サマリー
レポート詳細
医薬品卸売・流通市場レポート 2022-2032:本レポートは、新たな収益の柱を目指すリーディングカンパニーが、業界とその背景にあるダイナミクスをより深く理解する上で、非常に有益なものとなるでしょう。また、異業種への進出や新地域での既存事業の拡大を目指す企業にとっても有用なレポートです。
医療ニーズの変化に対応した医薬品卸売・販売業者への期待
医薬品卸・販売会社は、ヘルスケア分野での継続的なニーズの変化によってもたらされる新しい世界的な市場の見通しに対応することが期待されています。医薬品業界は、従来から製薬企業の流通需要に対応するために重要な役割を担ってきました。医薬品ビジネスは広大です。製薬業界は小売業が中心で、大半の事業者が分散している。製薬会社の大半は、自社の全国センターで商品を提供しています。市場の需要が高まっているため、この分野は絶えず進化を続けています。製薬会社は医薬品卸売業者に直接製品を販売します。薬局は医薬品の卸売業者から医薬品を購入する。フルサービスを提供する医薬品卸業者は、顧客の需要を満たすためにさまざまな商品とサービスを提供します。独立した薬剤師やホームケア事業者は、卸売薬や市販の鎮痛剤のような商品を提供する医薬品のソースと連携して、お金と重要な時間を節約することができます。
生産性向上のために、企業はサプライチェーンの中断を避けるために監視ソフトウェアにお金をかけなければならない
どのような産業においても、サプライチェーンに問題が発生する可能性があります。サプライ・ネットワークは、世界的にかつてないほどの激変を経験しています。実は、これは今、製薬業界が直面している最大の問題の一つでもあります。製薬会社の経営陣は、プロセスを最適化することで最大限の効果を上げようと努力していますが、予期せぬ技術的な問題によって、業界全体が遅れてしまう可能性があります。そのため、製薬会社は戦略を変更し、サプライチェーン全体の問題を軽減するためにリソースを投入しています。生産性を向上させたいのであれば、企業はモニタリング・ソフトウェアに投資する必要があります。実際に、モニタリング・ソフトウェアは、アイテムの場所を特定し、サプライ・チェーンの状態を評価するのに役立ちます。
マーケットリサーチレポートを購入する前に、どのような質問をすべきでしょうか?
- 医薬品卸売・流通市場はどのように進化しているのか?
- 医薬品卸売・流通市場の推進要因と抑制要因は何か?
- 医薬品卸売・流通の各サブマーケット区分は予測期間中にどのように成長し、2032年にこれらのサブマーケットが占める売上はどの程度になるか?
- 2022年から2032年にかけて、医薬品卸売・流通の各サブマーケットの市場シェアはどのように推移するのか?
- 2022年から2032年にかけて、市場全体の主なドライバーは何になるのか?
- 主要な医薬品卸売・流通市場はマクロ経済のダイナミクスに概ね追随するのか、それとも個々の国内市場が他を凌駕するのか?
- 2032年までに各国市場のシェアはどのように変化し、どの地域が2032年の市場をリードするのか?
- 主要プレイヤーは誰か、また予測期間中の展望は?
- これらの主要企業の医薬品卸売・流通プロジェクトはどのようなものか?
- 2022年から2032年にかけて、業界はどのように進化していくのか?現在および今後10年間に実施される医薬品卸売・流通プロジェクトにはどのような意味があるのか?
- 医薬品卸売・流通市場の規模をさらに拡大するために、製品の商業化の必要性が高まっているのか?
- 医薬品卸売・流通市場はどこへ向かい、どのようにすれば市場の最前線に立つことができるのか?
- 新製品やサービスラインに対する最適な投資オプションは何か?
- 企業を新たな成長軌道に乗せ、C-suiteに移行させるための重要な展望とは?
このことが、現在、そして今後10年間の医薬品卸売・流通市場にどのような影響を与えるかを知る必要があります。
- 362ページにわたる本レポートでは、176の表と149のグラフを独占的に提供します。
- このレポートでは、業界における主要な収益性の高い分野をハイライトしているため、今すぐその分野をターゲットにすることができます。
- 世界、地域、国別の売上高と成長率を詳細に分析しています。
- 競合他社が成功した主要なトレンド、変化、収益予測をハイライトしています。
本レポートは、医薬品卸売・流通市場が今後10年間にどのように発展し、COVID-19の景気後退と回復の変動に伴ってどのように変化するかを今日あなたに伝えます。この市場は、過去10年間のどの時点よりも、今がより重要なのです。
レポートでは、COVID-19のバリエーションや経済データなど、お客様の市場に特化した独自の情報をお届けしています。
2032年までの予測やその他の分析により、商業的な展望が見えてくる
- 2032年までの収益予測に加え、直近の実績、成長率、市場シェアもご覧いただけます。
- ビジネスの展望や展開など、独自の分析もご覧いただけます。
- 定性的分析(市場力学、促進要因、機会、阻害要因、課題など)、コスト構造、医薬品卸売・流通の価格上昇の影響、最近の動向などをご覧いただけます。
本レポートでは、COVID-19が業界と貴社にどのような影響を与えるかについて、データ分析と貴重な洞察を掲載しています。本レポートでは、COVID-19の4つの回収パターンとその影響、すなわち「V」、「L」、「W」、「U」について論じています。
報告書の対象セグメント
流通タイプ別
- 医療用医薬品/ブランド医薬品流通業者
- ジェネリック医薬品流通業者
- 宣伝・流通(PCD) フランチャイズ
- 一般用医薬品/医療用医薬品流通業者
- その他の流通タイプ
タイプ別
- フルライン卸売業者(FLW)
- ショートライン卸売業者(SLW)
- ダイレクト・トゥ・ファーマシー(DTP)
- 病院、診療所、その他
- メールオーダー
- その他のタイプ
製品タイプ別
- 医療用医薬品 卸売・物流
- 抗生物質卸売・販売
- OTC製品 卸売・販売
- 防腐剤 卸売・物流
- サプリメント卸売・販売
- その他の製品
世界市場全体とセグメントの収益予測に加え、5つの地域と25の主要国市場の収益予測も掲載しています。
北米
- 米国
- カナダ
欧州
- ドイツ
- フランス
- 英国
- イタリア
- スペイン
- ロシア
- 英国
- オランダ
- デンマーク
- フィンランド
- その他の欧州
アジア太平洋
- 中国
- インド
- 日本
- 韓国
- オーストラリア
- インドネシア
- マレーシア
- その他のアジア太平洋地域
ラテンアメリカ
- ブラジル
- メキシコ
- アルゼンチン
- その他のラテンアメリカ地域
MEA
- サウジアラビア
- トルコ
- UAE
- 南アフリカ
- その他のMEA地域
医薬品卸売・流通市場の2022年から2032年にかけての主要企業のプロファイルと、これらの企業のこのセグメントを中心とした情報も掲載しています。
主要企業と市場成長の可能性
・ Alfresa Holdings
・ AmerisourceBergen Corporation
・ Cardinal Health, Inc.
・ China Resources Pharmaceutical Group Limited
・ CuraScript SD
・ Dakota Drug Inc.
・ Fortissa
・ Fosun International
・ Geo-Young Corporation
・ Kingworld Medicines Group Ltd.
・ Mawdsley-Brooks
・ McKesson Corporation
・ Medipal Holdings Corporation
・ Morris and Dickson
・ Mutual Drug Company
・ Ohki Healthcare Holdings Co., Ltd
・ Petrone Group
・ PHOENIX Group
・ Prodigy Health
・ Profarma Distribuidora de Produtos Farmaceuticos SA
・ Realcan Pharmaceutical Group Co.
・ Shanghai Fosun Pharmaceutical (Group) Co., Ltd.
・ Sinopharm Group Co. Ltd.
・ Smith Drug Company
・ Suzuken Co Ltd.
・ Walgreens Boots Alliance, Inc.
・ Zhejiang Int’l Group Co. Ltd
医薬品卸売・流通市場の世界全体の売上高、2022年から2032年まで 金額ベースで、2022年に5480億米ドルを突破すると、当研究所は算出しています。2032年までの売上高成長率を予測しています。本調査では、最も大きな可能性を秘めた組織を特定します。彼らの能力、進歩、商業的展望を知ることで、一歩先を行くことができます。
医薬品卸売・流通市場、2022年から2032年までのレポートはどのように役立つのでしょうか?
360ページを超えるレポートでは、要約すると以下のような知識を得ることができます。
- 医薬品卸売・流通市場の2032年までの収益予測 製品タイプ、流通業者タイプ、タイプ別に、それぞれ世界と地域レベルで予測 - 投資と収益に最も有利な場所を見つけ、業界の展望を探る。
- 5つの地域と20の主要国市場の2032年までの収益予測 - 北米、欧州、アジア太平洋とラテンアメリカ、MEAの医薬品卸売・流通市場の2022年から2032年の市場予測を見る また、米国 、カナダ、メキシコ、ブラジル、ドイツ、フランス、英国、イタリア、中国、インド、日本、オーストラリアなど著名な経済圏の市場も予測されている。
- 医薬品卸売・流通市場に関わる主要企業27社の企業プロファイルを含む、2022年から2032年までの既存企業および市場参入を目指す企業の展望。
定量的・定性的な分析と独自の予測をご覧いただけます。私たちのレポートだけが持つ情報を入手し、貴重なビジネスインテリジェンスを得ることができます。
他にはない情報
私たちの新しいレポートがあれば、知識の遅れを取り戻し、チャンスを逃す可能性が低くなります。私たちの研究が貴社の調査、分析、意思決定にどのように役立つかをご覧ください。Visiongainの調査は、医薬品卸売・流通市場、2022年から2032年、市場の主要企業の商業分析を必要とするすべての人のためのものです。データ、トレンド、予測を見ることができます。
ページTOPに戻る
目次
目次
1 レポートの概要
1.1 調査の目的
1.2 医薬品卸売・流通市場の紹介
1.3 本レポートの特徴
1.4 本レポートを読むべき理由
1.5 本分析レポートが回答する主な質問には以下が含まれます。
1.6 本レポートは誰のためのものなのか?
1.7 方法論
1.7.1 市場の定義
1.7.2 市場評価・予測手法
1.7.5.1 一次調査
1.7.5.1 セカンダリーリサーチ
1.8 よくある質問と回答(FAQ)
1.9 関連するVisiongainのレポート
1.10 Visiongainについて
2 エグゼクティブサマリー
3 市場構造
3.1 サプライチェーン
3.1.5.1 成長と複雑化
3.1.5.1 インフラの改善拡大するサプライチェーンへのセルフケア
3.1.5.1 ローデータから意味のあるインサイトへ、複雑さは減少している
3.1.5.1 パフォーマンスの推進。ビジネスドライバーの整合性
3.1.5.1 外部コンサルタントのリソースの活用
3.2 バリューチェーン
3.2.5.1 医薬品の製造
3.2.5.1 調剤薬局への配送
3.2.5.1 エンドユーザーへの調剤
3.3 最近の動向・開発
3.3.5.1 人工知能(AI)
3.3.5.1 アナリティクス&ビッグデータ
3.3.5.1 医療の高精度化
3.3.5.1 ダイナミック生産
3.3.5.1 治療手順
4 市場概要
4.1 マーケットダイナミクス
4.2 市場の推進要因
4.2.1 汚染がもたらす疾病
4.2.2 新しいライフスタイルへの対応
4.2.1 メンテナンスとコストコントロールの増加
4.3 市場の抑制要因
4.3.1 単一または二重の供給元によるサプライチェーンの混乱が市場に与える影響はより大きい
4.3.2 ディストリビューターは認可された取引相手であるためにライセンスを所有しなければならない
4.3.3 病院医療における薬理学的・物理学的制約
4.4 市場の可能性
4.4.1 ローデータからオペレーティングアナリティクスへ、複雑さは減少する
4.4.2 外部コンサルティングの活用
4.4.3 プログラムによる補助金支出の増加による成長
4.5 市場の課題
4.5.1 大規模なデータ収集と分析
4.5.2 サプライチェーンの中断
4.5.3 顧客の要求の高まりとブランドの健全性を維持するための課題
4.6 COVID-19影響度分析
4.7 SWOT分析
4.7.1 市場の強み
4.7.2 市場の弱み
4.7.3 市場の好機
4.7.4 市場の脅威
4.8 ポーターのファイブフォース分析
4.8.1 サプライヤーパワー
4.8.2 バイヤーパワー
4.8.3 競争相手との競合
4.8.4 代替品による脅威
4.8.5 新規参入者の脅威
4.9 環境要因分析
4.9.1 政治的要因
4.9.2 経済的要因
4.9.3 社会的要因
4.9.4 技術的要因
4.9.5 法的要因
4.9.6 環境要因
5 医薬品卸売・流通市場分析
5.1 医薬品卸売・流通の概要
5.2 医薬品製造市場
5.3 医薬品市場の物流
5.4 世界の医薬品ビジネスの細分化
6 医薬品卸売・流通市場分析:タイプ別
6.1 セグメントの概要
6.1.1 フルライン卸売業者(FLW)
6.1.2 ショートライン卸売業者(SLW)
6.1.3 医薬品直販(DTP)
6.1.4 病院・診療所・その他
6.1.5 通信販売
6.1.6 その他のタイプ
6.2 タイプ別市場規模の推定と予測
7 医薬品卸売・流通市場分析:製品タイプ別
7.1 セグメントの概要
7.1.1 医療用医薬品卸売・流通事業
7.1.2 一般用医薬品卸売・流通事業
7.1.3 抗生物質卸売・流通事業
7.1.4 防腐剤卸売・流通事業
7.1.5 サプリメント卸売・流通事業
7.1.6 その他製品タイプ
7.2 製品タイプ別市場規模の推定と予測
8 医薬品卸売・流通市場分析:流通業者タイプ別
8.1 セグメントの概要
8.1.1 医療用医薬品/ブランド医薬品の流通業者
8.1.2 ジェネリック医薬品の流通業者
8.1.3 プロパガンダ・カム・ディストリビューション(PCD)フランチャイザー
8.1.4 一般用医薬品(OTC)/医療用医薬品流通業者
8.1.5 その他流通業者タイプ
8.2 流通業者タイプ別市場規模の推定と予測
9 北米の医薬品卸売・流通市場分析
9.1 北米市場規模推定・予測(金額別)
9.2 国別市場規模推定・予測
9.3 製品タイプ別市場規模推定・予測
9.4 流通業者タイプ別市場規模予測・予想
9.5 タイプ別市場規模予測・予想
9.6 アメリカ市場分析
9.7 カナダの市場分析
10 欧州の医薬品卸売・流通市場分析
10.1 欧州市場の展望
10.2 金額別市場規模の推定と予測
10.3 国別市場規模推定・予測
10.4 製品タイプ別市場規模推定・予測
10.5 流通業者タイプ別市場規模推定・予測
10.6 タイプ別市場規模予測・予想
10.7 ドイツの市場分析
10.8 フランスの市場分析
10.9 イギリスの市場分析
10.10 イタリアの市場分析
10.11 スペインの市場分析
10.12 フィンランドの市場分析
10.13 ロシア市場の分析
10.14 オランダの市場分析
10.15 デンマークの市場分析
10.16 その他の欧州の市場分析
11 アジア太平洋地域の医薬品卸売・流通市場分析
11.1 アジア・太平洋地域の市場展望
11.2 金額別市場規模の推定と予測
11.3 国別市場規模推定・予測
11.4 製品タイプ別市場規模推定・予測
11.5 流通業者タイプ別市場規模推定・予測
11.6 タイプ別市場規模推定・予測
11.7 中国市場の分析
11.8 インド市場の分析
11.9 日本市場の分析
11.10 韓国市場の分析
11.11 オーストラリアの市場分析
11.12 インドネシアの市場分析
11.13 マレーシアの市場分析
11.14 その他のアジア太平洋地域の市場分析
12 ラテンアメリカの医薬品卸売・流通市場分析
12.1 ラテンアメリカの展望
12.2 金額別市場規模の推定と予測
12.3 国別市場規模推定・予測
12.4 製品タイプ別市場規模推定・予測
12.5 流通業者タイプ別市場規模推定・予測
12.6 タイプ別市場規模予測・予想
12.7 ブラジル市場分析
12.8 メキシコの市場分析
12.9 アルゼンチンの市場分析
12.10 その他のラテンアメリカの市場分析
13 中東・アフリカ の医薬品卸売・流通市場分析
13.1 中東・アフリカ市場の展望
13.2 金額別市場規模の推定と予測
13.3 国別市場規模推定・予測
13.4 製品タイプ別市場規模推定・予測
13.5 流通業者タイプ別市場規模推定・予測
13.6 タイプ別市場規模予測・予想
13.7 サウジアラビアの市場分析
13.8 トルコの市場分析
13.9 UAEの市場分析
13.10 南アフリカの市場分析
13.11 その他の中東・アフリカ地域の市場分析
14 主要企業のプロフィール
14.1 戦略的フレームワーク
14.2 モリス・アンド・ディクソン
14.2.1 会社概要
14.2.2 会社概要
14.2.3 財務分析
14.2.4 会社の製品ベンチマーク
14.2.5 戦略的展望
14.3 アルフレッサ ホールディングス
14.3.1 会社概要
14.3.2 会社概要
14.3.3 財務分析
14.3.4 会社の製品ベンチマーク
14.3.5 戦略的な展望
14.4 ウォルグリーンズ・ブーツ・アライアンス社
14.4.1 企業スナップショット
14.4.2 会社概要
14.4.3 財務分析
14.4.4 会社製品のベンチマーク
14.4.5 戦略的な展望
14.5 アメリソース・ベルゲン・コーポレーション
14.5.1 企業スナップショット
14.5.2 会社概要
14.5.3 財務分析
14.5.4 会社の製品ベンチマーク
14.5.5 戦略的展望
14.6 シノファーム・グループ
14.6.1 会社概要
14.6.2 会社概要
14.6.3 財務分析
14.6.4 会社の製品ベンチマーク
14.6.5 戦略的展望
14.7 株式会社スズケン
14.7.1 会社概要
14.7.2 会社概要
14.7.3 財務分析
14.7.4 当社の製品ベンチマーク
14.7.5 戦略的展望
14.8 上海佛山薬業(集団)有限公司
14.8.1 企業スナップショット
14.8.2 会社概要
14.8.3 財務分析
14.8.4 会社の製品ベンチマーク
14.8.5 戦略的な展望
14.9 中国資源医薬集団有限公司
14.9.1 会社概要
14.9.2 会社概要
14.9.3 財務分析
14.9.4 会社の製品ベンチマーク
14.9.5 戦略的展望
14.10 スミス・ドラッグ・カンパニー
14.10.1 会社概要
14.10.2 会社概要
14.10.3 各社製品のベンチマーキング
14.11 CuraScript SD
14.11.1 企業スナップショット
14.11.2 会社概要
14.11.3 企業別製品ベンチマーク
14.12 カーディナル・ヘルス社
14.12.1 企業スナップショット
14.12.2 会社概要
14.12.3 財務分析
14.12.4 会社製品のベンチマーキング
14.12.5 戦略的展望
14.13 佛山市国際交流協会
14.13.1 企業スナップショット
14.13.2 会社概要
14.13.3 財務分析
14.13.4 製品ベンチマーク
14.13.5 戦略的展望
14.14 医薬品相互会社
14.14.1 企業スナップショット
14.14.2 会社概要
14.14.3 会社の製品ベンチマーク
14.15 マッケソンコーポレーション
14.15.1 企業スナップショット
14.15.2 会社概要
14.15.3 財務分析
14.15.4 会社の製品ベンチマーク
14.15.5 戦略的展望
14.16 メディパルホールディングス
14.16.1 企業スナップショット
14.16.2 会社概要
14.16.3 財務分析
14.16.4 会社の製品ベンチマーク
14.16.5 戦略的展望
14.17 フェニックスグループ
14.17.1 企業スナップショット
14.17.2 会社概要
14.17.3 財務分析
14.17.4 会社の製品ベンチマーク
14.17.5 戦略的展望
14.18 モーズレイ・ブルックス
14.18.1 会社概要
14.18.2 会社概要
14.18.3 会社の製品ベンチマーク
14.19 プロディジィ・ヘルス
14.19.1 企業スナップショット
14.19.2 会社概要
14.19.3 企業別製品ベンチマーク
14.20 ジオ・ヤングコーポレーション
14.20.1 企業スナップショット
14.20.2 会社概要
14.20.3 製品ベンチマーク
14.20.4 戦略的な展望
14.21 キングワールド メディシンズ グループ リミテッド
14.21.1 企業スナップショット
14.21.2 会社概要
14.21.3 製品ベンチマーク
14.21.4 戦略的展望
14.22 Profarma Distribuidora de Produtos Farmaceuticos SA
14.22.1 企業スナップショット
14.22.2 会社概要
14.22.3 財務分析
14.22.4 製品ベンチマーク
14.23 ペトロネグループ
14.23.1 企業スナップショット
14.23.2 会社概要
14.23.3 ベンチマーキング
14.23.4 戦略的な展望
14.24 リアルカン・ファーマシューティカル・グループ
14.24.1 企業スナップショット
14.24.2 会社概要
14.24.3 財務分析
14.24.4 製品ベンチマーク
14.24.5 戦略的展望
14.25 ダコタ・ドラッグ社
14.25.1 企業スナップショット
14.25.2 会社概要
14.25.3 ベンチマーキング
14.26 浙江国際集団有限公司
14.26.1 企業スナップショット
14.26.2 会社概要
14.26.3 財務分析
14.26.4 製品ベンチマーク
14.27 大木ヘルスケア・ホールディングス
14.27.1 企業スナップショット
14.27.2 会社概要
14.27.3 財務分析
14.27.4 ベンチマーキング
14.27.5 戦略的展望
14.28 フォルティサ
14.28.1 企業スナップショット
14.28.2 会社概要
14.28.3 当社製品のベンチマーク
15 結論と提言
表の一覧
Table 1 Pharma Wholesale and Distribution Market Snapshot, 2022 & 2032 (US$ billion, CAGR %)
Table 2 Pharma Wholesale and Distribution Market Forecast, 2022-2032 (US$ Bn, AGR (%), CAGR(%)) (V-Shaped Recovery Scenario)
Table 3 Pharma Wholesale and Distribution Market by Region, 2022-2032 (US$ Bn, AGR (%), CAGR(%)) (V-Shaped Recovery Scenario)
Table 4 Pharma Wholesale and Distribution Market Forecast, 2022-2032 (US$ Bn, AGR (%), CAGR(%)) (W-Shaped Recovery Scenario)
Table 5 Pharma Wholesale and Distribution Market by Region, 2022-2032 (US$ Bn, AGR (%), CAGR(%)) (W-Shaped Recovery Scenario)
Table 6 Pharma Wholesale and Distribution Market Forecast, 2022-2032 (US$ Bn, AGR (%), CAGR(%)) (U-Shaped Recovery Scenario)
Table 7 Pharma Wholesale and Distribution Market by Region, 2022-2032 (US$ Bn, AGR (%), CAGR(%)) (U-Shaped Recovery Scenario)
Table 8 Pharma Wholesale and Distribution Market Forecast, 2022-2032 (US$ Bn, AGR (%), CAGR(%)) (L-Shaped Recovery Scenario)
Table 9 Pharma Wholesale and Distribution Market by Region, 2022-2032 (US$ Bn, AGR (%), CAGR(%)) (L-Shaped Recovery Scenario)
Table 10 Pharma Wholesale and Distribution Market Forecast, 2022-2032 (US$ Bn, AGR (%), CAGR(%))
Table 11 Pharma Wholesale and Distribution Market by Region, 2022-2032 (US$ Bn, AGR (%), CAGR(%))
Table 12 Pharma Wholesale and Distribution Market by Product Type, 2022-2032 (US$ Bn, AGR (%), CAGR(%))
Table 13 Pharma Wholesale and Distribution Market by Distributor Type, 2022-2032 (US$ Bn, AGR (%), CAGR(%))
Table 14 Pharma Wholesale and Distribution Market by Type, 2022-2032 (US$ Bn, AGR (%), CAGR(%))
Table 15 Pharma Wholesale and Distribution Market by Type, 2022-2032 (US$ Bn, AGR (%), CAGR(%))
Table 16 Full-Line Wholesalers (FLWs) Market Forecast, 2022-2032 (US$ Bn, AGR (%), CAGR(%))
Table 17 Full-Line Wholesalers (FLWs) Market by Region, 2022-2032 (US$ Bn, AGR (%), CAGR(%))
Table 18 Short-Line Wholesalers (SLWs) Market Forecast, 2022-2032 (US$ Bn, AGR (%), CAGR(%))
Table 19 Short-Line Wholesalers (SLWs) Market by Region, 2022-2032 (US$ Bn, AGR (%), CAGR(%))
Table 20 Direct-to-Pharmacy (DTP) Market Forecast, 2022-2032 (US$ Bn, AGR (%), CAGR(%))
Table 21 Direct-to-Pharmacy (DTP) Market by Region, 2022-2032 (US$ Bn, AGR (%), CAGR(%))
Table 22 Hospitals, Clinics & Others Market Forecast, 2022-2032 (US$ Bn, AGR (%), CAGR(%))
Table 23 Hospitals, Clinics & Others Market by Region, 2022-2032 (US$ Bn, AGR (%), CAGR(%))
Table 24 Mail Orders Market Forecast, 2022-2032 (US$ Bn, AGR (%), CAGR(%))
Table 25 Mail Orders Market by Region, 2022-2032 (US$ Bn, AGR (%), CAGR(%))
Table 26 Other Types Market Forecast, 2022-2032 (US$ Bn, AGR (%), CAGR(%))
Table 27 Other Types Market by Region, 2022-2032 (US$ Bn, AGR (%), CAGR(%))
Table 28 Pharma Wholesale and Distribution Market by Product Type, 2022-2032 (US$ Bn, AGR (%), CAGR(%))
Table 29 Prescription Drugs Wholesaling & Distribution Market Forecast, 2022-2032 (US$ Bn, AGR (%), CAGR(%))
Table 30 Prescription Drugs Wholesaling & Distribution Market by Region, 2022-2032 (US$ Bn, AGR (%), CAGR(%))
Table 31 Antibiotics Wholesaling & Distribution Market Forecast, 2022-2032 (US$ Bn, AGR (%), CAGR(%))
Table 32 Antibiotics Wholesaling & Distribution Market by Region, 2022-2032 (US$ Bn, AGR (%), CAGR(%))
Table 33 OTC Products Wholesaling & Distribution Market Forecast, 2022-2032 (US$ Bn, AGR (%), CAGR(%))
Table 34 OTC Products Wholesaling & Distribution Market by Region, 2022-2032 (US$ Bn, AGR (%), CAGR(%))
Table 35 Antiseptics Wholesaling & Distribution Market Forecast, 2022-2032 (US$ Bn, AGR (%), CAGR(%))
Table 36 Antiseptics Wholesaling & Distribution Market by Region, 2022-2032 (US$ Bn, AGR (%), CAGR(%))
Table 37 Supplement Products Wholesaling & Distribution Market Forecast, 2022-2032 (US$ Bn, AGR (%), CAGR(%))
Table 38 Supplement Products Wholesaling & Distribution Market by Region, 2022-2032 (US$ Bn, AGR (%), CAGR(%))
Table 39 Other Product Types Wholesaling & Distribution Market Forecast, 2022-2032 (US$ Bn, AGR (%), CAGR(%))
Table 40 Other Product Types Wholesaling & Distribution Market by Region, 2022-2032 (US$ Bn, AGR (%), CAGR(%))
Table 41 Pharma Wholesale and Distribution Market by Distributor Type, 2022-2032 (US$ Bn, AGR (%), CAGR(%))
Table 42 Ethical/Branded Pharma Products Distributors Market Forecast, 2022-2032 (US$ Bn, AGR (%), CAGR(%))
Table 43 Ethical/Branded Pharma Products Distributors Market by Region, 2022-2032 (US$ Bn, AGR (%), CAGR(%))
Table 44 Generic Pharma Products Distributors Market Forecast, 2022-2032 (US$ Bn, AGR (%), CAGR(%))
Table 45 Generic Pharma Products Distributors Market by Region, 2022-2032 (US$ Bn, AGR (%), CAGR(%))
Table 46 Propaganda Cum Distribution (PCD) Franchise Market Forecast, 2022-2032 (US$ Bn, AGR (%), CAGR(%))
Table 47 Propaganda Cum Distribution (PCD) Franchise Market by Region, 2022-2032 (US$ Bn, AGR (%), CAGR(%))
Table 48 OTC/Institutional Supply Pharma Distributors Market Forecast, 2022-2032 (US$ Bn, AGR (%), CAGR(%))
Table 49 OTC/Institutional Supply Pharma Distributors Market by Region, 2022-2032 (US$ Bn, AGR (%), CAGR(%))
Table 50 Other Distributor Types Market Forecast, 2022-2032 (US$ Bn, AGR (%), CAGR(%))
Table 51 Other Distributor Types Market by Region, 2022-2032 (US$ Bn, AGR (%), CAGR(%))
Table 52 North America Pharma Wholesale and Distribution Market by Value, 2022-2032 (US$ Bn, AGR (%), CAGR(%))
Table 53 North America Pharma Wholesale and Distribution Market by Country, 2022-2032 (US$ Bn, AGR (%), CAGR(%))
Table 54 North America Pharma Wholesale and Distribution Market by Product Type, 2022-2032 (US$ Bn, AGR (%), CAGR(%))
Table 55 North America Pharma Wholesale and Distribution Market by Distributor Type, 2022-2032 (US$ Bn, AGR (%), CAGR(%))
Table 56 North America Pharma Wholesale and Distribution Market by Type, 2022-2032 (US$ Bn, AGR (%), CAGR(%))
Table 57 US Pharma Wholesale and Distribution Market by Value, 2022-2032 (US$ Bn, AGR (%), CAGR(%))
Table 58 Canada Pharma Wholesale and Distribution Market by Value, 2022-2032 (US$ Bn, AGR (%), CAGR(%))
Table 59 Europe Pharma Wholesale and Distribution Market by Value, 2022-2032 (US$ Bn, AGR (%), CAGR(%))
Table 60 Europe Pharma Wholesale and Distribution Market by Country, 2022-2032 (US$ Bn, AGR (%), CAGR(%))
Table 61 Europe Pharma Wholesale and Distribution Market by Product Type, 2022-2032 (US$ Bn, AGR (%), CAGR(%))
Table 62 Europe Pharma Wholesale and Distribution Market by Distributor Type, 2022-2032 (US$ Bn, AGR (%), CAGR(%))
Table 63 Europe Pharma Wholesale and Distribution Market by Type, 2022-2032 (US$ Bn, AGR (%), CAGR(%))
Table 64 Germany Pharma Wholesale and Distribution Market by Value, 2022-2032 (US$ Bn, AGR (%), CAGR(%))
Table 65 France Pharma Wholesale and Distribution Market by Value, 2022-2032 (US$ Bn, AGR (%), CAGR(%))
Table 66 UK Pharma Wholesale and Distribution Market by Value, 2022-2032 (US$ Bn, AGR (%), CAGR(%))
Table 67 Italy Pharma Wholesale and Distribution Market by Value, 2022-2032 (US$ Bn, AGR (%), CAGR(%))
Table 68 Spain Pharma Wholesale and Distribution Market by Value, 2022-2032 (US$ Bn, AGR (%), CAGR(%))
Table 69 Finland Pharma Wholesale and Distribution Market by Value, 2022-2032 (US$ Bn, AGR (%), CAGR(%))
Table 70 Russia Pharma Wholesale and Distribution Market by Value, 2022-2032 (US$ Bn, AGR (%), CAGR(%))
Table 71 The Netherlands Pharma Wholesale and Distribution Market by Value, 2022-2032 (US$ Bn, AGR (%), CAGR(%))
Table 72 Denmark Pharma Wholesale and Distribution Market by Value, 2022-2032 (US$ Bn, AGR (%), CAGR(%))
Table 73 Rest of Europe Pharma Wholesale and Distribution Market by Value, 2022-2032 (US$ Bn, AGR (%), CAGR(%))
Table 74 Asia-Pacific Pharma Wholesale and Distribution Market by Value, 2022-2032 (US$ Bn, AGR (%), CAGR(%))
Table 75 Asia-Pacific Pharma Wholesale and Distribution Market by Country, 2022-2032 (US$ Bn, AGR (%), CAGR(%))
Table 76 Asia-Pacific Pharma Wholesale and Distribution Market by Product Type, 2022-2032 (US$ Bn, AGR (%), CAGR(%))
Table 77 Asia-Pacific Pharma Wholesale and Distribution Market by Distributor Type, 2022-2032 (US$ Bn, AGR (%), CAGR(%))
Table 78 Asia-Pacific Pharma Wholesale and Distribution Market by Type, 2022-2032 (US$ Bn, AGR (%), CAGR(%))
Table 79 China Pharma Wholesale and Distribution Market by Value, 2022-2032 (US$ Bn, AGR (%), CAGR(%))
Table 80 India Pharma Wholesale and Distribution Market by Value, 2022-2032 (US$ Bn, AGR (%), CAGR(%))
Table 81 Japan Pharma Wholesale and Distribution Market by Value, 2022-2032 (US$ Bn, AGR (%), CAGR(%))
Table 82 South Korea Pharma Wholesale and Distribution Market by Value, 2022-2032 (US$ Bn, AGR (%), CAGR(%))
Table 83 Australia Pharma Wholesale and Distribution Market by Value, 2022-2032 (US$ Bn, AGR (%), CAGR(%))
Table 84 Indonesia Pharma Wholesale and Distribution Market by Value, 2022-2032 (US$ Bn, AGR (%), CAGR(%))
Table 85 Malaysia Pharma Wholesale and Distribution Market by Value, 2022-2032 (US$ Bn, AGR (%), CAGR(%))
Table 86 Rest of Asia-Pacific Pharma Wholesale and Distribution Market by Value, 2022-2032 (US$ Bn, AGR (%), CAGR(%))
Table 87 Latin America Pharma Wholesale and Distribution Market by Value, 2022-2032 (US$ Bn, AGR (%), CAGR(%))
Table 88 Latin America Pharma Wholesale and Distribution Market by Country, 2022-2032 (US$ Bn, AGR (%), CAGR(%))
Table 89 Latin America Pharma Wholesale and Distribution Market by Product Type, 2022-2032 (US$ Bn, AGR (%), CAGR(%))
Table 90 Latin America Pharma Wholesale and Distribution Market by Distributor Type, 2022-2032 (US$ Bn, AGR (%), CAGR(%))
Table 91 Latin America Pharma Wholesale and Distribution Market by Type, 2022-2032 (US$ Bn, AGR (%), CAGR(%))
Table 92 Brazil Pharma Wholesale and Distribution Market by Value, 2022-2032 (US$ Bn, AGR (%), CAGR(%))
Table 93 Mexico Pharma Wholesale and Distribution Market by Value, 2022-2032 (US$ Bn, AGR (%), CAGR(%))
Table 94 Argentina Pharma Wholesale and Distribution Market by Value, 2022-2032 (US$ Bn, AGR (%), CAGR(%))
Table 95 Rest of Latin America Pharma Wholesale and Distribution Market by Value, 2022-2032 (US$ Bn, AGR (%), CAGR(%))
Table 96 Middle East & Africa Pharma Wholesale and Distribution Market by Value, 2022-2032 (US$ Bn, AGR (%), CAGR(%))
Table 97 Middle East & Africa Pharma Wholesale and Distribution Market by Country, 2022-2032 (US$ Bn, AGR (%), CAGR(%))
Table 98 Middle East & Africa Pharma Wholesale and Distribution Market by Product Type, 2022-2032 (US$ Bn, AGR (%), CAGR(%))
Table 99 Middle East & Africa Pharma Wholesale and Distribution Market by Distributor Type, 2022-2032 (US$ Bn, AGR (%), CAGR(%))
Table 100 Middle East & Africa Pharma Wholesale and Distribution Market by Type, 2022-2032 (US$ Bn, AGR (%), CAGR(%))
Table 101 Saudi Arabia Pharma Wholesale and Distribution Market by Value, 2022-2032 (US$ Bn, AGR (%), CAGR(%))
Table 102 Turkey Pharma Wholesale and Distribution Market by Value, 2022-2032 (US$ Bn, AGR (%), CAGR(%))
Table 103 UAE Pharma Wholesale and Distribution Market by Value, 2022-2032 (US$ Bn, AGR (%), CAGR(%))
Table 104 South Africa Pharma Wholesale and Distribution Market by Value, 2022-2032 (US$ Bn, AGR (%), CAGR(%))
Table 105 Rest of Middle East & Africa Pharma Wholesale and Distribution Market by Value, 2022-2032 (US$ Bn, AGR (%), CAGR(%))
Table 106 Strategic Framework
Table 107 Morris and Dickson.: Company Information
Table 108 Morris and Dickson.: Company Service Benchmarking
Table 109 Morris and Dickson.: Strategic Outlook
Table 110 Alfresa Holdings.: Company Information
Table 111 Alfresa Holdings.: Company Service Benchmarking
Table 112 Alfresa Holdings.: Strategic Outlook
Table 113 Walgreens Boots Alliance, Inc: Company Information
Table 114 Walgreens Boots Alliance, Inc: Company Product and Service Benchmarking
Table 115 Walgreens Boots Alliance, Inc: Strategic Outlook
Table 116 AmerisourceBergen Corporation.: Company Information
Table 117 AmerisourceBergen Corporation.: Company Product and Service
Table 118 AmerisourceBergen Corporation Strategic Outlook
Table 119 Sinopharm Group Co. Ltd: Company Information
Table 120 Sinopharm Group Co. Ltd: Company Product and Service
Table 121 Sinopharm Group Co. Ltd.: Strategic Outlook
Table 122 Suzuken Co Ltd : Company Information
Table 123 Suzuken Co Ltd : Company Product and Service Benchmarking
Table 124 Suzuken Co Ltd: Strategic Outlook
Table 125 Shanghai Fosun Pharmaceutical (Group) Co., Ltd : Company Information
Table 126 Suzuken Co Ltd : Company Product and Service Benchmarking
Table 127 Shanghai Fosun Pharmaceutical (Group) Co., Ltd .: Strategic Outlook
Table 128 China Resources Pharmaceutical Group Limited.: Company Information
Table 129 China Resources Pharmaceutical Group Limited.: Company Service Benchmarking
Table 130 China Resources Pharmaceutical Group Limited.: Strategic Outlook
Table 131 Smith Drug Company: Company Information
Table 132 Smith Drug Company : Company Product and Service Benchmarking
Table 133 CuraScript SD.: Company Information
Table 134 CuraScript SD.: Company Product and Service Benchmarking
Table 135 Cardinal Health, Inc.: Company Information
Table 136 Cardinal Health, Inc.: Company Product and Service Benchmarking
Table 137 Cardinal Health, Inc. Recent Developments
Table 138 Fosun International: Company Information
Table 139 Fosun International: Product Benchmarking
Table 140 Fosun International: Strategic Outlook
Table 141 Mutual drug Company: Company Information
Table 142 Mutual drug Company: Company Product and Service Benchmarking
Table 143 McKesson Corporation.: Company Information
Table 144 McKesson Corporation: Product and Service
Table 145 McKesson Corporation: Recent Developments
Table 146 Medipal Holdings Corporation: Company Information
Table 147 Medipal Holdings Corporation: Company Product and Service
Table 148 Medipal Holdings Corporation.: Strategic Outlook
Table 156 Geo-Young Corporation: Company Information
Table 157 Geo-Young Corporation: Product Benchmarking
Table 158 Geo-Young Corporation: Strategic Outlook
Table 159 Kingworld Medicines Group Ltd: Company Information
Table 160 Kingworld Medicines Group Ltd: Product Benchmarking
Table 161 Kingworld Medicines Group Ltd: Strategic Outlook
Table 162 Profarma Distribuidora de Produtos Farmaceuticos: Company Information
Table 163 Profarma Distribuidora de Produtos Farmaceuticos SA: Product Benchmarking
Table 164 Petrone Group: Company Information
Table 165 Petrone Group: Product Benchmarking
Table 166 Petrone Group: Strategic Outlook
Table 167 Realcan Pharmaceutical Group Co: Company Information
Table 168 Realcan Pharmaceutical Group Co: Product Benchmarking
Table 169 Realcan Pharmaceutical Group Co: Strategic Outlook
Table 170 Dakota Drug Inc.: Company Information
Table 171 Dakota Drug Inc.: Product Benchmarking
Table 172 Zhejiang Int’l Group Co. Ltd: Company Information
Table 173 Zhejiang Int’l Group Co. Ltd: Product Benchmarking
Table 174 Ohki Healthcare Holdings Co., Ltd: Company Information
Table 175 Ohki Healthcare Holdings Co., Ltd: Product Benchmarking
Table 176 Ohki Healthcare Holdings Co., Ltd: Strategic Outlook
図の一覧
Figure 1 Pharma Wholesale and Distribution Market Segmentation
Figure 2 Pharma Wholesale and Distribution Market Forecast by Region: Market Attractiveness Index
Figure 3 Pharma Wholesale and Distribution Market by Type: Market Attractiveness Index
Figure 4 Pharma Wholesale and Distribution Market by Distributor Type: Market Attractiveness Index
Figure 5 Schematic of levels of pharmaceutical supply chains in emerging markets.
Figure 6 Schematic of three main types of pharmaceutical value chains in emerging markets.
Figure 7 Pharma Wholesale and Distribution Market: Market Dynamics
Figure 8 COVID Impact Analysis: Pharma Wholesale and Distribution Market Recovery Scenarios
Figure 9 Pharma Wholesale and Distribution Market Forecast, 2022-2032 (US$ Bn, AGR (%)) (V-Shaped Recovery Scenario)
Figure 10 Pharma Wholesale and Distribution Market by Region, 2022-2032 (US$ Bn, AGR (%)) (V-Shaped Recovery Scenario)
Figure 11 Pharma Wholesale and Distribution Market Forecast, 2022-2032 (US$ Bn, AGR (%)) (W-Shaped Recovery Scenario)
Figure 12 Pharma Wholesale and Distribution Market by Region, 2022-2032 (US$ Bn, AGR (%)) (W-Shaped Recovery Scenario)
Figure 13 Pharma Wholesale and Distribution Market Forecast, 2022-2032 (US$ Bn, AGR (%)) (U-Shaped Recovery Scenario)
Figure 14 Pharma Wholesale and Distribution Market by Region, 2022-2032 (US$ Bn, AGR (%)) (U-Shaped Recovery Scenario)
Figure 15 Pharma Wholesale and Distribution Market Forecast, 2022-2032 (US$ Bn, AGR (%)) (L-Shaped Recovery Scenario)
Figure 16 Pharma Wholesale and Distribution Market by Region, 2022-2032 (US$ Bn, AGR (%)) (L-Shaped Recovery Scenario)
Figure 17 Pharma Wholesale and Distribution Market: Porter’s Five Forces Analysis
Figure 18 Pharma Wholesale and Distribution Market Forecast, 2022-2032 (US$ Bn, AGR (%))
Figure 19 Pharma Wholesale and Distribution Market by Region, 2022-2032 (US$ Bn, AGR (%))
Figure 20 Pharma Wholesale and Distribution Market by Product Type, 2022-2032 (US$ Bn, AGR (%))
Figure 21 Pharma Wholesale and Distribution Market by Distributor Type, 2022-2032 (US$ Bn, AGR (%))
Figure 22 Pharma Wholesale and Distribution Market by Type, 2022-2032 (US$ Bn, AGR (%))
Figure 23 Pharma Wholesale and Distribution Market by Type, 2022-2032 (US$ Bn, AGR (%))
Figure 24 Full-Line Wholesalers (FLWs) Market Forecast, 2022-2032 (US$ Bn, AGR (%))
Figure 25 Full-Line Wholesalers (FLWs) Market by Region, 2022-2032 (US$ Bn, AGR (%))
Figure 26 Short-Line Wholesalers (SLWs) Market Forecast, 2022-2032 (US$ Bn, AGR (%))
Figure 27 Short-Line Wholesalers (SLWs) Market by Region, 2022-2032 (US$ Bn, AGR (%))
Figure 28 Direct-to-Pharmacy (DTP) Market Forecast, 2022-2032 (US$ Bn, AGR (%))
Figure 29 Direct-to-Pharmacy (DTP) Market by Region, 2022-2032 (US$ Bn, AGR (%))
Figure 30 Hospitals, Clinics & Others Market Forecast, 2022-2032 (US$ Bn, AGR (%))
Figure 31 Hospitals, Clinics & Others Market by Region, 2022-2032 (US$ Bn, AGR (%))
Figure 32 Mail Orders Market Forecast, 2022-2032 (US$ Bn, AGR (%))
Figure 33 Mail Orders Market by Region, 2022-2032 (US$ Bn, AGR (%))
Figure 34 Other Types Market Forecast, 2022-2032 (US$ Bn, AGR (%))
Figure 35 Other Types Market by Region, 2022-2032 (US$ Bn, AGR (%))
Figure 36 Pharma Wholesale and Distribution Market by Product Type, 2022-2032 (US$ Bn, AGR (%))
Figure 37 Prescription Drugs Wholesaling & Distribution Market Forecast, 2022-2032 (US$ Bn, AGR (%))
Figure 38 Prescription Drugs Wholesaling & Distribution Market by Region, 2022-2032 (US$ Bn, AGR (%))
Figure 39 Antibiotics Wholesaling & Distribution Market Forecast, 2022-2032 (US$ Bn, AGR (%))
Figure 40 Antibiotics Wholesaling & Distribution Market by Region, 2022-2032 (US$ Bn, AGR (%))
Figure 41 OTC Products Wholesaling & Distribution Market Forecast, 2022-2032 (US$ Bn, AGR (%))
Figure 42 OTC Products Wholesaling & Distribution Market by Region, 2022-2032 (US$ Bn, AGR (%))
Figure 43 Antiseptics Wholesaling & Distribution Market Forecast, 2022-2032 (US$ Bn, AGR (%))
Figure 44 Antiseptics Wholesaling & Distribution Market by Region, 2022-2032 (US$ Bn, AGR (%))
Figure 45 Supplement Products Wholesaling & Distribution Market Forecast, 2022-2032 (US$ Bn, AGR (%))
Figure 46 Supplement Products Wholesaling & Distribution Market by Region, 2022-2032 (US$ Bn, AGR (%))
Figure 47 Other Product Types Wholesaling & Distribution Market Forecast, 2022-2032 (US$ Bn, AGR (%))
Figure 48 Other Product Types Wholesaling & Distribution Market by Region, 2022-2032 (US$ Bn, AGR (%))
Figure 49 Pharma Wholesale and Distribution Market by Distributor Type, 2022-2032 (US$ Bn, AGR (%))
Figure 50 Ethical/Branded Pharma Products Distributors Market Forecast, 2022-2032 (US$ Bn, AGR (%))
Figure 51 Ethical/Branded Pharma Products Distributors Market by Region, 2022-2032 (US$ Bn, AGR (%))
Figure 52 Generic Pharma Products Distributors Market Forecast, 2022-2032 (US$ Bn, AGR (%))
Figure 53 Generic Pharma Products Distributors Market by Region, 2022-2032 (US$ Bn, AGR (%))
Figure 54 Propaganda Cum Distribution (PCD) Franchise Market Forecast, 2022-2032 (US$ Bn, AGR (%))
Figure 55 Propaganda Cum Distribution (PCD) Franchise Market by Region, 2022-2032 (US$ Bn, AGR (%))
Figure 56 OTC/Institutional Supply Pharma Distributors Market Forecast, 2022-2032 (US$ Bn, AGR (%))
Figure 57 OTC/Institutional Supply Pharma Distributors Market by Region, 2022-2032 (US$ Bn, AGR (%))
Figure 58 Other Distributor Types Market Forecast, 2022-2032 (US$ Bn, AGR (%))
Figure 59 Other Distributor Types Market by Region, 2022-2032 (US$ Bn, AGR (%))
Figure 60 North America Pharma Wholesale and Distribution Market by Value, 2022-2032 (US$ Bn, AGR (%))
Figure 61 North America Pharma Wholesale and Distribution Market by Country, 2022-2032 (US$ Bn, AGR (%))
Figure 62 North America Pharma Wholesale and Distribution Market by Product Type, 2022-2032 (US$ Bn, AGR (%))
Figure 63 North America Pharma Wholesale and Distribution Market by Distributor Type, 2022-2032 (US$ Bn, AGR (%))
Figure 64 North America Pharma Wholesale and Distribution Market by Type, 2022-2032 (US$ Bn, AGR (%))
Figure 65 US Pharma Wholesale and Distribution Market by Value, 2022-2032 (US$ Bn, AGR (%))
Figure 66 Canada Pharma Wholesale and Distribution Market by Value, 2022-2032 (US$ Bn, AGR (%))
Figure 67 Europe Pharma Wholesale and Distribution Market by Value, 2022-2032 (US$ Bn, AGR (%))
Figure 68 Europe Pharma Wholesale and Distribution Market by Country, 2022-2032 (US$ Bn, AGR (%))
Figure 69 Europe Pharma Wholesale and Distribution Market by Product Type, 2022-2032 (US$ Bn, AGR (%))
Figure 70 Europe Pharma Wholesale and Distribution Market by Product Type, 2022-2032 (US$ Bn, AGR (%))
Figure 71 Europe Pharma Wholesale and Distribution Market by Type, 2022-2032 (US$ Bn, AGR (%))
Figure 72 Germany Pharma Wholesale and Distribution Market by Value, 2022-2032 (US$ Bn, AGR (%))
Figure 73 France Pharma Wholesale and Distribution Market by Value, 2022-2032 (US$ Bn, AGR (%))
Figure 74 UK Pharma Wholesale and Distribution Market by Value, 2022-2032 (US$ Bn, AGR (%))
Figure 75 Italy Pharma Wholesale and Distribution Market by Value, 2022-2032 (US$ Bn, AGR (%))
Figure 76 Spain Pharma Wholesale and Distribution Market by Value, 2022-2032 (US$ Bn, AGR (%))
Figure 77 Finland Pharma Wholesale and Distribution Market by Value, 2022-2032 (US$ Bn, AGR (%))
Figure 78 Russia Pharma Wholesale and Distribution Market by Value, 2022-2032 (US$ Bn, AGR (%))
Figure 79 The Netherlands Pharma Wholesale and Distribution Market by Value, 2022-2032 (US$ Bn, AGR (%))
Figure 80 Denmark Pharma Wholesale and Distribution Market by Value, 2022-2032 (US$ Bn, AGR (%))
Figure 81 Rest of Europe Pharma Wholesale and Distribution Market by Value, 2022-2032 (US$ Bn, AGR (%))
Figure 82 Asia-Pacific Pharma Wholesale and Distribution Market by Value, 2022-2032 (US$ Bn, AGR (%))
Figure 83 Asia-Pacific Pharma Wholesale and Distribution Market by Country, 2022-2032 (US$ Bn, AGR (%))
Figure 84 Asia-Pacific Pharma Wholesale and Distribution Market by Product Type, 2022-2032 (US$ Bn, AGR (%))
Figure 85 Asia-Pacific Pharma Wholesale and Distribution Market by Distributor Type, 2022-2032 (US$ Bn, AGR (%))
Figure 86 Asia-Pacific Pharma Wholesale and Distribution Market by Type, 2022-2032 (US$ Bn, AGR (%))
Figure 87 China Pharma Wholesale and Distribution Market by Value, 2022-2032 (US$ Bn, AGR (%))
Figure 88 India Pharma Wholesale and Distribution Market by Value, 2022-2032 (US$ Bn, AGR (%))
Figure 89 Japan Pharma Wholesale and Distribution Market by Value, 2022-2032 (US$ Bn, AGR (%))
Figure 90 South Korea Pharma Wholesale and Distribution Market by Value, 2022-2032 (US$ Bn, AGR (%))
Figure 91 Australia Pharma Wholesale and Distribution Market by Value, 2022-2032 (US$ Bn, AGR (%))
Figure 92 Indonesia Pharma Wholesale and Distribution Market by Value, 2022-2032 (US$ Bn, AGR (%))
Figure 93 Malaysia Pharma Wholesale and Distribution Market by Value, 2022-2032 (US$ Bn, AGR (%))
Figure 94 Rest of Asia-Pacific Pharma Wholesale and Distribution Market by Value, 2022-2032 (US$ Bn, AGR (%))
Figure 95 Latin America Pharma Wholesale and Distribution Market by Value, 2022-2032 (US$ Bn, AGR (%))
Figure 96 Latin America Pharma Wholesale and Distribution Market by Country, 2022-2032 (US$ Bn, AGR (%))
Figure 97 Latin America Pharma Wholesale and Distribution Market by Product Type, 2022-2032 (US$ Bn, AGR (%))
Figure 98 Latin America Pharma Wholesale and Distribution Market by Distributor Type, 2022-2032 (US$ Bn, AGR (%))
Figure 99 Latin America Pharma Wholesale and Distribution Market by Type, 2022-2032 (US$ Bn, AGR (%))
Figure 100 Brazil Pharma Wholesale and Distribution Market by Value, 2022-2032 (US$ Bn, AGR (%))
Figure 101 Mexico Pharma Wholesale and Distribution Market by Value, 2022-2032 (US$ Bn, AGR (%))
Figure 102 Argentina Pharma Wholesale and Distribution Market by Value, 2022-2032 (US$ Bn, AGR (%))
Figure 103 Rest of Latin America Pharma Wholesale and Distribution Market by Value, 2022-2032 (US$ Bn, AGR (%))
Figure 104 Middle East & Africa Pharma Wholesale and Distribution Market by Value, 2022-2032 (US$ Bn, AGR (%))
Figure 105 Middle East & Africa Pharma Wholesale and Distribution Market by Country, 2022-2032 (US$ Bn, AGR (%))
Figure 106 Middle East & Africa Pharma Wholesale and Distribution Market by Product Type, 2022-2032 (US$ Bn, AGR (%))
Figure 107 Middle East & Africa Pharma Wholesale and Distribution Market by Distributor Type, 2022-2032 (US$ Bn, AGR (%))
Figure 108 Middle East & Africa Pharma Wholesale and Distribution Market by Type, 2022-2032 (US$ Bn, AGR (%))
Figure 109 Saudi Arabia Pharma Wholesale and Distribution Market by Value, 2022-2032 (US$ Bn, AGR (%))
Figure 110 Turkey Pharma Wholesale and Distribution Market by Value, 2022-2032 (US$ Bn, AGR (%))
Figure 111 UAE Pharma Wholesale and Distribution Market by Value, 2022-2032 (US$ Bn, AGR (%))
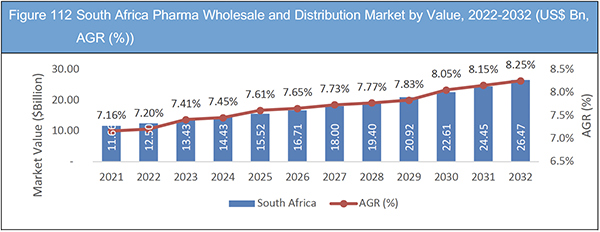
Figure 112 South Africa Pharma Wholesale and Distribution Market by Value, 2022-2032 (US$ Bn, AGR (%))
Figure 113 Rest of Middle East & Africa Pharma Wholesale and Distribution Market by Value, 2022-2032 (US$ Bn, AGR (%))
Figure 114 Morris and Dickson.: Company Revenue 2017-2021 (US$Mn, AGR %)
Figure 115 Alfresa Holdings.: Company Revenue 2018-2022 (US$Mn, AGR %)
Figure 116 Alfresa Holdings.: Company Gross Profit 2018-2022 (US$Mn, AGR %)
Figure 117 Alfresa Holdings.: Company R&D Expenses 2018-2022 (US$Mn, AGR %)
Figure 118 Walgreens Boots Alliance, Inc: Company Revenue 2017-2021 (US$Mn, AGR %)
Figure 119 Walgreens Boots Alliance, Inc: Company Gross Profit- 2017-2021 (US$Mn, AGR %)
Figure 120 AmerisourceBergen Corporation.: Company Revenue 2017-2021(US$Mn, AGR %)
Figure 121 AmerisourceBergen Corporation.: Company Gross Profit 2017-2021(US$Mn, AGR %)
Figure 122 Sinopharm Group Co. Ltd: Company Revenue 2017-2021(US$Mn, AGR %)
Figure 123 Sinopharm Group Co. Ltd: Company Gross Profit 2017-2021(US$Mn, AGR %)
Figure 124 Suzuken Co Ltd: Company Revenue 2018-2022 (US$Mn, AGR %)
Figure 125 Suzuken Co Ltd: Company Gross Profit 2018-2022 (US$Mn, AGR %)
Figure 126 Suzuken Co Ltd. : Company R & D Expenses 2018-2022 (US$Mn, AGR %)
Figure 127 Shanghai Fosun Pharmaceutical (Group) Co., Ltd : Company Revenue 2017-2021(US$Mn, AGR %)
Figure 128 Shanghai Fosun Pharmaceutical (Group) Co., Ltd : Company Gross Profit 2017-2021(US$Mn, AGR %)
Figure 129 Shanghai Fosun Pharmaceutical (Group) Co., Ltd : Company R& D Expenses 2017-2021(US$Mn, AGR %)
Figure 130 China Resources Pharmaceutical Group Limited.: Company Revenue 2017-2021 (US$Mn, AGR %)
Figure 131 China Resources Pharmaceutical Group Limited.: Company Gross Profit 2017-2021 (US$Mn, AGR %)
Figure 132 China Resources Pharmaceutical Group Limited.: Company R & D Expenses 2017-2021 (US$Mn, AGR %)
Figure 133 Cardinal Health, Inc.: Company Revenue 2017-2021 (US$Mn, AGR %)
Figure 134 Fosun International: Net Revenue, 2017-2021 (US$ million, AGR%)
Figure 135 Fosun International: R&D, 2017-2021 (US$ million, AGR%)
Figure 136 McKesson Corporation: Revenue 2017-2022 (US$Mn, AGR %)
Figure 137 McKesson Corporation: Gross Profit 2017-2022 (US$Mn, AGR %)
Figure 138 Medipal Holdings Corporation: Revenue 2018-2022 (US$Mn, AGR %)
Figure 139 Medipal Holdings Corporation: Gross Profit 2018-2022 (US$Mn, AGR %)
Figure 140 PHOENIX Group.: Company Revenue 2017-2021 (US$Mn, AGR %)
Figure 141 Profarma Distribuidora de Produtos Farmaceuticos SA: Net Revenue, 2017-2021 (US$ million, AGR%)
Figure 142 Profarma Distribuidora de Produtos Farmaceuticos SA: Gross Profit, 2017-2021 (US$ million, AGR%)
Figure 143 Realcan Pharmaceutical Group Co: Net Revenue, 2017-2021 (US$ million, AGR%)
Figure 144 Realcan Pharmaceutical Group Co: Gross Profit, 2017-2021 (US$ million, AGR%)
Figure 145 Zhejiang Int’l Group Co. Ltd: Net Revenue, 2017-2021 (US$ million, AGR%)
Figure 146 Zhejiang Int’l Group Co. Ltd: Gross Profit, 2017-2021 (US$ million, AGR%)
Figure 147 Zhejiang Int’l Group Co. Ltd: R&D, 2017-2021 (US$ million, AGR%)
Figure 148 Ohki Healthcare Holdings Co., Ltd: Net Revenue, 2019-2022 (US$ million, AGR%)
Figure 149 Ohki Healthcare Holdings Co., Ltd: Gross Profit, 2019-2022 (US$ million, AGR%)

