インフルエンザワクチン市場レポート:2023-2033
Influenza Vaccines Market Report 2023-2033
レポート詳細
インフルエンザワクチン市場レポート 2023-2033年 :本レポートは、業界とその基礎となる原動力をより良く理解することを望むなら、新たな収益ポケットを目指す大手企業にとって貴重な... もっと見る
※上記価格は部署ライセンス(Departmental licence)価格です。
その他の価格についてはデータリソースまでお問合せください。
日本語のページは自動翻訳を利用し作成しています。
実際のレポートは英文のみでご納品いたします。

|

|
サマリー
レポート詳細
インフルエンザワクチン市場レポート 2023-2033年:本レポートは、業界とその基礎となる原動力をより良く理解することを望むなら、新たな収益ポケットを目指す大手企業にとって貴重なものとなるでしょう。また、異業種への進出や新規地域での既存事業の拡大を目指す企業にとっても有用です。
インフルエンザの世界的流行は増加傾向にある。蔓延する感染を防ぐ最も効果的な方法は、ワクチン接種である。世界人口の高齢化に伴い、インフルエンザに罹患しやすくなり、インフルエンザワクチンの需要が高まっている。インフルエンザに対する意識の高まり、医療サービスの改善、先進国における出生率の高さなどが、予測期間中の現行および新型インフルエンザワクチン需要の増加に寄与している。その結果、インフルエンザ・ワクチン分野は、大幅な成長の見込みと堅調な収益を上げている。ワクチン接種は、特に小児にとってストレスの多い経験であるため、ストレスの少ないワクチンを提供する組織は大きな利益を得ることができる。
市場調査レポートを購入する前にすべき質問とは?
- インフルエンザワクチン市場はどのように進化しているのか?
- インフルエンザワクチン市場の促進要因と阻害要因は何か?
- 各インフルエンザワクチンサブマーケットセグメントは予測期間中にどのように成長し、2033年にはどれくらいの売上を占めるようになるのか?
- 2023年から2033年にかけて、各インフルエンザワクチンサブマーケットの市場シェアはどのように推移するのか?
- 2023年から2033年にかけて、市場全体を牽引する主な要因は何か?
- 主要なインフルエンザワクチン市場はマクロ経済の動きに概ね追随するのか、それとも個々の国市場が他を凌駕するのか?
- 2033年までに各国市場のシェアはどのように変化し、2033年にはどの地域が市場をリードするのか?
- また、2033年にはどの地域が市場をリードすることになるのでしょうか?
- これら主要企業のインフルエンザワクチン事業は?
- 2023年から2033年の間に、業界はどのように進化するのか?現在行われている
現在および今後10年間に実施されるインフルエンザワクチンのプロジェクトにはどのような意味があるのでしょうか?
- インフルエンザワクチン市場をさらに拡大するために、製品化の必要性は高まっていますか?
- インフルエンザワクチン市場はどこへ向かい、どのようにすれば市場の最前線に立てるのか?
- 新製品やサービスラインへの最適な投資方法とは?
- 企業を新たな成長軌道に乗せ、C-suiteに移行させるための重要な展望とは?
このことが、現在、そして今後10年間のインフルエンザワクチン市場にどのような影響を与えるかを見極める必要がある:
- 192ページにわたる本レポートでは、77の表と116の図表をご覧いただけます。
- 本レポートでは、業界における主要な有利分野を取り上げているため、今すぐターゲットを絞ることができます。
- 本レポートには、世界、地域、国の売上と成長に関する詳細な分析が含まれています。
- 競合他社が成功した主なトレンド、変化、収益予測をハイライトしています。
本レポートは、インフルエンザワクチン市場が今後10年間でどのように発展するか、またCOVID-19の景気後退と好転の変動に合わせてどのように発展するかをお伝えします。この市場は、過去10年間のどの時点よりも今が重要である。
2033年までの予測やその他の分析から、商業的な展望が明らかになる
- 2033年までの収益予測に加え、直近の業績、成長率、市場シェアもご覧いただけます。
- ビジネスの展望と展開に関する独自の分析をご覧いただけます。
- 定性的分析(市場ダイナミクス、促進要因、機会、阻害要因など)、ポーターのファイブフォース分析、PEST分析、最近の動向をご覧いただけます。
本レポートには、COVID-19が業界と貴社にどのような影響を与えるかについてのデータ分析と貴重な洞察が含まれている。本レポートでは、COVID-19の4つの回収パターンとその影響、すなわち「V」、「L」、「W」、「U」について論じている。
レポート対象セグメント
ワクチンタイプ
- 4価
- 3価
エンドユーザー
- 専門クリニック
- 病院
- その他
世界市場全体と各分野の売上予測に加え、5つの地域と21の主要国市場の売上予測も掲載しています:
北米
- アメリカ
- カナダ
欧州
- ドイツ
- 英国
- フランス
- イタリア
- スペイン
- その他の欧州
アジア太平洋
- 日本
- 中国
- インド
- オーストラリア
- 韓国
- 東南アジア
- その他のアジア太平洋地域
ラテンアメリカ
- ブラジル
- メキシコ
- その他ラテンアメリカ
MEA
- GCC
- 南アフリカ
- その他のMEA
本レポートでは、2023年から2033年までのインフルエンザワクチン市場における主要企業のプロファイルも掲載している。
主要企業と市場成長の可能性
・ Abbott Laboratories
・ AstraZeneca
・ BIKEN Co., Ltd.
・ CSL
・ Emergent BioSolutions Inc.
・ GSK plc
・ Pfizer Inc.
・ Sanofi
・ SINOVAC
・ Viatris Inc. (Mylan)
2023年から2033年にかけてのインフルエンザワクチン市場全体の世界売上高は、金額ベースで2023年に66億米ドルを突破するとの試算を発表した。2033年まで力強い収益成長を予測。当研究所では、最も大きな可能性を秘めた組織を特定しています。彼らの能力、進歩、商業的展望を発見し、一歩先を行くお手伝いをします。
インフルエンザワクチン市場、2023-2033年レポートはどのように役立つのか?
要約すると、190ページを超えるこのレポートは、以下の知識を提供する:
- インフルエンザワクチン市場の2023年から2033年までの収益予測、ワクチンの種類とエンドユーザー別の予測、世界レベルと地域レベルの各予測 - 業界の展望を発見し、投資と収益に最も有利な場所を見つけます。
- 5つの地域と21の主要国市場の2033年までの収益予測 - 北米、ヨーロッパ、アジア太平洋、ラテンアメリカ、MEAの2023年から2033年までのインフルエンザワクチン市場予測をご覧ください。また、米国、カナダ、メキシコ、ブラジル、ドイツ、フランス、英国、イタリア、中国、インド、日本、オーストラリアなどの主要国の市場も予測しています。
- 既存企業や市場参入を目指す企業の展望 - インフルエンザワクチン市場に関わる主要企業10社の企業プロファイルを含む、2023年から2033年までの市場。
独自の予測による定量的・定性的分析をご覧ください。私たちのレポートだけに含まれる情報を入手し、貴重なビジネスインテリジェンスで情報を得ることができます。
他にはない情報
私たちの新しいレポートがあれば、知識に遅れをとったり、チャンスを逃したりする可能性が低くなります。弊社の調査レポートが貴社の調査、分析、意思決定にどのように役立つかをご覧ください。Visiongainの調査は、2023年から2033年のインフルエンザワクチン市場の商業分析を必要とするすべての人、市場をリードする企業のためのものです。データ、トレンド、予測をご覧いただけます。
ページTOPに戻る
目次
目次
1 レポート概要
1.1 研究の目的
1.2 インフルエンザワクチン市場の紹介
1.3 本レポートの内容
1.4 本レポートを読むべき理由
1.5 本分析レポートが回答する主な質問は以下の通り:
1.6 本レポートは誰のためのものか?
1.7 方法論
1.7.1 市場の定義
1.7.2 市場評価・予測手法
1.7.3 データの検証
1.7.3.1 一次調査
1.7.3.2 セカンダリーリサーチ
1.8 よくある質問(FAQ)
1.9 Visiongainの関連レポート
1.10 Visiongainについて
2 エグゼクティブ・サマリー
3 市場概要
3.1 主要な調査結果
3.2 市場ダイナミクス
3.2.1 市場促進要因
3.2.1.1 産業成長を牽引する高齢者人口の増加
3.2.1.2 ワクチン開発への関心の高まり
3.2.1.3 感染症罹患率の高さが産業の成長を促進する
3.2.1.4 政府による予防接種プログラムの増加
3.2.1.5 産業成長を後押しする小児用インフルエンザワクチン
3.2.2 市場抑制要因
3.2.2.1 保険償還範囲が不十分であることが業界成長の障害となる可能性が高い
3.2.2.2 ワクチン開発期間の長期化が市場成長の妨げになると予測される
3.2.2.3 サプライチェーンの制約
3.2.2.4 保管と取り扱いの課題
3.2.3 市場機会
3.2.3.1 新興国
3.2.3.2 個別化されたワクチン接種戦略
3.2.3.3 パンデミックへの備えと備蓄
3.2.3.4 教育と啓発キャンペーン
3.2.3.5 強力な研究開発パイプライン
3.3 COVID-19インパクト分析
3.4 ポーターのファイブフォース分析
3.4.1 供給者パワー
3.4.2 バイヤーパワー
3.4.3 競争力
3.4.4 代替品による脅威
3.4.5 新規参入企業の脅威
3.5 PEST分析
3.5.1 政治的要因
3.5.2 経済的要因
3.5.3 社会的要因
3.5.4 技術的要因
4 インフルエンザワクチン市場分析:ワクチンタイプ別
4.1 主要な調査結果
4.2 ワクチンタイプ別セグメント 市場魅力度指数
4.3 ワクチンタイプ別インフルエンザワクチン市場規模推定と予測
4.4 4価ワクチン
4.4.1 2023〜2033年の地域別市場予測(US$ Million, AGR %)
4.4.2 地域別市場シェア、2023年・2033年 (%)
4.5 3価クロム
4.5.1 2023~2033年の地域別市場展望(US$ Million, AGR %)
4.5.2 地域別市場シェア、2023年・2033年 (%)
5 インフルエンザワクチン市場分析:エンドユーザー別
5.1 主要調査結果
5.2 エンドユーザーセグメント: 市場魅力度指数
5.3 エンドユーザー別インフルエンザワクチン市場規模推定と予測
5.4 専門クリニック
5.4.1 2023〜2033年の地域別市場予測(US$ Million, AGR %)
5.4.2 地域別市場シェア、2023年・2033年 (%)
5.5 病院
5.5.1 2023〜2033年の地域別市場予測(US$ Million, AGR %)
5.5.2 地域別市場シェア、2023年・2033年 (%)
5.6 その他
5.6.1 2023〜2033年の地域別市場予測(US$ Million, AGR %)
5.6.2 地域別市場シェア、2023年・2033年 (%)
6 インフルエンザワクチン市場分析:地域別
6.1 主要な調査結果
6.2 地域別市場規模の推定と予測
7 北米のインフルエンザワクチン市場分析
7.1 主要な調査結果
7.2 北米のインフルエンザワクチン市場魅力度指数
7.3 北米のインフルエンザワクチン国別市場、2023年、2028年、2033年(US$ Million)
7.4 北米のインフルエンザワクチン市場規模推定と予測:国別
7.5 北米のインフルエンザワクチン市場規模推定と予測:ワクチンタイプ別
7.6 北米のインフルエンザワクチン市場規模推定と予測:エンドユーザー別
7.7 アメリカのインフルエンザワクチン市場分析
7.8 カナダのインフルエンザワクチン市場分析
8 欧州のインフルエンザワクチン市場分析
8.1 主要な調査結果
8.2 欧州インフルエンザワクチン市場魅力度指数
8.3 欧州のインフルエンザワクチン国別市場、2023年、2028年、2033年(US$ Million)
8.4 欧州のインフルエンザワクチン市場規模推定と予測:国別
8.5 欧州のインフルエンザワクチン市場規模推定と予測:ワクチンタイプ別
8.6 欧州のインフルエンザワクチン市場規模推定と予測:エンドユーザー別
8.7 ドイツのインフルエンザワクチン市場分析
8.8 イギリスのインフルエンザワクチン市場分析
8.9 フランスのインフルエンザワクチン市場分析
8.10 イタリアのインフルエンザワクチン市場分析
8.11 スペインのインフルエンザワクチン市場分析
8.12 ロシアのインフルエンザワクチン市場分析
8.13 その他の欧州のインフルエンザワクチン市場分析
9 アジア太平洋地域のインフルエンザワクチン市場分析
9.1 主要な調査結果
9.2 アジア太平洋地域のインフルエンザワクチン市場魅力度指数
9.3 アジア太平洋地域のインフルエンザワクチン国別市場(2023年、2028年、2033年)(US$ Million
9.4 アジア太平洋地域のインフルエンザワクチン市場規模推定と予測:国別
9.5 アジア太平洋地域のインフルエンザワクチン市場規模推定と予測:ワクチンタイプ別
9.6 アジア太平洋地域のインフルエンザワクチン市場規模推定と予測:エンドユーザー別
9.7 日本のインフルエンザワクチン市場分析
9.8 中国のインフルエンザワクチン市場分析
9.9 インドのインフルエンザワクチン市場の分析
9.10 オーストラリアのインフルエンザワクチン市場分析
9.11 韓国のインフルエンザワクチン市場分析
9.12 東南アジアのインフルエンザワクチン市場分析
9.13 その他のアジア太平洋地域のインフルエンザワクチン市場分析
10 ラテンアメリカのインフルエンザワクチン市場分析
10.1 主要な調査結果
10.2 ラテンアメリカのインフルエンザワクチン市場魅力度指数
10.3 ラテンアメリカのインフルエンザワクチン国別市場、2023年、2028年、2033年(US$ Million)
10.4 ラテンアメリカのインフルエンザワクチン市場規模推定と予測:国別
10.5 ラテンアメリカのインフルエンザワクチン市場規模推定と予測:ワクチンタイプ別
10.6 ラテンアメリカのインフルエンザワクチン市場規模推定と予測:エンドユーザー別
10.7 ブラジルのインフルエンザワクチン市場分析
10.8 メキシコのインフルエンザワクチン市場分析
10.9 その他のラテンアメリカのインフルエンザワクチン市場分析
11 MEAのインフルエンザワクチン市場分析
11.1 主要な調査結果
11.2 MEAインフルエンザワクチン市場魅力度指数
11.3 MEAのインフルエンザワクチン国別市場、2023年、2028年、2033年(US$ Million)
11.4 MEAのインフルエンザワクチン市場規模推定と予測:国別
11.5 MEAのインフルエンザワクチン市場規模推定と予測:ワクチンタイプ別
11.6 MEAのインフルエンザワクチン市場規模推定と予測:エンドユーザー別
11.7 GCCのインフルエンザワクチン市場分析
11.8 南アフリカのインフルエンザワクチン市場分析
11.9 その他のMEAのインフルエンザワクチン市場分析
12 企業のプロフィール
12.1 CSL
12.1.1 会社概要
12.1.2 会社概要
12.1.3 財務分析
12.1.3.1 純収入、2015-2022年
12.1.3.2 売上高、2015-2022年
12.1.3.3 地域市場シェア、2022年
12.1.4 製品ベンチマーク
12.1.5 戦略的展望
12.2 Emergent BioSolutions Inc.
12.2.1 会社概要
12.2.2 会社概要
12.2.3 財務分析
12.2.3.1 純収入、2015-2022年
12.2.3.2 売上高、2015-2022年
12.2.4 製品ベンチマーク
12.3 GSK plc
12.3.1 会社概要
12.3.2 会社概要
12.3.3 財務分析
12.3.3.1 純収入、2015-2022年
12.3.3.2 売上高、2015-2022年
12.3.3.3 地域市場シェア、2022年
12.3.4 製品ベンチマーク
12.3.5 戦略的展望
12.4 Pfizer Inc.
12.4.1 会社概要
12.4.2 会社概要
12.4.3 財務分析
12.4.3.1 純収入、2015-2022年
12.4.3.2 売上高、2015-2022年
12.4.4 製品ベンチマーク
12.4.5 戦略的展望
12.5 Sanofi
12.5.1 会社概要
12.5.2 会社概要
12.5.3 財務分析
12.5.3.1 純収入、2015-2022年
12.5.3.2 R&D、2015-2022年
12.5.3.3 地域市場シェア、2022年
12.5.4 製品ベンチマーク
12.5.5 戦略的展望
12.6 AstraZeneca
12.6.1 会社概要
12.6.2 会社概要
12.6.3 財務分析
12.6.3.1 純収入、2015-2022年
12.6.3.2 R&D、2015-2022年
12.6.3.3 地域市場シェア、2022年
12.6.4 製品ベンチマーク
12.6.5 戦略的展望
12.7 SINOVAC
12.7.1 会社概要
12.7.2 会社概要
12.7.3 財務分析
12.7.3.1 純収入、2015-2022年
12.7.3.2 売上高、2015-2022年
12.7.4 製品ベンチマーク
12.7.5 戦略的展望
12.8 Viatris Inc. (Mylan)
12.8.1 会社概要
12.8.2 会社概要
12.8.3 財務分析
12.8.3.1 純収入、2015-2022年
12.8.3.2 地域市場シェア、2022年
12.8.3.3 R&D、2015-2022年
12.8.4 製品ベンチマーク
12.9 Abbott Laboratories
12.9.1 会社概要
12.9.2 会社概要
12.9.3 財務分析
12.9.3.1 純収入、2015-2022年
12.9.3.2 地域市場シェア、2022年
12.9.3.3 R&D、2015-2022年
12.9.4 製品ベンチマーク
12.10 BIKEN Co., Ltd.
12.10.1 会社概要
12.10.2 会社概要
12.10.3 製品ベンチマーク
12.10.4 戦略的展望
13 結論と提言
13.1 Visiongainからの結びの言葉
13.2 市場プレイヤーへの提言
ページTOPに戻る
図表リスト
表の一覧
Table 1 Influenza Vaccines Market Snapshot, 2023 & 2033 (US$ million, CAGR %)
Table 2 Influenza Vaccines Market Forecast by Region, 2023-2033 (US$ Million, AGR%, CAGR%): "V" Shaped Recovery
Table 3 Influenza Vaccines Market Forecast by Region, 2023-2033 (US$ Million, AGR%, CAGR%): "U" Shaped Recovery
Table 4 Influenza Vaccines Market Forecast by Region, 2023-2033 (US$ Million, AGR%, CAGR%): "W" Shaped Recovery
Table 5 Influenza Vaccines Market Forecast by Region, 2023-2033 (US$ Million, AGR%, CAGR%): "L" Shaped Recovery
Table 6 Influenza Vaccines Market Forecast by Vaccine Type, 2023-2033 (US$ Million, AGR%, CAGR%)
Table 7 Quadrivalent Segment Market Forecast by Region, 2023-2033 (US$ Million, AGR%, CAGR%)
Table 8 Trivalent Segment Market Forecast by Region, 2023-2033 (US$ Million, AGR%, CAGR%)
Table 9 Influenza Vaccines Market Forecast by End-users, 2023-2033 (US$ Million, AGR%, CAGR%)
Table 10 Specialty Clinics Segment Market Forecast by Region, 2023-2033 (US$ Million, AGR%, CAGR%)
Table 11 Hospitals Segment Market Forecast by Region, 2023-2033 (US$ Million, AGR%, CAGR%)
Table 12 Others Segment Market Forecast by Region, 2023-2033 (US$ Million, AGR%, CAGR%)
Table 13 Influenza Vaccines Market Forecast by Region, 2023-2033 (US$ Million, AGR%, CAGR%)
Table 14 North America Influenza Vaccines Market Forecast by Country, 2023-2033 (US$ Million, AGR%, CAGR%)
Table 15 North America Influenza Vaccines Market Forecast by Vaccine Type, 2023-2033 (US$ Million, AGR%, CAGR%)
Table 16 North America Influenza Vaccines Market Forecast by End-users, 2023-2033 (US$ Million, AGR%, CAGR%)
Table 17 U.S. Influenza Vaccines Market Forecast, 2023-2033 (US$ Million, AGR%, CAGR%)
Table 18 Canada Influenza Vaccines Market Forecast, 2023-2033 (US$ Million, AGR%, CAGR%)
Table 19 Europe Influenza Vaccines Market Forecast by Country, 2023-2033 (US$ Million, AGR%, CAGR%)
Table 20 Europe Influenza Vaccines Market Forecast by Vaccine Type, 2023-2033 (US$ Million, AGR%, CAGR%)
Table 21 Europe Influenza Vaccines Market Forecast by End-users, 2023-2033 (US$ Million, AGR%, CAGR%)
Table 22 Germany Influenza Vaccines Market Forecast, 2023-2033 (US$ Million, AGR%, CAGR%)
Table 23 UK Influenza Vaccines Market Forecast, 2023-2033 (US$ Million, AGR%, CAGR%)
Table 24 France Influenza Vaccines Market Forecast, 2023-2033 (US$ Million, AGR%, CAGR%)
Table 25 Italy Influenza Vaccines Market Forecast, 2023-2033 (US$ Million, AGR%, CAGR%)
Table 26 Spain Influenza Vaccines Market Forecast, 2023-2033 (US$ Million, AGR%, CAGR%)
Table 27 Russia Influenza Vaccines Market Forecast, 2023-2033 (US$ Million, AGR%, CAGR%)
Table 28 Rest of Europe Influenza Vaccines Market Forecast, 2023-2033 (US$ Million, AGR%, CAGR%)
Table 29 Asia Pacific Influenza Vaccines Market Forecast by Country, 2023-2033 (US$ Million, AGR%, CAGR%)
Table 30 Asia Pacific Influenza Vaccines Market Forecast by Vaccine Type, 2023-2033 (US$ Million, AGR%, CAGR%)
Table 31 Asia Pacific Influenza Vaccines Market Forecast by End-users, 2023-2033 (US$ Million, AGR%, CAGR%)
Table 32 Japan Influenza Vaccines Market Forecast, 2023-2033 (US$ Million, AGR%, CAGR%)
Table 33 China Influenza Vaccines Market Forecast, 2023-2033 (US$ Million, AGR%, CAGR%)
Table 34 India Influenza Vaccines Market Forecast, 2023-2033 (US$ Million, AGR%, CAGR%)
Table 35 Australia Influenza Vaccines Market Forecast, 2023-2033 (US$ Million, AGR%, CAGR%)
Table 36 South Korea Influenza Vaccines Market Forecast, 2023-2033 (US$ Million, AGR%, CAGR%)
Table 37 South-East Asia Influenza Vaccines Market Forecast, 2023-2033 (US$ Million, AGR%, CAGR%)
Table 38 Rest of Asia Pacific Influenza Vaccines Market Forecast, 2023-2033 (US$ Million, AGR%, CAGR%)
Table 39 Latin America Influenza Vaccines Market Forecast by Country, 2023-2033 (US$ Million, AGR%, CAGR%)
Table 40 Latin America Influenza Vaccines Market Forecast by Vaccine Type, 2023-2033 (US$ Million, AGR%, CAGR%)
Table 41 Latin America Influenza Vaccines Market Forecast by End-users, 2023-2033 (US$ Million, AGR%, CAGR%)
Table 42 Brazil Influenza Vaccines Market Forecast, 2023-2033 (US$ Million, AGR%, CAGR%)
Table 43 Mexico Influenza Vaccines Market Forecast, 2023-2033 (US$ Million, AGR%, CAGR%)
Table 44 Rest of Latin America Influenza Vaccines Market Forecast, 2023-2033 (US$ Million, AGR%, CAGR%)
Table 45 MEA Influenza Vaccines Market Forecast by Country, 2023-2033 (US$ Million, AGR%, CAGR%)
Table 46 MEA Influenza Vaccines Market Forecast by Vaccine Type, 2023-2033 (US$ Million, AGR%, CAGR%)
Table 47 MEA Influenza Vaccines Market Forecast by End-users, 2023-2033 (US$ Million, AGR%, CAGR%)
Table 48 GCC Influenza Vaccines Market Forecast, 2023-2033 (US$ Million, AGR%, CAGR%)
Table 49 South Africa Influenza Vaccines Market Forecast, 2023-2033 (US$ Million, AGR%, CAGR%)
Table 50 Rest of MEA Influenza Vaccines Market Forecast, 2023-2033 (US$ Million, AGR%, CAGR%)
Table 51 CSL: Key Details, (CEO, HQ, Revenue, Founded, No. of Employees, Company Type, Website, Business Segment)
Table 52 CSL: Product Benchmarking
Table 53 CSL: Strategic Outlook
Table 54 Emergent BioSolutions Inc.: Key Details, (CEO, HQ, Revenue, Founded, No. of Employees, Company Type, Website, Business Segment)
Table 55 Emergent BioSolutions Inc.: Product Benchmarking
Table 56 GSK plc: Key Details, (CEO, HQ, Revenue, Founded, No. of Employees, Company Type, Website, Business Segment)
Table 57 GSK plc: Product Benchmarking
Table 58 GSK plc: Strategic Outlook
Table 59 Pfizer Inc.: Key Details, (CEO, HQ, Revenue, Founded, No. of Employees, Company Type, Website, Business Segment)
Table 60 Pfizer Inc.: Product Benchmarking
Table 61 Pfizer Inc.: Strategic Outlook
Table 62 Sanofi: Key Details, (CEO, HQ, Revenue, Founded, No. of Employees, Company Type, Website, Business Segment)
Table 63 Sanofi: Product Benchmarking
Table 64 Sanofi: Strategic Outlook
Table 65 AstraZeneca: Key Details, (CEO, HQ, Revenue, Founded, No. of Employees, Company Type, Website, Business Segment)
Table 66 AstraZeneca: Product Benchmarking
Table 67 AstraZeneca: Strategic Outlook
Table 68 SINOVAC: Key Details, (CEO, HQ, Revenue, Founded, No. of Employees, Company Type, Website, Business Segment)
Table 69 SINOVAC: Product Benchmarking
Table 70 SINOVAC: Strategic Outlook
Table 71 Viatris Inc. (Mylan): Key Details, (CEO, HQ, Revenue, Founded, No. of Employees, Company Type, Website, Business Segment)
Table 72 Viatris Inc. (Mylan): Product Benchmarking
Table 73 Abbott Laboratories: Key Details, (CEO, HQ, Revenue, Founded, No. of Employees, Company Type, Website, Business Segment)
Table 74 Abbott Laboratories: Product Benchmarking
Table 75 BIKEN Co., Ltd.: Key Details, (CEO, HQ, Revenue, Founded, No. of Employees, Company Type, Website, Business Segment)
Table 76 BIKEN Co., Ltd.: Product Benchmarking
Table 77 BIKEN Co., Ltd.: Strategic Outlook
図の一覧
Figure 1 Influenza Vaccines Market Segmentation
Figure 2 Influenza Vaccines Market by Vaccine Type: Market Attractiveness Index
Figure 3 Influenza Vaccines Market by End-users: Market Attractiveness Index
Figure 4 Influenza Vaccines Market Attractiveness Index by Region
Figure 5 Influenza Vaccines Market: Market Dynamics
Figure 6 Influenza Vaccines Market by Region, 2023-2033 (US$ Million, AGR %): “V” Shaped Recovery
Figure 7 Influenza Vaccines Market by Region, 2023-2033 (US$ Million, AGR %): “U” Shaped Recovery
Figure 8 Influenza Vaccines Market by Region, 2023-2033 (US$ Million, AGR %): “W” Shaped Recovery
Figure 9 Influenza Vaccines Market by Region, 2023-2033 (US$ Million, AGR %): “L” Shaped Recovery
Figure 10 Influenza Vaccines Market: Porter’s Five Forces Analysis
Figure 11 Influenza Vaccines Market: PEST Analysis
Figure 12 Influenza Vaccines Market Attractiveness Index by Vaccine Type
Figure 13 Influenza Vaccines Market Forecast by Vaccine Type, 2023-2033 (US$ Million, AGR %)
Figure 14 Influenza Vaccines Market Share Forecast by Vaccine Type, 2023, 2028, 2033 (%)
Figure 15 Quadrivalent Segment Market Forecast by Region, 2023-2033 (US$ Million, AGR %)
Figure 16 Quadrivalent Segment Market Share Forecast by Region, 2023 & 2033 (%)
Figure 17 Trivalent Segment Market Forecast by Region, 2023-2033 (US$ Million, AGR %)
Figure 18 Trivalent Segment Market Share Forecast by Region, 2023 & 2033 (%)
Figure 19 Influenza Vaccines Market Attractiveness Index by Vaccine Type
Figure 20 Influenza Vaccines Market Forecast by End-users, 2023-2033 (US$ Million, AGR %)
Figure 21 Influenza Vaccines Market Share Forecast by End-users, 2023, 2028, 2033 (%)
Figure 22 Specialty Clinics Segment Market Forecast by Region, 2023-2033 (US$ Million, AGR %)
Figure 23 Specialty Clinics Segment Market Share Forecast by Region, 2023 & 2033 (%)
Figure 24 Hospitals Segment Market Forecast by Region, 2023-2033 (US$ Million, AGR %)
Figure 25 Hospitals Segment Market Share Forecast by Region, 2023 & 2033 (%)
Figure 26 Others Segment Market Forecast by Region, 2023-2033 (US$ Million, AGR %)
Figure 27 Others Segment Market Share Forecast by Region, 2023 & 2033 (%)
Figure 28 Influenza Vaccines Market Forecast by Region 2023, 2028, 2033 (Revenue, CAGR%)
Figure 29 Influenza Vaccines Market Share Forecast by Region 2023, 2028, 2033 (%)
Figure 30 Influenza Vaccines Market by Region, 2023-2033 (US$ Mn, AGR %)
Figure 31 North America Influenza Vaccines Market Attractiveness Index
Figure 32 North America Influenza Vaccines Market by Region, 2023, 2028 & 2033 (US$ Million)
Figure 33 North America Influenza Vaccines Market Forecast by Country, 2023-2033 (US$ Million, AGR %)
Figure 34 North America Influenza Vaccines Market Share Forecast by Country, 2023 & 2033 (%)
Figure 35 North America Influenza Vaccines Market Forecast by Vaccine Type, 2023-2033 (US$ Million, AGR %)
Figure 36 North America Influenza Vaccines Market Share Forecast by Vaccine Type, 2023 & 2033 (%)
Figure 37 North America Influenza Vaccines Market Forecast by End-users, 2023-2033 (US$ Million, AGR %)
Figure 38 North America Influenza Vaccines Market Share Forecast by End-users, 2023 & 2033 (%)
Figure 39 U.S. Influenza Vaccines Market Forecast, 2023-2033 (US$ Million, AGR %)
Figure 40 Canada Influenza Vaccines Market Forecast, 2023-2033 (US$ Million, AGR %)
Figure 41 Europe Influenza Vaccines Market Attractiveness Index
Figure 42 Europe Influenza Vaccines Market by Region, 2023, 2028 & 2033 (US$ Million)
Figure 43 Europe Influenza Vaccines Market Forecast by Country, 2023-2033 (US$ Million, AGR %)
Figure 44 Europe Influenza Vaccines Market Share Forecast by Country, 2023 & 2033 (%)
Figure 45 Europe Influenza Vaccines Market Forecast by Vaccine Type, 2023-2033 (US$ Million, AGR %)
Figure 46 Europe Influenza Vaccines Market Share Forecast by Vaccine Type, 2023 & 2033 (%)
Figure 47 Europe Influenza Vaccines Market Forecast by End-users, 2023-2033 (US$ Million, AGR %)
Figure 48 Europe Influenza Vaccines Market Share Forecast by End-users, 2023 & 2033 (%)
Figure 49 Germany Influenza Vaccines Market Forecast, 2023-2033 (US$ Million, AGR %)
Figure 50 UK Influenza Vaccines Market Forecast, 2023-2033 (US$ Million, AGR %)
Figure 51 France Influenza Vaccines Market Forecast, 2023-2033 (US$ Million, AGR %)
Figure 52 Italy Influenza Vaccines Market Forecast, 2023-2033 (US$ Million, AGR %)
Figure 53 Spain Influenza Vaccines Market Forecast, 2023-2033 (US$ Million, AGR %)
Figure 54 Russia Influenza Vaccines Market Forecast, 2023-2033 (US$ Million, AGR %)
Figure 55 Rest of Europe Influenza Vaccines Market Forecast, 2023-2033 (US$ Million, AGR %)
Figure 56 Asia Pacific Influenza Vaccines Market Attractiveness Index
Figure 57 Asia Pacific Influenza Vaccines Market by Region, 2023, 2028 & 2033 (US$ Million)
Figure 58 Asia Pacific Influenza Vaccines Market Forecast by Country, 2023-2033 (US$ Million, AGR %)
Figure 59 Asia Pacific Influenza Vaccines Market Share Forecast by Country, 2023 & 2033 (%)
Figure 60 Asia Pacific Influenza Vaccines Market Forecast by Vaccine Type, 2023-2033 (US$ Million, AGR %)
Figure 61 Asia Pacific Influenza Vaccines Market Share Forecast by Vaccine Type, 2023 & 2033 (%)
Figure 62 Asia Pacific Influenza Vaccines Market Forecast by End-users, 2023-2033 (US$ Million, AGR %)
Figure 63 Asia Pacific Influenza Vaccines Market Share Forecast by End-users, 2023 & 2033 (%)
Figure 64 Japan Influenza Vaccines Market Forecast, 2023-2033 (US$ Million, AGR %)
Figure 65 China Influenza Vaccines Market Forecast, 2023-2033 (US$ Million, AGR %)
Figure 66 India Influenza Vaccines Market Forecast, 2023-2033 (US$ Million, AGR %)
Figure 67 Australia Influenza Vaccines Market Forecast, 2023-2033 (US$ Million, AGR %)
Figure 68 South Korea Influenza Vaccines Market Forecast, 2023-2033 (US$ Million, AGR %)
Figure 69 South-East Asia Influenza Vaccines Market Forecast, 2023-2033 (US$ Million, AGR %)
Figure 70 Rest of Asia Pacific Influenza Vaccines Market Forecast, 2023-2033 (US$ Million, AGR %)
Figure 71 Latin America Influenza Vaccines Market Attractiveness Index
Figure 72 Latin America Influenza Vaccines Market by Region, 2023, 2028 & 2033 (US$ Million)
Figure 73 Latin America Influenza Vaccines Market Forecast by Country, 2023-2033 (US$ Million, AGR %)
Figure 74 Latin America Influenza Vaccines Market Share Forecast by Country, 2023 & 2033 (%)
Figure 75 Latin America Influenza Vaccines Market Forecast by Vaccine Type, 2023-2033 (US$ Million, AGR %)
Figure 76 Latin America Influenza Vaccines Market Share Forecast by Vaccine Type, 2023 & 2033 (%)
Figure 77 Latin America Influenza Vaccines Market Forecast by End-users, 2023-2033 (US$ Million, AGR %)
Figure 78 Latin America Influenza Vaccines Market Share Forecast by End-users, 2023 & 2033 (%)
Figure 79 Brazil Influenza Vaccines Market Forecast, 2023-2033 (US$ Million, AGR %)
Figure 80 Mexico Influenza Vaccines Market Forecast, 2023-2033 (US$ Million, AGR %)
Figure 81 Rest of Latin America Influenza Vaccines Market Forecast, 2023-2033 (US$ Million, AGR %)
Figure 82 MEA Influenza Vaccines Market Attractiveness Index
Figure 83 MEA Influenza Vaccines Market by Region, 2023, 2028 & 2033 (US$ Million)
Figure 84 MEA Influenza Vaccines Market Forecast by Country, 2023-2033 (US$ Million, AGR %)
Figure 85 MEA Influenza Vaccines Market Share Forecast by Country, 2023 & 2033 (%)
Figure 86 MEA Influenza Vaccines Market Forecast by Vaccine Type, 2023-2033 (US$ Million, AGR %)
Figure 87 MEA Influenza Vaccines Market Share Forecast by Vaccine Type, 2023 & 2033 (%)
Figure 88 MEA Influenza Vaccines Market Forecast by End-users, 2023-2033 (US$ Million, AGR %)
Figure 89 MEA Influenza Vaccines Market Share Forecast by End-users, 2023 & 2033 (%)
Figure 90 GCC Influenza Vaccines Market Forecast, 2023-2033 (US$ Million, AGR %)
Figure 91 South Africa Influenza Vaccines Market Forecast, 2023-2033 (US$ Million, AGR %)
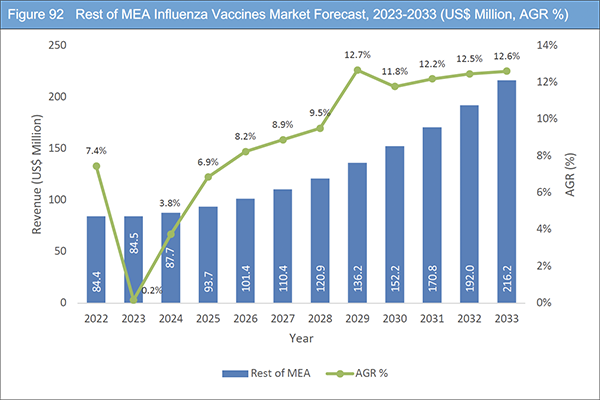
Figure 92 Rest of MEA Influenza Vaccines Market Forecast, 2023-2033 (US$ Million, AGR %)
Figure 93 CSL: Net Revenue, 2015-2022 (US$ Million, AGR %)
Figure 94 CSL: R&D, 2015-2022 (US$ Million, AGR %)
Figure 95 CSL: Regional Market Shares, 2022
Figure 96 Emergent BioSolutions Inc.: Net Revenue, 2015-2022 (US$ Million, AGR %)
Figure 97 Emergent BioSolutions Inc.: R&D, 2015-2022 (US$ Million, AGR %)
Figure 98 GSK plc: Net Revenue, 2015-2022 (US$ Million, AGR %)
Figure 99 GSK plc: R&D, 2015-2022 (US$ Million, AGR %)
Figure 100 GSK plc: Regional Market Shares, 2022
Figure 101 Pfizer Inc.: Net Revenue, 2015-2022 (US$ Million, AGR %)
Figure 102 Pfizer Inc.: R&D, 2015-2022 (US$ Million, AGR %)
Figure 103 Sanofi: Net Revenue, 2015-2022 (US$ Million, AGR %)
Figure 104 Sanofi: R&D, 2015-2022 (US$ Million, AGR %)
Figure 105 Sanofi: Regional Market Shares, 2022
Figure 106 AstraZeneca: Net Revenue, 2015-2022 (US$ Million, AGR %)
Figure 107 AstraZeneca: R&D, 2015-2022 (US$ Million, AGR %)
Figure 108 AstraZeneca: Regional Market Shares, 2022
Figure 109 SINOVAC: Net Revenue, 2015-2022 (US$ Million, AGR %)
Figure 110 SINOVAC: R&D, 2015-2022 (US$ Million, AGR %)
Figure 111 Viatris Inc. (Mylan): Net Revenue, 2015-2022 (US$ million, AGR%)
Figure 112 Viatris Inc. (Mylan): Regional Market Shares (%), 2022
Figure 113 Viatris Inc. (Mylan): R&D, 2015-2022 (US$ million, AGR%)
Figure 114 Abbott Laboratories: Net Revenue, 2015-2022 (US$ million, AGR%)
Figure 115 Abbott Laboratories: Regional Market Shares (%), 2022
Figure 116 Abbott Laboratories: R&D, 2015-2022 (US$ million, AGR%)
ページTOPに戻る
Summary
Report Details
The Influenza Vaccines Market Report 2023-2033: This report will prove invaluable to leading firms striving for new revenue pockets if they wish to better understand the industry and its underlying dynamics. It will be useful for companies that would like to expand into different industries or to expand their existing operations in a new region.
The global prevalence of influenza is on the rise. The most effective method of averting the widespread infection is through vaccination. As the global population ages, individuals become more susceptible to influenza, which increases the demand for influenza vaccines. Increasing awareness of influenza, the improvement of healthcare services, and high birth rates in developed nations will all contribute to increased demand for current and new influenza vaccines during the forecast period. As a result, the influenza vaccine sector exhibits substantial growth prospects and robust revenue generation. Vaccination is a stressful experience, especially for children; therefore, an organisation that provides a non-stressful vaccine stands to gain substantial benefits.
What Questions Should You Ask before Buying a Market Research Report?
• How is the influenza vaccines market evolving?
• What is driving and restraining the influenza vaccines market?
• How will each influenza vaccines submarket segment grow over the forecast period and how much revenue will these submarkets account for in 2033?
• How will the market shares for each influenza vaccines submarket develop from 2023 to 2033?
• What will be the main driver for the overall market from 2023 to 2033?
• Will leading influenza vaccines markets broadly follow the macroeconomic dynamics, or will individual national markets outperform others?
• How will the market shares of the national markets change by 2033 and which geographical region will lead the market in 2033?
• Who are the leading players and what are their prospects over the forecast period?
• What are the influenza vaccines projects for these leading companies?
• How will the industry evolve during the period between 2023 and 2033? What are the implications of
influenza vaccines projects taking place now and over the next 10 years?
• Is there a greater need for product commercialisation to further scale the influenza vaccines market?
• Where is the influenza vaccines market heading and how can you ensure you are at the forefront of the market?
• What are the best investment options for new product and service lines?
• What are the key prospects for moving companies into a new growth path and C-suite?
You need to discover how this will impact the influenza vaccines market today, and over the next 10 years:
• Our 192-page report provides 77 tables and 116 charts/graphs exclusively to you.
• The report highlights key lucrative areas in the industry so you can target them – NOW.
• It contains in-depth analysis of global, regional and national sales and growth.
• It highlights for you the key successful trends, changes and revenue projections made by your competitors.
This report tells you TODAY how the influenza vaccines market will develop in the next 10 years, and in line with the variations in COVID-19 economic recession and bounce. This market is more critical now than at any point over the last 10 years.
Forecasts to 2033 and other analyses reveal commercial prospects
• In addition to revenue forecasting to 2033, our new study provides you with recent results, growth rates, and market shares.
• You will find original analyses, with business outlooks and developments.
• Discover qualitative analyses (including market dynamics, drivers, opportunities, and restraints), Porter’s Five Forces Analysis, PEST Analysis and recent developments.
This report includes data analysis and invaluable insight into how COVID-19 will affect the industry and your company. Four COVID-19 recovery patterns and their impact, namely, “V”, “L”, “W” and “U” are discussed in this report.
Segments Covered in the Report
Vaccine Type
• Quadrivalent
• Trivalent
End-users
• Specialty Clinics
• Hospitals
• Others
In addition to the revenue predictions for the overall world market and segments, you will also find revenue forecasts for five regional and 21 leading national markets:
North America
• U.S.
• Canada
Europe
• Germany
• UK
• France
• Italy
• Spain
• Rest of Europe
Asia Pacific
• Japan
• China
• India
• Australia
• South Korea
• South-East Asia
• Rest of Asia Pacific
Latin America
• Brazil
• Mexico
• Rest of Latin America
MEA
• GCC
• South Africa
• Rest of MEA
The report also includes profiles and for some of the leading companies in the Influenza Vaccines Market, 2023 to 2033, with a focus on this segment of these companies’ operations.
Leading companies and the potential for market growth
• Abbott Laboratories
• AstraZeneca
• BIKEN Co., Ltd.
• CSL
• Emergent BioSolutions Inc.
• GSK plc
• Pfizer Inc.
• Sanofi
• SINOVAC
• Viatris Inc. (Mylan)
Overall world revenue for Influenza Vaccines Market, 2023 to 2033 in terms of value the market will surpass US$6,600.0million in 2023, our work calculates. We predict strong revenue growth through to 2033. Our work identifies which organizations hold the greatest potential. Discover their capabilities, progress, and commercial prospects, helping you stay ahead.
How will the Influenza Vaccines Market, 2023 to 2033 report help you?
In summary, our 190+ page report provides you with the following knowledge:
• Revenue forecasts to 2033 for Influenza Vaccines Market 2023 to 2033, with forecasts for vaccine type and end-users, each forecast at a global and regional level – discover the industry’s prospects, finding the most lucrative places for investments and revenues.
• Revenue forecasts to 2033 for five regional and 21 key national markets – See forecasts for the Influenza Vaccines Market, 2023 to 2033 market in North America, Europe, Asia-Pacific, Latin America, and MEA. Also forecasted is the market in the US, Canada, Mexico, Brazil, Germany, France, UK, Italy, China, India, Japan, and Australia among other prominent economies.
• Prospects for established firms and those seeking to enter the market – including company profiles for 10 of the major companies involved in the Influenza Vaccines Market, 2023 to 2033.
Find quantitative and qualitative analyses with independent predictions. Receive information that only our report contains, staying informed with invaluable business intelligence.
Information found nowhere else
With our new report, you are less likely to fall behind in knowledge or miss out on opportunities. See how our work could benefit your research, analyses, and decisions. Visiongain’s study is for everybody needing commercial analyses for the Influenza Vaccines Market 2023 to 2033, market-leading companies. You will find data, trends and predictions.
ページTOPに戻る
Table of Contents
Table of Contents
1 Report Overview
1.1 Objectives of the Study
1.2 Introduction to Influenza Vaccines Market
1.3 What This Report Delivers
1.4 Why You Should Read This Report
1.5 Key Questions Answered by This Analytical Report Include:
1.6 Who is This Report For?
1.7 Methodology
1.7.1 Market Definitions
1.7.2 Market Evaluation & Forecasting Methodology
1.7.3 Data Validation
1.7.3.1 Primary Research
1.7.3.2 Secondary Research
1.8 Frequently Asked Questions (FAQs)
1.9 Associated Visiongain Reports
1.10 About Visiongain
2 Executive Summary
3 Market Overview
3.1 Key Findings
3.2 Market Dynamics
3.2.1 Market Driving Factors
3.2.1.1 Growing Elderly Population Driving Industry Growth
3.2.1.2 Growing Interest in Vaccine Development
3.2.1.3 High Prevalence of Infectious Diseases Anticipated to Spur Industry Growth
3.2.1.4 Increase in Government Focus on Immunization Programs
3.2.1.5 Paediatric Influenza Vaccines Boosting Industry Growth
3.2.2 Market Restraining Factors
3.2.2.1 Inadequate Reimbursement Coverage Likely to Challenge Industry Growth
3.2.2.2 Longer Timelines for Vaccine Development Projected to Hamper Market Growth
3.2.2.3 Supply Chain Constraints
3.2.2.4 Storage and Handling Challenges
3.2.3 Market Opportunities
3.2.3.1 Emerging Economies
3.2.3.2 Personalized Vaccination Strategies
3.2.3.3 Pandemic Preparedness and Stockpiling
3.2.3.4 Education and Public Awareness Campaigns
3.2.3.5 Strong R&D Pipeline
3.3 COVID-19 Impact Analysis
3.4 Porter’s Five Forces Analysis
3.4.1 Supplier Power
3.4.2 Buyer Power
3.4.3 Competitive Rivalry
3.4.4 Threat from Substitutes
3.4.5 Threat of New Entrants
3.5 PEST Analysis
3.5.1 Political Factors
3.5.2 Economic Factors
3.5.3 Social Factors
3.5.4 Technological Factors
4 Influenza Vaccines Market Analysis by Vaccine Type
4.1 Key Findings
4.2 Vaccine Type Segment: Market Attractiveness Index
4.3 Influenza Vaccines Market Size Estimation and Forecast by Vaccine Type
4.4 Quadrivalent
4.4.1 Market Forecast by Region, 2023-2033 (US$ Million, AGR %)
4.4.2 Market Share by Region, 2023 & 2033 (%)
4.5 Trivalent
4.5.1 Market Forecast by Region, 2023-2033 (US$ Million, AGR %)
4.5.2 Market Share by Region, 2023 & 2033 (%)
5 Influenza Vaccines Market Analysis by End-users
5.1 Key Findings
5.2 End-users Segment: Market Attractiveness Index
5.3 Influenza Vaccines Market Size Estimation and Forecast by End-users
5.4 Specialty Clinics
5.4.1 Market Forecast by Region, 2023-2033 (US$ Million, AGR %)
5.4.2 Market Share by Region, 2023 & 2033 (%)
5.5 Hospitals
5.5.1 Market Forecast by Region, 2023-2033 (US$ Million, AGR %)
5.5.2 Market Share by Region, 2023 & 2033 (%)
5.6 Others
5.6.1 Market Forecast by Region, 2023-2033 (US$ Million, AGR %)
5.6.2 Market Share by Region, 2023 & 2033 (%)
6 Influenza Vaccines Market Analysis by Region
6.1 Key Findings
6.2 Regional Market Size Estimation and Forecast
7 North America Influenza Vaccines Market Analysis
7.1 Key Findings
7.2 North America Influenza Vaccines Market Attractiveness Index
7.3 North America Influenza Vaccines Market by Country, 2023, 2028 & 2033 (US$ Million)
7.4 North America Influenza Vaccines Market Size Estimation and Forecast by Country
7.5 North America Influenza Vaccines Market Size Estimation and Forecast by Vaccine Type
7.6 North America Influenza Vaccines Market Size Estimation and Forecast by End-users
7.7 U.S. Influenza Vaccines Market Analysis
7.8 Canada Influenza Vaccines Market Analysis
8 Europe Influenza Vaccines Market Analysis
8.1 Key Findings
8.2 Europe Influenza Vaccines Market Attractiveness Index
8.3 Europe Influenza Vaccines Market by Country, 2023, 2028 & 2033 (US$ Million)
8.4 Europe Influenza Vaccines Market Size Estimation and Forecast by Country
8.5 Europe Influenza Vaccines Market Size Estimation and Forecast by Vaccine Type
8.6 Europe Influenza Vaccines Market Size Estimation and Forecast by End-users
8.7 Germany Influenza Vaccines Market Analysis
8.8 UK Influenza Vaccines Market Analysis
8.9 France Influenza Vaccines Market Analysis
8.10 Italy Influenza Vaccines Market Analysis
8.11 Spain Influenza Vaccines Market Analysis
8.12 Russia Influenza Vaccines Market Analysis
8.13 Rest of Europe Influenza Vaccines Market Analysis
9 Asia Pacific Influenza Vaccines Market Analysis
9.1 Key Findings
9.2 Asia Pacific Influenza Vaccines Market Attractiveness Index
9.3 Asia Pacific Influenza Vaccines Market by Country, 2023, 2028 & 2033 (US$ Million)
9.4 Asia Pacific Influenza Vaccines Market Size Estimation and Forecast by Country
9.5 Asia Pacific Influenza Vaccines Market Size Estimation and Forecast by Vaccine Type
9.6 Asia Pacific Influenza Vaccines Market Size Estimation and Forecast by End-users
9.7 Japan Influenza Vaccines Market Analysis
9.8 China Influenza Vaccines Market Analysis
9.9 India Influenza Vaccines Market Analysis
9.10 Australia Influenza Vaccines Market Analysis
9.11 South Korea Influenza Vaccines Market Analysis
9.12 South-East Asia Influenza Vaccines Market Analysis
9.13 Rest of Asia Pacific Influenza Vaccines Market Analysis
10 Latin America Influenza Vaccines Market Analysis
10.1 Key Findings
10.2 Latin America Influenza Vaccines Market Attractiveness Index
10.3 Latin America Influenza Vaccines Market by Country, 2023, 2028 & 2033 (US$ Million)
10.4 Latin America Influenza Vaccines Market Size Estimation and Forecast by Country
10.5 Latin America Influenza Vaccines Market Size Estimation and Forecast by Vaccine Type
10.6 Latin America Influenza Vaccines Market Size Estimation and Forecast by End-users
10.7 Brazil Influenza Vaccines Market Analysis
10.8 Mexico Influenza Vaccines Market Analysis
10.9 Rest of Latin America Influenza Vaccines Market Analysis
11 MEA Influenza Vaccines Market Analysis
11.1 Key Findings
11.2 MEA Influenza Vaccines Market Attractiveness Index
11.3 MEA Influenza Vaccines Market by Country, 2023, 2028 & 2033 (US$ Million)
11.4 MEA Influenza Vaccines Market Size Estimation and Forecast by Country
11.5 MEA Influenza Vaccines Market Size Estimation and Forecast by Vaccine Type
11.6 MEA Influenza Vaccines Market Size Estimation and Forecast by End-users
11.7 GCC Influenza Vaccines Market Analysis
11.8 South Africa Influenza Vaccines Market Analysis
11.9 Rest of MEA Influenza Vaccines Market Analysis
12 Company Profiles
12.1 CSL
12.1.1 Company Snapshot
12.1.2 Company Overview
12.1.3 Financial Analysis
12.1.3.1 Net Revenue, 2015-2022
12.1.3.2 R&D, 2015-2022
12.1.3.3 Regional Market Shares, 2022
12.1.4 Product Benchmarking
12.1.5 Strategic Outlook
12.2 Emergent BioSolutions Inc.
12.2.1 Company Snapshot
12.2.2 Company Overview
12.2.3 Financial Analysis
12.2.3.1 Net Revenue, 2015-2022
12.2.3.2 R&D, 2015-2022
12.2.4 Product Benchmarking
12.3 GSK plc
12.3.1 Company Snapshot
12.3.2 Company Overview
12.3.3 Financial Analysis
12.3.3.1 Net Revenue, 2015-2022
12.3.3.2 R&D, 2015-2022
12.3.3.3 Regional Market Shares, 2022
12.3.4 Product Benchmarking
12.3.5 Strategic Outlook
12.4 Pfizer Inc.
12.4.1 Company Snapshot
12.4.2 Company Overview
12.4.3 Financial Analysis
12.4.3.1 Net Revenue, 2015-2022
12.4.3.2 R&D, 2015-2022
12.4.4 Product Benchmarking
12.4.5 Strategic Outlook
12.5 Sanofi
12.5.1 Company Snapshot
12.5.2 Company Overview
12.5.3 Financial Analysis
12.5.3.1 Net Revenue, 2015-2022
12.5.3.2 R&D, 2015-2022
12.5.3.3 Regional Market Shares, 2022
12.5.4 Product Benchmarking
12.5.5 Strategic Outlook
12.6 AstraZeneca
12.6.1 Company Snapshot
12.6.2 Company Overview
12.6.3 Financial Analysis
12.6.3.1 Net Revenue, 2015-2022
12.6.3.2 R&D, 2015-2022
12.6.3.3 Regional Market Shares, 2022
12.6.4 Product Benchmarking
12.6.5 Strategic Outlook
12.7 SINOVAC
12.7.1 Company Snapshot
12.7.2 Company Overview
12.7.3 Financial Analysis
12.7.3.1 Net Revenue, 2015-2022
12.7.3.2 R&D, 2015-2022
12.7.4 Product Benchmarking
12.7.5 Strategic Outlook
12.8 Viatris Inc. (Mylan)
12.8.1 Company Snapshot
12.8.2 Company Overview
12.8.3 Financial Analysis
12.8.3.1 Net Revenue, 2015-2022
12.8.3.2 Regional Market Shares, 2022
12.8.3.3 R&D, 2015-2022
12.8.4 Product Benchmarking
12.9 Abbott Laboratories
12.9.1 Company Snapshot
12.9.2 Company Overview
12.9.3 Financial Analysis
12.9.3.1 Net Revenue, 2015-2022
12.9.3.2 Regional Market Shares, 2022
12.9.3.3 R&D, 2015-2022
12.9.4 Product Benchmarking
12.10 BIKEN Co., Ltd.
12.10.1 Company Snapshot
12.10.2 Company Overview
12.10.3 Product Benchmarking
12.10.4 Strategic Outlook
13 Conclusion and Recommendations
13.1 Concluding Remarks from Visiongain
13.2 Recommendations for Market Players
ページTOPに戻る
List of Tables/Graphs
List of Tables
Table 1 Influenza Vaccines Market Snapshot, 2023 & 2033 (US$ million, CAGR %)
Table 2 Influenza Vaccines Market Forecast by Region, 2023-2033 (US$ Million, AGR%, CAGR%): "V" Shaped Recovery
Table 3 Influenza Vaccines Market Forecast by Region, 2023-2033 (US$ Million, AGR%, CAGR%): "U" Shaped Recovery
Table 4 Influenza Vaccines Market Forecast by Region, 2023-2033 (US$ Million, AGR%, CAGR%): "W" Shaped Recovery
Table 5 Influenza Vaccines Market Forecast by Region, 2023-2033 (US$ Million, AGR%, CAGR%): "L" Shaped Recovery
Table 6 Influenza Vaccines Market Forecast by Vaccine Type, 2023-2033 (US$ Million, AGR%, CAGR%)
Table 7 Quadrivalent Segment Market Forecast by Region, 2023-2033 (US$ Million, AGR%, CAGR%)
Table 8 Trivalent Segment Market Forecast by Region, 2023-2033 (US$ Million, AGR%, CAGR%)
Table 9 Influenza Vaccines Market Forecast by End-users, 2023-2033 (US$ Million, AGR%, CAGR%)
Table 10 Specialty Clinics Segment Market Forecast by Region, 2023-2033 (US$ Million, AGR%, CAGR%)
Table 11 Hospitals Segment Market Forecast by Region, 2023-2033 (US$ Million, AGR%, CAGR%)
Table 12 Others Segment Market Forecast by Region, 2023-2033 (US$ Million, AGR%, CAGR%)
Table 13 Influenza Vaccines Market Forecast by Region, 2023-2033 (US$ Million, AGR%, CAGR%)
Table 14 North America Influenza Vaccines Market Forecast by Country, 2023-2033 (US$ Million, AGR%, CAGR%)
Table 15 North America Influenza Vaccines Market Forecast by Vaccine Type, 2023-2033 (US$ Million, AGR%, CAGR%)
Table 16 North America Influenza Vaccines Market Forecast by End-users, 2023-2033 (US$ Million, AGR%, CAGR%)
Table 17 U.S. Influenza Vaccines Market Forecast, 2023-2033 (US$ Million, AGR%, CAGR%)
Table 18 Canada Influenza Vaccines Market Forecast, 2023-2033 (US$ Million, AGR%, CAGR%)
Table 19 Europe Influenza Vaccines Market Forecast by Country, 2023-2033 (US$ Million, AGR%, CAGR%)
Table 20 Europe Influenza Vaccines Market Forecast by Vaccine Type, 2023-2033 (US$ Million, AGR%, CAGR%)
Table 21 Europe Influenza Vaccines Market Forecast by End-users, 2023-2033 (US$ Million, AGR%, CAGR%)
Table 22 Germany Influenza Vaccines Market Forecast, 2023-2033 (US$ Million, AGR%, CAGR%)
Table 23 UK Influenza Vaccines Market Forecast, 2023-2033 (US$ Million, AGR%, CAGR%)
Table 24 France Influenza Vaccines Market Forecast, 2023-2033 (US$ Million, AGR%, CAGR%)
Table 25 Italy Influenza Vaccines Market Forecast, 2023-2033 (US$ Million, AGR%, CAGR%)
Table 26 Spain Influenza Vaccines Market Forecast, 2023-2033 (US$ Million, AGR%, CAGR%)
Table 27 Russia Influenza Vaccines Market Forecast, 2023-2033 (US$ Million, AGR%, CAGR%)
Table 28 Rest of Europe Influenza Vaccines Market Forecast, 2023-2033 (US$ Million, AGR%, CAGR%)
Table 29 Asia Pacific Influenza Vaccines Market Forecast by Country, 2023-2033 (US$ Million, AGR%, CAGR%)
Table 30 Asia Pacific Influenza Vaccines Market Forecast by Vaccine Type, 2023-2033 (US$ Million, AGR%, CAGR%)
Table 31 Asia Pacific Influenza Vaccines Market Forecast by End-users, 2023-2033 (US$ Million, AGR%, CAGR%)
Table 32 Japan Influenza Vaccines Market Forecast, 2023-2033 (US$ Million, AGR%, CAGR%)
Table 33 China Influenza Vaccines Market Forecast, 2023-2033 (US$ Million, AGR%, CAGR%)
Table 34 India Influenza Vaccines Market Forecast, 2023-2033 (US$ Million, AGR%, CAGR%)
Table 35 Australia Influenza Vaccines Market Forecast, 2023-2033 (US$ Million, AGR%, CAGR%)
Table 36 South Korea Influenza Vaccines Market Forecast, 2023-2033 (US$ Million, AGR%, CAGR%)
Table 37 South-East Asia Influenza Vaccines Market Forecast, 2023-2033 (US$ Million, AGR%, CAGR%)
Table 38 Rest of Asia Pacific Influenza Vaccines Market Forecast, 2023-2033 (US$ Million, AGR%, CAGR%)
Table 39 Latin America Influenza Vaccines Market Forecast by Country, 2023-2033 (US$ Million, AGR%, CAGR%)
Table 40 Latin America Influenza Vaccines Market Forecast by Vaccine Type, 2023-2033 (US$ Million, AGR%, CAGR%)
Table 41 Latin America Influenza Vaccines Market Forecast by End-users, 2023-2033 (US$ Million, AGR%, CAGR%)
Table 42 Brazil Influenza Vaccines Market Forecast, 2023-2033 (US$ Million, AGR%, CAGR%)
Table 43 Mexico Influenza Vaccines Market Forecast, 2023-2033 (US$ Million, AGR%, CAGR%)
Table 44 Rest of Latin America Influenza Vaccines Market Forecast, 2023-2033 (US$ Million, AGR%, CAGR%)
Table 45 MEA Influenza Vaccines Market Forecast by Country, 2023-2033 (US$ Million, AGR%, CAGR%)
Table 46 MEA Influenza Vaccines Market Forecast by Vaccine Type, 2023-2033 (US$ Million, AGR%, CAGR%)
Table 47 MEA Influenza Vaccines Market Forecast by End-users, 2023-2033 (US$ Million, AGR%, CAGR%)
Table 48 GCC Influenza Vaccines Market Forecast, 2023-2033 (US$ Million, AGR%, CAGR%)
Table 49 South Africa Influenza Vaccines Market Forecast, 2023-2033 (US$ Million, AGR%, CAGR%)
Table 50 Rest of MEA Influenza Vaccines Market Forecast, 2023-2033 (US$ Million, AGR%, CAGR%)
Table 51 CSL: Key Details, (CEO, HQ, Revenue, Founded, No. of Employees, Company Type, Website, Business Segment)
Table 52 CSL: Product Benchmarking
Table 53 CSL: Strategic Outlook
Table 54 Emergent BioSolutions Inc.: Key Details, (CEO, HQ, Revenue, Founded, No. of Employees, Company Type, Website, Business Segment)
Table 55 Emergent BioSolutions Inc.: Product Benchmarking
Table 56 GSK plc: Key Details, (CEO, HQ, Revenue, Founded, No. of Employees, Company Type, Website, Business Segment)
Table 57 GSK plc: Product Benchmarking
Table 58 GSK plc: Strategic Outlook
Table 59 Pfizer Inc.: Key Details, (CEO, HQ, Revenue, Founded, No. of Employees, Company Type, Website, Business Segment)
Table 60 Pfizer Inc.: Product Benchmarking
Table 61 Pfizer Inc.: Strategic Outlook
Table 62 Sanofi: Key Details, (CEO, HQ, Revenue, Founded, No. of Employees, Company Type, Website, Business Segment)
Table 63 Sanofi: Product Benchmarking
Table 64 Sanofi: Strategic Outlook
Table 65 AstraZeneca: Key Details, (CEO, HQ, Revenue, Founded, No. of Employees, Company Type, Website, Business Segment)
Table 66 AstraZeneca: Product Benchmarking
Table 67 AstraZeneca: Strategic Outlook
Table 68 SINOVAC: Key Details, (CEO, HQ, Revenue, Founded, No. of Employees, Company Type, Website, Business Segment)
Table 69 SINOVAC: Product Benchmarking
Table 70 SINOVAC: Strategic Outlook
Table 71 Viatris Inc. (Mylan): Key Details, (CEO, HQ, Revenue, Founded, No. of Employees, Company Type, Website, Business Segment)
Table 72 Viatris Inc. (Mylan): Product Benchmarking
Table 73 Abbott Laboratories: Key Details, (CEO, HQ, Revenue, Founded, No. of Employees, Company Type, Website, Business Segment)
Table 74 Abbott Laboratories: Product Benchmarking
Table 75 BIKEN Co., Ltd.: Key Details, (CEO, HQ, Revenue, Founded, No. of Employees, Company Type, Website, Business Segment)
Table 76 BIKEN Co., Ltd.: Product Benchmarking
Table 77 BIKEN Co., Ltd.: Strategic Outlook
List of Figures
Figure 1 Influenza Vaccines Market Segmentation
Figure 2 Influenza Vaccines Market by Vaccine Type: Market Attractiveness Index
Figure 3 Influenza Vaccines Market by End-users: Market Attractiveness Index
Figure 4 Influenza Vaccines Market Attractiveness Index by Region
Figure 5 Influenza Vaccines Market: Market Dynamics
Figure 6 Influenza Vaccines Market by Region, 2023-2033 (US$ Million, AGR %): “V” Shaped Recovery
Figure 7 Influenza Vaccines Market by Region, 2023-2033 (US$ Million, AGR %): “U” Shaped Recovery
Figure 8 Influenza Vaccines Market by Region, 2023-2033 (US$ Million, AGR %): “W” Shaped Recovery
Figure 9 Influenza Vaccines Market by Region, 2023-2033 (US$ Million, AGR %): “L” Shaped Recovery
Figure 10 Influenza Vaccines Market: Porter’s Five Forces Analysis
Figure 11 Influenza Vaccines Market: PEST Analysis
Figure 12 Influenza Vaccines Market Attractiveness Index by Vaccine Type
Figure 13 Influenza Vaccines Market Forecast by Vaccine Type, 2023-2033 (US$ Million, AGR %)
Figure 14 Influenza Vaccines Market Share Forecast by Vaccine Type, 2023, 2028, 2033 (%)
Figure 15 Quadrivalent Segment Market Forecast by Region, 2023-2033 (US$ Million, AGR %)
Figure 16 Quadrivalent Segment Market Share Forecast by Region, 2023 & 2033 (%)
Figure 17 Trivalent Segment Market Forecast by Region, 2023-2033 (US$ Million, AGR %)
Figure 18 Trivalent Segment Market Share Forecast by Region, 2023 & 2033 (%)
Figure 19 Influenza Vaccines Market Attractiveness Index by Vaccine Type
Figure 20 Influenza Vaccines Market Forecast by End-users, 2023-2033 (US$ Million, AGR %)
Figure 21 Influenza Vaccines Market Share Forecast by End-users, 2023, 2028, 2033 (%)
Figure 22 Specialty Clinics Segment Market Forecast by Region, 2023-2033 (US$ Million, AGR %)
Figure 23 Specialty Clinics Segment Market Share Forecast by Region, 2023 & 2033 (%)
Figure 24 Hospitals Segment Market Forecast by Region, 2023-2033 (US$ Million, AGR %)
Figure 25 Hospitals Segment Market Share Forecast by Region, 2023 & 2033 (%)
Figure 26 Others Segment Market Forecast by Region, 2023-2033 (US$ Million, AGR %)
Figure 27 Others Segment Market Share Forecast by Region, 2023 & 2033 (%)
Figure 28 Influenza Vaccines Market Forecast by Region 2023, 2028, 2033 (Revenue, CAGR%)
Figure 29 Influenza Vaccines Market Share Forecast by Region 2023, 2028, 2033 (%)
Figure 30 Influenza Vaccines Market by Region, 2023-2033 (US$ Mn, AGR %)
Figure 31 North America Influenza Vaccines Market Attractiveness Index
Figure 32 North America Influenza Vaccines Market by Region, 2023, 2028 & 2033 (US$ Million)
Figure 33 North America Influenza Vaccines Market Forecast by Country, 2023-2033 (US$ Million, AGR %)
Figure 34 North America Influenza Vaccines Market Share Forecast by Country, 2023 & 2033 (%)
Figure 35 North America Influenza Vaccines Market Forecast by Vaccine Type, 2023-2033 (US$ Million, AGR %)
Figure 36 North America Influenza Vaccines Market Share Forecast by Vaccine Type, 2023 & 2033 (%)
Figure 37 North America Influenza Vaccines Market Forecast by End-users, 2023-2033 (US$ Million, AGR %)
Figure 38 North America Influenza Vaccines Market Share Forecast by End-users, 2023 & 2033 (%)
Figure 39 U.S. Influenza Vaccines Market Forecast, 2023-2033 (US$ Million, AGR %)
Figure 40 Canada Influenza Vaccines Market Forecast, 2023-2033 (US$ Million, AGR %)
Figure 41 Europe Influenza Vaccines Market Attractiveness Index
Figure 42 Europe Influenza Vaccines Market by Region, 2023, 2028 & 2033 (US$ Million)
Figure 43 Europe Influenza Vaccines Market Forecast by Country, 2023-2033 (US$ Million, AGR %)
Figure 44 Europe Influenza Vaccines Market Share Forecast by Country, 2023 & 2033 (%)
Figure 45 Europe Influenza Vaccines Market Forecast by Vaccine Type, 2023-2033 (US$ Million, AGR %)
Figure 46 Europe Influenza Vaccines Market Share Forecast by Vaccine Type, 2023 & 2033 (%)
Figure 47 Europe Influenza Vaccines Market Forecast by End-users, 2023-2033 (US$ Million, AGR %)
Figure 48 Europe Influenza Vaccines Market Share Forecast by End-users, 2023 & 2033 (%)
Figure 49 Germany Influenza Vaccines Market Forecast, 2023-2033 (US$ Million, AGR %)
Figure 50 UK Influenza Vaccines Market Forecast, 2023-2033 (US$ Million, AGR %)
Figure 51 France Influenza Vaccines Market Forecast, 2023-2033 (US$ Million, AGR %)
Figure 52 Italy Influenza Vaccines Market Forecast, 2023-2033 (US$ Million, AGR %)
Figure 53 Spain Influenza Vaccines Market Forecast, 2023-2033 (US$ Million, AGR %)
Figure 54 Russia Influenza Vaccines Market Forecast, 2023-2033 (US$ Million, AGR %)
Figure 55 Rest of Europe Influenza Vaccines Market Forecast, 2023-2033 (US$ Million, AGR %)
Figure 56 Asia Pacific Influenza Vaccines Market Attractiveness Index
Figure 57 Asia Pacific Influenza Vaccines Market by Region, 2023, 2028 & 2033 (US$ Million)
Figure 58 Asia Pacific Influenza Vaccines Market Forecast by Country, 2023-2033 (US$ Million, AGR %)
Figure 59 Asia Pacific Influenza Vaccines Market Share Forecast by Country, 2023 & 2033 (%)
Figure 60 Asia Pacific Influenza Vaccines Market Forecast by Vaccine Type, 2023-2033 (US$ Million, AGR %)
Figure 61 Asia Pacific Influenza Vaccines Market Share Forecast by Vaccine Type, 2023 & 2033 (%)
Figure 62 Asia Pacific Influenza Vaccines Market Forecast by End-users, 2023-2033 (US$ Million, AGR %)
Figure 63 Asia Pacific Influenza Vaccines Market Share Forecast by End-users, 2023 & 2033 (%)
Figure 64 Japan Influenza Vaccines Market Forecast, 2023-2033 (US$ Million, AGR %)
Figure 65 China Influenza Vaccines Market Forecast, 2023-2033 (US$ Million, AGR %)
Figure 66 India Influenza Vaccines Market Forecast, 2023-2033 (US$ Million, AGR %)
Figure 67 Australia Influenza Vaccines Market Forecast, 2023-2033 (US$ Million, AGR %)
Figure 68 South Korea Influenza Vaccines Market Forecast, 2023-2033 (US$ Million, AGR %)
Figure 69 South-East Asia Influenza Vaccines Market Forecast, 2023-2033 (US$ Million, AGR %)
Figure 70 Rest of Asia Pacific Influenza Vaccines Market Forecast, 2023-2033 (US$ Million, AGR %)
Figure 71 Latin America Influenza Vaccines Market Attractiveness Index
Figure 72 Latin America Influenza Vaccines Market by Region, 2023, 2028 & 2033 (US$ Million)
Figure 73 Latin America Influenza Vaccines Market Forecast by Country, 2023-2033 (US$ Million, AGR %)
Figure 74 Latin America Influenza Vaccines Market Share Forecast by Country, 2023 & 2033 (%)
Figure 75 Latin America Influenza Vaccines Market Forecast by Vaccine Type, 2023-2033 (US$ Million, AGR %)
Figure 76 Latin America Influenza Vaccines Market Share Forecast by Vaccine Type, 2023 & 2033 (%)
Figure 77 Latin America Influenza Vaccines Market Forecast by End-users, 2023-2033 (US$ Million, AGR %)
Figure 78 Latin America Influenza Vaccines Market Share Forecast by End-users, 2023 & 2033 (%)
Figure 79 Brazil Influenza Vaccines Market Forecast, 2023-2033 (US$ Million, AGR %)
Figure 80 Mexico Influenza Vaccines Market Forecast, 2023-2033 (US$ Million, AGR %)
Figure 81 Rest of Latin America Influenza Vaccines Market Forecast, 2023-2033 (US$ Million, AGR %)
Figure 82 MEA Influenza Vaccines Market Attractiveness Index
Figure 83 MEA Influenza Vaccines Market by Region, 2023, 2028 & 2033 (US$ Million)
Figure 84 MEA Influenza Vaccines Market Forecast by Country, 2023-2033 (US$ Million, AGR %)
Figure 85 MEA Influenza Vaccines Market Share Forecast by Country, 2023 & 2033 (%)
Figure 86 MEA Influenza Vaccines Market Forecast by Vaccine Type, 2023-2033 (US$ Million, AGR %)
Figure 87 MEA Influenza Vaccines Market Share Forecast by Vaccine Type, 2023 & 2033 (%)
Figure 88 MEA Influenza Vaccines Market Forecast by End-users, 2023-2033 (US$ Million, AGR %)
Figure 89 MEA Influenza Vaccines Market Share Forecast by End-users, 2023 & 2033 (%)
Figure 90 GCC Influenza Vaccines Market Forecast, 2023-2033 (US$ Million, AGR %)
Figure 91 South Africa Influenza Vaccines Market Forecast, 2023-2033 (US$ Million, AGR %)
Figure 92 Rest of MEA Influenza Vaccines Market Forecast, 2023-2033 (US$ Million, AGR %)
Figure 93 CSL: Net Revenue, 2015-2022 (US$ Million, AGR %)
Figure 94 CSL: R&D, 2015-2022 (US$ Million, AGR %)
Figure 95 CSL: Regional Market Shares, 2022
Figure 96 Emergent BioSolutions Inc.: Net Revenue, 2015-2022 (US$ Million, AGR %)
Figure 97 Emergent BioSolutions Inc.: R&D, 2015-2022 (US$ Million, AGR %)
Figure 98 GSK plc: Net Revenue, 2015-2022 (US$ Million, AGR %)
Figure 99 GSK plc: R&D, 2015-2022 (US$ Million, AGR %)
Figure 100 GSK plc: Regional Market Shares, 2022
Figure 101 Pfizer Inc.: Net Revenue, 2015-2022 (US$ Million, AGR %)
Figure 102 Pfizer Inc.: R&D, 2015-2022 (US$ Million, AGR %)
Figure 103 Sanofi: Net Revenue, 2015-2022 (US$ Million, AGR %)
Figure 104 Sanofi: R&D, 2015-2022 (US$ Million, AGR %)
Figure 105 Sanofi: Regional Market Shares, 2022
Figure 106 AstraZeneca: Net Revenue, 2015-2022 (US$ Million, AGR %)
Figure 107 AstraZeneca: R&D, 2015-2022 (US$ Million, AGR %)
Figure 108 AstraZeneca: Regional Market Shares, 2022
Figure 109 SINOVAC: Net Revenue, 2015-2022 (US$ Million, AGR %)
Figure 110 SINOVAC: R&D, 2015-2022 (US$ Million, AGR %)
Figure 111 Viatris Inc. (Mylan): Net Revenue, 2015-2022 (US$ million, AGR%)
Figure 112 Viatris Inc. (Mylan): Regional Market Shares (%), 2022
Figure 113 Viatris Inc. (Mylan): R&D, 2015-2022 (US$ million, AGR%)
Figure 114 Abbott Laboratories: Net Revenue, 2015-2022 (US$ million, AGR%)
Figure 115 Abbott Laboratories: Regional Market Shares (%), 2022
Figure 116 Abbott Laboratories: R&D, 2015-2022 (US$ million, AGR%)
ページTOPに戻る
よくあるご質問
Visiongain社はどのような調査会社ですか?
英国の調査会社ヴィジョンゲイン社(Visiongain)は、通信とエネルギーのほか、自動車や化学・医薬品、金属など、広範な市場を対象に調査を行っています。自動車市場については、市場全般に関する調査のほ... もっと見る
調査レポートの納品までの日数はどの程度ですか?
在庫のあるものは速納となりますが、平均的には 3-4日と見て下さい。
但し、一部の調査レポートでは、発注を受けた段階で内容更新をして納品をする場合もあります。
発注をする前のお問合せをお願いします。
注文の手続きはどのようになっていますか?
1)お客様からの御問い合わせをいただきます。
2)見積書やサンプルの提示をいたします。
3)お客様指定、もしくは弊社の発注書をメール添付にて発送してください。
4)データリソース社からレポート発行元の調査会社へ納品手配します。
5) 調査会社からお客様へ納品されます。最近は、pdfにてのメール納品が大半です。
お支払方法の方法はどのようになっていますか?
納品と同時にデータリソース社よりお客様へ請求書(必要に応じて納品書も)を発送いたします。
お客様よりデータリソース社へ(通常は円払い)の御振り込みをお願いします。
請求書は、納品日の日付で発行しますので、翌月最終営業日までの当社指定口座への振込みをお願いします。振込み手数料は御社負担にてお願いします。
お客様の御支払い条件が60日以上の場合は御相談ください。
尚、初めてのお取引先や個人の場合、前払いをお願いすることもあります。ご了承のほど、お願いします。
データリソース社はどのような会社ですか?
当社は、世界各国の主要調査会社・レポート出版社と提携し、世界各国の市場調査レポートや技術動向レポートなどを日本国内の企業・公官庁及び教育研究機関に提供しております。
世界各国の「市場・技術・法規制などの」実情を調査・収集される時には、データリソース社にご相談ください。
お客様の御要望にあったデータや情報を抽出する為のレポート紹介や調査のアドバイスも致します。
|
|


