バイオ燃料産業市場レポート:2024-2034
Biofuel Industry Market Report 2024-2034
レポート詳細
バイオ燃料産業市場レポート 2024-2034 :この調査レポートは、業界とその基礎となる原動力をより良く理解することを望むなら、新たな収益ポケットを目指す大手企業にとって貴重なもの... もっと見る
※上記価格は部署ライセンス(Departmental licence)価格です。
その他の価格についてはデータリソースまでお問合せください。
日本語のページは自動翻訳を利用し作成しています。
実際のレポートは英文のみでご納品いたします。

|

|
サマリー
レポート詳細
バイオ燃料産業市場レポート 2024-2034:この調査レポートは、業界とその基礎となる原動力をより良く理解することを望むなら、新たな収益ポケットを目指す大手企業にとって貴重なものとなるでしょう。異業種への進出や新規地域での既存事業の拡大を目指す企業にも有用です。
持続可能なエネルギー源に対する需要の高まり
持続可能なエネルギー源に対する需要の高まりは、バイオ燃料産業の成長を大きく後押ししている。世界の人口は増加の一途をたどり、気候変動の影響が顕在化しているため、従来の化石燃料から再生可能エネルギーへの転換が急務となっている。バイオ燃料は、いくつかの利点をもたらすことから、従来の化石燃料に代わる最も有望な燃料のひとつと考えられている。
バイオ燃料の主な利点の一つは、温室効果ガスの排出削減である。バイオ燃料は、作物や植物廃棄物などの再生可能な資源から作られ、成長する過程で二酸化炭素を吸収する。その結果、バイオ燃料の使用は、温室効果ガスの排出を削減し、気候変動の影響を緩和するのに役立つ。気候変動に対する懸念が高まり、世界的な目標を達成するために温室効果ガス排出量を削減する必要があることを考えると、これは特に重要なことである。
適切なインフラの欠如が産業の成長を制限する可能性
バイオ燃料産業にとって、インフラの制約は大きな課題の一つである。バイオ燃料の生産には専門的な機器や設備が必要であり、これらの設備はすべての地域で広く利用できるとは限らない。このようなインフラの不足は、バイオ燃料の生産と流通を制限し、業界の成長を妨げる。
バイオ燃料産業における主なインフラ制約の一つは、バイオ燃料精製所と貯蔵施設の不足であ る。大量に精製・貯蔵できる化石燃料とは異なり、バイオ燃料は小規模に生産されることが多く、その貯蔵や輸送には特殊なインフラが必要となる場合がある。このため、バイオ燃料生産者にとってはコスト高となり、地域によってはバイオ燃料の入手が制限される可能性がある。
市場調査レポートを購入する前にすべき質問とは?
-
バイオ燃料市場はどのように進化しているのか?
-
バイオ燃料市場の推進要因と阻害要因は何か?
-
バイオ燃料の各サブマーケットは予測期間中にどのように成長し、2034年にはどれくらいの売上を占めるようになるのか?
-
2023年から2034年にかけて、各バイオ燃料サブマーケットの市場シェアはどのように推移するのか?
-
2024年から2034年にかけて、市場全体を牽引する主な要因は何か?
-
主要なバイオ燃料市場はマクロ経済の動きに幅広く追随するのか、それとも個々の国の市場が他国を上回るのか。
-
2034年までに各国市場のシェアはどのように変化し、どの地域が2034年の市場をリードするのか。
-
主要プレーヤーと予測期間中の見通しは?
-
これらの大手企業のバイオ燃料プロジェクトとは?
-
2024年から2034年の間に、業界はどのように発展していくのか?現在、そして今後10年間に行われるバイオ燃料プロジェクトにはどのような影響があるのか?
-
バイオ燃料市場をさらに拡大するためには、製品の商業化がより必要なのだろうか?
-
バイオ燃料市場はどこに向かっているのか、また、どのようにすれば市場の最前線に立てるのか?
このことが、現在、そして今後10年間のバイオ燃料市場にどのような影響を与えるかを見極める必要がある:
-
331ページに及ぶレポートには、101の表と178の図表が掲載されている。
-
本レポートでは、業界における主要な有利分野を取り上げているため、今すぐターゲットを絞ることができる。
-
世界、地域、国の売上高と成長に関する詳細な分析が含まれている。
-
競合他社が成功した主なトレンド、変化、収益予測をハイライトします。
本レポートは、バイオ燃料市場が今後10年間にどのように発展していくのか、またCOVID-19の景気後退と好転の変動に合わせてどのように発展していくのかを今でお伝えするものである。この市場は、過去10年間のどの時点よりも今が重要である。
2034年までの予測やその他の分析から、商業的な展望が明らかになる
-
2034年までの収益予測に加え、最近の実績、成長率、市場シェアも提供している。
-
ビジネスの展望や展開など、独自の分析が掲載されている。
-
定性的分析(市場ダイナミクス、促進要因、機会、阻害要因、課題を含む)、ポーターズファイブフォース分析、PEST分析、最近の動向をご覧いただけます。
レポート対象セグメント(市場規模:売上高)
タイプの展望
最終用途の展望
世代の展望
-
第一世代バイオ燃料
-
第二世代バイオ燃料
-
第三世代バイオ燃料
-
第四世代バイオ燃料
-
第五世代バイオ燃料
ソースの展望
-
トウモロコシ
-
植物油
-
サトウダイコン
-
小麦
-
サトウキビ
-
その他の情報源
世界市場全体と各分野の収益予測に加え、5つの地域と15の主要国市場の収益予測も掲載している:
北米
欧州
-
ドイツ
-
英国
-
フランス
-
イタリア
-
スペイン
-
その他の欧州
アジア太平洋
-
中国
-
インド
-
インドネシア
-
韓国
-
オーストラリア
-
その他のアジア太平洋
ラテンアメリカ
中東・アフリカ
また、2024年から2034年までのバイオ燃料市場における主要企業のプロファイルも掲載している。
報告書に掲載されている主要企業
-
Abengoa
-
ADM
-
Air Liquide
-
Alto Ingredients, Inc. (Pacific Ethanol)
-
Bunge Limited
-
Butamax Advanced Biofuels
-
Cargill
-
Chevron Renewable Energy Group
-
Cosan S.A.
-
Crop Energies AG
-
FutureFuel Corporation
-
Gevo, Inc.
-
Green Plains
-
Neste
-
Petrobras
-
POET
-
Royal Dutch Shell PLC
-
Valero Marketing and Supply Company
-
Verbio SE
-
Wilmar International Limited
2024年から2034年までのバイオ燃料市場全体の売上高(金額ベース)は、2023年に1200億米ドルを突破した。2033年まで収益は力強く成長すると予測している。当研究所では、最も大きな可能性を秘めた組織を特定しています。各組織の能力、進捗状況、商業的展望を把握し、常に一歩先を行くための一助としてください。
2024年から2034年までのバイオ燃料市場」市場レポートはどのようにお役に立ちますか?
要約すると、330ページを超えるこのレポートは、以下のような知識を提供する:
-
バイオ燃料市場、2024年から2034年までの収益と数量予測 世代、供給源、最終用途、タイプ、世界および地域レベルの各予測を掲載 - 業界の展望を発見し、投資と収益に最も有利な場所を見つけます。
-
5つの地域と15の主要国市場の2034年までの収益と数量予測 - 北米、欧州、アジア太平洋、中南米、中東・アフリカのバイオ燃料市場の2024年から2034年までの予測をご覧ください。また、米国、カナダ、ブラジル、スペイン、ドイツ、英国、中国、インド、インドネシア、南アフリカなどの主要国の市場規模推定と予測も掲載しています。
-
バイオ燃料市場に関わる主要企業20社の企業プロファイルを含む、既存企業および市場参入を目指す企業の展望。
独自の予測による定量的・定性的分析をご覧ください。私たちのレポートだけに含まれる情報を入手し、貴重なビジネスインテリジェンスで情報を得ることができます。
他にはない情報
私たちの新しいレポートがあれば、知識に遅れをとったり、チャンスを逃したりする可能性が低くなります。弊社のレポートが貴社の調査、分析、意思決定にどのように役立つかをご覧ください。Visiongainの調査は、バイオ燃料市場、2024年から2034年、市場をリードする企業の商業分析を必要とするすべての人のためのものです。データ、トレンド、予測をご覧いただけます。
ページTOPに戻る
目次
1 レポート概要
1.1 研究の目的
1.2 バイオ燃料産業市場の紹介
1.3 本レポートの内容
1.4 本レポートを読むべき理由
1.5 本分析レポートが回答する主な質問
1.6 本レポートは誰のためのものか?
1.7 方法論
1.7.1 市場の定義
1.7.2 市場評価・予測手法
1.7.3 データの検証
1.7.3.1 一次調査
1.7.3.2 セカンダリーリサーチ
1.8 よくある質問(FAQ)
1.9 Visiongainの関連レポート
1.10 Visiongainについて
2 エグゼクティブ・サマリー
3 市場概要
3.1 主要な調査結果
3.2 市場ダイナミクス
3.2.1 市場促進要因
3.2.1.1 バイオ燃料生産インフラの強化
3.2.1.2 電気自動車産業の台頭が市場を牽引
3.2.1.3 化石燃料価格の変動が市場を刺激する
3.2.2 市場抑制要因
3.2.2.1 十分なインフラの欠如が産業の成長を制限する可能性
3.2.2.2 土地利用の対立は引き続き業界の主要課題
3.2.3 市場機会
3.2.3.1 バイオ燃料産業におけるパートナーシップとコラボレーションの拡大
3.2.3.2 持続可能なエネルギー源に対する需要の高まり
3.2.3.3 市場に新たな道を開くバイオ燃料に関する国家政策
3.3 COVID-19の影響分析
3.4 ポーターのファイブフォース分析
3.4.1 サプライヤーの交渉力(中程度か高いか)
3.4.2 買い手の交渉力(中程度)
3.4.3 競争上のライバル(高)
3.4.4 代替品による脅威(低い)
3.4.5 新規参入企業の脅威(低)
3.5 PEST分析
3.5.1 政治的要因
3.5.2 経済的要因
3.5.3 社会的要因
3.5.4 技術的要因
4 バイオ燃料産業市場分析:タイプ別
4.1 主要な調査結果
4.2 タイプ別セグメント 市場魅力度指数
4.3 バイオ燃料産業のタイプ別市場規模推定と予測
4.4 バイオディーゼル
4.4.1 REGはブランド燃料製品ラインを立ち上げた
4.4.2 Be8 BeVantが新製品ラインを立ち上げた
4.4.3 2024-2034年の地域別市場規模(US$ Billion)
4.4.4 地域別市場シェア、2024年・2034年(%)
4.5 エタノール
4.5.1 住友商事、木質バイオマスからのバイオエタノール製造事業化に向けた戦略的パートナーシップを締結
4.5.2 Verbio社がインディアナ州サウスベンドのエタノール工場を買収
4.5.3 2024〜2034年の地域別市場規模(US$ Billion)
4.5.4 地域別市場シェア、2024年・2034年(%)
4.6 その他
4.6.1 BP、アーキア買収後初の米国バイオガスプラントを稼働
4.6.2 2024〜2034年の地域別市場規模(US$ Billion)
4.6.3 地域別市場シェア、2024年・2034年(%)
5 バイオ燃料産業市場分析:用途別
5.1 主要調査結果
5.2 最終用途セグメント 市場魅力度指数
5.3 バイオ燃料産業の用途別市場規模推定と予測
5.4 輸送
5.4.1 日本郵船、大王製紙向け木材チップ輸送船でバイオ燃料試験に成功
5.4.2 Scaniaがコートジボワールでバイオディーゼルの試験運用を開始
5.4.3 2024〜2034年の地域別市場規模(US$ Billion)
5.4.4 地域別市場シェア、2024年・2034年(%)
5.5 発電
5.5.1 エネルギー安全保障への懸念がバイオ燃料の成長を牽引
5.5.2 2024〜2034年の地域別市場規模(US$ Billion)
5.5.3 地域別市場シェア、2024年・2034年(%)
5.6 建物の暖房
5.6.1 HVOバイオ燃料暖房トライアルが英国の150棟に拡大
5.6.2 2024〜2034年の地域別市場規模(US$ Billion)
5.6.3 地域別市場シェア、2024年・2034年(%)
5.7 その他の最終用途
5.7.1 2024〜2034年の地域別市場規模(US$ Billion)
5.7.2 地域別市場シェア、2024年・2034年(%)
6 バイオ燃料産業市場分析:世代別
6.1 主要調査結果
6.2 世代別セグメント 市場魅力度指数
6.3 バイオ燃料産業の世代別市場規模推定と予測
6.4 第一世代バイオ燃料
6.4.1 2024〜2034年の地域別市場規模(US$ Billion)
6.4.2 地域別市場シェア、2024年・2034年(%)
6.5 第二世代バイオ燃料
6.5.1 2024〜2034年の地域別市場規模(US$ Billion)
6.5.2 地域別市場シェア、2024年・2034年(%)
6.6 第三世代バイオ燃料
6.6.1 2024〜2034年の地域別市場規模(US$ Billion)
6.6.2 地域別市場シェア、2024年・2034年(%)
6.7 第4世代バイオ燃料
6.7.1 2024〜2034年の地域別市場規模(US$ Billion)
6.7.2 地域別市場シェア、2024年・2034年(%)
6.8 第5世代バイオ燃料
6.8.1 2024〜2034年の地域別市場規模(US$ Billion)
6.8.2 地域別市場シェア、2024年・2034年(%)
7 バイオ燃料産業市場分析:供給源別
7.1 主要調査結果
7.2 供給源セグメント 市場魅力度指数
7.3 バイオ燃料産業の供給源別市場規模推定と予測
7.4 トウモロコシ
7.4.1 エネルギー安全保障のため、インド政府はトウモロコシに注目
7.4.2 2024〜2034年の地域別市場規模(US$ Billion)
7.4.3 地域別市場シェア、2024年・2034年(%)
7.5 植物油
7.5.1 RUDNのエンジニアが植物油でディーゼルエンジンを動かす
7.5.2 2024年~2034年の地域別市場規模(US$ Billion)
7.5.3 地域別市場シェア、2024年・2034年(%)
7.6 テンサイ
7.6.1 バイオ燃料会社が地元テンサイ生産者に新たな希望をもたらす
7.6.2 2024〜2034年の地域別市場規模(US$ Billion)
7.6.3 地域別市場シェア、2024年・2034年(%)
7.7 小麦
7.7.1 作物拡大に伴いBSBios社がブラジル初の大型小麦エタノールプラントを建設へ
7.7.2 2024~2034年の地域別市場規模(US$ Billion)
7.7.3 地域別市場シェア、2024年・2034年(%)
7.8 サトウキビ
7.8.1 サトウキビとキャッサバからバイオエタノールを生産するインドネシア
7.8.2 2024年~2034年の地域別市場規模(US$ Billion)
7.8.3 地域別市場シェア、2024年・2034年(%)
7.9 その他の供給源
7.9.1 2024〜2034年の地域別市場規模(US$ Billion)
7.9.2 地域別市場シェア、2024年・2034年(%)
8 バイオ燃料産業市場分析:地域別
8.1 主要な調査結果
8.2 地域別市場規模の推定と予測
9 北米のバイオ燃料産業市場分析
9.1 主要な調査結果
9.2 北米のバイオ燃料産業市場魅力度指数
9.3 北米のバイオ燃料産業国別市場2024年、2029年、2034年(US$ Billion)
9.4 北米のバイオ燃料産業市場規模推定と予測:国別
9.5 北米のバイオ燃料産業市場規模推定と予測:タイプ別
9.6 北米のバイオ燃料産業市場規模推定と予測:用途別
9.7 北米のバイオ燃料産業市場規模推定と予測:世代別
9.8 北米のバイオ燃料産業市場規模推定と予測:供給源別
9.9 米国のバイオ燃料産業市場分析
9.9.1 EPAとDOEは、先進バイオ燃料の開発を促進するために940万ドルを拠出すると発表した
9.9.2 米国は今後3年間でバイオ燃料規制を強化する予定
9.10 カナダのバイオ燃料産業市場分析
9.10.1 先進バイオ燃料カナダ(ABFC)が財政勧告を発表
9.10.2 カルガリーのシエロ社がエクスパンダー・エナジー社のバイオ燃料技術資産を買収
10 欧州のバイオ燃料産業市場分析
10.1 主要な調査結果
10.2 欧州のバイオ燃料産業市場魅力度指数
10.3 欧州のバイオ燃料産業国別市場:2024年、2029年、2034年(US$ Billion)
10.4 欧州のバイオ燃料産業市場規模推定と予測:国別
10.5 欧州のバイオ燃料産業市場規模推定と予測:タイプ別
10.6 欧州のバイオ燃料産業市場規模推定と予測:用途別
10.7 欧州のバイオ燃料産業市場規模推定と予測:世代別
10.8 欧州のバイオ燃料産業市場規模推定と予測:供給源別
10.9 ドイツのバイオ燃料産業市場分析
10.9.1 ドイツ環境相、農業におけるバイオ燃料利用に前向きな姿勢を示す
10.9.2 ドイツ初のCO2マイナス・バイオ燃料が誕生
10.10 英国のバイオ燃料産業市場分析
10.10.1 トラフィグラによるグリーンエネルギー社の買収
10.10.2 BPが英国のGreen Biofuels Ltdを買収
10.11 フランスのバイオ燃料産業市場分析
10.11.1 フランス、クリーン航空に年間3億ユーロを投資
10.11.2 CEVA Logistics、フランスのトラック14台をHVOバイオ燃料に転換
10.12 イタリアのバイオ燃料産業市場分析
10.12.1 エニ社、イタリアに第3のバイオリファイナリー建設へ
10.12.2 スマ・キャピタルがイタリアのバイオガス会社CH4Tを買収
10.13 スペインのバイオ燃料産業市場分析
10.13.1 スペインのセプサとアピカルがバイオ燃料工場の建設に着手
10.13.2 レプソル、スペイン初の先進バイオ燃料プラントの建設を開始
10.14 その他の欧州のバイオ燃料産業市場分析
11 アジア太平洋地域のバイオ燃料産業市場分析
11.1 主要な調査結果
11.2 アジア太平洋地域のバイオ燃料産業市場魅力度指数
11.3 アジア太平洋地域のバイオ燃料産業国別市場、2024年、2029年、2034年(US$ Billion)
11.4 アジア太平洋地域のバイオ燃料産業市場規模推定と予測:国別
11.5 アジア太平洋地域のバイオ燃料産業市場規模推定と予測:タイプ別
11.6 アジア太平洋地域のバイオ燃料産業市場規模推定と予測:用途別
11.7 アジア太平洋地域のバイオ燃料産業市場規模推定と予測:世代別
11.8 アジア太平洋地域のバイオ燃料産業市場規模推定と予測:供給源別
11.9 中国のバイオ燃料産業市場分析
11.9.1 バイオディーゼル実証プロジェクトを加速する中国
11.9.2 2023年にバイオベース・ディーゼルの輸出が増加
11.10 インドのバイオ燃料産業市場分析
11.10.1 インドのバイオ燃料消費量は3倍になる可能性がある
11.10.2 Aemetis社がインドのバイオディーゼル工場の拡張を完了
11.11 インドネシアのバイオ燃料産業市場分析
11.11.1 インドネシアのパームコ社がバイオディーゼル工場への投資を決定
11.11.2 インドネシアはパーム油ベースのバイオディーゼルの高配合を開始した
11.12 韓国のバイオ燃料産業市場分析
11.12.1 韓国のHVO新工場
11.12.2 韓国、バイオ燃料促進のための法律を更新
11.13 オーストラリアのバイオ燃料産業市場分析
11.13.1 BPが製油所をバイオ燃料工場に転換する認可を取得
11.14 その他のアジア太平洋地域のバイオ燃料産業市場分析
11.14.1 日本の日本郵船が外航海運のバイオ燃料をリード
12 ラテンアメリカのバイオ燃料産業市場分析
12.1 主要な調査結果
12.2 ラテンアメリカのバイオ燃料産業市場魅力度指数
12.3 ラテンアメリカのバイオ燃料産業国別市場:2024年、2029年、2034年(US$ Billion)
12.4 ラテンアメリカのバイオ燃料産業市場規模推定と予測:国別
12.5 ラテンアメリカのバイオ燃料産業市場規模推定と予測:タイプ別
12.6 ラテンアメリカのバイオ燃料産業市場規模推定と予測:用途別
12.7 ラテンアメリカのバイオ燃料産業市場規模推定と予測:世代別
12.8 ラテンアメリカのバイオ燃料産業市場規模推定と予測:供給源別
12.9 ブラジルのバイオ燃料産業市場分析
12.9.1 アセレン社がバイオ燃料に24億ドルを投資
12.10 アルゼンチンのバイオ燃料産業市場分析
12.10.1 アルゼンチンのバイオ燃料消費量
12.11 その他のラテンアメリカのバイオ燃料産業市場分析
13 中東・アフリカのバイオ燃料産業市場分析
13.1 主要な調査結果
13.2 中東・アフリカのバイオ燃料産業市場魅力度指数
13.3 中東・アフリカのバイオ燃料産業国別市場:2024年、2029年、2034年(US$ Billion)
13.4 中東・アフリカのバイオ燃料産業市場規模推定と予測:国別
13.5 中東・アフリカのバイオ燃料産業市場規模推定と予測:タイプ別
13.6 中東・アフリカのバイオ燃料産業市場規模推定と予測:用途別
13.7 中東・アフリカのバイオ燃料産業市場規模推定と予測:世代別
13.8 中東・アフリカのバイオ燃料産業市場規模推定と予測:供給源別
13.9 GCCのバイオ燃料産業市場分析
13.9.1 サウジアラビアがクリーンディーゼルとガソリン燃料を導入
13.9.2 ビトール、UAEでバイオ燃料の初配送を完了
13.10 南アフリカのバイオ燃料産業市場分析
13.11 その他の中東・アフリカ地域のバイオ燃料産業市場分析
14 主要企業のプロファイル
14.1 Green Plains
14.1.1 会社概要
14.1.2 会社概要
14.1.3 財務分析
14.1.3.1 純収入、2018-2022年
14.1.3.2 セグメント市場シェア、2022年
14.1.4 製品ベンチマーク
14.1.5 戦略的展望
14.2 Petrobras
14.2.1 会社概要
14.2.2 会社概要
14.2.3 財務分析
14.2.3.1 純収入、2018年~2022年
14.2.3.2 セグメント市場シェア、2022年
14.2.4 製品ベンチマーク
14.2.5 戦略的展望
14.3 Valero Marketing and Supply Company
14.3.1 会社概要
14.3.2 会社概要
14.3.3 財務分析
14.3.3.1 純収入、2018年~2022年
14.3.3.2 地域市場シェア、2022年
14.3.3.3 セグメント市場シェア、2022年
14.3.4 製品ベンチマーク
14.4 Alto Ingredients, Inc. (Pacific Ethanol, Inc.)
14.4.1 会社概要
14.4.2 会社概要
14.4.3 製品ベンチマーク
14.5 Butamax Advanced Biofuels, LLC
14.5.1 会社概要
14.5.2 会社概要
14.5.3 製品ベンチマーク
14.6 Gevo, Inc.
14.6.1 企業スナップショット
14.6.2 会社概要
14.6.3 財務分析
14.6.3.1 純収入、2018年〜2022年
14.6.3.2 セグメント市場シェア、2022年
14.6.4 製品ベンチマーク
14.6.5 戦略的展望
14.7 Wilmar International Limited
14.7.1 会社概要
14.7.2 会社概要
14.7.3 財務分析
14.7.3.1 純収入、2018-2022年
14.7.3.2 地域市場シェア、2022年
14.7.3.3 セグメント市場シェア、2022年
14.7.4 製品ベンチマーク
14.7.5 戦略的展望
14.8 Chevron Renewable Energy Group
14.8.1 会社概要
14.8.2 会社概要
14.8.3 製品ベンチマーク
14.8.4 戦略的展望
14.9 Bunge Limited
14.9.1 会社概要
14.9.2 会社概要
14.9.3 財務分析
14.9.3.1 純収入、2018年~2023年
14.9.3.2 セグメント市場シェア、2022年
14.9.4 製品ベンチマーク
14.9.5 戦略的展望
14.10 Royal Dutch Shell PLC
14.10.1 会社概要
14.10.2 会社概要
14.10.3 財務分析
14.10.3.1 純収入、2018年~2023年
14.10.3.2 セグメント市場シェア、2022年
14.10.4 製品ベンチマーク
14.10.5 戦略的展望
14.11 Crop Energies AG
14.11.1 会社概要
14.11.2 会社概要
14.11.3 財務分析
14.11.3.1 純収入、2018-2022年
14.11.3.2 セグメント市場シェア、2022年
14.11.4 製品ベンチマーク
14.11.5 戦略的展望
14.12 Air Liquide
14.12.1 会社概要
14.12.2 会社概要
14.12.3 財務分析
14.12.3.1 純収入、2018年〜2022年
14.12.3.2 地域市場シェア、2022年
14.12.3.3 セグメント市場シェア、2022年
14.12.4 製品ベンチマーク
14.12.5 戦略的展望
14.13 Abengoa, S.A.
14.13.1 会社概要
14.13.2 会社概要
14.13.3 製品ベンチマーク
14.14 Cosan S.A.
14.14.1 会社概要
14.14.2 会社概要
14.14.3 製品ベンチマーク
14.14.4 戦略的展望
14.15 FutureFuel Corporation
14.15.1 会社概要
14.15.2 会社概要
14.15.3 財務分析
14.15.3.1 純収入、2018年~2022年
14.15.3.2 セグメント市場シェア、2022年
14.15.4 製品ベンチマーク
14.16 ADM
14.16.1 会社概要
14.16.2 会社概要
14.16.3 財務分析
14.16.3.1 純収入、2018年~2022年
14.16.3.2 セグメント市場シェア、2022年
14.16.4 製品ベンチマーク
14.16.5 戦略的展望
14.17 Neste
14.17.1 会社概要
14.17.2 会社概要
14.17.3 財務分析
14.17.3.1 純収入、2018年~2022年
14.17.3.2 地域市場シェア、2022年
14.17.3.3 セグメント市場シェア、2022年
14.17.4 製品ベンチマーク
14.17.5 戦略的展望
14.18 POET
14.18.1 会社概要
14.18.2 会社概要
14.18.3 製品ベンチマーク
14.18.4 戦略的展望
14.19 Cargill
14.19.1 会社概要
14.19.2 会社概要
14.19.3 製品ベンチマーク
14.19.4 戦略的展望
14.20 Verbio SE
14.20.1 会社概要
14.20.2 会社概要
14.20.3 財務分析
14.20.3.1 純収入、2018年~2022年
14.20.3.2 セグメント市場シェア、2022年
14.20.4 製品ベンチマーク
14.20.5 戦略的展望
15 結論と提言
15.1 Visiongainからの結びの言葉
15.2 推奨事項
ページTOPに戻る
図表リスト
表の一覧
Table 1 Biofuel Industry Market Snapshot, 2024 & 2034 (US$ Billion, CAGR %)
Table 2 Biofuel Industry Market Forecast by Region, 2024-2034 (US$ Billion, AGR%, CAGR%): “V” Shaped Recovery
Table 3 Biofuel Industry Market Forecast by Region, 2024-2034 (US$ Billion, AGR%, CAGR%): “U” Shaped Recovery
Table 4 Biofuel Industry Market Forecast by Region, 2024-2034 (US$ Billion, AGR%, CAGR%): “W” Shaped Recovery
Table 5 Biofuel Industry Market Forecast by Region, 2024-2034 (US$ Billion, AGR%, CAGR%): “L” Shaped Recovery
Table 6 Biofuel Industry Market Forecast by Type, 2024-2034 (US$ Billion, AGR%, CAGR%)
Table 7 Biodiesel Segment Market Forecast by Region, 2024-2034 (US$ Billion, AGR%, CAGR%)
Table 8 Ethanol Segment Market Forecast by Region, 2024-2034 (US$ Billion, AGR%, CAGR%)
Table 9 Others Segment Market Forecast by Region, 2024-2034 (US$ Billion, AGR%, CAGR%)
Table 10 Biofuel Industry Market Forecast by End-use, 2024-2034 (US$ Billion, AGR%, CAGR%)
Table 11 Transportation Segment Market Forecast by Region, 2024-2034 (US$ Billion, AGR%, CAGR%)
Table 12 Electricity Generation Segment Market Forecast by Region, 2024-2034 (US$ Billion, AGR%, CAGR%)
Table 13 Heating Buildings Segment Market Forecast by Region, 2024-2034 (US$ Billion, AGR%, CAGR%)
Table 14 Other End-uses Segment Market Forecast by Region, 2024-2034 (US$ Billion, AGR%, CAGR%)
Table 15 Biofuel Industry Market Forecast by Generation, 2024-2034 (US$ Billion, AGR%, CAGR%)
Table 16 First-generation Biofuels Segment Market Forecast by Region, 2024-2034 (US$ Billion, AGR%, CAGR%)
Table 17 Second-generation Biofuels Segment Market Forecast by Region, 2024-2034 (US$ Billion, AGR%, CAGR%)
Table 18 Third-generation Biofuels Segment Market Forecast by Region, 2024-2034 (US$ Billion, AGR%, CAGR%)
Table 19 Fourth-generation Biofuels Segment Market Forecast by Region, 2024-2034 (US$ Billion, AGR%, CAGR%)
Table 20 Fifth-generation Biofuels Segment Market Forecast by Region, 2024-2034 (US$ Billion, AGR%, CAGR%)
Table 21 Biofuel Industry Market Forecast by Source, 2024-2034 (US$ Billion, AGR%, CAGR%)
Table 22 Maize Segment Market Forecast by Region, 2024-2034 (US$ Billion, AGR%, CAGR%)
Table 23 Vegetable oils Segment Market Forecast by Region, 2024-2034 (US$ Billion, AGR%, CAGR%)
Table 24 Sugar beet Segment Market Forecast by Region, 2024-2034 (US$ Billion, AGR%, CAGR%)
Table 25 Wheat Segment Market Forecast by Region, 2024-2034 (US$ Billion, AGR%, CAGR%)
Table 26 Sugar Cane Segment Market Forecast by Region, 2024-2034 (US$ Billion, AGR%, CAGR%)
Table 27 Other Sources Segment Market Forecast by Region, 2024-2034 (US$ Billion, AGR%, CAGR%)
Table 28 Biofuel Industry Market Forecast by Region, 2024-2034 (US$ Billion, AGR%, CAGR%)
Table 29 North America Biofuel Industry Market Forecast by Country, 2024-2034 (US$ Billion, AGR%, CAGR%)
Table 30 North America Biofuel Industry Market Forecast by Type, 2024-2034 (US$ Billion, AGR%, CAGR%)
Table 31 North America Biofuel Industry Market Forecast by End-use, 2024-2034 (US$ Billion, AGR%, CAGR%)
Table 32 North America Biofuel Industry Market Forecast by Generation, 2024-2034 (US$ Billion, AGR%, CAGR%)
Table 33 North America Biofuel Industry Market Forecast by Source, 2024-2034 (US$ Billion, AGR%, CAGR%)
Table 34 U.S. Biofuel Industry Market Forecast, 2024-2034 (US$ Billion, AGR%, CAGR%)
Table 35 Canada Biofuel Industry Market Forecast, 2024-2034 (US$ Billion, AGR%, CAGR%)
Table 36 Europe Biofuel Industry Market Forecast by Country, 2024-2034 (US$ Billion, AGR%, CAGR%)
Table 37 Europe Biofuel Industry Market Forecast by Type, 2024-2034 (US$ Billion, AGR%, CAGR%)
Table 38 Europe Biofuel Industry Market Forecast by End-use, 2024-2034 (US$ Billion, AGR%, CAGR%)
Table 39 Europe Biofuel Industry Market Forecast by Generation, 2024-2034 (US$ Billion, AGR%, CAGR%)
Table 40 Europe Biofuel Industry Market Forecast by Source, 2024-2034 (US$ Billion, AGR%, CAGR%)
Table 41 Germany Biofuel Industry Market Forecast, 2024-2034 (US$ Billion, AGR%, CAGR%)
Table 42 UK Biofuel Industry Market Forecast, 2024-2034 (US$ Billion, AGR%, CAGR%)
Table 43 France Biofuel Industry Market Forecast, 2024-2034 (US$ Billion, AGR%, CAGR%)
Table 44 Italy Biofuel Industry Market Forecast, 2024-2034 (US$ Billion, AGR%, CAGR%)
Table 45 Spain Biofuel Industry Market Forecast, 2024-2034 (US$ Billion, AGR%, CAGR%)
Table 46 Rest of the Europe Biofuel Industry Market Forecast, 2024-2034 (US$ Billion, AGR%, CAGR%)
Table 47 Asia Pacific Biofuel Industry Market Forecast by Country, 2024-2034 (US$ Billion, AGR%, CAGR%)
Table 48 Asia Pacific Biofuel Industry Market Forecast by Type, 2024-2034 (US$ Billion, AGR%, CAGR%)
Table 49 Asia Pacific Biofuel Industry Market Forecast by End-use, 2024-2034 (US$ Billion, AGR%, CAGR%)
Table 50 Asia Pacific Biofuel Industry Market Forecast by Generation, 2024-2034 (US$ Billion, AGR%, CAGR%)
Table 51 Asia Pacific Biofuel Industry Market Forecast by Source, 2024-2034 (US$ Billion, AGR%, CAGR%)
Table 52 China Biofuel Industry Market Forecast, 2024-2034 (US$ Billion, AGR%, CAGR%)
Table 53 India Biofuel Industry Market Forecast, 2024-2034 (US$ Billion, AGR%, CAGR%)
Table 54 Japan Biofuel Industry Market Forecast, 2024-2034 (US$ Billion, AGR%, CAGR%)
Table 55 South Korea Biofuel Industry Market Forecast, 2024-2034 (US$ Billion, AGR%, CAGR%)
Table 56 Australia Biofuel Industry Market Forecast, 2024-2034 (US$ Billion, AGR%, CAGR%)
Table 57 Rest of Asia Pacific Biofuel Industry Market Forecast, 2024-2034 (US$ Billion, AGR%, CAGR%)
Table 58 Latin America Biofuel Industry Market Forecast by Country, 2024-2034 (US$ Billion, AGR%, CAGR%)
Table 59 Latin America Biofuel Industry Market Forecast by Type, 2024-2034 (US$ Billion, AGR%, CAGR%)
Table 60 Latin America Biofuel Industry Market Forecast by End-use, 2024-2034 (US$ Billion, AGR%, CAGR%)
Table 61 Latin America Biofuel Industry Market Forecast by Generation, 2024-2034 (US$ Billion, AGR%, CAGR%)
Table 62 Latin America Biofuel Industry Market Forecast by Source, 2024-2034 (US$ Billion, AGR%, CAGR%)
Table 63 Brazil Biofuel Industry Market Forecast, 2024-2034 (US$ Billion, AGR%, CAGR%)
Table 64 Argentina Biofuel Industry Market Forecast, 2024-2034 (US$ Billion, AGR%, CAGR%)
Table 65 Rest of Latin America Biofuel Industry Market Forecast, 2024-2034 (US$ Billion, AGR%, CAGR%)
Table 66 Middle East & Africa Biofuel Industry Market Forecast by Country, 2024-2034 (US$ Billion, AGR%, CAGR%)
Table 67 Middle East & Africa Biofuel Industry Market Forecast by Type, 2024-2034 (US$ Billion, AGR%, CAGR%)
Table 68 Middle East & Africa Biofuel Industry Market Forecast by End-use, 2024-2034 (US$ Billion, AGR%, CAGR%)
Table 69 Middle East & Africa Biofuel Industry Market Forecast by Generation, 2024-2034 (US$ Billion, AGR%, CAGR%)
Table 70 Middle East & Africa Biofuel Industry Market Forecast by Source, 2024-2034 (US$ Billion, AGR%, CAGR%)
Table 71 GCC Biofuel Industry Market Forecast, 2024-2034 (US$ Billion, AGR%, CAGR%)
Table 72 South Africa Biofuel Industry Market Forecast, 2024-2034 (US$ Billion, AGR%, CAGR%)
Table 73 Rest of Middle East & Africa Biofuel Industry Market Forecast, 2024-2034 (US$ Billion, AGR%, CAGR%)
Table 74 Green Plains: Key Details, (CEO, HQ, Revenue, Founded, No. of Employees, Company Type, Website, Business Segment)
Table 75 Green Plains: Product Benchmarking
Table 76 Green Plains: Strategic Outlook
Table 77 Petrobras: Key Details, (CEO, HQ, Revenue, Founded, No. of Employees, Company Type, Website, Business Segment)
Table 78 Petrobras: Product Benchmarking
Table 79 Petrobras: Strategic Outlook
Table 80 Valero Marketing and Supply Company: Key Details, (CEO, HQ, Revenue, Founded, No. of Employees, Company Type, Website, Business Segment)
Table 81 Valero Marketing and Supply Company: Product Benchmarking
Table 82 Alto Ingredients, Inc. (Pacific Ethanol): Key Details, (CEO, HQ, Revenue, Founded, No. of Employees, Company Type, Website, Business Segment)
Table 83 Pacific Ethanol, Inc.: Product Benchmarking
Table 84 Butamax Advanced Biofuels, LLC: Key Details, (CEO, HQ, Revenue, Founded, No. of Employees, Company Type, Website, Business Segment)
Table 85 Butamax Advanced Biofuels, LLC: Product Benchmarking
Table 86 Gevo, Inc.: Key Details, (CEO, HQ, Revenue, Founded, No. of Employees, Company Type, Website, Business Segment)
Table 87 Gevo, Inc.: Product Benchmarking
Table 88 Gevo, Inc.: Strategic Outlook
Table 89 Wilmar International Limited: Key Details, (CEO, HQ, Revenue, Founded, No. of Employees, Company Type, Website, Business Segment)
Table 90 Wilmar International Limited: Product Benchmarking
Table 91 Wilmar International Limited: Strategic Outlook
Table 92 Chevron Renewable Energy Group: Key Details, (CEO, HQ, Revenue, Founded, No. of Employees, Company Type, Website, Business Segment)
Table 93 Chevron Renewable Energy Group: Product Benchmarking
Table 94 Chevron Renewable Energy Group: Strategic Outlook
Table 95 Bunge Limited: Key Details, (CEO, HQ, Revenue, Founded, No. of Employees, Company Type, Website, Business Segment)
Table 96 Bunge Limited: Product Benchmarking
Table 97 Bunge Limited: Strategic Outlook
Table 98 Royal Dutch Shell PLC: Key Details, (CEO, HQ, Revenue, Founded, No. of Employees, Company Type, Website, Business Segment)
Table 99 Royal Dutch Shell PLC: Product Benchmarking
Table 100 Royal Dutch Shell PLC: Strategic Outlook
Table 101 Crop Energies AG: Key Details, (CEO, HQ, Revenue, Founded, No. of Employees, Company Type, Website, Business Segment)
Table 102 Crop Energies AG: Product Benchmarking
Table 103 Crop Energies AG: Strategic Outlook
Table 104 Air Liquide: Key Details, (CEO, HQ, Revenue, Founded, No. of Employees, Company Type, Website, Business Segment)
Table 105 Air Liquide: Product Benchmarking
Table 106 Air Liquide: Strategic Outlook
Table 107 Abengoa: Key Details, (CEO, HQ, Revenue, Founded, No. of Employees, Company Type, Website, Business Segment)
Table 108 Abengoa, S.A.: Product Benchmarking
Table 109 Cosan S.A.: Key Details, (CEO, HQ, Revenue, Founded, No. of Employees, Company Type, Website, Business Segment)
Table 110 Cosan S.A.: Product Benchmarking
Table 111 Cosan S.A.: Strategic Outlook
Table 112 FutureFuel Corporation: Key Details, (CEO, HQ, Revenue, Founded, No. of Employees, Company Type, Website, Business Segment)
Table 113 FutureFuel Corporation: Product Benchmarking
Table 114 ADM: Key Details, (CEO, HQ, Revenue, Founded, No. of Employees, Company Type, Website, Business Segment)
Table 115 ADM: Product Benchmarking
Table 116 ADM: Strategic Outlook
Table 117 Neste: Key Details, (CEO, HQ, Revenue, Founded, No. of Employees, Company Type, Website, Business Segment)
Table 118 Neste: Product Benchmarking
Table 119 Neste: Strategic Outlook
Table 120 POET: Key Details, (CEO, HQ, Revenue, Founded, No. of Employees, Company Type, Website, Business Segment)
Table 121 POET: Product Benchmarking
Table 122 POET: Strategic Outlook
Table 123 Cargill: Key Details, (CEO, HQ, Revenue, Founded, No. of Employees, Company Type, Website, Business Segment)
Table 124 Cargill: Product Benchmarking
Table 125 Cargill: Strategic Outlook
Table 126 Verbio SE: Key Details, (CEO, HQ, Revenue, Founded, No. of Employees, Company Type, Website, Business Segment)
Table 127 Verbio SE: Product Benchmarking
Table 128 Verbio SE: Strategic Outlook
図の一覧
Figure 1 Biofuel Industry Market Segmentation
Figure 2 Biofuel Industry Market by Type: Market Attractiveness Index
Figure 3 Biofuel Industry Market by End-use: Market Attractiveness Index
Figure 4 Biofuel Industry Market by Generation: Market Attractiveness Index
Figure 5 Biofuel Industry Market by Source: Market Attractiveness Index
Figure 6 Biofuel Industry Market Attractiveness Index by Region
Figure 7 Biofuel Industry Market: Market Dynamics
Figure 8 Crude Oil Prices, 2010 – 2023 (USD per Barrel)
Figure 9 Biofuel Industry Market by Region, 2024-2034 (US$ Billion, AGR %): “V” Shaped Recovery
Figure 10 Biofuel Industry Market by Region, 2024-2034 (US$ Billion, AGR %): “U” Shaped Recovery
Figure 11 Biofuel Industry Market by Region, 2024-2034 (US$ Billion, AGR %): “W” Shaped Recovery
Figure 12 Biofuel Industry Market by Region, 2024-2034 (US$ Billion, AGR %): “L” Shaped Recovery
Figure 13 Biofuel Industry Market: Porter’s Five Forces Analysis
Figure 14 Biofuel Industry Market by Type: Market Attractiveness Index
Figure 15 Biofuel Industry Market Forecast by Type, 2024-2034 (US$ Billion, AGR %)
Figure 16 Biofuel Industry Market Share Forecast by Type, 2024, 2029, 2034 (%)
Figure 17 Biodiesel Segment Market Forecast by Region, 2024-2034 (US$ Billion, AGR %)
Figure 18 Biodiesel Segment Market Share Forecast by Region, 2024 & 2034 (%)
Figure 19 Ethanol Segment Market Forecast by Region, 2024-2034 (US$ Billion, AGR %)
Figure 20 Ethanol Segment Market Share Forecast by Region, 2024 & 2034 (%)
Figure 21 Others Segment Market Forecast by Region, 2024-2034 (US$ Billion, AGR %)
Figure 22 Others Segment Market Share Forecast by Region, 2024 & 2034 (%)
Figure 23 Biofuel Industry Market by End-use: Market Attractiveness Index
Figure 24 Biofuel Industry Market Forecast by End-use, 2024-2034 (US$ Billion, AGR %)
Figure 25 Biofuel Industry Market Share Forecast by End-use, 2024, 2029, 2034 (%)
Figure 26 Transportation Segment Market Forecast by Region, 2024-2034 (US$ Billion, AGR %)
Figure 27 Transportation Segment Market Share Forecast by Region, 2024 & 2034 (%)
Figure 28 Electricity Generation Segment Market Forecast by Region, 2024-2034 (US$ Billion, AGR %)
Figure 29 Electricity Generation Segment Market Share Forecast by Region, 2024 & 2034 (%)
Figure 30 Heating Buildings Segment Market Forecast by Region, 2024-2034 (US$ Billion, AGR %)
Figure 31 Heating Buildings Segment Market Share Forecast by Region, 2024 & 2034 (%)
Figure 32 Other End-uses Segment Market Forecast by Region, 2024-2034 (US$ Billion, AGR %)
Figure 33 Other End-uses Segment Market Share Forecast by Region, 2024 & 2034 (%)
Figure 34 Biofuel Industry Market by Generation: Market Attractiveness Index
Figure 35 Biofuel Industry Market Forecast by Generation, 2024-2034 (US$ Billion, AGR %)
Figure 36 Biofuel Industry Market Share Forecast by Generation, 2024, 2029, 2034 (%)
Figure 37 First-generation Biofuels Segment Market Forecast by Region, 2024-2034 (US$ Billion, AGR %)
Figure 38 First-generation Biofuels Segment Market Share Forecast by Region, 2024 & 2034 (%)
Figure 39 Second-generation Biofuels Segment Market Forecast by Region, 2024-2034 (US$ Billion, AGR %)
Figure 40 Second-generation Biofuels Segment Market Share Forecast by Region, 2024 & 2034 (%)
Figure 41 Third-generation Biofuels Segment Market Forecast by Region, 2024-2034 (US$ Billion, AGR %)
Figure 42 Third-generation Biofuels Segment Market Share Forecast by Region, 2024 & 2034 (%)
Figure 43 Fourth-generation Biofuels Segment Market Forecast by Region, 2024-2034 (US$ Billion, AGR %)
Figure 44 Fourth-generation Biofuels Segment Market Share Forecast by Region, 2024 & 2034 (%)
Figure 45 Fifth-generation Biofuels Segment Market Forecast by Region, 2024-2034 (US$ Billion, AGR %)
Figure 46 Fifth-generation Biofuels Segment Market Share Forecast by Region, 2024 & 2034 (%)
Figure 47 Biofuel Industry Market by Source: Market Attractiveness Index
Figure 48 Biofuel Industry Market Forecast by Source, 2024-2034 (US$ Billion, AGR %)
Figure 49 Biofuel Industry Market Share Forecast by Source, 2024, 2029, 2034 (%)
Figure 50 Maize Segment Market Forecast by Region, 2024-2034 (US$ Billion, AGR %)
Figure 51 Maize Segment Market Share Forecast by Region, 2024 & 2034 (%)
Figure 52 Vegetable oils Segment Market Forecast by Region, 2024-2034 (US$ Billion, AGR %)
Figure 53 Vegetable oils Segment Market Share Forecast by Region, 2024 & 2034 (%)
Figure 54 Sugar beet Segment Market Forecast by Region, 2024-2034 (US$ Billion, AGR %)
Figure 55 Sugar beet Segment Market Share Forecast by Region, 2024 & 2034 (%)
Figure 56 Wheat Segment Market Forecast by Region, 2024-2034 (US$ Billion, AGR %)
Figure 57 Wheat Segment Market Share Forecast by Region, 2024 & 2034 (%)
Figure 58 Sugar Cane Segment Market Forecast by Region, 2024-2034 (US$ Billion, AGR %)
Figure 59 Sugar Cane Segment Market Share Forecast by Region, 2024 & 2034 (%)
Figure 60 Other Sources Segment Market Forecast by Region, 2024-2034 (US$ Billion, AGR %)
Figure 61 Other Sources Segment Market Share Forecast by Region, 2024 & 2034 (%)
Figure 62 Biofuel Industry Market Forecast by Region 2024 and 2034 (US$ Billion, CAGR%)
Figure 63 Biofuel Industry Market Share Forecast by Region 2024, 2029, 2034 (%)
Figure 64 Biofuel Industry Market by Region, 2024-2034 (US$ Billion, AGR %)
Figure 65 North America Biofuel Industry Market Attractiveness Index
Figure 66 North America Biofuel Industry Market by Region, 2024, 2029 & 2034 (US$ Billion)
Figure 67 North America Biofuel Industry Market Forecast by Country, 2024-2034 (US$ Billion, AGR %)
Figure 68 North America Biofuel Industry Market Share Forecast by Country, 2024 & 2034 (%)
Figure 69 North America Biofuel Industry Market Forecast by Type, 2024-2034 (US$ Billion, AGR %)
Figure 70 North America Biofuel Industry Market Share Forecast by Type, 2024 & 2034 (%)
Figure 71 North America Biofuel Industry Market Forecast by End-use, 2024-2034 (US$ Billion, AGR %)
Figure 72 North America Biofuel Industry Market Share Forecast by End-use, 2024 & 2034 (%)
Figure 73 North America Biofuel Industry Market Forecast by Generation, 2024-2034 (US$ Billion, AGR %)
Figure 74 North America Biofuel Industry Market Share Forecast by Generation, 2024 & 2034 (%)
Figure 75 North America Biofuel Industry Market Forecast by Source, 2024-2034 (US$ Billion, AGR %)
Figure 76 North America Biofuel Industry Market Share Forecast by Source, 2024 & 2034 (%)
Figure 77 U.S. Biofuel Industry Market Forecast, 2024-2034 (US$ Billion, AGR %)
Figure 78 Canada Biofuel Industry Market Forecast, 2024-2034 (US$ Billion, AGR %)
Figure 79 Europe Biofuel Industry Market Attractiveness Index
Figure 80 Europe Biofuel Industry Market by Region, 2024, 2029 & 2034 (US$ Billion)
Figure 81 Europe Biofuel Industry Market Forecast by Country, 2024-2034 (US$ Billion, AGR %)
Figure 82 Europe Biofuel Industry Market Share Forecast by Country, 2024 & 2034 (%)
Figure 83 Europe Biofuel Industry Market Forecast by Type, 2024-2034 (US$ Billion, AGR %)
Figure 84 Europe Biofuel Industry Market Share Forecast by Type, 2024 & 2034 (%)
Figure 85 Europe Biofuel Industry Market Forecast by End-use, 2024-2034 (US$ Billion, AGR %)
Figure 86 Europe Biofuel Industry Market Share Forecast by End-use, 2024 & 2034 (%)
Figure 87 Europe Biofuel Industry Market Forecast by Generation, 2024-2034 (US$ Billion, AGR %)
Figure 88 Europe Biofuel Industry Market Share Forecast by Generation, 2024 & 2034 (%)
Figure 89 Europe Biofuel Industry Market Forecast by Source, 2024-2034 (US$ Billion, AGR %)
Figure 90 Europe Biofuel Industry Market Share Forecast by Source, 2024 & 2034 (%)
Figure 91 Germany Biofuel Industry Market Forecast, 2024-2034 (US$ Billion, AGR %)
Figure 92 UK Biofuel Industry Market Forecast, 2024-2034 (US$ Billion, AGR %)
Figure 93 France Biofuel Industry Market Forecast, 2024-2034 (US$ Billion, AGR %)
Figure 94 Italy Biofuel Industry Market Forecast, 2024-2034 (US$ Billion, AGR %)
Figure 95 Spain Biofuel Industry Market Forecast, 2024-2034 (US$ Billion, AGR %)
Figure 96 Rest of the Europe Biofuel Industry Market Forecast, 2024-2034 (US$ Billion, AGR %)
Figure 97 Asia Pacific Biofuel Industry Market Attractiveness Index
Figure 98 Asia Pacific Biofuel Industry Market by Region, 2024, 2029 & 2034 (US$ Billion)
Figure 99 Asia Pacific Biofuel Industry Market Forecast by Country, 2024-2034 (US$ Billion, AGR %)
Figure 100 Asia Pacific Biofuel Industry Market Share Forecast by Country, 2024 & 2034 (%)
Figure 101 Asia Pacific Biofuel Industry Market Forecast by Type, 2024-2034 (US$ Billion, AGR %)
Figure 102 Asia Pacific Biofuel Industry Market Share Forecast by Type, 2024 & 2034 (%)
Figure 103 Asia Pacific Biofuel Industry Market Forecast by End-use, 2024-2034 (US$ Billion, AGR %)
Figure 104 Asia Pacific Biofuel Industry Market Share Forecast by End-use, 2024 & 2034 (%)
Figure 105 Asia Pacific Biofuel Industry Market Forecast by Generation, 2024-2034 (US$ Billion, AGR %)
Figure 106 Asia Pacific Biofuel Industry Market Share Forecast by Generation, 2024 & 2034 (%)
Figure 107 Asia Pacific Biofuel Industry Market Forecast by Source, 2024-2034 (US$ Billion, AGR %)
Figure 108 Asia Pacific Biofuel Industry Market Share Forecast by Source, 2024 & 2034 (%)
Figure 109 China Biofuel Industry Market Forecast, 2024-2034 (US$ Billion, AGR %)
Figure 110 India Biofuel Industry Market Forecast, 2024-2034 (US$ Billion, AGR %)
Figure 111 Japan Biofuel Industry Market Forecast, 2024-2034 (US$ Billion, AGR %)
Figure 112 South Korea Biofuel Industry Market Forecast, 2024-2034 (US$ Billion, AGR %)
Figure 113 Australia Biofuel Industry Market Forecast, 2024-2034 (US$ Billion, AGR %)
Figure 114 Rest of Asia Pacific Biofuel Industry Market Forecast, 2024-2034 (US$ Billion, AGR %)
Figure 115 Latin America Biofuel Industry Market Attractiveness Index
Figure 116 Latin America Biofuel Industry Market by Region, 2024, 2029 & 2034 (US$ Billion)
Figure 117 Latin America Biofuel Industry Market Forecast by Country, 2024-2034 (US$ Billion, AGR %)
Figure 118 Latin America Biofuel Industry Market Share Forecast by Country, 2024 & 2034 (%)
Figure 119 Latin America Biofuel Industry Market Forecast by Type, 2024-2034 (US$ Billion, AGR %)
Figure 120 Latin America Biofuel Industry Market Share Forecast by Type, 2024 & 2034 (%)
Figure 121 Latin America Biofuel Industry Market Forecast by End-use, 2024-2034 (US$ Billion, AGR %)
Figure 122 Latin America Biofuel Industry Market Share Forecast by End-use, 2024 & 2034 (%)
Figure 123 Latin America Biofuel Industry Market Forecast by Generation, 2024-2034 (US$ Billion, AGR %)
Figure 124 Latin America Biofuel Industry Market Share Forecast by Generation, 2024 & 2034 (%)
Figure 125 Latin America Biofuel Industry Market Forecast by Source, 2024-2034 (US$ Billion, AGR %)
Figure 126 Latin America Biofuel Industry Market Share Forecast by Source, 2024 & 2034 (%)
Figure 127 Brazil Biofuel Industry Market Forecast, 2024-2034 (US$ Billion, AGR %)
Figure 128 Argentina Biofuel Industry Market Forecast, 2024-2034 (US$ Billion, AGR %)
Figure 129 Rest of Latin America Biofuel Industry Market Forecast, 2024-2034 (US$ Billion, AGR %)
Figure 130 Middle East & Africa Biofuel Industry Market Attractiveness Index
Figure 131 Middle East & Africa Biofuel Industry Market by Region, 2024, 2029 & 2034 (US$ Billion)
Figure 132 Middle East & Africa Biofuel Industry Market Forecast by Country, 2024-2034 (US$ Billion, AGR %)
Figure 133 Middle East & Africa Biofuel Industry Market Share Forecast by Country, 2024 & 2034 (%)
Figure 134 Middle East & Africa Biofuel Industry Market Forecast by Type, 2024-2034 (US$ Billion, AGR %)
Figure 135 Middle East & Africa Biofuel Industry Market Share Forecast by Type, 2024 & 2034 (%)
Figure 136 Middle East & Africa Biofuel Industry Market Forecast by End-use, 2024-2034 (US$ Billion, AGR %)
Figure 137 Middle East & Africa Biofuel Industry Market Share Forecast by End-use, 2024 & 2034 (%)
Figure 138 Middle East & Africa Biofuel Industry Market Forecast by Generation, 2024-2034 (US$ Billion, AGR %)
Figure 139 Middle East & Africa Biofuel Industry Market Share Forecast by Generation, 2024 & 2034 (%)
Figure 140 Middle East & Africa Biofuel Industry Market Forecast by Source, 2024-2034 (US$ Billion, AGR %)
Figure 141 Middle East & Africa Biofuel Industry Market Share Forecast by Source, 2024 & 2034 (%)
Figure 142 GCC Biofuel Industry Market Forecast, 2024-2034 (US$ Billion, AGR %)
Figure 143 South Africa Biofuel Industry Market Forecast, 2024-2034 (US$ Billion, AGR %)
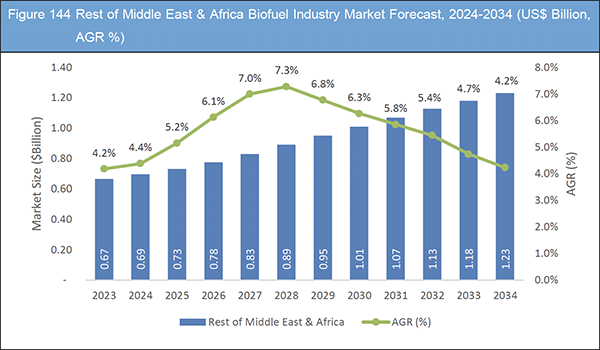
Figure 144 Rest of Middle East & Africa Biofuel Industry Market Forecast, 2024-2034 (US$ Billion, AGR %)
Figure 145 Green Plains: Net Revenue, 2018-2022 (US$ Million, AGR%)
Figure 146 Green Plains: Segment Market Shares, 2022
Figure 147 Petrobras: Net Revenue, 2018-2022 (US$ Million, AGR%)
Figure 148 Petrobras: Segment Market Shares, 2022
Figure 149 Valero Marketing and Supply Company: Net Revenue, 2018-2022 (US$ Million, AGR%)
Figure 150 Valero Marketing and Supply Company: Regional Market Shares, 2022
Figure 151 Valero Marketing and Supply Company: Segment Market Shares, 2022
Figure 152 Gevo, Inc.: Net Revenue, 2018-2022 (US$ Billion, AGR%)
Figure 153 Gevo, Inc.: Segment Market Shares, 2022
Figure 154 Wilmar International Limited: Net Revenue, 2018-2022 (US$ Billion, AGR%)
Figure 155 Wilmar International Limited: Regional Market Shares, 2022
Figure 156 Wilmar International Limited: Segment Market Shares, 2022
Figure 157 Bunge Limited: Net Revenue, 2018-2023 (US$ Billion, AGR%)
Figure 158 Bunge Limited: Segment Market Shares, 2022
Figure 159 Royal Dutch Shell PLC: Net Revenue, 2018-2023 (US$ Million, AGR%)
Figure 160 Royal Dutch Shell PLC: Segment Market Shares, 2022
Figure 161 Crop Energies AG: Net Revenue, 2018-2022 (US$ Million, AGR%)
Figure 162 Crop Energies AG: Segment Market Shares, 2022
Figure 163 Air Liquide: Net Revenue, 2018-2022 (US$ Billion, AGR%)
Figure 164 Air Liquide: Regional Market Shares, 2022
Figure 165 Air Liquide: Segment Market Shares, 2022
Figure 166 FutureFuel Corporation: Net Revenue, 2018-2022 (US$ Billion, AGR%)
Figure 167 FutureFuel Corporation: Segment Market Shares, 2022
Figure 168 ADM: Net Revenue, 2018-2022 (US$ Million, AGR%)
Figure 169 ADM: Segment Market Shares, 2022
Figure 170 Neste: Net Revenue, 2018-2022 (US$ Billion, AGR%)
Figure 171 Neste: Regional Market Shares, 2022
Figure 172 Neste: Segment Market Shares, 2022
Figure 173 Verbio SE: Net Revenue, 2018-2022 (US$ Billion, AGR%)
Figure 174 Verbio SE: Segment Market Shares, 2022
ページTOPに戻る
Summary
Report Details
The Biofuel Industry Market Report 2024-2034: This report will prove invaluable to leading firms striving for new revenue pockets if they wish to better understand the industry and its underlying dynamics. It will be useful for companies that would like to expand into different industries or to expand their existing operations in a new region.
Growing Demand for Sustainable Energy Sources
The increased demand for sustainable energy sources has been a significant driver of growth in the biofuel industry. The world’s population continues to grow, and the effects of climate change become more apparent, leading to an urgent need to transition from traditional fossil fuels to renewable energy sources. Biofuels are considered one of the most promising alternatives to traditional fossil fuels, as they offer several benefits.
One of the primary benefits of biofuels is reduced greenhouse gas emissions. Biofuels are made from renewable resources such as crops and plant waste, which absorb carbon dioxide as they grow. As a result, the use of biofuels can help reduce greenhouse gas emissions and mitigate the impacts of climate change. This is particularly important given the growing concerns around climate change and the need to reduce greenhouse gas emissions to meet global targets.
Lack of Adequate Infrastructure Can Limit the Growth of the Industry
Infrastructure limitations are one of the significant challenges for the biofuel industry. The production of biofuels requires specialized equipment and facilities, and these may not be widely available in all areas. This lack of infrastructure can limit the production and distribution of biofuels, hindering the growth of the industry.
One of the primary infrastructure limitations in the biofuel industry is the lack of biofuel refineries and storage facilities. Unlike fossil fuels, which can be refined and stored in large quantities, biofuels are often produced on a smaller scale, and their storage and transportation may require specialized infrastructure. This can lead to higher costs for biofuel producers and limit the availability of biofuels in certain regions.
What Questions Should You Ask before Buying a Market Research Report?
-
How is the biofuel market evolving?
-
What is driving and restraining the biofuel market?
-
How will each biofuel submarket segment grow over the forecast period and how much revenue will these submarkets account for in 2034?
-
How will the market shares for each biofuel submarket develops from 2023 to 2034?
-
What will be the main driver for the overall market from 2024 to 2034?
-
Will leading biofuel markets broadly follow the macroeconomic dynamics, or will individual national markets outperform others?
-
How will the market shares of the national markets change by 2034 and which geographical region will lead the market in 2034?
-
Who are the leading players and what are their prospects over the forecast period?
-
What are the biofuel projects for these leading companies?
-
How will the industry evolve during the period between 2024 and 2034? What are the implications of biofuel projects taking place now and over the next 10 years?
-
Is there a greater need for product commercialisation to further scale the biofuel market?
-
Where is the biofuel market heading and how can you ensure you are at the forefront of the market?
You need to discover how this will impact the biofuel market today, and over the next 10 years:
-
Our 331-page report provides 101 tables and 178 charts/graphs exclusively to you.
-
The report highlights key lucrative areas in the industry so you can target them – NOW.
-
It contains in-depth analysis of global, regional and national sales and growth.
-
It highlights for you the key successful trends, changes and revenue projections made by your competitors.
This report tells you TODAY how the biofuel market will develop in the next 10 years, and in line with the variations in COVID-19 economic recession and bounce. This market is more critical now than at any point over the last 10 years.
Forecasts to 2034 and other analyses reveal commercial prospects
-
In addition to revenue forecasting to 2034, our new study provides you with recent results, growth rates, and market shares.
-
You will find original analyses, with business outlooks and developments.
-
Discover qualitative analyses (including market dynamics, drivers, opportunities, restraints, and challenges), porters five forces analysis, PEST analysis, and recent developments.
Segments Covered in the Report (Market Size in Revenue)
Type Outlook
-
Biodiesel
-
Ethanol
-
Other Types
End-use Outlook
-
Transportation
-
Electricity Generation
-
Heating Buildings
-
Other End-Uses
Generation Outlook
-
First-generation Biofuels
-
Second-generation Biofuels
-
Third-generation Biofuels
-
Fourth-generation Biofuels
-
Fifth-generation Biofuels
Source Outlook
-
Maize
-
Vegetable Oils
-
Sugar Beet
-
Wheat
-
Sugar Cane
-
Other Sources
In addition to the revenue predictions for the overall world market and segments, you will also find revenue forecasts for five regional and 15 leading national markets:
North America
Europe
-
Germany
-
UK
-
France
-
Italy
-
Spain
-
Rest of Europe
Asia Pacific
-
China
-
India
-
Indonesia
-
South Korea
-
Australia
-
Rest of Asia Pacific
Latin America
-
Brazil
-
Argentina
-
Rest of Latin America
Middle East & Africa
-
GCC
-
South Africa
-
Rest of Middle East & Africa
The report also includes profiles and for some of the leading companies in the Biofuel Market, 2024 to 2034, with a focus on this segment of these companies’ operations.
Leading companies profiled in the report
-
Abengoa
-
ADM
-
Air Liquide
-
Alto Ingredients, Inc. (Pacific Ethanol)
-
Bunge Limited
-
Butamax Advanced Biofuels
-
Cargill
-
Chevron Renewable Energy Group
-
Cosan S.A.
-
Crop Energies AG
-
FutureFuel Corporation
-
Gevo, Inc.
-
Green Plains
-
Neste
-
Petrobras
-
POET
-
Royal Dutch Shell PLC
-
Valero Marketing and Supply Company
-
Verbio SE
-
Wilmar International Limited
Overall revenue for Biofuel Market, 2024 to 2034 in terms of value the market surpassed US$120 billion in 2023, our work calculates. We predict strong revenue growth through to 2033. Our work identifies which organisations hold the greatest potential. Discover their capabilities, progress, and commercial prospects, helping you stay ahead.
How will the Biofuel Market, 2024 to 2034 Market report help you?
In summary, our 330+ page report provides you with the following knowledge:
-
Revenue and volume forecasts to 2034 for Biofuel Market, 2024 to 2034 Market, with forecasts for generation, source, end-use, type, and each forecast at a global, and regional level – discover the industry’s prospects, finding the most lucrative places for investments and revenues.
-
Revenue and volume forecasts to 2034 for five regional and 15 key national markets – See forecasts for the Biofuel Market, 2024 to 2034 market in North America, Europe, Asia-Pacific, Latin America, and Middle East & Africa. Also, market size estimation and forecast is provided for US, Canada, Brazil, Spain, Germany, UK, China, India, Indonesia, and South Africa among other prominent economies.
-
Prospects for established firms and those seeking to enter the market – including company profiles for 20 of the major companies involved in the Biofuel Market.
Find quantitative and qualitative analyses with independent predictions. Receive information that only our report contains, staying informed with invaluable business intelligence.
Information found nowhere else
With our new report, you are less likely to fall behind in knowledge or miss out on opportunities. See how our work could benefit your research, analyses, and decisions. Visiongain’s study is for everybody needing commercial analyses for the Biofuel Market, 2024 to 2034, market-leading companies. You will find data, trends and predictions.
ページTOPに戻る
Table of Contents
1 Report Overview
1.1 Objectives of the Study
1.2 Introduction to Biofuel Industry Market
1.3 What This Report Delivers
1.4 Why You Should Read This Report
1.5 Key Questions Answered by This Analytical Report
1.6 Who is This Report for?
1.7 Methodology
1.7.1 Market Definitions
1.7.2 Market Evaluation & Forecasting Methodology
1.7.3 Data Validation
1.7.3.1 Primary Research
1.7.3.2 Secondary Research
1.8 Frequently Asked Questions (FAQs)
1.9 Associated Visiongain Reports
1.10 About Visiongain
2 Executive Summary
3 Market Overview
3.1 Key Findings
3.2 Market Dynamics
3.2.1 Market Driving Factors
3.2.1.1 Strengthening Biofuel Production Infrastructure
3.2.1.2 Rising Electric Vehicle Industry to Drive the Market
3.2.1.3 Fluctuating Fossil Fuel Prices to Spur the Market
3.2.2 Market Restraining Factors
3.2.2.1 Lack of Adequate Infrastructure Can Limit the Growth of the Industry
3.2.2.2 Land-Use Conflicts Continue to Be a Major Issue for the Industry
3.2.3 Market Opportunities
3.2.3.1 Growing Partnerships and Collaborations in Biofuel Industry
3.2.3.2 Growing Demand for Sustainable Energy Sources
3.2.3.3 National Policies on Biofuel to Open New Avenues for the Market
3.3 COVID-19 Impact Analysis
3.4 Porter’s Five Forces Analysis
3.4.1 Bargaining Power of Suppliers (Moderate – High)
3.4.2 Bargaining Power of Buyers (Moderate)
3.4.3 Competitive Rivalry (High)
3.4.4 Threat from Substitutes (Low)
3.4.5 Threat of New Entrants (Low)
3.5 PEST Analysis
3.5.1 Political Factors
3.5.2 Economic Factors
3.5.3 Social Factors
3.5.4 Technological Factors
4 Biofuel Industry Market Analysis by Type
4.1 Key Findings
4.2 Type Segment: Market Attractiveness Index
4.3 Biofuel Industry Market Size Estimation and Forecast by Type
4.4 Biodiesel
4.4.1 REG Launched Branded Fuel Product Line
4.4.2 Be8 BeVant Launched New Product Line
4.4.3 Market Size by Region, 2024-2034 (US$ Billion)
4.4.4 Market Share by Region, 2024 & 2034 (%)
4.5 Ethanol
4.5.1 Sumitomo Corporation Created Strategic Partnership to Commercialize Production of Bioethanol from Woody Biomass
4.5.2 Verbio Acquired Ethanol Plant in South Bend/Indiana
4.5.3 Market Size by Region, 2024-2034 (US$ Billion)
4.5.4 Market Share by Region, 2024 & 2034 (%)
4.6 Others
4.6.1 BP Launched First US Biogas Plant Since Archaea Acquisition
4.6.2 Market Size by Region, 2024-2034 (US$ Billion)
4.6.3 Market Share by Region, 2024 & 2034 (%)
5 Biofuel Industry Market Analysis by End-use
5.1 Key Findings
5.2 End-use Segment: Market Attractiveness Index
5.3 Biofuel Industry Market Size Estimation and Forecast by End-use
5.4 Transportation
5.4.1 NYK Conducted Successful Biofuel Trial on Vessel Transporting Wood Chips for Daio Paper
5.4.2 Scania Launched Biodiesel Pilot in Côte d’Ivoire
5.4.3 Market Size by Region, 2024-2034 (US$ Billion)
5.4.4 Market Share by Region, 2024 & 2034 (%)
5.5 Electricity Generation
5.5.1 Energy Security Concerns Drive Biofuel Growth
5.5.2 Market Size by Region, 2024-2034 (US$ Billion)
5.5.3 Market Share by Region, 2024 & 2034 (%)
5.6 Heating Buildings
5.6.1 HVO Biofuel Heating Trials Extended to 150 UK Buildings
5.6.2 Market Size by Region, 2024-2034 (US$ Billion)
5.6.3 Market Share by Region, 2024 & 2034 (%)
5.7 Other End-uses
5.7.1 Market Size by Region, 2024-2034 (US$ Billion)
5.7.2 Market Share by Region, 2024 & 2034 (%)
6 Biofuel Industry Market Analysis by Generation
6.1 Key Findings
6.2 Generation Segment: Market Attractiveness Index
6.3 Biofuel Industry Market Size Estimation and Forecast by Generation
6.4 First-generation Biofuels
6.4.1 Market Size by Region, 2024-2034 (US$ Billion)
6.4.2 Market Share by Region, 2024 & 2034 (%)
6.5 Second-generation Biofuels
6.5.1 Market Size by Region, 2024-2034 (US$ Billion)
6.5.2 Market Share by Region, 2024 & 2034 (%)
6.6 Third-generation Biofuels
6.6.1 Market Size by Region, 2024-2034 (US$ Billion)
6.6.2 Market Share by Region, 2024 & 2034 (%)
6.7 Fourth-generation Biofuels
6.7.1 Market Size by Region, 2024-2034 (US$ Billion)
6.7.2 Market Share by Region, 2024 & 2034 (%)
6.8 Fifth-generation Biofuels
6.8.1 Market Size by Region, 2024-2034 (US$ Billion)
6.8.2 Market Share by Region, 2024 & 2034 (%)
7 Biofuel Industry Market Analysis by Source
7.1 Key Findings
7.2 Source Segment: Market Attractiveness Index
7.3 Biofuel Industry Market Size Estimation and Forecast by Source
7.4 Maize
7.4.1 For Energy Security, Indian Govt Looks At Maize
7.4.2 Market Size by Region, 2024-2034 (US$ Billion)
7.4.3 Market Share by Region, 2024 & 2034 (%)
7.5 Vegetable oils
7.5.1 RUDN Engineers Run a Diesel Engine on Vegetable Oil
7.5.2 Market Size by Region, 2024-2034 (US$ Billion)
7.5.3 Market Share by Region, 2024 & 2034 (%)
7.6 Sugar Beet
7.6.1 Biofuels Company Brings New Hope to Local Sugar Beet Growers
7.6.2 Market Size by Region, 2024-2034 (US$ Billion)
7.6.3 Market Share by Region, 2024 & 2034 (%)
7.7 Wheat
7.7.1 BSBios to Build Brazil's First Big Wheat Ethanol Plant as Crop Expands
7.7.2 Market Size by Region, 2024-2034 (US$ Billion)
7.7.3 Market Share by Region, 2024 & 2034 (%)
7.8 Sugar Cane
7.8.1 Indonesia to Produce Bioethanol from Sugarcane and Cassava
7.8.2 Market Size by Region, 2024-2034 (US$ Billion)
7.8.3 Market Share by Region, 2024 & 2034 (%)
7.9 Other Sources
7.9.1 Market Size by Region, 2024-2034 (US$ Billion)
7.9.2 Market Share by Region, 2024 & 2034 (%)
8 Biofuel Industry Market Analysis by Region
8.1 Key Findings
8.2 Regional Market Size Estimation and Forecast
9 North America Biofuel Industry Market Analysis
9.1 Key Findings
9.2 North America Biofuel Industry Market Attractiveness Index
9.3 North America Biofuel Industry Market by Country, 2024, 2029, and 2034 (US$ Billion)
9.4 North America Biofuel Industry Market Size Estimation and Forecast by Country
9.5 North America Biofuel Industry Market Size Estimation and Forecast by Type
9.6 North America Biofuel Industry Market Size Estimation and Forecast by End-use
9.7 North America Biofuel Industry Market Size Estimation and Forecast by Generation
9.8 North America Biofuel Industry Market Size Estimation and Forecast by Source
9.9 U.S. Biofuel Industry Market Analysis
9.9.1 EPA, DOE Announced $9.4M to Spur Development of Advanced Biofuels
9.9.2 US to Boost Biofuel Mandates Over Next 3 Years
9.10 Canada Biofuel Industry Market Analysis
9.10.1 Advanced Biofuels Canada (ABFC) Released its Fiscal Recommendations
9.10.2 Calgary’s Cielo to Purchase Expander Energy’s Biofuels Technologies Assets
10 Europe Biofuel Industry Market Analysis
10.1 Key Findings
10.2 Europe Biofuel Industry Market Attractiveness Index
10.3 Europe Biofuel Industry Market by Country, 2024, 2029, and 2034 (US$ Billion)
10.4 Europe Biofuel Industry Market Size Estimation and Forecast by Country
10.5 Europe Biofuel Industry Market Size Estimation and Forecast by Type
10.6 Europe Biofuel Industry Market Size Estimation and Forecast by End-use
10.7 Europe Biofuel Industry Market Size Estimation and Forecast by Generation
10.8 Europe Biofuel Industry Market Size Estimation and Forecast by Source
10.9 Germany Biofuel Industry Market Analysis
10.9.1 German Environment Minister Signals Openness to Using Biofuels in Agriculture
10.9.2 The First CO2-negative Biofuel Comes from Germany
10.10 UK Biofuel Industry Market Analysis
10.10.1 Trafigura to Acquire Greenergy
10.10.2 BP Acquired UK’s Green Biofuels Ltd
10.11 France Biofuel Industry Market Analysis
10.11.1 France to Invest EUR 300 Million/year in Clean Aviation
10.11.2 CEVA Logistics Switches 14 Trucks in France to HVO Biofuel
10.12 Italy Biofuel Industry Market Analysis
10.12.1 Eni to Build Third Biorefinery in Italy
10.12.2 Suma Capital acquires Italian biogas company CH4T
10.13 Spain Biofuel Industry Market Analysis
10.13.1 Spain's Cepsa, Apical Begin Work on Biofuels Plant
10.13.2 Repsol Started Construction of Spain's First Advanced Biofuels Plant
10.14 Rest of the Europe Biofuel Industry Market Analysis
11 Asia Pacific Biofuel Industry Market Analysis
11.1 Key Findings
11.2 Asia Pacific Biofuel Industry Market Attractiveness Index
11.3 Asia Pacific Biofuel Industry Market by Country, 2024, 2029, and 2034 (US$ Billion)
11.4 Asia Pacific Biofuel Industry Market Size Estimation and Forecast by Country
11.5 Asia Pacific Biofuel Industry Market Size Estimation and Forecast by Type
11.6 Asia Pacific Biofuel Industry Market Size Estimation and Forecast by End-use
11.7 Asia Pacific Biofuel Industry Market Size Estimation and Forecast by Generation
11.8 Asia Pacific Biofuel Industry Market Size Estimation and Forecast by Source
11.9 China Biofuel Industry Market Analysis
11.9.1 China Accelerates Biodiesel Demo Projects
11.9.2 Biobased Diesel Exports Increased In 2023
11.10 India Biofuel Industry Market Analysis
11.10.1 India Could Triple its Biofuel Consumption
11.10.2 Aemetis Completed Expansion of Indian Biodiesel Plant
11.11 Indonesia Biofuel Industry Market Analysis
11.11.1 Indonesia's PalmCo Set to Invest in a Biodiesel Plant
11.11.2 Indonesia Launched Higher Blend of Palm Oil-based Biodiesel
11.12 South Korea Biofuel Industry Market Analysis
11.12.1 New HVO Plant in South Korea
11.12.2 Korea Updates Laws to Promote Biofuels
11.13 Australia Biofuel Industry Market Analysis
11.13.1 BP Gets Approval to Transform Refinery Into Biofuel Plant
11.14 Rest of Asia Pacific Biofuel Industry Market Analysis
11.14.1 Japan's NYK Line Leads the Way on Biofuels for International Shipping
12 Latin America Biofuel Industry Market Analysis
12.1 Key Findings
12.2 Latin America Biofuel Industry Market Attractiveness Index
12.3 Latin America Biofuel Industry Market by Country, 2024, 2029, and 2034 (US$ Billion)
12.4 Latin America Biofuel Industry Market Size Estimation and Forecast by Country
12.5 Latin America Biofuel Industry Market Size Estimation and Forecast by Type
12.6 Latin America Biofuel Industry Market Size Estimation and Forecast by End-use
12.7 Latin America Biofuel Industry Market Size Estimation and Forecast by Generation
12.8 Latin America Biofuel Industry Market Size Estimation and Forecast by Source
12.9 Brazil Biofuel Industry Market Analysis
12.9.1 Acelen to Invest $2.4bn in Biofuels
12.10 Argentina Biofuel Industry Market Analysis
12.10.1 Argentina Biofuel Consumption
12.11 Rest of Latin America Biofuel Industry Market Analysis
13 Middle East & Africa Biofuel Industry Market Analysis
13.1 Key Findings
13.2 Middle East & Africa Biofuel Industry Market Attractiveness Index
13.3 Middle East & Africa Biofuel Industry Market by Country, 2024, 2029, and 2034 (US$ Billion)
13.4 Middle East & Africa Biofuel Industry Market Size Estimation and Forecast by Country
13.5 Middle East & Africa Biofuel Industry Market Size Estimation and Forecast by Type
13.6 Middle East & Africa Biofuel Industry Market Size Estimation and Forecast by End-use
13.7 Middle East & Africa Biofuel Industry Market Size Estimation and Forecast by Generation
13.8 Middle East & Africa Biofuel Industry Market Size Estimation and Forecast by Source
13.9 GCC Biofuel Industry Market Analysis
13.9.1 Saudi Arabia Introduced Clean Diesel and Gasoline Fuels
13.9.2 Vitol Completed Inaugural Biofuel Delivery in the UAE
13.10 South Africa Biofuel Industry Market Analysis
13.11 Rest of Middle East & Africa Biofuel Industry Market Analysis
14 Company Profiles
14.1 Green Plains
14.1.1 Company Snapshot
14.1.2 Company Overview
14.1.3 Financial Analysis
14.1.3.1 Net Revenue, 2018-2022
14.1.3.2 Segment Market Shares, 2022
14.1.4 Product Benchmarking
14.1.5 Strategic Outlook
14.2 Petrobras
14.2.1 Company Snapshot
14.2.2 Company Overview
14.2.3 Financial Analysis
14.2.3.1 Net Revenue, 2018-2022
14.2.3.2 Segment Market Shares, 2022
14.2.4 Product Benchmarking
14.2.5 Strategic Outlook
14.3 Valero Marketing and Supply Company
14.3.1 Company Snapshot
14.3.2 Company Overview
14.3.3 Financial Analysis
14.3.3.1 Net Revenue, 2018-2022
14.3.3.2 Regional Market Shares, 2022
14.3.3.3 Segment Market Shares, 2022
14.3.4 Product Benchmarking
14.4 Alto Ingredients, Inc. (Pacific Ethanol, Inc.)
14.4.1 Company Snapshot
14.4.2 Company Overview
14.4.3 Product Benchmarking
14.5 Butamax Advanced Biofuels, LLC
14.5.1 Company Snapshot
14.5.2 Company Overview
14.5.3 Product Benchmarking
14.6 Gevo, Inc.
14.6.1 Company Snapshot
14.6.2 Company Overview
14.6.3 Financial Analysis
14.6.3.1 Net Revenue, 2018-2022
14.6.3.2 Segment Market Shares, 2022
14.6.4 Product Benchmarking
14.6.5 Strategic Outlook
14.7 Wilmar International Limited
14.7.1 Company Snapshot
14.7.2 Company Overview
14.7.3 Financial Analysis
14.7.3.1 Net Revenue, 2018-2022
14.7.3.2 Regional Market Shares, 2022
14.7.3.3 Segment Market Shares, 2022
14.7.4 Product Benchmarking
14.7.5 Strategic Outlook
14.8 Chevron Renewable Energy Group
14.8.1 Company Snapshot
14.8.2 Company Overview
14.8.3 Product Benchmarking
14.8.4 Strategic Outlook
14.9 Bunge Limited
14.9.1 Company Snapshot
14.9.2 Company Overview
14.9.3 Financial Analysis
14.9.3.1 Net Revenue, 2018-2023
14.9.3.2 Segment Market Shares, 2022
14.9.4 Product Benchmarking
14.9.5 Strategic Outlook
14.10 Royal Dutch Shell PLC
14.10.1 Company Snapshot
14.10.2 Company Overview
14.10.3 Financial Analysis
14.10.3.1 Net Revenue, 2018-2023
14.10.3.2 Segment Market Shares, 2022
14.10.4 Product Benchmarking
14.10.5 Strategic Outlook
14.11 Crop Energies AG
14.11.1 Company Snapshot
14.11.2 Company Overview
14.11.3 Financial Analysis
14.11.3.1 Net Revenue, 2018-2022
14.11.3.2 Segment Market Shares, 2022
14.11.4 Product Benchmarking
14.11.5 Strategic Outlook
14.12 Air Liquide
14.12.1 Company Snapshot
14.12.2 Company Overview
14.12.3 Financial Analysis
14.12.3.1 Net Revenue, 2018-2022
14.12.3.2 Regional Market Shares, 2022
14.12.3.3 Segment Market Shares, 2022
14.12.4 Product Benchmarking
14.12.5 Strategic Outlook
14.13 Abengoa, S.A.
14.13.1 Company Snapshot
14.13.2 Company Overview
14.13.3 Product Benchmarking
14.14 Cosan S.A.
14.14.1 Company Snapshot
14.14.2 Company Overview
14.14.3 Product Benchmarking
14.14.4 Strategic Outlook
14.15 FutureFuel Corporation
14.15.1 Company Snapshot
14.15.2 Company Overview
14.15.3 Financial Analysis
14.15.3.1 Net Revenue, 2018-2022
14.15.3.2 Segment Market Shares, 2022
14.15.4 Product Benchmarking
14.16 ADM
14.16.1 Company Snapshot
14.16.2 Company Overview
14.16.3 Financial Analysis
14.16.3.1 Net Revenue, 2018-2022
14.16.3.2 Segment Market Shares, 2022
14.16.4 Product Benchmarking
14.16.5 Strategic Outlook
14.17 Neste
14.17.1 Company Snapshot
14.17.2 Company Overview
14.17.3 Financial Analysis
14.17.3.1 Net Revenue, 2018-2022
14.17.3.2 Regional Market Shares, 2022
14.17.3.3 Segment Market Shares, 2022
14.17.4 Product Benchmarking
14.17.5 Strategic Outlook
14.18 POET
14.18.1 Company Snapshot
14.18.2 Company Overview
14.18.3 Product Benchmarking
14.18.4 Strategic Outlook
14.19 Cargill
14.19.1 Company Snapshot
14.19.2 Company Overview
14.19.3 Product Benchmarking
14.19.4 Strategic Outlook
14.20 Verbio SE
14.20.1 Company Snapshot
14.20.2 Company Overview
14.20.3 Financial Analysis
14.20.3.1 Net Revenue, 2018-2022
14.20.3.2 Segment Market Shares, 2022
14.20.4 Product Benchmarking
14.20.5 Strategic Outlook
15 Conclusion and Recommendations
15.1 Concluding Remarks from Visiongain
15.2 Recommendations
ページTOPに戻る
List of Tables/Graphs
List of Tables
Table 1 Biofuel Industry Market Snapshot, 2024 & 2034 (US$ Billion, CAGR %)
Table 2 Biofuel Industry Market Forecast by Region, 2024-2034 (US$ Billion, AGR%, CAGR%): “V” Shaped Recovery
Table 3 Biofuel Industry Market Forecast by Region, 2024-2034 (US$ Billion, AGR%, CAGR%): “U” Shaped Recovery
Table 4 Biofuel Industry Market Forecast by Region, 2024-2034 (US$ Billion, AGR%, CAGR%): “W” Shaped Recovery
Table 5 Biofuel Industry Market Forecast by Region, 2024-2034 (US$ Billion, AGR%, CAGR%): “L” Shaped Recovery
Table 6 Biofuel Industry Market Forecast by Type, 2024-2034 (US$ Billion, AGR%, CAGR%)
Table 7 Biodiesel Segment Market Forecast by Region, 2024-2034 (US$ Billion, AGR%, CAGR%)
Table 8 Ethanol Segment Market Forecast by Region, 2024-2034 (US$ Billion, AGR%, CAGR%)
Table 9 Others Segment Market Forecast by Region, 2024-2034 (US$ Billion, AGR%, CAGR%)
Table 10 Biofuel Industry Market Forecast by End-use, 2024-2034 (US$ Billion, AGR%, CAGR%)
Table 11 Transportation Segment Market Forecast by Region, 2024-2034 (US$ Billion, AGR%, CAGR%)
Table 12 Electricity Generation Segment Market Forecast by Region, 2024-2034 (US$ Billion, AGR%, CAGR%)
Table 13 Heating Buildings Segment Market Forecast by Region, 2024-2034 (US$ Billion, AGR%, CAGR%)
Table 14 Other End-uses Segment Market Forecast by Region, 2024-2034 (US$ Billion, AGR%, CAGR%)
Table 15 Biofuel Industry Market Forecast by Generation, 2024-2034 (US$ Billion, AGR%, CAGR%)
Table 16 First-generation Biofuels Segment Market Forecast by Region, 2024-2034 (US$ Billion, AGR%, CAGR%)
Table 17 Second-generation Biofuels Segment Market Forecast by Region, 2024-2034 (US$ Billion, AGR%, CAGR%)
Table 18 Third-generation Biofuels Segment Market Forecast by Region, 2024-2034 (US$ Billion, AGR%, CAGR%)
Table 19 Fourth-generation Biofuels Segment Market Forecast by Region, 2024-2034 (US$ Billion, AGR%, CAGR%)
Table 20 Fifth-generation Biofuels Segment Market Forecast by Region, 2024-2034 (US$ Billion, AGR%, CAGR%)
Table 21 Biofuel Industry Market Forecast by Source, 2024-2034 (US$ Billion, AGR%, CAGR%)
Table 22 Maize Segment Market Forecast by Region, 2024-2034 (US$ Billion, AGR%, CAGR%)
Table 23 Vegetable oils Segment Market Forecast by Region, 2024-2034 (US$ Billion, AGR%, CAGR%)
Table 24 Sugar beet Segment Market Forecast by Region, 2024-2034 (US$ Billion, AGR%, CAGR%)
Table 25 Wheat Segment Market Forecast by Region, 2024-2034 (US$ Billion, AGR%, CAGR%)
Table 26 Sugar Cane Segment Market Forecast by Region, 2024-2034 (US$ Billion, AGR%, CAGR%)
Table 27 Other Sources Segment Market Forecast by Region, 2024-2034 (US$ Billion, AGR%, CAGR%)
Table 28 Biofuel Industry Market Forecast by Region, 2024-2034 (US$ Billion, AGR%, CAGR%)
Table 29 North America Biofuel Industry Market Forecast by Country, 2024-2034 (US$ Billion, AGR%, CAGR%)
Table 30 North America Biofuel Industry Market Forecast by Type, 2024-2034 (US$ Billion, AGR%, CAGR%)
Table 31 North America Biofuel Industry Market Forecast by End-use, 2024-2034 (US$ Billion, AGR%, CAGR%)
Table 32 North America Biofuel Industry Market Forecast by Generation, 2024-2034 (US$ Billion, AGR%, CAGR%)
Table 33 North America Biofuel Industry Market Forecast by Source, 2024-2034 (US$ Billion, AGR%, CAGR%)
Table 34 U.S. Biofuel Industry Market Forecast, 2024-2034 (US$ Billion, AGR%, CAGR%)
Table 35 Canada Biofuel Industry Market Forecast, 2024-2034 (US$ Billion, AGR%, CAGR%)
Table 36 Europe Biofuel Industry Market Forecast by Country, 2024-2034 (US$ Billion, AGR%, CAGR%)
Table 37 Europe Biofuel Industry Market Forecast by Type, 2024-2034 (US$ Billion, AGR%, CAGR%)
Table 38 Europe Biofuel Industry Market Forecast by End-use, 2024-2034 (US$ Billion, AGR%, CAGR%)
Table 39 Europe Biofuel Industry Market Forecast by Generation, 2024-2034 (US$ Billion, AGR%, CAGR%)
Table 40 Europe Biofuel Industry Market Forecast by Source, 2024-2034 (US$ Billion, AGR%, CAGR%)
Table 41 Germany Biofuel Industry Market Forecast, 2024-2034 (US$ Billion, AGR%, CAGR%)
Table 42 UK Biofuel Industry Market Forecast, 2024-2034 (US$ Billion, AGR%, CAGR%)
Table 43 France Biofuel Industry Market Forecast, 2024-2034 (US$ Billion, AGR%, CAGR%)
Table 44 Italy Biofuel Industry Market Forecast, 2024-2034 (US$ Billion, AGR%, CAGR%)
Table 45 Spain Biofuel Industry Market Forecast, 2024-2034 (US$ Billion, AGR%, CAGR%)
Table 46 Rest of the Europe Biofuel Industry Market Forecast, 2024-2034 (US$ Billion, AGR%, CAGR%)
Table 47 Asia Pacific Biofuel Industry Market Forecast by Country, 2024-2034 (US$ Billion, AGR%, CAGR%)
Table 48 Asia Pacific Biofuel Industry Market Forecast by Type, 2024-2034 (US$ Billion, AGR%, CAGR%)
Table 49 Asia Pacific Biofuel Industry Market Forecast by End-use, 2024-2034 (US$ Billion, AGR%, CAGR%)
Table 50 Asia Pacific Biofuel Industry Market Forecast by Generation, 2024-2034 (US$ Billion, AGR%, CAGR%)
Table 51 Asia Pacific Biofuel Industry Market Forecast by Source, 2024-2034 (US$ Billion, AGR%, CAGR%)
Table 52 China Biofuel Industry Market Forecast, 2024-2034 (US$ Billion, AGR%, CAGR%)
Table 53 India Biofuel Industry Market Forecast, 2024-2034 (US$ Billion, AGR%, CAGR%)
Table 54 Japan Biofuel Industry Market Forecast, 2024-2034 (US$ Billion, AGR%, CAGR%)
Table 55 South Korea Biofuel Industry Market Forecast, 2024-2034 (US$ Billion, AGR%, CAGR%)
Table 56 Australia Biofuel Industry Market Forecast, 2024-2034 (US$ Billion, AGR%, CAGR%)
Table 57 Rest of Asia Pacific Biofuel Industry Market Forecast, 2024-2034 (US$ Billion, AGR%, CAGR%)
Table 58 Latin America Biofuel Industry Market Forecast by Country, 2024-2034 (US$ Billion, AGR%, CAGR%)
Table 59 Latin America Biofuel Industry Market Forecast by Type, 2024-2034 (US$ Billion, AGR%, CAGR%)
Table 60 Latin America Biofuel Industry Market Forecast by End-use, 2024-2034 (US$ Billion, AGR%, CAGR%)
Table 61 Latin America Biofuel Industry Market Forecast by Generation, 2024-2034 (US$ Billion, AGR%, CAGR%)
Table 62 Latin America Biofuel Industry Market Forecast by Source, 2024-2034 (US$ Billion, AGR%, CAGR%)
Table 63 Brazil Biofuel Industry Market Forecast, 2024-2034 (US$ Billion, AGR%, CAGR%)
Table 64 Argentina Biofuel Industry Market Forecast, 2024-2034 (US$ Billion, AGR%, CAGR%)
Table 65 Rest of Latin America Biofuel Industry Market Forecast, 2024-2034 (US$ Billion, AGR%, CAGR%)
Table 66 Middle East & Africa Biofuel Industry Market Forecast by Country, 2024-2034 (US$ Billion, AGR%, CAGR%)
Table 67 Middle East & Africa Biofuel Industry Market Forecast by Type, 2024-2034 (US$ Billion, AGR%, CAGR%)
Table 68 Middle East & Africa Biofuel Industry Market Forecast by End-use, 2024-2034 (US$ Billion, AGR%, CAGR%)
Table 69 Middle East & Africa Biofuel Industry Market Forecast by Generation, 2024-2034 (US$ Billion, AGR%, CAGR%)
Table 70 Middle East & Africa Biofuel Industry Market Forecast by Source, 2024-2034 (US$ Billion, AGR%, CAGR%)
Table 71 GCC Biofuel Industry Market Forecast, 2024-2034 (US$ Billion, AGR%, CAGR%)
Table 72 South Africa Biofuel Industry Market Forecast, 2024-2034 (US$ Billion, AGR%, CAGR%)
Table 73 Rest of Middle East & Africa Biofuel Industry Market Forecast, 2024-2034 (US$ Billion, AGR%, CAGR%)
Table 74 Green Plains: Key Details, (CEO, HQ, Revenue, Founded, No. of Employees, Company Type, Website, Business Segment)
Table 75 Green Plains: Product Benchmarking
Table 76 Green Plains: Strategic Outlook
Table 77 Petrobras: Key Details, (CEO, HQ, Revenue, Founded, No. of Employees, Company Type, Website, Business Segment)
Table 78 Petrobras: Product Benchmarking
Table 79 Petrobras: Strategic Outlook
Table 80 Valero Marketing and Supply Company: Key Details, (CEO, HQ, Revenue, Founded, No. of Employees, Company Type, Website, Business Segment)
Table 81 Valero Marketing and Supply Company: Product Benchmarking
Table 82 Alto Ingredients, Inc. (Pacific Ethanol): Key Details, (CEO, HQ, Revenue, Founded, No. of Employees, Company Type, Website, Business Segment)
Table 83 Pacific Ethanol, Inc.: Product Benchmarking
Table 84 Butamax Advanced Biofuels, LLC: Key Details, (CEO, HQ, Revenue, Founded, No. of Employees, Company Type, Website, Business Segment)
Table 85 Butamax Advanced Biofuels, LLC: Product Benchmarking
Table 86 Gevo, Inc.: Key Details, (CEO, HQ, Revenue, Founded, No. of Employees, Company Type, Website, Business Segment)
Table 87 Gevo, Inc.: Product Benchmarking
Table 88 Gevo, Inc.: Strategic Outlook
Table 89 Wilmar International Limited: Key Details, (CEO, HQ, Revenue, Founded, No. of Employees, Company Type, Website, Business Segment)
Table 90 Wilmar International Limited: Product Benchmarking
Table 91 Wilmar International Limited: Strategic Outlook
Table 92 Chevron Renewable Energy Group: Key Details, (CEO, HQ, Revenue, Founded, No. of Employees, Company Type, Website, Business Segment)
Table 93 Chevron Renewable Energy Group: Product Benchmarking
Table 94 Chevron Renewable Energy Group: Strategic Outlook
Table 95 Bunge Limited: Key Details, (CEO, HQ, Revenue, Founded, No. of Employees, Company Type, Website, Business Segment)
Table 96 Bunge Limited: Product Benchmarking
Table 97 Bunge Limited: Strategic Outlook
Table 98 Royal Dutch Shell PLC: Key Details, (CEO, HQ, Revenue, Founded, No. of Employees, Company Type, Website, Business Segment)
Table 99 Royal Dutch Shell PLC: Product Benchmarking
Table 100 Royal Dutch Shell PLC: Strategic Outlook
Table 101 Crop Energies AG: Key Details, (CEO, HQ, Revenue, Founded, No. of Employees, Company Type, Website, Business Segment)
Table 102 Crop Energies AG: Product Benchmarking
Table 103 Crop Energies AG: Strategic Outlook
Table 104 Air Liquide: Key Details, (CEO, HQ, Revenue, Founded, No. of Employees, Company Type, Website, Business Segment)
Table 105 Air Liquide: Product Benchmarking
Table 106 Air Liquide: Strategic Outlook
Table 107 Abengoa: Key Details, (CEO, HQ, Revenue, Founded, No. of Employees, Company Type, Website, Business Segment)
Table 108 Abengoa, S.A.: Product Benchmarking
Table 109 Cosan S.A.: Key Details, (CEO, HQ, Revenue, Founded, No. of Employees, Company Type, Website, Business Segment)
Table 110 Cosan S.A.: Product Benchmarking
Table 111 Cosan S.A.: Strategic Outlook
Table 112 FutureFuel Corporation: Key Details, (CEO, HQ, Revenue, Founded, No. of Employees, Company Type, Website, Business Segment)
Table 113 FutureFuel Corporation: Product Benchmarking
Table 114 ADM: Key Details, (CEO, HQ, Revenue, Founded, No. of Employees, Company Type, Website, Business Segment)
Table 115 ADM: Product Benchmarking
Table 116 ADM: Strategic Outlook
Table 117 Neste: Key Details, (CEO, HQ, Revenue, Founded, No. of Employees, Company Type, Website, Business Segment)
Table 118 Neste: Product Benchmarking
Table 119 Neste: Strategic Outlook
Table 120 POET: Key Details, (CEO, HQ, Revenue, Founded, No. of Employees, Company Type, Website, Business Segment)
Table 121 POET: Product Benchmarking
Table 122 POET: Strategic Outlook
Table 123 Cargill: Key Details, (CEO, HQ, Revenue, Founded, No. of Employees, Company Type, Website, Business Segment)
Table 124 Cargill: Product Benchmarking
Table 125 Cargill: Strategic Outlook
Table 126 Verbio SE: Key Details, (CEO, HQ, Revenue, Founded, No. of Employees, Company Type, Website, Business Segment)
Table 127 Verbio SE: Product Benchmarking
Table 128 Verbio SE: Strategic Outlook
List of Figures
Figure 1 Biofuel Industry Market Segmentation
Figure 2 Biofuel Industry Market by Type: Market Attractiveness Index
Figure 3 Biofuel Industry Market by End-use: Market Attractiveness Index
Figure 4 Biofuel Industry Market by Generation: Market Attractiveness Index
Figure 5 Biofuel Industry Market by Source: Market Attractiveness Index
Figure 6 Biofuel Industry Market Attractiveness Index by Region
Figure 7 Biofuel Industry Market: Market Dynamics
Figure 8 Crude Oil Prices, 2010 – 2023 (USD per Barrel)
Figure 9 Biofuel Industry Market by Region, 2024-2034 (US$ Billion, AGR %): “V” Shaped Recovery
Figure 10 Biofuel Industry Market by Region, 2024-2034 (US$ Billion, AGR %): “U” Shaped Recovery
Figure 11 Biofuel Industry Market by Region, 2024-2034 (US$ Billion, AGR %): “W” Shaped Recovery
Figure 12 Biofuel Industry Market by Region, 2024-2034 (US$ Billion, AGR %): “L” Shaped Recovery
Figure 13 Biofuel Industry Market: Porter’s Five Forces Analysis
Figure 14 Biofuel Industry Market by Type: Market Attractiveness Index
Figure 15 Biofuel Industry Market Forecast by Type, 2024-2034 (US$ Billion, AGR %)
Figure 16 Biofuel Industry Market Share Forecast by Type, 2024, 2029, 2034 (%)
Figure 17 Biodiesel Segment Market Forecast by Region, 2024-2034 (US$ Billion, AGR %)
Figure 18 Biodiesel Segment Market Share Forecast by Region, 2024 & 2034 (%)
Figure 19 Ethanol Segment Market Forecast by Region, 2024-2034 (US$ Billion, AGR %)
Figure 20 Ethanol Segment Market Share Forecast by Region, 2024 & 2034 (%)
Figure 21 Others Segment Market Forecast by Region, 2024-2034 (US$ Billion, AGR %)
Figure 22 Others Segment Market Share Forecast by Region, 2024 & 2034 (%)
Figure 23 Biofuel Industry Market by End-use: Market Attractiveness Index
Figure 24 Biofuel Industry Market Forecast by End-use, 2024-2034 (US$ Billion, AGR %)
Figure 25 Biofuel Industry Market Share Forecast by End-use, 2024, 2029, 2034 (%)
Figure 26 Transportation Segment Market Forecast by Region, 2024-2034 (US$ Billion, AGR %)
Figure 27 Transportation Segment Market Share Forecast by Region, 2024 & 2034 (%)
Figure 28 Electricity Generation Segment Market Forecast by Region, 2024-2034 (US$ Billion, AGR %)
Figure 29 Electricity Generation Segment Market Share Forecast by Region, 2024 & 2034 (%)
Figure 30 Heating Buildings Segment Market Forecast by Region, 2024-2034 (US$ Billion, AGR %)
Figure 31 Heating Buildings Segment Market Share Forecast by Region, 2024 & 2034 (%)
Figure 32 Other End-uses Segment Market Forecast by Region, 2024-2034 (US$ Billion, AGR %)
Figure 33 Other End-uses Segment Market Share Forecast by Region, 2024 & 2034 (%)
Figure 34 Biofuel Industry Market by Generation: Market Attractiveness Index
Figure 35 Biofuel Industry Market Forecast by Generation, 2024-2034 (US$ Billion, AGR %)
Figure 36 Biofuel Industry Market Share Forecast by Generation, 2024, 2029, 2034 (%)
Figure 37 First-generation Biofuels Segment Market Forecast by Region, 2024-2034 (US$ Billion, AGR %)
Figure 38 First-generation Biofuels Segment Market Share Forecast by Region, 2024 & 2034 (%)
Figure 39 Second-generation Biofuels Segment Market Forecast by Region, 2024-2034 (US$ Billion, AGR %)
Figure 40 Second-generation Biofuels Segment Market Share Forecast by Region, 2024 & 2034 (%)
Figure 41 Third-generation Biofuels Segment Market Forecast by Region, 2024-2034 (US$ Billion, AGR %)
Figure 42 Third-generation Biofuels Segment Market Share Forecast by Region, 2024 & 2034 (%)
Figure 43 Fourth-generation Biofuels Segment Market Forecast by Region, 2024-2034 (US$ Billion, AGR %)
Figure 44 Fourth-generation Biofuels Segment Market Share Forecast by Region, 2024 & 2034 (%)
Figure 45 Fifth-generation Biofuels Segment Market Forecast by Region, 2024-2034 (US$ Billion, AGR %)
Figure 46 Fifth-generation Biofuels Segment Market Share Forecast by Region, 2024 & 2034 (%)
Figure 47 Biofuel Industry Market by Source: Market Attractiveness Index
Figure 48 Biofuel Industry Market Forecast by Source, 2024-2034 (US$ Billion, AGR %)
Figure 49 Biofuel Industry Market Share Forecast by Source, 2024, 2029, 2034 (%)
Figure 50 Maize Segment Market Forecast by Region, 2024-2034 (US$ Billion, AGR %)
Figure 51 Maize Segment Market Share Forecast by Region, 2024 & 2034 (%)
Figure 52 Vegetable oils Segment Market Forecast by Region, 2024-2034 (US$ Billion, AGR %)
Figure 53 Vegetable oils Segment Market Share Forecast by Region, 2024 & 2034 (%)
Figure 54 Sugar beet Segment Market Forecast by Region, 2024-2034 (US$ Billion, AGR %)
Figure 55 Sugar beet Segment Market Share Forecast by Region, 2024 & 2034 (%)
Figure 56 Wheat Segment Market Forecast by Region, 2024-2034 (US$ Billion, AGR %)
Figure 57 Wheat Segment Market Share Forecast by Region, 2024 & 2034 (%)
Figure 58 Sugar Cane Segment Market Forecast by Region, 2024-2034 (US$ Billion, AGR %)
Figure 59 Sugar Cane Segment Market Share Forecast by Region, 2024 & 2034 (%)
Figure 60 Other Sources Segment Market Forecast by Region, 2024-2034 (US$ Billion, AGR %)
Figure 61 Other Sources Segment Market Share Forecast by Region, 2024 & 2034 (%)
Figure 62 Biofuel Industry Market Forecast by Region 2024 and 2034 (US$ Billion, CAGR%)
Figure 63 Biofuel Industry Market Share Forecast by Region 2024, 2029, 2034 (%)
Figure 64 Biofuel Industry Market by Region, 2024-2034 (US$ Billion, AGR %)
Figure 65 North America Biofuel Industry Market Attractiveness Index
Figure 66 North America Biofuel Industry Market by Region, 2024, 2029 & 2034 (US$ Billion)
Figure 67 North America Biofuel Industry Market Forecast by Country, 2024-2034 (US$ Billion, AGR %)
Figure 68 North America Biofuel Industry Market Share Forecast by Country, 2024 & 2034 (%)
Figure 69 North America Biofuel Industry Market Forecast by Type, 2024-2034 (US$ Billion, AGR %)
Figure 70 North America Biofuel Industry Market Share Forecast by Type, 2024 & 2034 (%)
Figure 71 North America Biofuel Industry Market Forecast by End-use, 2024-2034 (US$ Billion, AGR %)
Figure 72 North America Biofuel Industry Market Share Forecast by End-use, 2024 & 2034 (%)
Figure 73 North America Biofuel Industry Market Forecast by Generation, 2024-2034 (US$ Billion, AGR %)
Figure 74 North America Biofuel Industry Market Share Forecast by Generation, 2024 & 2034 (%)
Figure 75 North America Biofuel Industry Market Forecast by Source, 2024-2034 (US$ Billion, AGR %)
Figure 76 North America Biofuel Industry Market Share Forecast by Source, 2024 & 2034 (%)
Figure 77 U.S. Biofuel Industry Market Forecast, 2024-2034 (US$ Billion, AGR %)
Figure 78 Canada Biofuel Industry Market Forecast, 2024-2034 (US$ Billion, AGR %)
Figure 79 Europe Biofuel Industry Market Attractiveness Index
Figure 80 Europe Biofuel Industry Market by Region, 2024, 2029 & 2034 (US$ Billion)
Figure 81 Europe Biofuel Industry Market Forecast by Country, 2024-2034 (US$ Billion, AGR %)
Figure 82 Europe Biofuel Industry Market Share Forecast by Country, 2024 & 2034 (%)
Figure 83 Europe Biofuel Industry Market Forecast by Type, 2024-2034 (US$ Billion, AGR %)
Figure 84 Europe Biofuel Industry Market Share Forecast by Type, 2024 & 2034 (%)
Figure 85 Europe Biofuel Industry Market Forecast by End-use, 2024-2034 (US$ Billion, AGR %)
Figure 86 Europe Biofuel Industry Market Share Forecast by End-use, 2024 & 2034 (%)
Figure 87 Europe Biofuel Industry Market Forecast by Generation, 2024-2034 (US$ Billion, AGR %)
Figure 88 Europe Biofuel Industry Market Share Forecast by Generation, 2024 & 2034 (%)
Figure 89 Europe Biofuel Industry Market Forecast by Source, 2024-2034 (US$ Billion, AGR %)
Figure 90 Europe Biofuel Industry Market Share Forecast by Source, 2024 & 2034 (%)
Figure 91 Germany Biofuel Industry Market Forecast, 2024-2034 (US$ Billion, AGR %)
Figure 92 UK Biofuel Industry Market Forecast, 2024-2034 (US$ Billion, AGR %)
Figure 93 France Biofuel Industry Market Forecast, 2024-2034 (US$ Billion, AGR %)
Figure 94 Italy Biofuel Industry Market Forecast, 2024-2034 (US$ Billion, AGR %)
Figure 95 Spain Biofuel Industry Market Forecast, 2024-2034 (US$ Billion, AGR %)
Figure 96 Rest of the Europe Biofuel Industry Market Forecast, 2024-2034 (US$ Billion, AGR %)
Figure 97 Asia Pacific Biofuel Industry Market Attractiveness Index
Figure 98 Asia Pacific Biofuel Industry Market by Region, 2024, 2029 & 2034 (US$ Billion)
Figure 99 Asia Pacific Biofuel Industry Market Forecast by Country, 2024-2034 (US$ Billion, AGR %)
Figure 100 Asia Pacific Biofuel Industry Market Share Forecast by Country, 2024 & 2034 (%)
Figure 101 Asia Pacific Biofuel Industry Market Forecast by Type, 2024-2034 (US$ Billion, AGR %)
Figure 102 Asia Pacific Biofuel Industry Market Share Forecast by Type, 2024 & 2034 (%)
Figure 103 Asia Pacific Biofuel Industry Market Forecast by End-use, 2024-2034 (US$ Billion, AGR %)
Figure 104 Asia Pacific Biofuel Industry Market Share Forecast by End-use, 2024 & 2034 (%)
Figure 105 Asia Pacific Biofuel Industry Market Forecast by Generation, 2024-2034 (US$ Billion, AGR %)
Figure 106 Asia Pacific Biofuel Industry Market Share Forecast by Generation, 2024 & 2034 (%)
Figure 107 Asia Pacific Biofuel Industry Market Forecast by Source, 2024-2034 (US$ Billion, AGR %)
Figure 108 Asia Pacific Biofuel Industry Market Share Forecast by Source, 2024 & 2034 (%)
Figure 109 China Biofuel Industry Market Forecast, 2024-2034 (US$ Billion, AGR %)
Figure 110 India Biofuel Industry Market Forecast, 2024-2034 (US$ Billion, AGR %)
Figure 111 Japan Biofuel Industry Market Forecast, 2024-2034 (US$ Billion, AGR %)
Figure 112 South Korea Biofuel Industry Market Forecast, 2024-2034 (US$ Billion, AGR %)
Figure 113 Australia Biofuel Industry Market Forecast, 2024-2034 (US$ Billion, AGR %)
Figure 114 Rest of Asia Pacific Biofuel Industry Market Forecast, 2024-2034 (US$ Billion, AGR %)
Figure 115 Latin America Biofuel Industry Market Attractiveness Index
Figure 116 Latin America Biofuel Industry Market by Region, 2024, 2029 & 2034 (US$ Billion)
Figure 117 Latin America Biofuel Industry Market Forecast by Country, 2024-2034 (US$ Billion, AGR %)
Figure 118 Latin America Biofuel Industry Market Share Forecast by Country, 2024 & 2034 (%)
Figure 119 Latin America Biofuel Industry Market Forecast by Type, 2024-2034 (US$ Billion, AGR %)
Figure 120 Latin America Biofuel Industry Market Share Forecast by Type, 2024 & 2034 (%)
Figure 121 Latin America Biofuel Industry Market Forecast by End-use, 2024-2034 (US$ Billion, AGR %)
Figure 122 Latin America Biofuel Industry Market Share Forecast by End-use, 2024 & 2034 (%)
Figure 123 Latin America Biofuel Industry Market Forecast by Generation, 2024-2034 (US$ Billion, AGR %)
Figure 124 Latin America Biofuel Industry Market Share Forecast by Generation, 2024 & 2034 (%)
Figure 125 Latin America Biofuel Industry Market Forecast by Source, 2024-2034 (US$ Billion, AGR %)
Figure 126 Latin America Biofuel Industry Market Share Forecast by Source, 2024 & 2034 (%)
Figure 127 Brazil Biofuel Industry Market Forecast, 2024-2034 (US$ Billion, AGR %)
Figure 128 Argentina Biofuel Industry Market Forecast, 2024-2034 (US$ Billion, AGR %)
Figure 129 Rest of Latin America Biofuel Industry Market Forecast, 2024-2034 (US$ Billion, AGR %)
Figure 130 Middle East & Africa Biofuel Industry Market Attractiveness Index
Figure 131 Middle East & Africa Biofuel Industry Market by Region, 2024, 2029 & 2034 (US$ Billion)
Figure 132 Middle East & Africa Biofuel Industry Market Forecast by Country, 2024-2034 (US$ Billion, AGR %)
Figure 133 Middle East & Africa Biofuel Industry Market Share Forecast by Country, 2024 & 2034 (%)
Figure 134 Middle East & Africa Biofuel Industry Market Forecast by Type, 2024-2034 (US$ Billion, AGR %)
Figure 135 Middle East & Africa Biofuel Industry Market Share Forecast by Type, 2024 & 2034 (%)
Figure 136 Middle East & Africa Biofuel Industry Market Forecast by End-use, 2024-2034 (US$ Billion, AGR %)
Figure 137 Middle East & Africa Biofuel Industry Market Share Forecast by End-use, 2024 & 2034 (%)
Figure 138 Middle East & Africa Biofuel Industry Market Forecast by Generation, 2024-2034 (US$ Billion, AGR %)
Figure 139 Middle East & Africa Biofuel Industry Market Share Forecast by Generation, 2024 & 2034 (%)
Figure 140 Middle East & Africa Biofuel Industry Market Forecast by Source, 2024-2034 (US$ Billion, AGR %)
Figure 141 Middle East & Africa Biofuel Industry Market Share Forecast by Source, 2024 & 2034 (%)
Figure 142 GCC Biofuel Industry Market Forecast, 2024-2034 (US$ Billion, AGR %)
Figure 143 South Africa Biofuel Industry Market Forecast, 2024-2034 (US$ Billion, AGR %)
Figure 144 Rest of Middle East & Africa Biofuel Industry Market Forecast, 2024-2034 (US$ Billion, AGR %)
Figure 145 Green Plains: Net Revenue, 2018-2022 (US$ Million, AGR%)
Figure 146 Green Plains: Segment Market Shares, 2022
Figure 147 Petrobras: Net Revenue, 2018-2022 (US$ Million, AGR%)
Figure 148 Petrobras: Segment Market Shares, 2022
Figure 149 Valero Marketing and Supply Company: Net Revenue, 2018-2022 (US$ Million, AGR%)
Figure 150 Valero Marketing and Supply Company: Regional Market Shares, 2022
Figure 151 Valero Marketing and Supply Company: Segment Market Shares, 2022
Figure 152 Gevo, Inc.: Net Revenue, 2018-2022 (US$ Billion, AGR%)
Figure 153 Gevo, Inc.: Segment Market Shares, 2022
Figure 154 Wilmar International Limited: Net Revenue, 2018-2022 (US$ Billion, AGR%)
Figure 155 Wilmar International Limited: Regional Market Shares, 2022
Figure 156 Wilmar International Limited: Segment Market Shares, 2022
Figure 157 Bunge Limited: Net Revenue, 2018-2023 (US$ Billion, AGR%)
Figure 158 Bunge Limited: Segment Market Shares, 2022
Figure 159 Royal Dutch Shell PLC: Net Revenue, 2018-2023 (US$ Million, AGR%)
Figure 160 Royal Dutch Shell PLC: Segment Market Shares, 2022
Figure 161 Crop Energies AG: Net Revenue, 2018-2022 (US$ Million, AGR%)
Figure 162 Crop Energies AG: Segment Market Shares, 2022
Figure 163 Air Liquide: Net Revenue, 2018-2022 (US$ Billion, AGR%)
Figure 164 Air Liquide: Regional Market Shares, 2022
Figure 165 Air Liquide: Segment Market Shares, 2022
Figure 166 FutureFuel Corporation: Net Revenue, 2018-2022 (US$ Billion, AGR%)
Figure 167 FutureFuel Corporation: Segment Market Shares, 2022
Figure 168 ADM: Net Revenue, 2018-2022 (US$ Million, AGR%)
Figure 169 ADM: Segment Market Shares, 2022
Figure 170 Neste: Net Revenue, 2018-2022 (US$ Billion, AGR%)
Figure 171 Neste: Regional Market Shares, 2022
Figure 172 Neste: Segment Market Shares, 2022
Figure 173 Verbio SE: Net Revenue, 2018-2022 (US$ Billion, AGR%)
Figure 174 Verbio SE: Segment Market Shares, 2022
ページTOPに戻る
よくあるご質問
Visiongain社はどのような調査会社ですか?
英国の調査会社ヴィジョンゲイン社(Visiongain)は、通信とエネルギーのほか、自動車や化学・医薬品、金属など、広範な市場を対象に調査を行っています。自動車市場については、市場全般に関する調査のほ... もっと見る
調査レポートの納品までの日数はどの程度ですか?
在庫のあるものは速納となりますが、平均的には 3-4日と見て下さい。
但し、一部の調査レポートでは、発注を受けた段階で内容更新をして納品をする場合もあります。
発注をする前のお問合せをお願いします。
注文の手続きはどのようになっていますか?
1)お客様からの御問い合わせをいただきます。
2)見積書やサンプルの提示をいたします。
3)お客様指定、もしくは弊社の発注書をメール添付にて発送してください。
4)データリソース社からレポート発行元の調査会社へ納品手配します。
5) 調査会社からお客様へ納品されます。最近は、pdfにてのメール納品が大半です。
お支払方法の方法はどのようになっていますか?
納品と同時にデータリソース社よりお客様へ請求書(必要に応じて納品書も)を発送いたします。
お客様よりデータリソース社へ(通常は円払い)の御振り込みをお願いします。
請求書は、納品日の日付で発行しますので、翌月最終営業日までの当社指定口座への振込みをお願いします。振込み手数料は御社負担にてお願いします。
お客様の御支払い条件が60日以上の場合は御相談ください。
尚、初めてのお取引先や個人の場合、前払いをお願いすることもあります。ご了承のほど、お願いします。
データリソース社はどのような会社ですか?
当社は、世界各国の主要調査会社・レポート出版社と提携し、世界各国の市場調査レポートや技術動向レポートなどを日本国内の企業・公官庁及び教育研究機関に提供しております。
世界各国の「市場・技術・法規制などの」実情を調査・収集される時には、データリソース社にご相談ください。
お客様の御要望にあったデータや情報を抽出する為のレポート紹介や調査のアドバイスも致します。
|
|


