液体バイオ燃料市場レポート:2024-2034
Liquid Biofuels Market Report 2024-2034
レポート詳細
液体バイオ燃料市場レポート 2024-2034 :本レポートは、業界とその基礎となる原動力をより良く理解することを望むならば、新たな収益ポケットを目指す大手企業にとって貴重なものとな... もっと見る
※上記価格は部署ライセンス(Departmental licence)価格です。
その他の価格についてはデータリソースまでお問合せください。
日本語のページは自動翻訳を利用し作成しています。
実際のレポートは英文のみでご納品いたします。

|

|
サマリー
レポート詳細
液体バイオ燃料市場レポート 2024-2034:本レポートは、業界とその基礎となる原動力をより良く理解することを望むならば、新たな収益ポケットを目指す大手企業にとって貴重なものとなるであろう。異業種への進出や新規地域での既存事業の拡大を目指す企業にも有用です。
気候変動と持続可能性に対する消費者の意識の高まりが、よりクリーンな代替燃料への需要を促進
液体バイオ燃料市場は、化石燃料への依存を減らし、輸送関連の排出ガスが環境に与える影響を軽減することが急務となっていることが主な要因となっている。再生可能燃料基準やカーボンプライシングメカニズムなど、再生可能エネルギーの導入を促進する政府の取り組みや規制の枠組みは、市場のダイナミクスを形成する主要な推進要因である。さらに、気候変動と持続可能性に対する消費者の意識の高まりが、よりクリーンな代替燃料への需要を促し、バイオ燃料生産とインフラ整備への投資を促進している。
環境問題への関心が高まり、規制の枠組みが進化する中、液体バイオ燃料市場は、バリューチェーン全体の関係者に大きなビジネスチャンスをもたらしている。原料栽培、転換プロセス、流通チャネルにおける技術革新は、効率向上と生産コスト削減の道を提供する。さらに、戦略的提携や協力関係によって知識の共有やリソースの共有が可能になり、市場の拡大や新地域への浸透が促進される。さらに、研究開発投資の増加がバイオ燃料技術の進歩を促し、新規原料や生産方法の可能性を引き出している。
バイオ燃料市場は潜在的な可能性を秘めているものの、いくつかの課題がその成長軌道を妨げている。バイオ燃料生産を持続的に拡大するためには、原料の入手可能性の制限、食用作物との競合、土地利用の対立などが大きな障害となる。さらに、変換プロセスの効率や既存インフラとの適合性など、技術的な制約がバイオ燃料の 普及を妨げている。さらに、政策の不確実性と商品価格の変動は、業界参加者に規制リスクと財務リスクをもたらし、投資決定と市場存続に影響を与える。
バイオ燃料工場設立の高コストが市場を阻む
次世代バイオ燃料市場における障害の一つは、バイオ燃料生産に伴う生産コストの高さである。非食料原料を高度なバイオ燃料に変換する複雑なプロセスには、高度な技術と広範なインフラが必要とされることが多く、生産コストの上昇につながっている。普及と競争力強化のためには、生産技術の最適化、サプライチェーンの合理化、スケールメリットの追求に重点を置いた取り組みが必要である。コスト削減を推進し、次世代バイオ燃料を経済的に実現可能なものとし、大規模な商業展開につなげる ためには、支援政策や投資とともに、継続的な研究開発の取り組みが不可欠である。
市場調査レポートを購入する前にすべき質問とは?
-
液体バイオ燃料市場はどのように進化しているのか?
-
液体バイオ燃料市場の推進要因と阻害要因は何か?
-
液体バイオ燃料の各サブマーケットは予測期間中にどのように成長し、2034年にはどれくらいの売上を占めるようになるのか?
-
2024年から2034年にかけて、液体バイオ燃料の各サブマーケットの市場シェアはどのように推移するのか?
-
2024年から2034年にかけて、市場全体を牽引する主な要因は何か?
-
主要な液体バイオ燃料市場は、マクロ経済の動きに大枠で追随するのか、それとも個々の国の市場が他国を上回るのか。
-
2034年までに各国市場のシェアはどのように変化し、どの地域が2034年の市場をリードするのか。
-
主要プレーヤーと予測期間中の見通しは?
-
これらの大手企業の液体バイオ燃料プロジェクトとは?
-
2024年から2034年にかけて、バイオ燃料産業はどのように発展していくのか?現在および今後10年間に実施される液体バイオ燃料プロジェクトにはどのような意味があるのか?
-
液体バイオ燃料市場をさらに拡大するためには、製品の商業化がより必要なのでしょうか?
-
液体バイオ燃料市場はどこに向かっているのか、また、どのようにすれば市場の最前線に立てるのか。
-
新商品や新サービスに最適な投資方法とは?
-
企業を新たな成長軌道に乗せ、C-suiteに移行させるための重要な展望とは?
このことが、現在、そして今後10年間の液体バイオ燃料市場にどのような影響を与えるかを見極める必要がある:
-
395ページにわたるレポートでは、126の表と182の図表を掲載。
-
本レポートでは、業界における主要な有利分野を取り上げているため、今すぐターゲットを絞ることができる。
-
世界、地域、国の売上高と成長に関する詳細な分析が含まれている。
-
競合他社が成功した主なトレンド、変化、収益予測をハイライトします。
本レポートは、液体バイオ燃料市場が今後10年間にどのように発展していくのか、またCOVID-19の景気後退と好転の変動に合わせてどのように発展していくのかをTODAYでお伝えするものである。この市場は、過去10年間のどの時点よりも今が重要である。
2034年までの予測やその他の分析から、商業的な展望が明らかになる
-
2034年までの収益予測に加え、最近の実績、成長率、市場シェアも提供している。
-
ビジネスの展望や展開など、独自の分析が掲載されている。
-
定性的分析(市場ダイナミクス、促進要因、機会、阻害要因、課題など)、コスト構造、液体バイオ燃料価格上昇の影響、最近の動向などをご覧いただけます。
本レポートには、COVID-19が業界と貴社にどのような影響を与えるかについてのデータ分析と貴重な洞察が含まれている。本レポートでは、COVID-19の4つの回収パターンとその影響、すなわち「V」、「L」、「W」、「U」について論じている。
レポート対象セグメント
バイオエタノール別市場セグメント
-
第一世代バイオエタノール
-
第二世代バイオエタノール
用途別市場セグメント
バイオディーゼル別市場セグメント
-
菜種メチルエステル(RME)
-
大豆メチルエステル(SME)
-
脂肪酸メチルエステル(FAME)
-
その他のバイオディーゼル
再生可能ディーゼル別市場セグメント
-
加水分解植物油(HVO)
-
フィッシャー・トロプシュ(FT)ディーゼル
-
バイオブタノール
-
バイオジェット燃料
-
その他の再生可能ディーゼル
タイプ別市場セグメント
-
バイオエタノール
-
バイオディーゼル
-
再生可能ディーゼル
-
バイオメタノール
-
バイオプロパノール
-
その他のタイプ
世界市場全体とセグメント別の収益予測に加え、4つの地域と20の主要国市場の収益予測も掲載しています:
北米
欧州
-
ドイツ
-
スペイン
-
イギリス
-
フランス
-
イタリア
-
その他の欧州
アジア太平洋
-
中国
-
日本
-
インド
-
オーストラリア
-
韓国
-
その他のアジア太平洋
ラテンアメリカ
中東・アフリカ
世界市場全体とセグメント別の収益予測に加え、4つの地域と20の主要国市場の収益予測も掲載しています:
主要企業と市場成長の可能性
-
Algenol
-
Archer-Daniels-Midland Company
-
Bangchak Corporation Public Company Limited (BCP)
-
Bio-Oils Energy
-
Bunge Global SA
-
Cargill, Incorporated
-
Crop Energies AG
-
Emami Agrotech Limited
-
Eniven Group
-
Fulcrum Bioenergy
-
Green Biologics Ltd
-
POET LLC
-
Renewable Biofuels
-
Renewable Energy Group
-
World Energy Alternatives LLC
2024年から2034年までの液体バイオ燃料市場全体の世界売上高(金額ベース)は、2024年に964億米ドルを突破する。2034年まで力強い収益成長を予測。当調査では、最も大きな可能性を秘めた企業を特定しています。彼らの能力、進歩、商業的展望を発見し、一歩先を行くお手伝いをします。
液体バイオ燃料市場、2024-2034年レポートはどのように役立つのか?
要約すると、390ページを超えるこのレポートは、以下の知識を提供する:
-
液体バイオ燃料市場の2024年から2034年までの収益予測 バイオエタノール、用途、バイオディーゼル、再生可能ディーゼル、タイプ別に世界と地域レベルで予測 - 業界の将来性を発見し、投資と収益に最も有利な場所を見つけることができます。
-
4つの地域と20の主要国市場の2034年までの収益予測 - 北米、欧州、アジア太平洋、中南米、中東・アフリカの液体バイオ燃料市場の2024年から2034年までの予測をご覧ください。また、米国、カナダ、ブラジル、ドイツ、フランス、英国、イタリア、中国、インド、日本、オーストラリアなどの著名経済圏の市場も予測しています。
-
2024年から2034年までの液体バイオ燃料市場に関わる主要企業15社の企業プロファイルを含む。
独自の予測による定量的・定性的分析をご覧ください。私たちのレポートだけに含まれる情報を入手し、貴重なビジネスインテリジェンスで情報を得ることができます。
他にはない情報
私たちの新しいレポートがあれば、知識に遅れをとったり、チャンスを逃したりする可能性が低くなります。弊社のレポートが貴社の調査、分析、意思決定にどのように役立つかをご覧ください。Visiongainの調査は、液体バイオ燃料市場、2024年から2034年、市場をリードする企業の商業分析を必要とするすべての人のためのものです。データ、トレンド、予測をご覧いただけます。
ページTOPに戻る
目次
目次
1 レポート概要
1.1 研究の目的
1.2 液体バイオ燃料市場の紹介
1.3 本レポートの内容
1.4 本レポートを読むべき理由
1.5 本分析レポートが回答する主な質問
1.6 本レポートは誰のためのものか?
1.7 方法論
1.7.1 市場の定義
1.7.2 市場評価・予測手法
1.7.3 データの検証
1.7.3.1 一次調査
1.7.3.2 セカンダリーリサーチ
1.8 よくある質問(FAQ)
1.9 Visiongainの関連レポート
1.10 Visiongainについて
2 エグゼクティブ・サマリー
3 市場概要
3.1 主要な調査結果
3.2 市場ダイナミクス
3.2.1 市場促進要因
3.2.1.1 液体バイオ燃料生産による農村・農業開発への注目の高まり
3.2.1.2 気候変動と環境持続可能性に対する認識と懸念の高まり
3.2.1.3 研究開発投資の増加による技術革新と液体バイオ燃料技術向上の機会創出
3.2.2 市場阻害要因
3.2.2.1 バイオ燃料工場設立の高コストが市場を阻害している。
3.2.2.2 世界的に不透明な経済状況が市場成長を妨げる
3.2.2.3 バイオ燃料生産への食用作物の使用は、食糧安全保障と耕地競合に関する懸念を引き起こす可能性がある。
3.2.3 市場機会
3.2.3.1 バイオ燃料生産プロセスの技術進歩が液体バイオ燃料市場に新たな機会をもたらす
3.2.3.2 発展途上国におけるバイオ燃料市場の拡大
3.2.3.3 バイオ燃料生産者と主要産業との提携、液体バイオ燃料採用の機会
3.3 ポーターのファイブフォース分析
3.3.1 新規参入の脅威(中)
3.3.2 サプライヤーの交渉力(高)
3.3.3 買い手の交渉力(中〜高)
3.3.4 代替品による脅威(低~中)
3.3.5 競争上のライバル(高)
3.4 COVID-19の影響分析
3.4.1 "V字型回復"
3.4.2 "U字型回復"
3.4.3 "W字型回復"
3.4.4 "L字型回復"
3.5 PEST分析
4 液体バイオ燃料市場分析:バイオエタノール別
4.1 主要調査結果
4.2 バイオエタノールセグメント 市場魅力度指数
4.3 バイオエタノール別液体バイオ燃料市場規模の推定と予測
4.4 第一世代バイオエタノール
4.4.1 2024〜2034年の地域別市場規模(US$ Billion)
4.4.2 地域別市場シェア、2024年・2034年(%)
4.5 第二世代バイオエタノール
4.5.1 2024〜2034年の地域別市場規模(US$ Billion)
4.5.2 地域別市場シェア、2024年・2034年(%)
5 液体バイオ燃料市場分析:用途別
5.1 主要調査結果
5.2 用途別セグメント 市場魅力度指数
5.3 用途別液体バイオ燃料市場規模の推定と予測
5.4 輸送
5.4.1 2024〜2034年の地域別市場規模(US$ Billion)
5.4.2 地域別市場シェア、2024年・2034年(%)
5.5 発電
5.5.1 2024年〜2034年の地域別市場規模(US$ Billion)
5.5.2 地域別市場シェア、2024年・2034年(%)
5.6 熱発電
5.6.1 2024〜2034年の地域別市場規模(US$ Billion)
5.6.2 地域別市場シェア、2024年・2034年(%)
6 液体バイオ燃料市場分析:バイオディーゼル別
6.1 主要調査結果
6.2 バイオディーゼル・セグメント 市場魅力度指数
6.3 バイオディーゼル別液体バイオ燃料市場規模の推定と予測
6.4 菜種メチルエステル(RME)
6.4.1 2024〜2034年の地域別市場規模(US$ Billion)
6.4.2 地域別市場シェア、2024年・2034年(%)
6.5 大豆メチルエステル(SME)
6.5.1 2024年~2034年の地域別市場規模(US$ Billion)
6.5.2 地域別市場シェア、2024年・2034年(%)
6.6 脂肪酸メチルエステル(FAME)
6.6.1 2024年~2034年の地域別市場規模(US$ Billion)
6.6.2 地域別市場シェア、2024年・2034年(%)
6.7 その他のバイオディーゼル
6.7.1 2024〜2034年の地域別市場規模(US$ Billion)
6.7.2 地域別市場シェア、2024年・2034年(%)
7 の液体バイオ燃料市場分析:再生可能ディーゼル別
7.1 主要な調査結果
7.2 再生可能ディーゼルセグメント 市場魅力度指数
7.3 再生可能ディーゼル別の液体バイオ燃料市場規模の推定と予測
7.4 水添植物油(HVO)
7.4.1 2024~2034年の地域別市場規模(US$ Billion)
7.4.2 地域別市場シェア、2024年・2034年(%)
7.5 フィッシャー・トロプシュ(FT)ディーゼル
7.5.1 2024~2034年の地域別市場規模(US$ Billion)
7.5.2 地域別市場シェア、2024年・2034年(%)
7.6 バイオブタノール
7.6.1 2024〜2034年の地域別市場規模(US$ Billion)
7.6.2 地域別市場シェア、2024年・2034年(%)
7.7 バイオジェット燃料
7.7.1 2024〜2034年の地域別市場規模(US$ Billion)
7.7.2 地域別市場シェア、2024年・2034年(%)
7.8 その他の再生可能ディーゼル
7.8.1 2024〜2034年の地域別市場規模(US$ Billion)
7.8.2 地域別市場シェア、2024年・2034年(%)
8 液体バイオ燃料市場分析:タイプ別
8.1 主要な調査結果
8.2 タイプ別セグメント 市場魅力度指数
8.3 液体バイオ燃料のタイプ別市場規模推定と予測
8.4 バイオエタノール
8.4.1 2024〜2034年の地域別市場規模(US$ Million)
8.4.2 地域別市場シェア、2024年・2034年(%)
8.5 バイオディーゼル
8.5.1 2024~2034年の地域別市場規模(US$ Million)
8.5.2 地域別市場シェア、2024年・2034年(%)
8.6 再生可能ディーゼル
8.6.1 2024~2034年の地域別市場規模(US$ Million)
8.6.2 地域別市場シェア、2024年・2034年(%)
8.7 バイオメタノール
8.7.1 2024~2034年の地域別市場規模(US$ Million)
8.7.2 地域別市場シェア、2024年・2034年(%)
8.8 バイオプロパノール
8.8.1 2024~2034年の地域別市場規模(US$ Million)
8.8.2 地域別市場シェア、2024年・2034年(%)
8.9 その他のタイプ
8.9.1 2024年~2034年の地域別市場規模(US$ Million)
8.9.2 地域別市場シェア、2024年・2034年(%)
9 液体バイオ燃料市場分析:地域別
9.1 主要な調査結果
9.2 地域別市場規模の推定と予測
10 北米の液体バイオ燃料市場分析
10.1 主要な調査結果
10.2 北米の液体バイオ燃料市場魅力度指数
10.3 北米の液体バイオ燃料国別市場、2024年、2029年、2034年(US$ Billion)
10.4 北米の液体バイオ燃料市場規模推定と予測
10.5 北米の液体バイオ燃料市場規模推定と予測:国別
10.6 北米の液体バイオ燃料市場規模推定と予測:バイオエタノール別
10.7 北米の液体バイオ燃料市場規模推定と予測:用途別
10.8 北米の液体バイオ燃料市場規模推定と予測:バイオディーゼル
10.9 北米の液体バイオ燃料市場規模推定と予測:再生可能ディーゼル別
10.10 北米の液体バイオ燃料市場規模推定と予測:タイプ別
10.11 アメリカの液体バイオ燃料市場分析
10.12 カナダの液体バイオ燃料市場分析
11 欧州の液体バイオ燃料市場分析
11.1 主要な調査結果
11.2 欧州の液体バイオ燃料市場魅力度指数
11.3 欧州の液体バイオ燃料の国別市場、2024年、2029年、2034年(US$ Billion)
11.4 欧州の液体バイオ燃料市場規模推定と予測
11.5 欧州の液体バイオ燃料市場規模推定と予測:国別
11.6 欧州の液体バイオ燃料市場規模推定と予測:バイオエタノール別
11.7 欧州の液体バイオ燃料市場規 模推定と予測:用途別
11.8 欧州の液体バイオ燃料市場規模推定と予測:バイオディーゼル別
11.9 欧州の液体バイオ燃料市場規模推定と予測:再生可能ディーゼル別
11.10 欧州の液体バイオ燃料市場規模推定と予測:タイプ別
11.11 ドイツの液体バイオ燃料市場分析
11.12 イギリスの液体バイオ燃料市場分析
11.13 フランスの液体バイオ燃料市場分析
11.14 イタリアの液体バイオ燃料市場分析
11.15 スペインの液体バイオ燃料市場分析
11.16 その他の欧州の液体バイオ燃料市場分析
12 アジア太平洋の液体バイオ燃料市場分析
12.1 主要な調査結果
12.2 アジア太平洋地域の液体バイオ燃料市場魅力度指数
12.3 アジア太平洋地域の液体バイオ燃料の国別市場、2024年、2029年、2034年(US$ Billion)
12.4 アジア太平洋地域の液体バイオ燃料市場規模の推定と予測
12.5 アジア太平洋地域の液体バイオ燃料市場規模推定と予測:国別
12.6 アジア太平洋地域の液体バイオ燃料市場規模推定と予測:バイオエタノール別
12.7 アジア太平洋地域の液体バイオ燃料市場規模推定と予測:用途別
12.8 アジア太平洋地域の液体バイオ燃料市場規模推定と予測:バイオディーゼル
12.9 アジア太平洋地域の液体バイオ燃料市場規模推定と予測:再生可能ディーゼル別
12.10 アジア太平洋地域の液体バイオ燃料市場規模推定と予測:タイプ別
12.11 中国の液体バイオ燃料市場分析
12.12 インドの液体バイオ燃料市場分析
12.13 日本の液体バイオ燃料市場分析
12.14 韓国の液体バイオ燃料市場分析
12.15 オーストラリアの液体バイオ燃料市場分析
12.16 その他のアジア太平洋地域の液体バイオ燃料市場分析
13 中東・アフリカの液体バイオ燃料市場分析
13.1 主要な調査結果
13.2 中東・アフリカの液体バイオ燃料市場魅力度指数
13.3 中東・アフリカの液体バイオ燃料国別市場、2024年、2029年、2034年(US$ Billion)
13.4 中東・アフリカの液体バイオ燃料市場の推定と予測
13.5 中東・アフリカの液体バイオ燃料市場規模推定と予測:国別
13.6 中東・アフリカの液体バイオ燃料市場規模推定と予測:バイオエタノール別
13.7 中東・アフリカの液体バイオ燃料市場規模推定と予測:用途別
13.8 中東・アフリカの液体バイオ燃料市場規模推定と予測:バイオディーゼル別
13.9 中東・アフリカの液体バイオ燃料市場規模推定と予測:再生可能ディーゼル別
13.10 中東・アフリカの液体バイオ燃料市場規模推定と予測:タイプ別
13.11 GCCの液体バイオ燃料市場分析
13.12 南アフリカの液体バイオ燃料市場分析
13.13 その他の中東・アフリカ液体バイオ燃料市場の分析
14.2 ラテンアメリカ液体バイオ燃料市場魅力度指数
14.3 ラテンアメリカの液体バイオ燃料国別市場、2024年、2029年、2034年(US$ Billion)
14.4 ラテンアメリカの液体バイオ燃料市場規模推定と予測
14.5 ラテンアメリカの液体バイオ燃料市場規模推定と予測:国別
14.6 ラテンアメリカの液体バイオ燃料市場規模推定と予測:バイオエタノール別
14.7 ラテンアメリカの液体バイオ燃料市場規模推定と予測:用途別
14.8 ラテンアメリカの液体バイオ燃料市場規模推定と予測:バイオディーゼル
14.9 ラテンアメリカの液体バイオ燃料市場規模推定と予測:再生可能ディーゼル別
14.10 ラテンアメリカの液体バイオ燃料市場規模推定と予測:タイプ別
14.11 ブラジルの液体バイオ燃料市場分析
14.12 メキシコの液体バイオ燃料市場分析
14.13 その他のラテンアメリカの液体バイオ燃料市場の分析
15 会社概要
15.1 競争環境、2023年
15.2 戦略的展望
15.3 Fulcrum Bioenergy
15.3.1 会社概要
15.3.2 会社概要
15.3.3 製品ベンチマーク
15.3.4 戦略的展望
15.4 Archer-Daniels-Midland Company
15.4.1 会社概要
15.4.2 会社概要
15.4.3 財務分析
15.4.3.1 純収入、2018-2022年
15.4.3.2 R&D、2018-2022年
15.4.3.3 地域別収益シェア、2022年(%)
15.4.3.4 事業セグメント収益シェア、2022年(%)
15.4.4 製品ベンチマーク
15.4.5 戦略的展望
15.5 Renewable Biofuels
15.5.1 会社概要
15.5.2 会社概要
15.5.3 製品ベンチマーク
15.6 POET LLC
15.6.1 会社概要
15.6.2 会社概要
15.6.3 製品ベンチマーク
15.6.4 戦略的展望
15.7 Cargill, Incorporated
15.7.1 会社概要
15.7.2 会社概要
15.7.3 製品ベンチマーク
15.7.4 戦略的展望
15.8 Bangchak Corporation Public Company Limited (BCP)
15.8.1 会社概要
15.8.2 会社概要
15.8.3 製品ベンチマーク
15.8.4 戦略的展望
15.9 Renewable Energy Group
15.9.1 会社概要
15.9.2 会社概要
15.9.3 財務分析
15.9.3.1 純収入、2018-2022年
15.9.3.2 R&D、2018-2022年
15.9.3.3 地域別収益シェア、2022年(%)
15.9.3.4 事業セグメント収益シェア、2022年(%)
15.9.4 製品ベンチマーク
15.9.5 戦略的展望
15.10 Bunge Global SA
15.10.1 会社概要
15.10.2 会社概要
15.10.3 財務分析
15.10.3.1 純収入、2019-2023年
15.10.3.2 R&D、2019-2023年
15.10.3.3 地域別収益シェア、2023年(%)
15.10.3.4 事業セグメント収益シェア、2023年(%)
15.10.4 製品ベンチマーク
15.10.5 戦略的展望
15.11 Green Biologics Ltd
15.11.1 会社概要
15.11.2 会社概要
15.11.3 製品ベンチマーク
15.12 Crop Energies AG
15.12.1 会社概要
15.12.2 会社概要
15.12.3 財務分析
15.12.3.1 純収入、2018-2022年
15.12.4 製品ベンチマーク
15.12.5 戦略的展望
15.13 Algenol
15.13.1 会社概要
15.13.2 会社概要
15.13.3 製品ベンチマーク
15.14 Emami Agrotech Limited
15.14.1 会社概要
15.14.2 会社概要
15.14.3 製品ベンチマーク
15.15 Eniven Group
15.15.1 会社概要
15.15.2 会社概要
15.15.3 製品ベンチマーク
15.16 World Energy Alternatives LLC
15.16.1 会社概要
15.16.2 会社概要
15.16.3 製品ベンチマーク
15.16.4 戦略的展望
15.17 Bio-Oils Energy
15.17.1 会社概要
15.17.2 会社概要
15.17.3 製品ベンチマーク
16 結論と提言
16.1 Visiongainからの結びの言葉
16.2 市場プレイヤーへの提言
ページTOPに戻る
図表リスト
表の一覧
Table 1 Liquid Biofuels Market Snapshot, 2024 & 2034 (US$ Billion, CAGR %)
Table 2 Global Liquid Biofuels Market by Region, 2024-2034 (US$ Bn, AGR (%), CAGR (%)) (V-Shaped Recovery Scenario)
Table 3 Global Liquid Biofuels Market by Region, 2024-2034 (US$ Bn, AGR (%), CAGR (%)) (U-Shaped Recovery Scenario)
Table 4 Global Liquid Biofuels Market by Region, 2024-2034 (US$ Bn, AGR (%), CAGR (%)) (W-Shaped Recovery Scenario)
Table 5 Global Liquid Biofuels Market by Region, 2024-2034 (US$ Bn, AGR (%), CAGR (%)) (L-Shaped Recovery Scenario)
Table 6 Global Liquid Biofuels Market by Bioethanol, 2024-2034 (US$ Bn, AGR (%), CAGR (%))
Table 7 First-generation Bioethanol Market by Region, 2024-2034 (US$ Bn, AGR (%), CAGR (%))
Table 8 Second-generation Bioethanol Market by Region, 2024-2034 (US$ Bn, AGR (%), CAGR (%))
Table 9 Global Liquid Biofuels Market by Application, 2024-2034 (US$ Bn, AGR (%), CAGR (%))
Table 10 Transportation Market by Region, 2024-2034 (US$ Bn, AGR (%), CAGR (%))
Table 11 Power Generation Market by Region, 2024-2034 (US$ Bn, AGR (%), CAGR (%))
Table 12 Heat Generation Market by Region, 2024-2034 (US$ Bn, AGR (%), CAGR (%))
Table 13 Global Liquid Biofuels Market by Biodiesel, 2024-2034 (US$ Bn, AGR (%), CAGR (%))
Table 14 Rapeseed Methyl Ester (RME) Market by Region, 2024-2034 (US$ Bn, AGR (%), CAGR (%))
Table 15 Soybean Methyl Ester (SME) Market by Region, 2024-2034 (US$ Bn, AGR (%), CAGR (%))
Table 16 Fatty Acid Methyl Ester (FAME) Market by Region, 2024-2034 (US$ Bn, AGR (%), CAGR (%))
Table 17 Other Biodiesel Market by Region, 2024-2034 (US$ Bn, AGR (%), CAGR (%))
Table 18 Global Liquid Biofuels Market by Renewable Diesel, 2024-2034 (US$ Bn, AGR (%), CAGR (%))
Table 19 Hydrotreated Vegetable Oil (HVO) Market by Region, 2024-2034 (US$ Bn, AGR (%), CAGR (%))
Table 20 Fischer-Tropsch (FT) Diesel Market by Region, 2024-2034 (US$ Bn, AGR (%), CAGR (%))
Table 21 Biobutanol Market by Region, 2024-2034 (US$ Bn, AGR (%), CAGR (%))
Table 22 Bio Jet Fuel Market by Region, 2024-2034 (US$ Bn, AGR (%), CAGR (%))
Table 23 Other Renewable Diesel Market by Region, 2024-2034 (US$ Bn, AGR (%), CAGR (%))
Table 24 Global Liquid Biofuels Market by Type, 2024-2034 (US$ Bn, AGR (%), CAGR (%))
Table 25 Bioethanol Market by Region, 2024-2034 (US$ Bn, AGR (%), CAGR (%))
Table 26 Biodiesel Market by Region, 2024-2034 (US$ Bn, AGR (%), CAGR (%))
Table 27 Renewable Diesel Market by Region, 2024-2034 (US$ Bn, AGR (%), CAGR (%))
Table 28 Bio methanol Market by Region, 2024-2034 (US$ Bn, AGR (%), CAGR (%))
Table 29 Bio Propanol Market by Region, 2024-2034 (US$ Bn, AGR (%), CAGR (%))
Table 30 Other Type Market by Region, 2024-2034 (US$ Bn, AGR (%), CAGR (%))
Table 31 Global Liquid Biofuels Market by Region, 2024-2034 (US$ Bn, AGR (%), CAGR (%))
Table 32 North America Liquid Biofuels Market by Value, 2024-2034 (US$ Bn, AGR (%), CAGR (%))
Table 33 North America Liquid Biofuels Market by Country, 2024-2034 (US$ Bn, AGR (%), CAGR (%))
Table 34 North America Liquid Biofuels Market by Bioethanol, 2024-2034 (US$ Bn, AGR (%), CAGR (%))
Table 35 North America Liquid Biofuels Market by Application, 2024-2034 (US$ Bn, AGR (%), CAGR (%))
Table 36 North America Liquid Biofuels Market by Biodiesel, 2024-2034 (US$ Bn, AGR (%), CAGR (%))
Table 37 North America Liquid Biofuels Market by Renewable Diesel, 2024-2034 (US$ Bn, AGR (%), CAGR (%))
Table 38 North America Liquid Biofuels Market by Type, 2024-2034 (US$ Bn, AGR (%), CAGR (%))
Table 39 US Liquid Biofuels Market by Value, 2024-2034 (US$ Bn, AGR (%), CAGR (%))
Table 40 Canada Liquid Biofuels Market by Value, 2024-2034 (US$ Bn, AGR (%), CAGR (%))
Table 41 Europe Liquid Biofuels Market by Value, 2024-2034 (US$ Bn, AGR (%), CAGR (%))
Table 42 Europe Liquid Biofuels Market by Country, 2024-2034 (US$ Bn, AGR (%), CAGR (%))
Table 43 Europe Liquid Biofuels Market by Bioethanol, 2024-2034 (US$ Bn, AGR (%), CAGR (%))
Table 44 Europe Liquid Biofuels Market by Application, 2024-2034 (US$ Bn, AGR (%), CAGR (%))
Table 45 Europe Liquid Biofuels Market by Biodiesel, 2024-2034 (US$ Bn, AGR (%), CAGR (%))
Table 46 Europe Liquid Biofuels Market by Renewable Diesel, 2024-2034 (US$ Bn, AGR (%), CAGR (%))
Table 47 Europe Liquid Biofuels Market by Type, 2024-2034 (US$ Bn, AGR (%), CAGR (%))
Table 48 Germany Liquid Biofuels Market by Value, 2024-2034 (US$ Bn, AGR (%), CAGR (%))
Table 49 UK Liquid Biofuels Market by Value, 2024-2034 (US$ Bn, AGR (%), CAGR (%))
Table 50 France Liquid Biofuels Market by Value, 2024-2034 (US$ Bn, AGR (%), CAGR (%))
Table 51 Italy Liquid Biofuels Market by Value, 2024-2034 (US$ Bn, AGR (%), CAGR (%))
Table 52 Spain Liquid Biofuels Market by Value, 2024-2034 (US$ Bn, AGR (%), CAGR (%))
Table 53 Rest of Europe Liquid Biofuels Market by Value, 2024-2034 (US$ Bn, AGR (%), CAGR (%))
Table 54 Asia-Pacific Liquid Biofuels Market by Value, 2024-2034 (US$ Bn, AGR (%), CAGR (%))
Table 55 Asia-Pacific Liquid Biofuels Market by Country, 2024-2034 (US$ Bn, AGR (%), CAGR (%))
Table 56 Asia-Pacific Liquid Biofuels Market by Bioethanol, 2024-2034 (US$ Bn, AGR (%), CAGR (%))
Table 57 Asia-Pacific Liquid Biofuels Market by Application, 2024-2034 (US$ Bn, AGR (%), CAGR (%))
Table 58 Asia-Pacific Liquid Biofuels Market by Biodiesel, 2024-2034 (US$ Bn, AGR (%), CAGR (%))
Table 59 Asia-Pacific Liquid Biofuels Market by Renewable Diesel, 2024-2034 (US$ Bn, AGR (%), CAGR (%))
Table 60 Asia-Pacific Liquid Biofuels Market by Type, 2024-2034 (US$ Bn, AGR (%), CAGR (%))
Table 61 China Liquid Biofuels Market by Value, 2024-2034 (US$ Bn, AGR (%), CAGR (%))
Table 62 India Liquid Biofuels Market by Value, 2024-2034 (US$ Bn, AGR (%), CAGR (%))
Table 63 Japan Liquid Biofuels Market by Value, 2024-2034 (US$ Bn, AGR (%), CAGR (%))
Table 64 South Korea Liquid Biofuels Market by Value, 2024-2034 (US$ Bn, AGR (%), CAGR (%))
Table 65 Australia Liquid Biofuels Market by Value, 2024-2034 (US$ Bn, AGR (%), CAGR (%))
Table 66 Rest of Asia-Pacific Liquid Biofuels Market by Value, 2024-2034 (US$ Bn, AGR (%), CAGR (%))
Table 67 Middle East & Africa Liquid Biofuels Market by Value, 2024-2034 (US$ Bn, AGR (%), CAGR (%))
Table 68 Middle East & Africa Liquid Biofuels Market by Country, 2024-2034 (US$ Bn, AGR (%), CAGR (%))
Table 69 Middle East & Africa Liquid Biofuels Market by Bioethanol, 2024-2034 (US$ Bn, AGR (%), CAGR (%))
Table 70 Middle East & Africa Liquid Biofuels Market by Application, 2024-2034 (US$ Bn, AGR (%), CAGR (%))
Table 71 Middle East & Africa Liquid Biofuels Market by Biodiesel, 2024-2034 (US$ Bn, AGR (%), CAGR (%))
Table 72 Middle East & Africa Liquid Biofuels Market by Renewable Diesel, 2024-2034 (US$ Bn, AGR (%), CAGR (%))
Table 73 Middle East & Africa Liquid Biofuels Market by Type, 2024-2034 (US$ Bn, AGR (%), CAGR (%))
Table 74 GCC Liquid Biofuels Market by Value, 2024-2034 (US$ Bn, AGR (%), CAGR (%))
Table 75 South Africa Liquid Biofuels Market by Value, 2024-2034 (US$ Bn, AGR (%), CAGR (%))
Table 76 Rest of Middle East & Africa Liquid Biofuels Market by Value, 2024-2034 (US$ Bn, AGR (%), CAGR (%))
Table 77 Latin America Liquid Biofuels Market by Value, 2024-2034 (US$ Bn, AGR (%), CAGR (%))
Table 78 Latin America Liquid Biofuels Market by Country, 2024-2034 (US$ Bn, AGR (%), CAGR (%))
Table 79 Latin America Liquid Biofuels Market by Bioethanol, 2024-2034 (US$ Bn, AGR (%), CAGR (%))
Table 80 Latin America Liquid Biofuels Market by Application, 2024-2034 (US$ Bn, AGR (%), CAGR (%))
Table 81 Latin America Liquid Biofuels Market by Biodiesel, 2024-2034 (US$ Bn, AGR (%), CAGR (%))
Table 82 Latin America Liquid Biofuels Market by Renewable Diesel, 2024-2034 (US$ Bn, AGR (%), CAGR (%))
Table 83 Latin America Liquid Biofuels Market by Type, 2024-2034 (US$ Bn, AGR (%), CAGR (%))
Table 84 Brazil Liquid Biofuels Market by Value, 2024-2034 (US$ Bn, AGR (%), CAGR (%))
Table 85 Mexico Liquid Biofuels Market by Value, 2024-2034 (US$ Bn, AGR (%), CAGR (%))
Table 86 Rest of Latin America Liquid Biofuels Market by Value, 2024-2034 (US$ Bn, AGR (%), CAGR (%))
Table 87 Strategic Outlook - Contract
Table 88 Fulcrum Bioenergy: Key Details, (CEO, HQ, Revenue, Founded, No. of Employees, Company Type, Website, Business Segment)
Table 89 Fulcrum Bioenergy: Product Benchmarking
Table 90 Fulcrum Bioenergy: Strategic Outlook
Table 91 Archer-Daniels-Midland Company: Key Details, (CEO, HQ, Revenue, Founded, No. of Employees, Company Type, Website, Business Segment)
Table 92 Archer-Daniels-Midland Company: Product Benchmarking
Table 93 Archer-Daniels-Midland Company: Strategic Outlook
Table 94 Renewable Biofuels: Key Details, (CEO, HQ, Revenue, Founded, No. of Employees, Company Type, Website, Business Segment)
Table 95 Renewable Biofuels: Product Benchmarking
Table 96 POET LLC: Key Details, (CEO, HQ, Revenue, Founded, No. of Employees, Company Type, Website, Business Segment)
Table 97 POET LLC: Product Benchmarking
Table 98 POET LLC: Strategic Outlook
Table 99 Cargill, Incorporated: Key Details, (CEO, HQ, Revenue, Founded, No. of Employees, Company Type, Website, Business Segment)
Table 100 Cargill, Incorporated: Product Benchmarking
Table 101 Cargill, Incorporated: Strategic Outlook
Table 102 Bangchak Corporation Public Company Limited (BCP),: Key Details, (CEO, HQ, Revenue, Founded, No. of Employees, Company Type, Website, Business Segment)
Table 103 Bangchak Corporation Public Company Limited (BCP),: Product Benchmarking
Table 104 Bangchak Corporation Public Company Limited (BCP),: Strategic Outlook
Table 105 Renewable Energy Group: Key Details, (CEO, HQ, Revenue, Founded, No. of Employees, Company Type, Website, Business Segment)
Table 106 Renewable Energy Group: Product Benchmarking
Table 107 Renewable Energy Group: Strategic Outlook
Table 108 Bunge Global SA: Key Details, (CEO, HQ, Revenue, Founded, No. of Employees, Company Type, Website, Business Segment)
Table 109 Bunge Global SA: Product Benchmarking
Table 110 Bunge Global SA: Strategic Outlook
Table 111 Green Biologics Ltd: Key Details, (CEO, HQ, Revenue, Founded, No. of Employees, Company Type, Website, Business Segment)
Table 112 Green Biologics Ltd: Product Benchmarking
Table 113 Crop Energies AG: Key Details, (CEO, HQ, Revenue, Founded, No. of Employees, Company Type, Website, Business Segment)
Table 114 Crop Energies AG: Product Benchmarking
Table 115 Crop Energies AG: Strategic Outlook
Table 116 Algenol: Key Details, (CEO, HQ, Revenue, Founded, No. of Employees, Company Type, Website, Business Segment)
Table 117 Algenol: Product Benchmarking
Table 118 Emami Agrotech Limited: Key Details, (CEO, HQ, Revenue, Founded, No. of Employees, Company Type, Website, Business Segment)
Table 119 Emami Agrotech Limited: Product Benchmarking
Table 120 Eniven Group: Key Details, (CEO, HQ, Revenue, Founded, No. of Employees, Company Type, Website, Business Segment)
Table 121 Eniven Group: Product Benchmarking
Table 122 World Energy Alternatives LLC: Key Details, (CEO, HQ, Revenue, Founded, No. of Employees, Company Type, Website, Business Segment)
Table 123 World Energy Alternatives LLC: Product Benchmarking
Table 124 World Energy Alternatives LLC: Strategic Outlook
Table 125 KKK: Key Details, (CEO, HQ, Revenue, Founded, No. of Employees, Company Type, Website, Business Segment)
Table 126 Bio-Oils Energy: Product Benchmarking
図の一覧
Figure 1 Liquid Biofuels Market Segmentation
Figure 2 Liquid Biofuels Market by Bioethanol: Market Attractiveness Index
Figure 3 Liquid Biofuels Market by Application: Market Attractiveness Index
Figure 4 Liquid Biofuels Market by Biodiesel: Market Attractiveness Index
Figure 5 Liquid Biofuels Market by Renewable Diesel: Market Attractiveness Index
Figure 6 Liquid Biofuels Market by Type: Market Attractiveness Index
Figure 7 Liquid Biofuels Market Attractiveness Index by Region
Figure 8 Liquid Biofuels Market: Market Dynamics
Figure 9 Liquid Biofuels Market: Porter’s Five Forces Analysis
Figure 10 Global Liquid Biofuels Market Share Forecast by COVID, 2024-2034 (%)
Figure 11 Global Liquid Biofuels Market by Region, 2024-2034 (US$ Bn, AGR (%)) (V-Shaped Recovery Scenario)
Figure 12 Global Liquid Biofuels Market by Region, 2024-2034 (US$ Bn, AGR (%)) (U-Shaped Recovery Scenario)
Figure 13 Global Liquid Biofuels Market by Region, 2024-2034 (US$ Bn, AGR (%)) (W-Shaped Recovery Scenario)
Figure 14 Global Liquid Biofuels Market by Region, 2024-2034 (US$ Bn, AGR (%)) (L-Shaped Recovery Scenario)
Figure 15 Liquid Biofuels Market: PEST Analysis
Figure 16 Liquid Biofuels Market by Bioethanol: Market Attractiveness Index
Figure 17 Global Liquid Biofuels Market by Bioethanol, 2024-2034 (US$ Bn, AGR (%))
Figure 18 Liquid Biofuels Market Share Forecast by Bioethanol, 2024, 2029, 2034 (%)
Figure 19 First-generation Bioethanol Market by Region, 2024-2034 (US$ Bn, AGR (%))
Figure 20 First-generation Bioethanol Market Share Forecast by Region, 2024 & 2034 (%)
Figure 21 Second-generation Bioethanol Market by Region, 2024-2034 (US$ Bn, AGR (%))
Figure 22 Second-generation Bioethanol Market Share Forecast by Region, 2024 & 2034 (%)
Figure 23 Liquid Biofuels Market by Application: Market Attractiveness Index
Figure 24 Global Liquid Biofuels Market by Application, 2024-2034 (US$ Bn, AGR (%))
Figure 25 Liquid Biofuels Market Share Forecast by Application, 2024, 2029, 2034 (%)
Figure 26 Transportation Market by Region, 2024-2034 (US$ Bn, AGR (%))
Figure 27 Transportation Market Share Forecast by Region, 2024 & 2034 (%)
Figure 28 Power Generation Market by Region, 2024-2034 (US$ Bn, AGR (%))
Figure 29 Power Generation Market Share Forecast by Region, 2024 & 2034 (%)
Figure 30 Heat Generation Market by Region, 2024-2034 (US$ Bn, AGR (%))
Figure 31 Heat Generation Market Share Forecast by Region, 2024 & 2034 (%)
Figure 32 Liquid Biofuels Market by Biodiesel: Market Attractiveness Index
Figure 33 Global Liquid Biofuels Market by Biodiesel, 2024-2034 (US$ Bn, AGR (%))
Figure 34 Liquid Biofuels Market Share Forecast by Biodiesel, 2024, 2029, 2034 (%)
Figure 35 Rapeseed Methyl Ester (RME) Market by Region, 2024-2034 (US$ Bn, AGR (%))
Figure 36 Rapeseed Methyl Ester (RME) Market Share Forecast by Region, 2024 & 2034 (%)
Figure 37 Soybean Methyl Ester (SME) Market by Region, 2024-2034 (US$ Bn, AGR (%))
Figure 38 Soybean Methyl Ester (SME) Market Share Forecast by Region, 2024 & 2034 (%)
Figure 39 Fatty Acid Methyl Ester (FAME) Market by Region, 2024-2034 (US$ Bn, AGR (%))
Figure 40 Fatty Acid Methyl Ester (FAME) Market Share Forecast by Region, 2024 & 2034 (%)
Figure 41 Other Biodiesel Market by Region, 2024-2034 (US$ Bn, AGR (%))
Figure 42 Other Biodiesel Market Share Forecast by Region, 2024 & 2034 (%)
Figure 43 Liquid Biofuels Market by Renewable Diesel: Market Attractiveness Index
Figure 44 Global Liquid Biofuels Market by Renewable Diesel, 2024-2034 (US$ Bn, AGR (%))
Figure 45 Liquid Biofuels Market Share Forecast by Renewable Diesel, 2024, 2029, 2034 (%)
Figure 46 Hydrotreated Vegetable Oil (HVO) Market by Region, 2024-2034 (US$ Bn, AGR (%))
Figure 47 Hydrotreated Vegetable Oil (HVO) Market Share Forecast by Region, 2024 & 2034 (%)
Figure 48 Fischer-Tropsch (FT) Diesel Market by Region, 2024-2034 (US$ Bn, AGR (%))
Figure 49 Fischer-Tropsch (FT) Diesel Market Share Forecast by Region, 2024 & 2034 (%)
Figure 50 Biobutanol Market by Region, 2024-2034 (US$ Bn, AGR (%))
Figure 51 Biobutanol Market Share Forecast by Region, 2024 & 2034 (%)
Figure 52 Bio Jet Fuel Market by Region, 2024-2034 (US$ Bn, AGR (%))
Figure 53 Bio Jet Fuel Market Share Forecast by Region, 2024 & 2034 (%)
Figure 54 Other Renewable Diesel Market by Region, 2024-2034 (US$ Bn, AGR (%))
Figure 55 Other Renewable Diesel Market Share Forecast by Region, 2024 & 2034 (%)
Figure 56 Liquid Biofuels Market by Type: Market Attractiveness Index
Figure 57 Global Liquid Biofuels Market by Type, 2024-2034 (US$ Bn, AGR (%))
Figure 58 Liquid Biofuels Market Share Forecast by Type, 2024, 2029, 2034 (%)
Figure 59 Bioethanol Market by Region, 2024-2034 (US$ Bn, AGR (%))
Figure 60 Bioethanol Market Share Forecast by Region, 2024 & 2034 (%)
Figure 61 Biodiesel Market by Region, 2024-2034 (US$ Bn, AGR (%))
Figure 62 Biodiesel Market Share Forecast by Region, 2024 & 2034 (%)
Figure 63 Renewable Diesel Market by Region, 2024-2034 (US$ Bn, AGR (%))
Figure 64 Renewable Diesel Market Share Forecast by Region, 2024 & 2034 (%)
Figure 65 Bio methanol Market by Region, 2024-2034 (US$ Bn, AGR (%))
Figure 66 Bio-methanol Market Share Forecast by Region, 2024 & 2034 (%)
Figure 67 Bio Propanol Market by Region, 2024-2034 (US$ Bn, AGR (%))
Figure 68 Bio Propanol Market Share Forecast by Region, 2024 & 2034 (%)
Figure 69 Other Type Market by Region, 2024-2034 (US$ Bn, AGR (%))
Figure 70 Other Type Market Share Forecast by Region, 2024 & 2034 (%)
Figure 71 Liquid Biofuels Market Forecast by Region 2024 and 2034 (Revenue, CAGR%)
Figure 72 Liquid Biofuels Market Share Forecast by Region 2024, 2029, 2034 (%)
Figure 73 Global Liquid Biofuels Market by Region, 2024-2034 (US$ Bn, AGR (%))
Figure 74 North America Liquid Biofuels Market Attractiveness Index
Figure 75 North America Liquid Biofuels Market by Region, 2024, 2029 & 2034 (US$ Billion)
Figure 76 North America Liquid Biofuels Market by Value, 2024-2034 (US$ Bn, AGR (%))
Figure 77 North America Liquid Biofuels Market by Country, 2024-2034 (US$ Bn, AGR (%))
Figure 78 North America Liquid Biofuels Market Share Forecast by Country, 2024 & 2034 (%)
Figure 79 North America Liquid Biofuels Market by Bioethanol, 2024-2034 (US$ Bn, AGR (%))
Figure 80 North America Liquid Biofuels Market Share Forecast Bioethanol, 2024 & 2034 (%)
Figure 81 North America Liquid Biofuels Market by Application, 2024-2034 (US$ Bn, AGR (%))
Figure 82 North America Liquid Biofuels Market Share Forecast by Application, 2024 & 2034 (%)
Figure 83 North America Liquid Biofuels Market by Biodiesel, 2024-2034 (US$ Bn, AGR (%))
Figure 84 North America Liquid Biofuels Market Share Forecast by Biodiesel, 2024 & 2034 (%)
Figure 85 North America Liquid Biofuels Market by Renewable Diesel, 2024-2034 (US$ Bn, AGR (%))
Figure 86 North America Liquid Biofuels Market Share Forecast by Renewable Diesel, 2024 & 2034 (%)
Figure 87 North America Liquid Biofuels Market by Type, 2024-2034 (US$ Bn, AGR (%))
Figure 88 North America Liquid Biofuels Market Share Forecast by Type, 2024 & 2034 (%)
Figure 89 US Liquid Biofuels Market by Value, 2024-2034 (US$ Bn, AGR (%))
Figure 90 Canada Liquid Biofuels Market by Value, 2024-2034 (US$ Bn, AGR (%))
Figure 91 Europe Liquid Biofuels Market Attractiveness Index
Figure 92 Europe Liquid Biofuels Market by Region, 2024, 2029 & 2034 (US$ Billion)
Figure 93 Europe Liquid Biofuels Market by Value, 2024-2034 (US$ Bn, AGR (%))
Figure 94 Europe Liquid Biofuels Market by Country, 2024-2034 (US$ Bn, AGR (%))
Figure 95 Europe Liquid Biofuels Market Share Forecast by Country, 2024 & 2034 (%)
Figure 96 Europe Liquid Biofuels Market by Bioethanol, 2024-2034 (US$ Bn, AGR (%))
Figure 97 Europe Liquid Biofuels Market Share Forecast Bioethanol, 2024 & 2034 (%)
Figure 98 Europe Liquid Biofuels Market by Application, 2024-2034 (US$ Bn, AGR (%))
Figure 99 Europe Liquid Biofuels Market Share Forecast by Application, 2024 & 2034 (%)
Figure 100 Europe Liquid Biofuels Market by Biodiesel, 2024-2034 (US$ Bn, AGR (%))
Figure 101 Europe Liquid Biofuels Market Share Forecast by Biodiesel, 2024 & 2034 (%)
Figure 102 Europe Liquid Biofuels Market by Renewable Diesel, 2024-2034 (US$ Bn, AGR (%))
Figure 103 Europe Liquid Biofuels Market Share Forecast by Renewable Diesel, 2024 & 2034 (%)
Figure 104 Europe Liquid Biofuels Market by Type, 2024-2034 (US$ Bn, AGR (%))
Figure 105 Europe Liquid Biofuels Market Share Forecast by Type, 2024 & 2034 (%)
Figure 106 Germany Liquid Biofuels Market by Value, 2024-2034 (US$ Bn, AGR (%))
Figure 107 UK Liquid Biofuels Market by Value, 2024-2034 (US$ Bn, AGR (%))
Figure 108 France Liquid Biofuels Market by Value, 2024-2034 (US$ Bn, AGR (%))
Figure 109 Italy Liquid Biofuels Market by Value, 2024-2034 (US$ Bn, AGR (%))
Figure 110 Spain Liquid Biofuels Market by Value, 2024-2034 (US$ Bn, AGR (%))
Figure 111 Rest of Europe Liquid Biofuels Market by Value, 2024-2034 (US$ Bn, AGR (%))
Figure 112 Asia-Pacific Liquid Biofuels Market Attractiveness Index
Figure 113 Asia-Pacific Liquid Biofuels Market by Region, 2024, 2029 & 2034 (US$ Billion)
Figure 114 Asia-Pacific Liquid Biofuels Market by Value, 2024-2034 (US$ Bn, AGR (%))
Figure 115 Asia-Pacific Liquid Biofuels Market by Country, 2024-2034 (US$ Bn, AGR (%))
Figure 116 Asia-Pacific Liquid Biofuels Market Share Forecast by Country, 2024 & 2034 (%)
Figure 117 Asia-Pacific Liquid Biofuels Market by Bioethanol, 2024-2034 (US$ Bn, AGR (%))
Figure 118 Asia-Pacific Liquid Biofuels Market Share Forecast Bioethanol, 2024 & 2034 (%)
Figure 119 Asia-Pacific Liquid Biofuels Market by Application, 2024-2034 (US$ Bn, AGR (%))
Figure 120 Asia-Pacific Liquid Biofuels Market Share Forecast by Application, 2024 & 2034 (%)
Figure 121 Asia-Pacific Liquid Biofuels Market by Biodiesel, 2024-2034 (US$ Bn, AGR (%))
Figure 122 Asia-Pacific Liquid Biofuels Market Share Forecast by Biodiesel, 2024 & 2034 (%)
Figure 123 Asia-Pacific Liquid Biofuels Market by Renewable Diesel, 2024-2034 (US$ Bn, AGR (%))
Figure 124 Asia-Pacific Liquid Biofuels Market Share Forecast by Renewable Diesel, 2024 & 2034 (%)
Figure 125 Asia-Pacific Liquid Biofuels Market by Type, 2024-2034 (US$ Bn, AGR (%))
Figure 126 Asia-Pacific Liquid Biofuels Market Share Forecast by Type, 2024 & 2034 (%)
Figure 127 China Liquid Biofuels Market by Value, 2024-2034 (US$ Bn, AGR (%))
Figure 128 India Liquid Biofuels Market by Value, 2024-2034 (US$ Bn, AGR (%))
Figure 129 Japan Liquid Biofuels Market by Value, 2024-2034 (US$ Bn, AGR (%))
Figure 130 South Korea Liquid Biofuels Market by Value, 2024-2034 (US$ Bn, AGR (%))
Figure 131 Australia Liquid Biofuels Market by Value, 2024-2034 (US$ Bn, AGR (%))
Figure 132 Rest of Asia-Pacific Liquid Biofuels Market by Value, 2024-2034 (US$ Bn, AGR (%))
Figure 133 Middle East and Africa Liquid Biofuels Market Attractiveness Index
Figure 134 Middle East and Africa Liquid Biofuels Market by Region, 2024, 2029 & 2034 (US$ Billion)
Figure 135 Middle East & Africa Liquid Biofuels Market by Value, 2024-2034 (US$ Bn, AGR (%))
Figure 136 Middle East & Africa Liquid Biofuels Market by Country, 2024-2034 (US$ Bn, AGR (%))
Figure 137 Middle East and Africa Liquid Biofuels Market Share Forecast by Country, 2024 & 2034 (%)
Figure 138 Middle East & Africa Liquid Biofuels Market by Bioethanol, 2024-2034 (US$ Bn, AGR (%))
Figure 139 Middle East and Africa Liquid Biofuels Market Share Forecast Bioethanol, 2024 & 2034 (%)
Figure 140 Middle East & Africa Liquid Biofuels Market by Application, 2024-2034 (US$ Bn, AGR (%))
Figure 141 Middle East and Africa Liquid Biofuels Market Share Forecast by Application, 2024 & 2034 (%)
Figure 142 Middle East & Africa Liquid Biofuels Market by Biodiesel, 2024-2034 (US$ Bn, AGR (%))
Figure 143 Middle East and Africa Liquid Biofuels Market Share Forecast by Biodiesel, 2024 & 2034 (%)
Figure 144 Middle East & Africa Liquid Biofuels Market by Renewable Diesel, 2024-2034 (US$ Bn, AGR (%))
Figure 145 Middle East and Africa Liquid Biofuels Market Share Forecast by Renewable Diesel, 2024 & 2034 (%)
Figure 146 Middle East & Africa Liquid Biofuels Market by Type, 2024-2034 (US$ Bn, AGR (%))
Figure 147 Middle East and Africa Liquid Biofuels Market Share Forecast by Type, 2024 & 2034 (%)
Figure 148 GCC Liquid Biofuels Market by Value, 2024-2034 (US$ Bn, AGR (%))
Figure 149 South Africa Liquid Biofuels Market by Value, 2024-2034 (US$ Bn, AGR (%))
Figure 150 Rest of Middle East & Africa Liquid Biofuels Market by Value, 2024-2034 (US$ Bn, AGR (%))
Figure 151 Latin America Liquid Biofuels Market Attractiveness Index
Figure 152 Latin America Liquid Biofuels Market by Region, 2024, 2029 & 2034 (US$ Billion)
Figure 153 Latin America Liquid Biofuels Market by Value, 2024-2034 (US$ Bn, AGR (%)
Figure 154 Latin America Liquid Biofuels Market by Country, 2024-2034 (US$ Bn, AGR (%))
Figure 155 Latin America Liquid Biofuels Market Share Forecast by Country, 2024 & 2034 (%)
Figure 156 Latin America Liquid Biofuels Market by Bioethanol, 2024-2034 (US$ Bn, AGR (%))
Figure 157 Latin America Liquid Biofuels Market Share Forecast Bioethanol, 2024 & 2034 (%)
Figure 158 Latin America Liquid Biofuels Market by Application, 2024-2034 (US$ Bn, AGR (%))
Figure 159 Latin America Liquid Biofuels Market Share Forecast by Application, 2024 & 2034 (%)
Figure 160 Latin America Liquid Biofuels Market by Biodiesel, 2024-2034 (US$ Bn, AGR (%))
Figure 161 Latin America Liquid Biofuels Market Share Forecast by Biodiesel, 2024 & 2034 (%)
Figure 162 Latin America Liquid Biofuels Market by Renewable Diesel, 2024-2034 (US$ Bn, AGR (%))
Figure 163 Latin America Liquid Biofuels Market Share Forecast by Renewable Diesel, 2024 & 2034 (%)
Figure 164 Latin America Liquid Biofuels Market by Type, 2024-2034 (US$ Bn, AGR (%))
Figure 165 Latin America Liquid Biofuels Market Share Forecast by Type, 2024 & 2034 (%)
Figure 166 Brazil Liquid Biofuels Market by Value, 2024-2034 (US$ Bn, AGR (%))
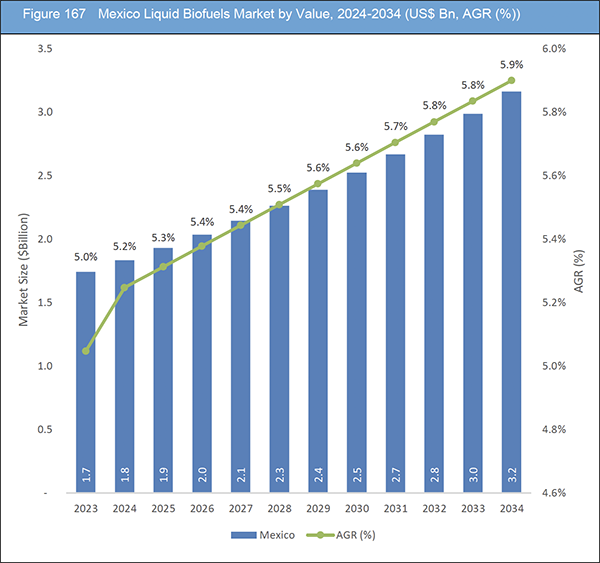
Figure 167 Mexico Liquid Biofuels Market by Value, 2024-2034 (US$ Bn, AGR (%))
Figure 168 Rest of Latin America Liquid Biofuels Market by Value, 2024-2034 (US$ Bn, AGR (%))
Figure 169 Liquid Biofuels Market: Company Share, 2023
Figure 170 Archer-Daniels-Midland Company.: Net Revenue, 2018-2022 (US$ Million, AGR%)
Figure 171 Archer-Daniels-Midland Company.: R&D, 2018-2022 (US$ Million, AGR%)
Figure 172 Archer-Daniels-Midland Company.: Regional Revenue Share, 2022 (%)
Figure 173 Archer-Daniels-Midland Company.: Business Segment Revenue Share, 2022 (%)
Figure 174 Renewable Energy Group.: Net Revenue, 2018-2022 (US$ Million, AGR%)
Figure 175 Renewable Energy Group.: R&D, 2018-2022 (US$ Million, AGR%)
Figure 176 Renewable Energy Group.: Regional Revenue Share, 2022 (%)
Figure 177 Renewable Energy Group.: Business Segment Revenue Share, 2022 (%)
Figure 178 Bunge Global SA.: Net Revenue, 2019-2023 (US$ Million, AGR%)
Figure 179 Bunge Global SA.: R&D, 2019-2023 (US$ Million, AGR%)
Figure 180 Bunge Global SA.: Regional Revenue Share, 2023 (%)
Figure 181 Bunge Global SA.: Business Segment Revenue Share, 2023 (%)
Figure 182 Crop Energies AG.: Net Revenue, 2018-2022 (US$ Million, AGR%)
ページTOPに戻る
Summary
Report Details
The Liquid Biofuels Market Report 2024-2034: This report will prove invaluable to leading firms striving for new revenue pockets if they wish to better understand the industry and its underlying dynamics. It will be useful for companies that would like to expand into different industries or to expand their existing operations in a new region.
Increasing Consumer Awareness of Climate Change and Sustainability Is Fostering Demand for Cleaner Fuel Alternatives
The liquid biofuels market is primarily driven by the imperative to reduce dependency on fossil fuels and mitigate the environmental impact of transportation-related emissions. Government initiatives and regulatory frameworks promoting renewable energy adoption, such as renewable fuel standards and carbon pricing mechanisms, are key drivers shaping market dynamics. Additionally, increasing consumer awareness of climate change and sustainability is fostering demand for cleaner fuel alternatives, propelling investment in biofuel production and infrastructure development.
Amidst growing environmental concerns and evolving regulatory frameworks, the liquid biofuels market presents significant opportunities for stakeholders across the value chain. Technological innovations in feedstock cultivation, conversion processes, and distribution channels offer avenues for enhancing efficiency and reducing production costs. Furthermore, strategic partnerships and collaborations enable knowledge sharing and resource pooling, facilitating market expansion and penetration into new geographies. Moreover, rising investments in research and development are driving advancements in biofuel technologies, unlocking the potential for novel feedstocks and production methods.
Despite the market’s potential, several challenges impede its growth trajectory. Limited availability of feedstocks, competition with food crops, and land use conflicts pose significant hurdles to scaling biofuel production sustainably. Moreover, technological constraints, such as the efficiency of conversion processes and the compatibility of biofuels with existing infrastructure, hinder widespread adoption. Additionally, policy uncertainties and fluctuations in commodity prices create regulatory and financial risks for industry participants, impacting investment decisions and market viability.
High Costs of Setting Up Biofuel Plants Hinder the Market
One obstacle in the next-generation biofuels market is the high production costs associated with biofuel production, necessitating the need for further cost reduction to attain commercial viability. The complex processes involved in converting non-food feedstocks into advanced biofuels often require sophisticated technologies and extensive infrastructure, leading to higher production expenses. To drive widespread adoption and competitiveness, efforts must focus on optimizing production techniques, streamlining supply chains, and exploring economies of scale. Ongoing research and development initiatives, along with supportive policies and investments, are essential to drive cost reduction and make next-generation biofuels economically feasible for large-scale commercial deployment.
What Questions Should You Ask before Buying a Market Research Report?
-
How is the liquid biofuels market evolving?
-
What is driving and restraining the liquid biofuels market?
-
How will each liquid biofuel submarket segment grow over the forecast period and how much revenue will these submarkets account for in 2034?
-
How will the market shares for each liquid biofuel’s submarket develop from 2024 to 2034?
-
What will be the main driver for the overall market from 2024 to 2034?
-
Will leading liquid biofuels markets broadly follow the macroeconomic dynamics, or will individual national markets outperform others?
-
How will the market shares of the national markets change by 2034 and which geographical region will lead the market in 2034?
-
Who are the leading players and what are their prospects over the forecast period?
-
What are the liquid biofuels projects for these leading companies?
-
How will the industry evolve during the period between 2024 and 2034? What are the implications of liquid biofuels projects taking place now and over the next 10 years?
-
Is there a greater need for product commercialisation to further scale the liquid biofuels market?
-
Where is the liquid biofuels market heading and how can you ensure you are at the forefront of the market?
-
What are the best investment options for new product and service lines?
-
What are the key prospects for moving companies into a new growth path and C-suite?
You need to discover how this will impact the liquid biofuels market today, and over the next 10 years:
-
Our 395-page report provides 126 tables and 182 charts/graphs exclusively to you.
-
The report highlights key lucrative areas in the industry so you can target them – NOW.
-
It contains in-depth analysis of global, regional and national sales and growth.
-
It highlights for you the key successful trends, changes and revenue projections made by your competitors.
This report tells you TODAY how the liquid biofuels market will develop in the next 10 years, and in line with the variations in COVID-19 economic recession and bounce. This market is more critical now than at any point over the last 10 years.
Forecasts to 2034 and other analyses reveal commercial prospects
-
In addition to revenue forecasting to 2034, our new study provides you with recent results, growth rates, and market shares.
-
You will find original analyses, with business outlooks and developments.
-
Discover qualitative analyses (including market dynamics, drivers, opportunities, restraints and challenges), cost structure, impact of rising liquid biofuels prices and recent developments.
This report includes data analysis and invaluable insight into how COVID-19 will affect the industry and your company. Four COVID-19 recovery patterns and their impact, namely, “V”, “L”, “W” and “U” are discussed in this report.
Segments Covered in the Report
Market Segment by Bioethanol
-
First-generation Bioethanol
-
Second-generation Bioethanol
Market Segment by Application
-
Transportation
-
Power Generation
-
Heat Generation
Market Segment by Biodiesel
-
Rapeseed Methyl Ester (RME)
-
Soybean Methyl Ester (SME)
-
Fatty Acid Methyl Ester (FAME)
-
Other Biodiesel
Market Segment by Renewable Diesel
-
Hydrotreated Vegetable Oil (HVO)
-
Fischer-Tropsch (FT) Diesel
-
Biobutanol
-
Bio Jet Fuel
-
Other Renewable Diesel
Market Segment by Type
-
Bioethanol
-
Biodiesel
-
Renewable Diesel
-
Biomethanol
-
Bio Propanol
-
Other Type
In addition to the revenue predictions for the overall world market and segments, you will also find revenue forecasts for four regional and 20 leading national markets:
North America
Europe
-
Germany
-
Spain
-
United Kingdom
-
France
-
Italy
-
Rest of Europe
Asia Pacific
-
China
-
Japan
-
India
-
Australia
-
South Korea
-
Rest of Asia Pacific
Latin America
-
Brazil
-
Mexico
-
Rest of Latin America
Middle East & Africa
-
GCC
-
South Africa
-
Rest of Middle East & Africa
The report also includes profiles and for some of the leading companies in the Liquid Biofuels Market, 2024 to 2034, with a focus on this segment of these companies’ operations.
Leading companies and the potential for market growth
-
Algenol
-
Archer-Daniels-Midland Company
-
Bangchak Corporation Public Company Limited (BCP)
-
Bio-Oils Energy
-
Bunge Global SA
-
Cargill, Incorporated
-
Crop Energies AG
-
Emami Agrotech Limited
-
Eniven Group
-
Fulcrum Bioenergy
-
Green Biologics Ltd
-
POET LLC
-
Renewable Biofuels
-
Renewable Energy Group
-
World Energy Alternatives LLC
Overall world revenue for Liquid Biofuels Market, 2024 to 2034 in terms of value the market will surpass US$96.4 billion in 2024, our work calculates. We predict strong revenue growth through to 2034. Our work identifies which organizations hold the greatest potential. Discover their capabilities, progress, and commercial prospects, helping you stay ahead.
How will the Liquid Biofuels Market, 2024 to 2034 report help you?
In summary, our 390+ page report provides you with the following knowledge:
-
Revenue forecasts to 2034 for Liquid Biofuels Market, 2024 to 2034 Market, with forecasts for bioethanol, application, biodiesel, renewable diesel, and type, each forecast at a global and regional level – discover the industry’s prospects, finding the most lucrative places for investments and revenues.
-
Revenue forecasts to 2034 for four regional and 20 key national markets – See forecasts for the Liquid Biofuels Market, 2024 to 2034 market in North America, Europe, Asia-Pacific, Latin America and Middle East & Africa. Also forecasted is the market in the US, Canada, Brazil, Germany, France, UK, Italy, China, India, Japan, and Australia among other prominent economies.
-
Prospects for established firms and those seeking to enter the market – including company profiles for 15 of the major companies involved in the Liquid Biofuels Market, 2024 to 2034.
Find quantitative and qualitative analyses with independent predictions. Receive information that only our report contains, staying informed with invaluable business intelligence.
Information found nowhere else
With our new report, you are less likely to fall behind in knowledge or miss out on opportunities. See how our work could benefit your research, analyses, and decisions. Visiongain’s study is for everybody needing commercial analyses for the Liquid Biofuels Market, 2024 to 2034, market-leading companies. You will find data, trends and predictions.
ページTOPに戻る
Table of Contents
Table of Contents
1 Report Overview
1.1 Objectives of the Study
1.2 Introduction to Liquid Biofuels Market
1.3 What This Report Delivers
1.4 Why You Should Read This Report
1.5 Key Questions Answered by This Analytical Report
1.6 Who Is This Report for?
1.7 Methodology
1.7.1 Market Definitions
1.7.2 Market Evaluation & Forecasting Methodology
1.7.3 Data Validation
1.7.3.1 Primary Research
1.7.3.2 Secondary Research
1.8 Frequently Asked Questions (FAQs)
1.9 Associated Visiongain Reports
1.10 About Visiongain
2 Executive Summary
3 Market Overview
3.1 Key Findings
3.2 Market Dynamics
3.2.1 Market Driving Factors
3.2.1.1 Increasing Focus on Rural and Agricultural Development Through Liquid Biofuel Production
3.2.1.2 Rising Awareness and Concerns About Climate Change And Environmental Sustainability
3.2.1.3 Increasing Investments in Research and Development are Fuelling Innovation and Creating Opportunities for Improved Liquid Biofuel Technologies
3.2.2 Market Restraining Factors
3.2.2.1 High Costs of Setting Up Biofuel Plants Hinder the Market.
3.2.2.2 Uncertain Economic Conditions Globally Hinder the Market Growth
3.2.2.3 The Use of Food Crops for Biofuel Production can Raise Concerns About Food Security and Competition for Arable Land
3.2.3 Market Opportunities
3.2.3.1 Technological Advancements in Biofuel Production Processes are Opening New Opportunities for the Liquid Biofuels Market
3.2.3.2 Expansion of Biofuel Markets In Developing Economies
3.2.3.3 Collaborations, Partnership Between Biofuel Producers and Major Industries, Opportunities for the Adoption of Liquid Biofuels
3.3 Porter’s Five Forces Analysis
3.3.1 Threat of New Entrants (Moderate)
3.3.2 Bargaining Power of Suppliers (High)
3.3.3 Bargaining Power of Buyers (Moderate to High)
3.3.4 Threat from Substitutes (Low to Moderate)
3.3.5 Competitive Rivalry (High)
3.4 COVID-19 Impact Analysis
3.4.1 “V-Shaped Recovery”
3.4.2 “U-Shaped Recovery”
3.4.3 “W-Shaped Recovery”
3.4.4 “L-Shaped Recovery”
3.5 PEST Analysis
4 Liquid Biofuels Market Analysis by Bioethanol
4.1 Key Findings
4.2 Bioethanol Segment: Market Attractiveness Index
4.3 Liquid Biofuels Market Size Estimation and Forecast by Bioethanol
4.4 First-generation Bioethanol
4.4.1 Market Size by Region, 2024-2034 (US$ Billion)
4.4.2 Market Share by Region, 2024 & 2034 (%)
4.5 Second-generation Bioethanol
4.5.1 Market Size by Region, 2024-2034 (US$ Billion)
4.5.2 Market Share by Region, 2024 & 2034 (%)
5 Liquid Biofuels Market Analysis by Application
5.1 Key Findings
5.2 Application Segment: Market Attractiveness Index
5.3 Liquid Biofuels Market Size Estimation and Forecast by Application
5.4 Transportation
5.4.1 Market Size by Region, 2024-2034 (US$ Billion)
5.4.2 Market Share by Region, 2024 & 2034 (%)
5.5 Power Generation
5.5.1 Market Size by Region, 2024-2034 (US$ Billion)
5.5.2 Market Share by Region, 2024 & 2034 (%)
5.6 Heat Generation
5.6.1 Market Size by Region, 2024-2034 (US$ Billion)
5.6.2 Market Share by Region, 2024 & 2034 (%)
6 Liquid Biofuels Market Analysis by Biodiesel
6.1 Key Findings
6.2 Biodiesel Segment: Market Attractiveness Index
6.3 Liquid Biofuels Market Size Estimation and Forecast by Biodiesel
6.4 Rapeseed Methyl Ester (RME)
6.4.1 Market Size by Region, 2024-2034 (US$ Billion)
6.4.2 Market Share by Region, 2024 & 2034 (%)
6.5 Soybean Methyl Ester (SME)
6.5.1 Market Size by Region, 2024-2034 (US$ Billion)
6.5.2 Market Share by Region, 2024 & 2034 (%)
6.6 Fatty Acid Methyl Ester (FAME)
6.6.1 Market Size by Region, 2024-2034 (US$ Billion)
6.6.2 Market Share by Region, 2024 & 2034 (%)
6.7 Other Biodiesel
6.7.1 Market Size by Region, 2024-2034 (US$ Billion)
6.7.2 Market Share by Region, 2024 & 2034 (%)
7 Liquid Biofuels Market Analysis by Renewable Diesel
7.1 Key Findings
7.2 Renewable Diesel Segment: Market Attractiveness Index
7.3 Liquid Biofuels Market Size Estimation and Forecast by Renewable Diesel
7.4 Hydrotreated Vegetable Oil (HVO)
7.4.1 Market Size by Region, 2024-2034 (US$ Billion)
7.4.2 Market Share by Region, 2024 & 2034 (%)
7.5 Fischer-Tropsch (FT) Diesel
7.5.1 Market Size by Region, 2024-2034 (US$ Billion)
7.5.2 Market Share by Region, 2024 & 2034 (%)
7.6 Biobutanol
7.6.1 Market Size by Region, 2024-2034 (US$ Billion)
7.6.2 Market Share by Region, 2024 & 2034 (%)
7.7 Bio Jet Fuel
7.7.1 Market Size by Region, 2024-2034 (US$ Billion)
7.7.2 Market Share by Region, 2024 & 2034 (%)
7.8 Other Renewable Diesel
7.8.1 Market Size by Region, 2024-2034 (US$ Billion)
7.8.2 Market Share by Region, 2024 & 2034 (%)
8 Liquid Biofuels Market Analysis by Type
8.1 Key Findings
8.2 Type Segment: Market Attractiveness Index
8.3 Liquid Biofuels Market Size Estimation and Forecast by Type
8.4 Bioethanol
8.4.1 Market Size by Region, 2024-2034 (US$ Million)
8.4.2 Market Share by Region, 2024 & 2034 (%)
8.5 Biodiesel
8.5.1 Market Size by Region, 2024-2034 (US$ Million)
8.5.2 Market Share by Region, 2024 & 2034 (%)
8.6 Renewable Diesel
8.6.1 Market Size by Region, 2024-2034 (US$ Million)
8.6.2 Market Share by Region, 2024 & 2034 (%)
8.7 Bio-methanol
8.7.1 Market Size by Region, 2024-2034 (US$ Million)
8.7.2 Market Share by Region, 2024 & 2034 (%)
8.8 Bio Propanol
8.8.1 Market Size by Region, 2024-2034 (US$ Million)
8.8.2 Market Share by Region, 2024 & 2034 (%)
8.9 Other Type
8.9.1 Market Size by Region, 2024-2034 (US$ Million)
8.9.2 Market Share by Region, 2024 & 2034 (%)
9 Liquid Biofuels Market Analysis by Region
9.1 Key Findings
9.2 Regional Market Size Estimation and Forecast
10 North America Liquid Biofuels Market Analysis
10.1 Key Findings
10.2 North America Liquid Biofuels Market Attractiveness Index
10.3 North America Liquid Biofuels Market by Country, 2024, 2029 & 2034 (US$ Billion)
10.4 North America Liquid Biofuels Market Size Estimation and Forecast
10.5 North America Liquid Biofuels Market Size Estimation and Forecast by Country
10.6 North America Liquid Biofuels Market Size Estimation and Forecast by Bioethanol
10.7 North America Liquid Biofuels Market Size Estimation and Forecast by Application
10.8 North America Liquid Biofuels Market Size Estimation and Forecast by Biodiesel
10.9 North America Liquid Biofuels Market Size Estimation and Forecast by Renewable Diesel
10.10 North America Liquid Biofuels Market Size Estimation and Forecast by Type
10.11 U.S. Liquid Biofuels Market Analysis
10.12 Canada Liquid Biofuels Market Analysis
11 Europe Liquid Biofuels Market Analysis
11.1 Key Findings
11.2 Europe Liquid Biofuels Market Attractiveness Index
11.3 Europe Liquid Biofuels Market by Country, 2024, 2029 & 2034 (US$ Billion)
11.4 Europe Liquid Biofuels Market Size Estimation and Forecast
11.5 Europe Liquid Biofuels Market Size Estimation and Forecast by Country
11.6 Europe Liquid Biofuels Market Size Estimation and Forecast by Bioethanol
11.7 Europe Liquid Biofuels Market Size Estimation and Forecast by Application
11.8 Europe Liquid Biofuels Market Size Estimation and Forecast by Biodiesel
11.9 Europe Liquid Biofuels Market Size Estimation and Forecast by Renewable Diesel
11.10 Europe Liquid Biofuels Market Size Estimation and Forecast by Type
11.11 Germany Liquid Biofuels Market Analysis
11.12 UK Liquid Biofuels Market Analysis
11.13 France Liquid Biofuels Market Analysis
11.14 Italy Liquid Biofuels Market Analysis
11.15 Spain Liquid Biofuels Market Analysis
11.16 Rest of Europe Liquid Biofuels Market Analysis
12 Asia-Pacific Liquid Biofuels Market Analysis
12.1 Key Findings
12.2 Asia-Pacific Liquid Biofuels Market Attractiveness Index
12.3 Asia-Pacific Liquid Biofuels Market by Country, 2024, 2029 & 2034 (US$ Billion)
12.4 Asia-Pacific Liquid Biofuels Market Size Estimation and Forecast
12.5 Asia-Pacific Liquid Biofuels Market Size Estimation and Forecast by Country
12.6 Asia-Pacific Liquid Biofuels Market Size Estimation and Forecast by Bioethanol
12.7 Asia-Pacific Liquid Biofuels Market Size Estimation and Forecast by Application
12.8 Asia-Pacific Liquid Biofuels Market Size Estimation and Forecast by Biodiesel
12.9 Asia-Pacific Liquid Biofuels Market Size Estimation and Forecast by Renewable Diesel
12.10 Asia-Pacific Liquid Biofuels Market Size Estimation and Forecast by Type
12.11 China Liquid Biofuels Market Analysis
12.12 India Liquid Biofuels Market Analysis
12.13 Japan Liquid Biofuels Market Analysis
12.14 South Korea Liquid Biofuels Market Analysis
12.15 Australia Liquid Biofuels Market Analysis
12.16 Rest of Asia-Pacific Liquid Biofuels Market Analysis
13 Middle East and Africa Liquid Biofuels Market Analysis
13.1 Key Findings
13.2 Middle East and Africa Liquid Biofuels Market Attractiveness Index
13.3 Middle East and Africa Liquid Biofuels Market by Country, 2024, 2029 & 2034 (US$ Billion)
13.4 Middle East and Africa Liquid Biofuels Market Size Estimation and Forecast
13.5 Middle East and Africa Liquid Biofuels Market Size Estimation and Forecast by Country
13.6 Middle East and Africa Liquid Biofuels Market Size Estimation and Forecast by Bioethanol
13.7 Middle East and Africa Liquid Biofuels Market Size Estimation and Forecast by Application
13.8 Middle East and Africa Liquid Biofuels Market Size Estimation and Forecast by Biodiesel
13.9 Middle East and Africa Liquid Biofuels Market Size Estimation and Forecast by Renewable Diesel
13.10 Middle East and Africa Liquid Biofuels Market Size Estimation and Forecast by Type
13.11 GCC Liquid Biofuels Market Analysis
13.12 South Africa Liquid Biofuels Market Analysis
13.13 Rest of Middle East & Africa Liquid Biofuels Market Analysis
14.2 Latin America Liquid Biofuels Market Attractiveness Index
14.3 Latin America Liquid Biofuels Market by Country, 2024, 2029 & 2034 (US$ Billion)
14.4 Latin America Liquid Biofuels Market Size Estimation and Forecast
14.5 Latin America Liquid Biofuels Market Size Estimation and Forecast by Country
14.6 Latin America Liquid Biofuels Market Size Estimation and Forecast by Bioethanol
14.7 Latin America Liquid Biofuels Market Size Estimation and Forecast by Application
14.8 Latin America Liquid Biofuels Market Size Estimation and Forecast by Biodiesel
14.9 Latin America Liquid Biofuels Market Size Estimation and Forecast by Renewable Diesel
14.10 Latin America Liquid Biofuels Market Size Estimation and Forecast by Type
14.11 Brazil Liquid Biofuels Market Analysis
14.12 Mexico Liquid Biofuels Market Analysis
14.13 Rest of Latin America Liquid Biofuels Market Analysis
15 Company Profiles
15.1 Competitive Landscape, 2023
15.2 Strategic Outlook
15.3 Fulcrum Bioenergy
15.3.1 Company Snapshot
15.3.2 Company Overview
15.3.3 Product Benchmarking
15.3.4 Strategic Outlook
15.4 Archer-Daniels-Midland Company
15.4.1 Company Snapshot
15.4.2 Company Overview
15.4.3 Financial Analysis
15.4.3.1 Net Revenue, 2018-2022
15.4.3.2 R&D, 2018-2022
15.4.3.3 Regional Revenue Share, 2022 (%)
15.4.3.4 Business Segment Revenue Share, 2022 (%)
15.4.4 Product Benchmarking
15.4.5 Strategic Outlook
15.5 Renewable Biofuels
15.5.1 Company Snapshot
15.5.2 Company Overview
15.5.3 Product Benchmarking
15.6 POET LLC
15.6.1 Company Snapshot
15.6.2 Company Overview
15.6.3 Product Benchmarking
15.6.4 Strategic Outlook
15.7 Cargill, Incorporated
15.7.1 Company Snapshot
15.7.2 Company Overview
15.7.3 Product Benchmarking
15.7.4 Strategic Outlook
15.8 Bangchak Corporation Public Company Limited (BCP),
15.8.1 Company Snapshot
15.8.2 Company Overview
15.8.3 Product Benchmarking
15.8.4 Strategic Outlook
15.9 Renewable Energy Group
15.9.1 Company Snapshot
15.9.2 Company Overview
15.9.3 Financial Analysis
15.9.3.1 Net Revenue, 2018-2022
15.9.3.2 R&D, 2018-2022
15.9.3.3 Regional Revenue Share, 2022 (%)
15.9.3.4 Business Segment Revenue Share, 2022 (%)
15.9.4 Product Benchmarking
15.9.5 Strategic Outlook
15.10 Bunge Global SA
15.10.1 Company Snapshot
15.10.2 Company Overview
15.10.3 Financial Analysis
15.10.3.1 Net Revenue, 2019-2023
15.10.3.2 R&D, 2019-2023
15.10.3.3 Regional Revenue Share, 2023 (%)
15.10.3.4 Business Segment Revenue Share, 2023 (%)
15.10.4 Product Benchmarking
15.10.5 Strategic Outlook
15.11 Green Biologics Ltd
15.11.1 Company Snapshot
15.11.2 Company Overview
15.11.3 Product Benchmarking
15.12 Crop Energies AG
15.12.1 Company Snapshot
15.12.2 Company Overview
15.12.3 Financial Analysis
15.12.3.1 Net Revenue, 2018-2022
15.12.4 Product Benchmarking
15.12.5 Strategic Outlook
15.13 Algenol
15.13.1 Company Snapshot
15.13.2 Company Overview
15.13.3 Product Benchmarking
15.14 Emami Agrotech Limited
15.14.1 Company Snapshot
15.14.2 Company Overview
15.14.3 Product Benchmarking
15.15 Eniven Group
15.15.1 Company Snapshot
15.15.2 Company Overview
15.15.3 Product Benchmarking
15.16 World Energy Alternatives LLC
15.16.1 Company Snapshot
15.16.2 Company Overview
15.16.3 Product Benchmarking
15.16.4 Strategic Outlook
15.17 Bio-Oils Energy
15.17.1 Company Snapshot
15.17.2 Company Overview
15.17.3 Product Benchmarking
16 Conclusion and Recommendations
16.1 Concluding Remarks from Visiongain
16.2 Recommendations for Market Players
ページTOPに戻る
List of Tables/Graphs
List of Tables
Table 1 Liquid Biofuels Market Snapshot, 2024 & 2034 (US$ Billion, CAGR %)
Table 2 Global Liquid Biofuels Market by Region, 2024-2034 (US$ Bn, AGR (%), CAGR (%)) (V-Shaped Recovery Scenario)
Table 3 Global Liquid Biofuels Market by Region, 2024-2034 (US$ Bn, AGR (%), CAGR (%)) (U-Shaped Recovery Scenario)
Table 4 Global Liquid Biofuels Market by Region, 2024-2034 (US$ Bn, AGR (%), CAGR (%)) (W-Shaped Recovery Scenario)
Table 5 Global Liquid Biofuels Market by Region, 2024-2034 (US$ Bn, AGR (%), CAGR (%)) (L-Shaped Recovery Scenario)
Table 6 Global Liquid Biofuels Market by Bioethanol, 2024-2034 (US$ Bn, AGR (%), CAGR (%))
Table 7 First-generation Bioethanol Market by Region, 2024-2034 (US$ Bn, AGR (%), CAGR (%))
Table 8 Second-generation Bioethanol Market by Region, 2024-2034 (US$ Bn, AGR (%), CAGR (%))
Table 9 Global Liquid Biofuels Market by Application, 2024-2034 (US$ Bn, AGR (%), CAGR (%))
Table 10 Transportation Market by Region, 2024-2034 (US$ Bn, AGR (%), CAGR (%))
Table 11 Power Generation Market by Region, 2024-2034 (US$ Bn, AGR (%), CAGR (%))
Table 12 Heat Generation Market by Region, 2024-2034 (US$ Bn, AGR (%), CAGR (%))
Table 13 Global Liquid Biofuels Market by Biodiesel, 2024-2034 (US$ Bn, AGR (%), CAGR (%))
Table 14 Rapeseed Methyl Ester (RME) Market by Region, 2024-2034 (US$ Bn, AGR (%), CAGR (%))
Table 15 Soybean Methyl Ester (SME) Market by Region, 2024-2034 (US$ Bn, AGR (%), CAGR (%))
Table 16 Fatty Acid Methyl Ester (FAME) Market by Region, 2024-2034 (US$ Bn, AGR (%), CAGR (%))
Table 17 Other Biodiesel Market by Region, 2024-2034 (US$ Bn, AGR (%), CAGR (%))
Table 18 Global Liquid Biofuels Market by Renewable Diesel, 2024-2034 (US$ Bn, AGR (%), CAGR (%))
Table 19 Hydrotreated Vegetable Oil (HVO) Market by Region, 2024-2034 (US$ Bn, AGR (%), CAGR (%))
Table 20 Fischer-Tropsch (FT) Diesel Market by Region, 2024-2034 (US$ Bn, AGR (%), CAGR (%))
Table 21 Biobutanol Market by Region, 2024-2034 (US$ Bn, AGR (%), CAGR (%))
Table 22 Bio Jet Fuel Market by Region, 2024-2034 (US$ Bn, AGR (%), CAGR (%))
Table 23 Other Renewable Diesel Market by Region, 2024-2034 (US$ Bn, AGR (%), CAGR (%))
Table 24 Global Liquid Biofuels Market by Type, 2024-2034 (US$ Bn, AGR (%), CAGR (%))
Table 25 Bioethanol Market by Region, 2024-2034 (US$ Bn, AGR (%), CAGR (%))
Table 26 Biodiesel Market by Region, 2024-2034 (US$ Bn, AGR (%), CAGR (%))
Table 27 Renewable Diesel Market by Region, 2024-2034 (US$ Bn, AGR (%), CAGR (%))
Table 28 Bio methanol Market by Region, 2024-2034 (US$ Bn, AGR (%), CAGR (%))
Table 29 Bio Propanol Market by Region, 2024-2034 (US$ Bn, AGR (%), CAGR (%))
Table 30 Other Type Market by Region, 2024-2034 (US$ Bn, AGR (%), CAGR (%))
Table 31 Global Liquid Biofuels Market by Region, 2024-2034 (US$ Bn, AGR (%), CAGR (%))
Table 32 North America Liquid Biofuels Market by Value, 2024-2034 (US$ Bn, AGR (%), CAGR (%))
Table 33 North America Liquid Biofuels Market by Country, 2024-2034 (US$ Bn, AGR (%), CAGR (%))
Table 34 North America Liquid Biofuels Market by Bioethanol, 2024-2034 (US$ Bn, AGR (%), CAGR (%))
Table 35 North America Liquid Biofuels Market by Application, 2024-2034 (US$ Bn, AGR (%), CAGR (%))
Table 36 North America Liquid Biofuels Market by Biodiesel, 2024-2034 (US$ Bn, AGR (%), CAGR (%))
Table 37 North America Liquid Biofuels Market by Renewable Diesel, 2024-2034 (US$ Bn, AGR (%), CAGR (%))
Table 38 North America Liquid Biofuels Market by Type, 2024-2034 (US$ Bn, AGR (%), CAGR (%))
Table 39 US Liquid Biofuels Market by Value, 2024-2034 (US$ Bn, AGR (%), CAGR (%))
Table 40 Canada Liquid Biofuels Market by Value, 2024-2034 (US$ Bn, AGR (%), CAGR (%))
Table 41 Europe Liquid Biofuels Market by Value, 2024-2034 (US$ Bn, AGR (%), CAGR (%))
Table 42 Europe Liquid Biofuels Market by Country, 2024-2034 (US$ Bn, AGR (%), CAGR (%))
Table 43 Europe Liquid Biofuels Market by Bioethanol, 2024-2034 (US$ Bn, AGR (%), CAGR (%))
Table 44 Europe Liquid Biofuels Market by Application, 2024-2034 (US$ Bn, AGR (%), CAGR (%))
Table 45 Europe Liquid Biofuels Market by Biodiesel, 2024-2034 (US$ Bn, AGR (%), CAGR (%))
Table 46 Europe Liquid Biofuels Market by Renewable Diesel, 2024-2034 (US$ Bn, AGR (%), CAGR (%))
Table 47 Europe Liquid Biofuels Market by Type, 2024-2034 (US$ Bn, AGR (%), CAGR (%))
Table 48 Germany Liquid Biofuels Market by Value, 2024-2034 (US$ Bn, AGR (%), CAGR (%))
Table 49 UK Liquid Biofuels Market by Value, 2024-2034 (US$ Bn, AGR (%), CAGR (%))
Table 50 France Liquid Biofuels Market by Value, 2024-2034 (US$ Bn, AGR (%), CAGR (%))
Table 51 Italy Liquid Biofuels Market by Value, 2024-2034 (US$ Bn, AGR (%), CAGR (%))
Table 52 Spain Liquid Biofuels Market by Value, 2024-2034 (US$ Bn, AGR (%), CAGR (%))
Table 53 Rest of Europe Liquid Biofuels Market by Value, 2024-2034 (US$ Bn, AGR (%), CAGR (%))
Table 54 Asia-Pacific Liquid Biofuels Market by Value, 2024-2034 (US$ Bn, AGR (%), CAGR (%))
Table 55 Asia-Pacific Liquid Biofuels Market by Country, 2024-2034 (US$ Bn, AGR (%), CAGR (%))
Table 56 Asia-Pacific Liquid Biofuels Market by Bioethanol, 2024-2034 (US$ Bn, AGR (%), CAGR (%))
Table 57 Asia-Pacific Liquid Biofuels Market by Application, 2024-2034 (US$ Bn, AGR (%), CAGR (%))
Table 58 Asia-Pacific Liquid Biofuels Market by Biodiesel, 2024-2034 (US$ Bn, AGR (%), CAGR (%))
Table 59 Asia-Pacific Liquid Biofuels Market by Renewable Diesel, 2024-2034 (US$ Bn, AGR (%), CAGR (%))
Table 60 Asia-Pacific Liquid Biofuels Market by Type, 2024-2034 (US$ Bn, AGR (%), CAGR (%))
Table 61 China Liquid Biofuels Market by Value, 2024-2034 (US$ Bn, AGR (%), CAGR (%))
Table 62 India Liquid Biofuels Market by Value, 2024-2034 (US$ Bn, AGR (%), CAGR (%))
Table 63 Japan Liquid Biofuels Market by Value, 2024-2034 (US$ Bn, AGR (%), CAGR (%))
Table 64 South Korea Liquid Biofuels Market by Value, 2024-2034 (US$ Bn, AGR (%), CAGR (%))
Table 65 Australia Liquid Biofuels Market by Value, 2024-2034 (US$ Bn, AGR (%), CAGR (%))
Table 66 Rest of Asia-Pacific Liquid Biofuels Market by Value, 2024-2034 (US$ Bn, AGR (%), CAGR (%))
Table 67 Middle East & Africa Liquid Biofuels Market by Value, 2024-2034 (US$ Bn, AGR (%), CAGR (%))
Table 68 Middle East & Africa Liquid Biofuels Market by Country, 2024-2034 (US$ Bn, AGR (%), CAGR (%))
Table 69 Middle East & Africa Liquid Biofuels Market by Bioethanol, 2024-2034 (US$ Bn, AGR (%), CAGR (%))
Table 70 Middle East & Africa Liquid Biofuels Market by Application, 2024-2034 (US$ Bn, AGR (%), CAGR (%))
Table 71 Middle East & Africa Liquid Biofuels Market by Biodiesel, 2024-2034 (US$ Bn, AGR (%), CAGR (%))
Table 72 Middle East & Africa Liquid Biofuels Market by Renewable Diesel, 2024-2034 (US$ Bn, AGR (%), CAGR (%))
Table 73 Middle East & Africa Liquid Biofuels Market by Type, 2024-2034 (US$ Bn, AGR (%), CAGR (%))
Table 74 GCC Liquid Biofuels Market by Value, 2024-2034 (US$ Bn, AGR (%), CAGR (%))
Table 75 South Africa Liquid Biofuels Market by Value, 2024-2034 (US$ Bn, AGR (%), CAGR (%))
Table 76 Rest of Middle East & Africa Liquid Biofuels Market by Value, 2024-2034 (US$ Bn, AGR (%), CAGR (%))
Table 77 Latin America Liquid Biofuels Market by Value, 2024-2034 (US$ Bn, AGR (%), CAGR (%))
Table 78 Latin America Liquid Biofuels Market by Country, 2024-2034 (US$ Bn, AGR (%), CAGR (%))
Table 79 Latin America Liquid Biofuels Market by Bioethanol, 2024-2034 (US$ Bn, AGR (%), CAGR (%))
Table 80 Latin America Liquid Biofuels Market by Application, 2024-2034 (US$ Bn, AGR (%), CAGR (%))
Table 81 Latin America Liquid Biofuels Market by Biodiesel, 2024-2034 (US$ Bn, AGR (%), CAGR (%))
Table 82 Latin America Liquid Biofuels Market by Renewable Diesel, 2024-2034 (US$ Bn, AGR (%), CAGR (%))
Table 83 Latin America Liquid Biofuels Market by Type, 2024-2034 (US$ Bn, AGR (%), CAGR (%))
Table 84 Brazil Liquid Biofuels Market by Value, 2024-2034 (US$ Bn, AGR (%), CAGR (%))
Table 85 Mexico Liquid Biofuels Market by Value, 2024-2034 (US$ Bn, AGR (%), CAGR (%))
Table 86 Rest of Latin America Liquid Biofuels Market by Value, 2024-2034 (US$ Bn, AGR (%), CAGR (%))
Table 87 Strategic Outlook - Contract
Table 88 Fulcrum Bioenergy: Key Details, (CEO, HQ, Revenue, Founded, No. of Employees, Company Type, Website, Business Segment)
Table 89 Fulcrum Bioenergy: Product Benchmarking
Table 90 Fulcrum Bioenergy: Strategic Outlook
Table 91 Archer-Daniels-Midland Company: Key Details, (CEO, HQ, Revenue, Founded, No. of Employees, Company Type, Website, Business Segment)
Table 92 Archer-Daniels-Midland Company: Product Benchmarking
Table 93 Archer-Daniels-Midland Company: Strategic Outlook
Table 94 Renewable Biofuels: Key Details, (CEO, HQ, Revenue, Founded, No. of Employees, Company Type, Website, Business Segment)
Table 95 Renewable Biofuels: Product Benchmarking
Table 96 POET LLC: Key Details, (CEO, HQ, Revenue, Founded, No. of Employees, Company Type, Website, Business Segment)
Table 97 POET LLC: Product Benchmarking
Table 98 POET LLC: Strategic Outlook
Table 99 Cargill, Incorporated: Key Details, (CEO, HQ, Revenue, Founded, No. of Employees, Company Type, Website, Business Segment)
Table 100 Cargill, Incorporated: Product Benchmarking
Table 101 Cargill, Incorporated: Strategic Outlook
Table 102 Bangchak Corporation Public Company Limited (BCP),: Key Details, (CEO, HQ, Revenue, Founded, No. of Employees, Company Type, Website, Business Segment)
Table 103 Bangchak Corporation Public Company Limited (BCP),: Product Benchmarking
Table 104 Bangchak Corporation Public Company Limited (BCP),: Strategic Outlook
Table 105 Renewable Energy Group: Key Details, (CEO, HQ, Revenue, Founded, No. of Employees, Company Type, Website, Business Segment)
Table 106 Renewable Energy Group: Product Benchmarking
Table 107 Renewable Energy Group: Strategic Outlook
Table 108 Bunge Global SA: Key Details, (CEO, HQ, Revenue, Founded, No. of Employees, Company Type, Website, Business Segment)
Table 109 Bunge Global SA: Product Benchmarking
Table 110 Bunge Global SA: Strategic Outlook
Table 111 Green Biologics Ltd: Key Details, (CEO, HQ, Revenue, Founded, No. of Employees, Company Type, Website, Business Segment)
Table 112 Green Biologics Ltd: Product Benchmarking
Table 113 Crop Energies AG: Key Details, (CEO, HQ, Revenue, Founded, No. of Employees, Company Type, Website, Business Segment)
Table 114 Crop Energies AG: Product Benchmarking
Table 115 Crop Energies AG: Strategic Outlook
Table 116 Algenol: Key Details, (CEO, HQ, Revenue, Founded, No. of Employees, Company Type, Website, Business Segment)
Table 117 Algenol: Product Benchmarking
Table 118 Emami Agrotech Limited: Key Details, (CEO, HQ, Revenue, Founded, No. of Employees, Company Type, Website, Business Segment)
Table 119 Emami Agrotech Limited: Product Benchmarking
Table 120 Eniven Group: Key Details, (CEO, HQ, Revenue, Founded, No. of Employees, Company Type, Website, Business Segment)
Table 121 Eniven Group: Product Benchmarking
Table 122 World Energy Alternatives LLC: Key Details, (CEO, HQ, Revenue, Founded, No. of Employees, Company Type, Website, Business Segment)
Table 123 World Energy Alternatives LLC: Product Benchmarking
Table 124 World Energy Alternatives LLC: Strategic Outlook
Table 125 KKK: Key Details, (CEO, HQ, Revenue, Founded, No. of Employees, Company Type, Website, Business Segment)
Table 126 Bio-Oils Energy: Product Benchmarking
List of Figures
Figure 1 Liquid Biofuels Market Segmentation
Figure 2 Liquid Biofuels Market by Bioethanol: Market Attractiveness Index
Figure 3 Liquid Biofuels Market by Application: Market Attractiveness Index
Figure 4 Liquid Biofuels Market by Biodiesel: Market Attractiveness Index
Figure 5 Liquid Biofuels Market by Renewable Diesel: Market Attractiveness Index
Figure 6 Liquid Biofuels Market by Type: Market Attractiveness Index
Figure 7 Liquid Biofuels Market Attractiveness Index by Region
Figure 8 Liquid Biofuels Market: Market Dynamics
Figure 9 Liquid Biofuels Market: Porter’s Five Forces Analysis
Figure 10 Global Liquid Biofuels Market Share Forecast by COVID, 2024-2034 (%)
Figure 11 Global Liquid Biofuels Market by Region, 2024-2034 (US$ Bn, AGR (%)) (V-Shaped Recovery Scenario)
Figure 12 Global Liquid Biofuels Market by Region, 2024-2034 (US$ Bn, AGR (%)) (U-Shaped Recovery Scenario)
Figure 13 Global Liquid Biofuels Market by Region, 2024-2034 (US$ Bn, AGR (%)) (W-Shaped Recovery Scenario)
Figure 14 Global Liquid Biofuels Market by Region, 2024-2034 (US$ Bn, AGR (%)) (L-Shaped Recovery Scenario)
Figure 15 Liquid Biofuels Market: PEST Analysis
Figure 16 Liquid Biofuels Market by Bioethanol: Market Attractiveness Index
Figure 17 Global Liquid Biofuels Market by Bioethanol, 2024-2034 (US$ Bn, AGR (%))
Figure 18 Liquid Biofuels Market Share Forecast by Bioethanol, 2024, 2029, 2034 (%)
Figure 19 First-generation Bioethanol Market by Region, 2024-2034 (US$ Bn, AGR (%))
Figure 20 First-generation Bioethanol Market Share Forecast by Region, 2024 & 2034 (%)
Figure 21 Second-generation Bioethanol Market by Region, 2024-2034 (US$ Bn, AGR (%))
Figure 22 Second-generation Bioethanol Market Share Forecast by Region, 2024 & 2034 (%)
Figure 23 Liquid Biofuels Market by Application: Market Attractiveness Index
Figure 24 Global Liquid Biofuels Market by Application, 2024-2034 (US$ Bn, AGR (%))
Figure 25 Liquid Biofuels Market Share Forecast by Application, 2024, 2029, 2034 (%)
Figure 26 Transportation Market by Region, 2024-2034 (US$ Bn, AGR (%))
Figure 27 Transportation Market Share Forecast by Region, 2024 & 2034 (%)
Figure 28 Power Generation Market by Region, 2024-2034 (US$ Bn, AGR (%))
Figure 29 Power Generation Market Share Forecast by Region, 2024 & 2034 (%)
Figure 30 Heat Generation Market by Region, 2024-2034 (US$ Bn, AGR (%))
Figure 31 Heat Generation Market Share Forecast by Region, 2024 & 2034 (%)
Figure 32 Liquid Biofuels Market by Biodiesel: Market Attractiveness Index
Figure 33 Global Liquid Biofuels Market by Biodiesel, 2024-2034 (US$ Bn, AGR (%))
Figure 34 Liquid Biofuels Market Share Forecast by Biodiesel, 2024, 2029, 2034 (%)
Figure 35 Rapeseed Methyl Ester (RME) Market by Region, 2024-2034 (US$ Bn, AGR (%))
Figure 36 Rapeseed Methyl Ester (RME) Market Share Forecast by Region, 2024 & 2034 (%)
Figure 37 Soybean Methyl Ester (SME) Market by Region, 2024-2034 (US$ Bn, AGR (%))
Figure 38 Soybean Methyl Ester (SME) Market Share Forecast by Region, 2024 & 2034 (%)
Figure 39 Fatty Acid Methyl Ester (FAME) Market by Region, 2024-2034 (US$ Bn, AGR (%))
Figure 40 Fatty Acid Methyl Ester (FAME) Market Share Forecast by Region, 2024 & 2034 (%)
Figure 41 Other Biodiesel Market by Region, 2024-2034 (US$ Bn, AGR (%))
Figure 42 Other Biodiesel Market Share Forecast by Region, 2024 & 2034 (%)
Figure 43 Liquid Biofuels Market by Renewable Diesel: Market Attractiveness Index
Figure 44 Global Liquid Biofuels Market by Renewable Diesel, 2024-2034 (US$ Bn, AGR (%))
Figure 45 Liquid Biofuels Market Share Forecast by Renewable Diesel, 2024, 2029, 2034 (%)
Figure 46 Hydrotreated Vegetable Oil (HVO) Market by Region, 2024-2034 (US$ Bn, AGR (%))
Figure 47 Hydrotreated Vegetable Oil (HVO) Market Share Forecast by Region, 2024 & 2034 (%)
Figure 48 Fischer-Tropsch (FT) Diesel Market by Region, 2024-2034 (US$ Bn, AGR (%))
Figure 49 Fischer-Tropsch (FT) Diesel Market Share Forecast by Region, 2024 & 2034 (%)
Figure 50 Biobutanol Market by Region, 2024-2034 (US$ Bn, AGR (%))
Figure 51 Biobutanol Market Share Forecast by Region, 2024 & 2034 (%)
Figure 52 Bio Jet Fuel Market by Region, 2024-2034 (US$ Bn, AGR (%))
Figure 53 Bio Jet Fuel Market Share Forecast by Region, 2024 & 2034 (%)
Figure 54 Other Renewable Diesel Market by Region, 2024-2034 (US$ Bn, AGR (%))
Figure 55 Other Renewable Diesel Market Share Forecast by Region, 2024 & 2034 (%)
Figure 56 Liquid Biofuels Market by Type: Market Attractiveness Index
Figure 57 Global Liquid Biofuels Market by Type, 2024-2034 (US$ Bn, AGR (%))
Figure 58 Liquid Biofuels Market Share Forecast by Type, 2024, 2029, 2034 (%)
Figure 59 Bioethanol Market by Region, 2024-2034 (US$ Bn, AGR (%))
Figure 60 Bioethanol Market Share Forecast by Region, 2024 & 2034 (%)
Figure 61 Biodiesel Market by Region, 2024-2034 (US$ Bn, AGR (%))
Figure 62 Biodiesel Market Share Forecast by Region, 2024 & 2034 (%)
Figure 63 Renewable Diesel Market by Region, 2024-2034 (US$ Bn, AGR (%))
Figure 64 Renewable Diesel Market Share Forecast by Region, 2024 & 2034 (%)
Figure 65 Bio methanol Market by Region, 2024-2034 (US$ Bn, AGR (%))
Figure 66 Bio-methanol Market Share Forecast by Region, 2024 & 2034 (%)
Figure 67 Bio Propanol Market by Region, 2024-2034 (US$ Bn, AGR (%))
Figure 68 Bio Propanol Market Share Forecast by Region, 2024 & 2034 (%)
Figure 69 Other Type Market by Region, 2024-2034 (US$ Bn, AGR (%))
Figure 70 Other Type Market Share Forecast by Region, 2024 & 2034 (%)
Figure 71 Liquid Biofuels Market Forecast by Region 2024 and 2034 (Revenue, CAGR%)
Figure 72 Liquid Biofuels Market Share Forecast by Region 2024, 2029, 2034 (%)
Figure 73 Global Liquid Biofuels Market by Region, 2024-2034 (US$ Bn, AGR (%))
Figure 74 North America Liquid Biofuels Market Attractiveness Index
Figure 75 North America Liquid Biofuels Market by Region, 2024, 2029 & 2034 (US$ Billion)
Figure 76 North America Liquid Biofuels Market by Value, 2024-2034 (US$ Bn, AGR (%))
Figure 77 North America Liquid Biofuels Market by Country, 2024-2034 (US$ Bn, AGR (%))
Figure 78 North America Liquid Biofuels Market Share Forecast by Country, 2024 & 2034 (%)
Figure 79 North America Liquid Biofuels Market by Bioethanol, 2024-2034 (US$ Bn, AGR (%))
Figure 80 North America Liquid Biofuels Market Share Forecast Bioethanol, 2024 & 2034 (%)
Figure 81 North America Liquid Biofuels Market by Application, 2024-2034 (US$ Bn, AGR (%))
Figure 82 North America Liquid Biofuels Market Share Forecast by Application, 2024 & 2034 (%)
Figure 83 North America Liquid Biofuels Market by Biodiesel, 2024-2034 (US$ Bn, AGR (%))
Figure 84 North America Liquid Biofuels Market Share Forecast by Biodiesel, 2024 & 2034 (%)
Figure 85 North America Liquid Biofuels Market by Renewable Diesel, 2024-2034 (US$ Bn, AGR (%))
Figure 86 North America Liquid Biofuels Market Share Forecast by Renewable Diesel, 2024 & 2034 (%)
Figure 87 North America Liquid Biofuels Market by Type, 2024-2034 (US$ Bn, AGR (%))
Figure 88 North America Liquid Biofuels Market Share Forecast by Type, 2024 & 2034 (%)
Figure 89 US Liquid Biofuels Market by Value, 2024-2034 (US$ Bn, AGR (%))
Figure 90 Canada Liquid Biofuels Market by Value, 2024-2034 (US$ Bn, AGR (%))
Figure 91 Europe Liquid Biofuels Market Attractiveness Index
Figure 92 Europe Liquid Biofuels Market by Region, 2024, 2029 & 2034 (US$ Billion)
Figure 93 Europe Liquid Biofuels Market by Value, 2024-2034 (US$ Bn, AGR (%))
Figure 94 Europe Liquid Biofuels Market by Country, 2024-2034 (US$ Bn, AGR (%))
Figure 95 Europe Liquid Biofuels Market Share Forecast by Country, 2024 & 2034 (%)
Figure 96 Europe Liquid Biofuels Market by Bioethanol, 2024-2034 (US$ Bn, AGR (%))
Figure 97 Europe Liquid Biofuels Market Share Forecast Bioethanol, 2024 & 2034 (%)
Figure 98 Europe Liquid Biofuels Market by Application, 2024-2034 (US$ Bn, AGR (%))
Figure 99 Europe Liquid Biofuels Market Share Forecast by Application, 2024 & 2034 (%)
Figure 100 Europe Liquid Biofuels Market by Biodiesel, 2024-2034 (US$ Bn, AGR (%))
Figure 101 Europe Liquid Biofuels Market Share Forecast by Biodiesel, 2024 & 2034 (%)
Figure 102 Europe Liquid Biofuels Market by Renewable Diesel, 2024-2034 (US$ Bn, AGR (%))
Figure 103 Europe Liquid Biofuels Market Share Forecast by Renewable Diesel, 2024 & 2034 (%)
Figure 104 Europe Liquid Biofuels Market by Type, 2024-2034 (US$ Bn, AGR (%))
Figure 105 Europe Liquid Biofuels Market Share Forecast by Type, 2024 & 2034 (%)
Figure 106 Germany Liquid Biofuels Market by Value, 2024-2034 (US$ Bn, AGR (%))
Figure 107 UK Liquid Biofuels Market by Value, 2024-2034 (US$ Bn, AGR (%))
Figure 108 France Liquid Biofuels Market by Value, 2024-2034 (US$ Bn, AGR (%))
Figure 109 Italy Liquid Biofuels Market by Value, 2024-2034 (US$ Bn, AGR (%))
Figure 110 Spain Liquid Biofuels Market by Value, 2024-2034 (US$ Bn, AGR (%))
Figure 111 Rest of Europe Liquid Biofuels Market by Value, 2024-2034 (US$ Bn, AGR (%))
Figure 112 Asia-Pacific Liquid Biofuels Market Attractiveness Index
Figure 113 Asia-Pacific Liquid Biofuels Market by Region, 2024, 2029 & 2034 (US$ Billion)
Figure 114 Asia-Pacific Liquid Biofuels Market by Value, 2024-2034 (US$ Bn, AGR (%))
Figure 115 Asia-Pacific Liquid Biofuels Market by Country, 2024-2034 (US$ Bn, AGR (%))
Figure 116 Asia-Pacific Liquid Biofuels Market Share Forecast by Country, 2024 & 2034 (%)
Figure 117 Asia-Pacific Liquid Biofuels Market by Bioethanol, 2024-2034 (US$ Bn, AGR (%))
Figure 118 Asia-Pacific Liquid Biofuels Market Share Forecast Bioethanol, 2024 & 2034 (%)
Figure 119 Asia-Pacific Liquid Biofuels Market by Application, 2024-2034 (US$ Bn, AGR (%))
Figure 120 Asia-Pacific Liquid Biofuels Market Share Forecast by Application, 2024 & 2034 (%)
Figure 121 Asia-Pacific Liquid Biofuels Market by Biodiesel, 2024-2034 (US$ Bn, AGR (%))
Figure 122 Asia-Pacific Liquid Biofuels Market Share Forecast by Biodiesel, 2024 & 2034 (%)
Figure 123 Asia-Pacific Liquid Biofuels Market by Renewable Diesel, 2024-2034 (US$ Bn, AGR (%))
Figure 124 Asia-Pacific Liquid Biofuels Market Share Forecast by Renewable Diesel, 2024 & 2034 (%)
Figure 125 Asia-Pacific Liquid Biofuels Market by Type, 2024-2034 (US$ Bn, AGR (%))
Figure 126 Asia-Pacific Liquid Biofuels Market Share Forecast by Type, 2024 & 2034 (%)
Figure 127 China Liquid Biofuels Market by Value, 2024-2034 (US$ Bn, AGR (%))
Figure 128 India Liquid Biofuels Market by Value, 2024-2034 (US$ Bn, AGR (%))
Figure 129 Japan Liquid Biofuels Market by Value, 2024-2034 (US$ Bn, AGR (%))
Figure 130 South Korea Liquid Biofuels Market by Value, 2024-2034 (US$ Bn, AGR (%))
Figure 131 Australia Liquid Biofuels Market by Value, 2024-2034 (US$ Bn, AGR (%))
Figure 132 Rest of Asia-Pacific Liquid Biofuels Market by Value, 2024-2034 (US$ Bn, AGR (%))
Figure 133 Middle East and Africa Liquid Biofuels Market Attractiveness Index
Figure 134 Middle East and Africa Liquid Biofuels Market by Region, 2024, 2029 & 2034 (US$ Billion)
Figure 135 Middle East & Africa Liquid Biofuels Market by Value, 2024-2034 (US$ Bn, AGR (%))
Figure 136 Middle East & Africa Liquid Biofuels Market by Country, 2024-2034 (US$ Bn, AGR (%))
Figure 137 Middle East and Africa Liquid Biofuels Market Share Forecast by Country, 2024 & 2034 (%)
Figure 138 Middle East & Africa Liquid Biofuels Market by Bioethanol, 2024-2034 (US$ Bn, AGR (%))
Figure 139 Middle East and Africa Liquid Biofuels Market Share Forecast Bioethanol, 2024 & 2034 (%)
Figure 140 Middle East & Africa Liquid Biofuels Market by Application, 2024-2034 (US$ Bn, AGR (%))
Figure 141 Middle East and Africa Liquid Biofuels Market Share Forecast by Application, 2024 & 2034 (%)
Figure 142 Middle East & Africa Liquid Biofuels Market by Biodiesel, 2024-2034 (US$ Bn, AGR (%))
Figure 143 Middle East and Africa Liquid Biofuels Market Share Forecast by Biodiesel, 2024 & 2034 (%)
Figure 144 Middle East & Africa Liquid Biofuels Market by Renewable Diesel, 2024-2034 (US$ Bn, AGR (%))
Figure 145 Middle East and Africa Liquid Biofuels Market Share Forecast by Renewable Diesel, 2024 & 2034 (%)
Figure 146 Middle East & Africa Liquid Biofuels Market by Type, 2024-2034 (US$ Bn, AGR (%))
Figure 147 Middle East and Africa Liquid Biofuels Market Share Forecast by Type, 2024 & 2034 (%)
Figure 148 GCC Liquid Biofuels Market by Value, 2024-2034 (US$ Bn, AGR (%))
Figure 149 South Africa Liquid Biofuels Market by Value, 2024-2034 (US$ Bn, AGR (%))
Figure 150 Rest of Middle East & Africa Liquid Biofuels Market by Value, 2024-2034 (US$ Bn, AGR (%))
Figure 151 Latin America Liquid Biofuels Market Attractiveness Index
Figure 152 Latin America Liquid Biofuels Market by Region, 2024, 2029 & 2034 (US$ Billion)
Figure 153 Latin America Liquid Biofuels Market by Value, 2024-2034 (US$ Bn, AGR (%)
Figure 154 Latin America Liquid Biofuels Market by Country, 2024-2034 (US$ Bn, AGR (%))
Figure 155 Latin America Liquid Biofuels Market Share Forecast by Country, 2024 & 2034 (%)
Figure 156 Latin America Liquid Biofuels Market by Bioethanol, 2024-2034 (US$ Bn, AGR (%))
Figure 157 Latin America Liquid Biofuels Market Share Forecast Bioethanol, 2024 & 2034 (%)
Figure 158 Latin America Liquid Biofuels Market by Application, 2024-2034 (US$ Bn, AGR (%))
Figure 159 Latin America Liquid Biofuels Market Share Forecast by Application, 2024 & 2034 (%)
Figure 160 Latin America Liquid Biofuels Market by Biodiesel, 2024-2034 (US$ Bn, AGR (%))
Figure 161 Latin America Liquid Biofuels Market Share Forecast by Biodiesel, 2024 & 2034 (%)
Figure 162 Latin America Liquid Biofuels Market by Renewable Diesel, 2024-2034 (US$ Bn, AGR (%))
Figure 163 Latin America Liquid Biofuels Market Share Forecast by Renewable Diesel, 2024 & 2034 (%)
Figure 164 Latin America Liquid Biofuels Market by Type, 2024-2034 (US$ Bn, AGR (%))
Figure 165 Latin America Liquid Biofuels Market Share Forecast by Type, 2024 & 2034 (%)
Figure 166 Brazil Liquid Biofuels Market by Value, 2024-2034 (US$ Bn, AGR (%))
Figure 167 Mexico Liquid Biofuels Market by Value, 2024-2034 (US$ Bn, AGR (%))
Figure 168 Rest of Latin America Liquid Biofuels Market by Value, 2024-2034 (US$ Bn, AGR (%))
Figure 169 Liquid Biofuels Market: Company Share, 2023
Figure 170 Archer-Daniels-Midland Company.: Net Revenue, 2018-2022 (US$ Million, AGR%)
Figure 171 Archer-Daniels-Midland Company.: R&D, 2018-2022 (US$ Million, AGR%)
Figure 172 Archer-Daniels-Midland Company.: Regional Revenue Share, 2022 (%)
Figure 173 Archer-Daniels-Midland Company.: Business Segment Revenue Share, 2022 (%)
Figure 174 Renewable Energy Group.: Net Revenue, 2018-2022 (US$ Million, AGR%)
Figure 175 Renewable Energy Group.: R&D, 2018-2022 (US$ Million, AGR%)
Figure 176 Renewable Energy Group.: Regional Revenue Share, 2022 (%)
Figure 177 Renewable Energy Group.: Business Segment Revenue Share, 2022 (%)
Figure 178 Bunge Global SA.: Net Revenue, 2019-2023 (US$ Million, AGR%)
Figure 179 Bunge Global SA.: R&D, 2019-2023 (US$ Million, AGR%)
Figure 180 Bunge Global SA.: Regional Revenue Share, 2023 (%)
Figure 181 Bunge Global SA.: Business Segment Revenue Share, 2023 (%)
Figure 182 Crop Energies AG.: Net Revenue, 2018-2022 (US$ Million, AGR%)
ページTOPに戻る
本レポートと同じKEY WORD(bio)の最新刊レポート
よくあるご質問
Visiongain社はどのような調査会社ですか?
英国の調査会社ヴィジョンゲイン社(Visiongain)は、通信とエネルギーのほか、自動車や化学・医薬品、金属など、広範な市場を対象に調査を行っています。自動車市場については、市場全般に関する調査のほ... もっと見る
調査レポートの納品までの日数はどの程度ですか?
在庫のあるものは速納となりますが、平均的には 3-4日と見て下さい。
但し、一部の調査レポートでは、発注を受けた段階で内容更新をして納品をする場合もあります。
発注をする前のお問合せをお願いします。
注文の手続きはどのようになっていますか?
1)お客様からの御問い合わせをいただきます。
2)見積書やサンプルの提示をいたします。
3)お客様指定、もしくは弊社の発注書をメール添付にて発送してください。
4)データリソース社からレポート発行元の調査会社へ納品手配します。
5) 調査会社からお客様へ納品されます。最近は、pdfにてのメール納品が大半です。
お支払方法の方法はどのようになっていますか?
納品と同時にデータリソース社よりお客様へ請求書(必要に応じて納品書も)を発送いたします。
お客様よりデータリソース社へ(通常は円払い)の御振り込みをお願いします。
請求書は、納品日の日付で発行しますので、翌月最終営業日までの当社指定口座への振込みをお願いします。振込み手数料は御社負担にてお願いします。
お客様の御支払い条件が60日以上の場合は御相談ください。
尚、初めてのお取引先や個人の場合、前払いをお願いすることもあります。ご了承のほど、お願いします。
データリソース社はどのような会社ですか?
当社は、世界各国の主要調査会社・レポート出版社と提携し、世界各国の市場調査レポートや技術動向レポートなどを日本国内の企業・公官庁及び教育研究機関に提供しております。
世界各国の「市場・技術・法規制などの」実情を調査・収集される時には、データリソース社にご相談ください。
お客様の御要望にあったデータや情報を抽出する為のレポート紹介や調査のアドバイスも致します。
|
|


