がんワクチン市場レポート:2023-2033
Cancer Vaccines Market Report 2023-2033
レポート詳細
がんワクチン市場レポート 2023-2033 :本レポートは、新たな収益の柱を目指す大手企業にとって、業界とその根底にある力学をより深く理解する上で貴重なものとなろう。異業種への進出や... もっと見る
※上記価格は部署ライセンス(Departmental licence)価格です。
その他の価格についてはデータリソースまでお問合せください。
日本語のページは自動翻訳を利用し作成しています。
実際のレポートは英文のみでご納品いたします。
サマリー
レポート詳細
がんワクチン市場レポート 2023-2033:本レポートは、新たな収益の柱を目指す大手企業にとって、業界とその根底にある力学をより深く理解する上で貴重なものとなろう。異業種への進出や、新たな地域での既存事業の拡大を希望する企業にとっても有用であろう。
がんワクチンの市場機会を創出する医薬品開発への技術導入
がんワクチン開発における人工知能(AI)の導入は、腫瘍学の分野に革命をもたらした。AIを駆使した技術により、研究者は膨大な量の遺伝子データや分子データを解析し、潜在的ながん抗原を特定し、ワクチンに最も適した標的を予測することができる。この合理化されたアプローチは、発見プロセスを加速させ、個々の患者に合わせた個別化がんワクチンを可能にする。さらに、AIアルゴリズムはワクチン製剤の最適化を支援し、その有効性と安全性プロファイルを向上させる。AIの力を活用することで、科学者たちは革新的ながんワクチンの開発と試験を迅速化し、がんとの闘いにおいてより効果的で的を絞った治療への新たな希望を提供することができる。例えば、情報通信技術の分野では、NECが最前線にいる。同社は現在、複雑な社会問題に迅速に対処するため、数十年来の人工知能(AI)能力を着実に向上させている。NECは現在、この獲得した知識を活用して、がん患者に完全に個別化された医薬品を提供するためにAIを活用するという問題に取り組んでいる。
がんワクチンの製造工程における厳しい規制ガイドラインと長期化するスケジュールが業界の成長を阻む可能性が高い
がんワクチンの製造工程は、厳しい規制ガイドラインや長期化するスケジュールなど、いくつかの課題に直面している。これらの要因は、がんワクチンの開発、製造、商業化に大きな影響を与える。
米国食品医薬品局(FDA)や欧州医薬品庁(EMA)などの規制機関は、ワクチンの安全性、有効性、品質を保証するために厳しい要件を課している。広範な文書化、包括的な臨床試験データ、適正製造規範(GMP)の遵守は、規制当局の承認を得るための前提条件である。
がんワクチンの製造工程は本質的に複雑で時間がかかるため、開発から商業化までの期間が長くなる。がんワクチンの開発には、安全性、有効性、免疫原性を確立するために何段階もの臨床試験を実施する必要があります。厳格な規制ガイドラインは、強固な試験デザイン、患者募集、綿密なデータ収集と解析を要求する。このような大規模な臨床試験プロセスは、製造スケジュール全体を大幅に長引かせる可能性がある。
市場調査レポートを購入する前にすべき質問とは?
- がんワクチン市場はどのように進化しているのか?
- 何ががんワクチン市場を牽引し、阻害しているのか?
- 各がんワクチンサブマーケットセグメントは予測期間中にどのように成長し、2033年にはどれくらいの売上を占めるようになるのか?
- 2023年から2033年にかけて、各がんワクチンサブマーケットの市場シェアはどのように推移するのか?
- 2023年から2033年にかけて市場全体を牽引する主な要因は何か?
- 主要ながんワクチン市場はマクロ経済の動きに概ね追随するのか、それとも個々の国別市場が他を凌駕するのか?
- 2033年までに各国市場のシェアはどのように変化し、2033年にはどの地域が市場をリードするのか?
- 主要プレーヤーは誰か、また予測期間中の見通しは?
- これら主要企業のがんワクチンプロジェクトとは?
- 2023年から2033年の間に、業界はどのように発展していくのでしょうか?現在および今後10年間に実施されるがんワクチンプロジェクトにはどのような意味があるのでしょうか?
- がんワクチン市場をさらに拡大するために、製品の商業化の必要性は高まっているのでしょうか?
- がんワクチン市場はどこへ向かい、どのようにすれば市場の最前線に立てるのか?
- 新製品やサービスラインへの最適な投資オプションは何か?
- 企業を新たな成長軌道に乗せ、C-suiteに移行させるための重要な展望とは?
このことが、現在、そして今後10年間のがんワクチン市場にどのような影響を与えるかを知る必要がある:
- 235ページにわたる本レポートでは、97の表と157の図表を掲載しています。
- 本レポートは、業界における主要な有利分野にハイライトを当てているため、今すぐターゲットを絞ることができます。
- 本レポートには、世界、地域、国の売上と成長に関する詳細な分析が含まれています。
- 競合他社が成功した主なトレンド、変化、収益予測をハイライトしています。
本レポートは、がんワクチン市場が今後10年間でどのように発展するか、またCOVID-19の景気後退と好転の変動に合わせてどのように発展するかをお伝えします。この市場は過去10年間のどの時点よりも今が重要である。
2033年までの予測やその他の分析から、商業的な展望が明らかになる
- 2033年までの収益予測に加え、直近の業績、成長率、市場シェアもご覧いただけます。
- ビジネスの展望と展開に関する独自の分析をご覧いただけます。
- 質的分析(市場ダイナミクス、促進要因、機会、阻害要因、課題を含む)、コスト構造、がんワクチン価格上昇の影響、最新動向をご覧いただけます。
本レポートには、COVID-19が業界と貴社にどのような影響を与えるかについてのデータ分析と貴重な洞察が含まれている。本レポートでは、COVID-19の4つの回収パターンとその影響、すなわち「V」、「L」、「W」、「U」について論じている。
レポート対象セグメント
タイプ
- 予防ワクチン
- 治療用ワクチン
技術
- 樹状細胞
- 組み換え
- 抗原/アジュバント
- ウイルスベクターとDNA
- 全細胞
適応症
- 子宮頸がん
- 前立腺がん
- その他の適応
エンドユーザー
- 小児
- 成人
世界市場全体と各分野の収益予測に加え、5つの地域と21の主要国市場の収益予測も掲載しています:
北米
- アメリカ
- カナダ
欧州
- ドイツ
- 英国
- フランス
- スペイン
- イタリア
- ロシア
- その他の欧州
アジア太平洋
- 中国
- 日本
- インド
- オーストラリア
- 韓国
- その他のアジア太平洋地域
ラテンアメリカ
- ブラジル
- メキシコ
- その他のラテンアメリカ
MEA
- GCC
- 南アフリカ
- その他のMEA
また、本レポートでは、がんワクチン市場の2023年から2033年にかけての主要企業のプロファイルと、これらの企業の事業のこのセグメントに焦点を当てている。
主要企業と市場成長の可能性
・ Amgen Inc.
・ AstraZeneca
・ Dendreon Pharmaceuticals LLC
・ F. Hoffmann-La Roche Ltd
・ GSK plc
・ Merck & Co., Inc.
・ Moderna, Inc.
・ OSE Immunotherapeutics
・ Synthaverse S.A. (Biomed-Lublin)
・ Walvax Biotechnology Co. Ltd.
2023年から2033年までのがんワクチン市場全体の世界売上高(金額ベース)は、2023年に80億6,000万米ドルを突破する。2033年まで力強い収益成長を予測。当研究所では、最も大きな可能性を秘めた組織を特定しています。彼らの能力、進歩、商業的展望を発見し、一歩先を行くお手伝いをします。
がんワクチン市場、2023-2033年レポートはどのように役立つのか?
要約すると、230ページを超えるこのレポートは、以下のような知識を提供する:
- がんワクチン市場の2023年~2033年までの収益予測:種類、技術、適応症、エンドユーザー別に世界および地域レベルで予測 - 業界の展望を発見し、投資と収益に最も有利な場所を見つけることができます。
- 5つの地域と21の主要国市場の2033年までの収益予測 - 北米、欧州、アジア太平洋、ラテンアメリカ、MEAのがんワクチン市場2023年から2033年までの市場予測をご覧ください。また、米国、カナダ、メキシコ、ブラジル、ドイツ、フランス、英国、イタリア、中国、インド、日本、オーストラリアなどの主要国の市場も予測しています。
- 既存企業および市場参入を目指す企業の展望 - がんワクチン市場に関わる主要企業10社の企業プロファイルを含む、2023年から2033年までの展望。
独自の予測による定量的・定性的分析をご覧ください。私たちのレポートだけに含まれる情報を入手し、貴重なビジネスインテリジェンスで情報を得ることができます。
他にはない情報
私たちの新しいレポートがあれば、知識に遅れをとったり、チャンスを逃したりする可能性が低くなります。弊社の調査レポートが貴社の調査、分析、意思決定にどのように役立つかをご覧ください。Visiongainのこの調査レポートは、がんワクチン市場(2023年~2033年)の商業分析を必要とするすべての人、市場をリードする企業を対象としています。データ、トレンド、予測をご覧いただけます。
ページTOPに戻る
目次
目次
1 レポート概要
1.1 研究の目的
1.2 はじめに
1.3 本レポートの内容
1.4 本レポートを読むべき理由
1.5 本分析レポートが回答する主な質問
1.6 本レポートは誰のためのものか?
1.7 方法論
1.7.1 市場の定義
1.7.2 市場評価・予測手法
1.7.3 データの検証
1.7.3.1 一次調査
1.7.3.2 セカンダリーリサーチ
1.8 よくある質問(FAQ)
1.9 Visiongainの関連レポート
1.10 Visiongainについて
2 エグゼクティブ・サマリー
3 市場概要
3.1 主要な調査結果
3.2 市場ダイナミクス
3.2.1 市場促進要因
3.2.1.1 がん患者数の増加がワクチン需要を促進する
3.2.1.2 PPPと政府による投資の増加が市場成長を促進する
3.2.2 市場抑制要因
3.2.2.1 がんワクチンの製造工程における厳しい規制ガイドラインと期間延長がもたらす課題
3.2.2.2 個別化医療の進歩が市場成長を妨げる
3.2.3 市場機会
3.2.3.1 有機的・無機的活動の増加ががんワクチン市場の成長を促進する
3.2.3.2 医薬品開発への技術導入ががんワクチンの市場機会を創出する
3.3 COVID-19インパクト分析
3.4 ポーターのファイブフォース分析
3.4.1 サプライヤーの交渉力
3.4.2 買い手の交渉力
3.4.3 競争相手のライバル関係
3.4.4 代替品による脅威
3.4.5 新規参入企業の脅威
3.5 PEST分析
4 がんワクチン市場分析:タイプ別
4.1 主要な調査結果
4.2 タイプ別セグメント 市場魅力度指数
4.3 がんワクチンの種類別市場規模推定と予測
4.4 予防ワクチン
4.4.1 2023〜2033年の地域別市場規模(US$ Million)
4.4.2 地域別市場シェア、2023年・2033年 (%)
4.5 治療用ワクチン
4.5.1 2023〜2033年の地域別市場規模(US$ Million)
4.5.2 地域別市場シェア、2023年・2033年 (%)
5 がんワクチン市場分析:技術別
5.1 主な調査結果
5.2 技術セグメント 市場魅力度指数
5.3 技術別のがんワクチン市場規模推定と予測
5.4 樹状細胞
5.4.1 2023〜2033年の地域別市場規模(US$ Million)
5.4.2 地域別市場シェア、2023年・2033年(%)
5.5 リコンビナント
5.5.1 2023~2033年の地域別市場規模(US$ Million)
5.5.2 地域別市場シェア、2023年・2033年(%)
5.6 抗原/アジュバント
5.6.1 2023~2033年の地域別市場規模(US$ Million)
5.6.2 地域別市場シェア、2023年・2033年(%)
5.7 ウイルスベクターとDNA
5.7.1 2023〜2033年の地域別市場規模(US$ Million)
5.7.2 地域別市場シェア、2023年・2033年(%)
5.8 ホールセル
5.8.1 2023~2033年の地域別市場規模(US$ Million)
5.8.2 地域別市場シェア、2023年および2033年 (%)
6 がんワクチン市場分析:適応症別
6.1 主な調査結果
6.2 適応症セグメント 市場魅力度指数
6.3 がんワクチンの適応症別市場規模推定と予測
6.4 子宮頸がん
6.4.1 2023〜2033年の地域別市場規模(US$ Million)
6.4.2 地域別市場シェア、2023年・2033年 (%)
6.5 前立腺がん
6.5.1 2023〜2033年の地域別市場規模(US$ Million)
6.5.2 地域別市場シェア、2023年・2033年 (%)
6.6 その他の適応症
6.6.1 2023〜2033年の地域別市場規模(US$ Million)
6.6.2 地域別市場シェア、2023年・2033年 (%)
7 がんワクチン市場分析:エンドユーザー別
7.1 主要調査結果
7.2 エンドユーザーセグメント市場魅力度指数
7.3 エンドユーザー別がんワクチン市場規模推定と予測
7.4 小児
7.4.1 2023〜2033年の地域別市場規模(US$ Million)
7.4.2 地域別市場シェア、2023年・2033年(%)
7.5 成人
7.5.1 2023〜2033年の地域別市場規模(US$ Million)
7.5.2 地域別市場シェア、2023年~2033年 (%)
8 がんワクチン市場分析:地域別
8.1 主要な調査結果
8.2 地域別市場規模の推定と予測
9 北米のがんワクチン市場分析
9.1 主要な調査結果
9.2 北米のがんワクチン市場魅力度指数
9.3 北米のがんワクチン国別市場:2023年、2028年、2033年(US$ Million)
9.4 北米のがんワクチン市場規模推定と予測:国別
9.5 北米のがんワクチン市場規模推定と予測:タイプ別
9.6 北米のがんワクチン市場規模推定と予測:技術別
9.7 北米のがんワクチン市場規模推定と予測:適応症別
9.8 北米のがんワクチン市場規模推定と予測:エンドユーザー別
9.9 アメリカのがんワクチン市場分析
9.10 カナダのがんワクチン市場分析
10 欧州のがんワクチン市場分析
10.1 主要な調査結果
10.2 欧州のがんワクチン市場魅力度指数
10.3 欧州のがんワクチン国別市場:2023年、2028年、2033年(US$ Million)
10.4 欧州のがんワクチン市場規模推定と予測:国別
10.5 欧州のがんワクチン市場規模推定と予測:タイプ別
10.6 欧州のがんワクチン市場規模推定と予測:技術別
10.7 欧州のがんワクチン市場規模推定と予測:適応症別
10.8 欧州のがんワクチン市場規模推定と予測:エンドユーザー別
10.9 ドイツのがんワクチン市場分析
10.10 フランスのがんワクチン市場分析
10.11 イギリスのがんワクチン市場の分析
10.12 イタリアのがんワクチン市場の分析
10.13 スペインのがんワクチン市場分析
10.14 ロシアのがんワクチン市場分析
10.15 その他の欧州のがんワクチン市場分析
11 アジア太平洋地域のがんワクチン市場分析
11.1 主要な調査結果
11.2 アジア太平洋地域のがんワクチン市場魅力度指数
11.3 アジア太平洋地域のがんワクチン国別市場:2023年、2028年、2033年(US$ Million)
11.4 アジア太平洋地域のがんワクチン市場規模推定と予測:国別
11.5 アジア太平洋地域のがんワクチン市場規模推定と予測:タイプ別
11.6 アジア太平洋地域のがんワクチン市場規模推定と予測:技術別
11.7 アジア太平洋地域のがんワクチン市場規模推定と予測:適応症別
11.8 アジア太平洋地域のがんワクチン市場規模推定と予測:エンドユーザー別
11.9 日本のがんワクチン市場分析
11.10 中国のがんワクチン市場分析
11.11 インドのがんワクチン市場分析
11.12 オーストラリアのがんワクチン市場分析
11.13 韓国のがんワクチン市場の分析
11.14 その他のアジア太平洋地域のがんワクチン市場分析
12 ラテンアメリカのがんワクチン市場分析
12.1 主要な調査結果
12.2 ラテンアメリカがんワクチン市場魅力度指数
12.3 ラテンアメリカのがんワクチン国別市場:2023年、2028年、2033年(US$ Million)
12.4 ラテンアメリカのがんワクチン市場規模推定と予測:国別
12.5 ラテンアメリカのがんワクチン市場規模推定と予測:タイプ別
12.6 ラテンアメリカのがんワクチン市場規模推定と予測:技術別
12.7 ラテンアメリカのがんワクチン市場規模推定と予測:適応症別
12.8 ラテンアメリカのがんワクチン市場規模推定と予測:エンドユーザー別
12.9 ブラジルのがんワクチン市場分析
12.10メキシコのがんワクチン市場分析
12.11ラテンアメリカのがんワクチン市場分析
13 MEAのがんワクチン市場分析
13.1 主要な調査結果
13.2 MEAのがんワクチン市場魅力度指数
13.3 MEAのがんワクチン国別市場:2023年、2028年、2033年(US$ Million)
13.4 MEAのがんワクチン市場規模推定と予測:国別
13.5 MEAのがんワクチン市場規模推定と予測:対応の件
13.6 MEAのがんワクチン市場規模推定と予測:技術別
13.7 MEAのがんワクチン市場規模推定と予測:適応症別
13.8 MEAのがんワクチン市場規模推定と予測:エンドユーザー別
13.9 GCCのがんワクチン市場分析
13.10 南アフリカのがんワクチン市場分析
13.11 その他のMEAのがんワクチン市場の分析
14 主要企業のプロファイル
14.1 競争環境、2022年
14.2 戦略的展望
14.3 GSK plc
14.3.1 会社概要
14.3.2 会社概要
14.3.3 財務分析
14.3.3.1 純収入、2017-2022年
14.3.3.2 R&D、2017-2022年
14.3.3.3 地域市場シェア、2022年
14.3.4 製品ベンチマーク
14.3.5 戦略的展望
14.4 Merck & Co., Inc.
14.4.1 会社概要
14.4.2 会社概要
14.4.3 財務分析
14.4.3.1 純収入、2017-2022年
14.4.3.2 売上高、2017-2022年
14.4.3.3 地域市場シェア、2022年
14.4.4 製品ベンチマーク
14.4.5 戦略的展望
14.5 Amgen Inc.
14.5.1 会社概要
14.5.2 会社概要
14.5.3 財務分析
14.5.3.1 純収入、2017-2022年
14.5.3.2 R&D、2017-2022年
14.5.3.3 地域市場シェア、2022年
14.5.4 製品ベンチマーク
14.5.5 戦略的展望
14.6 Walvax Biotechnology Co.Ltd.
14.6.1 会社概要
14.6.2 会社概要
14.6.3 財務分析
14.6.3.1 純収入、2018-2022年
14.6.3.2 R&D、2018-2022年
14.6.4 製品ベンチマーク
14.6.5 戦略的展望
14.7 OSE Immunotherapeutics
14.7.1 会社概要
14.7.2 会社概要
14.7.3 財務分析
14.7.3.1 純収入、2018-2022年
14.7.3.2 R&D、2017-2022年
14.7.4 製品ベンチマーク
14.7.5 戦略的展望
14.8 Synthaverse S. A. (Biomed-Lublin)
14.8.1 会社概要
14.8.2 会社概要
14.8.3 製品ベンチマーク
14.9 Dendreon Pharmaceuticals LLC
14.9.1 会社概要
14.9.2 会社概要
14.9.3 製品ベンチマーク
14.9.4 戦略的展望
14.10 F. Hoffmann-La Roche Ltd
14.10.1 会社概要
14.10.2 会社概要
14.10.3 財務分析
14.10.3.1 純収入、2018-2022年
14.10.3.2 売上高、2017-2022年
14.10.4 製品ベンチマーク
14.10.5 戦略的展望
14.11 Moderna, Inc.
14.11.1 会社概要
14.11.2 会社概要
14.11.3 財務分析
14.11.3.1 純収入、2017-2022年
14.11.3.2 R&D、2017-2022年
14.11.3.3 地域市場シェア、2022年
14.11.4 製品ベンチマーク
14.11.5 戦略的展望
14.12 AstraZeneca
14.12.1 会社概要
14.12.2 会社概要
14.12.3 財務分析
14.12.3.1 純収入、2017-2022年
14.12.3.2 R&D、2017-2022年
14.12.3.3 地域市場シェア、2022年
14.12.4 製品ベンチマーク
15 結論と提言
15.1 Visiongainからの結びの言葉
15.2 市場プレイヤーへの提言
ページTOPに戻る
図表リスト
表の一覧
Table 1 Cancer Vaccines Market Snapshot, 2023 & 2033 (US$ Million, CAGR %)
Table 2 Cancer Vaccines Market Forecast by Region, 2023-2033 (US$ Million, AGR%, CAGR%): “V” Shaped Recovery
Table 3 Cancer Vaccines Market Forecast by Region, 2023-2033 (US$ Million, AGR%, CAGR%): “U” Shaped Recovery
Table 4 Cancer Vaccines Market Forecast by Region, 2023-2033 (US$ Million, AGR%, CAGR%): “W” Shaped Recovery
Table 5 Cancer Vaccines Market Forecast by Region, 2023-2033 (US$ Million, AGR%, CAGR%): “L” Shaped Recovery
Table 6 Cancer Vaccines Market Forecast by Type, 2023-2033 (US$ Million, AGR%, CAGR %)
Table 7 Preventive Vaccines Segment Market Forecast by Region, 2023-2033 (US$ Million, AGR%, CAGR %)
Table 8 Therapeutic Vaccines Segment Market Forecast by Region, 2023-2033 (US$ Million, AGR%, CAGR%)
Table 9 Cancer Vaccines Market Forecast by Technology, 2023-2033 (US$ Million, AGR%, CAGR%)
Table 10 Dendritic Cells Segment Market Forecast by Region, 2023-2033 (US$ Million, AGR%, CAGR%)
Table 11 Recombinant Segment Market Forecast by Region, 2023-2033 (US$ Million, AGR%, CAGR%)
Table 12 Antigen/Adjuvant Segment Market Forecast by Region, 2023-2033 (US$ Million, AGR%, CAGR%)
Table 13 Viral Vector and DNA Segment Market Forecast by Region, 2023-2033 (US$ Million, AGR%, CAGR%)
Table 14 Whole-cell Segment Market Forecast by Region, 2023-2033 (US$ Million, AGR%, CAGR%)
Table 15 Cancer Vaccines Market Forecast by Indications, 2023-2033 (US$ Million, AGR%, CAGR%)
Table 16 Cervical Cancer Segment Market Forecast by Region, 2023-2033 (US$ Million, AGR%, CAGR%)
Table 17 Prostate Cancer Segment Market Forecast by Region, 2023-2033 (US$ Million, AGR%, CAGR%)
Table 18 Other Indications Segment Market Forecast by Region, 2023-2033 (US$ Million, AGR%, CAGR%)
Table 19 Cancer Vaccines Market Forecast by End-users, 2023-2033 (US$ Million, AGR%, CAGR%)
Table 20 Paediatrics Segment Market Forecast by Region, 2023-2033 (US$ Million, AGR%, CAGR%)
Table 21 Adults Segment Market Forecast by Region, 2023-2033 (US$ Million, AGR%, CAGR%)
Table 22 Cancer Vaccines Market Forecast by Region, 2023-2033 (US$ Million, AGR%, CAGR%)
Table 23 North America Cancer Vaccines Market Forecast by Country, 2023-2033 (US$ Million, AGR%, CAGR%)
Table 24 North America Cancer Vaccines Market Forecast by Type, 2023-2033 (US$ Million, AGR%, CAGR%)
Table 25 North America Cancer Vaccines Market Forecast by Technology, 2023-2033 (US$ Million, AGR%, CAGR%)
Table 26 North America Cancer Vaccines Market Forecast by Indications, 2023-2033 (US$ Million, AGR%, CAGR%)
Table 27 North America Cancer Vaccines Market Forecast by End-users, 2023-2033 (US$ Million, AGR%, CAGR%)
Table 28 U.S. Cancer Vaccines Market Forecast, 2023-2033 (US$ Million, AGR%, CAGR%)
Table 29 Canada Cancer Vaccines Market Forecast, 2023-2033 (US$ Million, AGR%, CAGR%)
Table 30 Europe Cancer Vaccines Market Forecast by Country, 2023-2033 (US$ Million, AGR%, CAGR %)
Table 31 Europe Cancer Vaccines Market Forecast by Type, 2023-2033 (US$ Million, AGR%, CAGR%)
Table 32 Europe Cancer Vaccines Market Forecast by Technology, 2023-2033 (US$ Million, AGR%, CAGR %)
Table 33 Europe Cancer Vaccines Market Forecast by Indications, 2023-2033 (US$ Million, AGR%, CAGR%)
Table 34 Europe Cancer Vaccines Market Forecast by End-users, 2023-2033 (US$ Million, AGR%, CAGR%)
Table 35 Germany Cancer Vaccines Market Forecast, 2023-2033 (US$ Million, AGR%, CAGR%)
Table 36 France Cancer Vaccines Market Forecast, 2023-2033 (US$ Million, AGR%, CAGR%)
Table 37 UK Cancer Vaccines Market Forecast, 2023-2033 (US$ Million, AGR%, CAGR%)
Table 38 Italy Cancer Vaccines Market Forecast, 2023-2033 (US$ Million, AGR%, CAGR%)
Table 39 Spain Cancer Vaccines Market Forecast, 2023-2033 (US$ Million, AGR%, CAGR%)
Table 40 Russia Cancer Vaccines Market Forecast, 2023-2033 (US$ Million, AGR%, CAGR%)
Table 41 Rest of Europe Cancer Vaccines Market Forecast, 2023-2033 (US$ Million, AGR%, CAGR%)
Table 42 Asia Pacific Cancer Vaccines Market Forecast by Country, 2023-2033 (US$ Million, AGR%, CAGR%)
Table 43 Asia Pacific Cancer Vaccines Market Forecast by Type, 2023-2033 (US$ Million, AGR%, CAGR%)
Table 44 Asia Pacific Cancer Vaccines Market Forecast by Technology, 2023-2033 (US$ Million, AGR%, CAGR%)
Table 45 Asia Pacific Cancer Vaccines Market Forecast by Indications, 2023-2033 (US$ Million, AGR%, CAGR%)
Table 46 Asia Pacific Cancer Vaccines Market Forecast by End-users, 2023-2033 (US$ Million, AGR%, CAGR%)
Table 47 Japan Cancer Vaccines Market Forecast, 2023-2033 (US$ Million, AGR%, CAGR%)
Table 48 China Cancer Vaccines Market Forecast, 2023-2033 (US$ Million, AGR%, CAGR%)
Table 49 India Cancer Vaccines Market Forecast, 2023-2033 (US$ Million, AGR%, CAGR%)
Table 50 Australia Cancer Vaccines Market Forecast, 2023-2033 (US$ Million, AGR%, CAGR%)
Table 51 South Korea Cancer Vaccines Market Forecast, 2023-2033 (US$ Million, AGR%, CAGR%)
Table 52 Rest of Asia Pacific Cancer Vaccines Market Forecast, 2023-2033 (US$ Million, AGR%, CAGR %)
Table 53 Latin America Cancer Vaccines Market Forecast by Country, 2023-2033 (US$ Million, AGR%, CAGR%)
Table 54 Latin America Cancer Vaccines Market Forecast by Type, 2023-2033 (US$ Million, AGR%, CAGR%)
Table 55 Latin America Cancer Vaccines Market Forecast by Technology, 2023-2033 (US$ Million, AGR%, CAGR%)
Table 56 Latin America Cancer Vaccines Market Forecast by Indications, 2023-2033 (US$ Million, AGR%, CAGR%)
Table 57 Latin America Cancer Vaccines Market Forecast by End-users, 2023-2033 (US$ Million, AGR%, CAGR%)
Table 58 Brazil Cancer Vaccines Market Forecast, 2023-2033 (US$ Million, AGR%, CAGR%)
Table 59 Mexico Cancer Vaccines Market Forecast, 2023-2033 (US$ Million, AGR%, CAGR%)
Table 60 Rest of Latin America Cancer Vaccines Market Forecast, 2023-2033 (US$ Million, AGR%, CAGR%)
Table 61 MEA Cancer Vaccines Market Forecast by Country, 2023-2033 (US$ Million, AGR%, CAGR%)
Table 62 MEA Cancer Vaccines Market Forecast by Type, 2023-2033 (US$ Million, AGR%, CAGR%)
Table 63 MEA Cancer Vaccines Market Forecast by Technology, 2023-2033 (US$ Million, AGR%, CAGR%)
Table 64 MEA Cancer Vaccines Market Forecast by Indications, 2023-2033 (US$ Million, AGR%, CAGR%)
Table 65 MEA Cancer Vaccines Market Forecast by End-users, 2023-2033 (US$ Million, AGR%, CAGR%)
Table 66 GCC Cancer Vaccines Market Forecast, 2023-2033 (US$ Million, AGR%, CAGR%)
Table 67 South Africa Cancer Vaccines Market Forecast, 2023-2033 (US$ Million, AGR%, CAGR%)
Table 68 Rest of MEA Cancer Vaccines Market Forecast, 2023-2033 (US$ Million, AGR%, CAGR %)
Table 69 Strategic Outlook
Table 70 GSK plc: Key Details, (CEO, HQ, Revenue, Founded, No. of Employees, Company Type, Website, Business Segment)
Table 71 GSK Plc: Product Benchmarking
Table 72 GSK Plc: Strategic Outlook
Table 73 Merck & Co., Inc.: Key Details, (CEO, HQ, Revenue, Founded, No. of Employees, Company Type, Website, Business Segment)
Table 74 Merck & Co., Inc.: Product Benchmarking
Table 75 Merck & Co., Inc.: Strategic Outlook
Table 76 Amgen Inc.: Key Details, (CEO, HQ, Revenue, Founded, No. of Employees, Company Type, Website, Business Segment)
Table 77 Amgen Inc.: Product Benchmarking
Table 78 Amgen Inc.: Strategic Outlook
Table 79 Walvax Biotechnology Co. Ltd.: Key Details, (CEO, HQ, Revenue, Founded, No. of Employees, Company Type, Website, Business Segment)
Table 80 Walvax Biotechnology Co. Ltd.: Product Benchmarking
Table 81 Walvax Biotechnology Co. Ltd.: Strategic Outlook
Table 82 OSE Immunotherapeutics: Key Details, (CEO, HQ, Revenue, Founded, No. of Employees, Company Type, Website, Business Segment)
Table 83 OSE Immunotherapeutic: Product Benchmarking
Table 84 OSE Immunotherapeutic: Strategic Outlook
Table 85 Synthaverse S. A. (Biomed-Lublin): Key Details, (CEO, HQ, Revenue, Founded, No. of Employees, Company Type, Website, Business Segment)
Table 86 Synthaverse S. A. (Biomed-Lublin): Product Benchmarking
Table 87 Dendreon Pharmaceuticals LLC: Key Details, (CEO, HQ, Revenue, Founded, No. of Employees, Company Type, Website, Business Segment)
Table 88 Dendreon Pharmaceuticals LLC: Product Benchmarking
Table 89 Dendreon Pharmaceuticals LLC: Strategic Outlook
Table 90 F. Hoffmann-La Roche Ltd: Key Details, (CEO, HQ, Revenue, Founded, No. of Employees, Company Type, Website, Business Segment)
Table 91 F. Hoffmann-La Roche Ltd: Product Benchmarking
Table 92 F. Hoffmann-La Roche Ltd: Strategic Outlook
Table 93 Moderna, Inc.: Key Details, (CEO, HQ, Revenue, Founded, No. of Employees, Company Type, Website, Business Segment)
Table 94 Moderna, Inc.: Product Benchmarking
Table 95 Moderna, Inc.: Strategic Outlook
Table 96 AstraZeneca: Key Details, (CEO, HQ, Revenue, Founded, No. of Employees, Company Type, Website, Business Segment)
Table 97 AstraZeneca: Product Benchmarking
図の一覧
Figure 1 Cancer Vaccines Market Segmentation
Figure 2 Cancer Vaccines Market by Type: Market Attractiveness Index
Figure 3 Cancer Vaccines Market by Technology: Market Attractiveness Index
Figure 4 Cancer Vaccines Market by Indications: Market Attractiveness Index
Figure 5 Cancer Vaccines Market by End-users: Market Attractiveness Index
Figure 6 Cancer Vaccines Market Attractiveness Index by Region
Figure 7 Cancer Vaccines Market Dynamics
Figure 8 Global Cancer Case Rate per 100,000 People, 2015–2020
Figure 9 Global Cancer Cases by Country, 2022
Figure 10 R&D Spending by Major Oncology Companies, 2018–2022
Figure 11 Cancer Vaccines Market by Region, 2023-2033 (US$ Million, AGR %): “V” Shaped Recovery
Figure 12 Cancer Vaccines Market by Region, 2023-2033 (US$ Million, AGR %): “U” Shaped Recovery
Figure 13 Cancer Vaccines Market by Region, 2023-2033 (US$ Million, AGR %): “W” Shaped Recovery
Figure 14 Cancer Vaccines Market by Region, 2023-2033 (US$ Million, AGR %): “L” Shaped Recovery
Figure 15 Cancer Vaccines Market: Porter’s Five Forces Analysis
Figure 16 Cancer Vaccines Market: PEST Analysis
Figure 17 Cancer Vaccines Market by Type: Market Attractiveness Index
Figure 18 Cancer Vaccines Market Forecast by Type, 2023-2033 (US$ Million, AGR %)
Figure 19 Cancer Vaccines Market Share Forecast by Type, 2023, 2028, 2033 (%)
Figure 20 Preventive Vaccines Segment Market Forecast by Region, 2023-2033 (US$ Million, AGR %)
Figure 21 Preventive Vaccines Segment Market Share Forecast by Region, 2023 & 2033 (%)
Figure 22 Therapeutic Vaccines Segment Market Forecast by Region, 2023-2033 (US$ Million, AGR %)
Figure 23 Therapeutic Vaccines Segment Market Share Forecast by Region, 2023 & 2033 (%)
Figure 24 Cancer Vaccines Market by Technology: Market Attractiveness Index
Figure 25 Cancer Vaccines Market Forecast by Technology, 2023-2033 (US$ Million, AGR %)
Figure 26 Cancer Vaccines Market Share Forecast by Technology, 2023, 2028, 2033 (%)
Figure 27 Dendritic Cells Segment Market Forecast by Region, 2023-2033 (US$ Million, AGR %)
Figure 28 Dendritic Cells Segment Market Share Forecast by Region, 2023 & 2033 (%)
Figure 29 Recombinant Segment Market Forecast by Region, 2023-2033 (US$ Million, AGR %)
Figure 30 Recombinant Segment Market Share Forecast by Region, 2023 & 2033 (%)
Figure 31 Antigen/Adjuvant Segment Market Forecast by Region, 2023-2033 (US$ Million, AGR %)
Figure 32 Antigen/Adjuvant Segment Market Share Forecast by Region, 2023 & 2033 (%)
Figure 33 Viral Vector and DNA Segment Market Forecast by Region, 2023-2033 (US$ Million, AGR %)
Figure 34 Viral Vector and DNA Segment Market Share Forecast by Region, 2023 & 2033 (%)
Figure 35 Whole-cell Segment Market Forecast by Region, 2023-2033 (US$ Million, AGR %)
Figure 36 Whole-cell Segment Market Share Forecast by Region, 2023 & 2033 (%)
Figure 37 Cancer Vaccines Market by Indications: Market Attractiveness Index
Figure 38 Cancer Vaccines Market Forecast by Indications, 2023-2033 (US$ Million, AGR %)
Figure 39 Cancer Vaccines Market Share Forecast by Indications, 2023, 2028, 2033 (%)
Figure 40 Cervical Cancer Segment Market Forecast by Region, 2023-2033 (US$ Million, AGR %)
Figure 41 Cervical Cancer Segment Market Share Forecast by Region, 2023 & 2033 (%)
Figure 42 Prostate Cancer Segment Market Forecast by Region, 2023-2033 (US$ Million, AGR %)
Figure 43 Prostate Cancer Segment Market Share Forecast by Region, 2023 & 2033 (%)
Figure 44 Other Indications Market Forecast by Region, 2023-2033 (US$ Million, AGR %)
Figure 45 Other Indications Segment Market Share Forecast by Region, 2023 & 2033 (%)
Figure 46 Cancer Vaccines Market by End-users: Market Attractiveness Index
Figure 47 Cancer Vaccines Market Forecast by End-users, 2023-2033 (US$ Million, AGR %)
Figure 48 Cancer Vaccines Market Share Forecast by End-users, 2023, 2028, 2033 (%)
Figure 49 Paediatrics Segment Market Forecast by Region, 2023-2033 (US$ Million, AGR %)
Figure 50 Paediatrics Segment Market Share Forecast by Region, 2023 & 2033 (%)
Figure 51 Adults Segment Market Forecast by Region, 2023-2033 (US$ Million, AGR %)
Figure 52 Adults Segment Market Share Forecast by Region, 2023 & 2033 (%)
Figure 53 Cancer Vaccines Market Forecast by Region 2023 and 2033 (Revenue, CAGR%)
Figure 54 Cancer Vaccines Market Share Forecast by Region 2023, 2028, 2033 (%)
Figure 55 Cancer Vaccines Market by Region, 2023-2033 (US$ Million, AGR %)
Figure 56 North America Cancer Vaccines Market Attractiveness Index
Figure 57 North America Cancer Vaccines Market by Region, 2023, 2028 & 2033 (US$ Million)
Figure 58 North America Cancer Vaccines Market Forecast by Country, 2023-2033 (US$ Million, AGR %)
Figure 59 North America Cancer Vaccines Market Share Forecast by Country, 2023 & 2033 (%)
Figure 60 North America Cancer Vaccines Market Forecast by Type, 2023-2033 (US$ Million, AGR %)
Figure 61 North America Cancer Vaccines Market Share Forecast by Type, 2023 & 2033 (%)
Figure 62 North America Cancer Vaccines Market Forecast by Technology, 2023-2033 (US$ Million, AGR %)
Figure 63 North America Cancer Vaccines Market Share Forecast by Technology, 2023 & 2033 (%)
Figure 64 North America Cancer Vaccines Market Forecast by Indications, 2023-2033 (US$ Million, AGR %)
Figure 65 North America Cancer Vaccines Market Share Forecast by Indications, 2023 & 2033 (%)
Figure 66 North America Cancer Vaccines Market Forecast by End-users, 2023-2033 (US$ Million, AGR %)
Figure 67 North America Cancer Vaccines Market Share Forecast by End-users, 2023 & 2033 (%)
Figure 68 U.S. Cancer Vaccines Market Forecast, 2023-2033 (US$ Million, AGR %)
Figure 69 Canada Cancer Vaccines Market Forecast, 2023-2033 (US$ Million, AGR %)
Figure 70 Europe Cancer Vaccines Market Attractiveness Index
Figure 71 Europe Cancer Vaccines Market by Region, 2023, 2028 & 2033 (US$ Million)
Figure 72 Europe Cancer Vaccines Market Forecast by Country, 2023-2033 (US$ Million, AGR %)
Figure 73 Europe Cancer Vaccines Market Share Forecast by Country, 2023 & 2033 (%)
Figure 74 Europe Cancer Vaccines Market Forecast by Type, 2023-2033 (US$ Million, AGR %)
Figure 75 Europe Cancer Vaccines Market Share Forecast by Type, 2023 & 2033 (%)
Figure 76 Europe Cancer Vaccines Market Forecast by Technology, 2023-2033 (US$ Million, AGR %)
Figure 77 Europe Cancer Vaccines Market Share Forecast by Technology, 2023 & 2033 (%)
Figure 78 Europe Cancer Vaccines Market Forecast by Indications, 2023-2033 (US$ Million, AGR %)
Figure 79 Europe Cancer Vaccines Market Share Forecast by Indications, 2023 & 2033 (%)
Figure 80 Europe Cancer Vaccines Market Forecast by End-users, 2023-2033 (US$ Million, AGR %)
Figure 81 Europe Cancer Vaccines Market Share Forecast by End-users, 2023 & 2033 (%)
Figure 82 Germany Cancer Vaccines Market Forecast, 2023-2033 (US$ Million, AGR %)
Figure 83 France Cancer Vaccines Market Forecast, 2023-2033 (US$ Million, AGR %)
Figure 84 UK Cancer Vaccines Market Forecast, 2023-2033 (US$ Million, AGR %)
Figure 85 Italy Cancer Vaccines Market Forecast, 2023-2033 (US$ Million, AGR %)
Figure 86 Spain Cancer Vaccines Market Forecast, 2023-2033 (US$ Million, AGR %)
Figure 87 Russia Cancer Vaccines Market Forecast, 2023-2033 (US$ Million, AGR %)
Figure 88 Rest of Europe Cancer Vaccines Market Forecast, 2023-2033 (US$ Million, AGR %)
Figure 89 Asia Pacific Cancer Vaccines Market Attractiveness Index
Figure 90 Asia Pacific Cancer Vaccines Market by Region, 2023, 2028 & 2033 (US$ Million)
Figure 91 Asia Pacific Cancer Vaccines Market Forecast by Country, 2023-2033 (US$ Million, AGR %)
Figure 92 Asia Pacific Cancer Vaccines Market Share Forecast by Country, 2023 & 2033 (%)
Figure 93 Asia Pacific Cancer Vaccines Market Forecast by Type, 2023-2033 (US$ Million, AGR %)
Figure 94 Asia Pacific Cancer Vaccines Market Share Forecast by Type, 2023 & 2033 (%)
Figure 95 Asia Pacific Cancer Vaccines Market Forecast by Technology, 2023-2033 (US$ Million, AGR %)
Figure 96 Asia Pacific Cancer Vaccines Market Share Forecast by Technology, 2023 & 2033 (%)
Figure 97 Asia Pacific Cancer Vaccines Market Forecast by Indications, 2023-2033 (US$ Million, AGR %)
Figure 98 Asia Pacific Cancer Vaccines Market Share Forecast by Indications, 2023 & 2033 (%)
Figure 99 Asia Pacific Cancer Vaccines Market Forecast by End-users, 2023-2033 (US$ Million, AGR %)
Figure 100 Asia Pacific Cancer Vaccines Market Share Forecast by End-users, 2023 & 2033 (%)
Figure 101 Japan Cancer Vaccines Market Forecast, 2023-2033 (US$ Million, AGR %)
Figure 102 China Cancer Vaccines Market Forecast, 2023-2033 (US$ Million, AGR %)
Figure 103 India Cancer Vaccines Market Forecast, 2023-2033 (US$ Million, AGR %)
Figure 104 Australia Cancer Vaccines Market Forecast, 2023-2033 (US$ Million, AGR %)
Figure 105 South Korea Cancer Vaccines Market Forecast, 2023-2033 (US$ Million, AGR %)
Figure 106 Rest of Asia Pacific Cancer Vaccines Market Forecast, 2023-2033 (US$ Million, AGR %)
Figure 107 Latin America Cancer Vaccines Market Attractiveness Index
Figure 108 Latin America Cancer Vaccines Market by Region, 2023, 2028 & 2033 (US$ Million)
Figure 109 Latin America Cancer Vaccines Market Forecast by Country, 2023-2033 (US$ Million, AGR %)
Figure 110 Latin America Cancer Vaccines Market Share Forecast by Country, 2023 & 2033 (%)
Figure 111 Latin America Cancer Vaccines Market Forecast by Type, 2023-2033 (US$ Million, AGR %)
Figure 112 Latin America Cancer Vaccines Market Share Forecast by Type, 2023 & 2033 (%)
Figure 113 Latin America Cancer Vaccines Market Forecast by Technology, 2023-2033 (US$ Million, AGR %)
Figure 114 Latin America Cancer Vaccines Market Share Forecast by Technology, 2023 & 2033 (%)
Figure 115 Latin America Cancer Vaccines Market Forecast by Indications, 2023-2033 (US$ Million, AGR %)
Figure 116 Latin America Cancer Vaccines Market Share Forecast by Indications, 2023 & 2033 (%)
Figure 117 Latin America Cancer Vaccines Market Forecast by End-users, 2023-2033 (US$ Million, AGR %)
Figure 118 Latin America Cancer Vaccines Market Share Forecast by End-users, 2023 & 2033 (%)
Figure 119 Brazil Cancer Vaccines Market Forecast, 2023-2033 (US$ Million, AGR %)
Figure 120 Mexico Cancer Vaccines Market Forecast, 2023-2033 (US$ Million, AGR %)
Figure 121 Rest of Latin America Cancer Vaccines Market Forecast, 2023-2033 (US$ Million, AGR %)
Figure 122 MEA Cancer Vaccines Market Attractiveness Index
Figure 123 MEA Cancer Vaccines Market by Region, 2023, 2028 & 2033 (US$ Million)
Figure 124 MEA Cancer Vaccines Market Forecast by Country, 2023-2033 (US$ Million, AGR %)
Figure 125 MEA Cancer Vaccines Market Share Forecast by Country, 2023 & 2033 (%)
Figure 126 MEA Cancer Vaccines Market Forecast by Type, 2023-2033 (US$ Million, AGR %)
Figure 127 MEA Cancer Vaccines Market Share Forecast by Type, 2023 & 2033 (%)
Figure 128 MEA Cancer Vaccines Market Forecast by Technology, 2023-2033 (US$ Million, AGR %)
Figure 129 MEA Cancer Vaccines Market Share Forecast by Technology, 2023 & 2033 (%)
Figure 130 MEA Cancer Vaccines Market Forecast by Indications, 2023-2033 (US$ Million, AGR %)
Figure 131 MEA Cancer Vaccines Market Share Forecast by Indications, 2023 & 2033 (%)
Figure 132 MEA Cancer Vaccines Market Forecast by End-users, 2023-2033 (US$ Million, AGR %)
Figure 133 MEA Cancer Vaccines Market Share Forecast by End-users, 2023 & 2033 (%)
Figure 134 GCC Cancer Vaccines Market Forecast, 2023-2033 (US$ Million, AGR %)
Figure 135 South Africa Cancer Vaccines Market Forecast, 2023-2033 (US$ Million, AGR %)
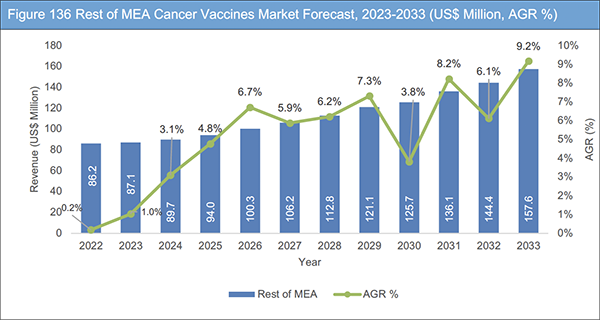
Figure 136 Rest of MEA Cancer Vaccines Market Forecast, 2023-2033 (US$ Million, AGR %)
Figure 137 GSK PLC: Net Revenue, 2017-2022 (US$ Billion, AGR%)
Figure 138 GSK PLC: R&D, 2017-2022 (US$ Billion, AGR%)
Figure 139 GSK Plc: Regional Market Shares, 2022
Figure 140 Merck & Co., Inc.: Net Revenue, 2017-2022 (US$ Billion, AGR%)
Figure 141 Merck & Co., Inc.: R&D, 2017-2022 (US$ Billion, AGR%)
Figure 142 Merck & Co., Inc.: Regional Market Shares, 2022
Figure 143 Amgen Inc.: Net Revenue, 2017-2022 (US$ Billion, AGR%)
Figure 144 Amgen Inc.: R&D, 2017-2022 (US$ Billion, AGR%)
Figure 145 Amgen Inc.: Regional Market Shares, 2022
Figure 146 Walvax Biotechnology Co. Ltd.: Net Revenue, 2018-2022 (US$ Million, AGR%)
Figure 147 Walvax Biotechnology Co. Ltd.: R&D, 2018-2022 (US$ Million, AGR%)
Figure 148 OSE Immunotherapeutics: Net Revenue, 2018-2022 (US$ Million, AGR%)
Figure 149 OSE Immunotherapeutics: R&D, 2017-2022 (US$ Million, AGR%)
Figure 150 F. Hoffmann-La Roche Ltd: Net Revenue, 2018-2022 (US$ Billion, AGR%)
Figure 151 F. Hoffmann-La Roche Ltd: R&D, 2017-2022 (US$ Billion, AGR%)
Figure 152 Moderna, Inc.: Net Revenue, 2017-2022 (US$ Billion, AGR%)
Figure 153 Moderna, Inc.: R&D, 2017-2022 (US$ Billion, AGR%)
Figure 154 Moderna, Inc.: Regional Market Shares, 2022
Figure 155 AstraZeneca: Net Revenue, 2017-2022 (US$ Billion, AGR%)
Figure 156 AstraZeneca: R&D, 2017-2022 (US$ Billion, AGR%)
Figure 157 AstraZeneca: Regional Market Shares, 2022
ページTOPに戻る
Summary
Report Details
The Cancer Vaccines Market Report 2023-2033: This report will prove invaluable to leading firms striving for new revenue pockets if they wish to better understand the industry and its underlying dynamics. It will be useful for companies that would like to expand into different industries or to expand their existing operations in a new region.
Adoption of Technology in Drug Development to Create Market Opportunities for Cancer Vaccines
The adoption of Artificial Intelligence (AI) in cancer vaccine development has revolutionized the field of oncology. AI-driven technologies enable researchers to analyze vast amounts of genetic and molecular data, identifying potential cancer antigens and predicting the most suitable targets for vaccines. This streamlined approach accelerates the discovery process and allows for personalized cancer vaccines tailored to individual patients. Additionally, AI algorithms aid in the optimization of vaccine formulations, enhancing their effectiveness and safety profiles. By harnessing the power of AI, scientists can expedite the development and testing of innovative cancer vaccines, providing new hope for more effective and targeted treatments in the fight against cancer. For instance, in terms of information and communication technologies, NEC Corporation has been in the forefront. It is currently steadily improving its decades-old artificial intelligence (AI) capabilities to quickly handle complex social concerns. The business is now using this acquired knowledge to tackle the problem of using AI to provide fully individualised medicines for cancer patients.
Stringent Regulatory Guidelines and Extended Timelines in the Manufacturing Process of Cancer Vaccines Likely to Challenge Industry Growth
The manufacturing process of cancer vaccines faces several challenges, including stringent regulatory guidelines and longer timelines. These factors significantly impact the development, production, and commercialization of cancer vaccines.
Regulatory agencies, such as the U.S. Food and Drug Administration (FDA) and the European Medicines Agency (EMA), impose rigorous requirements to ensure the safety, efficacy, and quality of vaccines. The extensive documentation, comprehensive clinical trial data, and adherence to Good Manufacturing Practices (GMP) are prerequisites for regulatory approval.
The manufacturing process of cancer vaccines is inherently complex and time-consuming, leading to extended timelines for their development and commercialization. Cancer vaccine development involves conducting multiple phases of clinical trials to establish safety, efficacy, and immunogenicity. The stringent regulatory guidelines demand robust trial design, patient recruitment, and meticulous data collection and analysis. This extensive clinical trial process can significantly prolong the overall manufacturing timeline.
What Questions Should You Ask before Buying a Market Research Report?
• How is the cancer vaccines market evolving?
• What is driving and restraining the cancer vaccines market?
• How will each cancer vaccines submarket segment grow over the forecast period and how much revenue will these submarkets account for in 2033?
• How will the market shares for each cancer vaccines submarket develop from 2023 to 2033?
• What will be the main driver for the overall market from 2023 to 2033?
• Will leading cancer vaccines markets broadly follow the macroeconomic dynamics, or will individual national markets outperform others?
• How will the market shares of the national markets change by 2033 and which geographical region will lead the market in 2033?
• Who are the leading players and what are their prospects over the forecast period?
• What are the cancer vaccines projects for these leading companies?
• How will the industry evolve during the period between 2023 and 2033? What are the implications of cancer vaccines projects taking place now and over the next 10 years?
• Is there a greater need for product commercialisation to further scale the cancer vaccines market?
• Where is the cancer vaccines market heading and how can you ensure you are at the forefront of the market?
• What are the best investment options for new product and service lines?
• What are the key prospects for moving companies into a new growth path and C-suite?
You need to discover how this will impact the Cancer Vaccines Market today, and over the next 10 years:
• Our 235-page report provides 97 tables and 157 charts/graphs exclusively to you.
• The report highlights key lucrative areas in the industry so you can target them – NOW.
• It contains in-depth analysis of global, regional and national sales and growth.
• It highlights for you the key successful trends, changes and revenue projections made by your competitors.
This report tells you TODAY how the Cancer Vaccines market will develop in the next 10 years, and in line with the variations in COVID-19 economic recession and bounce. This market is more critical now than at any point over the last 10 years.
Forecasts to 2033 and other analyses reveal commercial prospects
• In addition to revenue forecasting to 2033, our new study provides you with recent results, growth rates, and market shares.
• You will find original analyses, with business outlooks and developments.
• Discover qualitative analyses (including market dynamics, drivers, opportunities, restraints and challenges), cost structure, impact of rising Cancer Vaccines prices and recent developments.
This report includes data analysis and invaluable insight into how COVID-19 will affect the industry and your company. Four COVID-19 recovery patterns and their impact, namely, “V”, “L”, “W” and “U” are discussed in this report.
Segments Covered in the Report
Type
• Preventive Vaccines
• Therapeutic Vaccines
Technology
• Dendritic Cells
• Recombinant
• Antigen/Adjuvant
• Viral Vector and DNA
• Whole-cell
Indications
• Cervical Cancer
• Prostate Cancer
• Other Indications
End-users
• Paediatrics
• Adults
In addition to the revenue predictions for the overall world market and segments, you will also find revenue forecasts for five regional and 21 leading national markets:
North America
• U.S.
• Canada
Europe
• Germany
• UK
• France
• Spain
• Italy
• Russia
• Rest of Europe
Asia Pacific
• China
• Japan
• India
• Australia
• South Korea
• Rest of Asia Pacific
Latin America
• Brazil
• Mexico
• Rest of Latin America
MEA
• GCC
• South Africa
• Rest of MEA
The report also includes profiles and for some of the leading companies in the Cancer Vaccines Market, 2023 to 2033, with a focus on this segment of these companies’ operations.
Leading companies and the potential for market growth
• Amgen Inc.
• AstraZeneca
• Dendreon Pharmaceuticals LLC
• F. Hoffmann-La Roche Ltd
• GSK plc
• Merck & Co., Inc.
• Moderna, Inc.
• OSE Immunotherapeutics
• Synthaverse S.A. (Biomed-Lublin)
• Walvax Biotechnology Co. Ltd.
Overall world revenue for Cancer Vaccines Market, 2023 to 2033 in terms of value the market will surpass US$8,060 million in 2023, our work calculates. We predict strong revenue growth through to 2033. Our work identifies which organizations hold the greatest potential. Discover their capabilities, progress, and commercial prospects, helping you stay ahead.
How will the Cancer Vaccines Market, 2023 to 2033 report help you?
In summary, our 230+ page report provides you with the following knowledge:
• Revenue forecasts to 2033 for Cancer Vaccines Market, 2023 to 2033 Market, with forecasts for type, technology, indications, and end-users, each forecast at a global and regional level – discover the industry’s prospects, finding the most lucrative places for investments and revenues.
• Revenue forecasts to 2033 for five regional and 21 key national markets – See forecasts for the Cancer Vaccines Market, 2023 to 2033 market in North America, Europe, Asia-Pacific, Latin America, and MEA. Also forecasted is the market in the US, Canada, Mexico, Brazil, Germany, France, UK, Italy, China, India, Japan, and Australia among other prominent economies.
• Prospects for established firms and those seeking to enter the market – including company profiles for 10 of the major companies involved in the Cancer Vaccines Market, 2023 to 2033.
Find quantitative and qualitative analyses with independent predictions. Receive information that only our report contains, staying informed with invaluable business intelligence.
Information found nowhere else
With our new report, you are less likely to fall behind in knowledge or miss out on opportunities. See how our work could benefit your research, analyses, and decisions. Visiongain’s study is for everybody needing commercial analyses for the Cancer Vaccines Market, 2023 to 2033, market-leading companies. You will find data, trends and predictions.
ページTOPに戻る
Table of Contents
Table of Contents
1 Report Overview
1.1 Objectives of the Study
1.2 Introduction
1.3 What This Report Delivers
1.4 Why You Should Read This Report
1.5 Key Questions Answered by This Analytical Report
1.6 Who is This Report for?
1.7 Methodology
1.7.1 Market Definitions
1.7.2 Market Evaluation & Forecasting Methodology
1.7.3 Data Validation
1.7.3.1 Primary Research
1.7.3.2 Secondary Research
1.8 Frequently Asked Questions (FAQs)
1.9 Associated Visiongain Reports
1.10 About Visiongain
2 Executive Summary
3 Market Overview
3.1 Key Findings
3.2 Market Dynamics
3.2.1 Market Driving Factors
3.2.1.1 Increasing Number of Cancer Cases to Drive the Vaccine Demand
3.2.1.2 Rising investment by PPPs and Government to Boost the Market Growth
3.2.2 Market Restraining Factors
3.2.2.1 Challenges Posed by Stringent Regulatory Guidelines and Extended Timelines in the Manufacturing Process of Cancer Vaccines
3.2.2.2 Advancement in Personalised Medicine to Hamper the Market Growth
3.2.3 Market Opportunities
3.2.3.1 Increasing Organic and Inorganic Activities to Boost the Cancer Vaccines Market Growth
3.2.3.2 Adoption of Technology in Drug Development to Create Market Opportunities for Cancer Vaccines
3.3 COVID-19 Impact Analysis
3.4 Porter’s Five Forces Analysis
3.4.1 Bargaining Power of Suppliers
3.4.2 Bargaining Power of Buyers
3.4.3 Competitive Rivalry
3.4.4 Threat from Substitutes
3.4.5 Threat of New Entrants
3.5 PEST Analysis
4 Cancer Vaccines Market Analysis by Type
4.1 Key Findings
4.2 Type Segment: Market Attractiveness Index
4.3 Cancer Vaccines Market Size Estimation and Forecast by Type
4.4 Preventive Vaccines
4.4.1 Market Size by Region, 2023-2033 (US$ Million)
4.4.2 Market Share by Region, 2023 & 2033 (%)
4.5 Therapeutic Vaccines
4.5.1 Market Size by Region, 2023-2033 (US$ Million)
4.5.2 Market Share by Region, 2023 & 2033 (%)
5 Cancer Vaccines Market Analysis by Technology
5.1 Key Findings
5.2 Technology Segment: Market Attractiveness Index
5.3 Cancer Vaccines Market Size Estimation and Forecast by Technology
5.4 Dendritic Cells
5.4.1 Market Size by Region, 2023-2033 (US$ Million)
5.4.2 Market Share by Region, 2023 & 2033 (%)
5.5 Recombinant
5.5.1 Market Size by Region, 2023-2033 (US$ Million)
5.5.2 Market Share by Region, 2023 & 2033 (%)
5.6 Antigen/Adjuvant
5.6.1 Market Size by Region, 2023-2033 (US$ Million)
5.6.2 Market Share by Region, 2023 & 2033 (%)
5.7 Viral Vector and DNA
5.7.1 Market Size by Region, 2023-2033 (US$ Million)
5.7.2 Market Share by Region, 2023 & 2033 (%)
5.8 Whole-cell
5.8.1 Market Size by Region, 2023-2033 (US$ Million)
5.8.2 Market Share by Region, 2023 & 2033 (%)
6 Cancer Vaccines Market Analysis by Indications
6.1 Key Findings
6.2 Indications Segment: Market Attractiveness Index
6.3 Cancer Vaccines Market Size Estimation and Forecast by Indications
6.4 Cervical Cancer
6.4.1 Market Size by Region, 2023-2033 (US$ Million)
6.4.2 Market Share by Region, 2023 & 2033 (%)
6.5 Prostate Cancer
6.5.1 Market Size by Region, 2023-2033 (US$ Million)
6.5.2 Market Share by Region, 2023 & 2033 (%)
6.6 Other Indications
6.6.1 Market Size by Region, 2023-2033 (US$ Million)
6.6.2 Market Share by Region, 2023 & 2033 (%)
7 Cancer Vaccines Market Analysis by End-users
7.1 Key Findings
7.2 End-users Segment: Market Attractiveness Index
7.3 Cancer Vaccines Market Size Estimation and Forecast by End-users
7.4 Paediatrics
7.4.1 Market Size by Region, 2023-2033 (US$ Million)
7.4.2 Market Share by Region, 2023 & 2033 (%)
7.5 Adults
7.5.1 Market Size by Region, 2023-2033 (US$ Million)
7.5.2 Market Share by Region, 2023 & 2033 (%)
8 Cancer Vaccines Market Analysis by Region
8.1 Key Findings
8.2 Regional Market Size Estimation and Forecast
9 North America Cancer Vaccines Market Analysis
9.1 Key Findings
9.2 North America Cancer Vaccines Market Attractiveness Index
9.3 North America Cancer Vaccines Market by Country, 2023, 2028 & 2033 (US$ Million)
9.4 North America Cancer Vaccines Market Size Estimation and Forecast by Country
9.5 North America Cancer Vaccines Market Size Estimation and Forecast by Type
9.6 North America Cancer Vaccines Market Size Estimation and Forecast by Technology
9.7 North America Cancer Vaccines Market Size Estimation and Forecast by Indications
9.8 North America Cancer Vaccines Market Size Estimation and Forecast by End-users
9.9 U.S. Cancer Vaccines Market Analysis
9.10 Canada Cancer Vaccines Market Analysis
10 Europe Cancer Vaccines Market Analysis
10.1 Key Findings
10.2 Europe Cancer Vaccines Market Attractiveness Index
10.3 Europe Cancer Vaccines Market by Country, 2023, 2028 & 2033 (US$ Million)
10.4 Europe Cancer Vaccines Market Size Estimation and Forecast by Country
10.5 Europe Cancer Vaccines Market Size Estimation and Forecast by Type
10.6 Europe Cancer Vaccines Market Size Estimation and Forecast by Technology
10.7 Europe Cancer Vaccines Market Size Estimation and Forecast by Indications
10.8 Europe Cancer Vaccines Market Size Estimation and Forecast by End-users
10.9 Germany Cancer Vaccines Market Analysis
10.10 France Cancer Vaccines Market Analysis
10.11 UK Cancer Vaccines Market Analysis
10.12 Italy Cancer Vaccines Market Analysis
10.13 Spain Cancer Vaccines Market Analysis
10.14 Russia Cancer Vaccines Market Analysis
10.15 Rest of Europe Cancer Vaccines Market Analysis
11 Asia Pacific Cancer Vaccines Market Analysis
11.1 Key Findings
11.2 Asia Pacific Cancer Vaccines Market Attractiveness Index
11.3 Asia Pacific Cancer Vaccines Market by Country, 2023, 2028 & 2033 (US$ Million)
11.4 Asia Pacific Cancer Vaccines Market Size Estimation and Forecast by Country
11.5 Asia Pacific Cancer Vaccines Market Size Estimation and Forecast by Type
11.6 Asia Pacific Cancer Vaccines Market Size Estimation and Forecast by Technology
11.7 Asia Pacific Cancer Vaccines Market Size Estimation and Forecast by Indications
11.8 Asia Pacific Cancer Vaccines Market Size Estimation and Forecast by End-users
11.9 Japan Cancer Vaccines Market Analysis
11.10 China Cancer Vaccines Market Analysis
11.11 India Cancer Vaccines Market Analysis
11.12 Australia Cancer Vaccines Market Analysis
11.13 South Korea Cancer Vaccines Market Analysis
11.14 Rest of Asia Pacific Cancer Vaccines Market Analysis
12 Latin America Cancer Vaccines Market Analysis
12.1 Key Findings
12.2 Latin America Cancer Vaccines Market Attractiveness Index
12.3 Latin America Cancer Vaccines Market by Country, 2023, 2028 & 2033 (US$ Million)
12.4 Latin America Cancer Vaccines Market Size Estimation and Forecast by Country
12.5 Latin America Cancer Vaccines Market Size Estimation and Forecast by Type
12.6 Latin America Cancer Vaccines Market Size Estimation and Forecast by Technology
12.7 Latin America Cancer Vaccines Market Size Estimation and Forecast by Indications
12.8 Latin America Cancer Vaccines Market Size Estimation and Forecast by End-users
12.9 Brazil Cancer Vaccines Market Analysis
12.10Mexico Cancer Vaccines Market Analysis
12.11Rest of Latin America Cancer Vaccines Market Analysis
13 MEA Cancer Vaccines Market Analysis
13.1 Key Findings
13.2 MEA Cancer Vaccines Market Attractiveness Index
13.3 MEA Cancer Vaccines Market by Country, 2023, 2028 & 2033 (US$ Million)
13.4 MEA Cancer Vaccines Market Size Estimation and Forecast by Country
13.5 MEA Cancer Vaccines Market Size Estimation and Forecast by Type
13.6 MEA Cancer Vaccines Market Size Estimation and Forecast by Technology
13.7 MEA Cancer Vaccines Market Size Estimation and Forecast by Indications
13.8 MEA Cancer Vaccines Market Size Estimation and Forecast by End-users
13.9 GCC Cancer Vaccines Market Analysis
13.10 South Africa Cancer Vaccines Market Analysis
13.11 Rest of MEA Cancer Vaccines Market Analysis
14 Company Profiles
14.1 Competitive Landscape, 2022
14.2 Strategic Outlook
14.3 GSK plc
14.3.1 Company Snapshot
14.3.2 Company Overview
14.3.3 Financial Analysis
14.3.3.1 Net Revenue, 2017-2022
14.3.3.2 R&D, 2017-2022
14.3.3.3 Regional Market Shares, 2022
14.3.4 Product Benchmarking
14.3.5 Strategic Outlook
14.4 Merck & Co., Inc.
14.4.1 Company Snapshot
14.4.2 Company Overview
14.4.3 Financial Analysis
14.4.3.1 Net Revenue, 2017-2022
14.4.3.2 R&D, 2017-2022
14.4.3.3 Regional Market Shares, 2022
14.4.4 Product Benchmarking
14.4.5 Strategic Outlook
14.5 Amgen Inc.
14.5.1 Company Snapshot
14.5.2 Company Overview
14.5.3 Financial Analysis
14.5.3.1 Net Revenue, 2017-2022
14.5.3.2 R&D, 2017-2022
14.5.3.3 Regional Market Shares, 2022
14.5.4 Product Benchmarking
14.5.5 Strategic Outlook
14.6 Walvax Biotechnology Co. Ltd.
14.6.1 Company Snapshot
14.6.2 Company Overview
14.6.3 Financial Analysis
14.6.3.1 Net Revenue, 2018-2022
14.6.3.2 R&D, 2018-2022
14.6.4 Product Benchmarking
14.6.5 Strategic Outlook
14.7 OSE Immunotherapeutics
14.7.1 Company Snapshot
14.7.2 Company Overview
14.7.3 Financial Analysis
14.7.3.1 Net Revenue, 2018-2022
14.7.3.2 R&D, 2017-2022
14.7.4 Product Benchmarking
14.7.5 Strategic Outlook
14.8 Synthaverse S. A. (Biomed-Lublin)
14.8.1 Company Snapshot
14.8.2 Company Overview
14.8.3 Product Benchmarking
14.9 Dendreon Pharmaceuticals LLC
14.9.1 Company Snapshot
14.9.2 Company Overview
14.9.3 Product Benchmarking
14.9.4 Strategic Outlook
14.10 F. Hoffmann-La Roche Ltd
14.10.1 Company Snapshot
14.10.2 Company Overview
14.10.3 Financial Analysis
14.10.3.1 Net Revenue, 2018-2022
14.10.3.2 R&D, 2017-2022
14.10.4 Product Benchmarking
14.10.5 Strategic Outlook
14.11 Moderna, Inc.
14.11.1 Company Snapshot
14.11.2 Company Overview
14.11.3 Financial Analysis
14.11.3.1 Net Revenue, 2017-2022
14.11.3.2 R&D, 2017-2022
14.11.3.3 Regional Market Shares, 2022
14.11.4 Product Benchmarking
14.11.5 Strategic Outlook
14.12 AstraZeneca
14.12.1 Company Snapshot
14.12.2 Company Overview
14.12.3 Financial Analysis
14.12.3.1 Net Revenue, 2017-2022
14.12.3.2 R&D, 2017-2022
14.12.3.3 Regional Market Shares, 2022
14.12.4 Product Benchmarking
15 Conclusion and Recommendations
15.1 Concluding Remarks from Visiongain
15.2 Recommendations for Market Players
ページTOPに戻る
List of Tables/Graphs
List of Tables
Table 1 Cancer Vaccines Market Snapshot, 2023 & 2033 (US$ Million, CAGR %)
Table 2 Cancer Vaccines Market Forecast by Region, 2023-2033 (US$ Million, AGR%, CAGR%): “V” Shaped Recovery
Table 3 Cancer Vaccines Market Forecast by Region, 2023-2033 (US$ Million, AGR%, CAGR%): “U” Shaped Recovery
Table 4 Cancer Vaccines Market Forecast by Region, 2023-2033 (US$ Million, AGR%, CAGR%): “W” Shaped Recovery
Table 5 Cancer Vaccines Market Forecast by Region, 2023-2033 (US$ Million, AGR%, CAGR%): “L” Shaped Recovery
Table 6 Cancer Vaccines Market Forecast by Type, 2023-2033 (US$ Million, AGR%, CAGR %)
Table 7 Preventive Vaccines Segment Market Forecast by Region, 2023-2033 (US$ Million, AGR%, CAGR %)
Table 8 Therapeutic Vaccines Segment Market Forecast by Region, 2023-2033 (US$ Million, AGR%, CAGR%)
Table 9 Cancer Vaccines Market Forecast by Technology, 2023-2033 (US$ Million, AGR%, CAGR%)
Table 10 Dendritic Cells Segment Market Forecast by Region, 2023-2033 (US$ Million, AGR%, CAGR%)
Table 11 Recombinant Segment Market Forecast by Region, 2023-2033 (US$ Million, AGR%, CAGR%)
Table 12 Antigen/Adjuvant Segment Market Forecast by Region, 2023-2033 (US$ Million, AGR%, CAGR%)
Table 13 Viral Vector and DNA Segment Market Forecast by Region, 2023-2033 (US$ Million, AGR%, CAGR%)
Table 14 Whole-cell Segment Market Forecast by Region, 2023-2033 (US$ Million, AGR%, CAGR%)
Table 15 Cancer Vaccines Market Forecast by Indications, 2023-2033 (US$ Million, AGR%, CAGR%)
Table 16 Cervical Cancer Segment Market Forecast by Region, 2023-2033 (US$ Million, AGR%, CAGR%)
Table 17 Prostate Cancer Segment Market Forecast by Region, 2023-2033 (US$ Million, AGR%, CAGR%)
Table 18 Other Indications Segment Market Forecast by Region, 2023-2033 (US$ Million, AGR%, CAGR%)
Table 19 Cancer Vaccines Market Forecast by End-users, 2023-2033 (US$ Million, AGR%, CAGR%)
Table 20 Paediatrics Segment Market Forecast by Region, 2023-2033 (US$ Million, AGR%, CAGR%)
Table 21 Adults Segment Market Forecast by Region, 2023-2033 (US$ Million, AGR%, CAGR%)
Table 22 Cancer Vaccines Market Forecast by Region, 2023-2033 (US$ Million, AGR%, CAGR%)
Table 23 North America Cancer Vaccines Market Forecast by Country, 2023-2033 (US$ Million, AGR%, CAGR%)
Table 24 North America Cancer Vaccines Market Forecast by Type, 2023-2033 (US$ Million, AGR%, CAGR%)
Table 25 North America Cancer Vaccines Market Forecast by Technology, 2023-2033 (US$ Million, AGR%, CAGR%)
Table 26 North America Cancer Vaccines Market Forecast by Indications, 2023-2033 (US$ Million, AGR%, CAGR%)
Table 27 North America Cancer Vaccines Market Forecast by End-users, 2023-2033 (US$ Million, AGR%, CAGR%)
Table 28 U.S. Cancer Vaccines Market Forecast, 2023-2033 (US$ Million, AGR%, CAGR%)
Table 29 Canada Cancer Vaccines Market Forecast, 2023-2033 (US$ Million, AGR%, CAGR%)
Table 30 Europe Cancer Vaccines Market Forecast by Country, 2023-2033 (US$ Million, AGR%, CAGR %)
Table 31 Europe Cancer Vaccines Market Forecast by Type, 2023-2033 (US$ Million, AGR%, CAGR%)
Table 32 Europe Cancer Vaccines Market Forecast by Technology, 2023-2033 (US$ Million, AGR%, CAGR %)
Table 33 Europe Cancer Vaccines Market Forecast by Indications, 2023-2033 (US$ Million, AGR%, CAGR%)
Table 34 Europe Cancer Vaccines Market Forecast by End-users, 2023-2033 (US$ Million, AGR%, CAGR%)
Table 35 Germany Cancer Vaccines Market Forecast, 2023-2033 (US$ Million, AGR%, CAGR%)
Table 36 France Cancer Vaccines Market Forecast, 2023-2033 (US$ Million, AGR%, CAGR%)
Table 37 UK Cancer Vaccines Market Forecast, 2023-2033 (US$ Million, AGR%, CAGR%)
Table 38 Italy Cancer Vaccines Market Forecast, 2023-2033 (US$ Million, AGR%, CAGR%)
Table 39 Spain Cancer Vaccines Market Forecast, 2023-2033 (US$ Million, AGR%, CAGR%)
Table 40 Russia Cancer Vaccines Market Forecast, 2023-2033 (US$ Million, AGR%, CAGR%)
Table 41 Rest of Europe Cancer Vaccines Market Forecast, 2023-2033 (US$ Million, AGR%, CAGR%)
Table 42 Asia Pacific Cancer Vaccines Market Forecast by Country, 2023-2033 (US$ Million, AGR%, CAGR%)
Table 43 Asia Pacific Cancer Vaccines Market Forecast by Type, 2023-2033 (US$ Million, AGR%, CAGR%)
Table 44 Asia Pacific Cancer Vaccines Market Forecast by Technology, 2023-2033 (US$ Million, AGR%, CAGR%)
Table 45 Asia Pacific Cancer Vaccines Market Forecast by Indications, 2023-2033 (US$ Million, AGR%, CAGR%)
Table 46 Asia Pacific Cancer Vaccines Market Forecast by End-users, 2023-2033 (US$ Million, AGR%, CAGR%)
Table 47 Japan Cancer Vaccines Market Forecast, 2023-2033 (US$ Million, AGR%, CAGR%)
Table 48 China Cancer Vaccines Market Forecast, 2023-2033 (US$ Million, AGR%, CAGR%)
Table 49 India Cancer Vaccines Market Forecast, 2023-2033 (US$ Million, AGR%, CAGR%)
Table 50 Australia Cancer Vaccines Market Forecast, 2023-2033 (US$ Million, AGR%, CAGR%)
Table 51 South Korea Cancer Vaccines Market Forecast, 2023-2033 (US$ Million, AGR%, CAGR%)
Table 52 Rest of Asia Pacific Cancer Vaccines Market Forecast, 2023-2033 (US$ Million, AGR%, CAGR %)
Table 53 Latin America Cancer Vaccines Market Forecast by Country, 2023-2033 (US$ Million, AGR%, CAGR%)
Table 54 Latin America Cancer Vaccines Market Forecast by Type, 2023-2033 (US$ Million, AGR%, CAGR%)
Table 55 Latin America Cancer Vaccines Market Forecast by Technology, 2023-2033 (US$ Million, AGR%, CAGR%)
Table 56 Latin America Cancer Vaccines Market Forecast by Indications, 2023-2033 (US$ Million, AGR%, CAGR%)
Table 57 Latin America Cancer Vaccines Market Forecast by End-users, 2023-2033 (US$ Million, AGR%, CAGR%)
Table 58 Brazil Cancer Vaccines Market Forecast, 2023-2033 (US$ Million, AGR%, CAGR%)
Table 59 Mexico Cancer Vaccines Market Forecast, 2023-2033 (US$ Million, AGR%, CAGR%)
Table 60 Rest of Latin America Cancer Vaccines Market Forecast, 2023-2033 (US$ Million, AGR%, CAGR%)
Table 61 MEA Cancer Vaccines Market Forecast by Country, 2023-2033 (US$ Million, AGR%, CAGR%)
Table 62 MEA Cancer Vaccines Market Forecast by Type, 2023-2033 (US$ Million, AGR%, CAGR%)
Table 63 MEA Cancer Vaccines Market Forecast by Technology, 2023-2033 (US$ Million, AGR%, CAGR%)
Table 64 MEA Cancer Vaccines Market Forecast by Indications, 2023-2033 (US$ Million, AGR%, CAGR%)
Table 65 MEA Cancer Vaccines Market Forecast by End-users, 2023-2033 (US$ Million, AGR%, CAGR%)
Table 66 GCC Cancer Vaccines Market Forecast, 2023-2033 (US$ Million, AGR%, CAGR%)
Table 67 South Africa Cancer Vaccines Market Forecast, 2023-2033 (US$ Million, AGR%, CAGR%)
Table 68 Rest of MEA Cancer Vaccines Market Forecast, 2023-2033 (US$ Million, AGR%, CAGR %)
Table 69 Strategic Outlook
Table 70 GSK plc: Key Details, (CEO, HQ, Revenue, Founded, No. of Employees, Company Type, Website, Business Segment)
Table 71 GSK Plc: Product Benchmarking
Table 72 GSK Plc: Strategic Outlook
Table 73 Merck & Co., Inc.: Key Details, (CEO, HQ, Revenue, Founded, No. of Employees, Company Type, Website, Business Segment)
Table 74 Merck & Co., Inc.: Product Benchmarking
Table 75 Merck & Co., Inc.: Strategic Outlook
Table 76 Amgen Inc.: Key Details, (CEO, HQ, Revenue, Founded, No. of Employees, Company Type, Website, Business Segment)
Table 77 Amgen Inc.: Product Benchmarking
Table 78 Amgen Inc.: Strategic Outlook
Table 79 Walvax Biotechnology Co. Ltd.: Key Details, (CEO, HQ, Revenue, Founded, No. of Employees, Company Type, Website, Business Segment)
Table 80 Walvax Biotechnology Co. Ltd.: Product Benchmarking
Table 81 Walvax Biotechnology Co. Ltd.: Strategic Outlook
Table 82 OSE Immunotherapeutics: Key Details, (CEO, HQ, Revenue, Founded, No. of Employees, Company Type, Website, Business Segment)
Table 83 OSE Immunotherapeutic: Product Benchmarking
Table 84 OSE Immunotherapeutic: Strategic Outlook
Table 85 Synthaverse S. A. (Biomed-Lublin): Key Details, (CEO, HQ, Revenue, Founded, No. of Employees, Company Type, Website, Business Segment)
Table 86 Synthaverse S. A. (Biomed-Lublin): Product Benchmarking
Table 87 Dendreon Pharmaceuticals LLC: Key Details, (CEO, HQ, Revenue, Founded, No. of Employees, Company Type, Website, Business Segment)
Table 88 Dendreon Pharmaceuticals LLC: Product Benchmarking
Table 89 Dendreon Pharmaceuticals LLC: Strategic Outlook
Table 90 F. Hoffmann-La Roche Ltd: Key Details, (CEO, HQ, Revenue, Founded, No. of Employees, Company Type, Website, Business Segment)
Table 91 F. Hoffmann-La Roche Ltd: Product Benchmarking
Table 92 F. Hoffmann-La Roche Ltd: Strategic Outlook
Table 93 Moderna, Inc.: Key Details, (CEO, HQ, Revenue, Founded, No. of Employees, Company Type, Website, Business Segment)
Table 94 Moderna, Inc.: Product Benchmarking
Table 95 Moderna, Inc.: Strategic Outlook
Table 96 AstraZeneca: Key Details, (CEO, HQ, Revenue, Founded, No. of Employees, Company Type, Website, Business Segment)
Table 97 AstraZeneca: Product Benchmarking
List of Figures
Figure 1 Cancer Vaccines Market Segmentation
Figure 2 Cancer Vaccines Market by Type: Market Attractiveness Index
Figure 3 Cancer Vaccines Market by Technology: Market Attractiveness Index
Figure 4 Cancer Vaccines Market by Indications: Market Attractiveness Index
Figure 5 Cancer Vaccines Market by End-users: Market Attractiveness Index
Figure 6 Cancer Vaccines Market Attractiveness Index by Region
Figure 7 Cancer Vaccines Market Dynamics
Figure 8 Global Cancer Case Rate per 100,000 People, 2015–2020
Figure 9 Global Cancer Cases by Country, 2022
Figure 10 R&D Spending by Major Oncology Companies, 2018–2022
Figure 11 Cancer Vaccines Market by Region, 2023-2033 (US$ Million, AGR %): “V” Shaped Recovery
Figure 12 Cancer Vaccines Market by Region, 2023-2033 (US$ Million, AGR %): “U” Shaped Recovery
Figure 13 Cancer Vaccines Market by Region, 2023-2033 (US$ Million, AGR %): “W” Shaped Recovery
Figure 14 Cancer Vaccines Market by Region, 2023-2033 (US$ Million, AGR %): “L” Shaped Recovery
Figure 15 Cancer Vaccines Market: Porter’s Five Forces Analysis
Figure 16 Cancer Vaccines Market: PEST Analysis
Figure 17 Cancer Vaccines Market by Type: Market Attractiveness Index
Figure 18 Cancer Vaccines Market Forecast by Type, 2023-2033 (US$ Million, AGR %)
Figure 19 Cancer Vaccines Market Share Forecast by Type, 2023, 2028, 2033 (%)
Figure 20 Preventive Vaccines Segment Market Forecast by Region, 2023-2033 (US$ Million, AGR %)
Figure 21 Preventive Vaccines Segment Market Share Forecast by Region, 2023 & 2033 (%)
Figure 22 Therapeutic Vaccines Segment Market Forecast by Region, 2023-2033 (US$ Million, AGR %)
Figure 23 Therapeutic Vaccines Segment Market Share Forecast by Region, 2023 & 2033 (%)
Figure 24 Cancer Vaccines Market by Technology: Market Attractiveness Index
Figure 25 Cancer Vaccines Market Forecast by Technology, 2023-2033 (US$ Million, AGR %)
Figure 26 Cancer Vaccines Market Share Forecast by Technology, 2023, 2028, 2033 (%)
Figure 27 Dendritic Cells Segment Market Forecast by Region, 2023-2033 (US$ Million, AGR %)
Figure 28 Dendritic Cells Segment Market Share Forecast by Region, 2023 & 2033 (%)
Figure 29 Recombinant Segment Market Forecast by Region, 2023-2033 (US$ Million, AGR %)
Figure 30 Recombinant Segment Market Share Forecast by Region, 2023 & 2033 (%)
Figure 31 Antigen/Adjuvant Segment Market Forecast by Region, 2023-2033 (US$ Million, AGR %)
Figure 32 Antigen/Adjuvant Segment Market Share Forecast by Region, 2023 & 2033 (%)
Figure 33 Viral Vector and DNA Segment Market Forecast by Region, 2023-2033 (US$ Million, AGR %)
Figure 34 Viral Vector and DNA Segment Market Share Forecast by Region, 2023 & 2033 (%)
Figure 35 Whole-cell Segment Market Forecast by Region, 2023-2033 (US$ Million, AGR %)
Figure 36 Whole-cell Segment Market Share Forecast by Region, 2023 & 2033 (%)
Figure 37 Cancer Vaccines Market by Indications: Market Attractiveness Index
Figure 38 Cancer Vaccines Market Forecast by Indications, 2023-2033 (US$ Million, AGR %)
Figure 39 Cancer Vaccines Market Share Forecast by Indications, 2023, 2028, 2033 (%)
Figure 40 Cervical Cancer Segment Market Forecast by Region, 2023-2033 (US$ Million, AGR %)
Figure 41 Cervical Cancer Segment Market Share Forecast by Region, 2023 & 2033 (%)
Figure 42 Prostate Cancer Segment Market Forecast by Region, 2023-2033 (US$ Million, AGR %)
Figure 43 Prostate Cancer Segment Market Share Forecast by Region, 2023 & 2033 (%)
Figure 44 Other Indications Market Forecast by Region, 2023-2033 (US$ Million, AGR %)
Figure 45 Other Indications Segment Market Share Forecast by Region, 2023 & 2033 (%)
Figure 46 Cancer Vaccines Market by End-users: Market Attractiveness Index
Figure 47 Cancer Vaccines Market Forecast by End-users, 2023-2033 (US$ Million, AGR %)
Figure 48 Cancer Vaccines Market Share Forecast by End-users, 2023, 2028, 2033 (%)
Figure 49 Paediatrics Segment Market Forecast by Region, 2023-2033 (US$ Million, AGR %)
Figure 50 Paediatrics Segment Market Share Forecast by Region, 2023 & 2033 (%)
Figure 51 Adults Segment Market Forecast by Region, 2023-2033 (US$ Million, AGR %)
Figure 52 Adults Segment Market Share Forecast by Region, 2023 & 2033 (%)
Figure 53 Cancer Vaccines Market Forecast by Region 2023 and 2033 (Revenue, CAGR%)
Figure 54 Cancer Vaccines Market Share Forecast by Region 2023, 2028, 2033 (%)
Figure 55 Cancer Vaccines Market by Region, 2023-2033 (US$ Million, AGR %)
Figure 56 North America Cancer Vaccines Market Attractiveness Index
Figure 57 North America Cancer Vaccines Market by Region, 2023, 2028 & 2033 (US$ Million)
Figure 58 North America Cancer Vaccines Market Forecast by Country, 2023-2033 (US$ Million, AGR %)
Figure 59 North America Cancer Vaccines Market Share Forecast by Country, 2023 & 2033 (%)
Figure 60 North America Cancer Vaccines Market Forecast by Type, 2023-2033 (US$ Million, AGR %)
Figure 61 North America Cancer Vaccines Market Share Forecast by Type, 2023 & 2033 (%)
Figure 62 North America Cancer Vaccines Market Forecast by Technology, 2023-2033 (US$ Million, AGR %)
Figure 63 North America Cancer Vaccines Market Share Forecast by Technology, 2023 & 2033 (%)
Figure 64 North America Cancer Vaccines Market Forecast by Indications, 2023-2033 (US$ Million, AGR %)
Figure 65 North America Cancer Vaccines Market Share Forecast by Indications, 2023 & 2033 (%)
Figure 66 North America Cancer Vaccines Market Forecast by End-users, 2023-2033 (US$ Million, AGR %)
Figure 67 North America Cancer Vaccines Market Share Forecast by End-users, 2023 & 2033 (%)
Figure 68 U.S. Cancer Vaccines Market Forecast, 2023-2033 (US$ Million, AGR %)
Figure 69 Canada Cancer Vaccines Market Forecast, 2023-2033 (US$ Million, AGR %)
Figure 70 Europe Cancer Vaccines Market Attractiveness Index
Figure 71 Europe Cancer Vaccines Market by Region, 2023, 2028 & 2033 (US$ Million)
Figure 72 Europe Cancer Vaccines Market Forecast by Country, 2023-2033 (US$ Million, AGR %)
Figure 73 Europe Cancer Vaccines Market Share Forecast by Country, 2023 & 2033 (%)
Figure 74 Europe Cancer Vaccines Market Forecast by Type, 2023-2033 (US$ Million, AGR %)
Figure 75 Europe Cancer Vaccines Market Share Forecast by Type, 2023 & 2033 (%)
Figure 76 Europe Cancer Vaccines Market Forecast by Technology, 2023-2033 (US$ Million, AGR %)
Figure 77 Europe Cancer Vaccines Market Share Forecast by Technology, 2023 & 2033 (%)
Figure 78 Europe Cancer Vaccines Market Forecast by Indications, 2023-2033 (US$ Million, AGR %)
Figure 79 Europe Cancer Vaccines Market Share Forecast by Indications, 2023 & 2033 (%)
Figure 80 Europe Cancer Vaccines Market Forecast by End-users, 2023-2033 (US$ Million, AGR %)
Figure 81 Europe Cancer Vaccines Market Share Forecast by End-users, 2023 & 2033 (%)
Figure 82 Germany Cancer Vaccines Market Forecast, 2023-2033 (US$ Million, AGR %)
Figure 83 France Cancer Vaccines Market Forecast, 2023-2033 (US$ Million, AGR %)
Figure 84 UK Cancer Vaccines Market Forecast, 2023-2033 (US$ Million, AGR %)
Figure 85 Italy Cancer Vaccines Market Forecast, 2023-2033 (US$ Million, AGR %)
Figure 86 Spain Cancer Vaccines Market Forecast, 2023-2033 (US$ Million, AGR %)
Figure 87 Russia Cancer Vaccines Market Forecast, 2023-2033 (US$ Million, AGR %)
Figure 88 Rest of Europe Cancer Vaccines Market Forecast, 2023-2033 (US$ Million, AGR %)
Figure 89 Asia Pacific Cancer Vaccines Market Attractiveness Index
Figure 90 Asia Pacific Cancer Vaccines Market by Region, 2023, 2028 & 2033 (US$ Million)
Figure 91 Asia Pacific Cancer Vaccines Market Forecast by Country, 2023-2033 (US$ Million, AGR %)
Figure 92 Asia Pacific Cancer Vaccines Market Share Forecast by Country, 2023 & 2033 (%)
Figure 93 Asia Pacific Cancer Vaccines Market Forecast by Type, 2023-2033 (US$ Million, AGR %)
Figure 94 Asia Pacific Cancer Vaccines Market Share Forecast by Type, 2023 & 2033 (%)
Figure 95 Asia Pacific Cancer Vaccines Market Forecast by Technology, 2023-2033 (US$ Million, AGR %)
Figure 96 Asia Pacific Cancer Vaccines Market Share Forecast by Technology, 2023 & 2033 (%)
Figure 97 Asia Pacific Cancer Vaccines Market Forecast by Indications, 2023-2033 (US$ Million, AGR %)
Figure 98 Asia Pacific Cancer Vaccines Market Share Forecast by Indications, 2023 & 2033 (%)
Figure 99 Asia Pacific Cancer Vaccines Market Forecast by End-users, 2023-2033 (US$ Million, AGR %)
Figure 100 Asia Pacific Cancer Vaccines Market Share Forecast by End-users, 2023 & 2033 (%)
Figure 101 Japan Cancer Vaccines Market Forecast, 2023-2033 (US$ Million, AGR %)
Figure 102 China Cancer Vaccines Market Forecast, 2023-2033 (US$ Million, AGR %)
Figure 103 India Cancer Vaccines Market Forecast, 2023-2033 (US$ Million, AGR %)
Figure 104 Australia Cancer Vaccines Market Forecast, 2023-2033 (US$ Million, AGR %)
Figure 105 South Korea Cancer Vaccines Market Forecast, 2023-2033 (US$ Million, AGR %)
Figure 106 Rest of Asia Pacific Cancer Vaccines Market Forecast, 2023-2033 (US$ Million, AGR %)
Figure 107 Latin America Cancer Vaccines Market Attractiveness Index
Figure 108 Latin America Cancer Vaccines Market by Region, 2023, 2028 & 2033 (US$ Million)
Figure 109 Latin America Cancer Vaccines Market Forecast by Country, 2023-2033 (US$ Million, AGR %)
Figure 110 Latin America Cancer Vaccines Market Share Forecast by Country, 2023 & 2033 (%)
Figure 111 Latin America Cancer Vaccines Market Forecast by Type, 2023-2033 (US$ Million, AGR %)
Figure 112 Latin America Cancer Vaccines Market Share Forecast by Type, 2023 & 2033 (%)
Figure 113 Latin America Cancer Vaccines Market Forecast by Technology, 2023-2033 (US$ Million, AGR %)
Figure 114 Latin America Cancer Vaccines Market Share Forecast by Technology, 2023 & 2033 (%)
Figure 115 Latin America Cancer Vaccines Market Forecast by Indications, 2023-2033 (US$ Million, AGR %)
Figure 116 Latin America Cancer Vaccines Market Share Forecast by Indications, 2023 & 2033 (%)
Figure 117 Latin America Cancer Vaccines Market Forecast by End-users, 2023-2033 (US$ Million, AGR %)
Figure 118 Latin America Cancer Vaccines Market Share Forecast by End-users, 2023 & 2033 (%)
Figure 119 Brazil Cancer Vaccines Market Forecast, 2023-2033 (US$ Million, AGR %)
Figure 120 Mexico Cancer Vaccines Market Forecast, 2023-2033 (US$ Million, AGR %)
Figure 121 Rest of Latin America Cancer Vaccines Market Forecast, 2023-2033 (US$ Million, AGR %)
Figure 122 MEA Cancer Vaccines Market Attractiveness Index
Figure 123 MEA Cancer Vaccines Market by Region, 2023, 2028 & 2033 (US$ Million)
Figure 124 MEA Cancer Vaccines Market Forecast by Country, 2023-2033 (US$ Million, AGR %)
Figure 125 MEA Cancer Vaccines Market Share Forecast by Country, 2023 & 2033 (%)
Figure 126 MEA Cancer Vaccines Market Forecast by Type, 2023-2033 (US$ Million, AGR %)
Figure 127 MEA Cancer Vaccines Market Share Forecast by Type, 2023 & 2033 (%)
Figure 128 MEA Cancer Vaccines Market Forecast by Technology, 2023-2033 (US$ Million, AGR %)
Figure 129 MEA Cancer Vaccines Market Share Forecast by Technology, 2023 & 2033 (%)
Figure 130 MEA Cancer Vaccines Market Forecast by Indications, 2023-2033 (US$ Million, AGR %)
Figure 131 MEA Cancer Vaccines Market Share Forecast by Indications, 2023 & 2033 (%)
Figure 132 MEA Cancer Vaccines Market Forecast by End-users, 2023-2033 (US$ Million, AGR %)
Figure 133 MEA Cancer Vaccines Market Share Forecast by End-users, 2023 & 2033 (%)
Figure 134 GCC Cancer Vaccines Market Forecast, 2023-2033 (US$ Million, AGR %)
Figure 135 South Africa Cancer Vaccines Market Forecast, 2023-2033 (US$ Million, AGR %)
Figure 136 Rest of MEA Cancer Vaccines Market Forecast, 2023-2033 (US$ Million, AGR %)
Figure 137 GSK PLC: Net Revenue, 2017-2022 (US$ Billion, AGR%)
Figure 138 GSK PLC: R&D, 2017-2022 (US$ Billion, AGR%)
Figure 139 GSK Plc: Regional Market Shares, 2022
Figure 140 Merck & Co., Inc.: Net Revenue, 2017-2022 (US$ Billion, AGR%)
Figure 141 Merck & Co., Inc.: R&D, 2017-2022 (US$ Billion, AGR%)
Figure 142 Merck & Co., Inc.: Regional Market Shares, 2022
Figure 143 Amgen Inc.: Net Revenue, 2017-2022 (US$ Billion, AGR%)
Figure 144 Amgen Inc.: R&D, 2017-2022 (US$ Billion, AGR%)
Figure 145 Amgen Inc.: Regional Market Shares, 2022
Figure 146 Walvax Biotechnology Co. Ltd.: Net Revenue, 2018-2022 (US$ Million, AGR%)
Figure 147 Walvax Biotechnology Co. Ltd.: R&D, 2018-2022 (US$ Million, AGR%)
Figure 148 OSE Immunotherapeutics: Net Revenue, 2018-2022 (US$ Million, AGR%)
Figure 149 OSE Immunotherapeutics: R&D, 2017-2022 (US$ Million, AGR%)
Figure 150 F. Hoffmann-La Roche Ltd: Net Revenue, 2018-2022 (US$ Billion, AGR%)
Figure 151 F. Hoffmann-La Roche Ltd: R&D, 2017-2022 (US$ Billion, AGR%)
Figure 152 Moderna, Inc.: Net Revenue, 2017-2022 (US$ Billion, AGR%)
Figure 153 Moderna, Inc.: R&D, 2017-2022 (US$ Billion, AGR%)
Figure 154 Moderna, Inc.: Regional Market Shares, 2022
Figure 155 AstraZeneca: Net Revenue, 2017-2022 (US$ Billion, AGR%)
Figure 156 AstraZeneca: R&D, 2017-2022 (US$ Billion, AGR%)
Figure 157 AstraZeneca: Regional Market Shares, 2022
ページTOPに戻る
本レポートと同分野(医療/ヘルスケア)の最新刊レポート
Visiongain社のヘルスケアと医薬・化学品分野での最新刊レポート
本レポートと同じKEY WORD(cancer)の最新刊レポート
よくあるご質問
Visiongain社はどのような調査会社ですか?
英国の調査会社ヴィジョンゲイン社(Visiongain)は、通信とエネルギーのほか、自動車や化学・医薬品、金属など、広範な市場を対象に調査を行っています。自動車市場については、市場全般に関する調査のほ... もっと見る
調査レポートの納品までの日数はどの程度ですか?
在庫のあるものは速納となりますが、平均的には 3-4日と見て下さい。
但し、一部の調査レポートでは、発注を受けた段階で内容更新をして納品をする場合もあります。
発注をする前のお問合せをお願いします。
注文の手続きはどのようになっていますか?
1)お客様からの御問い合わせをいただきます。
2)見積書やサンプルの提示をいたします。
3)お客様指定、もしくは弊社の発注書をメール添付にて発送してください。
4)データリソース社からレポート発行元の調査会社へ納品手配します。
5) 調査会社からお客様へ納品されます。最近は、pdfにてのメール納品が大半です。
お支払方法の方法はどのようになっていますか?
納品と同時にデータリソース社よりお客様へ請求書(必要に応じて納品書も)を発送いたします。
お客様よりデータリソース社へ(通常は円払い)の御振り込みをお願いします。
請求書は、納品日の日付で発行しますので、翌月最終営業日までの当社指定口座への振込みをお願いします。振込み手数料は御社負担にてお願いします。
お客様の御支払い条件が60日以上の場合は御相談ください。
尚、初めてのお取引先や個人の場合、前払いをお願いすることもあります。ご了承のほど、お願いします。
データリソース社はどのような会社ですか?
当社は、世界各国の主要調査会社・レポート出版社と提携し、世界各国の市場調査レポートや技術動向レポートなどを日本国内の企業・公官庁及び教育研究機関に提供しております。
世界各国の「市場・技術・法規制などの」実情を調査・収集される時には、データリソース社にご相談ください。
お客様の御要望にあったデータや情報を抽出する為のレポート紹介や調査のアドバイスも致します。
|
|

