ワクチン受託製造市場レポート:2023-2033
Vaccine Contract Manufacturing Market Report 2023-2033
レポート詳細
ワクチン受託製造市場レポート 2023-2033年 :業界とその基礎となる原動力をより良く理解することを望むなら、新たな収益ポケットを目指す大手企業にとって貴重なものとなるでしょう。... もっと見る
※上記価格は部署ライセンス(Departmental licence)価格です。
その他の価格についてはデータリソースまでお問合せください。
日本語のページは自動翻訳を利用し作成しています。
実際のレポートは英文のみでご納品いたします。

|

|
サマリー
レポート詳細
ワクチン受託製造市場レポート 2023-2033年:業界とその基礎となる原動力をより良く理解することを望むなら、新たな収益ポケットを目指す大手企業にとって貴重なものとなるでしょう。異業種への進出や新規地域での既存事業の拡大を目指す企業にも有用です。
世界的な需要の増加、製品革新と費用対効果が市場成長を牽引
人口増加、高齢化、感染症の発生など様々な要因により、ワクチン需要は世界的に高まっている。このような需要の増加は、特にパンデミックや広範囲に及ぶ感染症の流行時に、ワクチン開発業者の生産ニーズに対応するための受託製造業者のビジネスチャンスを生み出している。ワクチンの研究開発の進歩により、新しいワクチンや改良された製剤が発見されている。契約製造業者は、これらのイノベーションを商業製品に転換する上で重要な役割を担っている。ワクチン開発企業は研究開発活動に注力する一方で、製造業務を外部パートナーに依頼することが多く、製造受託サービスへの需要が高まっています。受託製造は、ワクチン製造に費用対効果の高いソリューションを提供できる。ワクチン開発企業にとって、大規模な製造施設を設立・維持することは資本集約的である可能性があります。一方、製造受託企業は既存のインフラ、設備、専門知識を活用することで、より低い単位あたりのコストでワクチンを製造することができます。このコスト優位性により、受託製造はワクチン開発企業にとって魅力的な選択肢となります。
業界の成長を妨げる規制、知的財産、生産能力の課題
ワクチン製造業界は規制が厳しく、受託製造業者は米国食品医薬品局(FDA)や欧州医薬品庁(EMA)などの規制当局が課す厳しい規制要件を遵守する必要がある。こうした規制の遵守は複雑で時間がかかるため、製造の遅れやコスト増につながる可能性がある。ワクチンは特許技術や独自の製造工程を伴うことが多い。契約製造業者は、ワクチン開発者が保有する知的財産権により、これらの技術へのアクセスや使用において制限や制約に直面する可能性がある。ライセンス契約の交渉や知的財産の保護は困難であり、特定の契約製造業者の市場参入が制限される可能性があります。ワクチンの製造能力は限られており、特にパンデミックや広範囲に及ぶアウトブレイク時には、高い需要が発生することが多い。受託製造業者は、厳しいスケジュール内で必要量を満たすために生産規模を拡大するという課題に直面する可能性がある。製造能力の限界は、遅延や供給不足を招き、利用可能なプロジェクトをめぐる契約製造業者間の競争を激化させる可能性がある。
市場調査レポートを購入する前にすべき質問とは?
- ワクチン受託製造市場はどのように進化しているのか?
- ワクチン受託製造市場の推進要因と阻害要因は何か?
- 各ワクチン受託製造サブマーケットセグメントは予測期間中にどのように成長し、2033年にはどれくらいの売上を占めるようになるのか?
- 2023年から2033年にかけて、各ワクチン受託製造サブマーケットの市場シェアはどのように推移するのか?
- 2023年から2033年にかけて、市場全体の主な牽引役は何か?
- 主要なワクチン受託製造市場はマクロ経済ダイナミクスに概ね追随するのか、それとも個々の国内市場が他を凌駕するのか?
- 2033年までに各国市場のシェアはどのように変化し、2033年にはどの地域が市場をリードするのか?
- 主要プレイヤーは誰で、予測期間中の見通しは?
- これらの大手企業のワクチン受託製造プロジェクトはどのようなものですか?
- 2023年から2033年の間に、業界はどのように発展していくのでしょうか?現在および今後10年間に実施されるワクチン受託製造プロジェクトにはどのような意味があるのでしょうか?
- ワクチン受託製造市場をさらに拡大するために、製品の商業化の必要性は高まっていますか?
- ワクチン受託製造市場はどこに向かい、どのようにすれば市場の最前線に立てるのか?
- 新製品やサービスラインに対する最適な投資オプションは何か?
- 企業を新たな成長軌道に乗せ、C-suiteに移行させるための重要な展望とは?
このことが現在、そして今後10年間のワクチン受託製造市場にどのような影響を与えるかを見極める必要がある:
- 375ページにわたる本レポートでは、143の表と229の図表を掲載しています。
- 本レポートは、業界における主要な有利分野にハイライトを当てているため、今すぐターゲットを絞ることができます。
- 世界、地域、国の売上と成長に関する詳細な分析が含まれています。
- 競合他社が成功した主なトレンド、変化、収益予測をハイライトしています。
本レポートは、ワクチン受託製造市場が今後10年間でどのように発展するか、またCOVID-19の景気後退と好転の変動に合わせてどのように発展するかをお伝えします。この市場は、過去10年間のどの時点よりも今が重要である。
2033年までの予測やその他の分析から、商業的な展望が明らかになる
- 2033年までの収益予測に加え、直近の業績、成長率、市場シェアもご覧いただけます。
- ビジネスの展望と展開に関する独自の分析をご覧いただけます。
- 定性的分析(市場ダイナミクス、促進要因、機会、阻害要因、課題を含む)、コスト構造、ワクチン受託製造価格上昇の影響、最新動向をご覧いただけます。
本レポートには、COVID-19が業界と貴社にどのような影響を与えるかについてのデータ分析と貴重な洞察が含まれている。本レポートでは、COVID-19の4つの回収パターンとその影響、すなわち「V」、「L」、「W」、「U」について論じている。
レポート対象セグメント
工程
- 上流工程
- 下流工程
下流工程
- 充填・仕上げ作業
- 分析・QC研究
- ワクチン包装
上流工程
- 哺乳類発現ワクチンタイプ
- 細菌発現ワクチン・タイプ
- 酵母発現ワクチン
- バキュロウイルス/昆虫発現ワクチンタイプ
- その他の上流工程
最終用途
- 人体用
- 動物用
タイプ
- サブユニットワクチン
- 生ワクチン
- 結合型ワクチン
- 不活化ワクチン
- トキソイドワクチン
- ウイルスベクターワクチン
- 組み換えベクターワクチン
- その他のワクチン
業務
- 前臨床
- 臨床
- 商業
企業規模
- 小規模メーカー
- 中堅メーカー
- 大手メーカー
- 超大手メーカー
世界市場全体と各分野の売上予測に加え、5つの地域と21の主要国市場の売上予測も掲載しています:
北米
- アメリカ
- カナダ
欧州
- ドイツ
- 英国
- フランス
- イタリア
- スペイン
- ロシア
- その他の欧州地域
アジア太平洋
- 中国
- 日本
- インド
- オーストラリア
- 韓国
- その他のアジア太平洋地域
ラテンアメリカ
- ブラジル
- メキシコ
- その他のラテンアメリカ
MEA
- GCC
- 南アフリカ
- その他のMEA
2023年から2033年までのワクチン受託製造市場における主要企業のプロファイルも掲載している。
主要企業と市場成長の可能性
・ Ajinomoto Bio-Pharma
・ Batavia Biosciences B.V.
・ Bavarian Nordic
・ Catalent Inc
・ Charles River Laboratories
・ Curia Global, Inc.
・ Emergent BioSolutions
・ FUJIFILM Holdings Corporation
・ ICON plc
・ IDT Biologika
・ Lonza
・ Recipharm AB
・ Richter-Helm BioLogics GmbH & Co. KG
・ Vibalogics
・ WuXi Biologics
2023年から2033年にかけてのワクチン受託製造市場全体の世界売上高は、金額ベースで2023年に30億9,500万米ドルを突破する。2033年まで堅調な売上成長を予測している。当研究所では、最も大きな可能性を秘めた組織を特定する。彼らの能力、進歩、商業的展望を発見し、一歩先を行くお手伝いをします。
ワクチン受託製造市場、2023-2033年レポートはどのように役立つのか?
要約すると、370ページを超えるこのレポートは、以下の知識を提供する:
- ワクチン受託製造市場の2023年~2033年までの収益予測、プロセス、上流、下流、最終用途、タイプ、事業、企業規模を世界および地域レベルで各予測 - 業界の展望を発見し、投資と収益に最も有利な場所を見つけることができます。
- 5つの地域と21の主要国市場の2033年までの収益予測 - 北米、ヨーロッパ、アジア太平洋、ラテンアメリカ、MEAのワクチン受託製造市場の2023年から2033年までの予測をご覧ください。また、米国、カナダ、メキシコ、ブラジル、ドイツ、フランス、英国、イタリア、中国、インド、日本、オーストラリアなどの主要国の市場も予測しています。
- 2023年から2033年までのワクチン受託製造市場に関わる主要企業15社の企業プロファイルを含む。
独自の予測による定量的・定性的分析をご覧ください。私たちのレポートだけに含まれる情報を入手し、貴重なビジネスインテリジェンスで情報を得ることができます。
他にはない情報
私たちの新しいレポートがあれば、知識に遅れをとったり、チャンスを逃したりする可能性が低くなります。Visiongainの調査が貴社の調査、分析、意思決定にどのように役立つかをご覧ください。Visiongainの調査は、ワクチン受託製造市場をリードする企業の商業的分析を必要とするすべての人のためのものです。データ、トレンド、予測をご覧いただけます。
ページTOPに戻る
目次
目次
1 レポート概要
1.1 研究の目的
1.2 ワクチン受託製造市場の紹介
1.3 本レポートの内容
1.4 本レポートを読むべき理由
1.5 本分析レポートが回答する主な質問
1.6 本レポートの対象者
1.7 方法論
1.7.1 市場の定義
1.7.2 市場評価・予測手法
1.7.3 データの検証
1.7.3.1 一次調査
1.7.3.2 セカンダリーリサーチ
1.8 よくある質問(FAQ)
1.9 Visiongainの関連レポート
1.10 Visiongainについて
2 エグゼクティブサマリー
3 市場概要
3.1 主要な調査結果
3.2 市場ダイナミクス
3.2.1 市場促進要因
3.2.1.1 感染症の成長
3.2.1.2 ステークホルダーの協力による製造能力の最大化
3.2.2 市場抑制要因
3.2.2.1 材料と設備の不足
3.2.2.2 製造工程の複雑さ
3.2.3 市場機会
3.2.3.1 新しいワクチン技術
3.2.3.2 遺伝子ベースのワクチン
3.3 COVID-19の影響分析
3.4 ポーターのファイブフォース分析
3.4.1 供給者の交渉力
3.4.2 バイヤーの交渉力
3.4.3 競争相手のライバル関係
3.4.4 代替品による脅威
3.4.5 新規参入企業の脅威
3.5 PEST分析
4 ワクチン受託製造市場分析:プロセス別
4.1 主要な調査結果
4.2 適応症セグメント 市場魅力度指数
4.3 ワクチン受託製造のプロセス別市場規模推定と予測
4.4 上流工程
4.4.1 2023年~2033年、地域別市場規模(US$ Million)
4.4.2 地域別市場シェア、2023年・2033年(%)
4.5 下流工程
4.5.1 2023年~2033年、地域別市場規模(US$ Million)
4.5.2 地域別市場シェア、2023年・2033年(%)
5 ワクチン受託製造市場分析:下流工程別
5.1 主要な調査結果
5.2 下流工程セグメント: 市場魅力度指数
5.3 下流工程別ワクチン受託製造市場規模推定と予測
5.4 充填・仕上げ作業
5.4.1 2023年~2033年、地域別市場規模(US$ Million)
5.4.2 地域別市場シェア、2023年・2033年(%)
5.5 分析・QC業務
5.5.1 2023年~2033年、地域別市場規模(US$ Million)
5.5.2 地域別市場シェア、2023年・2033年(%)
5.6 ワクチン包装
5.6.1 2023年~2033年、地域別市場規模(US$ Million)
5.6.2 地域別市場シェア、2023年・2033年 (%)
6 ワクチン受託製造市場分析:上流工程別
6.1 主要な調査結果
6.2 上流工程セグメント: 市場魅力度指数
6.3 上流工程別ワクチン受託製造市場規模推定と予測
6.4 哺乳動物発現ワクチンタイプ
6.4.1 2023年~2033年、地域別市場規模(US$ Million)
6.4.2 地域別市場シェア、2023年・2033年(%)
6.5 細菌発現ワクチンタイプ
6.5.1 2023年~2033年、地域別市場規模(US$ Million)
6.5.2 地域別市場シェア、2023年・2033年(%)
6.6 酵母発現ワクチンタイプ
6.6.1 2023年~2033年、地域別市場規模(US$ Million)
6.6.2 地域別市場シェア、2023年・2033年(%)
6.7 バキュロウイルス/昆虫発現ワクチンタイプ
6.7.1 2023年~2033年、地域別市場規模(US$ Million)
6.7.2 地域別市場シェア、2023年・2033年(%)
6.8 その他の上流工程
6.8.1 2023年~2033年、地域別市場規模(US$ Million)
6.8.2 地域別市場シェア、2023年・2033年(%)
7 ワクチン受託製造市場分析:エンドユース別
7.1 主要調査結果
7.2 エンドユーズセグメント: 市場魅力度指数
7.3 エンドユース別ワクチン受託製造市場規模推定と予測
7.4 ヒト用
7.4.1 2023年~2033年、地域別市場規模(US$ Million)
7.4.2 地域別市場シェア、2023年・2033年(%)
7.5 獣医用
7.5.1 2023年~2033年、地域別市場規模(US$ Million)
7.5.2 地域別市場シェア、2023年・2033年 (%)
8 ワクチン受託製造市場分析:ワクチンタイプ別
8.1 主要な調査結果
8.2 ワクチンタイプ別セグメント 市場魅力度指数
8.3 ワクチンタイプ別ワクチン受託製造市場規模の推定と予測
8.4 サブユニットワクチン
8.4.1 2023年~2033年、地域別市場規模(US$ Million)
8.4.2 地域別市場シェア、2023年・2033年(%)
8.5 生体不活化ワクチン
8.5.1 2023年~2033年、地域別市場規模(US$ Million)
8.5.2 地域別市場シェア、2023年・2033年(%)
8.6 抱合型ワクチン
8.6.1 2023年~2033年、地域別市場規模(US$ Million)
8.6.2 2023年・2033年の地域別市場シェア(%)
8.7 不活化ワクチン
8.7.1 2023年~2033年、地域別市場規模(US$ Million)
8.7.2 地域別市場シェア、2023年・2033年(%)
8.8 トキソイドワクチン
8.8.1 2023年~2033年、地域別市場規模(US$ Million)
8.8.2 地域別市場シェア、2023年・2033年(%)
8.9 ウイルスベクターワクチン
8.9.1 2023年~2033年、地域別市場規模(US$ Million)
8.9.2 地域別市場シェア、2023年・2033年(%)
8.10 組換えベクターワクチン
8.10.1 2023年~2033年、地域別市場規模(US$ Million)
8.10.2 地域別市場シェア、2023年・2033年(%)
8.11 その他のワクチンタイプ
8.11.1 2023年~2033年、地域別市場規模(US$ Million)
8.11.2 地域別市場シェア、2023年・2033年(%)
9 ワクチン受託製造市場分析:オペレーション別
9.1 主要な調査結果
9.2 オペレーションセグメント別 市場魅力度指数
9.3 オペレーション別ワクチン受託製造市場規模推定と予測
9.4 前臨床
9.4.1 2023年~2033年、地域別市場規模(US$ Million)
9.4.2 地域別市場シェア、2023年・2033年(%)
9.5 臨床
9.5.1 2023年~2033年、地域別市場規模(US$ Million)
9.5.2 地域別市場シェア、2023年・2033年 (%)
9.6 商業
9.6.1 2023年~2033年、地域別市場規模(US$ Million)
9.6.2 地域別市場シェア、2023年・2033年 (%)
10 ワクチン受託製造市場分析:企業規模別
10.1 主要な調査結果
10.2 企業規模セグメント: 市場魅力度指数
10.3 企業規模別ワクチン受託製造市場規模の推定と予測
10.4 小規模メーカー
10.4.1 2023年~2033年、地域別市場規模(US$ Million)
10.4.2 地域別市場シェア、2023年・2033年(%)
10.5 中堅メーカー
10.5.1 2023年~2033年、地域別市場規模(US$ Million)
10.5.2 地域別市場シェア、2023年・2033年(%)
10.6 大規模メーカー
10.6.1 2023年~2033年、地域別市場規模(US$ Million)
10.6.2 地域別市場シェア、2023年・2033年 (%)
10.7 超大型メーカー
10.7.1 2023年~2033年、地域別市場規模(US$ Million)
10.7.2 地域別市場シェア、2023年・2033年 (%)
11 ワクチン受託製造市場分析:地域別
11.1 主要な調査結果
11.2 地域別市場規模の推定と予測
12 北米のワクチン受託製造市場分析
12.1 主要な調査結果
12.2 北米ワクチン受託製造市場魅力度指数
12.3 北米のワクチン受託製造市場の国別、2023年、2028年、2033年(US$ Million)
12.4 北米のワクチン受託製造市場規模推定と予測:国別
12.5 北米のワクチン受託製造市場規模推定と予測:工程別
12.6 北米のワクチン受託製造市場規模推定と予測:下流工程別
12.7 北米のワクチン受託製造市場規模推定と予測:上流工程別
12.8 北米のワクチン受託製造市場規模推定と予測:エンドユーザー別
12.9 北米のワクチン受託製造市場規模推定と予測:ワクチンタイプ別
12.10 北米のワクチン受託製造市場規模推定と予測:オペレーション別
12.11 北米のワクチン受託製造市場規模推定と予測:企業規模別
12.12 アメリカのワクチン受託製造市場分析
12.13 カナダのワクチン受託製造市場分析
13 欧州のワクチン受託製造市場分析
13.1 主要な調査結果
13.2 欧州ワクチン受託製造市場魅力度指数
13.3 欧州のワクチン受託製造市場の国別推移、2023年、2028年、2033年(US$ Million)
13.4 欧州のワクチン受託製造市場規模推定と予測:国別
13.5 欧州のワクチン受託製造市場規模推定と予測:プロセス別
13.6 欧州のワクチン受託製造市場規模推定と予測:下流工程別
13.7 欧州のワクチン受託製造市場規模推定と予測:上流工程別
13.8 欧州のワクチン受託製造市場規模推定と予測:エンドユーザー別
13.9 欧州のワクチン受託製造市場規模推定と予測:ワクチンタイプ別
13.10 欧州のワクチン受託製造市場規模推定と予測:オペレーション別
13.11 欧州のワクチン受託製造市場規模推定と予測:企業規模別
13.12 ドイツのワクチン受託製造市場分析
13.13 イギリスのワクチン受託製造市場分析
13.14 フランスのワクチン受託製造市場の分析
13.15 イタリアのワクチン受託製造市場の分析
13.16 スペインのワクチン受託製造市場分析
13.17 ロシアワクチン受託製造市場分析
13.18 その他の欧州地域のワクチン受託製造市場分析
14 アジア太平洋地域のワクチン受託製造市場分析
14.1 主要な調査結果
14.2 アジア太平洋地域のワクチン受託製造市場魅力度指数
14.3 アジア太平洋地域のワクチン受託製造市場の国別推移、2023年、2028年、2033年(US$ Million)
14.4 アジア太平洋地域のワクチン受託製造市場規模推定と予測:国別
14.5 アジア太平洋地域のワクチン受託製造市場規模推定と予測:プロセス別
14.6 アジア太平洋地域のワクチン受託製造市場規模推定と予測:下流工程別
14.7 アジア太平洋地域のワクチン受託製造市場規模推定と予測:上流工程別
14.8 アジア太平洋地域のワクチン受託製造市場規模推定と予測:エンドユーザー別
14.9 アジア太平洋地域のワクチン受託製造市場規模推定と予測:ワクチンタイプ別
14.10 アジア太平洋地域のワクチン受託製造市場規模推定と予測:事業別
14.11 アジア太平洋地域のワクチン受託製造市場規模推定と予測:企業規模別
14.12 中国ワクチン受託製造市場分析
14.13 インドのワクチン受託製造市場分析
14.14 日本のワクチン受託製造市場の分析
14.15 韓国ワクチン受託製造市場の分析
14.16 オーストラリアのワクチン受託製造市場分析
14.17 その他のアジア太平洋地域のワクチン受託製造市場分析
15 ラテンアメリカのワクチン受託製造市場分析
15.1 主要な調査結果
15.2 ラテンアメリカのワクチン受託製造市場魅力度指数
15.3 ラテンアメリカのワクチン受託製造市場の国別推移、2023年、2028年、2033年(US$ Million)
15.4 ラテンアメリカのワクチン受託製造市場規模推定と予測:国別
15.5 ラテンアメリカのワクチン受託製造市場規模推定と予測:プロセス別
15.6 ラテンアメリカのワクチン受託製造市場規模推定と予測:下流工程別
15.7 ラテンアメリカのワクチン受託製造市場規模推定と予測:上流工程別
15.8 ラテンアメリカのワクチン受託製造市場規模推定と予測:エンドユーザー別
15.9 ラテンアメリカのワクチン受託製造市場規模推定と予測:ワクチンタイプ別
15.10 ラテンアメリカのワクチン受託製造市場規模推定と予測:事業別
15.11 ラテンアメリカのワクチン受託製造市場規模推定と予測:企業規模別
15.12 ブラジルのワクチン受託製造市場分析
15.13 メキシコのワクチン受託製造市場分析
15.14 その他のラテンアメリカのワクチン受託製造市場分析
16 中東・アフリカのワクチン受託製造市場分析
16.1 主要な調査結果
16.2 中東・アフリカのワクチン受託製造市場魅力度指数
16.3 中東・アフリカのワクチン受託製造国別市場、2023年、2028年、2033年(US$ Million)
16.4 中東・アフリカのワクチン受託製造市場規模推定と予測:国別
16.5 中東・アフリカのワクチン受託製造市場規模推定と予測:工程別
16.6 中東・アフリカのワクチン受託製造市場規模推定と予測:下流工程別
16.7 中東・アフリカのワクチン受託製造市場規模推定と予測:上流工程別
16.8 中東・アフリカのワクチン受託製造市場規模推定と予測:エンドユーザー別
16.9 中東・アフリカのワクチン受託製造市場規模推定と予測:ワクチンタイプ別
16.10 中東・アフリカのワクチン受託製造市場規模推定と予測:事業別
16.11 中東・アフリカのワクチン受託製造市場規模推定と予測:企業規模別
16.12 GCCのワクチン受託製造市場分析
16.13 南アフリカのワクチン受託製造市場分析
16.14 その他のMEAのワクチン受託製造市場分析
17 企業プロフィール
17.1 競争環境、2022年
17.2 戦略的展望
17.3 キャタレント社
17.3.1 会社概要
17.3.2 会社概要
17.3.3 財務分析
17.3.3.1 純収入、2017-2022年
17.3.3.2 地域市場シェア、2022年
17.3.4 サービスベンチマーク
17.3.5 戦略的展望
17.4 Emergent BioSolutions
17.4.1 会社概要
17.4.2 会社概要
17.4.3 財務分析
17.4.3.1 純収入、2017-2022年
17.4.3.2 R&D、2017-2022年
17.4.3.3 地域市場シェア、2022年
17.4.4 サービスベンチマーク
17.4.5 戦略的展望
17.5 Ajinomoto Bio-Pharma
17.5.1 会社概要
17.5.2 会社概要
17.5.3 財務分析
17.5.3.1 純収入、2017-2022年
17.5.3.2 地域市場シェア、2022年
17.5.4 サービスベンチマーク
17.5.5 戦略的展望
17.6 Lonza
17.6.1 会社概要
17.6.2 会社概要
17.6.3 財務分析
17.6.3.1 純収入、2017-2022年
17.6.3.2 R&D、2017年〜2022年
17.6.3.3 地域市場シェア、2022年
17.6.4 サービスベンチマーク
17.6.5 戦略的展望
17.7 Curia Global, Inc.
17.7.1 会社概要
17.7.2 会社概要
17.7.3 サービス・ベンチマーク
17.7.4 戦略的展望
17.8 WuXi Biologics
17.8.1 会社概要
17.8.2 会社概要
17.8.3 財務分析
17.8.3.1 純収入、2017-2022年
17.8.3.2 R&D、2017-2022年
17.8.3.3 地域市場シェア、2022年
17.8.4 サービスベンチマーク
17.8.5 戦略的展望
17.9 Vibalogics
17.9.1 会社概要
17.9.2 会社概要
17.9.3 サービスベンチマーク
17.9.4 戦略的展望
17.10 FUJIFILM Holdings Corporation
17.10.1 会社概要
17.10.2 会社概要
17.10.3 財務分析
17.10.3.1 純収入、2017-2022年
17.10.3.2 売上高、2017-2022年
17.10.3.3 地域市場シェア、2022年
17.10.4 サービスベンチマーク
17.11 Recipharm AB
17.11.1 会社概要
17.11.2 会社概要
17.11.3 サービス・ベンチマーク
17.11.4 戦略的展望
17.12 Richter-Helm BioLogics GmbH & Co. KG
17.12.1 会社概要
17.12.2 会社概要
17.12.3 サービスベンチマーク
17.12.4 戦略的展望
17.13 Bavarian Nordic
17.13.1 会社概要
17.13.2 会社概要
17.13.3 財務分析
17.13.3.1 純収入、2017-2022年
17.13.3.2 売上高、2017-2022年
17.13.4 サービスベンチマーク
17.14 Charles River Laboratories
17.14.1 会社概要
17.14.2 会社概要
17.14.3 財務分析
17.14.3.1 純収入、2017-2022年
17.14.3.2 地域市場シェア、2022年
17.14.4 サービスベンチマーク
17.14.5 戦略的展望
17.15 ICON plc
17.15.1 会社概要
17.15.2 会社概要
17.15.3 財務分析
17.15.3.1 純収入, 2017-2022
17.15.3.2 R&D、2017-2022年
17.15.3.3 地域市場シェア、2022年
17.15.4 サービスベンチマーク
17.15.5 戦略的展望
17.16 Batavia Biosciences B.V.
17.16.1 会社概要
17.16.2 会社概要
17.16.3 サービス・ベンチマーク
17.17 IDT Biologika
17.17.1 会社概要
17.17.2 会社概要
17.17.3 サービス・ベンチマーク
18 結論と提言
18.1 Visiongainからの結びの言葉
18.2 市場プレイヤーへの提言
ページTOPに戻る
図表リスト
表の一覧
Table 1 Vaccine Contract Manufacturing Market Snapshot, 2023 & 2033 (US$ Million, CAGR %)
Table 2 Vaccine Contract Manufacturing Market Forecast by Region, 2023-2033 (US$ Million, AGR%, CAGR%): “V” Shaped Recovery
Table 3 Vaccine Contract Manufacturing Market Forecast by Region, 2023-2033 (US$ Million, AGR%, CAGR%): “U” Shaped Recovery
Table 4 Vaccine Contract Manufacturing Market Forecast by Region, 2023-2033 (US$ Million, AGR%, CAGR%): “W” Shaped Recovery
Table 5 Vaccine Contract Manufacturing Market Forecast by Region, 2023-2033 (US$ Million, AGR%, CAGR%): “L” Shaped Recovery
Table 6 Vaccine Contract Manufacturing Market Forecast by Process, 2023-2033 (US$ Million, AGR%, CAGR%)
Table 7 Upstream Process Segment Market Forecast by Region, 2023-2033 (US$ Million, AGR%, CAGR%)
Table 8 Downstream Process Segment Market Forecast by Region, 2023-2033 (US$ Million, AGR%, CAGR%)
Table 9 Vaccine Contract Manufacturing Market Forecast by Downstream Process, 2023-2033 (US$ Million, AGR%, CAGR%)
Table 10 Fill & Finish Operations Segment Market Forecast by Region, 2023-2033 (US$ Million, AGR%, CAGR%)
Table 11 Analytical & QC Studies Segment Market Forecast by Region, 2023-2033 (US$ Million, AGR%, CAGR%)
Table 12 Vaccine Packaging Segment Market Forecast by Region, 2023-2033 (US$ Million, AGR%, CAGR%)
Table 13 Vaccine Contract Manufacturing Market Forecast by Upstream Process, 2023-2033 (US$ Million, AGR%, CAGR%)
Table 14 Mammalian Expression Vaccine Type Segment Market Forecast by Region, 2023-2033 (US$ Million, AGR%, CAGR%)
Table 15 Bacterial Expression Vaccine Type Segment Market Forecast by Region, 2023-2033 (US$ Million, AGR%, CAGR%)
Table 16 Yeast Expression Vaccine Type Segment Market Forecast by Region, 2023-2033 (US$ Million, AGR%, CAGR%)
Table 17 Baculovirus/insect Expression Vaccine Type Segment Market Forecast by Region, 2023-2033 (US$ Million, AGR%, CAGR%)
Table 18 Other Upstream Process Segment Market Forecast by Region, 2023-2033 (US$ Million, AGR%, CAGR%)
Table 19 Vaccine Contract Manufacturing Market Forecast by End-use, 2023-2033 (US$ Million, AGR%, CAGR%)
Table 20 Human Use Segment Market Forecast by Region, 2023-2033 (US$ Million, AGR%, CAGR%)
Table 21 Veterinary Segment Market Forecast by Region, 2023-2033 (US$ Million, AGR%, CAGR%)
Table 22 Vaccine Contract Manufacturing Market Forecast by Vaccine Type, 2023-2033 (US$ Million, AGR%, CAGR%)
Table 23 Subunit Vaccines Type Segment Market Forecast by Region, 2023-2033 (US$ Million, AGR%, CAGR%)
Table 24 Live Attenuated Vaccines Segment Market Forecast by Region, 2023-2033 (US$ Million, AGR%, CAGR%)
Table 25 Conjugate Vaccines Segment Market Forecast by Region, 2023-2033 (US$ Million, AGR%, CAGR%)
Table 26 Inactivated Vaccines Segment Market Forecast by Region, 2023-2033 (US$ Million, AGR%, CAGR%)
Table 27 Toxoid Vaccines Segment Market Forecast by Region, 2023-2033 (US$ Million, AGR%, CAGR%)
Table 28 Viral Vector Vaccines Segment Market Forecast by Region, 2023-2033 (US$ Million, AGR%, CAGR%)
Table 29 Recombinant Vector Vaccines Segment Market Forecast by Region, 2023-2033 (US$ Million, AGR%, CAGR%)
Table 30 Other Vaccine Types Segment Market Forecast by Region, 2023-2033 (US$ Million, AGR%, CAGR%)
Table 31 Vaccine Contract Manufacturing Market Forecast by Operation, 2023-2033 (US$ Million, AGR%, CAGR%)
Table 32 Preclinical Segment Market Forecast by Region, 2023-2033 (US$ Million, AGR%, CAGR%)
Table 33 Clinical Segment Market Forecast by Region, 2023-2033 (US$ Million, AGR%, CAGR%)
Table 34 Commercial Segment Market Forecast by Region, 2023-2033 (US$ Million, AGR%, CAGR%)
Table 35 Vaccine Contract Manufacturing Market Forecast by Company Size, 2023-2033 (US$ Million, AGR%, CAGR%)
Table 36 Small Manufacturers Segment Market Forecast by Region, 2023-2033 (US$ Million, AGR%, CAGR%)
Table 37 Mid-sized Manufacturer Segment Market Forecast by Region, 2023-2033 (US$ Million, AGR%, CAGR%)
Table 38 Large Manufacturers Segment Market Forecast by Region, 2023-2033 (US$ Million, AGR%, CAGR%)
Table 39 Very Large Manufacturers Segment Market Forecast by Region, 2023-2033 (US$ Million, AGR%, CAGR%)
Table 40 Vaccine Contract Manufacturing Market Forecast by Region, 2023-2033 (US$ Million, AGR%, CAGR%)
Table 41 North America Vaccine Contract Manufacturing Market Forecast by Country, 2023-2033 (US$ Million, AGR%, CAGR%)
Table 42 North America Vaccine Contract Manufacturing Market Forecast by Process, 2023-2033 (US$ Million, AGR%, CAGR%)
Table 43 North America Vaccine Contract Manufacturing Market Forecast by Downstream Process, 2023-2033 (US$ Million, AGR%, CAGR%)
Table 44 North America Vaccine Contract Manufacturing Market Forecast by Upstream Process, 2023-2033 (US$ Million, AGR%, CAGR%)
Table 45 North America Vaccine Contract Manufacturing Market Forecast by End-use, 2023-2033 (US$ Million, AGR%, CAGR%)
Table 46 North America Vaccine Contract Manufacturing Market Forecast by Vaccine Type, 2023-2033 (US$ Million, AGR%, CAGR%)
Table 47 North America Vaccine Contract Manufacturing Market Forecast by Operation, 2023-2033 (US$ Million, AGR%, CAGR%)
Table 48 North America Vaccine Contract Manufacturing Market Forecast by Company Size, 2023-2033 (US$ Million, AGR%, CAGR%)
Table 49 U.S. Vaccine Contract Manufacturing Market Forecast, 2023-2033 (US$ Million, AGR%, CAGR%)
Table 50 Canada Vaccine Contract Manufacturing Market Forecast, 2023-2033 (US$ Million, AGR%, CAGR%)
Table 51 Europe Vaccine Contract Manufacturing Market Forecast by Country, 2023-2033 (US$ Million, AGR%, CAGR%)
Table 52 Europe Vaccine Contract Manufacturing Market Forecast by Process, 2023-2033 (US$ Million, AGR%, CAGR%)
Table 53 Europe Vaccine Contract Manufacturing Market Forecast by Downstream Process, 2023-2033 (US$ Million, AGR%, CAGR%)
Table 54 Europe Vaccine Contract Manufacturing Market Forecast by Upstream Process, 2023-2033 (US$ Million, AGR%, CAGR%)
Table 55 Europe Vaccine Contract Manufacturing Market Forecast by End-use, 2023-2033 (US$ Million, AGR%, CAGR%)
Table 56 Europe Vaccine Contract Manufacturing Market Forecast by Vaccine Type, 2023-2033 (US$ Million, AGR%, CAGR%)
Table 57 Europe Vaccine Contract Manufacturing Market Forecast by Operation, 2023-2033 (US$ Million, AGR%, CAGR%)
Table 58 Europe Vaccine Contract Manufacturing Market Forecast by Company Size, 2023-2033 (US$ Million, AGR%, CAGR%)
Table 59 Germany Vaccine Contract Manufacturing Market Forecast, 2023-2033 (US$ Million, AGR%, CAGR%)
Table 60 UK Vaccine Contract Manufacturing Market Forecast, 2023-2033 (US$ Million, AGR%, CAGR%)
Table 61 France Vaccine Contract Manufacturing Market Forecast, 2023-2033 (US$ Million, AGR%, CAGR%)
Table 62 Italy Vaccine Contract Manufacturing Market Forecast, 2023-2033 (US$ Million, AGR%, CAGR%)
Table 63 Spain Vaccine Contract Manufacturing Market Forecast, 2023-2033 (US$ Million, AGR%, CAGR%)
Table 64 Russia Vaccine Contract Manufacturing Market Forecast, 2023-2033 (US$ Million, AGR%, CAGR%)
Table 65 Rest of Europe Vaccine Contract Manufacturing Market Forecast, 2023-2033 (US$ Million, AGR%, CAGR%)
Table 66 Asia Pacific Vaccine Contract Manufacturing Market Forecast by Country, 2023-2033 (US$ Million, AGR%, CAGR%)
Table 67 Asia Pacific Vaccine Contract Manufacturing Market Forecast by Process, 2023-2033 (US$ Million, AGR%, CAGR%)
Table 68 Asia Pacific Vaccine Contract Manufacturing Market Forecast by Downstream Process, 2023-2033 (US$ Million, AGR%, CAGR%)
Table 69 Asia Pacific Vaccine Contract Manufacturing Market Forecast by Upstream Process, 2023-2033 (US$ Million, AGR%, CAGR%)
Table 70 Asia Pacific Vaccine Contract Manufacturing Market Forecast by End-use, 2023-2033 (US$ Million, AGR%, CAGR%)
Table 71 Asia Pacific Vaccine Contract Manufacturing Market Forecast by Vaccine Type, 2023-2033 (US$ Million, AGR%, CAGR%)
Table 72 Asia Pacific Vaccine Contract Manufacturing Market Forecast by Operation, 2023-2033 (US$ Million, AGR%, CAGR%)
Table 73 Asia Pacific Vaccine Contract Manufacturing Market Forecast by Company Size, 2023-2033 (US$ Million, AGR%, CAGR%)
Table 74 China Vaccine Contract Manufacturing Market Forecast, 2023-2033 (US$ Million, AGR%, CAGR%)
Table 75 India Vaccine Contract Manufacturing Market Forecast, 2023-2033 (US$ Million, AGR%, CAGR%)
Table 76 Japan Vaccine Contract Manufacturing Market Forecast, 2023-2033 (US$ Million, AGR%, CAGR%)
Table 77 South Korea Vaccine Contract Manufacturing Market Forecast, 2023-2033 (US$ Million, AGR%, CAGR%)
Table 78 Australia Vaccine Contract Manufacturing Market Forecast, 2023-2033 (US$ Million, AGR%, CAGR%)
Table 79 Rest of Asia-Pacific Vaccine Contract Manufacturing Market Forecast, 2023-2033 (US$ Million, AGR%, CAGR%)
Table 80 Latin America Vaccine Contract Manufacturing Market Forecast by Country, 2023-2033 (US$ Million, AGR%, CAGR%)
Table 81 Latin America Vaccine Contract Manufacturing Market Forecast by Process, 2023-2033 (US$ Million, AGR%, CAGR%)
Table 82 Latin America Vaccine Contract Manufacturing Market Forecast by Downstream Process, 2023-2033 (US$ Million, AGR%, CAGR%)
Table 83 Latin America Vaccine Contract Manufacturing Market Forecast by Upstream Process, 2023-2033 (US$ Million, AGR%, CAGR%)
Table 84 Latin America Vaccine Contract Manufacturing Market Forecast by End-use, 2023-2033 (US$ Million, AGR%, CAGR%)
Table 85 Latin America Vaccine Contract Manufacturing Market Forecast by Vaccine Type, 2023-2033 (US$ Million, AGR%, CAGR%)
Table 86 Latin America Vaccine Contract Manufacturing Market Forecast by Operation, 2023-2033 (US$ Million, AGR%, CAGR%)
Table 87 Latin America Vaccine Contract Manufacturing Market Forecast by Company Size, 2023-2033 (US$ Million, AGR%, CAGR%)
Table 88 Brazil Vaccine Contract Manufacturing Market Forecast, 2023-2033 (US$ Million, AGR%, CAGR%)
Table 89 Mexico Vaccine Contract Manufacturing Market Forecast, 2023-2033 (US$ Million, AGR%, CAGR%)
Table 90 Rest of Latin America Vaccine Contract Manufacturing Market Forecast, 2023-2033 (US$ Million, AGR%, CAGR%)
Table 91 Middle East & Africa Vaccine Contract Manufacturing Market Forecast by Country, 2023-2033 (US$ Million, AGR%, CAGR%)
Table 92 Middle East & Africa Vaccine Contract Manufacturing Market Forecast by Process, 2023-2033 (US$ Million, AGR%, CAGR%)
Table 93 Middle East & Africa Vaccine Contract Manufacturing Market Forecast by Downstream Process, 2023-2033 (US$ Million, AGR%, CAGR%)
Table 94 Middle East & Africa Vaccine Contract Manufacturing Market Forecast by Upstream Process, 2023-2033 (US$ Million, AGR%, CAGR%)
Table 95 Middle East & Africa Vaccine Contract Manufacturing Market Forecast by End-use, 2023-2033 (US$ Million, AGR%, CAGR%)
Table 96 Middle East & Africa Vaccine Contract Manufacturing Market Forecast by Vaccine Type, 2023-2033 (US$ Million, AGR%, CAGR%)
Table 97 Middle East & Africa Vaccine Contract Manufacturing Market Forecast by Operation, 2023-2033 (US$ Million, AGR%, CAGR%)
Table 98 Middle East & Africa Vaccine Contract Manufacturing Market Forecast by Company Size, 2023-2033 (US$ Million, AGR%, CAGR%)
Table 99 GCC Vaccine Contract Manufacturing Market Forecast, 2023-2033 (US$ Million, AGR%, CAGR%)
Table 100 South Africa Vaccine Contract Manufacturing Market Forecast, 2023-2033 (US$ Million, AGR%, CAGR%)
Table 101 Rest of MEA Vaccine Contract Manufacturing Market Forecast, 2023-2033 (US$ Million, AGR%, CAGR%)
Table 102 Strategic Outlook
Table 103 Catalent, Inc: Key Details, (CEO, HQ, Revenue, Founded, No. of Employees, Company Type, Website, Business Segment)
Table 104 Catalent, Inc: Service Benchmarking
Table 105 Catalent, Inc: Strategic Outlook
Table 106 Emergent BioSolutions: Key Details, (CEO, HQ, Revenue, Founded, No. of Employees, Company Type, Website, Business Segment)
Table 107 Emergent BioSolutions: Service Benchmarking
Table 108 Emergent BioSolutions: Strategic Outlook
Table 109 Ajinomoto Bio-Pharma: Key Details, (CEO, HQ, Revenue, Founded, No. of Employees, Company Type, Website, Business Segment)
Table 110 Ajinomoto Bio-Pharma: Service Benchmarking
Table 111 Ajinomoto Bio-Pharma: Strategic Outlook
Table 112 Lonza: Key Details, (CEO, HQ, Revenue, Founded, No. of Employees, Company Type, Website, Business Segment)
Table 113 Lonza: Service Benchmarking
Table 114 Lonza: Strategic Outlook
Table 115 Curia Global, Inc.: Key Details, (CEO, HQ, Revenue, Founded, No. of Employees, Company Type, Website, Business Segment)
Table 116 Curia Global Inc.: Service Benchmarking
Table 117 Curia Global Inc.: Strategic Outlook
Table 118 WuXi Biologics: Key Details, (CEO, HQ, Revenue, Founded, No. of Employees, Company Type, Website, Business Segment)
Table 119 WuXi Biologics: Service Benchmarking
Table 120 WuXi Biologics: Strategic Outlook
Table 121 Vibalogics: Key Details, (CEO, HQ, Revenue, Founded, No. of Employees, Company Type, Website, Business Segment)
Table 122 Vibalogics: Service Benchmarking
Table 123 Vibalogics: Strategic Outlook
Table 124 FUJIFILM Holdings Corporation: Key Details, (CEO, HQ, Revenue, Founded, No. of Employees, Company Type, Website, Business Segment)
Table 125 FUJIFILM Holdings Corporation: Service Benchmarking
Table 126 Recipharm AB: Key Details, (CEO, HQ, Revenue, Founded, No. of Employees, Company Type, Website, Business Segment)
Table 127 Recipharm AB: Service Benchmarking
Table 128 Recipharm AB: Strategic Outlook
Table 129 Richter-Helm BioLogics GmbH & Co. KG: Key Details, (CEO, HQ, Revenue, Founded, No. of Employees, Company Type, Website, Business Segment)
Table 130 Richter-Helm BioLogics GmbH & Co. KG: Service Benchmarking
Table 131 Richter-Helm BioLogics GmbH & Co. KG: Strategic Outlook
Table 132 Bavarian Nordic: Key Details, (CEO, HQ, Revenue, Founded, No. of Employees, Company Type, Website, Business Segment)
Table 133 Bavarian Nordic: Service Benchmarking
Table 134 Charles River Laboratories: Key Details, (CEO, HQ, Revenue, Founded, No. of Employees, Company Type, Website, Business Segment)
Table 135 Charles River Laboratories: Service Benchmarking
Table 136 Charles River Laboratories: Strategic Outlook
Table 137 ICON plc: Key Details, (CEO, HQ, Revenue, Founded, No. of Employees, Company Type, Website, Business Segment)
Table 138 ICON plc: Service Benchmarking
Table 139 ICON plc: Strategic Outlook
Table 140 Batavia Biosciences B.V.: Key Details, (CEO, HQ, Revenue, Founded, No. of Employees, Company Type, Website, Business Segment)
Table 141 Batavia Biosciences B.V.: Service Benchmarking
Table 142 IDT Biologika: Key Details, (CEO, HQ, Revenue, Founded, No. of Employees, Company Type, Website, Business Segment)
Table 143 IDT Biologika: Service Benchmarking
図の一覧
Figure 1 Vaccine Contract Manufacturing Market Segmentation
Figure 2 Vaccine Contract Manufacturing Market by Process Type: Market Attractiveness Index
Figure 3 Vaccine Contract Manufacturing Market by Downstream: Market Attractiveness Index
Figure 4 Vaccine Contract Manufacturing Market by Downstream: Market Attractiveness Index
Figure 5 Vaccine Contract Manufacturing Market by End-use: Market Attractiveness Index
Figure 6 Vaccine Contract Manufacturing Market by Vaccine Type: Market Attractiveness Index
Figure 7 Vaccine Contract Manufacturing Market by Operation: Market Attractiveness Index
Figure 8 Vaccine Contract Manufacturing Market by Company Size: Market Attractiveness Index
Figure 9 Vaccine Contract Manufacturing Market Attractiveness Index by Region
Figure 10 Vaccine Contract Manufacturing Market: Market Dynamics
Figure 11 Vaccine Contract Manufacturing Market by Region, 2023-2033 (US$ Million, AGR %): “V” Shaped Recovery
Figure 12 Vaccine Contract Manufacturing Market by Region, 2023-2033 (US$ Million, AGR %): “U” Shaped Recovery
Figure 13 Vaccine Contract Manufacturing Market by Region, 2023-2033 (US$ Million, AGR %): “W” Shaped Recovery
Figure 14 Vaccine Contract Manufacturing Market by Region, 2023-2033 (US$ Million, AGR %): “L” Shaped Recovery
Figure 15 Vaccine Contract Manufacturing Market: Porter’s Five Forces Analysis
Figure 16 Vaccine Contract Manufacturing Market: PEST Analysis
Figure 17 Vaccine Contract Manufacturing Market by Process: Market Attractiveness Index
Figure 18 Vaccine Contract Manufacturing Market Forecast by Process, 2023-2033 (US$ Million, AGR %)
Figure 19 Vaccine Contract Manufacturing Market Share Forecast by Process, 2023, 2028, 2033 (%)
Figure 20 Upstream Process Segment Market Forecast by Region, 2023-2033 (US$ Million, AGR %)
Figure 21 Upstream Process Segment Market Share Forecast by Region, 2023 & 2033 (%)
Figure 22 Downstream Process Segment Market Forecast by Region, 2023-2033 (US$ Million, AGR %)
Figure 23 Downstream Process Segment Market Share Forecast by Region, 2023 & 2033 (%)
Figure 24 Vaccine Contract Manufacturing Market by Downstream Process: Market Attractiveness Index
Figure 25 Vaccine Contract Manufacturing Market Forecast by Downstream Process, 2023-2033 (US$ Million, AGR %)
Figure 26 Vaccine Contract Manufacturing Market Share Forecast by Downstream Process, 2023, 2028, 2033 (%)
Figure 27 Fill & Finish Operations Segment Market Forecast by Region, 2023-2033 (US$ Million, AGR %)
Figure 28 Fill & Finish Operations Segment Market Share Forecast by Region, 2023 & 2033 (%)
Figure 29 Analytical & QC Studies Segment Market Forecast by Region, 2023-2033 (US$ Million, AGR %)
Figure 30 Analytical & QC Studies Segment Market Share Forecast by Region, 2023 & 2033 (%)
Figure 31 Vaccine Packaging Segment Market Forecast by Region, 2023-2033 (US$ Million, AGR %)
Figure 32 Vaccine Packaging Segment Market Share Forecast by Region, 2023 & 2033 (%)
Figure 33 Vaccine Contract Manufacturing Market by Upstream Process: Market Attractiveness Index
Figure 34 Vaccine Contract Manufacturing Market Forecast by Upstream Process, 2023-2033 (US$ Million, AGR %)
Figure 35 Vaccine Contract Manufacturing Market Share Forecast by Upstream Process, 2023, 2028, 2033 (%)
Figure 36 Mammalian Expression Vaccine Type Segment Market Forecast by Region, 2023-2033 (US$ Million, AGR %)
Figure 37 Mammalian Expression Vaccine Type Segment Market Share Forecast by Region, 2023 & 2033 (%)
Figure 38 Bacterial Expression Vaccine Type Segment Market Forecast by Region, 2023-2033 (US$ Million, AGR %)
Figure 39 Bacterial Expression Vaccine Type Segment Market Share Forecast by Region, 2023 & 2033 (%)
Figure 40 Yeast Expression Vaccine Type Segment Market Forecast by Region, 2023-2033 (US$ Million, AGR %)
Figure 41 Yeast Expression Vaccine Type Segment Market Share Forecast by Region, 2023 & 2033 (%)
Figure 42 Baculovirus/insect Expression Vaccine Type Segment Market Forecast by Region, 2023-2033 (US$ Million, AGR %)
Figure 43 Baculovirus/insect Expression Vaccine Type Segment Market Share Forecast by Region, 2023 & 2033 (%)
Figure 44 Other Upstream Process Segment Market Forecast by Region, 2023-2033 (US$ Million, AGR %)
Figure 45 Other Upstream Process Segment Market Share Forecast by Region, 2023 & 2033 (%)
Figure 46 Vaccine Contract Manufacturing Market by End-use: Market Attractiveness Index
Figure 47 Vaccine Contract Manufacturing Market Forecast by End-use, 2023-2033 (US$ Million, AGR %)
Figure 48 Vaccine Contract Manufacturing Market Share Forecast by End-use, 2023, 2028, 2033 (%)
Figure 49 Human Use Segment Market Forecast by Region, 2023-2033 (US$ Million, AGR %)
Figure 50 Human Use Segment Market Share Forecast by Region, 2023 & 2033 (%)
Figure 51 Veterinary Segment Market Forecast by Region, 2023-2033 (US$ Million, AGR %)
Figure 52 Veterinary Segment Market Share Forecast by Region, 2023 & 2033 (%)
Figure 53 Vaccine Contract Manufacturing Market by Vaccine Type: Market Attractiveness Index
Figure 54 Vaccine Contract Manufacturing Market Forecast by Vaccine Type, 2023-2033 (US$ Million, AGR %)
Figure 55 Vaccine Contract Manufacturing Market Share Forecast by Vaccine Type, 2023, 2028, 2033 (%)
Figure 56 Subunit Vaccines Segment Market Forecast by Region, 2023-2033 (US$ Million, AGR %)
Figure 57 Subunit Vaccines Segment Market Share Forecast by Region, 2023 & 2033 (%)
Figure 58 Live Attenuated Vaccines Segment Market Forecast by Region, 2023-2033 (US$ Million, AGR %)
Figure 59 Live Attenuated Vaccines Segment Market Share Forecast by Region, 2023 & 2033 (%)
Figure 60 Conjugate Vaccines Segment Market Forecast by Region, 2023-2033 (US$ Million, AGR %)
Figure 61 Conjugate Vaccines Segment Market Share Forecast by Region, 2023 & 2033 (%)
Figure 62 Inactivated Vaccines Segment Market Forecast by Region, 2023-2033 (US$ Million, AGR %)
Figure 63 Inactivated Vaccines Segment Market Share Forecast by Region, 2023 & 2033 (%)
Figure 64 Toxoid Vaccines Segment Market Forecast by Region, 2023-2033 (US$ Million, AGR %)
Figure 65 Toxoid Vaccines Segment Market Share Forecast by Region, 2023 & 2033 (%)
Figure 66 Viral Vector Vaccines Segment Market Forecast by Region, 2023-2033 (US$ Million, AGR %)
Figure 67 Viral Vector Vaccines Segment Market Share Forecast by Region, 2023 & 2033 (%)
Figure 68 Recombinant Vector Vaccines Segment Market Forecast by Region, 2023-2033 (US$ Million, AGR %)
Figure 69 Recombinant Vector Vaccines Segment Market Share Forecast by Region, 2023 & 2033 (%)
Figure 70 Other Vaccine Types Segment Market Forecast by Region, 2023-2033 (US$ Million, AGR %)
Figure 71 Other Vaccine Types Segment Market Share Forecast by Region, 2023 & 2033 (%)
Figure 72 Vaccine Contract Manufacturing Market by Operation: Market Attractiveness Index
Figure 73 Vaccine Contract Manufacturing Market Forecast by Operation, 2023-2033 (US$ Million, AGR %)
Figure 74 Vaccine Contract Manufacturing Market Share Forecast by Operation, 2023, 2028, 2033 (%)
Figure 75 Preclinical Segment Market Forecast by Region, 2023-2033 (US$ Million, AGR %)
Figure 76 Preclinical Segment Market Share Forecast by Region, 2023 & 2033 (%)
Figure 77 Clinical Segment Market Forecast by Region, 2023-2033 (US$ Million, AGR %)
Figure 78 Clinical Segment Market Share Forecast by Region, 2023 & 2033 (%)
Figure 79 Commercial Segment Market Forecast by Region, 2023-2033 (US$ Million, AGR %)
Figure 80 Commercial Segment Market Share Forecast by Region, 2023 & 2033 (%)
Figure 81 Vaccine Contract Manufacturing Market by Company Size: Market Attractiveness Index
Figure 82 Vaccine Contract Manufacturing Market Forecast by Company Size, 2023-2033 (US$ Million, AGR %)
Figure 83 Vaccine Contract Manufacturing Market Share Forecast by Company Size, 2023, 2028, 2033 (%)
Figure 84 Small Manufacturers Segment Market Forecast by Region, 2023-2033 (US$ Million, AGR %)
Figure 85 Small Manufacturers Segment Market Share Forecast by Region, 2023 & 2033 (%)
Figure 86 Mid-sized Manufacturers Segment Market Forecast by Region, 2023-2033 (US$ Million, AGR %)
Figure 87 Mid-sized Manufacturers Segment Market Share Forecast by Region, 2023 & 2033 (%)
Figure 88 Large Manufacturers Segment Market Forecast by Region, 2023-2033 (US$ Million, AGR %)
Figure 89 Large Manufacturers Segment Market Share Forecast by Region, 2023 & 2033 (%)
Figure 90 Very Large Manufacturers Segment Market Forecast by Region, 2023-2033 (US$ Million, AGR %)
Figure 91 Very Large Manufacturers Segment Market Share Forecast by Region, 2023 & 2033 (%)
Figure 92 Vaccine Contract Manufacturing Market Forecast by Region 2023 and 2033 (Revenue, CAGR%)
Figure 93 Vaccine Contract Manufacturing Market Share Forecast by Region 2023, 2028, 2033 (%)
Figure 94 Vaccine Contract Manufacturing Market by Region, 2023-2033 (US$ Million, AGR %)
Figure 95 North America Vaccine Contract Manufacturing Market Attractiveness Index
Figure 96 North America Vaccine Contract Manufacturing Market by Region, 2023, 2028 & 2033 (US$ Million)
Figure 97 North America Vaccine Contract Manufacturing Market Forecast by Country, 2023-2033 (US$ Million, AGR %)
Figure 98 North America Vaccine Contract Manufacturing Market Share Forecast by Country, 2023 & 2033 (%)
Figure 99 North America Vaccine Contract Manufacturing Market Forecast by Process, 2023-2033 (US$ Million, AGR %)
Figure 100 North America Vaccine Contract Manufacturing Market Share Forecast by Process, 2023 & 2033 (%)
Figure 101 North America Vaccine Contract Manufacturing Market Forecast by Downstream Process, 2023-2033 (US$ Million, AGR %)
Figure 102 North America Vaccine Contract Manufacturing Market Share Forecast by Downstream Process, 2023 & 2033 (%)
Figure 103 North America Vaccine Contract Manufacturing Market Forecast by Upstream Process, 2023-2033 (US$ Million, AGR %)
Figure 104 North America Vaccine Contract Manufacturing Market Share Forecast by Upstream Process, 2023 & 2033 (%)
Figure 105 North America Vaccine Contract Manufacturing Market Forecast by End-use, 2023-2033 (US$ Million, AGR %)
Figure 106 North America Vaccine Contract Manufacturing Market Share Forecast by End-use, 2023 & 2033 (%)
Figure 107 North America Vaccine Contract Manufacturing Market Forecast by Vaccine Type, 2023-2033 (US$ Million, AGR %)
Figure 108 North America Vaccine Contract Manufacturing Market Share Forecast by Vaccine Type, 2023 & 2033 (%)
Figure 109 North America Vaccine Contract Manufacturing Market Forecast by Operation, 2023-2033 (US$ Million, AGR %)
Figure 110 North America Vaccine Contract Manufacturing Market Share Forecast by Operation, 2023 & 2033 (%)
Figure 111 North America Vaccine Contract Manufacturing Market Forecast by Company Size, 2023-2033 (US$ Million, AGR %)
Figure 112 North America Vaccine Contract Manufacturing Market Share Forecast by Company Size, 2023 & 2033 (%)
Figure 113 U.S. Vaccine Contract Manufacturing Market Forecast, 2023-2033 (US$ Million, AGR %)
Figure 114 Canada Vaccine Contract Manufacturing Market Forecast, 2023-2033 (US$ Million, AGR %)
Figure 115 Europe Vaccine Contract Manufacturing Market Attractiveness Index
Figure 116 Europe Vaccine Contract Manufacturing Market by Region, 2023, 2028 & 2033 (US$ Million)
Figure 117 Europe Vaccine Contract Manufacturing Market Forecast by Country, 2023-2033 (US$ Million, AGR %)
Figure 118 Europe Vaccine Contract Manufacturing Market Share Forecast by Country, 2023 & 2033 (%)
Figure 119 Europe Vaccine Contract Manufacturing Market Forecast by Process, 2023-2033 (US$ Million, AGR %)
Figure 120 Europe Vaccine Contract Manufacturing Market Share Forecast by Process, 2023 & 2033 (%)
Figure 121 Europe Vaccine Contract Manufacturing Market Forecast by Downstream Process, 2023-2033 (US$ Million, AGR %)
Figure 122 Europe Vaccine Contract Manufacturing Market Share Forecast by Downstream Process, 2023 & 2033 (%)
Figure 123 Europe Vaccine Contract Manufacturing Market Forecast by Upstream Process, 2023-2033 (US$ Million, AGR %)
Figure 124 Europe Vaccine Contract Manufacturing Market Share Forecast by Upstream Process, 2023 & 2033 (%)
Figure 125 Europe Vaccine Contract Manufacturing Market Forecast by End-use, 2023-2033 (US$ Million, AGR %)
Figure 126 Europe Vaccine Contract Manufacturing Market Share Forecast by End-use, 2023 & 2033 (%)
Figure 127 Europe Vaccine Contract Manufacturing Market Forecast by Vaccine Type, 2023-2033 (US$ Million, AGR %)
Figure 128 Europe Vaccine Contract Manufacturing Market Share Forecast by Vaccine Type, 2023 & 2033 (%)
Figure 129 Europe Vaccine Contract Manufacturing Market Forecast by Operation, 2023-2033 (US$ Million, AGR %)
Figure 130 Europe Vaccine Contract Manufacturing Market Share Forecast by Operation, 2023 & 2033 (%)
Figure 131 Europe Vaccine Contract Manufacturing Market Forecast by Company Size, 2023-2033 (US$ Million, AGR %)
Figure 132 Europe Vaccine Contract Manufacturing Market Share Forecast by Company Size, 2023 & 2033 (%)
Figure 133 Germany Vaccine Contract Manufacturing Market Forecast, 2023-2033 (US$ Million, AGR %)
Figure 134 UK Vaccine Contract Manufacturing Market Forecast, 2023-2033 (US$ Million, AGR %)
Figure 135 France Vaccine Contract Manufacturing Market Forecast, 2023-2033 (US$ Million, AGR %)
Figure 136 Italy Vaccine Contract Manufacturing Market Forecast, 2023-2033 (US$ Million, AGR %)
Figure 137 Spain Vaccine Contract Manufacturing Market Forecast, 2023-2033 (US$ Million, AGR %)
Figure 138 Russia Vaccine Contract Manufacturing Market Forecast, 2023-2033 (US$ Million, AGR %)
Figure 139 Rest of Europe Vaccine Contract Manufacturing Market Forecast, 2023-2033 (US$ Million, AGR %)
Figure 140 Asia Pacific Vaccine Contract Manufacturing Market Attractiveness Index
Figure 141 Asia Pacific Vaccine Contract Manufacturing Market by Region, 2023, 2028 & 2033 (US$ Million)
Figure 142 Asia Pacific Vaccine Contract Manufacturing Market Forecast by Country, 2023-2033 (US$ Million, AGR %)
Figure 143 Asia Pacific Vaccine Contract Manufacturing Market Share Forecast by Country, 2023 & 2033 (%)
Figure 144 Asia Pacific Vaccine Contract Manufacturing Market Forecast by Process, 2023-2033 (US$ Million, AGR %)
Figure 145 Asia Pacific Vaccine Contract Manufacturing Market Share Forecast by Process, 2023 & 2033 (%)
Figure 146 Asia Pacific Vaccine Contract Manufacturing Market Forecast by Downstream Process, 2023-2033 (US$ Million, AGR %)
Figure 147 Asia Pacific Vaccine Contract Manufacturing Market Share Forecast by Downstream Process, 2023 & 2033 (%)
Figure 148 Asia Pacific Vaccine Contract Manufacturing Market Forecast by Upstream Process, 2023-2033 (US$ Million, AGR %)
Figure 149 Asia Pacific Vaccine Contract Manufacturing Market Share Forecast by Upstream Process, 2023 & 2033 (%)
Figure 150 Asia Pacific Vaccine Contract Manufacturing Market Forecast by End-use, 2023-2033 (US$ Million, AGR %)
Figure 151 Asia Pacific Vaccine Contract Manufacturing Market Share Forecast by End-use, 2023 & 2033 (%)
Figure 152 Asia Pacific Vaccine Contract Manufacturing Market Forecast by Vaccine Type, 2023-2033 (US$ Million, AGR %)
Figure 153 Asia Pacific Vaccine Contract Manufacturing Market Share Forecast by Vaccine Type, 2023 & 2033 (%)
Figure 154 Asia Pacific Vaccine Contract Manufacturing Market Forecast by Operation, 2023-2033 (US$ Million, AGR %)
Figure 155 Asia Pacific Vaccine Contract Manufacturing Market Share Forecast by Operation, 2023 & 2033 (%)
Figure 156 Asia Pacific Vaccine Contract Manufacturing Market Forecast by Company Size, 2023-2033 (US$ Million, AGR %)
Figure 157 Asia Pacific Vaccine Contract Manufacturing Market Share Forecast by Company Size, 2023 & 2033 (%)
Figure 158 China Vaccine Contract Manufacturing Market Forecast, 2023-2033 (US$ Million, AGR %)
Figure 159 India Vaccine Contract Manufacturing Market Forecast, 2023-2033 (US$ Million, AGR %)
Figure 160 Japan Vaccine Contract Manufacturing Market Forecast, 2023-2033 (US$ Million, AGR %)
Figure 161 South Korea Vaccine Contract Manufacturing Market Forecast, 2023-2033 (US$ Million, AGR %)
Figure 162 Australia Vaccine Contract Manufacturing Market Forecast, 2023-2033 (US$ Million, AGR %)
Figure 163 Rest of Asia-Pacific Vaccine Contract Manufacturing Market Forecast, 2023-2033 (US$ Million, AGR %)
Figure 164 Latin America Vaccine Contract Manufacturing Market Attractiveness Index
Figure 165 Latin America Vaccine Contract Manufacturing Market by Region, 2023, 2028 & 2033 (US$ Million)
Figure 166 Latin America Vaccine Contract Manufacturing Market Forecast by Country, 2023-2033 (US$ Million, AGR %)
Figure 167 Latin America Vaccine Contract Manufacturing Market Share Forecast by Country, 2023 & 2033 (%)
Figure 168 Latin America Vaccine Contract Manufacturing Market Forecast by Process, 2023-2033 (US$ Million, AGR %)
Figure 169 Latin America Vaccine Contract Manufacturing Market Share Forecast by Process, 2023 & 2033 (%)
Figure 170 Latin America Vaccine Contract Manufacturing Market Forecast by Downstream Process, 2023-2033 (US$ Million, AGR %)
Figure 171 Latin America Vaccine Contract Manufacturing Market Share Forecast by Downstream Process, 2023 & 2033 (%)
Figure 172 Latin America Vaccine Contract Manufacturing Market Forecast by Upstream Process, 2023-2033 (US$ Million, AGR %)
Figure 173 Latin America Vaccine Contract Manufacturing Market Share Forecast by Upstream Process, 2023 & 2033 (%)
Figure 174 Latin America Vaccine Contract Manufacturing Market Forecast by End-use, 2023-2033 (US$ Million, AGR %)
Figure 175 Latin America Vaccine Contract Manufacturing Market Share Forecast by End-use, 2023 & 2033 (%)
Figure 176 Latin America Vaccine Contract Manufacturing Market Forecast by Vaccine Type, 2023-2033 (US$ Million, AGR %)
Figure 177 Latin America Vaccine Contract Manufacturing Market Share Forecast by Vaccine Type, 2023 & 2033 (%)
Figure 178 Latin America Vaccine Contract Manufacturing Market Forecast by Operation, 2023-2033 (US$ Million, AGR %)
Figure 179 Latin America Vaccine Contract Manufacturing Market Share Forecast by Operation, 2023 & 2033 (%)
Figure 180 Latin America Vaccine Contract Manufacturing Market Forecast by Company Size, 2023-2033 (US$ Million, AGR %)
Figure 181 Latin America Vaccine Contract Manufacturing Market Share Forecast by Company Size, 2023 & 2033 (%)
Figure 182 Brazil Vaccine Contract Manufacturing Market Forecast, 2023-2033 (US$ Million, AGR %)
Figure 183 Mexico Vaccine Contract Manufacturing Market Forecast, 2023-2033 (US$ Million, AGR %)
Figure 184 Rest of Latin America Vaccine Contract Manufacturing Market Forecast, 2023-2033 (US$ Million, AGR %)
Figure 185 Middle East & Africa Vaccine Contract Manufacturing Market Attractiveness Index
Figure 186 Middle East & Africa Vaccine Contract Manufacturing Market by Region, 2023, 2028 & 2033 (US$ Million)
Figure 187 Middle East & Africa Vaccine Contract Manufacturing Market Forecast by Country, 2023-2033 (US$ Million, AGR %)
Figure 188 Middle East & Africa Vaccine Contract Manufacturing Market Share Forecast by Country, 2023 & 2033 (%)
Figure 189 Middle East & Africa Vaccine Contract Manufacturing Market Forecast by Process, 2023-2033 (US$ Million, AGR %)
Figure 190 Middle East & Africa Vaccine Contract Manufacturing Market Share Forecast by Process, 2023 & 2033 (%)
Figure 191 Middle East & Africa Vaccine Contract Manufacturing Market Forecast by Downstream Process, 2023-2033 (US$ Million, AGR %)
Figure 192 Middle East & Africa Vaccine Contract Manufacturing Market Share Forecast by Downstream Process, 2023 & 2033 (%)
Figure 193 Middle East & Africa Vaccine Contract Manufacturing Market Forecast by Upstream Process, 2023-2033 (US$ Million, AGR %)
Figure 194 Middle East & Africa Vaccine Contract Manufacturing Market Share Forecast by Upstream Process, 2023 & 2033 (%)
Figure 195 Middle East & Africa Vaccine Contract Manufacturing Market Forecast by End-use, 2023-2033 (US$ Million, AGR %)
Figure 196 Middle East & Africa Vaccine Contract Manufacturing Market Share Forecast by End-use, 2023 & 2033 (%)
Figure 197 Middle East & Africa Vaccine Contract Manufacturing Market Forecast by Vaccine Type, 2023-2033 (US$ Million, AGR %)
Figure 198 Middle East & Africa Vaccine Contract Manufacturing Market Share Forecast by Vaccine Type, 2023 & 2033 (%)
Figure 199 Middle East & Africa Vaccine Contract Manufacturing Market Forecast by Operation, 2023-2033 (US$ Million, AGR %)
Figure 200 Middle East & Africa Vaccine Contract Manufacturing Market Share Forecast by Operation, 2023 & 2033 (%)
Figure 201 Middle East & Africa Vaccine Contract Manufacturing Market Forecast by Company Size, 2023-2033 (US$ Million, AGR %)
Figure 202 Middle East & Africa Vaccine Contract Manufacturing Market Share Forecast by Company Size, 2023 & 2033 (%)
Figure 203 GCC Vaccine Contract Manufacturing Market Forecast, 2023-2033 (US$ Million, AGR %)
Figure 204 South Africa Vaccine Contract Manufacturing Market Forecast, 2023-2033 (US$ Million, AGR %)
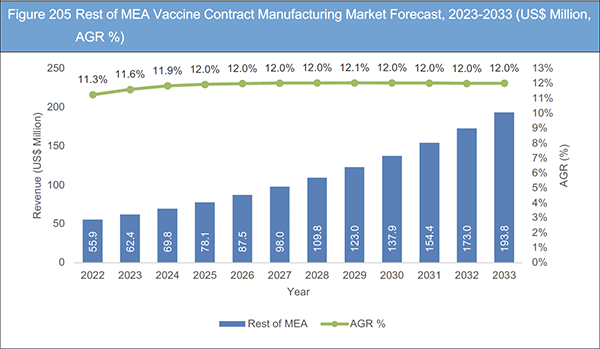
Figure 205 Rest of MEA Vaccine Contract Manufacturing Market Forecast, 2023-2033 (US$ Million, AGR %)
Figure 206 Vaccine Contract Manufacturing Market: Company Share/Ranking, 2022
Figure 207 Catalent, Inc: Net Revenue, 2017-2022 (US$ Million, AGR%)
Figure 208 Catalent, Inc: Regional Market Shares, 2022
Figure 209 Emergent BioSolutions: Net Revenue, 2017-2022 (US$ Million, AGR%)
Figure 210 Emergent BioSolutions: R&D, 2017-2022 (US$ Million, AGR%)
Figure 211 Emergent BioSolutions: Regional Market Shares, 2022
Figure 212 Ajinomoto Bio-Pharma: Net Revenue, 2017-2022 (US$ Million, AGR%)
Figure 213 Ajinomoto Bio-Pharma: Regional Market Shares, 2022
Figure 214 Lonza: Net Revenue, 2017-2022 (US$ Million, AGR%)
Figure 215 Lonza: R&D, 2017-2022 (US$ Million, AGR%)
Figure 216 Lonza: Regional Market Shares, 2022
Figure 217 WuXi Biologics: Net Revenue, 2017-2022 (US$ Million, AGR%)
Figure 218 WuXi Biologics: R&D, 2017-2022 (US$ Million, AGR%)
Figure 219 WuXi Biologics: Regional Market Shares, 2022
Figure 220 FUJIFILM Holdings Corporation: Net Revenue, 2017-2022 (US$ Million, AGR%)
Figure 221 FUJIFILM Holdings Corporation: R&D, 2017-2022 (US$ Million, AGR%)
Figure 222 FUJIFILM Holdings Corporation: Regional Market Shares, 2022
Figure 223 Bavarian Nordic: Net Revenue, 2017-2022 (US$ Million, AGR%)
Figure 224 Bavarian Nordic: R&D, 2017-2022 (US$ Million, AGR%)
Figure 225 Charles River Laboratories: Net Revenue, 2017-2022 (US$ Million, AGR%)
Figure 226 Charles River Laboratories: Regional Market Shares, 2022
Figure 227 ICON plc: Net Revenue, 2017-2022 (US$ Million, AGR%)
Figure 228 ICON plc: R&D, 2017-2022 (US$ Million, AGR%)
Figure 229 ICON plc: Regional Market Shares, 2022
ページTOPに戻る
Summary
Report Details
The Vaccine Contract Manufacturing Market Report 2023-2033: This report will prove invaluable to leading firms striving for new revenue pockets if they wish to better understand the industry and its underlying dynamics. It will be useful for companies that would like to expand into different industries or to expand their existing operations in a new region.
Increasing Global Demand, Product Innovation and Cost Effectiveness Driving Market Growth
The global demand for vaccines has been rising due to various factors, including population growth, aging populations, and the emergence of infectious diseases. This increasing demand creates opportunities for contract manufacturers to support vaccine developers in meeting the production needs, especially during pandemics or widespread outbreaks. Advances in vaccine research and development have led to the discovery of new vaccines and improved formulations. Contract manufacturers play a crucial role in translating these innovations into commercial products. As vaccine developers focus on R&D activities, they often seek external partners to handle manufacturing operations, driving the demand for contract manufacturing services. Contract manufacturing can provide cost-effective solutions for vaccine production. Establishing and maintaining large-scale manufacturing facilities can be capital-intensive for vaccine developers, while contract manufacturers can leverage their existing infrastructure, equipment, and expertise to produce vaccines at a lower cost per unit. This cost advantage makes contract manufacturing an attractive option for vaccine developers.
Regulations, Intellectual Property and Capacity Challenges to Hamper Industry Growth
The vaccine manufacturing industry is highly regulated, and contract manufacturers need to comply with stringent regulatory requirements imposed by regulatory authorities such as the U.S. Food and Drug Administration (FDA) and the European Medicines Agency (EMA). Adhering to these regulations can be complex and time-consuming, leading to delays in production and increased costs. Vaccines often involve patented technologies and proprietary manufacturing processes. Contract manufacturers may face limitations or restrictions in accessing or using these technologies due to intellectual property rights held by the vaccine developers. Negotiating licensing agreements and protecting intellectual property can be challenging and may restrict the participation of certain contract manufacturers in the market. The manufacturing capacity for vaccines is limited, and there is often high demand, particularly during pandemics or widespread outbreaks. Contract manufacturers may face challenges in scaling up production to meet the required volumes within tight timelines. Limited capacity can result in delays, supply shortages, and increased competition among contract manufacturers for available projects.
What Questions Should You Ask before Buying a Market Research Report?
• How is the vaccine contract manufacturing market evolving?
• What is driving and restraining the vaccine contract manufacturing market?
• How will each vaccine contract manufacturing submarket segment grow over the forecast period and how much revenue will these submarkets account for in 2033?
• How will the market shares for each vaccine contract manufacturing submarket develop from 2023 to 2033?
• What will be the main driver for the overall market from 2023 to 2033?
• Will leading vaccine contract manufacturing markets broadly follow the macroeconomic dynamics, or will individual national markets outperform others?
• How will the market shares of the national markets change by 2033 and which geographical region will lead the market in 2033?
• Who are the leading players and what are their prospects over the forecast period?
• What are the vaccine contract manufacturing projects for these leading companies?
• How will the industry evolve during the period between 2023 and 2033? What are the implications of vaccine contract manufacturing projects taking place now and over the next 10 years?
• Is there a greater need for product commercialisation to further scale the vaccine contract manufacturing market?
• Where is the vaccine contract manufacturing market heading and how can you ensure you are at the forefront of the market?
• What are the best investment options for new product and service lines?
• What are the key prospects for moving companies into a new growth path and C-suite?
You need to discover how this will impact the vaccine contract manufacturing market today, and over the next 10 years:
• Our 375-page report provides 143 tables and 229 charts/graphs exclusively to you.
• The report highlights key lucrative areas in the industry so you can target them – NOW.
• It contains in-depth analysis of global, regional and national sales and growth.
• It highlights for you the key successful trends, changes and revenue projections made by your competitors.
This report tells you TODAY how the vaccine contract manufacturing market will develop in the next 10 years, and in line with the variations in COVID-19 economic recession and bounce. This market is more critical now than at any point over the last 10 years.
Forecasts to 2033 and other analyses reveal commercial prospects
• In addition to revenue forecasting to 2033, our new study provides you with recent results, growth rates, and market shares.
• You will find original analyses, with business outlooks and developments.
• Discover qualitative analyses (including market dynamics, drivers, opportunities, restraints and challenges), cost structure, impact of rising vaccine contract manufacturing prices and recent developments.
This report includes data analysis and invaluable insight into how COVID-19 will affect the industry and your company. Four COVID-19 recovery patterns and their impact, namely, “V”, “L”, “W” and “U” are discussed in this report.
Segments Covered in the Report
Process
• Upstream Process
• Downstream Process
Downstream Process
• Fill & Finish Operations
• Analytical & QC Studies
• Vaccine Packaging
Upstream Process
• Mammalian Expression Vaccine Type
• Bacterial Expression Vaccine Type
• Yeast Expression Vaccine Type
• Baculovirus/insect Expression Vaccine Type
• Other Upstream Process
End-use
• Human Use
• Veterinary
Type
• Subunit Vaccines
• Live Attenuated Vaccines
• Conjugate Vaccines
• Inactivated Vaccines
• Toxoid Vaccines
• Viral Vector Vaccines
• Recombinant Vector Vaccines
• Other Vaccine Types
Operation
• Preclinical
• Clinical
• Commercial
Company Size
• Small Manufacturers
• Mid-sized Manufacturers
• Large Manufacturers
• Very Large Manufacturers
In addition to the revenue predictions for the overall world market and segments, you will also find revenue forecasts for five regional and 21 leading national markets:
North America
• U.S.
• Canada
Europe
• Germany
• UK
• France
• Italy
• Spain
• Russia
• Rest of Europe
Asia Pacific
• China
• Japan
• India
• Australia
• South Korea
• Rest of Asia Pacific
Latin America
• Brazil
• Mexico
• Rest of Latin America
MEA
• GCC
• South Africa
• Rest of MEA
The report also includes profiles and for some of the leading companies in the Vaccine Contract Manufacturing Market, 2023 to 2033, with a focus on this segment of these companies’ operations.
Leading companies and the potential for market growth
• Ajinomoto Bio-Pharma
• Batavia Biosciences B.V.
• Bavarian Nordic
• Catalent Inc
• Charles River Laboratories
• Curia Global, Inc.
• Emergent BioSolutions
• FUJIFILM Holdings Corporation
• ICON plc
• IDT Biologika
• Lonza
• Recipharm AB
• Richter-Helm BioLogics GmbH & Co. KG
• Vibalogics
• WuXi Biologics
Overall world revenue for Vaccine Contract Manufacturing Market, 2023 to 2033 in terms of value the market will surpass US$3,095.0 million in 2023, our work calculates. We predict strong revenue growth through to 2033. Our work identifies which organizations hold the greatest potential. Discover their capabilities, progress, and commercial prospects, helping you stay ahead.
How will the Vaccine Contract Manufacturing Market, 2023 to 2033 report help you?
In summary, our 370+ page report provides you with the following knowledge:
• Revenue forecasts to 2033 for Vaccine Contract Manufacturing Market, 2023 to 2033, with forecasts for process, upstream, downstream, end-use, type, operation and company size each forecast at a global and regional level – discover the industry’s prospects, finding the most lucrative places for investments and revenues.
• Revenue forecasts to 2033 for five regional and 21 key national markets – See forecasts for the Vaccine Contract Manufacturing Market, 2023 to 2033 in North America, Europe, Asia-Pacific, Latin America, and MEA. Also forecasted is the market in the U.S., Canada, Mexico, Brazil, Germany, France, UK, Italy, China, India, Japan, and Australia among other prominent economies.
• Prospects for established firms and those seeking to enter the market – including company profiles for 15 of the major companies involved in the Vaccine Contract Manufacturing Market, 2023 to 2033.
Find quantitative and qualitative analyses with independent predictions. Receive information that only our report contains, staying informed with invaluable business intelligence.
Information found nowhere else
With our new report, you are less likely to fall behind in knowledge or miss out on opportunities. See how our work could benefit your research, analyses, and decisions. Visiongain’s study is for everybody needing commercial analyses for the vaccine contract manufacturing market-leading companies. You will find data, trends and predictions.
ページTOPに戻る
Table of Contents
Table of Contents
1 Report Overview
1.1 Objectives of the Study
1.2 Introduction to Vaccine Contract Manufacturing Market
1.3 What This Report Delivers
1.4 Why You Should Read This Report
1.5 Key Questions Answered by This Analytical Report
1.6 Who is This Report for?
1.7 Methodology
1.7.1 Market Definitions
1.7.2 Market Evaluation & Forecasting Methodology
1.7.3 Data Validation
1.7.3.1 Primary Research
1.7.3.2 Secondary Research
1.8 Frequently Asked Questions (FAQs)
1.9 Associated Visiongain Reports
1.10 About Visiongain
2 Executive Summary
3 Market Overview
3.1 Key Findings
3.2 Market Dynamics
3.2.1 Market Driving Factors
3.2.1.1 Growth in infectious diseases
3.2.1.2 Stakeholder cooperation maximises manufacturing capacity
3.2.2 Market Restraining Factors
3.2.2.1 Material and equipment shortages
3.2.2.2 Manufacturing process complexity
3.2.3 Market Opportunities
3.2.3.1 New vaccine technologies
3.2.3.2 Gene-based vaccines
3.3 COVID-19 Impact Analysis
3.4 Porter’s Five Forces Analysis
3.4.1 Bargaining Power of Suppliers
3.4.2 Bargaining Power of Buyers
3.4.3 Competitive Rivalry
3.4.4 Threat from Substitutes
3.4.5 Threat of New Entrants
3.5 PEST Analysis
4 Vaccine Contract Manufacturing Market Analysis by Process
4.1 Key Findings
4.2 Indication Segment: Market Attractiveness Index
4.3 Vaccine Contract Manufacturing Market Size Estimation and Forecast by Process
4.4 Upstream Process
4.4.1 Market Size by Region, 2023-2033 (US$ Million)
4.4.2 Market Share by Region, 2023 & 2033 (%)
4.5 Downstream Process
4.5.1 Market Size by Region, 2023-2033 (US$ Million)
4.5.2 Market Share by Region, 2023 & 2033 (%)
5 Vaccine Contract Manufacturing Market Analysis by Downstream Process
5.1 Key Findings
5.2 Downstream Process Segment: Market Attractiveness Index
5.3 Vaccine Contract Manufacturing Market Size Estimation and Forecast by Downstream Process
5.4 Fill & Finish Operations
5.4.1 Market Size by Region, 2023-2033 (US$ Million)
5.4.2 Market Share by Region, 2023 & 2033 (%)
5.5 Analytical & QC Studies
5.5.1 Market Size by Region, 2023-2033 (US$ Million)
5.5.2 Market Share by Region, 2023 & 2033 (%)
5.6 Vaccine Packaging
5.6.1 Market Size by Region, 2023-2033 (US$ Million)
5.6.2 Market Share by Region, 2023 & 2033 (%)
6 Vaccine Contract Manufacturing Market Analysis by Upstream Process
6.1 Key Findings
6.2 Upstream Process Segment: Market Attractiveness Index
6.3 Vaccine Contract Manufacturing Market Size Estimation and Forecast by Upstream Process
6.4 Mammalian Expression Vaccine Type
6.4.1 Market Size by Region, 2023-2033 (US$ Million)
6.4.2 Market Share by Region, 2023 & 2033 (%)
6.5 Bacterial Expression Vaccine Type
6.5.1 Market Size by Region, 2023-2033 (US$ Million)
6.5.2 Market Share by Region, 2023 & 2033 (%)
6.6 Yeast Expression Vaccine Type
6.6.1 Market Size by Region, 2023-2033 (US$ Million)
6.6.2 Market Share by Region, 2023 & 2033 (%)
6.7 Baculovirus/insect Expression Vaccine Type
6.7.1 Market Size by Region, 2023-2033 (US$ Million)
6.7.2 Market Share by Region, 2023 & 2033 (%)
6.8 Other Upstream Process
6.8.1 Market Size by Region, 2023-2033 (US$ Million)
6.8.2 Market Share by Region, 2023 & 2033 (%)
7 Vaccine Contract Manufacturing Market Analysis by End-use
7.1 Key Findings
7.2 End-use Segment: Market Attractiveness Index
7.3 Vaccine Contract Manufacturing Market Size Estimation and Forecast by End-use
7.4 Human Use
7.4.1 Market Size by Region, 2023-2033 (US$ Million)
7.4.2 Market Share by Region, 2023 & 2033 (%)
7.5 Veterinary
7.5.1 Market Size by Region, 2023-2033 (US$ Million)
7.5.2 Market Share by Region, 2023 & 2033 (%)
8 Vaccine Contract Manufacturing Market Analysis by Vaccine Type
8.1 Key Findings
8.2 Vaccine Type Segment: Market Attractiveness Index
8.3 Vaccine Contract Manufacturing Market Size Estimation and Forecast by Vaccine Type
8.4 Subunit Vaccines
8.4.1 Market Size by Region, 2023-2033 (US$ Million)
8.4.2 Market Share by Region, 2023 & 2033 (%)
8.5 Live Attenuated Vaccines
8.5.1 Market Size by Region, 2023-2033 (US$ Million)
8.5.2 Market Share by Region, 2023 & 2033 (%)
8.6 Conjugate Vaccines
8.6.1 Market Size by Region, 2023-2033 (US$ Million)
8.6.2 Market Share by Region, 2023 & 2033 (%)
8.7 Inactivated Vaccines
8.7.1 Market Size by Region, 2023-2033 (US$ Million)
8.7.2 Market Share by Region, 2023 & 2033 (%)
8.8 Toxoid Vaccines
8.8.1 Market Size by Region, 2023-2033 (US$ Million)
8.8.2 Market Share by Region, 2023 & 2033 (%)
8.9 Viral Vector Vaccines
8.9.1 Market Size by Region, 2023-2033 (US$ Million)
8.9.2 Market Share by Region, 2023 & 2033 (%)
8.10 Recombinant Vector Vaccines
8.10.1 Market Size by Region, 2023-2033 (US$ Million)
8.10.2 Market Share by Region, 2023 & 2033 (%)
8.11 Other Vaccine Types
8.11.1 Market Size by Region, 2023-2033 (US$ Million)
8.11.2 Market Share by Region, 2023 & 2033 (%)
9 Vaccine Contract Manufacturing Market Analysis by Operation
9.1 Key Findings
9.2 Operation Segment: Market Attractiveness Index
9.3 Vaccine Contract Manufacturing Market Size Estimation and Forecast by Operation
9.4 Preclinical
9.4.1 Market Size by Region, 2023-2033 (US$ Million)
9.4.2 Market Share by Region, 2023 & 2033 (%)
9.5 Clinical
9.5.1 Market Size by Region, 2023-2033 (US$ Million)
9.5.2 Market Share by Region, 2023 & 2033 (%)
9.6 Commercial
9.6.1 Market Size by Region, 2023-2033 (US$ Million)
9.6.2 Market Share by Region, 2023 & 2033 (%)
10 Vaccine Contract Manufacturing Market Analysis by Company Size
10.1 Key Findings
10.2 Company Size Segment: Market Attractiveness Index
10.3 Vaccine Contract Manufacturing Market Size Estimation and Forecast by Company Size
10.4 Small Manufacturers
10.4.1 Market Size by Region, 2023-2033 (US$ Million)
10.4.2 Market Share by Region, 2023 & 2033 (%)
10.5 Mid-sized Manufacturers
10.5.1 Market Size by Region, 2023-2033 (US$ Million)
10.5.2 Market Share by Region, 2023 & 2033 (%)
10.6 Large Manufacturers
10.6.1 Market Size by Region, 2023-2033 (US$ Million)
10.6.2 Market Share by Region, 2023 & 2033 (%)
10.7 Very Large Manufacturers
10.7.1 Market Size by Region, 2023-2033 (US$ Million)
10.7.2 Market Share by Region, 2023 & 2033 (%)
11 Vaccine Contract Manufacturing Market Analysis by Region
11.1 Key Findings
11.2 Regional Market Size Estimation and Forecast
12 North America Vaccine Contract Manufacturing Market Analysis
12.1 Key Findings
12.2 North America Vaccine Contract Manufacturing Market Attractiveness Index
12.3 North America Vaccine Contract Manufacturing Market by Country, 2023, 2028 & 2033 (US$ Million)
12.4 North America Vaccine Contract Manufacturing Market Size Estimation and Forecast by Country
12.5 North America Vaccine Contract Manufacturing Market Size Estimation and Forecast by Process
12.6 North America Vaccine Contract Manufacturing Market Size Estimation and Forecast by Downstream Process
12.7 North America Vaccine Contract Manufacturing Market Size Estimation and Forecast by Upstream Process
12.8 North America Vaccine Contract Manufacturing Market Size Estimation and Forecast by End-users
12.9 North America Vaccine Contract Manufacturing Market Size Estimation and Forecast by Vaccine Type
12.10 North America Vaccine Contract Manufacturing Market Size Estimation and Forecast by Operation
12.11 North America Vaccine Contract Manufacturing Market Size Estimation and Forecast by Company Size
12.12 U.S. Vaccine Contract Manufacturing Market Analysis
12.13 Canada Vaccine Contract Manufacturing Market Analysis
13 Europe Vaccine Contract Manufacturing Market Analysis
13.1 Key Findings
13.2 Europe Vaccine Contract Manufacturing Market Attractiveness Index
13.3 Europe Vaccine Contract Manufacturing Market by Country, 2023, 2028 & 2033 (US$ Million)
13.4 Europe Vaccine Contract Manufacturing Market Size Estimation and Forecast by Country
13.5 Europe Vaccine Contract Manufacturing Market Size Estimation and Forecast by Process
13.6 Europe Vaccine Contract Manufacturing Market Size Estimation and Forecast by Downstream Process
13.7 Europe Vaccine Contract Manufacturing Market Size Estimation and Forecast by Upstream Process
13.8 Europe Vaccine Contract Manufacturing Market Size Estimation and Forecast by End-users
13.9 Europe Vaccine Contract Manufacturing Market Size Estimation and Forecast by Vaccine Type
13.10 Europe Vaccine Contract Manufacturing Market Size Estimation and Forecast by Operation
13.11 Europe Vaccine Contract Manufacturing Market Size Estimation and Forecast by Company Size
13.12 Germany Vaccine Contract Manufacturing Market Analysis
13.13 UK Vaccine Contract Manufacturing Market Analysis
13.14 France Vaccine Contract Manufacturing Market Analysis
13.15 Italy Vaccine Contract Manufacturing Market Analysis
13.16 Spain Vaccine Contract Manufacturing Market Analysis
13.17 Russia Vaccine Contract Manufacturing Market Analysis
13.18 Rest of Europe Vaccine Contract Manufacturing Market Analysis
14 Asia Pacific Vaccine Contract Manufacturing Market Analysis
14.1 Key Findings
14.2 Asia Pacific Vaccine Contract Manufacturing Market Attractiveness Index
14.3 Asia Pacific Vaccine Contract Manufacturing Market by Country, 2023, 2028 & 2033 (US$ Million)
14.4 Asia Pacific Vaccine Contract Manufacturing Market Size Estimation and Forecast by Country
14.5 Asia Pacific Vaccine Contract Manufacturing Market Size Estimation and Forecast by Process
14.6 Asia Pacific Vaccine Contract Manufacturing Market Size Estimation and Forecast by Downstream Process
14.7 Asia Pacific Vaccine Contract Manufacturing Market Size Estimation and Forecast by Upstream Process
14.8 Asia Pacific Vaccine Contract Manufacturing Market Size Estimation and Forecast by End-users
14.9 Asia Pacific Vaccine Contract Manufacturing Market Size Estimation and Forecast by Vaccine Type
14.10 Asia Pacific Vaccine Contract Manufacturing Market Size Estimation and Forecast by Operation
14.11 Asia Pacific Vaccine Contract Manufacturing Market Size Estimation and Forecast by Company Size
14.12 China Vaccine Contract Manufacturing Market Analysis
14.13 India Vaccine Contract Manufacturing Market Analysis
14.14 Japan Vaccine Contract Manufacturing Market Analysis
14.15 South Korea Vaccine Contract Manufacturing Market Analysis
14.16 Australia Vaccine Contract Manufacturing Market Analysis
14.17 Rest of Asia-Pacific Vaccine Contract Manufacturing Market Analysis
15 Latin America Vaccine Contract Manufacturing Market Analysis
15.1 Key Findings
15.2 Latin America Vaccine Contract Manufacturing Market Attractiveness Index
15.3 Latin America Vaccine Contract Manufacturing Market by Country, 2023, 2028 & 2033 (US$ Million)
15.4 Latin America Vaccine Contract Manufacturing Market Size Estimation and Forecast by Country
15.5 Latin America Vaccine Contract Manufacturing Market Size Estimation and Forecast by Process
15.6 Latin America Vaccine Contract Manufacturing Market Size Estimation and Forecast by Downstream Process
15.7 Latin America Vaccine Contract Manufacturing Market Size Estimation and Forecast by Upstream Process
15.8 Latin America Vaccine Contract Manufacturing Market Size Estimation and Forecast by End-users
15.9 Latin America Vaccine Contract Manufacturing Market Size Estimation and Forecast by Vaccine Type
15.10 Latin America Vaccine Contract Manufacturing Market Size Estimation and Forecast by Operation
15.11 Latin America Vaccine Contract Manufacturing Market Size Estimation and Forecast by Company Size
15.12 Brazil Vaccine Contract Manufacturing Market Analysis
15.13 Mexico Vaccine Contract Manufacturing Market Analysis
15.14 Rest of Latin America Vaccine Contract Manufacturing Market Analysis
16 Middle East & Africa Vaccine Contract Manufacturing Market Analysis
16.1 Key Findings
16.2 Middle East & Africa Vaccine Contract Manufacturing Market Attractiveness Index
16.3 Middle East & Africa Vaccine Contract Manufacturing Market by Country, 2023, 2028 & 2033 (US$ Million)
16.4 Middle East & Africa Vaccine Contract Manufacturing Market Size Estimation and Forecast by Country
16.5 Middle East & Africa Vaccine Contract Manufacturing Market Size Estimation and Forecast by Process
16.6 Middle East & Africa Vaccine Contract Manufacturing Market Size Estimation and Forecast by Downstream Process
16.7 Middle East & Africa Vaccine Contract Manufacturing Market Size Estimation and Forecast by Upstream Process
16.8 Middle East & Africa Vaccine Contract Manufacturing Market Size Estimation and Forecast by End-users
16.9 Middle East & Africa Vaccine Contract Manufacturing Market Size Estimation and Forecast by Vaccine Type
16.10 Middle East & Africa Vaccine Contract Manufacturing Market Size Estimation and Forecast by Operation
16.11 Middle East & Africa Vaccine Contract Manufacturing Market Size Estimation and Forecast by Company Size
16.12 GCC Vaccine Contract Manufacturing Market Analysis
16.13 South Africa Vaccine Contract Manufacturing Market Analysis
16.14 Rest of MEA Vaccine Contract Manufacturing Market Analysis
17 Company Profiles
17.1 Competitive Landscape, 2022
17.2 Strategic Outlook
17.3 Catalent, Inc
17.3.1 Company Snapshot
17.3.2 Company Overview
17.3.3 Financial Analysis
17.3.3.1 Net Revenue, 2017-2022
17.3.3.2 Regional Market Shares, 2022
17.3.4 Service Benchmarking
17.3.5 Strategic Outlook
17.4 Emergent BioSolutions
17.4.1 Company Snapshot
17.4.2 Company Overview
17.4.3 Financial Analysis
17.4.3.1 Net Revenue, 2017-2022
17.4.3.2 R&D, 2017-2022
17.4.3.3 Regional Market Shares, 2022
17.4.4 Service Benchmarking
17.4.5 Strategic Outlook
17.5 Ajinomoto Bio-Pharma
17.5.1 Company Snapshot
17.5.2 Company Overview
17.5.3 Financial Analysis
17.5.3.1 Net Revenue, 2017-2022
17.5.3.2 Regional Market Shares, 2022
17.5.4 Service Benchmarking
17.5.5 Strategic Outlook
17.6 Lonza
17.6.1 Company Snapshot
17.6.2 Company Overview
17.6.3 Financial Analysis
17.6.3.1 Net Revenue, 2017-2022
17.6.3.2 R&D, 2017-2022
17.6.3.3 Regional Market Shares, 2022
17.6.4 Service Benchmarking
17.6.5 Strategic Outlook
17.7 Curia Global, Inc.
17.7.1 Company Snapshot
17.7.2 Company Overview
17.7.3 Service Benchmarking
17.7.4 Strategic Outlook
17.8 WuXi Biologics
17.8.1 Company Snapshot
17.8.2 Company Overview
17.8.3 Financial Analysis
17.8.3.1 Net Revenue, 2017-2022
17.8.3.2 R&D, 2017-2022
17.8.3.3 Regional Market Shares, 2022
17.8.4 Service Benchmarking
17.8.5 Strategic Outlook
17.9 Vibalogics
17.9.1 Company Snapshot
17.9.2 Company Overview
17.9.3 Service Benchmarking
17.9.4 Strategic Outlook
17.10 FUJIFILM Holdings Corporation
17.10.1 Company Snapshot
17.10.2 Company Overview
17.10.3 Financial Analysis
17.10.3.1 Net Revenue, 2017-2022
17.10.3.2 R&D, 2017-2022
17.10.3.3 Regional Market Shares, 2022
17.10.4 Service Benchmarking
17.11 Recipharm AB
17.11.1 Company Snapshot
17.11.2 Company Overview
17.11.3 Service Benchmarking
17.11.4 Strategic Outlook
17.12 Richter-Helm BioLogics GmbH & Co. KG
17.12.1 Company Snapshot
17.12.2 Company Overview
17.12.3 Service Benchmarking
17.12.4 Strategic Outlook
17.13 Bavarian Nordic
17.13.1 Company Snapshot
17.13.2 Company Overview
17.13.3 Financial Analysis
17.13.3.1 Net Revenue, 2017-2022
17.13.3.2 R&D, 2017-2022
17.13.4 Service Benchmarking
17.14 Charles River Laboratories
17.14.1 Company Snapshot
17.14.2 Company Overview
17.14.3 Financial Analysis
17.14.3.1 Net Revenue, 2017-2022
17.14.3.2 Regional Market Shares, 2022
17.14.4 Service Benchmarking
17.14.5 Strategic Outlook
17.15 ICON plc
17.15.1 Company Snapshot
17.15.2 Company Overview
17.15.3 Financial Analysis
17.15.3.1 Net Revenue, 2017-2022
17.15.3.2 R&D, 2017-2022
17.15.3.3 Regional Market Shares, 2022
17.15.4 Service Benchmarking
17.15.5 Strategic Outlook
17.16 Batavia Biosciences B.V.
17.16.1 Company Snapshot
17.16.2 Company Overview
17.16.3 Service Benchmarking
17.17 IDT Biologika
17.17.1 Company Snapshot
17.17.2 Company Overview
17.17.3 Service Benchmarking
18 Conclusion and Recommendations
18.1 Concluding Remarks from Visiongain
18.2 Recommendations for Market Players
ページTOPに戻る
List of Tables/Graphs
List of Tables
Table 1 Vaccine Contract Manufacturing Market Snapshot, 2023 & 2033 (US$ Million, CAGR %)
Table 2 Vaccine Contract Manufacturing Market Forecast by Region, 2023-2033 (US$ Million, AGR%, CAGR%): “V” Shaped Recovery
Table 3 Vaccine Contract Manufacturing Market Forecast by Region, 2023-2033 (US$ Million, AGR%, CAGR%): “U” Shaped Recovery
Table 4 Vaccine Contract Manufacturing Market Forecast by Region, 2023-2033 (US$ Million, AGR%, CAGR%): “W” Shaped Recovery
Table 5 Vaccine Contract Manufacturing Market Forecast by Region, 2023-2033 (US$ Million, AGR%, CAGR%): “L” Shaped Recovery
Table 6 Vaccine Contract Manufacturing Market Forecast by Process, 2023-2033 (US$ Million, AGR%, CAGR%)
Table 7 Upstream Process Segment Market Forecast by Region, 2023-2033 (US$ Million, AGR%, CAGR%)
Table 8 Downstream Process Segment Market Forecast by Region, 2023-2033 (US$ Million, AGR%, CAGR%)
Table 9 Vaccine Contract Manufacturing Market Forecast by Downstream Process, 2023-2033 (US$ Million, AGR%, CAGR%)
Table 10 Fill & Finish Operations Segment Market Forecast by Region, 2023-2033 (US$ Million, AGR%, CAGR%)
Table 11 Analytical & QC Studies Segment Market Forecast by Region, 2023-2033 (US$ Million, AGR%, CAGR%)
Table 12 Vaccine Packaging Segment Market Forecast by Region, 2023-2033 (US$ Million, AGR%, CAGR%)
Table 13 Vaccine Contract Manufacturing Market Forecast by Upstream Process, 2023-2033 (US$ Million, AGR%, CAGR%)
Table 14 Mammalian Expression Vaccine Type Segment Market Forecast by Region, 2023-2033 (US$ Million, AGR%, CAGR%)
Table 15 Bacterial Expression Vaccine Type Segment Market Forecast by Region, 2023-2033 (US$ Million, AGR%, CAGR%)
Table 16 Yeast Expression Vaccine Type Segment Market Forecast by Region, 2023-2033 (US$ Million, AGR%, CAGR%)
Table 17 Baculovirus/insect Expression Vaccine Type Segment Market Forecast by Region, 2023-2033 (US$ Million, AGR%, CAGR%)
Table 18 Other Upstream Process Segment Market Forecast by Region, 2023-2033 (US$ Million, AGR%, CAGR%)
Table 19 Vaccine Contract Manufacturing Market Forecast by End-use, 2023-2033 (US$ Million, AGR%, CAGR%)
Table 20 Human Use Segment Market Forecast by Region, 2023-2033 (US$ Million, AGR%, CAGR%)
Table 21 Veterinary Segment Market Forecast by Region, 2023-2033 (US$ Million, AGR%, CAGR%)
Table 22 Vaccine Contract Manufacturing Market Forecast by Vaccine Type, 2023-2033 (US$ Million, AGR%, CAGR%)
Table 23 Subunit Vaccines Type Segment Market Forecast by Region, 2023-2033 (US$ Million, AGR%, CAGR%)
Table 24 Live Attenuated Vaccines Segment Market Forecast by Region, 2023-2033 (US$ Million, AGR%, CAGR%)
Table 25 Conjugate Vaccines Segment Market Forecast by Region, 2023-2033 (US$ Million, AGR%, CAGR%)
Table 26 Inactivated Vaccines Segment Market Forecast by Region, 2023-2033 (US$ Million, AGR%, CAGR%)
Table 27 Toxoid Vaccines Segment Market Forecast by Region, 2023-2033 (US$ Million, AGR%, CAGR%)
Table 28 Viral Vector Vaccines Segment Market Forecast by Region, 2023-2033 (US$ Million, AGR%, CAGR%)
Table 29 Recombinant Vector Vaccines Segment Market Forecast by Region, 2023-2033 (US$ Million, AGR%, CAGR%)
Table 30 Other Vaccine Types Segment Market Forecast by Region, 2023-2033 (US$ Million, AGR%, CAGR%)
Table 31 Vaccine Contract Manufacturing Market Forecast by Operation, 2023-2033 (US$ Million, AGR%, CAGR%)
Table 32 Preclinical Segment Market Forecast by Region, 2023-2033 (US$ Million, AGR%, CAGR%)
Table 33 Clinical Segment Market Forecast by Region, 2023-2033 (US$ Million, AGR%, CAGR%)
Table 34 Commercial Segment Market Forecast by Region, 2023-2033 (US$ Million, AGR%, CAGR%)
Table 35 Vaccine Contract Manufacturing Market Forecast by Company Size, 2023-2033 (US$ Million, AGR%, CAGR%)
Table 36 Small Manufacturers Segment Market Forecast by Region, 2023-2033 (US$ Million, AGR%, CAGR%)
Table 37 Mid-sized Manufacturer Segment Market Forecast by Region, 2023-2033 (US$ Million, AGR%, CAGR%)
Table 38 Large Manufacturers Segment Market Forecast by Region, 2023-2033 (US$ Million, AGR%, CAGR%)
Table 39 Very Large Manufacturers Segment Market Forecast by Region, 2023-2033 (US$ Million, AGR%, CAGR%)
Table 40 Vaccine Contract Manufacturing Market Forecast by Region, 2023-2033 (US$ Million, AGR%, CAGR%)
Table 41 North America Vaccine Contract Manufacturing Market Forecast by Country, 2023-2033 (US$ Million, AGR%, CAGR%)
Table 42 North America Vaccine Contract Manufacturing Market Forecast by Process, 2023-2033 (US$ Million, AGR%, CAGR%)
Table 43 North America Vaccine Contract Manufacturing Market Forecast by Downstream Process, 2023-2033 (US$ Million, AGR%, CAGR%)
Table 44 North America Vaccine Contract Manufacturing Market Forecast by Upstream Process, 2023-2033 (US$ Million, AGR%, CAGR%)
Table 45 North America Vaccine Contract Manufacturing Market Forecast by End-use, 2023-2033 (US$ Million, AGR%, CAGR%)
Table 46 North America Vaccine Contract Manufacturing Market Forecast by Vaccine Type, 2023-2033 (US$ Million, AGR%, CAGR%)
Table 47 North America Vaccine Contract Manufacturing Market Forecast by Operation, 2023-2033 (US$ Million, AGR%, CAGR%)
Table 48 North America Vaccine Contract Manufacturing Market Forecast by Company Size, 2023-2033 (US$ Million, AGR%, CAGR%)
Table 49 U.S. Vaccine Contract Manufacturing Market Forecast, 2023-2033 (US$ Million, AGR%, CAGR%)
Table 50 Canada Vaccine Contract Manufacturing Market Forecast, 2023-2033 (US$ Million, AGR%, CAGR%)
Table 51 Europe Vaccine Contract Manufacturing Market Forecast by Country, 2023-2033 (US$ Million, AGR%, CAGR%)
Table 52 Europe Vaccine Contract Manufacturing Market Forecast by Process, 2023-2033 (US$ Million, AGR%, CAGR%)
Table 53 Europe Vaccine Contract Manufacturing Market Forecast by Downstream Process, 2023-2033 (US$ Million, AGR%, CAGR%)
Table 54 Europe Vaccine Contract Manufacturing Market Forecast by Upstream Process, 2023-2033 (US$ Million, AGR%, CAGR%)
Table 55 Europe Vaccine Contract Manufacturing Market Forecast by End-use, 2023-2033 (US$ Million, AGR%, CAGR%)
Table 56 Europe Vaccine Contract Manufacturing Market Forecast by Vaccine Type, 2023-2033 (US$ Million, AGR%, CAGR%)
Table 57 Europe Vaccine Contract Manufacturing Market Forecast by Operation, 2023-2033 (US$ Million, AGR%, CAGR%)
Table 58 Europe Vaccine Contract Manufacturing Market Forecast by Company Size, 2023-2033 (US$ Million, AGR%, CAGR%)
Table 59 Germany Vaccine Contract Manufacturing Market Forecast, 2023-2033 (US$ Million, AGR%, CAGR%)
Table 60 UK Vaccine Contract Manufacturing Market Forecast, 2023-2033 (US$ Million, AGR%, CAGR%)
Table 61 France Vaccine Contract Manufacturing Market Forecast, 2023-2033 (US$ Million, AGR%, CAGR%)
Table 62 Italy Vaccine Contract Manufacturing Market Forecast, 2023-2033 (US$ Million, AGR%, CAGR%)
Table 63 Spain Vaccine Contract Manufacturing Market Forecast, 2023-2033 (US$ Million, AGR%, CAGR%)
Table 64 Russia Vaccine Contract Manufacturing Market Forecast, 2023-2033 (US$ Million, AGR%, CAGR%)
Table 65 Rest of Europe Vaccine Contract Manufacturing Market Forecast, 2023-2033 (US$ Million, AGR%, CAGR%)
Table 66 Asia Pacific Vaccine Contract Manufacturing Market Forecast by Country, 2023-2033 (US$ Million, AGR%, CAGR%)
Table 67 Asia Pacific Vaccine Contract Manufacturing Market Forecast by Process, 2023-2033 (US$ Million, AGR%, CAGR%)
Table 68 Asia Pacific Vaccine Contract Manufacturing Market Forecast by Downstream Process, 2023-2033 (US$ Million, AGR%, CAGR%)
Table 69 Asia Pacific Vaccine Contract Manufacturing Market Forecast by Upstream Process, 2023-2033 (US$ Million, AGR%, CAGR%)
Table 70 Asia Pacific Vaccine Contract Manufacturing Market Forecast by End-use, 2023-2033 (US$ Million, AGR%, CAGR%)
Table 71 Asia Pacific Vaccine Contract Manufacturing Market Forecast by Vaccine Type, 2023-2033 (US$ Million, AGR%, CAGR%)
Table 72 Asia Pacific Vaccine Contract Manufacturing Market Forecast by Operation, 2023-2033 (US$ Million, AGR%, CAGR%)
Table 73 Asia Pacific Vaccine Contract Manufacturing Market Forecast by Company Size, 2023-2033 (US$ Million, AGR%, CAGR%)
Table 74 China Vaccine Contract Manufacturing Market Forecast, 2023-2033 (US$ Million, AGR%, CAGR%)
Table 75 India Vaccine Contract Manufacturing Market Forecast, 2023-2033 (US$ Million, AGR%, CAGR%)
Table 76 Japan Vaccine Contract Manufacturing Market Forecast, 2023-2033 (US$ Million, AGR%, CAGR%)
Table 77 South Korea Vaccine Contract Manufacturing Market Forecast, 2023-2033 (US$ Million, AGR%, CAGR%)
Table 78 Australia Vaccine Contract Manufacturing Market Forecast, 2023-2033 (US$ Million, AGR%, CAGR%)
Table 79 Rest of Asia-Pacific Vaccine Contract Manufacturing Market Forecast, 2023-2033 (US$ Million, AGR%, CAGR%)
Table 80 Latin America Vaccine Contract Manufacturing Market Forecast by Country, 2023-2033 (US$ Million, AGR%, CAGR%)
Table 81 Latin America Vaccine Contract Manufacturing Market Forecast by Process, 2023-2033 (US$ Million, AGR%, CAGR%)
Table 82 Latin America Vaccine Contract Manufacturing Market Forecast by Downstream Process, 2023-2033 (US$ Million, AGR%, CAGR%)
Table 83 Latin America Vaccine Contract Manufacturing Market Forecast by Upstream Process, 2023-2033 (US$ Million, AGR%, CAGR%)
Table 84 Latin America Vaccine Contract Manufacturing Market Forecast by End-use, 2023-2033 (US$ Million, AGR%, CAGR%)
Table 85 Latin America Vaccine Contract Manufacturing Market Forecast by Vaccine Type, 2023-2033 (US$ Million, AGR%, CAGR%)
Table 86 Latin America Vaccine Contract Manufacturing Market Forecast by Operation, 2023-2033 (US$ Million, AGR%, CAGR%)
Table 87 Latin America Vaccine Contract Manufacturing Market Forecast by Company Size, 2023-2033 (US$ Million, AGR%, CAGR%)
Table 88 Brazil Vaccine Contract Manufacturing Market Forecast, 2023-2033 (US$ Million, AGR%, CAGR%)
Table 89 Mexico Vaccine Contract Manufacturing Market Forecast, 2023-2033 (US$ Million, AGR%, CAGR%)
Table 90 Rest of Latin America Vaccine Contract Manufacturing Market Forecast, 2023-2033 (US$ Million, AGR%, CAGR%)
Table 91 Middle East & Africa Vaccine Contract Manufacturing Market Forecast by Country, 2023-2033 (US$ Million, AGR%, CAGR%)
Table 92 Middle East & Africa Vaccine Contract Manufacturing Market Forecast by Process, 2023-2033 (US$ Million, AGR%, CAGR%)
Table 93 Middle East & Africa Vaccine Contract Manufacturing Market Forecast by Downstream Process, 2023-2033 (US$ Million, AGR%, CAGR%)
Table 94 Middle East & Africa Vaccine Contract Manufacturing Market Forecast by Upstream Process, 2023-2033 (US$ Million, AGR%, CAGR%)
Table 95 Middle East & Africa Vaccine Contract Manufacturing Market Forecast by End-use, 2023-2033 (US$ Million, AGR%, CAGR%)
Table 96 Middle East & Africa Vaccine Contract Manufacturing Market Forecast by Vaccine Type, 2023-2033 (US$ Million, AGR%, CAGR%)
Table 97 Middle East & Africa Vaccine Contract Manufacturing Market Forecast by Operation, 2023-2033 (US$ Million, AGR%, CAGR%)
Table 98 Middle East & Africa Vaccine Contract Manufacturing Market Forecast by Company Size, 2023-2033 (US$ Million, AGR%, CAGR%)
Table 99 GCC Vaccine Contract Manufacturing Market Forecast, 2023-2033 (US$ Million, AGR%, CAGR%)
Table 100 South Africa Vaccine Contract Manufacturing Market Forecast, 2023-2033 (US$ Million, AGR%, CAGR%)
Table 101 Rest of MEA Vaccine Contract Manufacturing Market Forecast, 2023-2033 (US$ Million, AGR%, CAGR%)
Table 102 Strategic Outlook
Table 103 Catalent, Inc: Key Details, (CEO, HQ, Revenue, Founded, No. of Employees, Company Type, Website, Business Segment)
Table 104 Catalent, Inc: Service Benchmarking
Table 105 Catalent, Inc: Strategic Outlook
Table 106 Emergent BioSolutions: Key Details, (CEO, HQ, Revenue, Founded, No. of Employees, Company Type, Website, Business Segment)
Table 107 Emergent BioSolutions: Service Benchmarking
Table 108 Emergent BioSolutions: Strategic Outlook
Table 109 Ajinomoto Bio-Pharma: Key Details, (CEO, HQ, Revenue, Founded, No. of Employees, Company Type, Website, Business Segment)
Table 110 Ajinomoto Bio-Pharma: Service Benchmarking
Table 111 Ajinomoto Bio-Pharma: Strategic Outlook
Table 112 Lonza: Key Details, (CEO, HQ, Revenue, Founded, No. of Employees, Company Type, Website, Business Segment)
Table 113 Lonza: Service Benchmarking
Table 114 Lonza: Strategic Outlook
Table 115 Curia Global, Inc.: Key Details, (CEO, HQ, Revenue, Founded, No. of Employees, Company Type, Website, Business Segment)
Table 116 Curia Global Inc.: Service Benchmarking
Table 117 Curia Global Inc.: Strategic Outlook
Table 118 WuXi Biologics: Key Details, (CEO, HQ, Revenue, Founded, No. of Employees, Company Type, Website, Business Segment)
Table 119 WuXi Biologics: Service Benchmarking
Table 120 WuXi Biologics: Strategic Outlook
Table 121 Vibalogics: Key Details, (CEO, HQ, Revenue, Founded, No. of Employees, Company Type, Website, Business Segment)
Table 122 Vibalogics: Service Benchmarking
Table 123 Vibalogics: Strategic Outlook
Table 124 FUJIFILM Holdings Corporation: Key Details, (CEO, HQ, Revenue, Founded, No. of Employees, Company Type, Website, Business Segment)
Table 125 FUJIFILM Holdings Corporation: Service Benchmarking
Table 126 Recipharm AB: Key Details, (CEO, HQ, Revenue, Founded, No. of Employees, Company Type, Website, Business Segment)
Table 127 Recipharm AB: Service Benchmarking
Table 128 Recipharm AB: Strategic Outlook
Table 129 Richter-Helm BioLogics GmbH & Co. KG: Key Details, (CEO, HQ, Revenue, Founded, No. of Employees, Company Type, Website, Business Segment)
Table 130 Richter-Helm BioLogics GmbH & Co. KG: Service Benchmarking
Table 131 Richter-Helm BioLogics GmbH & Co. KG: Strategic Outlook
Table 132 Bavarian Nordic: Key Details, (CEO, HQ, Revenue, Founded, No. of Employees, Company Type, Website, Business Segment)
Table 133 Bavarian Nordic: Service Benchmarking
Table 134 Charles River Laboratories: Key Details, (CEO, HQ, Revenue, Founded, No. of Employees, Company Type, Website, Business Segment)
Table 135 Charles River Laboratories: Service Benchmarking
Table 136 Charles River Laboratories: Strategic Outlook
Table 137 ICON plc: Key Details, (CEO, HQ, Revenue, Founded, No. of Employees, Company Type, Website, Business Segment)
Table 138 ICON plc: Service Benchmarking
Table 139 ICON plc: Strategic Outlook
Table 140 Batavia Biosciences B.V.: Key Details, (CEO, HQ, Revenue, Founded, No. of Employees, Company Type, Website, Business Segment)
Table 141 Batavia Biosciences B.V.: Service Benchmarking
Table 142 IDT Biologika: Key Details, (CEO, HQ, Revenue, Founded, No. of Employees, Company Type, Website, Business Segment)
Table 143 IDT Biologika: Service Benchmarking
List of Figures
Figure 1 Vaccine Contract Manufacturing Market Segmentation
Figure 2 Vaccine Contract Manufacturing Market by Process Type: Market Attractiveness Index
Figure 3 Vaccine Contract Manufacturing Market by Downstream: Market Attractiveness Index
Figure 4 Vaccine Contract Manufacturing Market by Downstream: Market Attractiveness Index
Figure 5 Vaccine Contract Manufacturing Market by End-use: Market Attractiveness Index
Figure 6 Vaccine Contract Manufacturing Market by Vaccine Type: Market Attractiveness Index
Figure 7 Vaccine Contract Manufacturing Market by Operation: Market Attractiveness Index
Figure 8 Vaccine Contract Manufacturing Market by Company Size: Market Attractiveness Index
Figure 9 Vaccine Contract Manufacturing Market Attractiveness Index by Region
Figure 10 Vaccine Contract Manufacturing Market: Market Dynamics
Figure 11 Vaccine Contract Manufacturing Market by Region, 2023-2033 (US$ Million, AGR %): “V” Shaped Recovery
Figure 12 Vaccine Contract Manufacturing Market by Region, 2023-2033 (US$ Million, AGR %): “U” Shaped Recovery
Figure 13 Vaccine Contract Manufacturing Market by Region, 2023-2033 (US$ Million, AGR %): “W” Shaped Recovery
Figure 14 Vaccine Contract Manufacturing Market by Region, 2023-2033 (US$ Million, AGR %): “L” Shaped Recovery
Figure 15 Vaccine Contract Manufacturing Market: Porter’s Five Forces Analysis
Figure 16 Vaccine Contract Manufacturing Market: PEST Analysis
Figure 17 Vaccine Contract Manufacturing Market by Process: Market Attractiveness Index
Figure 18 Vaccine Contract Manufacturing Market Forecast by Process, 2023-2033 (US$ Million, AGR %)
Figure 19 Vaccine Contract Manufacturing Market Share Forecast by Process, 2023, 2028, 2033 (%)
Figure 20 Upstream Process Segment Market Forecast by Region, 2023-2033 (US$ Million, AGR %)
Figure 21 Upstream Process Segment Market Share Forecast by Region, 2023 & 2033 (%)
Figure 22 Downstream Process Segment Market Forecast by Region, 2023-2033 (US$ Million, AGR %)
Figure 23 Downstream Process Segment Market Share Forecast by Region, 2023 & 2033 (%)
Figure 24 Vaccine Contract Manufacturing Market by Downstream Process: Market Attractiveness Index
Figure 25 Vaccine Contract Manufacturing Market Forecast by Downstream Process, 2023-2033 (US$ Million, AGR %)
Figure 26 Vaccine Contract Manufacturing Market Share Forecast by Downstream Process, 2023, 2028, 2033 (%)
Figure 27 Fill & Finish Operations Segment Market Forecast by Region, 2023-2033 (US$ Million, AGR %)
Figure 28 Fill & Finish Operations Segment Market Share Forecast by Region, 2023 & 2033 (%)
Figure 29 Analytical & QC Studies Segment Market Forecast by Region, 2023-2033 (US$ Million, AGR %)
Figure 30 Analytical & QC Studies Segment Market Share Forecast by Region, 2023 & 2033 (%)
Figure 31 Vaccine Packaging Segment Market Forecast by Region, 2023-2033 (US$ Million, AGR %)
Figure 32 Vaccine Packaging Segment Market Share Forecast by Region, 2023 & 2033 (%)
Figure 33 Vaccine Contract Manufacturing Market by Upstream Process: Market Attractiveness Index
Figure 34 Vaccine Contract Manufacturing Market Forecast by Upstream Process, 2023-2033 (US$ Million, AGR %)
Figure 35 Vaccine Contract Manufacturing Market Share Forecast by Upstream Process, 2023, 2028, 2033 (%)
Figure 36 Mammalian Expression Vaccine Type Segment Market Forecast by Region, 2023-2033 (US$ Million, AGR %)
Figure 37 Mammalian Expression Vaccine Type Segment Market Share Forecast by Region, 2023 & 2033 (%)
Figure 38 Bacterial Expression Vaccine Type Segment Market Forecast by Region, 2023-2033 (US$ Million, AGR %)
Figure 39 Bacterial Expression Vaccine Type Segment Market Share Forecast by Region, 2023 & 2033 (%)
Figure 40 Yeast Expression Vaccine Type Segment Market Forecast by Region, 2023-2033 (US$ Million, AGR %)
Figure 41 Yeast Expression Vaccine Type Segment Market Share Forecast by Region, 2023 & 2033 (%)
Figure 42 Baculovirus/insect Expression Vaccine Type Segment Market Forecast by Region, 2023-2033 (US$ Million, AGR %)
Figure 43 Baculovirus/insect Expression Vaccine Type Segment Market Share Forecast by Region, 2023 & 2033 (%)
Figure 44 Other Upstream Process Segment Market Forecast by Region, 2023-2033 (US$ Million, AGR %)
Figure 45 Other Upstream Process Segment Market Share Forecast by Region, 2023 & 2033 (%)
Figure 46 Vaccine Contract Manufacturing Market by End-use: Market Attractiveness Index
Figure 47 Vaccine Contract Manufacturing Market Forecast by End-use, 2023-2033 (US$ Million, AGR %)
Figure 48 Vaccine Contract Manufacturing Market Share Forecast by End-use, 2023, 2028, 2033 (%)
Figure 49 Human Use Segment Market Forecast by Region, 2023-2033 (US$ Million, AGR %)
Figure 50 Human Use Segment Market Share Forecast by Region, 2023 & 2033 (%)
Figure 51 Veterinary Segment Market Forecast by Region, 2023-2033 (US$ Million, AGR %)
Figure 52 Veterinary Segment Market Share Forecast by Region, 2023 & 2033 (%)
Figure 53 Vaccine Contract Manufacturing Market by Vaccine Type: Market Attractiveness Index
Figure 54 Vaccine Contract Manufacturing Market Forecast by Vaccine Type, 2023-2033 (US$ Million, AGR %)
Figure 55 Vaccine Contract Manufacturing Market Share Forecast by Vaccine Type, 2023, 2028, 2033 (%)
Figure 56 Subunit Vaccines Segment Market Forecast by Region, 2023-2033 (US$ Million, AGR %)
Figure 57 Subunit Vaccines Segment Market Share Forecast by Region, 2023 & 2033 (%)
Figure 58 Live Attenuated Vaccines Segment Market Forecast by Region, 2023-2033 (US$ Million, AGR %)
Figure 59 Live Attenuated Vaccines Segment Market Share Forecast by Region, 2023 & 2033 (%)
Figure 60 Conjugate Vaccines Segment Market Forecast by Region, 2023-2033 (US$ Million, AGR %)
Figure 61 Conjugate Vaccines Segment Market Share Forecast by Region, 2023 & 2033 (%)
Figure 62 Inactivated Vaccines Segment Market Forecast by Region, 2023-2033 (US$ Million, AGR %)
Figure 63 Inactivated Vaccines Segment Market Share Forecast by Region, 2023 & 2033 (%)
Figure 64 Toxoid Vaccines Segment Market Forecast by Region, 2023-2033 (US$ Million, AGR %)
Figure 65 Toxoid Vaccines Segment Market Share Forecast by Region, 2023 & 2033 (%)
Figure 66 Viral Vector Vaccines Segment Market Forecast by Region, 2023-2033 (US$ Million, AGR %)
Figure 67 Viral Vector Vaccines Segment Market Share Forecast by Region, 2023 & 2033 (%)
Figure 68 Recombinant Vector Vaccines Segment Market Forecast by Region, 2023-2033 (US$ Million, AGR %)
Figure 69 Recombinant Vector Vaccines Segment Market Share Forecast by Region, 2023 & 2033 (%)
Figure 70 Other Vaccine Types Segment Market Forecast by Region, 2023-2033 (US$ Million, AGR %)
Figure 71 Other Vaccine Types Segment Market Share Forecast by Region, 2023 & 2033 (%)
Figure 72 Vaccine Contract Manufacturing Market by Operation: Market Attractiveness Index
Figure 73 Vaccine Contract Manufacturing Market Forecast by Operation, 2023-2033 (US$ Million, AGR %)
Figure 74 Vaccine Contract Manufacturing Market Share Forecast by Operation, 2023, 2028, 2033 (%)
Figure 75 Preclinical Segment Market Forecast by Region, 2023-2033 (US$ Million, AGR %)
Figure 76 Preclinical Segment Market Share Forecast by Region, 2023 & 2033 (%)
Figure 77 Clinical Segment Market Forecast by Region, 2023-2033 (US$ Million, AGR %)
Figure 78 Clinical Segment Market Share Forecast by Region, 2023 & 2033 (%)
Figure 79 Commercial Segment Market Forecast by Region, 2023-2033 (US$ Million, AGR %)
Figure 80 Commercial Segment Market Share Forecast by Region, 2023 & 2033 (%)
Figure 81 Vaccine Contract Manufacturing Market by Company Size: Market Attractiveness Index
Figure 82 Vaccine Contract Manufacturing Market Forecast by Company Size, 2023-2033 (US$ Million, AGR %)
Figure 83 Vaccine Contract Manufacturing Market Share Forecast by Company Size, 2023, 2028, 2033 (%)
Figure 84 Small Manufacturers Segment Market Forecast by Region, 2023-2033 (US$ Million, AGR %)
Figure 85 Small Manufacturers Segment Market Share Forecast by Region, 2023 & 2033 (%)
Figure 86 Mid-sized Manufacturers Segment Market Forecast by Region, 2023-2033 (US$ Million, AGR %)
Figure 87 Mid-sized Manufacturers Segment Market Share Forecast by Region, 2023 & 2033 (%)
Figure 88 Large Manufacturers Segment Market Forecast by Region, 2023-2033 (US$ Million, AGR %)
Figure 89 Large Manufacturers Segment Market Share Forecast by Region, 2023 & 2033 (%)
Figure 90 Very Large Manufacturers Segment Market Forecast by Region, 2023-2033 (US$ Million, AGR %)
Figure 91 Very Large Manufacturers Segment Market Share Forecast by Region, 2023 & 2033 (%)
Figure 92 Vaccine Contract Manufacturing Market Forecast by Region 2023 and 2033 (Revenue, CAGR%)
Figure 93 Vaccine Contract Manufacturing Market Share Forecast by Region 2023, 2028, 2033 (%)
Figure 94 Vaccine Contract Manufacturing Market by Region, 2023-2033 (US$ Million, AGR %)
Figure 95 North America Vaccine Contract Manufacturing Market Attractiveness Index
Figure 96 North America Vaccine Contract Manufacturing Market by Region, 2023, 2028 & 2033 (US$ Million)
Figure 97 North America Vaccine Contract Manufacturing Market Forecast by Country, 2023-2033 (US$ Million, AGR %)
Figure 98 North America Vaccine Contract Manufacturing Market Share Forecast by Country, 2023 & 2033 (%)
Figure 99 North America Vaccine Contract Manufacturing Market Forecast by Process, 2023-2033 (US$ Million, AGR %)
Figure 100 North America Vaccine Contract Manufacturing Market Share Forecast by Process, 2023 & 2033 (%)
Figure 101 North America Vaccine Contract Manufacturing Market Forecast by Downstream Process, 2023-2033 (US$ Million, AGR %)
Figure 102 North America Vaccine Contract Manufacturing Market Share Forecast by Downstream Process, 2023 & 2033 (%)
Figure 103 North America Vaccine Contract Manufacturing Market Forecast by Upstream Process, 2023-2033 (US$ Million, AGR %)
Figure 104 North America Vaccine Contract Manufacturing Market Share Forecast by Upstream Process, 2023 & 2033 (%)
Figure 105 North America Vaccine Contract Manufacturing Market Forecast by End-use, 2023-2033 (US$ Million, AGR %)
Figure 106 North America Vaccine Contract Manufacturing Market Share Forecast by End-use, 2023 & 2033 (%)
Figure 107 North America Vaccine Contract Manufacturing Market Forecast by Vaccine Type, 2023-2033 (US$ Million, AGR %)
Figure 108 North America Vaccine Contract Manufacturing Market Share Forecast by Vaccine Type, 2023 & 2033 (%)
Figure 109 North America Vaccine Contract Manufacturing Market Forecast by Operation, 2023-2033 (US$ Million, AGR %)
Figure 110 North America Vaccine Contract Manufacturing Market Share Forecast by Operation, 2023 & 2033 (%)
Figure 111 North America Vaccine Contract Manufacturing Market Forecast by Company Size, 2023-2033 (US$ Million, AGR %)
Figure 112 North America Vaccine Contract Manufacturing Market Share Forecast by Company Size, 2023 & 2033 (%)
Figure 113 U.S. Vaccine Contract Manufacturing Market Forecast, 2023-2033 (US$ Million, AGR %)
Figure 114 Canada Vaccine Contract Manufacturing Market Forecast, 2023-2033 (US$ Million, AGR %)
Figure 115 Europe Vaccine Contract Manufacturing Market Attractiveness Index
Figure 116 Europe Vaccine Contract Manufacturing Market by Region, 2023, 2028 & 2033 (US$ Million)
Figure 117 Europe Vaccine Contract Manufacturing Market Forecast by Country, 2023-2033 (US$ Million, AGR %)
Figure 118 Europe Vaccine Contract Manufacturing Market Share Forecast by Country, 2023 & 2033 (%)
Figure 119 Europe Vaccine Contract Manufacturing Market Forecast by Process, 2023-2033 (US$ Million, AGR %)
Figure 120 Europe Vaccine Contract Manufacturing Market Share Forecast by Process, 2023 & 2033 (%)
Figure 121 Europe Vaccine Contract Manufacturing Market Forecast by Downstream Process, 2023-2033 (US$ Million, AGR %)
Figure 122 Europe Vaccine Contract Manufacturing Market Share Forecast by Downstream Process, 2023 & 2033 (%)
Figure 123 Europe Vaccine Contract Manufacturing Market Forecast by Upstream Process, 2023-2033 (US$ Million, AGR %)
Figure 124 Europe Vaccine Contract Manufacturing Market Share Forecast by Upstream Process, 2023 & 2033 (%)
Figure 125 Europe Vaccine Contract Manufacturing Market Forecast by End-use, 2023-2033 (US$ Million, AGR %)
Figure 126 Europe Vaccine Contract Manufacturing Market Share Forecast by End-use, 2023 & 2033 (%)
Figure 127 Europe Vaccine Contract Manufacturing Market Forecast by Vaccine Type, 2023-2033 (US$ Million, AGR %)
Figure 128 Europe Vaccine Contract Manufacturing Market Share Forecast by Vaccine Type, 2023 & 2033 (%)
Figure 129 Europe Vaccine Contract Manufacturing Market Forecast by Operation, 2023-2033 (US$ Million, AGR %)
Figure 130 Europe Vaccine Contract Manufacturing Market Share Forecast by Operation, 2023 & 2033 (%)
Figure 131 Europe Vaccine Contract Manufacturing Market Forecast by Company Size, 2023-2033 (US$ Million, AGR %)
Figure 132 Europe Vaccine Contract Manufacturing Market Share Forecast by Company Size, 2023 & 2033 (%)
Figure 133 Germany Vaccine Contract Manufacturing Market Forecast, 2023-2033 (US$ Million, AGR %)
Figure 134 UK Vaccine Contract Manufacturing Market Forecast, 2023-2033 (US$ Million, AGR %)
Figure 135 France Vaccine Contract Manufacturing Market Forecast, 2023-2033 (US$ Million, AGR %)
Figure 136 Italy Vaccine Contract Manufacturing Market Forecast, 2023-2033 (US$ Million, AGR %)
Figure 137 Spain Vaccine Contract Manufacturing Market Forecast, 2023-2033 (US$ Million, AGR %)
Figure 138 Russia Vaccine Contract Manufacturing Market Forecast, 2023-2033 (US$ Million, AGR %)
Figure 139 Rest of Europe Vaccine Contract Manufacturing Market Forecast, 2023-2033 (US$ Million, AGR %)
Figure 140 Asia Pacific Vaccine Contract Manufacturing Market Attractiveness Index
Figure 141 Asia Pacific Vaccine Contract Manufacturing Market by Region, 2023, 2028 & 2033 (US$ Million)
Figure 142 Asia Pacific Vaccine Contract Manufacturing Market Forecast by Country, 2023-2033 (US$ Million, AGR %)
Figure 143 Asia Pacific Vaccine Contract Manufacturing Market Share Forecast by Country, 2023 & 2033 (%)
Figure 144 Asia Pacific Vaccine Contract Manufacturing Market Forecast by Process, 2023-2033 (US$ Million, AGR %)
Figure 145 Asia Pacific Vaccine Contract Manufacturing Market Share Forecast by Process, 2023 & 2033 (%)
Figure 146 Asia Pacific Vaccine Contract Manufacturing Market Forecast by Downstream Process, 2023-2033 (US$ Million, AGR %)
Figure 147 Asia Pacific Vaccine Contract Manufacturing Market Share Forecast by Downstream Process, 2023 & 2033 (%)
Figure 148 Asia Pacific Vaccine Contract Manufacturing Market Forecast by Upstream Process, 2023-2033 (US$ Million, AGR %)
Figure 149 Asia Pacific Vaccine Contract Manufacturing Market Share Forecast by Upstream Process, 2023 & 2033 (%)
Figure 150 Asia Pacific Vaccine Contract Manufacturing Market Forecast by End-use, 2023-2033 (US$ Million, AGR %)
Figure 151 Asia Pacific Vaccine Contract Manufacturing Market Share Forecast by End-use, 2023 & 2033 (%)
Figure 152 Asia Pacific Vaccine Contract Manufacturing Market Forecast by Vaccine Type, 2023-2033 (US$ Million, AGR %)
Figure 153 Asia Pacific Vaccine Contract Manufacturing Market Share Forecast by Vaccine Type, 2023 & 2033 (%)
Figure 154 Asia Pacific Vaccine Contract Manufacturing Market Forecast by Operation, 2023-2033 (US$ Million, AGR %)
Figure 155 Asia Pacific Vaccine Contract Manufacturing Market Share Forecast by Operation, 2023 & 2033 (%)
Figure 156 Asia Pacific Vaccine Contract Manufacturing Market Forecast by Company Size, 2023-2033 (US$ Million, AGR %)
Figure 157 Asia Pacific Vaccine Contract Manufacturing Market Share Forecast by Company Size, 2023 & 2033 (%)
Figure 158 China Vaccine Contract Manufacturing Market Forecast, 2023-2033 (US$ Million, AGR %)
Figure 159 India Vaccine Contract Manufacturing Market Forecast, 2023-2033 (US$ Million, AGR %)
Figure 160 Japan Vaccine Contract Manufacturing Market Forecast, 2023-2033 (US$ Million, AGR %)
Figure 161 South Korea Vaccine Contract Manufacturing Market Forecast, 2023-2033 (US$ Million, AGR %)
Figure 162 Australia Vaccine Contract Manufacturing Market Forecast, 2023-2033 (US$ Million, AGR %)
Figure 163 Rest of Asia-Pacific Vaccine Contract Manufacturing Market Forecast, 2023-2033 (US$ Million, AGR %)
Figure 164 Latin America Vaccine Contract Manufacturing Market Attractiveness Index
Figure 165 Latin America Vaccine Contract Manufacturing Market by Region, 2023, 2028 & 2033 (US$ Million)
Figure 166 Latin America Vaccine Contract Manufacturing Market Forecast by Country, 2023-2033 (US$ Million, AGR %)
Figure 167 Latin America Vaccine Contract Manufacturing Market Share Forecast by Country, 2023 & 2033 (%)
Figure 168 Latin America Vaccine Contract Manufacturing Market Forecast by Process, 2023-2033 (US$ Million, AGR %)
Figure 169 Latin America Vaccine Contract Manufacturing Market Share Forecast by Process, 2023 & 2033 (%)
Figure 170 Latin America Vaccine Contract Manufacturing Market Forecast by Downstream Process, 2023-2033 (US$ Million, AGR %)
Figure 171 Latin America Vaccine Contract Manufacturing Market Share Forecast by Downstream Process, 2023 & 2033 (%)
Figure 172 Latin America Vaccine Contract Manufacturing Market Forecast by Upstream Process, 2023-2033 (US$ Million, AGR %)
Figure 173 Latin America Vaccine Contract Manufacturing Market Share Forecast by Upstream Process, 2023 & 2033 (%)
Figure 174 Latin America Vaccine Contract Manufacturing Market Forecast by End-use, 2023-2033 (US$ Million, AGR %)
Figure 175 Latin America Vaccine Contract Manufacturing Market Share Forecast by End-use, 2023 & 2033 (%)
Figure 176 Latin America Vaccine Contract Manufacturing Market Forecast by Vaccine Type, 2023-2033 (US$ Million, AGR %)
Figure 177 Latin America Vaccine Contract Manufacturing Market Share Forecast by Vaccine Type, 2023 & 2033 (%)
Figure 178 Latin America Vaccine Contract Manufacturing Market Forecast by Operation, 2023-2033 (US$ Million, AGR %)
Figure 179 Latin America Vaccine Contract Manufacturing Market Share Forecast by Operation, 2023 & 2033 (%)
Figure 180 Latin America Vaccine Contract Manufacturing Market Forecast by Company Size, 2023-2033 (US$ Million, AGR %)
Figure 181 Latin America Vaccine Contract Manufacturing Market Share Forecast by Company Size, 2023 & 2033 (%)
Figure 182 Brazil Vaccine Contract Manufacturing Market Forecast, 2023-2033 (US$ Million, AGR %)
Figure 183 Mexico Vaccine Contract Manufacturing Market Forecast, 2023-2033 (US$ Million, AGR %)
Figure 184 Rest of Latin America Vaccine Contract Manufacturing Market Forecast, 2023-2033 (US$ Million, AGR %)
Figure 185 Middle East & Africa Vaccine Contract Manufacturing Market Attractiveness Index
Figure 186 Middle East & Africa Vaccine Contract Manufacturing Market by Region, 2023, 2028 & 2033 (US$ Million)
Figure 187 Middle East & Africa Vaccine Contract Manufacturing Market Forecast by Country, 2023-2033 (US$ Million, AGR %)
Figure 188 Middle East & Africa Vaccine Contract Manufacturing Market Share Forecast by Country, 2023 & 2033 (%)
Figure 189 Middle East & Africa Vaccine Contract Manufacturing Market Forecast by Process, 2023-2033 (US$ Million, AGR %)
Figure 190 Middle East & Africa Vaccine Contract Manufacturing Market Share Forecast by Process, 2023 & 2033 (%)
Figure 191 Middle East & Africa Vaccine Contract Manufacturing Market Forecast by Downstream Process, 2023-2033 (US$ Million, AGR %)
Figure 192 Middle East & Africa Vaccine Contract Manufacturing Market Share Forecast by Downstream Process, 2023 & 2033 (%)
Figure 193 Middle East & Africa Vaccine Contract Manufacturing Market Forecast by Upstream Process, 2023-2033 (US$ Million, AGR %)
Figure 194 Middle East & Africa Vaccine Contract Manufacturing Market Share Forecast by Upstream Process, 2023 & 2033 (%)
Figure 195 Middle East & Africa Vaccine Contract Manufacturing Market Forecast by End-use, 2023-2033 (US$ Million, AGR %)
Figure 196 Middle East & Africa Vaccine Contract Manufacturing Market Share Forecast by End-use, 2023 & 2033 (%)
Figure 197 Middle East & Africa Vaccine Contract Manufacturing Market Forecast by Vaccine Type, 2023-2033 (US$ Million, AGR %)
Figure 198 Middle East & Africa Vaccine Contract Manufacturing Market Share Forecast by Vaccine Type, 2023 & 2033 (%)
Figure 199 Middle East & Africa Vaccine Contract Manufacturing Market Forecast by Operation, 2023-2033 (US$ Million, AGR %)
Figure 200 Middle East & Africa Vaccine Contract Manufacturing Market Share Forecast by Operation, 2023 & 2033 (%)
Figure 201 Middle East & Africa Vaccine Contract Manufacturing Market Forecast by Company Size, 2023-2033 (US$ Million, AGR %)
Figure 202 Middle East & Africa Vaccine Contract Manufacturing Market Share Forecast by Company Size, 2023 & 2033 (%)
Figure 203 GCC Vaccine Contract Manufacturing Market Forecast, 2023-2033 (US$ Million, AGR %)
Figure 204 South Africa Vaccine Contract Manufacturing Market Forecast, 2023-2033 (US$ Million, AGR %)
Figure 205 Rest of MEA Vaccine Contract Manufacturing Market Forecast, 2023-2033 (US$ Million, AGR %)
Figure 206 Vaccine Contract Manufacturing Market: Company Share/Ranking, 2022
Figure 207 Catalent, Inc: Net Revenue, 2017-2022 (US$ Million, AGR%)
Figure 208 Catalent, Inc: Regional Market Shares, 2022
Figure 209 Emergent BioSolutions: Net Revenue, 2017-2022 (US$ Million, AGR%)
Figure 210 Emergent BioSolutions: R&D, 2017-2022 (US$ Million, AGR%)
Figure 211 Emergent BioSolutions: Regional Market Shares, 2022
Figure 212 Ajinomoto Bio-Pharma: Net Revenue, 2017-2022 (US$ Million, AGR%)
Figure 213 Ajinomoto Bio-Pharma: Regional Market Shares, 2022
Figure 214 Lonza: Net Revenue, 2017-2022 (US$ Million, AGR%)
Figure 215 Lonza: R&D, 2017-2022 (US$ Million, AGR%)
Figure 216 Lonza: Regional Market Shares, 2022
Figure 217 WuXi Biologics: Net Revenue, 2017-2022 (US$ Million, AGR%)
Figure 218 WuXi Biologics: R&D, 2017-2022 (US$ Million, AGR%)
Figure 219 WuXi Biologics: Regional Market Shares, 2022
Figure 220 FUJIFILM Holdings Corporation: Net Revenue, 2017-2022 (US$ Million, AGR%)
Figure 221 FUJIFILM Holdings Corporation: R&D, 2017-2022 (US$ Million, AGR%)
Figure 222 FUJIFILM Holdings Corporation: Regional Market Shares, 2022
Figure 223 Bavarian Nordic: Net Revenue, 2017-2022 (US$ Million, AGR%)
Figure 224 Bavarian Nordic: R&D, 2017-2022 (US$ Million, AGR%)
Figure 225 Charles River Laboratories: Net Revenue, 2017-2022 (US$ Million, AGR%)
Figure 226 Charles River Laboratories: Regional Market Shares, 2022
Figure 227 ICON plc: Net Revenue, 2017-2022 (US$ Million, AGR%)
Figure 228 ICON plc: R&D, 2017-2022 (US$ Million, AGR%)
Figure 229 ICON plc: Regional Market Shares, 2022
ページTOPに戻る
よくあるご質問
Visiongain社はどのような調査会社ですか?
英国の調査会社ヴィジョンゲイン社(Visiongain)は、通信とエネルギーのほか、自動車や化学・医薬品、金属など、広範な市場を対象に調査を行っています。自動車市場については、市場全般に関する調査のほ... もっと見る
調査レポートの納品までの日数はどの程度ですか?
在庫のあるものは速納となりますが、平均的には 3-4日と見て下さい。
但し、一部の調査レポートでは、発注を受けた段階で内容更新をして納品をする場合もあります。
発注をする前のお問合せをお願いします。
注文の手続きはどのようになっていますか?
1)お客様からの御問い合わせをいただきます。
2)見積書やサンプルの提示をいたします。
3)お客様指定、もしくは弊社の発注書をメール添付にて発送してください。
4)データリソース社からレポート発行元の調査会社へ納品手配します。
5) 調査会社からお客様へ納品されます。最近は、pdfにてのメール納品が大半です。
お支払方法の方法はどのようになっていますか?
納品と同時にデータリソース社よりお客様へ請求書(必要に応じて納品書も)を発送いたします。
お客様よりデータリソース社へ(通常は円払い)の御振り込みをお願いします。
請求書は、納品日の日付で発行しますので、翌月最終営業日までの当社指定口座への振込みをお願いします。振込み手数料は御社負担にてお願いします。
お客様の御支払い条件が60日以上の場合は御相談ください。
尚、初めてのお取引先や個人の場合、前払いをお願いすることもあります。ご了承のほど、お願いします。
データリソース社はどのような会社ですか?
当社は、世界各国の主要調査会社・レポート出版社と提携し、世界各国の市場調査レポートや技術動向レポートなどを日本国内の企業・公官庁及び教育研究機関に提供しております。
世界各国の「市場・技術・法規制などの」実情を調査・収集される時には、データリソース社にご相談ください。
お客様の御要望にあったデータや情報を抽出する為のレポート紹介や調査のアドバイスも致します。
|
|

