Vehicle to Grid(V2G)市場レポート:2023-2033
Vehicle to Grid (V2G) Market Report 2023-2033
レポート詳細
Vehicle to Grid(V2G)市場レポート 2023-2033 :本レポートは、新たな収益の柱を目指すリーディングカンパニーが、業界とその背景にあるダイナミクスをより深く理解する上で、非常に有... もっと見る
※上記価格は部署ライセンス(Departmental licence)価格です。
その他の価格についてはデータリソースまでお問合せください。
日本語のページは自動翻訳を利用し作成しています。
実際のレポートは英文のみでご納品いたします。

|

|
サマリー
レポート詳細
Vehicle to Grid(V2G)市場レポート 2023-2033:本レポートは、新たな収益の柱を目指すリーディングカンパニーが、業界とその背景にあるダイナミクスをより深く理解する上で、非常に有益なものとなるでしょう。また、異業種への進出や新地域での既存事業の拡大を目指す企業にとっても有用なレポートです。
駐車場に停めた自動車が電力を生み出す「Vehicle-to-Grid(V2G)技術」
V2Gとは、バッテリー式電気自動車(BEV)、プラグインハイブリッド車(PHEV)、水素燃料電池自動車(FCEV)などのプラグイン電気自動車(PEV)が電力系統と通信し、電力を系統に戻したり充電量を調整したりして需要応答サービスを販売する仕組みのことで、V2Gは、その代表例です。V2G蓄電機能を持つ電気自動車は、太陽光や風力などの再生可能エネルギーで発電した電力を蓄電し、天候や時間帯によって出力を変化させて放出することができます。V2Gを利用できるのは、電気プラグに接続できる車両です。バッテリー式電気自動車(BEV)とプラグインハイブリッド車からなるPEVは、一般にプラグイン電気自動車(PHEV)と呼ばれる。自動車の95%は常時駐車しているため、電気自動車のバッテリーを利用して、自動車から配電網に電気を流し、また戻すことができるかもしれません。V2Gに関連する潜在的な収入に関する評価では、政府の十分な支援を前提とした場合、1日の平均走行距離が32、64、97km(20、40、60マイル)のいずれかに応じて、自動車所有者はそれぞれ年間454、394、318ドルを得る可能性があるとされています。
北米は最大の市場シェアを持ち、予測期間中に重要な成長を遂げる。
地域別では、北米が最大の市場シェアを持ち、予測期間においても重要な成長を遂げています。市場拡大を牽引する2つの重要な要素は、新技術の早期受容と環境問題への社会的認識です。同地域では、電気自動車の普及を促進するために、政府によるインセンティブが提供されています。さらに、現地の自動車メーカーが顧客に長期保証を提供しており、これが市場の成長を支えていると予測されます。米国政府は、同国の排出量削減への長期的な取り組みの一環として、2022年に電気自動車インフラに7億5,000万ドルの投資を見込んでいます。同様に、カナダ政府もV2Gのインフラ整備に多額の投資を行っています。
マーケットリサーチレポートを購入する前に、どのような質問をすべきでしょうか?
- Vehicle to Grid(V2G)市場はどのように進化しているのか?
- Vehicle to Grid(V2G)市場の推進要因と抑制要因は何か?
- Vehicle to Grid(V2G)の各サブ市場セグメントは予測期間中にどのように成長し、2033年にこれらのサブ市場が占める売上はどの程度になるのでしょうか?
- 2023年から2033年にかけて、Vehicle to Grid(V2G)の各サブマーケットの市場シェアはどのように推移するのでしょうか?
- 2023年から2033年にかけて、市場全体の主なドライバーは何でしょうか?
- 主要なVehicle to Grid(V2G)市場はマクロ経済のダイナミクスに概ね追随するのか、それとも個々の国内市場が他を凌駕するのか?
- 2033年までに各国市場のシェアはどのように変化し、どの地域が2033年の市場をリードするのか?
- 主要プレイヤーは誰か、また予測期間中の見通しは?
- これらリーディング企業のVehicle to Grid(V2G)プロジェクトはどのようなものか?
- 2023年から2033年の間に、業界はどのように進化するのか?現在および今後10年間に行われるVehicle to Grid(V2G)プロジェクトにはどのような意味があるのだろうか?
- Vehicle to Grid (V2G)市場をさらに拡大するために、製品の商業化の必要性は高いか?
- Vehicle to Grid(V2G)市場の方向性と、市場の最前線に立つための方法とは?
- 新製品・新サービスへの最適な投資方法とは?
- 企業を新たな成長軌道に乗せ、C-suiteに移行させるための重要な展望とは?
このことが、現在、そして今後10年間のVehicle to Grid(V2G)市場にどのような影響を与えるかを知る必要があります。
- 320ページにわたる本レポートでは、167の表と162のグラフを独占的に提供します。
- このレポートでは、業界における主要な収益性の高い分野に焦点を当て、お客様が今すぐターゲットとできるような情報を提供しています。
- 世界、地域、国別の売上高と成長率を詳細に分析しています。
- 競合他社が成功した主なトレンド、変化、収益予測をハイライトしています。
本レポートは、Vehicle to Grid(V2G)市場が今後10年間にどのように発展し、COVID-19の景気後退と回復の変動に対応していくかを教えてくれます。この市場は、過去10年間のどの時点よりも今が重要なのです。
2033年までの予測やその他の分析により、商業的な展望が見えてきた
- 2033年までの収益予測に加え、直近の実績、成長率、市場シェアもご覧いただけます。
- ビジネスの展望や展開など、独自の分析もご覧いただけます。
- 定性的分析(市場ダイナミクス、ドライバー、機会、阻害要因、課題など)、コスト構造、Vehicle to Grid(V2G)価格上昇の影響、最近の開発状況などをご覧いただけます。
本レポートでは、COVID-19が業界と貴社にどのような影響を与えるかについて、データ分析と貴重な洞察を掲載しています。本レポートでは、COVID-19の4つの回収パターンとその影響、すなわち「V」、「L」、「W」、「U」について論じています。
報告書の対象セグメント
充電タイプ別市場セグメント
- 単方向充電
- 双方向充電
用途別市場セグメント
- ピーク電力販売
- 回転予備
- ベースロード電源
車両タイプ別市場セグメント
- バッテリー電気自動車(BEV)
- 燃料電池車(FCEV)
- プラグインハイブリッド車(PHEV)
- その他車両タイプ
サービス別市場セグメント
- アンシラリーサービス
- アクティブパワーサポート
- 家庭用バックアップエネルギー
- 無効電力補償
- その他サービス
ソリューション別市場セグメント
- 電気自動車供給設備(EVSE)
- 電力変換装置(PCE)
- V2Gスマートメーター
- ホームエネルギーマネジメントシステム(HEM)
- ダイナミックロードマネジメント(DLM)
- その他のソリューション
世界市場全体とセグメントの収益予測に加え、4地域と主要20カ国市場の収益予測も掲載しています。
北米
- アメリカ
- カナダ
欧州
- ドイツ
- スペイン
- イギリス
- フランス
- イタリア
- その他の地域
アジア太平洋地域
- 中国
- 日本
- インド
- オーストラリア
- 韓国
- その他のアジア太平洋地域
ラテンアメリカ
- ブラジル
- メキシコ
- その他のラテンアメリカ地域
中近東・アフリカ
- 南米
- サウジアラビア
- トルコ
- その他の中近東・アフリカ
Vehicle to Grid(V2G)市場の2023年から2033年までの主要企業のプロファイルと、これらの企業の事業のこのセグメントに焦点を当てたものも含まれています。
主要企業と市場成長の可能性
・ AC Propulsion
・ Coritech Services Inc
・ Denso Corporation
・ Endesa SA
・ EnerDel, Inc.
・ Energie Baden Wuerttemberg AG (EnBW)
・ Engie Group
・ EV Grid
・ Hitachi Ltd
・ Jedlix
・ Mitsubishi Motors Corporation
・ NextEra Energy, Inc. (NEE)
・ Nissan Motor Company Ltd
・ NRG Energy Inc
・ NUVVE LTD
・ OVO Energy Ltd.
・ PG&E Corporation
Vehicle to Grid (V2G) Market, 2023 to 2033の世界全体の収益は、金額ベースで2023年に1,158百万米ドルを超えると、我々の仕事は計算しています。2033年まで力強い収益成長が予測される。本調査では、最も大きな可能性を秘めた企業を特定しています。彼らの能力、進歩、商業的展望を発見することで、一歩先を行くことができます。
Vehicle to Grid (V2G) Market, 2023 to 2033のレポートはどのように役立つのでしょうか?
320ページに及ぶレポートでは、要約すると以下のような知識を得ることができます。
- Vehicle to Grid (V2G)市場の2033年までの収益予測、充電タイプ、サービス、ソリューション、車両タイプ、アプリケーション、企業規模の各予測を世界および地域レベルで掲載 - 投資と収益に最も有利な場所を見つけ、業界の展望を発見してください。
- 4つの地域と20の主要国市場の2033年までの収益予測 - Vehicle to Grid (V2G) Market, 2023 to 2033の北米、ヨーロッパ、アジア太平洋、LAMEAの市場予測をご覧いただけます。また、米国、カナダ、メキシコ、ブラジル、ドイツ、フランス、英国、イタリア、中国、インド、日本、オーストラリアなどの主要経済圏の市場も予測されています。
- 既存企業および市場参入を目指す企業の展望 - Vehicle to Grid (V2G) Marketに関わる主要企業15社の企業プロファイルを含む、2023年から2033年までの展望を掲載しています。
定量的・定性的な分析と独自の予測をご覧いただけます。私たちのレポートだけが持つ情報を入手し、貴重なビジネスインテリジェンスを得ることができます。
他にはない情報
私たちの新しいレポートがあれば、知識の遅れを取り戻し、チャンスを逃す可能性が低くなります。私たちの研究が貴社の調査、分析、意思決定にどのように役立つかをご覧ください。Visiongainの調査は、Vehicle to Grid (V2G) Market, 2023 to 2033の商業分析を必要とするすべての人、市場の主要企業のためのものです。データ、トレンド、予測を見つけることができます。
ページTOPに戻る
目次
目次
1.レポートの概要
1.1 研究の目的
1.2 Vehicle to Grid(V2G)とは?
1.3 本レポートの特徴
1.4 本レポートを読むべき理由
1.5 本分析レポートが回答する主な疑問点
1.6 本レポートは誰のためのものか?
1.7 方法論
1.7.1 市場の定義
1.7.2 市場評価・予測手法
1.7.3 データの検証
1.8 よくある質問と回答(FAQ)
1.9 関連するVisiongainレポート
1.10 Visiongainについて
2 エグゼクティブサマリー
3 プレミアムインサイト
3.1 地域別スナップショット世界のVehicle to Grid(V2G)事情
3.2 充電タイプセグメント市場魅力度指標
3.3 用途セグメント市場魅力度指標
3.4 車両タイプセグメント市場魅力度指標
3.5 サービスセグメント市場魅力度指標
3.6 ソリューションセグメント市場魅力度指数
4 市場の概要
4.1 主要な調査結果
4.2 マーケットダイナミクス
4.3 市場の推進要因
4.3.1 炭素排出量の削減と省エネルギー化
4.3.2 最近のV2G技術の発展
4.3.3 ピークカットなどの電気的メリット
4.3.4 アンシラリーサービスとレギュレーションサービス
4.3.5 再生可能エネルギーの統合
4.4 市場の抑制要因
4.4.1 導入の問題
4.4.2 スマートシティにおけるEVの統合を阻む障壁
4.4.3 連携のあり方。自動車メーカーとエネルギーセクターの連携が必要
4.4.4 欧州の新基準
4.5 市場の可能性
4.5.1 V2G技術・デバイスの向上
4.5.2 Vehicle-To-Grid技術は、欧州のエネルギー転換の問題を緩和する可能性がある
4.6 市場の課題
4.6.1 V2Gに立ちはだかる社会的・文化的障害
4.6.2 V2Gが直面するビジネス・産業要因
4.6.3 V2Gの普及を左右する重要な要素は、電池の効率と耐久性
4.6.4 セキュリティ脅威と認証プロトコル
4.7 COVID-19のインパクト分析
4.7.1 "V字回復"
4.7.2 "W字回復"
4.7.3 "U字回復"
4.7.4 "L字回復"
4.8 ポーターのファイブフォース分析
4.8.1 サプライヤーパワー
4.8.2 バイヤーパワー
4.8.3 競合他社の競争力
4.8.4 代替品による脅威
4.8.5 新規参入者の脅威
4.9 SWOT分析
4.10 環境要因分析
4.10.1 政治的要因
4.10.2 経済的要因
4.10.3 社会的要因
4.10.4 技術的要因
5 世界のVehicle to Grid(V2G)市場分析
5.1 主な調査結果
5.2 Vehicle to Grid(V2G)の世界市場予測
5.3 Vehicle to Grid(V2G)の世界市場:地域別
5.4 Vehicle to Grid(V2G)の世界市場:充電タイプ別
5.5 Vehicle to Grid(V2G)の世界市場:用途別
5.6 Vehicle to Grid(V2G)の世界市場:車両タイプ別
5.7 Vehicle to Grid(V2G)の世界市場:サービス別
5.8 Vehicle to Grid(V2G)の世界市場:ソリューション別
6 世界のVehicle to Grid(V2G)市場分析:充電タイプ別
6.1 セグメントの概要
6.1.1 世界のVehicle to Grid(V2G)市場:充電タイプ別
6.2 単方向充電
6.2.1 単方向充電の世界市場予測
6.2.2 単方向充電の世界市場:地域別
6.3 双方向充電
6.3.1 双方向充電の世界市場展望
6.3.2 双方向充電の世界地域別市場展望
7 世界のVehicle to Grid(V2G)市場分析:用途別
7.1 セグメントの概要
7.1.1 世界のVehicle to Grid(V2G)市場:用途別
7.2 ピークパワー売上高
7.2.1 世界のピークパワー売上高市場予測
7.2.2 ピーク電力販売の世界市場:地域別
7.3 スピニングリザーブ
7.3.1 スピニングリザーブの世界市場予測
7.3.2 スピニングリザーブの地域別世界市場
7.4 基幹電源
7.4.1 基幹電源の世界市場予測
7.4.2 基幹電源の世界地域別市場展望
8 世界のVehicle to Grid(V2G)車両タイプ別市場分析
8.1 セグメントの概要
8.1.1 世界のVehicle to Grid(V2G)市場:車両タイプ別
8.2 バッテリー電気自動車(BEV)
8.2.1 バッテリー電気自動車(BEV)の世界市場予測
8.2.2 バッテリー電気自動車(BEV)の地域別世界市場
8.3 燃料電池自動車(FCEV)
8.3.1 燃料電池車(FCEV)の世界市場展望
8.3.2 燃料電池電気自動車(FCEV)地域別世界市場予測
8.4 プラグインハイブリッド車(PHEV)
8.4.1 プラグインハイブリッド車(PHEV)の世界市場展望
8.4.2 プラグインハイブリッド電気自動車(PHEV)の世界地域別市場展望
8.5 その他の車両タイプ
8.5.1 その他車両タイプの世界市場予測
8.5.2 その他車両タイプの地域別世界市場展望
9 世界のVehicle to Grid(V2G)市場分析:サービス別
9.1 セグメントの概要
9.1.1 世界のVehicle to Grid(V2G)市場:サービス別
9.2 アンシラリサービス
9.2.1 アンシラリサービスの世界市場予測
9.2.2 アンシラリー・サービスの世界市場:地域別
9.3 アクティブパワーサポート
9.3.1 アクティブパワーサポートの世界市場予測
9.3.2 アクティブパワーサポートの世界市場:地域別
9.4 家庭用バックアップエネルギー市場
9.4.1 家庭用バックアップエネルギーの世界市場予測
9.4.2 家庭用バックアップエネルギーの世界市場:地域別
9.5 無効電力補償
9.5.1 無効電力補償の世界市場予測
9.5.2 無効電力補償の世界市場:地域別
9.6 その他サービス
9.6.1 その他サービスの世界市場予測
9.6.2 その他サービスの世界市場:地域別
10 世界のVehicle to Grid(V2G)市場分析:ソリューション別
10.1 セグメントの概要
10.1.1 世界のVehicle to Grid(V2G)市場:ソリューション別
10.2 電気自動車供給設備(EVSE)分野
10.2.1 電気自動車用供給装置(EVSE)の世界市場予測
10.2.2 電気自動車供給装置(EVSE)の世界市場:地域別
10.3 電力変換装置(PCE)
10.3.1 電力変換装置(PCE)の世界市場予測
10.3.2 電力変換装置(PCE)の世界地域別市場展望
10.4 スマートメーターの市場展望
10.4.1 V2Gスマートメーターの世界市場予測
10.4.2 V2Gスマートメーターの世界地域別市場予測
10.5 ホームエネルギーマネジメント(HEM)
10.5.1 ホームエネルギーマネジメント(HEM)システムの世界市場予測
10.5.2 ホームエネルギーマネジメント(HEM)システムの世界地域別市場予測
10.6 ダイナミックロードマネジメント
10.6.1 ダイナミックロードマネージメント(DLM)の世界市場予測
10.6.2 ダイナミックロードマネージメント(DLM)の世界市場:地域別
10.7 その他のソリューション
10.7.1 その他ソリューションの世界市場予測
10.7.2 その他ソリューションの世界市場:地域別
11 北米のVehicle to Grid(V2G)市場分析
11.1 主要な調査結果
11.1.1 カミンズ社、北米初のVehicle to Grid型スクールバスの納入で協業
11.1.2 欧州と北米では2025年までに790万台のEV充電器が接続される予定
11.2 北米のVehicle to Grid(V2G)市場(金額別)
11.3 北米のVehicle to Grid(V2G)国別市場
11.4 北米のVehicle to Grid(V2G)市場:充電タイプ別
11.5 北米のVehicle to Grid(V2G)市場:用途別
11.6 北米のVehicle to Grid(V2G)市場:車両タイプ別
11.7 北米のVehicle to Grid(V2G)市場:サービス別
11.8 北米のVehicle to Grid(V2G)市場:ソリューション別
11.9 米国市場分析
11.9.1 米国中西部で初のVehicle to Grid充電の試験運用が開始される
11.9.2 カリフォルニア州、送電網の安定化のために電気自動車のV2G充電技術を検討
11.9.3 米国のVehicle to Grid(V2G)市場(金額別)
11.10 カナダ市場分析
11.10.1 カナダ、ノバスコシア州の電気自動車グリッド統合パイロットプロジェクトに投資
11.10.2 カナダ政府による充電インフラへの資金提供
11.10.3 カナダのVehicle to Grid(V2G)市場(金額別)
12 欧州のVehicle to Grid(V2G)市場分析
12.1 主要な調査結果
12.1.1 欧米における新たな車両-グリッド間統合技術の選択肢
12.1.2 電気自動車の台頭により、グリッドインテグレーションの必要性が高まる
12.2 欧州のVehicle to Grid(V2G)市場(金額別)
12.3 欧州のVehicle to Grid(V2G)国別市場
12.4 欧州のVehicle to Grid(V2G)市場:充電タイプ別
12.5 欧州のVehicle to Grid(V2G)市場:用途別
12.6 欧州Vehicle to Grid(V2G)市場:車両タイプ別
12.7 欧州Vehicle to Grid(V2G)市場:サービス別
12.8 欧州Vehicle to Grid(V2G)市場:ソリューション別
12.9 ドイツの市場分析
12.9.1 エレクトロモビリティがドイツの電力網に与える影響
12.9.2 日産リーフがドイツでVehicle to Gridの認可を取得
12.9.3 ドイツのVehicle to Grid(V2G)市場(金額別)
12.10 英国市場分析
12.10.1 英国のエネルギー規制当局がVehicle to Gridの提案をサポート
12.10.2 英国の電力ネットワーク・オペレーターがVehicle to Gridのトライアルを開始
12.10.3 英国のVehicle to Grid(V2G)市場(金額別)
12.11 フランス市場分析
12.11.1 フランスはABBのVehicle to Gridソリューションの欧州展開を開始する
12.11.2 ABB、フランスのDREEVに11KWの新V2G充電技術を提供
12.11.3 フランスのVehicle to Grid(V2G)市場(金額別)
12.12 イタリア市場分析
12.12.1 イタリア・トリノでVehicle to Gridのパイロット・プロジェクトが始動
12.12.2 閉鎖後のイタリアで世界最大のVehicle to Grid充電プロジェクトが始動
12.12.3 イタリアのVehicle to Grid(V2G)市場(金額別)
12.13 スペイン市場分析
12.13.1 スペインのEV充電グリッド拡大のためのターボチャージャー
12.13.2 スペインのREEとIbilがEV急速充電プロジェクトで協業
12.13.3 スペインのVehicle to Grid(V2G)市場(金額別)
12.14 その他の欧州市場の分析
12.14.1 欧州のVehicle to Grid(V2G)市場(金額別)
13 アジア太平洋地域のVehicle to Grid(V2G)市場分析
13.1 主要な調査結果
13.1.1 アジア太平洋地域のスマートグリッドネットワークの需要が市場を牽引する
13.1.2 アジア太平洋地域の国々が証明するテーラーメイドのE-モビリティ・ソリューションの必要性
13.1.3 アジア太平洋地域は高性能電気自動車が市場を牽引する
13.2 アジア太平洋地域のVehicle to Grid(V2G)市場(金額別)
13.3 アジア太平洋地域のVehicle to Grid(V2G)国別市場
13.4 アジア太平洋地域のVehicle to Grid(V2G)市場:充電タイプ別
13.5 アジア太平洋地域のVehicle to Grid(V2G)市場:用途別
13.6 アジア太平洋地域のVehicle to Grid(V2G)市場:車両タイプ別
13.7 アジア太平洋地域のVehicle to Grid(V2G)市場:サービス別
13.8 アジア太平洋地域のVehicle to Grid(V2G)市場:ソリューション別
13.9 中国市場の分析
13.9.1 EV充電が中国の電力網を浄化する方法
13.9.2 スマートグリッド市場における中国の優位性
13.9.3 中国のVehicle to Grid(V2G)市場(金額別)
13.10 インド市場の分析
13.10.1 インドの電気自動車の障壁と課題、Vehicle to Gridの最適化
13.10.2 インドの電気自動車普及の原動力となる充電技術
13.10.3 インドのVehicle to Grid(V2G)市場(金額別)
13.11 日本市場の分析
13.11.1 日本のVehicle to Gridの将来計画
13.11.2 Nuvve CorporationのVehicle-to-Grid(V2G)プラットフォームが日本のグリッドサービス提供プロジェクトの新フェーズを可能にする
13.11.3 日本のVehicle to Grid(V2G)市場(金額別)
13.12 韓国市場分析
13.12.1 現代自動車グループ、済州島で新型EVを用いたビークル・トゥ・グリッドの実証実験へ
13.12.2 韓国電力公社、電気自動車向けマルチビークル充電グリッドの開発を完了
13.12.3 韓国のVehicle to Grid(V2G)市場(金額別)
13.13 オーストラリア市場分析
13.13.1 キャンベラ・プロジェクトがオーストラリアのビークル・トゥ・グリッドの準備態勢をレヴュー
13.13.2 Sunverge、Simply Energy、日産オーストラリア、Wallboxと電気自動車-家庭間および電気自動車-グリッド間のサービス提供のための戦略的パートナーシップを発表
13.14 その他のアジア太平洋地域の市場分析
13.14.1 残りのアジア太平洋地域のVehicle to Grid(V2G)市場(金額別)
14 中東・アフリカのVehicle to Grid(V2G)市場分析
14.1 主要な調査結果
14.1.1 電気自動車はMENAのエネルギーと交通セクターのゲームチェンジャーである
14.1.2 シーメンス、UAEにEV充電コリドーを建設
14.2 中東・アフリカのVehicle to Grid(V2G)市場(金額別)
14.3 中東・アフリカのVehicle to Grid(V2G)国別市場
14.4 中東・アフリカのVehicle to Grid(V2G)市場:充電タイプ別
14.5 中東・アフリカのVehicle to Grid(V2G)市場:用途別
14.6 中東・アフリカのVehicle to Grid(V2G)市場:車両タイプ別
14.7 中東・アフリカのVehicle to Grid(V2G)市場:サービス別
14.8 中東・アフリカVehicle to Grid(V2G)市場:ソリューション別
14.9 南アフリカの市場分析
14.9.1 日産自動車と国連がアフリカで「Vehicle To Grid」プロジェクトを開始
14.9.2 EVの未来に向けたアフリカの険しい道のり
14.9.3 南アフリカのVehicle to Grid(V2G)市場(金額別)
14.10 サウジアラビアの市場分析
14.10.1 ファーウェイがサウジアラビアの1300mwh蓄電池プロジェクトを受注
14.10.2 サウジアラビアにおける電気自動車の普及と炭素排出量
14.10.3 サウジアラビアのVehicle to Grid(V2G)場(金額別)
14.11 トルコの市場分析
14.11.1 トルコのTOGGは電気自動車の国内需要を押し上げる
14.11.2 トルコの配電網に電気自動車を組み込む
14.11.3 トルコのVehicle to Grid(V2G)市場(金額別)
14.12 その他の中東・アフリカ地域の市場分析
14.12.1 UAEで潜在力を発揮する電気自動車
14.12.2 その他の中東・アフリカ地域のVehicle to Grid(V2G)市場(金額別)
15 ラテンアメリカのVehicle to Grid(V2G)市場分析
15.1 主要な調査結果
15.2 ラテンアメリカのエネルギープロバイダーが500基のEV充電ステーションを展開
15.3 日産リーフがラテンアメリカ初のV2Gシステムで重要な役割を果たす
15.4 ラテンアメリカのVehicle to Grid(V2G)市場(金額別)
15.5 ラテンアメリカのVehicle to Grid(V2G)国別市場
15.6 ラテンアメリカのVehicle to Grid(V2G)市場:充電タイプ別
15.7 ラテンアメリカのVehicle to Grid(V2G)市場:用途別
15.8 ラテンアメリカのVehicle to Grid(V2G)市場:車両タイプ別
15.9 ラテンアメリカのVehicle to Grid(V2G)市場:サービス別
15.10 ラテンアメリカのVehicle to Grid(V2G)市場:ソリューション別
15.11 ブラジルの市場分析
15.11.1 ブラジルのスマートグリッド普及の追い風に
15.11.2 Neoenergiaがブラジル北東部で電気自動車用コリドーを開始
15.11.3 ブラジルのVehicle to Grid(V2G)市場(金額別)
15.12 メキシコ市場分析
15.12.1 メキシコでは電気自動車の生産を支える再生可能エネルギーベースのインフラが必要
15.12.2 GM、メキシコ工場に10億ドルの電気自動車計画を立てるが、UAWは反旗を翻す
15.12.3 メキシコのVehicle to Grid(V2G)市場(金額別)
15.13 その他のラテンアメリカ地域の市場分析
15.13.1 その他のラテンアメリカのVehicle to Grid(V2G)市場(金額別)
16 主要企業のプロフィール
16.1 EnBW社
16.1.1 会社概要
16.1.2 会社概要
16.1.3 製品ベンチマーク
16.1.4 戦略的展望
16.2 エンデサ
16.2.1 企業スナップショット
16.2.2 会社概要
16.2.3 戦略的展望
16.3 ネクステラ・エナジー
16.3.1 会社概要
16.3.2 会社概要
16.3.3 財務分析
16.3.4 製品ベンチマーク
16.3.5 戦略的展望
16.4 PG&E社
16.4.1 会社概要
16.4.2 会社概要
16.4.3 財務分析
16.4.4 製品ベンチマーク
16.4.5 戦略的展望
16.5 Nuvve
16.5.1 企業スナップショット
16.5.2 会社概要
16.5.3 製品ベンチマーク
16.5.4 戦略的展望
16.6 ACプロパルジョン社
16.6.1 企業スナップショット
16.6.2 会社概要
16.6.3 ベンチマーキング
16.7 株式会社デンソー
16.7.1 企業スナップショット
16.7.2 会社概要
16.7.3 財務分析
16.7.4 ベンチマーキング
16.7.5 戦略的展望
16.8 エナーデル
16.8.1 企業スナップショット
16.8.2 会社概要
16.8.3 ベンチマーキング
16.8.4 戦略的展望
16.9 コリテックサービス
16.9.1 企業スナップショット
16.9.2 会社概要
16.9.3 ベンチマーキング
16.10 エンギーグループ
16.10.1 企業スナップショット
16.10.2 会社概要
16.10.3 財務分析
16.10.4 戦略的展望
16.11 EV Grid
16.11.1 企業スナップショット
16.11.2 会社概要
16.12 日立製作所
16.12.1 会社概要
16.12.2 会社概要
16.12.3 財務分析
16.12.4 製品ベンチマーク
16.12.5 戦略的展望
16.13 日産自動車株式会社
16.13.1 企業スナップショット
16.13.2 会社概要
16.13.3 財務分析
16.13.4 製品ベンチマーク
16.13.5 戦略的な展望
16.14 NRGエナジー社
16.14.1 企業スナップショット
16.14.2 会社概要
16.14.3 財務分析
16.14.4 戦略的展望
16.15 OVOエナジー社
16.15.1 企業スナップショット
16.15.2 会社概要
16.15.3 製品ベンチマーク
16.15.4 戦略的展望
16.16 三菱自動車工業株式会社
16.16.1 企業スナップショット
16.16.2 会社概要
16.16.3 財務分析
16.16.4 製品ベンチマーク
16.16.5 戦略的展望
16.17 コリネックス
16.17.1 企業スナップショット
16.17.2 会社概要
16.17.3 ベンチマーキング
16.17.4 戦略的展望
16.18 コリテック
16.18.1 企業スナップショット
16.18.2 会社概要
16.18.3 ベンチマーキング
16.19 ジェドリックス
16.19.1 企業スナップショット
16.19.2 会社概要
16.19.3 製品ベンチマーク
16.19.4 戦略的展望
17 結論と提言
17.1 V2Gは、電気自動車の実用性を高め、電気自動車へのシフトを加速させる有望な技術です
18 用語集
表の一覧
Table 1 Global Vehicle to Grid (V2G) Market Snapshot, 2022 & 2033 (US$ million, CAGR %)
Table 2 Global Vehicle to Grid (V2G) Market Forecast, 2023-2033 (US$ Mn, AGR (%), CAGR (%)) (V-Shaped Recovery Scenario)
Table 3 Global Vehicle to Grid (V2G) Market by Region, 2023-2033 (US$ Mn, AGR (%), CAGR (%)) (V-Shaped Recovery Scenario)
Table 4 Global Vehicle to Grid (V2G) Market Forecast, 2023-2033 (US$ Mn, AGR (%), CAGR (%)) (W-Shaped Recovery Scenario)
Table 5 Global Vehicle to Grid (V2G) Market by Region, 2023-2033 (US$ Mn, AGR (%), CAGR (%)) (W-Shaped Recovery Scenario)
Table 6 Global Vehicle to Grid (V2G) Market Forecast, 2023-2033 (US$ Mn, AGR (%), CAGR (%)) (U-Shaped Recovery Scenario)
Table 7 Global Vehicle to Grid (V2G) Market by Region, 2023-2033 (US$ Mn, AGR (%), CAGR (%)) (U-Shaped Recovery Scenario)
Table 8 Global Vehicle to Grid (V2G) Market Forecast, 2023-2033 (US$ Mn, AGR (%), CAGR (%)) (L-Shaped Recovery Scenario)
Table 9 Global Vehicle to Grid (V2G) Market by Region, 2023-2033 (US$ Mn, AGR (%), CAGR (%)) (L-Shaped Recovery Scenario)
Table 10 Global Vehicle to Grid (V2G) Market SWOT Analysis 2023-2033
Table 11 Global Vehicle to Grid (V2G) Market Forecast, 2023-2033 (US$ Mn, AGR (%), CAGR (%))
Table 12 Global Vehicle to Grid (V2G) Market by Region, 2023-2033 (US$ Mn, AGR (%), CAGR (%))
Table 13 Global Vehicle to Grid (V2G) Market by Charging Type, 2023-2033 (US$ Mn, AGR (%), CAGR (%))
Table 14 Global Vehicle to Grid (V2G) Market by Application, 2023-2033 (US$ Mn, AGR (%), CAGR (%))
Table 15 Global Vehicle to Grid (V2G) Market by Vehicle Type, 2023-2033 (US$ Mn, AGR (%), CAGR (%))
Table 16 Global Vehicle to Grid (V2G) Market by Service, 2023-2033 (US$ Mn, AGR (%), CAGR (%))
Table 17 Global Vehicle to Grid (V2G) Market by Solution, 2023-2033 (US$ Mn, AGR (%), CAGR (%))
Table 18 Global Vehicle to Grid (V2G) Market by Charging Type, 2023-2033 (US$ Mn, AGR (%), CAGR (%))
Table 19 Global Unidirectional Charging Market Forecast, 2023-2033 (US$ Mn, AGR (%), CAGR (%))
Table 20 Global Unidirectional Charging Market by Region, 2023-2033 (US$ Mn, AGR (%), CAGR (%))
Table 21 Global Bidirectional Charging Market Forecast, 2023-2033 (US$ Mn, AGR (%), CAGR (%))
Table 22 Global Bidirectional Charging Market by Region, 2023-2033 (US$ Mn, AGR (%), CAGR (%))
Table 23 Global Vehicle to Grid (V2G) Market by Application, 2023-2033 (US$ Mn, AGR (%), CAGR (%))
Table 24 Global Peak Power Sales Market Forecast, 2023-2033 (US$ Mn, AGR (%), CAGR (%))
Table 25 Global Peak Power Sales Market by Region, 2023-2033 (US$ Mn, AGR (%), CAGR (%))
Table 26 Global Spinning Reserves Market Forecast, 2023-2033 (US$ Mn, AGR (%), CAGR (%))
Table 27 Global Spinning Reserves Market by Region, 2023-2033 (US$ Mn, AGR (%), CAGR (%))
Table 28 Global Base Load Power Market Forecast, 2023-2033 (US$ Mn, AGR (%), CAGR (%))
Table 29 Global Base Load Power Market by Region, 2023-2033 (US$ Mn, AGR (%), CAGR (%))
Table 30 Global Vehicle to Grid (V2G) Market by Vehicle Type, 2023-2033 (US$ Mn, AGR (%), CAGR (%))
Table 31 Global Battery Electric Vehicle (BEV) Market Forecast, 2023-2033 (US$ Mn, AGR (%), CAGR (%))
Table 32 Global Battery Electric Vehicle (BEV) Market by Region, 2023-2033 (US$ Mn, AGR (%), CAGR (%))
Table 33 Global Fuel Cell Electric Vehicle (FCEV) Market Forecast, 2023-2033 (US$ Mn, AGR (%), CAGR (%))
Table 34 Global Fuel Cell Electric Vehicle (FCEV) Market by Region, 2023-2033 (US$ Mn, AGR (%), CAGR (%))
Table 35 Global Plug-In Hybrid Electric Vehicle (PHEV) Market Forecast, 2023-2033 (US$ Mn, AGR (%), CAGR (%))
Table 36 Global Plug-In Hybrid Electric Vehicle (PHEV) Market by Region, 2023-2033 (US$ Mn, AGR (%), CAGR (%))
Table 37 Global Other Vehicle Type Market Forecast, 2023-2033 (US$ Mn, AGR (%), CAGR (%))
Table 38 Global Other Vehicle Type Market by Region, 2023-2033 (US$ Mn, AGR (%), CAGR (%))
Table 39 Global Vehicle to Grid (V2G) Market by Service, 2023-2033 (US$ Mn, AGR (%), CAGR (%))
Table 40 Global Ancillary Services Market Forecast, 2023-2033 (US$ Mn, AGR (%), CAGR (%))
Table 41 Global Ancillary Services Market by Region, 2023-2033 (US$ Mn, AGR (%), CAGR (%))
Table 42 Global Active Power Support Market Forecast, 2023-2033 (US$ Mn, AGR (%), CAGR (%))
Table 43 Global Active Power Support Market by Region, 2023-2033 (US$ Mn, AGR (%), CAGR (%))
Table 44 Global Backup Energy for Home Market Forecast, 2023-2033 (US$ Mn, AGR (%), CAGR (%))
Table 45 Global Backup Energy for Home Market by Region, 2023-2033 (US$ Mn, AGR (%), CAGR (%))
Table 46 Global Reactive Power Compensation Market Forecast, 2023-2033 (US$ Mn, AGR (%), CAGR (%))
Table 47 Global Reactive Power Compensation Market by Region, 2023-2033 (US$ Mn, AGR (%), CAGR (%))
Table 48 Global Other Services Market Forecast, 2023-2033 (US$ Mn, AGR (%), CAGR (%))
Table 49 Global Other Services Market by Region, 2023-2033 (US$ Mn, AGR (%), CAGR (%))
Table 50 Global Vehicle to Grid (V2G) Market by Solution, 2023-2033 (US$ Mn, AGR (%), CAGR (%))
Table 51 Global Electric Vehicle Supply Equipment (EVSE) Market Forecast, 2023-2033 (US$ Mn, AGR (%), CAGR (%))
Table 52 Global Electric Vehicle Supply Equipment (EVSE) Market by Region, 2023-2033 (US$ Mn, AGR (%), CAGR (%))
Table 53 Global Power Conversion Equipment (PCE) Market Forecast, 2023-2033 (US$ Mn, AGR (%), CAGR (%))
Table 54 Global Power Conversion Equipment (PCE) Market by Region, 2023-2033 (US$ Mn, AGR (%), CAGR (%))
Table 55 Global V2G Smart Meters Market Forecast, 2023-2033 (US$ Mn, AGR (%), CAGR (%))
Table 56 Global V2G Smart Meters Market by Region, 2023-2033 (US$ Mn, AGR (%), CAGR (%))
Table 57 Global Home Energy Management (HEM) Systems Market Forecast, 2023-2033 (US$ Mn, AGR (%), CAGR (%))
Table 58 Global Home Energy Management (HEM) Systems Market by Region, 2023-2033 (US$ Mn, AGR (%), CAGR (%))
Table 59 Global Dynamic Load Management (DLM) Market Forecast, 2023-2033 (US$ Mn, AGR (%), CAGR (%))
Table 60 Global Dynamic Load Management (DLM) Market by Region, 2023-2033 (US$ Mn, AGR (%), CAGR (%))
Table 61 Global Other Solutions Market Forecast, 2023-2033 (US$ Mn, AGR (%), CAGR (%))
Table 62 Global Other Solutions Market by Region, 2023-2033 (US$ Mn, AGR (%), CAGR (%))
Table 63 North America Vehicle to Grid (V2G) Market by Value, 2023-2033 (US$ Mn, AGR (%), CAGR (%))
Table 64 North America Vehicle to Grid (V2G) Market by Country, 2023-2033 (US$ Mn, AGR (%), CAGR (%))
Table 65 North America Vehicle to Grid (V2G) Market by Charging Type, 2023-2033 (US$ Mn, AGR (%), CAGR (%))
Table 66 North America Vehicle to Grid (V2G) Market by Application, 2023-2033 (US$ Mn, AGR (%), CAGR (%))
Table 67 North America Vehicle to Grid (V2G) Market by Vehicle Type, 2023-2033 (US$ Mn, AGR (%), CAGR (%))
Table 68 North America Vehicle to Grid (V2G) Market by Service, 2023-2033 (US$ Mn, AGR (%), CAGR (%))
Table 69 North America Vehicle to Grid (V2G) Market by Solution, 2023-2033 (US$ Mn, AGR (%), CAGR (%))
Table 70 US Vehicle to Grid (V2G) Market by Value, 2023-2033 (US$ Mn, AGR (%), CAGR (%))
Table 71 Canada Vehicle to Grid (V2G) Market by Value, 2023-2033 (US$ Mn, AGR (%), CAGR (%))
Table 72 Europe Vehicle to Grid (V2G) Market by Value, 2023-2033 (US$ Mn, AGR (%), CAGR (%))
Table 73 Europe Vehicle to Grid (V2G) Market by Country, 2023-2033 (US$ Mn, AGR (%), CAGR (%))
Table 74 Europe Vehicle to Grid (V2G) Market by Charging Type, 2023-2033 (US$ Mn, AGR (%), CAGR (%))
Table 75 Europe Vehicle to Grid (V2G) Market by Application, 2023-2033 (US$ Mn, AGR (%), CAGR (%))
Table 76 Europe Vehicle to Grid (V2G) Market by Vehicle Type, 2023-2033 (US$ Mn, AGR (%), CAGR (%))
Table 77 Europe Vehicle to Grid (V2G) Market by Service, 2023-2033 (US$ Mn, AGR (%), CAGR (%))
Table 78 Europe Vehicle to Grid (V2G) Market by Solution, 2023-2033 (US$ Mn, AGR (%), CAGR (%))
Table 79 Germany Vehicle to Grid (V2G) Market by Value, 2023-2033 (US$ Mn, AGR (%), CAGR (%))
Table 80 UK Vehicle to Grid (V2G) Market by Value, 2023-2033 (US$ Mn, AGR (%), CAGR (%))
Table 81 France Vehicle to Grid (V2G) Market by Value, 2023-2033 (US$ Mn, AGR (%), CAGR (%))
Table 82 Italy Vehicle to Grid (V2G) Market by Value, 2023-2033 (US$ Mn, AGR (%), CAGR (%))
Table 83 Spain Vehicle to Grid (V2G) Market by Value, 2023-2033 (US$ Mn, AGR (%), CAGR (%))
Table 84 Rest of Europe Vehicle to Grid (V2G) Market by Value, 2023-2033 (US$ Mn, AGR (%), CAGR (%))
Table 85 Asia-Pacific Vehicle to Grid (V2G) Market by Value, 2023-2033 (US$ Mn, AGR (%), CAGR (%))
Table 86 Asia-Pacific Vehicle to Grid (V2G) Market by Country, 2023-2033 (US$ Mn, AGR (%), CAGR (%))
Table 87 Asia-Pacific Vehicle to Grid (V2G) Market by Charging Type, 2023-2033 (US$ Mn, AGR (%), CAGR (%))
Table 88 Asia-Pacific Vehicle to Grid (V2G) Market by Application, 2023-2033 (US$ Mn, AGR (%), CAGR (%))
Table 89 Asia-Pacific Vehicle to Grid (V2G) Market by Vehicle Type, 2023-2033 (US$ Mn, AGR (%), CAGR (%))
Table 90 Asia-Pacific Vehicle to Grid (V2G) Market by Service, 2023-2033 (US$ Mn, AGR (%), CAGR (%))
Table 91 Asia-Pacific Vehicle to Grid (V2G) Market by Solution, 2023-2033 (US$ Mn, AGR (%), CAGR (%))
Table 92 China Vehicle to Grid (V2G) Market by Value, 2023-2033 (US$ Mn, AGR (%), CAGR (%))
Table 93 India Vehicle to Grid (V2G) Market by Value, 2023-2033 (US$ Mn, AGR (%), CAGR (%))
Table 94 Japan Vehicle to Grid (V2G) Market by Value, 2023-2033 (US$ Mn, AGR (%), CAGR (%))
Table 95 South Korea Vehicle to Grid (V2G) Market by Value, 2023-2033 (US$ Mn, AGR (%), CAGR (%))
Table 96 Australia Vehicle to Grid (V2G) Market by Value, 2023-2033 (US$ Mn, AGR (%), CAGR (%))
Table 97 Rest of Asia-Pacific Vehicle to Grid (V2G) Market by Value, 2023-2033 (US$ Mn, AGR (%), CAGR (%))
Table 98 Middle East & Africa Vehicle to Grid (V2G) Market by Value, 2023-2033 (US$ Mn, AGR (%), CAGR (%))
Table 99 Middle East & Africa Vehicle to Grid (V2G) Market by Country, 2023-2033 (US$ Mn, AGR (%), CAGR (%))
Table 100 Middle East & Africa Vehicle to Grid (V2G) Market by Charging Type, 2023-2033 (US$ Mn, AGR (%), CAGR (%))
Table 101 Middle East & Africa Vehicle to Grid (V2G) Market by Application, 2023-2033 (US$ Mn, AGR (%), CAGR (%))
Table 102 Middle East & Africa Vehicle to Grid (V2G) Market by Vehicle Type, 2023-2033 (US$ Mn, AGR (%), CAGR (%))
Table 103 Middle East & Africa Vehicle to Grid (V2G) Market by Service, 2023-2033 (US$ Mn, AGR (%), CAGR (%))
Table 104 Middle East & Africa Vehicle to Grid (V2G) Market by Solution, 2023-2033 (US$ Mn, AGR (%), CAGR (%))
Table 105 South Africa Vehicle to Grid (V2G) Market by Value, 2023-2033 (US$ Mn, AGR (%), CAGR (%))
Table 106 Saudi Arabia Vehicle to Grid (V2G) Market by Value, 2023-2033 (US$ Mn, AGR (%), CAGR (%))
Table 107 Turkey Vehicle to Grid (V2G) Market by Value, 2023-2033 (US$ Mn, AGR (%), CAGR (%))
Table 108 Rest of Middle East & Africa Vehicle to Grid (V2G) Market by Value, 2023-2033 (US$ Mn, AGR (%), CAGR (%))
Table 109 Latin America Vehicle to Grid (V2G) Market by Value, 2023-2033 (US$ Mn, AGR (%), CAGR (%))
Table 110 Latin America Vehicle to Grid (V2G) Market by Country, 2023-2033 (US$ Mn, AGR (%), CAGR (%))
Table 111 Latin America Vehicle to Grid (V2G) Market by Charging Type, 2023-2033 (US$ Mn, AGR (%), CAGR (%))
Table 112 Latin America Vehicle to Grid (V2G) Market by Application, 2023-2033 (US$ Mn, AGR (%), CAGR (%))
Table 113 Latin America Vehicle to Grid (V2G) Market by Vehicle Type, 2023-2033 (US$ Mn, AGR (%), CAGR(%))
Table 114 Latin America Vehicle to Grid (V2G) Market by Service, 2023-2033 (US$ Mn, AGR (%), CAGR(%))
Table 115 Latin America Vehicle to Grid (V2G) Market by Solution, 2023-2033 (US$ Mn, AGR (%), CAGR(%))
Table 116 Brazil Vehicle to Grid (V2G) Market by Value, 2023-2033 (US$ Mn, AGR (%), CAGR (%))
Table 117 Mexico Vehicle to Grid (V2G) Market by Value, 2023-2033 (US$ Mn, AGR (%), CAGR (%))
Table 118 Rest of Latin America Vehicle to Grid (V2G) Market by Value, 2023-2033 (US$ Mn, AGR (%), CAGR (%))
Table 119 EnBW: Key Details, (CEO, HQ, Revenue, Founded, No. of Employees, Company Type, Website, Business Segment)
Table 120 EnBW: Product Benchmarking
Table 121 EnBW: Strategic Outlook
Table 122 Endesa: Key Details, (CEO, HQ, Revenue, Founded, No. of Employees, Company Type, Website, Business Segment)
Table 123 Endesa: Strategic Outlook
Table 124 NextEra Energy: Key Details, (CEO, HQ, Revenue, Founded, No. of Employees, Company Type, Website, Business Segment)
Table 125 NextEra Energy: Product Benchmarking
Table 126 NextEra Energy: Strategic Outlook
Table 127 PG&E: Key Details, (CEO, HQ, Revenue, Founded, No. of Employees, Company Type, Website, Business Segment)
Table 128 PG&E: Product Benchmarking
Table 129 PG&E: Strategic Outlook
Table 130 Nuvve: Key Details, (CEO, HQ, Revenue, Founded, No. of Employees, Company Type, Website, Business Segment)
Table 131 Nuvve: Product Benchmarking
Table 132 Nuvve: Strategic Outlook
Table 133 AC Propulsion Inc: Key Details, (CEO, HQ, Revenue, Founded, No. of Employees, Company Type, Website, Business Segment)
Table 134 AC Propulsion Inc: Product Benchmarking
Table 135 Denso Corporation: Key Details, (CEO, HQ, Revenue, Founded, No. of Employees, Company Type, Website, Business Segment)
Table 136 Denso Corporation: Product Benchmarking
Table 137 Denso Corporation: Strategic Outlook
Table 138 Enerdel: Key Details, (CEO, HQ, Revenue, Founded, No. of Employees, Company Type, Website, Business Segment)
Table 139 Enerdel:: Product Benchmarking
Table 140 Enerdel:: Strategic Outlook
Table 141 Coritech Services Inc: Key Details, (CEO, HQ, Revenue, Founded, No. of Employees, Company Type, Website, Business Segment)
Table 142 Coritech Services Inc: Product Benchmarking
Table 143 Engie Group: Key Details, (CEO, HQ, Revenue, Founded, No. of Employees, Company Type, Website, Business Segment)
Table 144 Engie Group: Strategic Outlook
Table 145 EV Grid: Key Details, (CEO, HQ, Revenue, Founded, No. of Employees, Company Type, Website, Business Segment)
Table 146 Hitachi Ltd: Key Details, (CEO, HQ, Revenue, Founded, No. of Employees, Company Type, Website, Business Segment)
Table 147 Hitachi Ltd: Product Benchmarking
Table 148 Hitachi Ltd: Strategic Outlook
Table 149 Nissan Motor Company Ltd: Key Details, (CEO, HQ, Revenue, Founded, No. of Employees, Company Type, Website, Business Segment)
Table 150 Nissan Motor Company Ltd: Product Benchmarking
Table 151 Nissan Motor Company Ltd: Strategic Outlook
Table 152 NRG Energy Inc: Key Details, (CEO, HQ, Revenue, Founded, No. of Employees, Company Type, Website, Business Segment)
Table 153 NRG Energy Inc: Strategic Outlook
Table 154 OVO Energy Ltd: Key Details, (CEO, HQ, Revenue, Founded, No. of Employees, Company Type, Website, Business Segment)
Table 155 OVO Energy Ltd: Product Benchmarking
Table 156 OVO Energy Ltd: Strategic Outlook
Table 157 Mitsubishi Motors Corporation: Key Details, (CEO, HQ, Revenue, Founded, No. of Employees, Company Type, Website, Business Segment)
Table 158 Mitsubishi Motors Corporation: Product Benchmarking
Table 159 Mitsubishi Motors Corporation: Strategic Outlook
Table 160 Corinex:: Key Details, (CEO, HQ, Revenue, Founded, No. of Employees, Company Type, Website, Business Segment)
Table 161 Corinex:: Product Benchmarking
Table 162 Corinex:: Strategic Outlook
Table 163 Coritech: Key Details, (CEO, HQ, Revenue, Founded, No. of Employees, Company Type, Website, Business Segment)
Table 164 Coritech: Product Benchmarking
Table 165 Jedlix: Key Details, (CEO, HQ, Revenue, Founded, No. of Employees, Company Type, Website, Business Segment)
Table 166 Jedlix: Product Benchmarking
Table 167 Jedlix: Strategic Outlook
図の一覧
Figure 1 Global Vehicle-to-Grid (V2G) Segmentation
Figure 2 Breakdown of Primary Interviews by Company Type, Designation, & Region
Figure 3 Global Vehicle-to-Grid (V2G) Forecast by Region: Market Attractiveness Index
Figure 4 Global Vehicle-to-Grid (V2G) by Charging Type: Market Attractiveness Index
Figure 5 Global Vehicle-to-Grid (V2G) by Application: Market Attractiveness Index
Figure 6 Global Vehicle-to-Grid (V2G) by Vehicle Type: Market Attractiveness Index
Figure 7 Global Vehicle-to-Grid (V2G) by Service: Market Attractiveness Index
Figure 8 Global Vehicle-to-Grid (V2G) by Solutions: Market Attractiveness Index
Figure 9 Global Vehicle-to-Grid (V2G): Market Dynamics
Figure 10 Global Vehicle to Grid (V2G) Market Forecast, 2023-2033 (US$ Mn, AGR (%)) (V-Shaped Recovery Scenario)
Figure 11 Global Vehicle to Grid (V2G) Market by Region, 2023-2033 (US$ Mn, AGR (%)) (V-Shaped Recovery Scenario)
Figure 12 Global Vehicle to Grid (V2G) Market Forecast, 2023-2033 (US$ Mn, AGR (%)) (W-Shaped Recovery Scenario)
Figure 13 Global Vehicle to Grid (V2G) Market by Region, 2023-2033 (US$ Mn, AGR (%)) (W-Shaped Recovery Scenario)
Figure 14 Global Vehicle to Grid (V2G) Market Forecast, 2023-2033 (US$ Mn, AGR (%)) (U-Shaped Recovery Scenario)
Figure 15 Global Vehicle to Grid (V2G) Market by Region, 2023-2033 (US$ Mn, AGR (%)) (U-Shaped Recovery Scenario)
Figure 16 Global Vehicle to Grid (V2G) Market Forecast, 2023-2033 (US$ Mn, AGR (%)) (L-Shaped Recovery Scenario)
Figure 17 Global Vehicle to Grid (V2G) Market by Region, 2023-2033 (US$ Mn, AGR (%)) (L-Shaped Recovery Scenario)
Figure 18 Global Vehicle-to-Grid (V2G): Porter’s Five Forces Analysis
Figure 19 Global Vehicle to Grid (V2G) Market Forecast, 2023-2033 (US$ Mn, AGR (%))
Figure 20 Global Vehicle to Grid (V2G) Market by Region, 2023-2033 (US$ Mn, AGR (%))
Figure 21 Global Vehicle to Grid (V2G) Market by Charging Type, 2023-2033 (US$ Mn, AGR (%))
Figure 22 Global Vehicle to Grid (V2G) Market by Application, 2023-2033 (US$ Mn, AGR (%))
Figure 23 Global Vehicle to Grid (V2G) Market by Vehicle Type, 2023-2033 (US$ Mn, AGR (%))
Figure 24 Global Vehicle to Grid (V2G) Market by Service, 2023-2033 (US$ Mn, AGR (%))
Figure 25 Global Vehicle to Grid (V2G) Market by Solution, 2023-2033 (US$ Mn, AGR (%))
Figure 26 Global Vehicle to Grid (V2G) Market Share Forecast by Charging Type 2023, 2028, 2033 (%)
Figure 27 Global Vehicle to Grid (V2G) Market by Charging Type, 2023-2033 (US$ Mn, AGR (%))
Figure 28 Global Unidirectional Charging Market Forecast, 2023-2033 (US$ Mn, AGR (%))
Figure 29 Global Unidirectional Charging Market by Region, 2023-2033 (US$ Mn, AGR (%))
Figure 30 Global Bidirectional Charging Market Forecast, 2023-2033 (US$ Mn, AGR (%))
Figure 31 Global Bidirectional Charging Market by Region, 2023-2033 (US$ Mn, AGR (%))
Figure 32 Global Vehicle to Grid (V2G) Market Share Forecast by Application 2023, 2028, 2033 (%)
Figure 33 Global Vehicle to Grid (V2G) Market by Application, 2023-2033 (US$ Mn, AGR (%))
Figure 34 Global Peak Power Sales Market Forecast, 2023-2033 (US$ Mn, AGR (%))
Figure 35 Global Peak Power Sales Market by Region, 2023-2033 (US$ Mn, AGR (%))
Figure 36 Global Spinning Reserves Market Forecast, 2023-2033 (US$ Mn, AGR (%))
Figure 37 Global Spinning Reserves Market by Region, 2023-2033 (US$ Mn, AGR (%))
Figure 38 Global Base Load Power Market Forecast, 2023-2033 (US$ Mn, AGR (%))
Figure 39 Global Base Load Power Market by Region, 2023-2033 (US$ Mn, AGR (%))
Figure 40 Global Vehicle to Grid (V2G) Market Share Forecast by Systems 2023, 2028, 2033 (%)
Figure 41 Global Vehicle to Grid (V2G) Market by Vehicle Type, 2023-2033 (US$ Mn, AGR (%))
Figure 42 Global Battery Electric Vehicle (BEV) Market Forecast, 2023-2033 (US$ Mn, AGR (%))
Figure 43 Global Battery Electric Vehicle (BEV) Market by Region, 2023-2033 (US$ Mn, AGR (%))
Figure 44 Global Fuel Cell Electric Vehicle (FCEV) Market Forecast, 2023-2033 (US$ Mn, AGR (%))
Figure 45 Global Fuel Cell Electric Vehicle (FCEV) Market by Region, 2023-2033 (US$ Mn, AGR (%))
Figure 46 Global Plug-In Hybrid Electric Vehicle (PHEV) Market Forecast, 2023-2033 (US$ Mn, AGR (%))
Figure 47 Global Plug-In Hybrid Electric Vehicle (PHEV) Market by Region, 2023-2033 (US$ Mn, AGR (%))
Figure 48 Global Other Vehicle Type Market Forecast, 2023-2033 (US$ Mn, AGR (%))
Figure 49 Global Other Vehicle Type Market by Region, 2023-2033 (US$ Mn, AGR (%))
Figure 50 Global Vehicle to Grid (V2G) Market Share Forecast by Services 2023, 2028, 2033 (%)
Figure 51 Global Vehicle to Grid (V2G) Market by Service, 2023-2033 (US$ Mn, AGR (%))
Figure 52 Global Ancillary Services Market Forecast, 2023-2033 (US$ Mn, AGR (%))
Figure 53 Global Ancillary Services Market by Region, 2023-2033 (US$ Mn, AGR (%))
Figure 54 Global Active Power Support Market Forecast, 2023-2033 (US$ Mn, AGR (%))
Figure 55 Global Active Power Support Market by Region, 2023-2033 (US$ Mn, AGR (%))
Figure 56 Global Backup Energy for Home Market Forecast, 2023-2033 (US$ Mn, AGR (%))
Figure 57 Global Backup Energy for Home Market by Region, 2023-2033 (US$ Mn, AGR (%))
Figure 58 Global Reactive Power Compensation Market Forecast, 2023-2033 (US$ Mn, AGR (%))
Figure 59 Global Reactive Power Compensation Market by Region, 2023-2033 (US$ Mn, AGR (%))
Figure 60 Global Other Services Market Forecast, 2023-2033 (US$ Mn, AGR (%))
Figure 61 Global Other Services Market by Region, 2023-2033 (US$ Mn, AGR (%))
Figure 62 Global Vehicle to Grid (V2G) Market by Solution, 2023-2033 (US$ Mn, AGR (%))
Figure 63 Global Electric Vehicle Supply Equipment (EVSE) Market Forecast, 2023-2033 (US$ Mn, AGR (%))
Figure 64 Global Electric Vehicle Supply Equipment (EVSE) Market by Region, 2023-2033 (US$ Mn, AGR (%))
Figure 65 Global Power Conversion Equipment (PCE) Market Forecast, 2023-2033 (US$ Mn, AGR (%))
Figure 66 Global Power Conversion Equipment (PCE) Market by Region, 2023-2033 (US$ Mn, AGR (%))
Figure 67 Global V2G Smart Meters Market Forecast, 2023-2033 (US$ Mn, AGR (%))
Figure 68 Global V2G Smart Meters Market by Region, 2023-2033 (US$ Mn, AGR (%))
Figure 69 Global Home Energy Management (HEM) Systems Market Forecast, 2023-2033 (US$ Mn, AGR (%))
Figure 70 Global Home Energy Management (HEM) Systems Market by Region, 2023-2033 (US$ Mn, AGR (%))
Figure 71 Global Dynamic Load Management (DLM) Market Forecast, 2023-2033 (US$ Mn, AGR (%))
Figure 72 Global Dynamic Load Management (DLM) Market by Region, 2023-2033 (US$ Mn, AGR (%))
Figure 73 Global Other Solutions Market Forecast, 2023-2033 (US$ Mn, AGR (%))
Figure 74 Global Other Solutions Market by Region, 2023-2033 (US$ Mn, AGR (%))
Figure 75 North America Vehicle to Grid (V2G) Market by Value, 2023-2033 (US$ Mn, AGR (%))
Figure 76 North America Vehicle to Grid (V2G) Market by Country, 2023-2033 (US$ Mn, AGR (%))
Figure 77 North America Vehicle to Grid (V2G) Market by Charging Type, 2023-2033 (US$ Mn, AGR (%))
Figure 78 North America Vehicle to Grid (V2G) Market by Application, 2023-2033 (US$ Mn, AGR (%))
Figure 79 North America Vehicle to Grid (V2G) Market by Vehicle Type, 2023-2033 (US$ Mn, AGR (%))
Figure 80 North America Vehicle to Grid (V2G) Market by Service, 2023-2033 (US$ Mn, AGR (%))
Figure 81 North America Vehicle to Grid (V2G) Market by Solution, 2023-2033 (US$ Mn, AGR (%))
Figure 82 Canada Market Forecast by Region, 2023-2033 (US$ million)
Figure 83 Canada Market Forecast by Region, 2023-2033 (US$ million)
Figure 84 Europe Vehicle to Grid (V2G) Market by Value, 2023-2033 (US$ Mn, AGR (%))
Figure 85 Europe Vehicle to Grid (V2G) Market by Country, 2023-2033 (US$ Mn, AGR (%))
Figure 86 Europe Vehicle to Grid (V2G) Market by Charging Type, 2023-2033 (US$ Mn, AGR (%))
Figure 87 Europe Vehicle to Grid (V2G) Market by Application, 2023-2033 (US$ Mn, AGR (%))
Figure 88 Europe Vehicle to Grid (V2G) Market by Vehicle Type, 2023-2033 (US$ Mn, AGR (%))
Figure 89 Europe Vehicle to Grid (V2G) Market by Service, 2023-2033 (US$ Mn, AGR (%))
Figure 90 Europe Vehicle to Grid (V2G) Market by Solution, 2023-2033 (US$ Mn, AGR (%))
Figure 91 Germany Market Forecast by Region, 2023-2033 (US$ million)
Figure 92 UK Market Forecast by Region, 2023-2033 (US$ million)
Figure 93 France Market Forecast by Region, 2023-2033 (US$ million)
Figure 94 Italy Market Forecast by Region, 2023-2033 (US$ million)
Figure 95 Italy Market Forecast by Region, 2023-2033 (US$ million)
Figure 96 Rest of Europe Market Forecast by Region, 2023-2033 (US$ million)
Figure 97 Asia-Pacific Vehicle to Grid (V2G) Market by Value, 2023-2033 (US$ Mn, AGR (%))
Figure 98 Asia-Pacific Vehicle to Grid (V2G) Market by Country, 2023-2033 (US$ Mn, AGR (%))
Figure 99 Asia-Pacific Vehicle to Grid (V2G) Market by Charging Type, 2023-2033 (US$ Mn, AGR (%))
Figure 100 Asia-Pacific Vehicle to Grid (V2G) Market by Application, 2023-2033 (US$ Mn, AGR (%))
Figure 101 Asia-Pacific Vehicle to Grid (V2G) Market by Vehicle Type, 2023-2033 (US$ Mn, AGR (%))
Figure 102 Asia-Pacific Vehicle to Grid (V2G) Market by Service, 2023-2033 (US$ Mn, AGR (%))
Figure 103 Asia-Pacific Vehicle to Grid (V2G) Market by Solution, 2023-2033 (US$ Mn, AGR (%))
Figure 104 China Market Forecast by Region, 2023-2033 (US$ million)
Figure 105 India Market Forecast by Region, 2023-2033 (US$ million)
Figure 106 Japan Market Forecast by Region, 2023-2033 (US$ million)
Figure 107 South Korea Market Forecast by Region, 2023-2033 (US$ million)
Figure 108 Australia Market Forecast by Region, 2023-2033 (US$ million)
Figure 109 Rest of Asia-Pacific Market Forecast by Region, 2023-2033 (US$ million)
Figure 110 Middle East & Africa Vehicle to Grid (V2G) Market by Value, 2023-2033 (US$ Mn, AGR (%))
Figure 111 Middle East & Africa Vehicle to Grid (V2G) Market by Country, 2023-2033 (US$ Mn, AGR (%))
Figure 112 Middle East & Africa Vehicle to Grid (V2G) Market by Charging Type, 2023-2033 (US$ Mn, AGR (%))
Figure 113 Middle East & Africa Vehicle to Grid (V2G) Market by Application, 2023-2033 (US$ Mn, AGR (%))
Figure 114 Middle East & Africa Vehicle to Grid (V2G) Market by Vehicle Type, 2023-2033 (US$ Mn, AGR (%))
Figure 115 Middle East & Africa Vehicle to Grid (V2G) Market by Service, 2023-2033 (US$ Mn, AGR (%))
Figure 116 Middle East & Africa Vehicle to Grid (V2G) Market by Solution, 2023-2033 (US$ Mn, AGR (%))
Figure 117 South Africa Market Forecast by Region, 2023-2033 (US$ million)
Figure 118 Saudi Arabia Market Forecast by Region, 2023-2033 (US$ million)
Figure 119 Turkey Market Forecast by Region, 2023-2033 (US$ million)
Figure 120 Rest of Middle East & Africa Market Forecast by Region, 2023-2033 (US$ million)
Figure 121 Latin America Vehicle to Grid (V2G) Market by Value, 2023-2033 (US$ Mn, AGR (%))
Figure 122 Latin America Vehicle to Grid (V2G) Market by Country, 2023-2033 (US$ Mn, AGR (%), CAGR (%))
Figure 123 Latin America Vehicle to Grid (V2G) Market by Charging Type, 2023-2033 (US$ Mn, AGR (%))
Figure 124 Latin America Vehicle to Grid (V2G) Market by Application, 2023-2033 (US$ Mn, AGR (%))
Figure 125 Latin America Vehicle to Grid (V2G) Market by Vehicle Type, 2023-2033 (US$ Mn, AGR (%))
Figure 126 Latin America Vehicle to Grid (V2G) Market by Service, 2023-2033 (US$ Mn, AGR (%))
Figure 127 Latin America Vehicle to Grid (V2G) Market by Solution, 2023-2033 (US$ Mn, AGR (%))
Figure 128 Brazil Market Forecast by Region, 2023-2033 (US$ million)
Figure 129 Mexico Market Forecast by Region, 2023-2033 (US$ million)
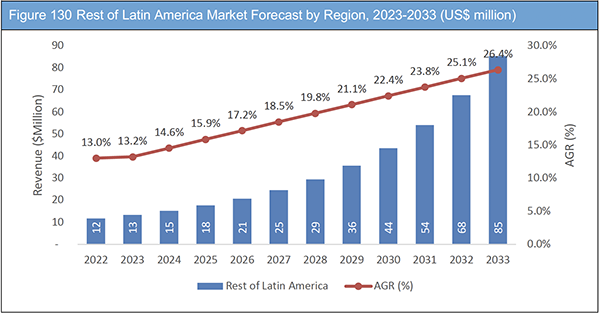
Figure 130 Rest of Latin America Market Forecast by Region, 2023-2033 (US$ million)
Figure 131 NextEra Energy: Net Revenue, 2017-2021 (US$ million, AGR%)
Figure 132 NextEra Energy: Gross Profit, 2017-2021 (US$ million, AGR%)
Figure 133 NextEra Energy: Operational Income, 2017-2021 (US$ million, AGR%)
Figure 134 NextEra Energy: EBITDA, 2017-2021 (US$ million, AGR%)
Figure 135 PG&E: Net Revenue, 2017-2021 (US$ million, AGR%)
Figure 136 PG&E: Gross Profit, 2017-2021 (US$ million, AGR%)
Figure 137 PG&E: Operational Income, 2017-2021 (US$ million, AGR%)
Figure 138 PG&E : EBITDA, 2017-2021 (US$ million, AGR%)
Figure 139 Denso Corporation: Net Revenue, 2017-2021 (US$ million, AGR%)
Figure 140 Denso Corporation: Gross Profit, 2017-2021 (US$ million, AGR%)
Figure 141 Denso Corporation: Operational Income, 2017-2021 (US$ million, AGR%)
Figure 142 Denso Corporation: EBITDA, 2017-2021 (US$ million, AGR%)
Figure 143 Engie Group: Net Revenue, 2017-2021 (US$ million, AGR%)
Figure 144 Engie Group: Gross Profit, 2017-2021 (US$ million, AGR%)
Figure 145 Engie Group: Operational Income, 2017-2021 (US$ million, AGR%)
Figure 146 Engie Group: EBITDA, 2017-2021 (US$ million, AGR%)
Figure 147 Hitachi Ltd: Net Revenue, 2017-2021 (US$ million, AGR%)
Figure 148 Hitachi Ltd: Gross Profit, 2017-2021 (US$ million, AGR%)
Figure 149 Hitachi Ltd: Operational Income, 2017-2021 (US$ million, AGR%)
Figure 150 Hitachi Ltd: EBITDA, 2017-2021 (US$ million, AGR%)
Figure 151 Nissan Motor Company Ltd: Net Revenue, 2017-2021 (US$ million, AGR%)
Figure 152 Nissan Motor Company Ltd: Gross Profit, 2017-2021 (US$ million, AGR%)
Figure 153 Nissan Motor Company Ltd: Operational Income, 2017-2021 (US$ million, AGR%)
Figure 154 Nissan Motor Company Ltd: EBITDA, 2017-2021 (US$ million, AGR%)
Figure 155 NRG Energy Inc: Net Revenue, 2017-2021 (US$ million, AGR%)
Figure 156 NRG Energy Inc: Gross Profit, 2017-2021 (US$ million, AGR%)
Figure 157 NRG Energy Inc: Operational Income, 2017-2021 (US$ million, AGR%)
Figure 158 NRG Energy Inc: EBITDA, 2017-2021 (US$ million, AGR%)
Figure 159 Mitsubishi Motors Corporation: Net Revenue, 2017-2021 (US$ million, AGR%)
Figure 160 Mitsubishi Motors Corporation: Gross Profit, 2017-2021 (US$ million, AGR%)
Figure 161 Mitsubishi Motors Corporation: Operational Income, 2017-2021 (US$ million, AGR%)
Figure 162 Mitsubishi Motors Corporation: EBITDA, 2017-2021 (US$ million, AGR%)
ページTOPに戻る
Summary
この調査レポートは世界のVehicle to Grid(V2G)市場を調査し、充電タイプ別、用途別、車両タイプ別、サービス別、ソリューション別、地域別に2022年から2033年までの予測結果を掲載しています。また関連企業情報を提供しています。
主な掲載内容(目次より抜粋)
-
レポート概要
-
エグゼクティブサマリー
-
プレミアムインサイト
-
市場概要
-
世界のV2G市場分析
-
世界のV2G市場分析:充電タイプ別
-
世界のV2G市場分析:用途別
-
世界のV2G市場分析:車両タイプ別
-
世界のV2G市場分析:サービス別
-
世界のV2G市場分析:ソリューション別
-
北米のV2G市場分析
-
欧州のV2G市場分析
-
アジア太平洋地域のV2G市場分析
-
中東・アフリカのV2G市場分析
-
ラテンアメリカのV2G市場分析
-
主要企業のプロフィール
Report Details
The Vehicle to Grid (V2G) Market Report 2023-2033: This report will prove invaluable to leading firms striving for new revenue pockets if they wish to better understand the industry and its underlying dynamics. It will be useful for companies that would like to expand into different industries or to expand their existing operations in a new region.
The Concept of Parked Automobiles Generating Electricity for the Grid Is Known as Vehicle-To-Grid (V2G) Technology
Vehicle-to-Grid (V2G) refers to a system in which plug-in electric vehicles (PEVs), such as battery electric vehicles (BEVs), plug-in hybrids (PHEVs), and hydrogen fuel cell electric vehicles (FCEVs), communicate with the power grid to sell demand response services by returning electricity to the grid or throttling their charging rate. Electric vehicles with V2G storage capability can store and release electricity generated from renewable energy sources such as solar and wind, with output that varies based on weather and time of day. Vehicles that can be connected to an electric plug can use V2G. PEVs, which comprise battery electric cars (BEVs) and plug-in hybrids, are commonly referred to as plug-in electric vehicles (PEVs) (PHEV). Because 95% of automobiles are parked at any given moment, electric vehicle batteries might be used to allow electricity to flow from the car to the electric distribution network and back. According to a assessment on potential revenues linked with V2G, vehicle owners might earn $454, $394, or $318 per year depending on whether their average daily trip was 32, 64, or 97 km (20, 40, or 60 miles), respectively, assuming sufficient governmental support.
North America has the largest Market Share and also has key growth in forecast period
On the Basis of region, North America has the largest market share and also has key growth in forecast period. Two important elements driving market expansion are early acceptance of new technology and public awareness of environmental issues. Incentives offered by the government to stimulate the adoption of electric vehicles in the region. Furthermore, local automakers are offering long-term guarantees to their clients, which is projected to support market growth. The US government anticipated a $750 million investment in electric-vehicle infrastructure in 2022 as part of the country’s long-term commitment to reduce emissions. Similarly, the Canadian government is heavily investing in V2G infrastructure development.
What Questions Should You Ask before Buying a Market Research Report?
• How is the vehicle to grid (V2G) market evolving?
• What is driving and restraining the vehicle to grid (V2G) market?
• How will each vehicle to grid (V2G) submarket segment grow over the forecast period and how much revenue will these submarkets account for in 2033?
• How will the market shares for each vehicle to grid (V2G) submarket develop from 2023 to 2033?
• What will be the main driver for the overall market from 2023 to 2033?
• Will leading vehicle to grid (V2G) markets broadly follow the macroeconomic dynamics, or will individual national markets outperform others?
• How will the market shares of the national markets change by 2033 and which geographical region will lead the market in 2033?
• Who are the leading players and what are their prospects over the forecast period?
• What are the vehicle to grid (V2G) projects for these leading companies?
• How will the industry evolve during the period between 2023 and 2033? What are the implications of vehicle to grid (V2G) projects taking place now and over the next 10 years?
• Is there a greater need for product commercialisation to further scale the vehicle to grid (V2G) market?
• Where is the vehicle to grid (V2G) market heading and how can you ensure you are at the forefront of the market?
• What are the best investment options for new product and service lines?
• What are the key prospects for moving companies into a new growth path and C-suite?
You need to discover how this will impact the vehicle to grid (V2G) market today, and over the next 10 years:
• Our 320-page report provides 167 tables and 162 charts/graphs exclusively to you.
• The report highlights key lucrative areas in the industry so you can target them – NOW.
• It contains in-depth analysis of global, regional and national sales and growth.
• It highlights for you the key successful trends, changes and revenue projections made by your competitors.
This report tells you TODAY how the vehicle to grid (V2G) market will develop in the next 10 years, and in line with the variations in COVID-19 economic recession and bounce. This market is more critical now than at any point over the last 10 years.
Forecasts to 2033 and other analyses reveal commercial prospects
• In addition to revenue forecasting to 2033, our new study provides you with recent results, growth rates, and market shares.
• You will find original analyses, with business outlooks and developments.
• Discover qualitative analyses (including market dynamics, drivers, opportunities, restraints and challenges), cost structure, impact of rising vehicle to grid (V2G) prices and recent developments.
This report includes data analysis and invaluable insight into how COVID-19 will affect the industry and your company. Four COVID-19 recovery patterns and their impact, namely, “V”, “L”, “W” and “U” are discussed in this report.
Segments Covered in the Report
Market Segment by Charging Type
• Unidirectional Charging
• Bidirectional Charging
Market Segment by Application
• Peak Power Sales
• Spinning Reserves
• Base Load Power
Market Segment by Vehicle Type
• Battery Electric Vehicle (BEV)
• Fuel Cell Electric Vehicle (FCEV)
• Plug-In Hybrid Electric Vehicle (PHEV)
• Other Vehicle Type
Market Segment by Service
• Ancillary Services
• Active Power Support
• Backup Energy for Home
• Reactive Power Compensation
• Other Services
Market Segment by Solution
• Electric Vehicle Supply Equipment (EVSE)
• Power Conversion Equipment (PCE)
• V2G Smart Meters
• Home Energy Management (HEM) Systems
• Dynamic Load Management (DLM)
• Other Solutions
In addition to the revenue predictions for the overall world market and segments, you will also find revenue forecasts for four regional and 20 leading national markets:
North America
• U.S.
• Canada
Europe
• Germany
• Spain
• United Kingdom
• France
• Italy
• Rest of Europe
Asia Pacific
• China
• Japan
• India
• Australia
• South Korea
• Rest of Asia Pacific
Latin America
• Brazil
• Mexico
• Rest of Latin America
Middle East & Africa
• South Africa
• Saudi Arabia
• Turkey
• Rest of Middle East & Africa
The report also includes profiles and for some of the leading companies in the Vehicle to Grid (V2G) Market, 2023 to 2033, with a focus on this segment of these companies’ operations.
Leading companies and the potential for market growth
• AC Propulsion
• Coritech Services Inc
• Denso Corporation
• Endesa SA
• EnerDel, Inc.
• Energie Baden Wuerttemberg AG (EnBW)
• Engie Group
• EV Grid
• Hitachi Ltd
• Jedlix
• Mitsubishi Motors Corporation
• NextEra Energy, Inc. (NEE)
• Nissan Motor Company Ltd
• NRG Energy Inc
• NUVVE LTD
• OVO Energy Ltd.
• PG&E Corporation
Overall world revenue for Vehicle to Grid (V2G) Market, 2023 to 2033 in terms of value the market will surpass US$1,158 million in 2023, our work calculates. We predict strong revenue growth through to 2033. Our work identifies which organizations hold the greatest potential. Discover their capabilities, progress, and commercial prospects, helping you stay ahead.
How will the Vehicle to Grid (V2G) Market, 2023 to 2033 report help you?
In summary, our 320-page report provides you with the following knowledge:
• Revenue forecasts to 2033 for Vehicle to Grid (V2G) Market, 2023 to 2033 Market, with forecasts for charging type, service, solution, vehicle type, application and company size, each forecast at a global and regional level – discover the industry’s prospects, finding the most lucrative places for investments and revenues.
• Revenue forecasts to 2033 for four regional and 20 key national markets – See forecasts for the Vehicle to Grid (V2G) Market, 2023 to 2033 market in North America, Europe, Asia-Pacific and LAMEA. Also forecasted is the market in the US, Canada, Mexico, Brazil, Germany, France, UK, Italy, China, India, Japan, and Australia among other prominent economies.
• Prospects for established firms and those seeking to enter the market – including company profiles for 15 of the major companies involved in the Vehicle to Grid (V2G) Market, 2023 to 2033.
Find quantitative and qualitative analyses with independent predictions. Receive information that only our report contains, staying informed with invaluable business intelligence.
Information found nowhere else
With our new report, you are less likely to fall behind in knowledge or miss out on opportunities. See how our work could benefit your research, analyses, and decisions. Visiongain’s study is for everybody needing commercial analyses for the Vehicle to Grid (V2G) Market, 2023 to 2033, market-leading companies. You will find data, trends and predictions.
ページTOPに戻る
Table of Contents
Table of Contents
1. Report Overview
1.1 Objectives of the Study
1.2 Introduction to Vehicle-to-Grid (V2G)
1.3 What This Report Delivers
1.4 Why You Should Read This Report
1.5 Key Questions Answered by This Analytical Report
1.6 Who is This Report for?
1.7 Methodology
1.7.1 Market Definitions
1.7.2 Market Evaluation & Forecasting Methodology
1.7.3 Data Validation
1.8 Frequently Asked Questions (FAQs)
1.9 Associated Visiongain Reports
1.10 About Visiongain
2 Executive Summary
3 Premium Insights
3.1 Geographical Snapshot: Global Vehicle-to-Grid (V2G)
3.2 Charging Type Segment: Market Attractiveness Index
3.3 Application Segment: Market Attractiveness Index
3.4 Vehicle Type Segment: Market Attractiveness Index
3.5 Service Segment: Market Attractive Index
3.6 Solution Segment: Market Attractive Index
4 Market Overview
4.1 Key Findings
4.2 Market Dynamics
4.3 Market Driving Factors
4.3.1 Reduction in Carbon Emissions and Energy Savings
4.3.2 Recent Developments in V2G Technology
4.3.3 Peak Shaving and Other Electrical Benefits
4.3.4 Ancillary and Regulation Services
4.3.5 Renewable Energy Integration
4.4 Market Restraining Factors
4.4.1 Implementation Issues
4.4.2 Barriers That Impend the Integration of EV in Smart Cities
4.4.3 Cooperation: Car Manufacturers and the Energy Sector Must Step In
4.4.4 New European Standard
4.5 Market Opportunities
4.5.1 Improvement in V2G Technology and Devices
4.5.2 Vehicle-To-Grid Technology Could Ease Europe’s Energy Transition Woes
4.6 Market Challenges
4.6.1 Social and Cultural Obstacles Ahead for V2G
4.6.2 Business and Industrial Factors AheadaFor V2G
4.6.3 Two of the Most Important Elements Influencing V2G Adoption Are Battery Efficiency and Durability
4.6.4 Security Threats and Authentication Protocol
4.7 COVID-19 Impact Analysis
4.7.1 “V-Shaped Recovery”
4.7.2 “W-Shaped Recovery”
4.7.3 “U-Shaped Recovery”
4.7.4 “L-Shaped Recovery”
4.8 Porter’s Five Forces Analysis
4.8.1 Supplier Power
4.8.2 Buyer Power
4.8.3 Competitive Rivalry
4.8.4 Threat from Substitutes
4.8.5 Threat of New Entrants
4.9 SWOT Analysis
4.10 PESTLE Analysis
4.10.1 Political Factors
4.10.2 Economic Factors
4.10.3 Social Factors
4.10.4 Technological Factors
5 Global Vehicle-to-Grid (V2G) Market Analysis
5.1 Key Findings
5.2 Global Vehicle to Grid (V2G) Market Forecast
5.3 Global Vehicle to Grid (V2G) Market by Region
5.4 Global Vehicle to Grid (V2G) Market by Charging Type
5.5 Global Vehicle to Grid (V2G) Market by Application
5.6 Global Vehicle to Grid (V2G) Market by Vehicle Type
5.7 Global Vehicle to Grid (V2G) Market by Service
5.8 Global Vehicle to Grid (V2G) Market by Solution
6 Global Vehicle-to-Grid (V2G) Market Analysis by Charging Type
6.1 Segment Overview
6.1.1 Global Vehicle to Grid (V2G) Market by Charging Type
6.2 Unidirectional Charging
6.2.1 Global Unidirectional Charging Market Forecast
6.2.2 Global Unidirectional Charging Market by Region
6.3 Bidirectional Charging
6.3.1 Global Bidirectional Charging Market Forecast
6.3.2 Global Bidirectional Charging Market by Region
7 Global Vehicle-to-Grid (V2G) Market Analysis by Application
7.1 Segment Overview
7.1.1 Global Vehicle to Grid (V2G) Market by Application
7.2 Peak Power Sales
7.2.1 Global Peak Power Sales Market Forecast
7.2.2 Global Peak Power Sales Market by Region
7.3 Spinning Reserves
7.3.1 Global Spinning Reserves Market Forecast
7.3.2 Global Spinning Reserves Market by Region
7.4 Base Load Power
7.4.1 Global Base Load Power Market Forecast
7.4.2 Global Base Load Power Market by Region
8 Global Vehicle-to-Grid (V2G) Market Analysis by Vehicle Type
8.1 Segment Overview
8.1.1 Global Vehicle to Grid (V2G) Market by Vehicle Type
8.2 Battery Electric Vehicle (BEV)
8.2.1 Global Battery Electric Vehicle (BEV) Market Forecast
8.2.2 Global Battery Electric Vehicle (BEV) Market by Region
8.3 Fuel Cell Electric Vehicle (FCEV)
8.3.1 Global Fuel Cell Electric Vehicle (FCEV) Market Forecast
8.3.2 Global Fuel Cell Electric Vehicle (FCEV) Market by Region
8.4 Plug-In Hybrid Electric Vehicle (PHEV)
8.4.1 Global Plug-In Hybrid Electric Vehicle (PHEV) Market Forecast
8.4.2 Global Plug-In Hybrid Electric Vehicle (PHEV) Market by Region
8.5 Other Vehicle Type
8.5.1 Global Other Vehicle Type Market Forecast
8.5.2 Global Other Vehicle Type Market by Region
9 Global Vehicle-to-Grid (V2G) Market Analysis by Service
9.1 Segment Overview
9.1.1 Global Vehicle to Grid (V2G) Market by Service
9.2 Ancillary Service
9.2.1 Global Ancillary Services Market Forecast
9.2.2 Global Ancillary Services Market by Region
9.3 Active Power Support
9.3.1 Global Active Power Support Market Forecast
9.3.2 Global Active Power Support Market by Region
9.4 Backup Energy for Home Market
9.4.1 Global Backup Energy for Home Market Forecast
9.4.2 Global Backup Energy for Home Market by Region
9.5 Reactive Power Compensation
9.5.1 Global Reactive Power Compensation Market Forecast
9.5.2 Global Reactive Power Compensation Market by Region
9.6 Other Service
9.6.1 Global Other Services Market Forecast
9.6.2 Global Other Services Market by Region
10 Global Vehicle-to-Grid (V2G) Market Analysis by Solution
10.1 Segment Overview
10.1.1 Global Vehicle to Grid (V2G) Market by Solution
10.2 Electric Vehicle Supply Equipment (EVSE)
10.2.1 Global Electric Vehicle Supply Equipment (EVSE) Market Forecast
10.2.2 Global Electric Vehicle Supply Equipment (EVSE) Market by Region
10.3 Power Conversion Equipment (PCE)
10.3.1 Global Power Conversion Equipment (PCE) Market Forecast
10.3.2 Global Power Conversion Equipment (PCE) Market by Region
10.4 Smart Meters Market Forecast
10.4.1 Global V2G Smart Meters Market Forecast
10.4.2 Global V2G Smart Meters Market by Region
10.5 Home Energy Management (HEM)
10.5.1 Global Home Energy Management (HEM) Systems Market Forecast
10.5.2 Global Home Energy Management (HEM) Systems Market by Region
10.6 Dynamic Load Management
10.6.1 Global Dynamic Load Management (DLM) Market Forecast
10.6.2 Global Dynamic Load Management (DLM) Market by Region
10.7 Other Solutions
10.7.1 Global Other Solutions Market Forecast
10.7.2 Global Other Solutions Market by Region
11 North America Vehicle-to-Grid (V2G) Market Analysis
11.1 Key Findings
11.1.1 Cummins Collaborates to Deliver the First Vehicle-To-Grid School Buses in North America
11.1.2 Europe and North America to Connect 7.9 Million EV Chargers by 2025
11.2 North America Vehicle to Grid (V2G) Market by Value
11.3 North America Vehicle to Grid (V2G) Market by Country
11.4 North America Vehicle to Grid (V2G) Market by Charging Type
11.5 North America Vehicle to Grid (V2G) Market by Application
11.6 North America Vehicle to Grid (V2G) Market by Vehicle Type
11.7 North America Vehicle to Grid (V2G) Market by Service
11.8 North America Vehicle to Grid (V2G) Market by Solution
11.9 U.S. Market Analysis
11.9.1 First Vehicle-To-Grid Charging Pilot in the US Midwest Underway
11.9.2 California Considers Electric Car V2G Charging Tech for Grid Stability
11.9.3 US Vehicle to Grid (V2G) Market by Value
11.10 Canada Market Analysis
11.10.1 Canada Invests in Electric Vehicle Grid Integration Pilot Project in Nova Scotia
11.10.2 Canadian Government Funds Charging Infrastructure
11.10.3 Canada Vehicle to Grid (V2G) Market by Value
12 Europe Vehicle-to-Grid (V2G) Market Analysis
12.1 Key Findings
12.1.1 New Vehicle-To-Grid Integration Technology Options in Europe and US
12.1.2 Rise of Electric Vehicles Heightens Grid-Integration Imperative
12.2 Europe Vehicle to Grid (V2G) Market by Value
12.3 Europe Vehicle to Grid (V2G) Market by Country
12.4 Europe Vehicle to Grid (V2G) Market by Charging Type
12.5 Europe Vehicle to Grid (V2G) Market by Application
12.6 Europe Vehicle to Grid (V2G) Market by Vehicle Type
12.7 Europe Vehicle to Grid (V2G) Market by Service
12.8 Europe Vehicle to Grid (V2G) Market by Solution
12.9 Germany Market Analysis
12.9.1 The Impact of Electromobility on the German Electric Grid
12.9.2 Nissan Leaf Gets Approval for Vehicle-To-Grid Use in Germany
12.9.3 Germany Vehicle to Grid (V2G) Market by Value
12.10 UK Market Analysis
12.10.1 UK Energy Regulator Supports Vehicle-To-Grid Proposal
12.10.2 UK Electricity Network Operator Launches Vehicle-To-Grid Trial
12.10.3 UK Vehicle to Grid (V2G) Market by Value
12.11 France Market Analysis
12.11.1 France to Kickstart Europe Rollout of ABB Vehicle-To-Grid Solution
12.11.2 ABB to Provide its New 11 KW V2G Charging Technology to France’s DREEV
12.11.3 France Vehicle to Grid (V2G) Market by Value
12.12 Italy Market Analysis
12.12.1 Vehicle-To-Grid Pilot Project Inaugurated in Turin, Italy
12.12.2 Work on World's Largest Vehicle-To-Grid Charging Project Commences in Italy Post Lockdown
12.12.3 Italy Vehicle to Grid (V2G) Market by Value
12.13 Spain Market Analysis
12.13.1 Turbocharging the Expansion of the Spanish EV Charging Grid
12.13.2 Spain’s REE, Ibil to Collaborate on EV Fast Charging Projects
12.13.3 Spain Vehicle to Grid (V2G) Market by Value
12.14 Rest of Europe Market Analysis
12.14.1 Rest of Europe Vehicle to Grid (V2G) Market by Value
13 Asia-Pacific Vehicle-to-Grid (V2G) Market Analysis
13.1 Key Findings
13.1.1 Asia Pacific Demand of Smart Grid Network Will Drive the Market
13.1.2 Asia Pacific Countries Prove the Need for Tailored E-Mobility Solutions
13.1.3 The Asia-Pacific High-Performance Electric Vehicles Will Drive the Market
13.2 Asia-Pacific Vehicle to Grid (V2G) Market by Value
13.3 Asia-Pacific Vehicle to Grid (V2G) Market by Country
13.4 Asia-Pacific Vehicle to Grid (V2G) Market by Charging Type
13.5 Asia-Pacific Vehicle to Grid (V2G) Market by Application
13.6 Asia-Pacific Vehicle to Grid (V2G) Market by Vehicle Type
13.7 Asia-Pacific Vehicle to Grid (V2G) Market by Service
13.8 Asia-Pacific Vehicle to Grid (V2G) Market by Solution
13.9 China Market Analysis
13.9.1 How EV Charging Can Clean Up China's Electricity Grid
13.9.2 China is Dominating in Smart Grid Market
13.9.3 China Vehicle to Grid (V2G) Market by Value
13.10 India Market Analysis
13.10.1 Barrier and Challenges of Electric Vehicle in India and Vehicle to Grid Optimisation
13.10.2 Charging Tech to Drive India’s EV Ride
13.10.3 India Vehicle to Grid (V2G) Market by Value
13.11 Japan Market Analysis
13.11.1 Japan Future Plan for Vehicle to Grid
13.11.2 Nuvve Corporation’s Vehicle-To-Grid (V2G) Platform Enables New Phase of Project Providing Grid Services in Japan
13.11.3 Japan Vehicle to Grid (V2G) Market by Value
13.12 South Korea Market Analysis
13.12.1 Hyundai Auto Group to Demonstrate Vehicle-To-Grid Using New Evs in Jeju
13.12.2 KEPCO Completes Development of Electric Car Multi-Vehicle Charging Grid
13.12.3 South Korea Vehicle to Grid (V2G) Market by Value
13.13 Australia Market Analysis
13.13.1 Canberra Project REVS up Australia’s Vehicle-To-Grid Readiness
13.13.2 Sunverge Announces Strategic Partnership with Simply Energy, Nissan Australia And Wallbox To Deliver Electric Vehicle-To-Home And Electric Vehicle-To-Grid Services
13.14 Rest of Asia-Pacific Market Analysis
13.14.1 Rest of Asia-Pacific Vehicle to Grid (V2G) Market by Value
14 Middle East and Africa Vehicle-to-Grid (V2G) Market Analysis
14.1 Key Findings
14.1.1 Electric Mobility Is a Game-Changer for MENA’s Energy and Transport Sectors
14.1.2 Siemens to Build EV Charging Corridor in the UAE
14.2 Middle East & Africa Vehicle to Grid (V2G) Market by Value
14.3 Middle East & Africa Vehicle to Grid (V2G) Market by Country
14.4 Middle East & Africa Vehicle to Grid (V2G) Market by Charging Type
14.5 Middle East & Africa Vehicle to Grid (V2G) Market by Application
14.6 Middle East & Africa Vehicle to Grid (V2G) Market by Vehicle Type
14.7 Middle East & Africa Vehicle to Grid (V2G) Market by Service
14.8 Middle East & Africa Vehicle to Grid (V2G) Market by Solution
14.9 South Africa Market Analysis
14.9.1 Nissan and UN to Create ‘Vehicle To Grid’ Project in Africa
14.9.2 Africa’s Bumpy Road to an EV Future
14.9.3 South Africa Vehicle to Grid (V2G) Market by Value
14.10 Saudi Arabia Market Analysis
14.10.1 Huawei Secures Contract for 1300mwh Saudi Battery Storage Project
14.10.2 Electric Vehicle Deployment and Carbon Emissions in Saudi Arabia
14.10.3 Saudi Arabia Vehicle to Grid (V2G) Market by Value
14.11 Turkey Market Analysis
14.11.1 Turkey’s TOGG Pushes up Domestic Demand for Electric Cars
14.11.2 Integrating Electric Vehicles into Turkey’s Distribution Grids
14.11.3 Turkey Vehicle to Grid (V2G) Market by Value
14.12 Rest of Middle East and Africa Market Analysis
14.12.1 Electric Vehicles Show Potential in the UAE
14.12.2 Rest of Middle East & Africa Vehicle to Grid (V2G) Market by Value
15 Latin America Vehicle-to-Grid (V2G) Market Analysis
15.1 Key Findings
15.2 Latin American Energy Provider Deploying 500 EV Charging Stations
15.3 Nissan LEAF Plays Key Role in Latin America’s First V2G System
15.4 Latin America Vehicle to Grid (V2G) Market by Value
15.5 Latin America Vehicle to Grid (V2G) Market by Country
15.6 Latin America Vehicle to Grid (V2G) Market by Charging Type
15.7 Latin America Vehicle to Grid (V2G) Market by Application
15.8 Latin America Vehicle to Grid (V2G) Market by Vehicle Type
15.9 Latin America Vehicle to Grid (V2G) Market by Service
15.10 Latin America Vehicle to Grid (V2G) Market by Solution
15.11 Brazil Market Analysis
15.11.1 Brazil’s Smart Grid Deployment Gets a Push
15.11.2 Neoenergia Launches Electric Vehicle Corridor In Northeast Brazil
15.11.3 Brazil Vehicle to Grid (V2G) Market by Value
15.12 Mexico Market Analysis
15.12.1 Mexico Needs a Renewable-Based Infrastructure to Support the Production of Electric Vehicles
15.12.2 GM Plans $1B Electric Vehicle Future for Mexico Plant, UAW Cries Foul
15.12.3 Mexico Vehicle to Grid (V2G) Market by Value
15.13 Rest of Latin America Market Analysis
15.13.1 Rest of Latin America Vehicle to Grid (V2G) Market by Value
16 Company Profiles
16.1 EnBW
16.1.1 Company Snapshot
16.1.2 Company Overview
16.1.3 Product Benchmarking
16.1.4 Strategic Outlook
16.2 Endesa
16.2.1 Company Snapshot
16.2.2 Company Overview
16.2.3 Strategic Outlook
16.3 NextEra Energy
16.3.1 Company Snapshot
16.3.2 Company Overview
16.3.3 Financial Analysis
16.3.4 Product Benchmarking
16.3.5 Strategic Outlook
16.4 PG&E
16.4.1 Company Snapshot
16.4.2 Company Overview
16.4.3 Financial Analysis
16.4.4 Product Benchmarking
16.4.5 Strategic Outlook
16.5 Nuvve
16.5.1 Company Snapshot
16.5.2 Company Overview
16.5.3 Product Benchmarking
16.5.4 Strategic Outlook
16.6 AC Propulsion Inc.
16.6.1 Company Snapshot
16.6.2 Company Overview
16.6.3 Product Benchmarking
16.7 Denso Corporation
16.7.1 Company Snapshot
16.7.2 Company Overview
16.7.3 Financial Analysis
16.7.4 Product Benchmarking
16.7.5 Strategic Outlook
16.8 Enerdel
16.8.1 Company Snapshot
16.8.2 Company Overview
16.8.3 Product Benchmarking
16.8.4 Strategic Outlook
16.9 Coritech Services Inc
16.9.1 Company Snapshot
16.9.2 Company Overview
16.9.3 Product Benchmarking
16.10 Engie Group
16.10.1 Company Snapshot
16.10.2 Company Overview
16.10.3 Financial Analysis
16.10.4 Strategic Outlook
16.11 EV Grid
16.11.1 Company Snapshot
16.11.2 Company Overview
16.12 Hitachi Ltd
16.12.1 Company Snapshot
16.12.2 Company Overview
16.12.3 Financial Analysis
16.12.4 Product Benchmarking
16.12.5 Strategic Outlook
16.13 Nissan Motor Company Ltd
16.13.1 Company Snapshot
16.13.2 Company Overview
16.13.3 Financial Analysis
16.13.4 Product Benchmarking
16.13.5 Strategic Outlook
16.14 NRG Energy Inc
16.14.1 Company Snapshot
16.14.2 Company Overview
16.14.3 Financial Analysis
16.14.4 Strategic Outlook
16.15 OVO Energy Ltd.
16.15.1 Company Snapshot
16.15.2 Company Overview
16.15.3 Product Benchmarking
16.15.4 Strategic Outlook
16.16 Mitsubishi Motors Corporation
16.16.1 Company Snapshot
16.16.2 Company Overview
16.16.3 Financial Analysis
16.16.4 Product Benchmarking
16.16.5 Strategic Outlook
16.17 Corinex
16.17.1 Company Snapshot
16.17.2 Company Overview
16.17.3 Product Benchmarking
16.17.4 Strategic Outlook
16.18 Coritech
16.18.1 Company Snapshot
16.18.2 Company Overview
16.18.3 Product Benchmarking
16.19 Jedlix
16.19.1 Company Snapshot
16.19.2 Company Overview
16.19.3 Product Benchmarking
16.19.4 Strategic Outlook
17 Conclusion and Recommendations
17.1 V2G is a Promising Technology that Could Hasten the Shift to Electric Vehicles by Increasing their Commercial Viability.
18 Glossary Terms
List of Tables
Table 1 Global Vehicle to Grid (V2G) Market Snapshot, 2022 & 2033 (US$ million, CAGR %)
Table 2 Global Vehicle to Grid (V2G) Market Forecast, 2023-2033 (US$ Mn, AGR (%), CAGR (%)) (V-Shaped Recovery Scenario)
Table 3 Global Vehicle to Grid (V2G) Market by Region, 2023-2033 (US$ Mn, AGR (%), CAGR (%)) (V-Shaped Recovery Scenario)
Table 4 Global Vehicle to Grid (V2G) Market Forecast, 2023-2033 (US$ Mn, AGR (%), CAGR (%)) (W-Shaped Recovery Scenario)
Table 5 Global Vehicle to Grid (V2G) Market by Region, 2023-2033 (US$ Mn, AGR (%), CAGR (%)) (W-Shaped Recovery Scenario)
Table 6 Global Vehicle to Grid (V2G) Market Forecast, 2023-2033 (US$ Mn, AGR (%), CAGR (%)) (U-Shaped Recovery Scenario)
Table 7 Global Vehicle to Grid (V2G) Market by Region, 2023-2033 (US$ Mn, AGR (%), CAGR (%)) (U-Shaped Recovery Scenario)
Table 8 Global Vehicle to Grid (V2G) Market Forecast, 2023-2033 (US$ Mn, AGR (%), CAGR (%)) (L-Shaped Recovery Scenario)
Table 9 Global Vehicle to Grid (V2G) Market by Region, 2023-2033 (US$ Mn, AGR (%), CAGR (%)) (L-Shaped Recovery Scenario)
Table 10 Global Vehicle to Grid (V2G) Market SWOT Analysis 2023-2033
Table 11 Global Vehicle to Grid (V2G) Market Forecast, 2023-2033 (US$ Mn, AGR (%), CAGR (%))
Table 12 Global Vehicle to Grid (V2G) Market by Region, 2023-2033 (US$ Mn, AGR (%), CAGR (%))
Table 13 Global Vehicle to Grid (V2G) Market by Charging Type, 2023-2033 (US$ Mn, AGR (%), CAGR (%))
Table 14 Global Vehicle to Grid (V2G) Market by Application, 2023-2033 (US$ Mn, AGR (%), CAGR (%))
Table 15 Global Vehicle to Grid (V2G) Market by Vehicle Type, 2023-2033 (US$ Mn, AGR (%), CAGR (%))
Table 16 Global Vehicle to Grid (V2G) Market by Service, 2023-2033 (US$ Mn, AGR (%), CAGR (%))
Table 17 Global Vehicle to Grid (V2G) Market by Solution, 2023-2033 (US$ Mn, AGR (%), CAGR (%))
Table 18 Global Vehicle to Grid (V2G) Market by Charging Type, 2023-2033 (US$ Mn, AGR (%), CAGR (%))
Table 19 Global Unidirectional Charging Market Forecast, 2023-2033 (US$ Mn, AGR (%), CAGR (%))
Table 20 Global Unidirectional Charging Market by Region, 2023-2033 (US$ Mn, AGR (%), CAGR (%))
Table 21 Global Bidirectional Charging Market Forecast, 2023-2033 (US$ Mn, AGR (%), CAGR (%))
Table 22 Global Bidirectional Charging Market by Region, 2023-2033 (US$ Mn, AGR (%), CAGR (%))
Table 23 Global Vehicle to Grid (V2G) Market by Application, 2023-2033 (US$ Mn, AGR (%), CAGR (%))
Table 24 Global Peak Power Sales Market Forecast, 2023-2033 (US$ Mn, AGR (%), CAGR (%))
Table 25 Global Peak Power Sales Market by Region, 2023-2033 (US$ Mn, AGR (%), CAGR (%))
Table 26 Global Spinning Reserves Market Forecast, 2023-2033 (US$ Mn, AGR (%), CAGR (%))
Table 27 Global Spinning Reserves Market by Region, 2023-2033 (US$ Mn, AGR (%), CAGR (%))
Table 28 Global Base Load Power Market Forecast, 2023-2033 (US$ Mn, AGR (%), CAGR (%))
Table 29 Global Base Load Power Market by Region, 2023-2033 (US$ Mn, AGR (%), CAGR (%))
Table 30 Global Vehicle to Grid (V2G) Market by Vehicle Type, 2023-2033 (US$ Mn, AGR (%), CAGR (%))
Table 31 Global Battery Electric Vehicle (BEV) Market Forecast, 2023-2033 (US$ Mn, AGR (%), CAGR (%))
Table 32 Global Battery Electric Vehicle (BEV) Market by Region, 2023-2033 (US$ Mn, AGR (%), CAGR (%))
Table 33 Global Fuel Cell Electric Vehicle (FCEV) Market Forecast, 2023-2033 (US$ Mn, AGR (%), CAGR (%))
Table 34 Global Fuel Cell Electric Vehicle (FCEV) Market by Region, 2023-2033 (US$ Mn, AGR (%), CAGR (%))
Table 35 Global Plug-In Hybrid Electric Vehicle (PHEV) Market Forecast, 2023-2033 (US$ Mn, AGR (%), CAGR (%))
Table 36 Global Plug-In Hybrid Electric Vehicle (PHEV) Market by Region, 2023-2033 (US$ Mn, AGR (%), CAGR (%))
Table 37 Global Other Vehicle Type Market Forecast, 2023-2033 (US$ Mn, AGR (%), CAGR (%))
Table 38 Global Other Vehicle Type Market by Region, 2023-2033 (US$ Mn, AGR (%), CAGR (%))
Table 39 Global Vehicle to Grid (V2G) Market by Service, 2023-2033 (US$ Mn, AGR (%), CAGR (%))
Table 40 Global Ancillary Services Market Forecast, 2023-2033 (US$ Mn, AGR (%), CAGR (%))
Table 41 Global Ancillary Services Market by Region, 2023-2033 (US$ Mn, AGR (%), CAGR (%))
Table 42 Global Active Power Support Market Forecast, 2023-2033 (US$ Mn, AGR (%), CAGR (%))
Table 43 Global Active Power Support Market by Region, 2023-2033 (US$ Mn, AGR (%), CAGR (%))
Table 44 Global Backup Energy for Home Market Forecast, 2023-2033 (US$ Mn, AGR (%), CAGR (%))
Table 45 Global Backup Energy for Home Market by Region, 2023-2033 (US$ Mn, AGR (%), CAGR (%))
Table 46 Global Reactive Power Compensation Market Forecast, 2023-2033 (US$ Mn, AGR (%), CAGR (%))
Table 47 Global Reactive Power Compensation Market by Region, 2023-2033 (US$ Mn, AGR (%), CAGR (%))
Table 48 Global Other Services Market Forecast, 2023-2033 (US$ Mn, AGR (%), CAGR (%))
Table 49 Global Other Services Market by Region, 2023-2033 (US$ Mn, AGR (%), CAGR (%))
Table 50 Global Vehicle to Grid (V2G) Market by Solution, 2023-2033 (US$ Mn, AGR (%), CAGR (%))
Table 51 Global Electric Vehicle Supply Equipment (EVSE) Market Forecast, 2023-2033 (US$ Mn, AGR (%), CAGR (%))
Table 52 Global Electric Vehicle Supply Equipment (EVSE) Market by Region, 2023-2033 (US$ Mn, AGR (%), CAGR (%))
Table 53 Global Power Conversion Equipment (PCE) Market Forecast, 2023-2033 (US$ Mn, AGR (%), CAGR (%))
Table 54 Global Power Conversion Equipment (PCE) Market by Region, 2023-2033 (US$ Mn, AGR (%), CAGR (%))
Table 55 Global V2G Smart Meters Market Forecast, 2023-2033 (US$ Mn, AGR (%), CAGR (%))
Table 56 Global V2G Smart Meters Market by Region, 2023-2033 (US$ Mn, AGR (%), CAGR (%))
Table 57 Global Home Energy Management (HEM) Systems Market Forecast, 2023-2033 (US$ Mn, AGR (%), CAGR (%))
Table 58 Global Home Energy Management (HEM) Systems Market by Region, 2023-2033 (US$ Mn, AGR (%), CAGR (%))
Table 59 Global Dynamic Load Management (DLM) Market Forecast, 2023-2033 (US$ Mn, AGR (%), CAGR (%))
Table 60 Global Dynamic Load Management (DLM) Market by Region, 2023-2033 (US$ Mn, AGR (%), CAGR (%))
Table 61 Global Other Solutions Market Forecast, 2023-2033 (US$ Mn, AGR (%), CAGR (%))
Table 62 Global Other Solutions Market by Region, 2023-2033 (US$ Mn, AGR (%), CAGR (%))
Table 63 North America Vehicle to Grid (V2G) Market by Value, 2023-2033 (US$ Mn, AGR (%), CAGR (%))
Table 64 North America Vehicle to Grid (V2G) Market by Country, 2023-2033 (US$ Mn, AGR (%), CAGR (%))
Table 65 North America Vehicle to Grid (V2G) Market by Charging Type, 2023-2033 (US$ Mn, AGR (%), CAGR (%))
Table 66 North America Vehicle to Grid (V2G) Market by Application, 2023-2033 (US$ Mn, AGR (%), CAGR (%))
Table 67 North America Vehicle to Grid (V2G) Market by Vehicle Type, 2023-2033 (US$ Mn, AGR (%), CAGR (%))
Table 68 North America Vehicle to Grid (V2G) Market by Service, 2023-2033 (US$ Mn, AGR (%), CAGR (%))
Table 69 North America Vehicle to Grid (V2G) Market by Solution, 2023-2033 (US$ Mn, AGR (%), CAGR (%))
Table 70 US Vehicle to Grid (V2G) Market by Value, 2023-2033 (US$ Mn, AGR (%), CAGR (%))
Table 71 Canada Vehicle to Grid (V2G) Market by Value, 2023-2033 (US$ Mn, AGR (%), CAGR (%))
Table 72 Europe Vehicle to Grid (V2G) Market by Value, 2023-2033 (US$ Mn, AGR (%), CAGR (%))
Table 73 Europe Vehicle to Grid (V2G) Market by Country, 2023-2033 (US$ Mn, AGR (%), CAGR (%))
Table 74 Europe Vehicle to Grid (V2G) Market by Charging Type, 2023-2033 (US$ Mn, AGR (%), CAGR (%))
Table 75 Europe Vehicle to Grid (V2G) Market by Application, 2023-2033 (US$ Mn, AGR (%), CAGR (%))
Table 76 Europe Vehicle to Grid (V2G) Market by Vehicle Type, 2023-2033 (US$ Mn, AGR (%), CAGR (%))
Table 77 Europe Vehicle to Grid (V2G) Market by Service, 2023-2033 (US$ Mn, AGR (%), CAGR (%))
Table 78 Europe Vehicle to Grid (V2G) Market by Solution, 2023-2033 (US$ Mn, AGR (%), CAGR (%))
Table 79 Germany Vehicle to Grid (V2G) Market by Value, 2023-2033 (US$ Mn, AGR (%), CAGR (%))
Table 80 UK Vehicle to Grid (V2G) Market by Value, 2023-2033 (US$ Mn, AGR (%), CAGR (%))
Table 81 France Vehicle to Grid (V2G) Market by Value, 2023-2033 (US$ Mn, AGR (%), CAGR (%))
Table 82 Italy Vehicle to Grid (V2G) Market by Value, 2023-2033 (US$ Mn, AGR (%), CAGR (%))
Table 83 Spain Vehicle to Grid (V2G) Market by Value, 2023-2033 (US$ Mn, AGR (%), CAGR (%))
Table 84 Rest of Europe Vehicle to Grid (V2G) Market by Value, 2023-2033 (US$ Mn, AGR (%), CAGR (%))
Table 85 Asia-Pacific Vehicle to Grid (V2G) Market by Value, 2023-2033 (US$ Mn, AGR (%), CAGR (%))
Table 86 Asia-Pacific Vehicle to Grid (V2G) Market by Country, 2023-2033 (US$ Mn, AGR (%), CAGR (%))
Table 87 Asia-Pacific Vehicle to Grid (V2G) Market by Charging Type, 2023-2033 (US$ Mn, AGR (%), CAGR (%))
Table 88 Asia-Pacific Vehicle to Grid (V2G) Market by Application, 2023-2033 (US$ Mn, AGR (%), CAGR (%))
Table 89 Asia-Pacific Vehicle to Grid (V2G) Market by Vehicle Type, 2023-2033 (US$ Mn, AGR (%), CAGR (%))
Table 90 Asia-Pacific Vehicle to Grid (V2G) Market by Service, 2023-2033 (US$ Mn, AGR (%), CAGR (%))
Table 91 Asia-Pacific Vehicle to Grid (V2G) Market by Solution, 2023-2033 (US$ Mn, AGR (%), CAGR (%))
Table 92 China Vehicle to Grid (V2G) Market by Value, 2023-2033 (US$ Mn, AGR (%), CAGR (%))
Table 93 India Vehicle to Grid (V2G) Market by Value, 2023-2033 (US$ Mn, AGR (%), CAGR (%))
Table 94 Japan Vehicle to Grid (V2G) Market by Value, 2023-2033 (US$ Mn, AGR (%), CAGR (%))
Table 95 South Korea Vehicle to Grid (V2G) Market by Value, 2023-2033 (US$ Mn, AGR (%), CAGR (%))
Table 96 Australia Vehicle to Grid (V2G) Market by Value, 2023-2033 (US$ Mn, AGR (%), CAGR (%))
Table 97 Rest of Asia-Pacific Vehicle to Grid (V2G) Market by Value, 2023-2033 (US$ Mn, AGR (%), CAGR (%))
Table 98 Middle East & Africa Vehicle to Grid (V2G) Market by Value, 2023-2033 (US$ Mn, AGR (%), CAGR (%))
Table 99 Middle East & Africa Vehicle to Grid (V2G) Market by Country, 2023-2033 (US$ Mn, AGR (%), CAGR (%))
Table 100 Middle East & Africa Vehicle to Grid (V2G) Market by Charging Type, 2023-2033 (US$ Mn, AGR (%), CAGR (%))
Table 101 Middle East & Africa Vehicle to Grid (V2G) Market by Application, 2023-2033 (US$ Mn, AGR (%), CAGR (%))
Table 102 Middle East & Africa Vehicle to Grid (V2G) Market by Vehicle Type, 2023-2033 (US$ Mn, AGR (%), CAGR (%))
Table 103 Middle East & Africa Vehicle to Grid (V2G) Market by Service, 2023-2033 (US$ Mn, AGR (%), CAGR (%))
Table 104 Middle East & Africa Vehicle to Grid (V2G) Market by Solution, 2023-2033 (US$ Mn, AGR (%), CAGR (%))
Table 105 South Africa Vehicle to Grid (V2G) Market by Value, 2023-2033 (US$ Mn, AGR (%), CAGR (%))
Table 106 Saudi Arabia Vehicle to Grid (V2G) Market by Value, 2023-2033 (US$ Mn, AGR (%), CAGR (%))
Table 107 Turkey Vehicle to Grid (V2G) Market by Value, 2023-2033 (US$ Mn, AGR (%), CAGR (%))
Table 108 Rest of Middle East & Africa Vehicle to Grid (V2G) Market by Value, 2023-2033 (US$ Mn, AGR (%), CAGR (%))
Table 109 Latin America Vehicle to Grid (V2G) Market by Value, 2023-2033 (US$ Mn, AGR (%), CAGR (%))
Table 110 Latin America Vehicle to Grid (V2G) Market by Country, 2023-2033 (US$ Mn, AGR (%), CAGR (%))
Table 111 Latin America Vehicle to Grid (V2G) Market by Charging Type, 2023-2033 (US$ Mn, AGR (%), CAGR (%))
Table 112 Latin America Vehicle to Grid (V2G) Market by Application, 2023-2033 (US$ Mn, AGR (%), CAGR (%))
Table 113 Latin America Vehicle to Grid (V2G) Market by Vehicle Type, 2023-2033 (US$ Mn, AGR (%), CAGR(%))
Table 114 Latin America Vehicle to Grid (V2G) Market by Service, 2023-2033 (US$ Mn, AGR (%), CAGR(%))
Table 115 Latin America Vehicle to Grid (V2G) Market by Solution, 2023-2033 (US$ Mn, AGR (%), CAGR(%))
Table 116 Brazil Vehicle to Grid (V2G) Market by Value, 2023-2033 (US$ Mn, AGR (%), CAGR (%))
Table 117 Mexico Vehicle to Grid (V2G) Market by Value, 2023-2033 (US$ Mn, AGR (%), CAGR (%))
Table 118 Rest of Latin America Vehicle to Grid (V2G) Market by Value, 2023-2033 (US$ Mn, AGR (%), CAGR (%))
Table 119 EnBW: Key Details, (CEO, HQ, Revenue, Founded, No. of Employees, Company Type, Website, Business Segment)
Table 120 EnBW: Product Benchmarking
Table 121 EnBW: Strategic Outlook
Table 122 Endesa: Key Details, (CEO, HQ, Revenue, Founded, No. of Employees, Company Type, Website, Business Segment)
Table 123 Endesa: Strategic Outlook
Table 124 NextEra Energy: Key Details, (CEO, HQ, Revenue, Founded, No. of Employees, Company Type, Website, Business Segment)
Table 125 NextEra Energy: Product Benchmarking
Table 126 NextEra Energy: Strategic Outlook
Table 127 PG&E: Key Details, (CEO, HQ, Revenue, Founded, No. of Employees, Company Type, Website, Business Segment)
Table 128 PG&E: Product Benchmarking
Table 129 PG&E: Strategic Outlook
Table 130 Nuvve: Key Details, (CEO, HQ, Revenue, Founded, No. of Employees, Company Type, Website, Business Segment)
Table 131 Nuvve: Product Benchmarking
Table 132 Nuvve: Strategic Outlook
Table 133 AC Propulsion Inc: Key Details, (CEO, HQ, Revenue, Founded, No. of Employees, Company Type, Website, Business Segment)
Table 134 AC Propulsion Inc: Product Benchmarking
Table 135 Denso Corporation: Key Details, (CEO, HQ, Revenue, Founded, No. of Employees, Company Type, Website, Business Segment)
Table 136 Denso Corporation: Product Benchmarking
Table 137 Denso Corporation: Strategic Outlook
Table 138 Enerdel: Key Details, (CEO, HQ, Revenue, Founded, No. of Employees, Company Type, Website, Business Segment)
Table 139 Enerdel:: Product Benchmarking
Table 140 Enerdel:: Strategic Outlook
Table 141 Coritech Services Inc: Key Details, (CEO, HQ, Revenue, Founded, No. of Employees, Company Type, Website, Business Segment)
Table 142 Coritech Services Inc: Product Benchmarking
Table 143 Engie Group: Key Details, (CEO, HQ, Revenue, Founded, No. of Employees, Company Type, Website, Business Segment)
Table 144 Engie Group: Strategic Outlook
Table 145 EV Grid: Key Details, (CEO, HQ, Revenue, Founded, No. of Employees, Company Type, Website, Business Segment)
Table 146 Hitachi Ltd: Key Details, (CEO, HQ, Revenue, Founded, No. of Employees, Company Type, Website, Business Segment)
Table 147 Hitachi Ltd: Product Benchmarking
Table 148 Hitachi Ltd: Strategic Outlook
Table 149 Nissan Motor Company Ltd: Key Details, (CEO, HQ, Revenue, Founded, No. of Employees, Company Type, Website, Business Segment)
Table 150 Nissan Motor Company Ltd: Product Benchmarking
Table 151 Nissan Motor Company Ltd: Strategic Outlook
Table 152 NRG Energy Inc: Key Details, (CEO, HQ, Revenue, Founded, No. of Employees, Company Type, Website, Business Segment)
Table 153 NRG Energy Inc: Strategic Outlook
Table 154 OVO Energy Ltd: Key Details, (CEO, HQ, Revenue, Founded, No. of Employees, Company Type, Website, Business Segment)
Table 155 OVO Energy Ltd: Product Benchmarking
Table 156 OVO Energy Ltd: Strategic Outlook
Table 157 Mitsubishi Motors Corporation: Key Details, (CEO, HQ, Revenue, Founded, No. of Employees, Company Type, Website, Business Segment)
Table 158 Mitsubishi Motors Corporation: Product Benchmarking
Table 159 Mitsubishi Motors Corporation: Strategic Outlook
Table 160 Corinex:: Key Details, (CEO, HQ, Revenue, Founded, No. of Employees, Company Type, Website, Business Segment)
Table 161 Corinex:: Product Benchmarking
Table 162 Corinex:: Strategic Outlook
Table 163 Coritech: Key Details, (CEO, HQ, Revenue, Founded, No. of Employees, Company Type, Website, Business Segment)
Table 164 Coritech: Product Benchmarking
Table 165 Jedlix: Key Details, (CEO, HQ, Revenue, Founded, No. of Employees, Company Type, Website, Business Segment)
Table 166 Jedlix: Product Benchmarking
Table 167 Jedlix: Strategic Outlook
List of Figures
Figure 1 Global Vehicle-to-Grid (V2G) Segmentation
Figure 2 Breakdown of Primary Interviews by Company Type, Designation, & Region
Figure 3 Global Vehicle-to-Grid (V2G) Forecast by Region: Market Attractiveness Index
Figure 4 Global Vehicle-to-Grid (V2G) by Charging Type: Market Attractiveness Index
Figure 5 Global Vehicle-to-Grid (V2G) by Application: Market Attractiveness Index
Figure 6 Global Vehicle-to-Grid (V2G) by Vehicle Type: Market Attractiveness Index
Figure 7 Global Vehicle-to-Grid (V2G) by Service: Market Attractiveness Index
Figure 8 Global Vehicle-to-Grid (V2G) by Solutions: Market Attractiveness Index
Figure 9 Global Vehicle-to-Grid (V2G): Market Dynamics
Figure 10 Global Vehicle to Grid (V2G) Market Forecast, 2023-2033 (US$ Mn, AGR (%)) (V-Shaped Recovery Scenario)
Figure 11 Global Vehicle to Grid (V2G) Market by Region, 2023-2033 (US$ Mn, AGR (%)) (V-Shaped Recovery Scenario)
Figure 12 Global Vehicle to Grid (V2G) Market Forecast, 2023-2033 (US$ Mn, AGR (%)) (W-Shaped Recovery Scenario)
Figure 13 Global Vehicle to Grid (V2G) Market by Region, 2023-2033 (US$ Mn, AGR (%)) (W-Shaped Recovery Scenario)
Figure 14 Global Vehicle to Grid (V2G) Market Forecast, 2023-2033 (US$ Mn, AGR (%)) (U-Shaped Recovery Scenario)
Figure 15 Global Vehicle to Grid (V2G) Market by Region, 2023-2033 (US$ Mn, AGR (%)) (U-Shaped Recovery Scenario)
Figure 16 Global Vehicle to Grid (V2G) Market Forecast, 2023-2033 (US$ Mn, AGR (%)) (L-Shaped Recovery Scenario)
Figure 17 Global Vehicle to Grid (V2G) Market by Region, 2023-2033 (US$ Mn, AGR (%)) (L-Shaped Recovery Scenario)
Figure 18 Global Vehicle-to-Grid (V2G): Porter’s Five Forces Analysis
Figure 19 Global Vehicle to Grid (V2G) Market Forecast, 2023-2033 (US$ Mn, AGR (%))
Figure 20 Global Vehicle to Grid (V2G) Market by Region, 2023-2033 (US$ Mn, AGR (%))
Figure 21 Global Vehicle to Grid (V2G) Market by Charging Type, 2023-2033 (US$ Mn, AGR (%))
Figure 22 Global Vehicle to Grid (V2G) Market by Application, 2023-2033 (US$ Mn, AGR (%))
Figure 23 Global Vehicle to Grid (V2G) Market by Vehicle Type, 2023-2033 (US$ Mn, AGR (%))
Figure 24 Global Vehicle to Grid (V2G) Market by Service, 2023-2033 (US$ Mn, AGR (%))
Figure 25 Global Vehicle to Grid (V2G) Market by Solution, 2023-2033 (US$ Mn, AGR (%))
Figure 26 Global Vehicle to Grid (V2G) Market Share Forecast by Charging Type 2023, 2028, 2033 (%)
Figure 27 Global Vehicle to Grid (V2G) Market by Charging Type, 2023-2033 (US$ Mn, AGR (%))
Figure 28 Global Unidirectional Charging Market Forecast, 2023-2033 (US$ Mn, AGR (%))
Figure 29 Global Unidirectional Charging Market by Region, 2023-2033 (US$ Mn, AGR (%))
Figure 30 Global Bidirectional Charging Market Forecast, 2023-2033 (US$ Mn, AGR (%))
Figure 31 Global Bidirectional Charging Market by Region, 2023-2033 (US$ Mn, AGR (%))
Figure 32 Global Vehicle to Grid (V2G) Market Share Forecast by Application 2023, 2028, 2033 (%)
Figure 33 Global Vehicle to Grid (V2G) Market by Application, 2023-2033 (US$ Mn, AGR (%))
Figure 34 Global Peak Power Sales Market Forecast, 2023-2033 (US$ Mn, AGR (%))
Figure 35 Global Peak Power Sales Market by Region, 2023-2033 (US$ Mn, AGR (%))
Figure 36 Global Spinning Reserves Market Forecast, 2023-2033 (US$ Mn, AGR (%))
Figure 37 Global Spinning Reserves Market by Region, 2023-2033 (US$ Mn, AGR (%))
Figure 38 Global Base Load Power Market Forecast, 2023-2033 (US$ Mn, AGR (%))
Figure 39 Global Base Load Power Market by Region, 2023-2033 (US$ Mn, AGR (%))
Figure 40 Global Vehicle to Grid (V2G) Market Share Forecast by Systems 2023, 2028, 2033 (%)
Figure 41 Global Vehicle to Grid (V2G) Market by Vehicle Type, 2023-2033 (US$ Mn, AGR (%))
Figure 42 Global Battery Electric Vehicle (BEV) Market Forecast, 2023-2033 (US$ Mn, AGR (%))
Figure 43 Global Battery Electric Vehicle (BEV) Market by Region, 2023-2033 (US$ Mn, AGR (%))
Figure 44 Global Fuel Cell Electric Vehicle (FCEV) Market Forecast, 2023-2033 (US$ Mn, AGR (%))
Figure 45 Global Fuel Cell Electric Vehicle (FCEV) Market by Region, 2023-2033 (US$ Mn, AGR (%))
Figure 46 Global Plug-In Hybrid Electric Vehicle (PHEV) Market Forecast, 2023-2033 (US$ Mn, AGR (%))
Figure 47 Global Plug-In Hybrid Electric Vehicle (PHEV) Market by Region, 2023-2033 (US$ Mn, AGR (%))
Figure 48 Global Other Vehicle Type Market Forecast, 2023-2033 (US$ Mn, AGR (%))
Figure 49 Global Other Vehicle Type Market by Region, 2023-2033 (US$ Mn, AGR (%))
Figure 50 Global Vehicle to Grid (V2G) Market Share Forecast by Services 2023, 2028, 2033 (%)
Figure 51 Global Vehicle to Grid (V2G) Market by Service, 2023-2033 (US$ Mn, AGR (%))
Figure 52 Global Ancillary Services Market Forecast, 2023-2033 (US$ Mn, AGR (%))
Figure 53 Global Ancillary Services Market by Region, 2023-2033 (US$ Mn, AGR (%))
Figure 54 Global Active Power Support Market Forecast, 2023-2033 (US$ Mn, AGR (%))
Figure 55 Global Active Power Support Market by Region, 2023-2033 (US$ Mn, AGR (%))
Figure 56 Global Backup Energy for Home Market Forecast, 2023-2033 (US$ Mn, AGR (%))
Figure 57 Global Backup Energy for Home Market by Region, 2023-2033 (US$ Mn, AGR (%))
Figure 58 Global Reactive Power Compensation Market Forecast, 2023-2033 (US$ Mn, AGR (%))
Figure 59 Global Reactive Power Compensation Market by Region, 2023-2033 (US$ Mn, AGR (%))
Figure 60 Global Other Services Market Forecast, 2023-2033 (US$ Mn, AGR (%))
Figure 61 Global Other Services Market by Region, 2023-2033 (US$ Mn, AGR (%))
Figure 62 Global Vehicle to Grid (V2G) Market by Solution, 2023-2033 (US$ Mn, AGR (%))
Figure 63 Global Electric Vehicle Supply Equipment (EVSE) Market Forecast, 2023-2033 (US$ Mn, AGR (%))
Figure 64 Global Electric Vehicle Supply Equipment (EVSE) Market by Region, 2023-2033 (US$ Mn, AGR (%))
Figure 65 Global Power Conversion Equipment (PCE) Market Forecast, 2023-2033 (US$ Mn, AGR (%))
Figure 66 Global Power Conversion Equipment (PCE) Market by Region, 2023-2033 (US$ Mn, AGR (%))
Figure 67 Global V2G Smart Meters Market Forecast, 2023-2033 (US$ Mn, AGR (%))
Figure 68 Global V2G Smart Meters Market by Region, 2023-2033 (US$ Mn, AGR (%))
Figure 69 Global Home Energy Management (HEM) Systems Market Forecast, 2023-2033 (US$ Mn, AGR (%))
Figure 70 Global Home Energy Management (HEM) Systems Market by Region, 2023-2033 (US$ Mn, AGR (%))
Figure 71 Global Dynamic Load Management (DLM) Market Forecast, 2023-2033 (US$ Mn, AGR (%))
Figure 72 Global Dynamic Load Management (DLM) Market by Region, 2023-2033 (US$ Mn, AGR (%))
Figure 73 Global Other Solutions Market Forecast, 2023-2033 (US$ Mn, AGR (%))
Figure 74 Global Other Solutions Market by Region, 2023-2033 (US$ Mn, AGR (%))
Figure 75 North America Vehicle to Grid (V2G) Market by Value, 2023-2033 (US$ Mn, AGR (%))
Figure 76 North America Vehicle to Grid (V2G) Market by Country, 2023-2033 (US$ Mn, AGR (%))
Figure 77 North America Vehicle to Grid (V2G) Market by Charging Type, 2023-2033 (US$ Mn, AGR (%))
Figure 78 North America Vehicle to Grid (V2G) Market by Application, 2023-2033 (US$ Mn, AGR (%))
Figure 79 North America Vehicle to Grid (V2G) Market by Vehicle Type, 2023-2033 (US$ Mn, AGR (%))
Figure 80 North America Vehicle to Grid (V2G) Market by Service, 2023-2033 (US$ Mn, AGR (%))
Figure 81 North America Vehicle to Grid (V2G) Market by Solution, 2023-2033 (US$ Mn, AGR (%))
Figure 82 Canada Market Forecast by Region, 2023-2033 (US$ million)
Figure 83 Canada Market Forecast by Region, 2023-2033 (US$ million)
Figure 84 Europe Vehicle to Grid (V2G) Market by Value, 2023-2033 (US$ Mn, AGR (%))
Figure 85 Europe Vehicle to Grid (V2G) Market by Country, 2023-2033 (US$ Mn, AGR (%))
Figure 86 Europe Vehicle to Grid (V2G) Market by Charging Type, 2023-2033 (US$ Mn, AGR (%))
Figure 87 Europe Vehicle to Grid (V2G) Market by Application, 2023-2033 (US$ Mn, AGR (%))
Figure 88 Europe Vehicle to Grid (V2G) Market by Vehicle Type, 2023-2033 (US$ Mn, AGR (%))
Figure 89 Europe Vehicle to Grid (V2G) Market by Service, 2023-2033 (US$ Mn, AGR (%))
Figure 90 Europe Vehicle to Grid (V2G) Market by Solution, 2023-2033 (US$ Mn, AGR (%))
Figure 91 Germany Market Forecast by Region, 2023-2033 (US$ million)
Figure 92 UK Market Forecast by Region, 2023-2033 (US$ million)
Figure 93 France Market Forecast by Region, 2023-2033 (US$ million)
Figure 94 Italy Market Forecast by Region, 2023-2033 (US$ million)
Figure 95 Italy Market Forecast by Region, 2023-2033 (US$ million)
Figure 96 Rest of Europe Market Forecast by Region, 2023-2033 (US$ million)
Figure 97 Asia-Pacific Vehicle to Grid (V2G) Market by Value, 2023-2033 (US$ Mn, AGR (%))
Figure 98 Asia-Pacific Vehicle to Grid (V2G) Market by Country, 2023-2033 (US$ Mn, AGR (%))
Figure 99 Asia-Pacific Vehicle to Grid (V2G) Market by Charging Type, 2023-2033 (US$ Mn, AGR (%))
Figure 100 Asia-Pacific Vehicle to Grid (V2G) Market by Application, 2023-2033 (US$ Mn, AGR (%))
Figure 101 Asia-Pacific Vehicle to Grid (V2G) Market by Vehicle Type, 2023-2033 (US$ Mn, AGR (%))
Figure 102 Asia-Pacific Vehicle to Grid (V2G) Market by Service, 2023-2033 (US$ Mn, AGR (%))
Figure 103 Asia-Pacific Vehicle to Grid (V2G) Market by Solution, 2023-2033 (US$ Mn, AGR (%))
Figure 104 China Market Forecast by Region, 2023-2033 (US$ million)
Figure 105 India Market Forecast by Region, 2023-2033 (US$ million)
Figure 106 Japan Market Forecast by Region, 2023-2033 (US$ million)
Figure 107 South Korea Market Forecast by Region, 2023-2033 (US$ million)
Figure 108 Australia Market Forecast by Region, 2023-2033 (US$ million)
Figure 109 Rest of Asia-Pacific Market Forecast by Region, 2023-2033 (US$ million)
Figure 110 Middle East & Africa Vehicle to Grid (V2G) Market by Value, 2023-2033 (US$ Mn, AGR (%))
Figure 111 Middle East & Africa Vehicle to Grid (V2G) Market by Country, 2023-2033 (US$ Mn, AGR (%))
Figure 112 Middle East & Africa Vehicle to Grid (V2G) Market by Charging Type, 2023-2033 (US$ Mn, AGR (%))
Figure 113 Middle East & Africa Vehicle to Grid (V2G) Market by Application, 2023-2033 (US$ Mn, AGR (%))
Figure 114 Middle East & Africa Vehicle to Grid (V2G) Market by Vehicle Type, 2023-2033 (US$ Mn, AGR (%))
Figure 115 Middle East & Africa Vehicle to Grid (V2G) Market by Service, 2023-2033 (US$ Mn, AGR (%))
Figure 116 Middle East & Africa Vehicle to Grid (V2G) Market by Solution, 2023-2033 (US$ Mn, AGR (%))
Figure 117 South Africa Market Forecast by Region, 2023-2033 (US$ million)
Figure 118 Saudi Arabia Market Forecast by Region, 2023-2033 (US$ million)
Figure 119 Turkey Market Forecast by Region, 2023-2033 (US$ million)
Figure 120 Rest of Middle East & Africa Market Forecast by Region, 2023-2033 (US$ million)
Figure 121 Latin America Vehicle to Grid (V2G) Market by Value, 2023-2033 (US$ Mn, AGR (%))
Figure 122 Latin America Vehicle to Grid (V2G) Market by Country, 2023-2033 (US$ Mn, AGR (%), CAGR (%))
Figure 123 Latin America Vehicle to Grid (V2G) Market by Charging Type, 2023-2033 (US$ Mn, AGR (%))
Figure 124 Latin America Vehicle to Grid (V2G) Market by Application, 2023-2033 (US$ Mn, AGR (%))
Figure 125 Latin America Vehicle to Grid (V2G) Market by Vehicle Type, 2023-2033 (US$ Mn, AGR (%))
Figure 126 Latin America Vehicle to Grid (V2G) Market by Service, 2023-2033 (US$ Mn, AGR (%))
Figure 127 Latin America Vehicle to Grid (V2G) Market by Solution, 2023-2033 (US$ Mn, AGR (%))
Figure 128 Brazil Market Forecast by Region, 2023-2033 (US$ million)
Figure 129 Mexico Market Forecast by Region, 2023-2033 (US$ million)
Figure 130 Rest of Latin America Market Forecast by Region, 2023-2033 (US$ million)
Figure 131 NextEra Energy: Net Revenue, 2017-2021 (US$ million, AGR%)
Figure 132 NextEra Energy: Gross Profit, 2017-2021 (US$ million, AGR%)
Figure 133 NextEra Energy: Operational Income, 2017-2021 (US$ million, AGR%)
Figure 134 NextEra Energy: EBITDA, 2017-2021 (US$ million, AGR%)
Figure 135 PG&E: Net Revenue, 2017-2021 (US$ million, AGR%)
Figure 136 PG&E: Gross Profit, 2017-2021 (US$ million, AGR%)
Figure 137 PG&E: Operational Income, 2017-2021 (US$ million, AGR%)
Figure 138 PG&E : EBITDA, 2017-2021 (US$ million, AGR%)
Figure 139 Denso Corporation: Net Revenue, 2017-2021 (US$ million, AGR%)
Figure 140 Denso Corporation: Gross Profit, 2017-2021 (US$ million, AGR%)
Figure 141 Denso Corporation: Operational Income, 2017-2021 (US$ million, AGR%)
Figure 142 Denso Corporation: EBITDA, 2017-2021 (US$ million, AGR%)
Figure 143 Engie Group: Net Revenue, 2017-2021 (US$ million, AGR%)
Figure 144 Engie Group: Gross Profit, 2017-2021 (US$ million, AGR%)
Figure 145 Engie Group: Operational Income, 2017-2021 (US$ million, AGR%)
Figure 146 Engie Group: EBITDA, 2017-2021 (US$ million, AGR%)
Figure 147 Hitachi Ltd: Net Revenue, 2017-2021 (US$ million, AGR%)
Figure 148 Hitachi Ltd: Gross Profit, 2017-2021 (US$ million, AGR%)
Figure 149 Hitachi Ltd: Operational Income, 2017-2021 (US$ million, AGR%)
Figure 150 Hitachi Ltd: EBITDA, 2017-2021 (US$ million, AGR%)
Figure 151 Nissan Motor Company Ltd: Net Revenue, 2017-2021 (US$ million, AGR%)
Figure 152 Nissan Motor Company Ltd: Gross Profit, 2017-2021 (US$ million, AGR%)
Figure 153 Nissan Motor Company Ltd: Operational Income, 2017-2021 (US$ million, AGR%)
Figure 154 Nissan Motor Company Ltd: EBITDA, 2017-2021 (US$ million, AGR%)
Figure 155 NRG Energy Inc: Net Revenue, 2017-2021 (US$ million, AGR%)
Figure 156 NRG Energy Inc: Gross Profit, 2017-2021 (US$ million, AGR%)
Figure 157 NRG Energy Inc: Operational Income, 2017-2021 (US$ million, AGR%)
Figure 158 NRG Energy Inc: EBITDA, 2017-2021 (US$ million, AGR%)
Figure 159 Mitsubishi Motors Corporation: Net Revenue, 2017-2021 (US$ million, AGR%)
Figure 160 Mitsubishi Motors Corporation: Gross Profit, 2017-2021 (US$ million, AGR%)
Figure 161 Mitsubishi Motors Corporation: Operational Income, 2017-2021 (US$ million, AGR%)
Figure 162 Mitsubishi Motors Corporation: EBITDA, 2017-2021 (US$ million, AGR%)
ページTOPに戻る
よくあるご質問
Visiongain社はどのような調査会社ですか?
英国の調査会社ヴィジョンゲイン社(Visiongain)は、通信とエネルギーのほか、自動車や化学・医薬品、金属など、広範な市場を対象に調査を行っています。自動車市場については、市場全般に関する調査のほ... もっと見る
調査レポートの納品までの日数はどの程度ですか?
在庫のあるものは速納となりますが、平均的には 3-4日と見て下さい。
但し、一部の調査レポートでは、発注を受けた段階で内容更新をして納品をする場合もあります。
発注をする前のお問合せをお願いします。
注文の手続きはどのようになっていますか?
1)お客様からの御問い合わせをいただきます。
2)見積書やサンプルの提示をいたします。
3)お客様指定、もしくは弊社の発注書をメール添付にて発送してください。
4)データリソース社からレポート発行元の調査会社へ納品手配します。
5) 調査会社からお客様へ納品されます。最近は、pdfにてのメール納品が大半です。
お支払方法の方法はどのようになっていますか?
納品と同時にデータリソース社よりお客様へ請求書(必要に応じて納品書も)を発送いたします。
お客様よりデータリソース社へ(通常は円払い)の御振り込みをお願いします。
請求書は、納品日の日付で発行しますので、翌月最終営業日までの当社指定口座への振込みをお願いします。振込み手数料は御社負担にてお願いします。
お客様の御支払い条件が60日以上の場合は御相談ください。
尚、初めてのお取引先や個人の場合、前払いをお願いすることもあります。ご了承のほど、お願いします。
データリソース社はどのような会社ですか?
当社は、世界各国の主要調査会社・レポート出版社と提携し、世界各国の市場調査レポートや技術動向レポートなどを日本国内の企業・公官庁及び教育研究機関に提供しております。
世界各国の「市場・技術・法規制などの」実情を調査・収集される時には、データリソース社にご相談ください。
お客様の御要望にあったデータや情報を抽出する為のレポート紹介や調査のアドバイスも致します。
|
|

