血漿タンパク質治療薬市場レポート:2022-2032
Plasma Protein Therapeutics Market Report 2022-2032
レポート詳細
血漿タンパク質治療薬市場、2022年~2032年-最新業界動向、研究開発の進展、収益予測に迫る
中低所得国での献血の増加に伴い、需要が増加
世界的な取り組みにより、中低所得国... もっと見る
※上記価格は部署ライセンス(Departmental licence)価格です。
その他の価格についてはデータリソースまでお問合せください。
日本語のページは自動翻訳を利用し作成しています。
実際のレポートは英文のみでご納品いたします。
サマリー
レポート詳細
血漿タンパク質治療薬市場、2022年~2032年-最新業界動向、研究開発の進展、収益予測に迫る
中低所得国での献血の増加に伴い、需要が増加
世界的な取り組みにより、中低所得国での自発的な無報酬献血が増加し、赤血球濃縮製剤のアンメットニーズが満たされていることが指摘されています。一方、高所得国では、赤血球の需要が減少傾向にあり、世界的な経済発展に伴い、この傾向は今後も続くと予想されます。その結果、血漿分画に利用できる回収血漿の量は減少していると思われます。
COVID-19 患者数の増加に対応する業界の能力を妨げる混乱
血漿製品は、提供意思のあるドナー、提供施設、世界中の製造ネットワーク、医薬品の流通ルートなど、綿密に設計された複雑なシステムによって実現されており、通常であれば概ね信頼できるものである。しかし、コロナウイルス感染症が大流行し、状況は複雑化している。このパンデミックは、2020年初頭に始まる血漿調達の十分に発達したバランスのとれたシステムに大きな影響を与え、生命を変えるこれらの医薬品に対する患者の需要拡大に対応する業界の能力を大きく阻害した。
一歩先を行く方法を発見する
220ページを超える本レポートでは、180以上の表とチャート/グラフを提供しています。このレポートでは、業界における最も収益性の高い分野と今後の市場展望を明らかにしています。この新しい調査では、世界市場全体と地域レベルでの売上予測を評価することができます。業績、トレンド、機会、収益予測をご覧ください。血漿蛋白質治療薬市場は成長を続けており、多くの機会が残されています。この機会をどのように生かすかをご覧ください。
2032年までの予測やその他の分析により、商業的な展望が明らかになる
- 2032年までの売上予測に加え、直近の実績、成長率、市場シェアも掲載。
- ビジネスの展望や展開など、独自の分析が見つかります。
- 定性的分析(市場力学、ドライバー、機会、制約、課題を含む)、PEST分析、ポーターの5つの力、SWOT分析、製品プロファイル、商業的発展を発見することができます。
世界市場およびサブマーケットの売上予測をご覧いただけます
製品
- 免疫グロブリン
- アルブミン
- 凝固因子
- C1-エステラーゼ阻害剤(C1-INH)
- その他の製品
用途
- 血友病
- 原発性免疫不全症(PID)
- 特発性血小板減少性紫斑病(ITP)
- 二次性免疫不全症
- 遺伝性血管性浮腫
- その他
地域
- 北米
- 欧州
- アジア太平洋
- ラテンアメリカ
- MEA
世界市場全体とセグメントの収益予測に加え、5地域と20の主要国市場の収益予測も掲載しています。
地域
北米
- 米国
- カナダ
欧州
- ドイツ
- フランス
- 英国
- イタリア
- スペイン
- その他の欧州地域
アジア太平洋
- 中国
- 日本
- インド
- オーストラリア
- 南朝鮮
- その他のアジア太平洋地域
ラテンアメリカ
- ブラジル
- メキシコ
- ラテンアメリカの残りの地域
中東・アフリカ
- GCC
- 南アフリカ
- その他の中東・アフリカ地域
主要企業と市場成長の可能性
血漿タンパク質療薬の世界全体の売上は、2022年に280億米ドルを超えると試算しています。2032年まで収益が大きく伸びると予測しています。当社の調査は、どの組織が最も大きな可能性を持っているかを特定します。彼らの能力、進歩、商業的展望を発見することで、一歩先を行くことができます。
血漿蛋白質治療薬市場のレポートはどのようにあなたを助けるか
220ページを超えるレポートでは、要約すると以下のような知識を得ることができます。
- 血漿蛋白質治療薬市場の2032年までの収益予測。血漿タンパク質治療薬市場の5つのセグメントを予測し、製品および用途のサブセグメントをそれぞれ世界および地域レベルで予測-業界の展望を見出し、投資と収益に最も有利な場所を特定
- 5つの地域と20の主要国市場の2032年までの収益予測-北米、欧州、アジア太平洋、その他の地域の血漿短パン治療薬市場の予測をご覧ください。これらの地域市場は、米国、カナダ、ブラジル、メキシコ、ドイツ、フランス、英国、イタリア、スペイン、中国、インド、日本、オーストラリア、韓国など、著名な経済圏を含む国によってさらに細かく分類されています。
- 血漿タンパク質治療薬市場に関与する9社の企業プロファイルを含む、既存企業および市場参入を目指す企業の展望。本レポートで紹介する企業には、ADMA Biologics Inc.、Bio Products Laboratory Ltd.、Biotest AG、China Biologic Products Holdings Inc.、CSL Behring、Grifols SA、Kedrion SpA、Octapharma USA Inc、Takeda Pharmaceutical Company Ltdなどの著名企業が含まれています。
定量的・定性的な分析と独自の予測をご覧いただけます。私たちのレポートだけが持つ情報を入手し、貴重なビジネスインテリジェンスを得ることができます。
他にはない情報
私たちの新しいレポートタイトルで、知識の遅れを取り戻し、チャンスを逃す可能性が低くなります。私たちの研究が貴社の研究、分析、意思決定にどのように役立つかをご覧ください。Visiongainの研究は、血漿タンパク質治療薬市場や主要企業の商業的分析を必要とするすべての人のためのものです。データ、トレンド、予測をご覧いただけます。
ページTOPに戻る
目次
目次
1.レポートの概要
1.1 血漿タンパク質治療薬市場の紹介
1.2 血漿タンパク質治療薬市場の定義
1.3 本レポートを読むべき理由
1.4 本レポートが提供するもの
1.5 本分析レポートが回答する主な質問には以下が含まれます。
1.6 本レポートは誰のためのものなのか?
1.7 方法論
1.7.1 COVID-19の影響。回復シナリオ
1.7.2 市場評価・予測手法
1.8 よくある質問と回答(FAQ)
1.9 関連するVisiongainレポート
1.10 Visiongainについて
2 エグゼクティブサマリー
2.1 セグメント別分析、2022年
2.2 地域別分析、2022年
3 世界の血漿タンパク質治療薬市場のダイナミクス
3.1 COVID-19が血漿タンパク質治療薬市場に与える影響
3.2 血漿タンパク質治療薬市場の最新動向
3.3 市場の推進要因
3.3.1 平均余命の延長
3.3.2 ゲノム解析による利益と医療費節減の実現
3.3.3 免疫グロブリン(IG)に対する需要の高まり
3.3.4 イノベーションへの投資の増加
3.4 市場の抑制要因
3.4.1 厳しい規制が市場成長の妨げとなる
3.4.2 血漿療法への需要が血漿の供給を上回っていること
3.4.3 認知度の低さ
3.4.4 COVID-19は血漿の需要と供給のギャップを拡大させた
3.5 世界市場における機会
3.5.1 血友病の罹患率の上昇
3.5.2 新興国におけるビジネスチャンス
3.6 ポーターのファイブフォース分析
3.6.1 供給者のバーゲニングパワー
3.6.2 バイヤーのバーゲニングパワー
3.6.3 新規参入の脅威
3.6.4 代替品の脅威
3.6.5 競合他社の競争力
3.7 SWOT分析
3.7.1 強み
3.7.2 弱点
3.7.3 機会
3.7.4 脅威
4 世界の血漿タンパク質治療薬市場分析:製品別
4.1 セグメントの概要
4.2 免疫グロブリン
4.3 アルブミン
4.4 凝固因子
4.5 C1-エステラーゼ阻害剤(C1-INH)
4.6 世界の製品別市場規模の推定と予測
4.6.1 COVID-19前の市場シナリオ
4.6.2 ポストCOVID-19の市場シナリオ(V、U、W、L字回復の分析)
5 世界の血漿タンパク質治療薬市場分析:用途別
5.1 セグメントの概要
5.2 血友病
5.3 原発性免疫不全症(PID)
5.4 特発性血小板減少性紫斑病(ITP)
5.5 二次性免疫不全症
5.6 遺伝性血管性浮腫
5.7 世界の用途別市場規模の推定と予測
5.7.1 COVID-19前の市場シナリオ
5.7.2 ポストCOVID-19市場シナリオ(V、U、W、L字回復分析)
6 地域および主要国の血漿タンパク質治療薬市場予測 2022-2032
6.1 血漿タンパク質治療薬の世界地域別市場予測 2022-2032
6.2 COVID-19の影響回復シナリオ(V,U,W,L)
7 北米の血漿タンパク質治療薬市場
7.1 地域別概要
7.2 北米血漿タンパク質治療薬国別市場予測 2022-2032年
7.3 北米血漿タンパク質治療薬市場の製品別予測
7.4 北米血漿タンパク質治療薬市場の用途別予測
7.5 米国
7.5.1 米国のFDAがテルモ・ブラッド・アンド・セル・テクノロジーズの新血漿採取技術を認可
7.5.2 米国血漿タンパク質治療薬市場収益、2022-2032年
7.6 カナダ
7.6.1 紹介
7.6.2 カナダ血漿タンパク質治療薬市場収益、2022年-2032年
7.7 ポストCOVID-19の国別回復シナリオ
8 欧州の血漿タンパク質治療薬市場
8.1 地域別概要
8.2 欧州血漿蛋白質治療薬国別市場予測 2022-2032年
8.3 欧州血漿蛋白質治療薬市場の製品別予測
8.4 欧州血漿蛋白質治療薬の用途別市場展望
8.5 ドイツ
8.5.1 血漿ドナーは全血ドナーを上回る献血を行う
8.5.2 ドイツ血漿タンパク質治療薬市場収益、2022-2032年
8.6 イギリス
8.6.1 英国の血漿禁止令は解除された
8.6.2 英国血漿タンパク質治療薬市場収益、2022年-2032年
8.7 フランス
8.7.1 治療用血漿を処理・製造するための多用途な政策
8.7.2 フランス血漿タンパク質治療薬市場収益、2022年-2032年
8.8 イタリア
8.8.1 市場分析
8.8.2 イタリア血漿タンパク質治療薬市場収益、2022年-2032年
8.9 スペイン
8.9.1 スペイン血漿タンパク質治療薬市場収益、2022年-2032年
8.10 その他の欧州地域
8.10.1 その他の欧州地域の血漿タンパク質治療薬市場収益、2022年-2032年
8.11 国別ポストCOVID-19回復シナリオ
9 アジア太平洋地域の血漿タンパク質治療薬市場
9.1 地域別概要
9.2 アジア太平洋地域の血漿タンパク質治療薬の国別市場予測 2022-2032年
9.3 アジア太平洋地域の血漿タンパク質治療薬市場:製品別予測
9.4 アジア太平洋地域の血漿タンパク質治療薬市場の用途別予測
9.5 日本血漿タンパク質治療薬市場予測、2022年~2032年
9.5.1 市場分析
9.5.2 日本血漿タンパク質治療薬市場収益、2022年-2032年
9.6 中国血漿タンパク質療薬の市場予測、2022年-2032年
9.6.1 市場分析
9.6.2 中国血漿タンパク質治療薬市場収益、2022年-2032年
9.7 インド血漿蛋白質治療薬の市場予測、2022年-2032年
9.7.1 市場分析
9.7.2 インド血漿タンパク質治療薬市場収益、2022年-2032年
9.8 オーストラリア血漿蛋白質治療薬市場予測、2022年-2032年
9.8.1 オーストラリア血漿タンパク質治療薬市場収益、2022年-2032年
9.9 韓国血漿タンパク質治療薬の市場予測、2022年-2032年
9.9.1 市場分析
9.9.2 韓国血漿タンパク質治療薬市場収益、2022年-2032年
9.10 その他のアジア太平洋地域の血漿タンパク質治療薬市場予測、2022年-2032年
9.10.1 その他のアジア太平洋地域の血漿タンパク質治療薬市場収益、2022年-2032年
9.11 ポストCOVID-19の国別回復シナリオ
10 ラテンアメリカの血漿タンパク質治療薬市場
10.1 地域別概要
10.2 中南米血漿タンパク質治療薬国別市場予測 2022-2032年
10.3 中南米血漿タンパク質治療薬市場の製品別予測
10.4 中南米血漿タンパク質治療薬市場の用途別予測
10.5 ブラジル血漿蛋白質タンパク質治療薬市場予測、2022-2032年
10.5.1 市場分析
10.5.2 ブラジル血漿タンパク質治療薬市場収益、2022年-2032年
10.6 メキシコ血漿タンパク質治療薬市場予測、2022年-2032年
10.6.1 CSLベーリングとグリフォルス、米国国境警備隊のメキシコ血漿提供禁止を上訴へ
10.6.2 メキシコの血漿タンパク質治療薬市場収益、2022年-2032年
10.7 その他のラテンアメリカの血漿タンパク質治療薬市場予測、2022年-2032年
10.7.1 その他ののラテンアメリカの血漿タンパク質治療薬市場収益、2022年-2032年
10.8 ポストCOVID-19の国別回復シナリオ
11 中東・アフリカの血漿タンパク質治療薬市場
11.1 市場の概要
11.2 中東・アフリカの血漿タンパク質治療薬の国別市場予測 2022年-2032年
11.3 中東・アフリカ血漿タンパク質治療薬市場製品別予測
11.4 中東・アフリカ血漿タンパク質治療薬市場:用途別予測
11.5 GCC血漿タンパク質治療薬の市場予測 2022-2032年
11.5.1 GCC血漿タンパク質治療薬の市場収益、2022年-2032年
11.6 南アフリカの血漿タンパク質治療薬市場予測、2022年-2032年
11.6.1 南アフリカの血漿タンパク質治療薬市場収益、2022年-2032年
11.7 その他の中東・アフリカの血漿タンパク質治療薬市場予測、2022年-2032年
11.7.1 その他の中東・アフリカの血漿タンパク質治療薬市場収益、2022年-2032年
11.8 ポストCOVID-19の国別回復シナリオ
12 企業プロフィール
12.1 ADMA Biologics, Inc.
12.1.1 企業スナップショット
12.1.2 会社概要
12.1.3 財務分析
12.1.4 製品ベンチマーク
12.1.5 最新の開発状況
12.2 株式会社バイオプロダクツ研究所
12.2.1 会社概要
12.2.2 会社概要
12.2.3 ベンチマーキング製品
12.2.4 最新の開発状況
12.3 ビオテスト社
12.3.1 企業スナップショット
12.3.2 会社概要
12.3.3 財務分析
12.3.4 製品ベンチマーク
12.3.5 最新の開発状況
12.4 中国生物学製品ホールディングス
12.4.1 企業スナップショット
12.4.2 会社概要
12.4.3 製品ベンチマーク
12.4.4 最新の開発状況
12.5 CSLベーリング
12.5.1 企業スナップショット
12.5.2 会社概要
12.5.3 財務分析
12.5.4 製品ベンチマーク
12.5.5 最新の開発状況
12.6 グリフォルスSA
12.6.1 企業スナップショット
12.6.2 会社概要
12.6.3 財務分析
12.6.4 製品ベンチマーク
12.6.5 最新の開発状況
12.7 ケドリオンSPA
12.7.1 会社概要
12.7.2 会社概要
12.7.3 財務分析
12.7.4 製品ベンチマーク
12.8 オクタファーマAG
12.8.1 企業スナップショット
12.8.2 会社概要
12.8.3 ベンチマーキング
12.8.4 最新の開発状況
12.9 武田薬品工業株式会社
12.9.1 会社概要
12.9.2 会社概要
12.9.3 財務分析
12.9.4 ベンチマーキング
12.9.5 最新の開発状況
13 結論と提言
13.1 結論
13.2 提言
表の一覧
Table 1 Global Plasma Protein Therapeutics Market Snapshot, 2022 & 2032 (US$ billion, CAGR %)
Table 2 Global Plasma Protein Therapeutics Market Forecast by Product, 2022-2032 (US$ mn, AGR%, CAGR%)
Table 3 Global Plasma Protein Therapeutics Market Forecast by Product, 2022-2032 (US$ mn, AGR%, CAGR%): "V" Shaped Recovery
Table 4 Global Plasma Protein Therapeutics Market Forecast by Product, 2022-2032 (US$ mn, AGR%, CAGR%): "U" Shaped Recovery
Table 5 Global Plasma Protein Therapeutics Market Forecast by Product, 2022-2032 (US$ mn, AGR%, CAGR%): "W" Shaped Recovery
Table 6 Global Plasma Protein Therapeutics Market Forecast by Product, 2022-2032 (US$ mn, AGR%, CAGR%): "L" Shaped Recovery
Table 7 Global Plasma Protein Therapeutics Market Forecast by Application, 2022-2032 (US$ mn, AGR%, CAGR%)
Table 8 Global Plasma Protein Therapeutics Market Forecast by Application, 2022-2032 (US$ mn, AGR%, CAGR%): "V" Shaped Recovery
Table 9 Global Plasma Protein Therapeutics Market Forecast by Application, 2022-2032 (US$ mn, AGR%, CAGR%): "U" Shaped Recovery
Table 10 Global Plasma Protein Therapeutics Market Forecast by Application, 2022-2032 (US$ mn, AGR%, CAGR%): "W" Shaped Recovery
Table 11 Global Plasma Protein Therapeutics Market Forecast by Application, 2022-2032 (US$ mn, AGR%, CAGR%): "L" Shaped Recovery
Table 12 Global Plasma Protein Therapeutics Market Forecast by Region, 2022-2032 (US$ mn, AGR%, CAGR%)
Table 13 Global Plasma Protein Therapeutics Market Forecast by Region, 2022-2032 (US$ mn, AGR%, CAGR%): "V" Shaped Recovery
Table 14 Global Plasma Protein Therapeutics Market Forecast by Region, 2022-2032 (US$ mn, AGR%, CAGR%): "U" Shaped Recovery
Table 15 Global Plasma Protein Therapeutics Market Forecast by Region, 2022-2032 (US$ mn, AGR%, CAGR%): "W" Shaped Recovery
Table 16 Global Plasma Protein Therapeutics Market Forecast by Region, 2022-2032 (US$ mn, AGR%, CAGR%): "L" Shaped Recovery
Table 17 North America Plasma Protein Therapeutics Market Forecast by Country, 2022-2032 (US$ mn, AGR%, CAGR%)
Table 18 North America Plasma Protein Therapeutics Market Forecast by Product, 2022-2032 (US$ mn, AGR%, CAGR%)
Table 19 North America Plasma Protein Therapeutics Market Forecast by Application, 2022-2032 (US$ mn, AGR%, CAGR%)
Table 20 U.S. Plasma Protein Therapeutics Market Forecast, 2022-2032 (US$ mn, AGR%, CAGR%)
Table 21 Canada Plasma Protein Therapeutics Market Forecast, 2022-2032 (US$ mn, AGR%, CAGR%)
Table 22 North America Plasma Protein Therapeutics Market Forecast by Country, 2022-2032 (US$ mn, AGR%, CAGR%): "V" Shaped Recovery
Table 23 North America Plasma Protein Therapeutics Market Forecast by Country, 2022-2032 (US$ mn, AGR%, CAGR%): "U" Shaped Recovery
Table 24 North America Plasma Protein Therapeutics Market Forecast by Country, 2022-2032 (US$ mn, AGR%, CAGR%): "W" Shaped Recovery
Table 25 North America Plasma Protein Therapeutics Market Forecast by Country, 2022-2032 (US$ mn, AGR%, CAGR%): "L" Shaped Recovery
Table 26 Europe Plasma Protein Therapeutics Market Forecast by Country, 2022-2032 (US$ mn, AGR%, CAGR%)
Table 27 Europe Plasma Protein Therapeutics Market Forecast by Product, 2022-2032 (US$ mn, AGR%, CAGR%)
Table 28 Europe Plasma Protein Therapeutics Market Forecast by Application, 2022-2032 (US$ mn, AGR%, CAGR%)
Table 29 Germany Plasma Protein Therapeutics Market Forecast, 2022-2032 (US$ mn, AGR%, CAGR%)
Table 30 UK Plasma Protein Therapeutics Market Forecast, 2022-2032 (US$ mn, AGR%, CAGR%)
Table 31 France Plasma Protein Therapeutics Market Forecast, 2022-2032 (US$ mn, AGR%, CAGR%)
Table 32 Italy Plasma Protein Therapeutics Market Forecast, 2022-2032 (US$ mn, AGR%, CAGR%)
Table 33 Spain Plasma Protein Therapeutics Market Forecast, 2022-2032 (US$ mn, AGR%, CAGR%)
Table 34 Rest of Europe Plasma Protein Therapeutics Market Forecast, 2022-2032 (US$ mn, AGR%, CAGR%)
Table 35 Europe Plasma Protein Therapeutics Market Forecast by Country, 2022-2032 (US$ mn, AGR%, CAGR%): "V" Shaped Recovery
Table 36 Europe Plasma Protein Therapeutics Market Forecast by Country, 2022-2032 (US$ mn, AGR%, CAGR%): "U" Shaped Recovery
Table 37 Europe Plasma Protein Therapeutics Market Forecast by Country, 2022-2032 (US$ mn, AGR%, CAGR%): "W" Shaped Recovery
Table 38 Europe Plasma Protein Therapeutics Market Forecast by Country, 2022-2032 (US$ mn, AGR%, CAGR%): "L" Shaped Recovery
Table 39 Asia Pacific Plasma Protein Therapeutics Market Forecast by Country, 2022-2032 (US$ mn, AGR%, CAGR%)
Table 40 Asia Pacific Plasma Protein Therapeutics Market Forecast by Product, 2022-2032 (US$ mn, AGR%, CAGR%)
Table 41 Asia Pacific Plasma Protein Therapeutics Market Forecast by Application, 2022-2032 (US$ mn, AGR%, CAGR%)
Table 42 Japan Plasma Protein Therapeutics Market Forecast, 2022-2032 (US$ mn, AGR%, CAGR%)
Table 43 China Plasma Protein Therapeutics Market Forecast, 2022-2032 (US$ mn, AGR%, CAGR%)
Table 44 India Plasma Protein Therapeutics Market Forecast, 2022-2032 (US$ mn, AGR%, CAGR%)
Table 45 Australia Plasma Protein Therapeutics Market Forecast, 2022-2032 (US$ mn, AGR%, CAGR%)
Table 46 South Korea Plasma Protein Therapeutics Market Forecast, 2022-2032 (US$ mn, AGR%, CAGR%)
Table 47 Rest of Asia Pacific Plasma Protein Therapeutics Market Forecast, 2022-2032 (US$ mn, AGR%, CAGR%)
Table 48 Asia Pacific Plasma Protein Therapeutics Market Forecast by Country, 2022-2032 (US$ mn, AGR%, CAGR%): "V" Shaped Recovery
Table 49 Asia Pacific Plasma Protein Therapeutics Market Forecast by Country, 2022-2032 (US$ mn, AGR%, CAGR%): "U" Shaped Recovery
Table 50 Asia Pacific Plasma Protein Therapeutics Market Forecast by Country, 2022-2032 (US$ mn, AGR%, CAGR%): "W" Shaped Recovery
Table 51 Asia Pacific Plasma Protein Therapeutics Market Forecast by Country, 2022-2032 (US$ mn, AGR%, CAGR%): "L" Shaped Recovery
Table 52 Latin America Plasma Protein Therapeutics Market Forecast by Country, 2022-2032 (US$ mn, AGR%, CAGR%)
Table 53 Latin America Plasma Protein Therapeutics Market Forecast by Product, 2022-2032 (US$ mn, AGR%, CAGR%)
Table 54 Latin America Plasma Protein Therapeutics Market Forecast by Application, 2022-2032 (US$ mn, AGR%, CAGR%)
Table 55 Brazil Plasma Protein Therapeutics Market Forecast, 2022-2032 (US$ mn, AGR%, CAGR%)
Table 56 Mexico Plasma Protein Therapeutics Market Forecast, 2022-2032 (US$ mn, AGR%, CAGR%)
Table 57 Rest of Latin America Plasma Protein Therapeutics Market Forecast, 2022-2032 (US$ mn, AGR%, CAGR%)
Table 58 Latin America Plasma Protein Therapeutics Market Forecast by Country, 2022-2032 (US$ mn, AGR%, CAGR%): "V" Shaped Recovery
Table 59 Latin America Plasma Protein Therapeutics Market Forecast by Country, 2022-2032 (US$ mn, AGR%, CAGR%): "U" Shaped Recovery
Table 60 Latin America Plasma Protein Therapeutics Market Forecast by Country, 2022-2032 (US$ mn, AGR%, CAGR%): "W" Shaped Recovery
Table 61 Latin America Plasma Protein Therapeutics Market Forecast by Country, 2022-2032 (US$ mn, AGR%, CAGR%): "L" Shaped Recovery
Table 62 MEA Plasma Protein Therapeutics Market Forecast by Country, 2022-2032 (US$ mn, AGR%, CAGR%)
Table 63 MEA Plasma Protein Therapeutics Market Forecast by Product, 2022-2032 (US$ mn, AGR%, CAGR%)
Table 64 MEA Plasma Protein Therapeutics Market Forecast by Application, 2022-2032 (US$ mn, AGR%, CAGR%)
Table 65 GCC Plasma Protein Therapeutics Market Forecast, 2022-2032 (US$ mn, AGR%, CAGR%)
Table 66 South Africa Plasma Protein Therapeutics Market Forecast, 2022-2032 (US$ mn, AGR%, CAGR%)
Table 67 Rest of MEA Plasma Protein Therapeutics Market Forecast, 2022-2032 (US$ mn, AGR%, CAGR%)
Table 68 MEA Plasma Protein Therapeutics Market Forecast by Country, 2022-2032 (US$ mn, AGR%, CAGR%): "V" Shaped Recovery
Table 69 MEA Plasma Protein Therapeutics Market Forecast by Country, 2022-2032 (US$ mn, AGR%, CAGR%): "U" Shaped Recovery
Table 70 MEA Plasma Protein Therapeutics Market Forecast by Country, 2022-2032 (US$ mn, AGR%, CAGR%): "W" Shaped Recovery
Table 71 MEA Plasma Protein Therapeutics Market Forecast by Country, 2022-2032 (US$ mn, AGR%, CAGR%): "L" Shaped Recovery
Table 72 ADMA Biologics, Inc.: Key Details, (CEO, HQ, Revenue, Founded, No. of Employees, Company Type, Website, Business Segment)
Table 73 ADMA Biologics Inc.: Product Benchmarking
Table 74 ADMA Biologics, Inc.: Recent Developments
Table 75 Bio Products Laboratory Ltd.: Key Details, (CEO, HQ, Founded, No. of Employees, Company Type, Website, Business Segment)
Table 76 Bio Products Laboratory Ltd.: Product Benchmarking
Table 77 Bio Products Laboratory Ltd.: Recent Developments
Table 78 Biotest AG: Key Details, (CEO, HQ, Revenue, Founded, No. of Employees, Company Type, Website, Business Segment)
Table 79 Biotest AG: Product Benchmarking
Table 80 Biotest AG: Recent Developments
Table 81 China Biologic Products Holdings Inc.: Key Details, (CEO, HQ, Founded, No. of Employees, Company Type, Website, Business Segment)
Table 82 China Biologic Products Holdings Inc.: Product Benchmarking
Table 83 China Biologic Products Holdings Inc.: Recent Developments
Table 84 CSL Behring: Key Details, (CEO, HQ, Revenue, Founded, No. of Employees, Company Type, Website, Business Segment)
Table 85 CSL Behring: Product Benchmarking
Table 86 CSL Behring: Recent Developments
Table 87 Grifols SA: Key Details, (CEO, HQ, Revenue, Founded, No. of Employees, Company Type, Website, Business Segment)
Table 88 Grifols SA: Product Benchmarking
Table 89 Grifols SA: Recent Developments
Table 90 Kedrion SpA: Key Details, (CEO, HQ, Revenue, Founded, No. of Employees, Company Type, Website, Business Segment)
Table 91 Kedrion SpA: Product Benchmarking
Table 92 Octapharma AG: Key Details, (CEO, HQ, Founded, No. of Employees, Company Type, Website, Business Segment)
Table 93 Octapharma AG: Product Benchmarking
Table 94 Octapharma AG: Recent Developments
Table 95 Takeda Pharmaceutical Company Ltd: Key Details, (CEO, HQ, Revenue, Founded, No. of Employees, Company Type, Website, Business Segment)
Table 96 Takeda Pharmaceutical Company Ltd: Product Benchmarking
Table 97 Takeda Pharmaceutical Company Ltd: Recent Developments
図の一覧
Figure 1 Global Plasma Protein Therapeutics Market: Market Segmentation
Figure 2 Global Plasma Protein Therapeutics Market Trends
Figure 3 Global Plasma Protein Therapeutics Market: Porter’s Five Forces
Figure 4 Global Plasma Protein Therapeutics Market: SWOT Analysis
Figure 5 Global Plasma Protein Therapeutics Market Share Forecast by Product: 2022, 2027, 2032 (%)
Figure 6 Global Plasma Protein Therapeutics Market Forecast by Product, 2022-2032 (US$ million, AGR %)
Figure 7 Global Plasma Protein Therapeutics Market Forecast by Product, 2022-2032 (US$ million, AGR %): “V” Shaped Recovery
Figure 8 Global Plasma Protein Therapeutics Market Forecast by Product, 2022-2032 (US$ million, AGR %): “U” Shaped Recovery
Figure 9 Global Plasma Protein Therapeutics Market Forecast by Product, 2022-2032 (US$ million, AGR %): “W” Shaped Recovery
Figure 10 Global Plasma Protein Therapeutics Market Forecast by Product, 2022-2032 (US$ million, AGR %): “L” Shaped Recovery
Figure 11 Global Plasma Protein Therapeutics Market Share Forecast by Applications: 2022, 2027, 2032 (%)
Figure 12 Global Plasma Protein Therapeutics Market Forecast by Applications, 2022-2032 (US$ million, AGR %)
Figure 13 Global Plasma Protein Therapeutics Market Forecast by Applications, 2022-2032 (US$ million, AGR %): “V” Shaped Recovery
Figure 14 Global Plasma Protein Therapeutics Market Forecast by Applications, 2022-2032 (US$ million, AGR %): “U” Shaped Recovery
Figure 15 Global Plasma Protein Therapeutics Market Forecast by Applications, 2022-2032 (US$ million, AGR %): “W” Shaped Recovery
Figure 16 Global Plasma Protein Therapeutics Market Forecast by Applications, 2022-2032 (US$ million, AGR %): “L” Shaped Recovery
Figure 17 Global Plasma Protein Therapeutics Market Forecast by Region 2022-2032 (US$ million)
Figure 18 Global Plasma Protein Therapeutics Market Share Forecast by Region 2022, 2027, 2032 (%)
Figure 19 Global Plasma Protein Therapeutics Market Forecast, 2022-2032 (US$ million, AGR%): “V” Shaped Recovery
Figure 20 Global Plasma Protein Therapeutics Market Forecast, 2022-2032 (US$ million, AGR %): “U” Shaped Recovery
Figure 21 Global Plasma Protein Therapeutics Market Forecast, 2022-2032 (US$ million, AGR%): “W” Shaped Recovery
Figure 22 Global Plasma Protein Therapeutics Market Forecast, 2022-2032 (US$ million, AGR%): “L” Shaped Recovery
Figure 23 North America Plasma Protein Therapeutics Market Forecast by Country 2022-2032 (US$ million)
Figure 24 North America Plasma Protein Therapeutics Market Share Forecast by Country 2022, 2027, 2032 (%)
Figure 25 North America Plasma Protein Therapeutics Market Forecast by Product, 2022-2032 (US$ million)
Figure 26 North America Plasma Protein Therapeutics Market Forecast by Applications, 2022-2032 (US$ million)
Figure 27 U.S. Plasma Protein Therapeutics Market Forecast, 2022-2032 (US$ million, AGR %)
Figure 28 Canada Plasma Protein Therapeutics Market Forecast, 2022-2032 (US$ million, AGR %)
Figure 29 North America Plasma Protein Therapeutics Market Forecast by Country, 2022-2032 (US$ million, AGR %): “V” Shaped Recovery
Figure 30 North America Plasma Protein Therapeutics Market Forecast by Country, 2022-2032 (US$ million, AGR %): “U” Shaped Recovery
Figure 31 North America Plasma Protein Therapeutics Market Forecast by Country, 2022-2032 (US$ million, AGR %): “W” Shaped Recovery
Figure 32 North America Plasma Protein Therapeutics Market Forecast by Country, 2022-2032 (US$ million, AGR %): “L” Shaped Recovery
Figure 33 Europe Plasma Protein Therapeutics Market Forecast by Country 2022-2032 (US$ million)
Figure 34 Europe Plasma Protein Therapeutics Market Share Forecast by Country 2022, 2027, 2032 (%)
Figure 35 Europe Plasma Protein Therapeutics Market Forecast by Product, 2022-2032 (US$ million, AGR%)
Figure 36 Europe Plasma Protein Therapeutics Market Forecast by Applications, 2022-2032 (US$ million, AGR%)
Figure 37 Germany Plasma Protein Therapeutics Market Forecast, 2022-2032 (US$ million, AGR %)
Figure 38 UK Plasma Protein Therapeutics Market Forecast, 2022-2032 (US$ million, AGR %)
Figure 39 France Plasma Protein Therapeutics Market Forecast, 2022-2032 (US$ million, AGR %)
Figure 40 Italy Plasma Protein Therapeutics Market Forecast, 2022-2032 (US$ million, AGR %)
Figure 41 Spain Plasma Protein Therapeutics Market Forecast, 2022-2032 (US$ million, AGR %)
Figure 42 Rest of Europe Plasma Protein Therapeutics Market Forecast, 2022-2032 (US$ million, AGR %)
Figure 43 Europe Plasma Protein Therapeutics Market Forecast by Country, 2022-2032 (US$ million, AGR %): “V” Shaped Recovery
Figure 44 Europe Plasma Protein Therapeutics Market Forecast by Country, 2022-2032 (US$ million, AGR %): “U” Shaped Recovery
Figure 45 Europe Plasma Protein Therapeutics Market Forecast by Country, 2022-2032 (US$ million, AGR %): “W” Shaped Recovery
Figure 46 Europe Plasma Protein Therapeutics Market Forecast by Country, 2022-2032 (US$ million, AGR %): “L” Shaped Recovery
Figure 47 Asia Pacific Plasma Protein Therapeutics Market Forecast by Country 2022-2032 (US$ million)
Figure 48 Asia Pacific Plasma Protein Therapeutics Market Share Forecast by Country 2022, 2027, 2032 (%)
Figure 49 Asia Pacific Plasma Protein Therapeutics Market Forecast by Product, 2022-2032 (US$ million)
Figure 50 Asia Pacific Plasma Protein Therapeutics Market Forecast by Applications, 2022-2032 (US$ million, AGR%)
Figure 51 Japan Plasma Protein Therapeutics Market Forecast, 2022-2032 (US$ million, AGR %)
Figure 52 China Plasma Protein Therapeutics Market Forecast, 2022-2032 (US$ million, AGR %)
Figure 53 India Plasma Protein Therapeutics Market Forecast, 2022-2032 (US$ million, AGR %)
Figure 54 Australia Plasma Protein Therapeutics Market Forecast, 2022-2032 (US$ million, AGR %)
Figure 55 South Korea Plasma Protein Therapeutics Market Forecast, 2022-2032 (US$ million, AGR %)
Figure 56 Rest of Asia Pacific Plasma Protein Therapeutics Market Forecast, 2022-2032 (US$ million, AGR %)
Figure 57 Asia Pacific Plasma Protein Therapeutics Market Forecast by Country, 2022-2032 (US$ million, AGR %): “V” Shaped Recovery
Figure 58 Asia Pacific Plasma Protein Therapeutics Market Forecast by Country, 2022-2032 (US$ million, AGR %): “U” Shaped Recovery
Figure 59 Asia Pacific Plasma Protein Therapeutics Market Forecast by Country, 2022-2032 (US$ million, AGR %): “W” Shaped Recovery
Figure 60 Asia Pacific Plasma Protein Therapeutics Market Forecast by Country, 2022-2032 (US$ million, AGR %): “L” Shaped Recovery
Figure 61 Latin America Plasma Protein Therapeutics Market Forecast by Country 2022-2032 (US$ million)
Figure 62 Latin America Plasma Protein Therapeutics Market Share Forecast by Country 2022, 2027, 2032 (%)
Figure 63 Latin America Plasma Protein Therapeutics Market Forecast by Product, 2022-2032 (US$ million, AGR%)
Figure 64 Latin America Plasma Protein Therapeutics Market Forecast by Applications, 2022-2032 (US$ million, AGR%)
Figure 65 Brazil Plasma Protein Therapeutics Market Forecast, 2022-2032 (US$ million, AGR %)
Figure 66 Mexico Plasma Protein Therapeutics Market Forecast, 2022-2032 (US$ million, AGR %)
Figure 67 Rest of Latin America Plasma Protein Therapeutics Market Forecast, 2022-2032 (US$ million, AGR %)
Figure 68 Latin America Plasma Protein Therapeutics Market Forecast by Country, 2022-2032 (US$ million, AGR %): “V” Shaped Recovery
Figure 69 Latin America Plasma Protein Therapeutics Market Forecast by Country, 2022-2032 (US$ million, AGR %): “U” Shaped Recovery
Figure 70 Latin America Plasma Protein Therapeutics Market Forecast by Country, 2022-2032 (US$ million, AGR %): “W” Shaped Recovery
Figure 71 Latin America Plasma Protein Therapeutics Market Forecast by Country, 2022-2032 (US$ million, AGR %): “L” Shaped Recovery
Figure 72 Middle East and Africa Plasma Protein Therapeutics Market Forecast by Country 2022-2032 (US$ million)
Figure 73 Middle East and Africa Plasma Protein Therapeutics Market Share Forecast by Country 2022, 2027, 2032 (%)
Figure 74 Middle East and Africa Plasma Protein Therapeutics Market Forecast by Product, 2022-2032 (US$ million, AGR%)
Figure 75 Middle East and Africa Plasma Protein Therapeutics Market Forecast by Applications, 2022-2032 (US$ million, AGR%)
Figure 76 GCC Plasma Protein Therapeutics Market Forecast, 2022-2032 (US$ million, AGR %)
Figure 77 South Africa Plasma Protein Therapeutics Market Forecast, 2022-2032 (US$ million, AGR %)
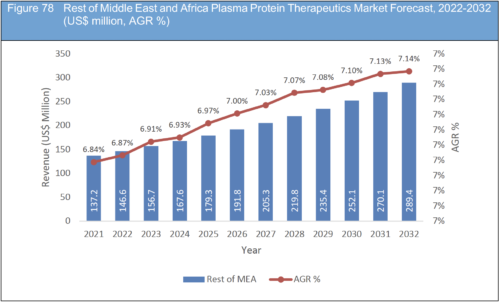
Figure 78 Rest of Middle East and Africa Plasma Protein Therapeutics Market Forecast, 2022-2032 (US$ million, AGR %)
Figure 79 MEA Plasma Protein Therapeutics Market Forecast by Country, 2022-2032 (US$ million, AGR %): “V” Shaped Recovery
Figure 80 MEA Plasma Protein Therapeutics Market Forecast by Country, 2022-2032 (US$ million, AGR %): “U” Shaped Recovery
Figure 81 MEA Plasma Protein Therapeutics Market Forecast by Country, 2022-2032 (US$ million, AGR %): “W” Shaped Recovery
Figure 82 MEA Plasma Protein Therapeutics Market Forecast by Country, 2022-2032 (US$ million, AGR %): “L” Shaped Recovery
Figure 83 ADMA Biologics, Inc.: Net Revenue, 2015-2021 (US$ million, AGR%)
Figure 84 ADMA Biologics, Inc.: R&D Expenses, 2015-2021 (US$ million, AGR%)
Figure 85 ADMA Biologics, Inc.: Gross Profit, 2015-2021 (US$ million, AGR%)
Figure 86 Biotest AG: Net Revenue, 2015-2021 (US$ million, AGR%)
Figure 87 CSL Behring: Net Revenue, 2015-2021 (US$ million, AGR%)
Figure 88 CSL Behring: R&D Expenses, 2015-2021 (US$ million, AGR%)
Figure 89 CSL Behring: Gross Profit, 2015-2021 (US$ million, AGR%)
Figure 90 Grifols SA: Net Revenue, 2015-2021 (US$ million, AGR%)
Figure 91 Grifols SA: R&D Expenses, 2015-2021 (US$ million, AGR%)
Figure 92 Grifols SA: Gross Profit, 2015-2021 (US$ million, AGR%)
Figure 93 Kedrion SpA: Net Revenue, 2018-2020 (US$ million, AGR%)
Figure 94 Kedrion SpA: R&D Expenses, 2018-2020 (US$ million, AGR%)
Figure 95 Kedrion SpA: Gross Profit, 2018-2020 (US$ million, AGR%)
Figure 96 Takeda Pharmaceutical Company Ltd: Net Revenue, 2015-2021 (US$ million, AGR%)
Figure 97 Takeda Pharmaceutical Company Ltd: R&D Expenses, 2015-2021 (US$ million, AGR%)
Figure 98 Takeda Pharmaceutical Company Ltd: Gross Profit, 2015-2021 (US$ million, AGR%)
ページTOPに戻る
Summary
この調査レポートは世界の血漿タンパク質治療薬市場を調査し、製品別、用途別、地域別に2022年から2032年までの予測結果を掲載しています。また関連企業情報を提供しています。
主な掲載内容(目次より抜粋)
-
レポート概要
-
エグゼクティブサマリー
-
市場のダイナミックス
-
世界の血漿タンパク質治療薬市場分析:製品別
-
世界の血漿タンパク質治療薬市場分析:用途別
-
血漿タンパク質治療薬市場予測 :地域別・主要国別 2022-2032年
-
北米の血漿タンパク質治療薬市場
-
欧州の血漿タンパク質治療薬市場
-
アジア太平洋地域の血漿タンパク質治療薬市場
-
ラテンアメリカの血漿タンパク質治療薬市場
-
中東・アフリカの血漿タンパク質治療薬市場
-
主要企業のプロフィール
Report Details
Plasma Protein Therapeutics Market, 2022 to 2032- our new study reveals the latest industry trends, R&D progress, and predicted revenues
Increase of Blood Donations to Fuel Demand Across Low and Middle Income Countries
Due to the worldwide initiatives, a rise in voluntary, unpaid blood donations from low- and middle-income countries has been noted to fulfil the unmet need for red blood cell concentrates. In high-income nations, however, demand for red blood cells has been steadily declining, and with global economic advancements, this trend is anticipated to continue. As a result, it seems that the quantity of recovered plasma accessible for plasma fractionation is diminishing.
COVID-19 Disruption Hampering the Industry’s Ability to Keep Pace with Growing Patient Pool
Plasma products are made possible by a meticulously designed, complicated system of willing donors, donation facilities, worldwide manufacturing networks, and pharmaceutical product distribution routes, which is generally reliable under normal conditions. The situation has become complicated with the outbreak of the coronavirus disease pandemic. The pandemic had a substantial influence on the well-developed and balanced system of plasma procurement beginning in early 2020, greatly impeding the industry’s capacity to keep up with expanding patient demand for these life-changing medications.
Discover how to stay ahead
Our 220+ page report provides 180+ tables and charts/graphs. Read on to discover the most lucrative areas in the industry and the future market prospects. Our new study lets you assess forecasted sales at the overall world market and regional level. See financial results, trends, opportunities, and revenue predictions. Much opportunity remains in this growing Plasma Protein Therapeutics Market. See how to exploit the opportunities.
Forecasts to 2032 and other analyses reveal the commercial prospects
• In addition to revenue forecasting to 2032, our new study provides you with recent results, growth rates, and market shares.
• You find original analyses, with business outlooks and developments.
• Discover qualitative analyses (including market dynamics, drivers, opportunities, restraints, and challenges), PEST Analysis, Porter’s Five Forces, SWOT Analysis, product profiles, and commercial developments.
Discover sales predictions for the world market and sub-markets
Product
• Immunoglobulins
• Albumin
• Coagulation Factors
• C1-Esterase Inhibitor (C1-INH)
• Other Products
Applications
• Hemophilia
• Primary Immunodeficiency Disorder (PID)
• Idiopathic Thrombocytopenic Purpura (ITP)
• Secondary Immunodeficiency
• Hereditary Angioedema
• Others
Region
• North America
• Europe
• Asia Pacific
• Latin America
• MEA
In addition to the revenue predictions for the overall world market and segments, you will also find revenue forecasts for 5 regional and 20 leading national markets:
By Region
North America
• U.S.
• Canada
Europe
• Germany
• France
• UK
• Italy
• Spain
• Rest of Europe
Asia Pacific
• China
• Japan
• India
• Australia
• South Korea
• Rest of Asia Pacific
Latin America
• Brazil
• Mexico
• Rest of Latin America
Middle East & Africa
• GCC
• South Africa
• Rest of Middle East & Africa
Leading companies and the potential for market growth
Overall world revenue for Plasma Protein Therapeutics Market will surpass US$28 billion in 2022, our work calculates. We predict strong revenue growth through 2032. Our work identifies which organizations hold the greatest potential. Discover their capabilities, progress, and commercial prospects, helping you stay ahead.
How the Plasma Protein Therapeutics Market report helps you
In summary, our 220+ page report provides you with the following knowledge:
• Revenue forecasts to 2032 for Plasma Protein Therapeutics Market, with forecasts for 5 segmentations of the plasma protein therapeutics market, with forecasts for product and applications sub-segments each forecasted at a global and regional level– discover the industry’s prospects, finding the most lucrative places for investments and revenues
• Revenue forecasts to 2032 for five regional and 20 key national markets– See forecasts for the Plasma Protein Therapeutics Market in North America, Europe, Asia Pacific, and Rest of the World. These regional markets have been further bifurcated by countries including the US, Canada, Brazil, Mexico, Germany, France, UK, Italy, Spain, China, India, Japan, Australia, South Korea, among other prominent economies.
• Prospects for established firms and those seeking to enter the market– including company profiles for 9 of the companies involved in the Plasma Protein Therapeutics Market. Some of the companies profiled in this report include ADMA Biologics Inc., Bio Products Laboratory Ltd., Biotest AG, China Biologic Products Holdings Inc., CSL Behring, Grifols SA, Kedrion SpA, Octapharma USA Inc., and Takeda Pharmaceutical Company Ltd, among other prominent players.
Find quantitative and qualitative analyses with independent predictions. Receive information that only our report contains, staying informed with this invaluable business intelligence.
Information found nowhere else
With our newly report title, you are less likely to fall behind in knowledge or miss out on opportunities. See how our work could benefit your research, analyses, and decisions. Visiongain’s study is for everybody needing commercial analyses for the Plasma Protein Therapeutics Market and leading companies. You will find data, trends, and predictions.
ページTOPに戻る
Table of Contents
Table of Contents
1. Report Overview
1.1 Introduction to Plasma Protein Therapeutics Market
1.2 Plasma Protein Therapeutics Market Definition
1.3 Why You Should Read This Report
1.4 What This Report Delivers
1.5 Key Questions Answered by this Analytical Report Include:
1.6 Who is This Report For?
1.7 Methodology
1.7.1 COVID-19 Impact: Recovery Scenarios
1.7.2 Market Evaluation & Forecasting Methodology
1.8 Frequently Asked Questions (FAQs)
1.9 Associated Visiongain Reports
1.10 About Visiongain
2 Executive Summary
2.1 Segmental Analysis, 2022
2.2 Regional Analysis, 2022
3 Global Plasma Protein Therapeutics Market Dynamics
3.1 COVID-19 Impact on the Plasma Protein Therapeutics Market
3.2 Current Trends in the Plasma Protein Therapeutics Market
3.3 Market Driving Factors
3.3.1 Increase Life Expectancy
3.3.2 Provides Genomic Gains and Healthcare Savings
3.3.3 Rising Demand for Immunoglobulins (IG)
3.3.4 Growing Investments in Innovation
3.4 Market Restraining Factors
3.4.1 Stringent Regulations to Hamper Market Growth
3.4.2 Demand for Plasma Therapies Outpacing Supply of Plasma
3.4.3 Lack of Awareness
3.4.4 COVID-19 Has Expanded the Gap Between Plasma Supply and Demand
3.5 Opportunities in the Global Market
3.5.1 Rising Incidence of Haemophilia
3.5.2 Opportunities in Emerging Economies
3.6 Porter’s Five Forces Analysis
3.6.1 Bargaining Power of Suppliers
3.6.2 Bargaining Power of Buyers
3.6.3 Threat of New Entrants
3.6.4 Threat of Substitutes
3.6.5 Competitive Rivalry
3.7 SWOT Analysis
3.7.1 Strengths
3.7.2 Weaknesses
3.7.3 Opportunities
3.7.4 Threats
4 Global Plasma Protein Therapeutics Market Analysis by Product
4.1 Segment Overview
4.2 Immunoglobulins
4.3 Albumin
4.4 Coagulation Factors
4.5 C1-Esterase Inhibitor (C1-INH)
4.6 Global Market Size Estimation and Forecast by Product
4.6.1 Pre-COVID-19 Market Scenario
4.6.2 Post-COVID-19 Market Scenarios (V, U, W, L Shaped Recovery Analysis
5 Global Plasma Protein Therapeutics Market Analysis by Applications
5.1 Segment Overview
5.2 Hemophilia
5.3 Primary Immunodeficiency Disorder (PID)
5.4 Idiopathic Thrombocytopenic Purpura (ITP)
5.5 Secondary Immunodeficiency
5.6 Hereditary Angioedema
5.7 Global Market Size Estimation and Forecast by Applications
5.7.1 Pre-COVID-19 Market Scenario
5.7.2 Post-COVID-19 Market Scenarios (V, U, W, L Shaped Recovery Analysis
6 Regional and Leading National Plasma Protein Therapeutics Market Forecasts 2022-2032
6.1 Global Plasma Protein Therapeutics Market by Region Forecast 2022-2032
6.2 COVID-19 Impact Recovery Scenarios (V, U, W, L)
7 North America Plasma Protein Therapeutics Market
7.1 Regional Overview
7.2 North America Plasma Protein Therapeutics Market by Country, Forecast 2022-2032
7.3 North America Plasma Protein Therapeutics Market Forecast by Product
7.4 North America Plasma Protein Therapeutics Market Forecast by Applications
7.5 U.S.
7.5.1 U.S. FDA Clears Terumo Blood and Cell Technologies' New Plasma Collection Technology
7.5.2 U.S. Plasma Protein Therapeutics Market Revenue, 2022-2032
7.6 Canada
7.6.1 Introduction
7.6.2 Canada Plasma Protein Therapeutics Market Revenue, 2022-2032
7.7 Post-COVID-19 Recovery Scenarios by Country
8 Europe Plasma Protein Therapeutics Market
8.1 Regional Overview
8.2 Europe Plasma Protein Therapeutics Market by Country, Forecast 2022-2032
8.3 Europe Plasma Protein Therapeutics Market Forecast by Product
8.4 Europe Plasma Protein Therapeutics Market Forecast by Applications
8.5 Germany
8.5.1 Plasma Donors Donate More Than Whole-Blood Donors
8.5.2 Germany Plasma Protein Therapeutics Market Revenue, 2022-2032
8.6 UK
8.6.1 UK Plasma Ban Lifted
8.6.2 UK Plasma Protein Therapeutics Market Revenue, 2022-2032
8.7 France
8.7.1 Versatile Policy to Process & Manufacture Therapeutic Plasma
8.7.2 France Plasma Protein Therapeutics Market Revenue, 2022-2032
8.8 Italy
8.8.1 Market Analysis
8.8.2 Italy Plasma Protein Therapeutics Market Revenue, 2022-2032
8.9 Spain
8.9.1 Spain Plasma Protein Therapeutics Market Revenue, 2022-2032
8.10 Rest of Europe
8.10.1 Rest of Europe Plasma Protein Therapeutics Market Revenue, 2022-2032
8.11 Post-COVID-19 Recovery Scenarios by Country
9 Asia Pacific Plasma Protein Therapeutics Market
9.1 Regional Overview
9.2 Asia Pacific Plasma Protein Therapeutics Market by Country, Forecast 2022-2032
9.3 Asia Pacific Plasma Protein Therapeutics Market Forecast by Product
9.4 Asia Pacific Plasma Protein Therapeutics Market Forecast by Applications
9.5 Japan Plasma Protein Therapeutics Market Forecast, 2022-2032
9.5.1 Market Analysis
9.5.2 Japan Plasma Protein Therapeutics Market Revenue, 2022-2032
9.6 China Plasma Protein Therapeutics Market Forecast, 2022-2032
9.6.1 Market Analysis
9.6.2 China Plasma Protein Therapeutics Market Revenue, 2022-2032
9.7 India Plasma Protein Therapeutics Market Forecast, 2022-2032
9.7.1 Market Analysis
9.7.2 India Plasma Protein Therapeutics Market Revenue, 2022-2032
9.8 Australia Plasma Protein Therapeutics Market Forecast, 2022-2032
9.8.1 Australia Plasma Protein Therapeutics Market Revenue, 2022-2032
9.9 South Korea Plasma Protein Therapeutics Market Forecast, 2022-2032
9.9.1 Market Analysis
9.9.2 South Korea Plasma Protein Therapeutics Market Revenue, 2022-2032
9.10 Rest of Asia Pacific Plasma Protein Therapeutics Market Forecast, 2022-2032
9.10.1 Rest of Asia Pacific Plasma Protein Therapeutics Market Revenue, 2022-2032
9.11 Post-COVID-19 Recovery Scenarios by Country
10 Latin America Plasma Protein Therapeutics Market
10.1 Regional Overview
10.2 Latin America Plasma Protein Therapeutics Market by Country, Forecast 2022-2032
10.3 Latin America Plasma Protein Therapeutics Market Forecast by Product
10.4 Latin America Plasma Protein Therapeutics Market Forecast by Applications
10.5 Brazil Plasma Protein Therapeutics Market Forecast, 2022-2032
10.5.1 Market Analysis
10.5.2 Brazil Plasma Protein Therapeutics Market Revenue, 2022-2032
10.6 Mexico Plasma Protein Therapeutics Market Forecast, 2022-2032
10.6.1 CSL Behring and Grifols to appeal US Border Patrol’s Ban on Mexican Plasma Donations
10.6.2 Mexico Plasma Protein Therapeutics Market Revenue, 2022-2032
10.7 Rest of Latin America Plasma Protein Therapeutics Market Forecast, 2022-2032
10.7.1 Rest of Latin America Plasma Protein Therapeutics Market Revenue, 2022-2032
10.8 Post-COVID-19 Recovery Scenarios by Country
11 Middle East and Africa Plasma Protein Therapeutics Market
11.1 Market Overview
11.2 Middle East and Africa Plasma Protein Therapeutics Market by Country, Forecast 2022-2032
11.3 Middle East and Africa Plasma Protein Therapeutics Market Forecast by Product
11.4 Middle East and Africa Plasma Protein Therapeutics Market Forecast by Applications
11.5 GCC Plasma Protein Therapeutics Market Forecast, 2022-2032
11.5.1 GCC Plasma Protein Therapeutics Market Revenue, 2022-2032
11.6 South Africa Plasma Protein Therapeutics Market Forecast, 2022-2032
11.6.1 South Africa Plasma Protein Therapeutics Market Revenue, 2022-2032
11.7 Rest of Middle East and Africa Plasma Protein Therapeutics Market Forecast, 2022-2032
11.7.1 Rest of Middle East and Africa Plasma Protein Therapeutics Market Revenue, 2022-2032
11.8 Post-COVID-19 Recovery Scenarios by Country
12 Company Profiles
12.1 ADMA Biologics, Inc.
12.1.1 Company Snapshot
12.1.2 Company Overview
12.1.3 Financial Analysis
12.1.4 Product Benchmarking
12.1.5 Recent Developments
12.2 Bio Products Laboratory Ltd.
12.2.1 Company Snapshot
12.2.2 Company Overview
12.2.3 Product Benchmarking
12.2.4 Recent Developments
12.3 Biotest AG
12.3.1 Company Snapshot
12.3.2 Company Overview
12.3.3 Financial Analysis
12.3.4 Product Benchmarking
12.3.5 Recent Developments
12.4 China Biologic Products Holdings Inc.
12.4.1 Company Snapshot
12.4.2 Company Overview
12.4.3 Product Benchmarking
12.4.4 Recent Developments
12.5 CSL Behring
12.5.1 Company Snapshot
12.5.2 Company Overview
12.5.3 Financial Analysis
12.5.4 Product Benchmarking
12.5.5 Recent Developments
12.6 Grifols SA
12.6.1 Company Snapshot
12.6.2 Company Overview
12.6.3 Financial Analysis
12.6.4 Product Benchmarking
12.6.5 Recent Developments
12.7 Kedrion SpA
12.7.1 Company Snapshot
12.7.2 Company Overview
12.7.3 Financial Analysis
12.7.4 Product Benchmarking
12.8 Octapharma AG
12.8.1 Company Snapshot
12.8.2 Company Overview
12.8.3 Product Benchmarking
12.8.4 Recent Developments
12.9 Takeda Pharmaceutical Company Ltd
12.9.1 Company Snapshot
12.9.2 Company Overview
12.9.3 Financial Analysis
12.9.4 Product Benchmarking
12.9.5 Recent Developments
13 Conclusion and Recommendations
13.1 Concluding Remarks
13.2 Recommendations
List of Tables
Table 1 Global Plasma Protein Therapeutics Market Snapshot, 2022 & 2032 (US$ billion, CAGR %)
Table 2 Global Plasma Protein Therapeutics Market Forecast by Product, 2022-2032 (US$ mn, AGR%, CAGR%)
Table 3 Global Plasma Protein Therapeutics Market Forecast by Product, 2022-2032 (US$ mn, AGR%, CAGR%): "V" Shaped Recovery
Table 4 Global Plasma Protein Therapeutics Market Forecast by Product, 2022-2032 (US$ mn, AGR%, CAGR%): "U" Shaped Recovery
Table 5 Global Plasma Protein Therapeutics Market Forecast by Product, 2022-2032 (US$ mn, AGR%, CAGR%): "W" Shaped Recovery
Table 6 Global Plasma Protein Therapeutics Market Forecast by Product, 2022-2032 (US$ mn, AGR%, CAGR%): "L" Shaped Recovery
Table 7 Global Plasma Protein Therapeutics Market Forecast by Application, 2022-2032 (US$ mn, AGR%, CAGR%)
Table 8 Global Plasma Protein Therapeutics Market Forecast by Application, 2022-2032 (US$ mn, AGR%, CAGR%): "V" Shaped Recovery
Table 9 Global Plasma Protein Therapeutics Market Forecast by Application, 2022-2032 (US$ mn, AGR%, CAGR%): "U" Shaped Recovery
Table 10 Global Plasma Protein Therapeutics Market Forecast by Application, 2022-2032 (US$ mn, AGR%, CAGR%): "W" Shaped Recovery
Table 11 Global Plasma Protein Therapeutics Market Forecast by Application, 2022-2032 (US$ mn, AGR%, CAGR%): "L" Shaped Recovery
Table 12 Global Plasma Protein Therapeutics Market Forecast by Region, 2022-2032 (US$ mn, AGR%, CAGR%)
Table 13 Global Plasma Protein Therapeutics Market Forecast by Region, 2022-2032 (US$ mn, AGR%, CAGR%): "V" Shaped Recovery
Table 14 Global Plasma Protein Therapeutics Market Forecast by Region, 2022-2032 (US$ mn, AGR%, CAGR%): "U" Shaped Recovery
Table 15 Global Plasma Protein Therapeutics Market Forecast by Region, 2022-2032 (US$ mn, AGR%, CAGR%): "W" Shaped Recovery
Table 16 Global Plasma Protein Therapeutics Market Forecast by Region, 2022-2032 (US$ mn, AGR%, CAGR%): "L" Shaped Recovery
Table 17 North America Plasma Protein Therapeutics Market Forecast by Country, 2022-2032 (US$ mn, AGR%, CAGR%)
Table 18 North America Plasma Protein Therapeutics Market Forecast by Product, 2022-2032 (US$ mn, AGR%, CAGR%)
Table 19 North America Plasma Protein Therapeutics Market Forecast by Application, 2022-2032 (US$ mn, AGR%, CAGR%)
Table 20 U.S. Plasma Protein Therapeutics Market Forecast, 2022-2032 (US$ mn, AGR%, CAGR%)
Table 21 Canada Plasma Protein Therapeutics Market Forecast, 2022-2032 (US$ mn, AGR%, CAGR%)
Table 22 North America Plasma Protein Therapeutics Market Forecast by Country, 2022-2032 (US$ mn, AGR%, CAGR%): "V" Shaped Recovery
Table 23 North America Plasma Protein Therapeutics Market Forecast by Country, 2022-2032 (US$ mn, AGR%, CAGR%): "U" Shaped Recovery
Table 24 North America Plasma Protein Therapeutics Market Forecast by Country, 2022-2032 (US$ mn, AGR%, CAGR%): "W" Shaped Recovery
Table 25 North America Plasma Protein Therapeutics Market Forecast by Country, 2022-2032 (US$ mn, AGR%, CAGR%): "L" Shaped Recovery
Table 26 Europe Plasma Protein Therapeutics Market Forecast by Country, 2022-2032 (US$ mn, AGR%, CAGR%)
Table 27 Europe Plasma Protein Therapeutics Market Forecast by Product, 2022-2032 (US$ mn, AGR%, CAGR%)
Table 28 Europe Plasma Protein Therapeutics Market Forecast by Application, 2022-2032 (US$ mn, AGR%, CAGR%)
Table 29 Germany Plasma Protein Therapeutics Market Forecast, 2022-2032 (US$ mn, AGR%, CAGR%)
Table 30 UK Plasma Protein Therapeutics Market Forecast, 2022-2032 (US$ mn, AGR%, CAGR%)
Table 31 France Plasma Protein Therapeutics Market Forecast, 2022-2032 (US$ mn, AGR%, CAGR%)
Table 32 Italy Plasma Protein Therapeutics Market Forecast, 2022-2032 (US$ mn, AGR%, CAGR%)
Table 33 Spain Plasma Protein Therapeutics Market Forecast, 2022-2032 (US$ mn, AGR%, CAGR%)
Table 34 Rest of Europe Plasma Protein Therapeutics Market Forecast, 2022-2032 (US$ mn, AGR%, CAGR%)
Table 35 Europe Plasma Protein Therapeutics Market Forecast by Country, 2022-2032 (US$ mn, AGR%, CAGR%): "V" Shaped Recovery
Table 36 Europe Plasma Protein Therapeutics Market Forecast by Country, 2022-2032 (US$ mn, AGR%, CAGR%): "U" Shaped Recovery
Table 37 Europe Plasma Protein Therapeutics Market Forecast by Country, 2022-2032 (US$ mn, AGR%, CAGR%): "W" Shaped Recovery
Table 38 Europe Plasma Protein Therapeutics Market Forecast by Country, 2022-2032 (US$ mn, AGR%, CAGR%): "L" Shaped Recovery
Table 39 Asia Pacific Plasma Protein Therapeutics Market Forecast by Country, 2022-2032 (US$ mn, AGR%, CAGR%)
Table 40 Asia Pacific Plasma Protein Therapeutics Market Forecast by Product, 2022-2032 (US$ mn, AGR%, CAGR%)
Table 41 Asia Pacific Plasma Protein Therapeutics Market Forecast by Application, 2022-2032 (US$ mn, AGR%, CAGR%)
Table 42 Japan Plasma Protein Therapeutics Market Forecast, 2022-2032 (US$ mn, AGR%, CAGR%)
Table 43 China Plasma Protein Therapeutics Market Forecast, 2022-2032 (US$ mn, AGR%, CAGR%)
Table 44 India Plasma Protein Therapeutics Market Forecast, 2022-2032 (US$ mn, AGR%, CAGR%)
Table 45 Australia Plasma Protein Therapeutics Market Forecast, 2022-2032 (US$ mn, AGR%, CAGR%)
Table 46 South Korea Plasma Protein Therapeutics Market Forecast, 2022-2032 (US$ mn, AGR%, CAGR%)
Table 47 Rest of Asia Pacific Plasma Protein Therapeutics Market Forecast, 2022-2032 (US$ mn, AGR%, CAGR%)
Table 48 Asia Pacific Plasma Protein Therapeutics Market Forecast by Country, 2022-2032 (US$ mn, AGR%, CAGR%): "V" Shaped Recovery
Table 49 Asia Pacific Plasma Protein Therapeutics Market Forecast by Country, 2022-2032 (US$ mn, AGR%, CAGR%): "U" Shaped Recovery
Table 50 Asia Pacific Plasma Protein Therapeutics Market Forecast by Country, 2022-2032 (US$ mn, AGR%, CAGR%): "W" Shaped Recovery
Table 51 Asia Pacific Plasma Protein Therapeutics Market Forecast by Country, 2022-2032 (US$ mn, AGR%, CAGR%): "L" Shaped Recovery
Table 52 Latin America Plasma Protein Therapeutics Market Forecast by Country, 2022-2032 (US$ mn, AGR%, CAGR%)
Table 53 Latin America Plasma Protein Therapeutics Market Forecast by Product, 2022-2032 (US$ mn, AGR%, CAGR%)
Table 54 Latin America Plasma Protein Therapeutics Market Forecast by Application, 2022-2032 (US$ mn, AGR%, CAGR%)
Table 55 Brazil Plasma Protein Therapeutics Market Forecast, 2022-2032 (US$ mn, AGR%, CAGR%)
Table 56 Mexico Plasma Protein Therapeutics Market Forecast, 2022-2032 (US$ mn, AGR%, CAGR%)
Table 57 Rest of Latin America Plasma Protein Therapeutics Market Forecast, 2022-2032 (US$ mn, AGR%, CAGR%)
Table 58 Latin America Plasma Protein Therapeutics Market Forecast by Country, 2022-2032 (US$ mn, AGR%, CAGR%): "V" Shaped Recovery
Table 59 Latin America Plasma Protein Therapeutics Market Forecast by Country, 2022-2032 (US$ mn, AGR%, CAGR%): "U" Shaped Recovery
Table 60 Latin America Plasma Protein Therapeutics Market Forecast by Country, 2022-2032 (US$ mn, AGR%, CAGR%): "W" Shaped Recovery
Table 61 Latin America Plasma Protein Therapeutics Market Forecast by Country, 2022-2032 (US$ mn, AGR%, CAGR%): "L" Shaped Recovery
Table 62 MEA Plasma Protein Therapeutics Market Forecast by Country, 2022-2032 (US$ mn, AGR%, CAGR%)
Table 63 MEA Plasma Protein Therapeutics Market Forecast by Product, 2022-2032 (US$ mn, AGR%, CAGR%)
Table 64 MEA Plasma Protein Therapeutics Market Forecast by Application, 2022-2032 (US$ mn, AGR%, CAGR%)
Table 65 GCC Plasma Protein Therapeutics Market Forecast, 2022-2032 (US$ mn, AGR%, CAGR%)
Table 66 South Africa Plasma Protein Therapeutics Market Forecast, 2022-2032 (US$ mn, AGR%, CAGR%)
Table 67 Rest of MEA Plasma Protein Therapeutics Market Forecast, 2022-2032 (US$ mn, AGR%, CAGR%)
Table 68 MEA Plasma Protein Therapeutics Market Forecast by Country, 2022-2032 (US$ mn, AGR%, CAGR%): "V" Shaped Recovery
Table 69 MEA Plasma Protein Therapeutics Market Forecast by Country, 2022-2032 (US$ mn, AGR%, CAGR%): "U" Shaped Recovery
Table 70 MEA Plasma Protein Therapeutics Market Forecast by Country, 2022-2032 (US$ mn, AGR%, CAGR%): "W" Shaped Recovery
Table 71 MEA Plasma Protein Therapeutics Market Forecast by Country, 2022-2032 (US$ mn, AGR%, CAGR%): "L" Shaped Recovery
Table 72 ADMA Biologics, Inc.: Key Details, (CEO, HQ, Revenue, Founded, No. of Employees, Company Type, Website, Business Segment)
Table 73 ADMA Biologics Inc.: Product Benchmarking
Table 74 ADMA Biologics, Inc.: Recent Developments
Table 75 Bio Products Laboratory Ltd.: Key Details, (CEO, HQ, Founded, No. of Employees, Company Type, Website, Business Segment)
Table 76 Bio Products Laboratory Ltd.: Product Benchmarking
Table 77 Bio Products Laboratory Ltd.: Recent Developments
Table 78 Biotest AG: Key Details, (CEO, HQ, Revenue, Founded, No. of Employees, Company Type, Website, Business Segment)
Table 79 Biotest AG: Product Benchmarking
Table 80 Biotest AG: Recent Developments
Table 81 China Biologic Products Holdings Inc.: Key Details, (CEO, HQ, Founded, No. of Employees, Company Type, Website, Business Segment)
Table 82 China Biologic Products Holdings Inc.: Product Benchmarking
Table 83 China Biologic Products Holdings Inc.: Recent Developments
Table 84 CSL Behring: Key Details, (CEO, HQ, Revenue, Founded, No. of Employees, Company Type, Website, Business Segment)
Table 85 CSL Behring: Product Benchmarking
Table 86 CSL Behring: Recent Developments
Table 87 Grifols SA: Key Details, (CEO, HQ, Revenue, Founded, No. of Employees, Company Type, Website, Business Segment)
Table 88 Grifols SA: Product Benchmarking
Table 89 Grifols SA: Recent Developments
Table 90 Kedrion SpA: Key Details, (CEO, HQ, Revenue, Founded, No. of Employees, Company Type, Website, Business Segment)
Table 91 Kedrion SpA: Product Benchmarking
Table 92 Octapharma AG: Key Details, (CEO, HQ, Founded, No. of Employees, Company Type, Website, Business Segment)
Table 93 Octapharma AG: Product Benchmarking
Table 94 Octapharma AG: Recent Developments
Table 95 Takeda Pharmaceutical Company Ltd: Key Details, (CEO, HQ, Revenue, Founded, No. of Employees, Company Type, Website, Business Segment)
Table 96 Takeda Pharmaceutical Company Ltd: Product Benchmarking
Table 97 Takeda Pharmaceutical Company Ltd: Recent Developments
List of Figures
Figure 1 Global Plasma Protein Therapeutics Market: Market Segmentation
Figure 2 Global Plasma Protein Therapeutics Market Trends
Figure 3 Global Plasma Protein Therapeutics Market: Porter’s Five Forces
Figure 4 Global Plasma Protein Therapeutics Market: SWOT Analysis
Figure 5 Global Plasma Protein Therapeutics Market Share Forecast by Product: 2022, 2027, 2032 (%)
Figure 6 Global Plasma Protein Therapeutics Market Forecast by Product, 2022-2032 (US$ million, AGR %)
Figure 7 Global Plasma Protein Therapeutics Market Forecast by Product, 2022-2032 (US$ million, AGR %): “V” Shaped Recovery
Figure 8 Global Plasma Protein Therapeutics Market Forecast by Product, 2022-2032 (US$ million, AGR %): “U” Shaped Recovery
Figure 9 Global Plasma Protein Therapeutics Market Forecast by Product, 2022-2032 (US$ million, AGR %): “W” Shaped Recovery
Figure 10 Global Plasma Protein Therapeutics Market Forecast by Product, 2022-2032 (US$ million, AGR %): “L” Shaped Recovery
Figure 11 Global Plasma Protein Therapeutics Market Share Forecast by Applications: 2022, 2027, 2032 (%)
Figure 12 Global Plasma Protein Therapeutics Market Forecast by Applications, 2022-2032 (US$ million, AGR %)
Figure 13 Global Plasma Protein Therapeutics Market Forecast by Applications, 2022-2032 (US$ million, AGR %): “V” Shaped Recovery
Figure 14 Global Plasma Protein Therapeutics Market Forecast by Applications, 2022-2032 (US$ million, AGR %): “U” Shaped Recovery
Figure 15 Global Plasma Protein Therapeutics Market Forecast by Applications, 2022-2032 (US$ million, AGR %): “W” Shaped Recovery
Figure 16 Global Plasma Protein Therapeutics Market Forecast by Applications, 2022-2032 (US$ million, AGR %): “L” Shaped Recovery
Figure 17 Global Plasma Protein Therapeutics Market Forecast by Region 2022-2032 (US$ million)
Figure 18 Global Plasma Protein Therapeutics Market Share Forecast by Region 2022, 2027, 2032 (%)
Figure 19 Global Plasma Protein Therapeutics Market Forecast, 2022-2032 (US$ million, AGR%): “V” Shaped Recovery
Figure 20 Global Plasma Protein Therapeutics Market Forecast, 2022-2032 (US$ million, AGR %): “U” Shaped Recovery
Figure 21 Global Plasma Protein Therapeutics Market Forecast, 2022-2032 (US$ million, AGR%): “W” Shaped Recovery
Figure 22 Global Plasma Protein Therapeutics Market Forecast, 2022-2032 (US$ million, AGR%): “L” Shaped Recovery
Figure 23 North America Plasma Protein Therapeutics Market Forecast by Country 2022-2032 (US$ million)
Figure 24 North America Plasma Protein Therapeutics Market Share Forecast by Country 2022, 2027, 2032 (%)
Figure 25 North America Plasma Protein Therapeutics Market Forecast by Product, 2022-2032 (US$ million)
Figure 26 North America Plasma Protein Therapeutics Market Forecast by Applications, 2022-2032 (US$ million)
Figure 27 U.S. Plasma Protein Therapeutics Market Forecast, 2022-2032 (US$ million, AGR %)
Figure 28 Canada Plasma Protein Therapeutics Market Forecast, 2022-2032 (US$ million, AGR %)
Figure 29 North America Plasma Protein Therapeutics Market Forecast by Country, 2022-2032 (US$ million, AGR %): “V” Shaped Recovery
Figure 30 North America Plasma Protein Therapeutics Market Forecast by Country, 2022-2032 (US$ million, AGR %): “U” Shaped Recovery
Figure 31 North America Plasma Protein Therapeutics Market Forecast by Country, 2022-2032 (US$ million, AGR %): “W” Shaped Recovery
Figure 32 North America Plasma Protein Therapeutics Market Forecast by Country, 2022-2032 (US$ million, AGR %): “L” Shaped Recovery
Figure 33 Europe Plasma Protein Therapeutics Market Forecast by Country 2022-2032 (US$ million)
Figure 34 Europe Plasma Protein Therapeutics Market Share Forecast by Country 2022, 2027, 2032 (%)
Figure 35 Europe Plasma Protein Therapeutics Market Forecast by Product, 2022-2032 (US$ million, AGR%)
Figure 36 Europe Plasma Protein Therapeutics Market Forecast by Applications, 2022-2032 (US$ million, AGR%)
Figure 37 Germany Plasma Protein Therapeutics Market Forecast, 2022-2032 (US$ million, AGR %)
Figure 38 UK Plasma Protein Therapeutics Market Forecast, 2022-2032 (US$ million, AGR %)
Figure 39 France Plasma Protein Therapeutics Market Forecast, 2022-2032 (US$ million, AGR %)
Figure 40 Italy Plasma Protein Therapeutics Market Forecast, 2022-2032 (US$ million, AGR %)
Figure 41 Spain Plasma Protein Therapeutics Market Forecast, 2022-2032 (US$ million, AGR %)
Figure 42 Rest of Europe Plasma Protein Therapeutics Market Forecast, 2022-2032 (US$ million, AGR %)
Figure 43 Europe Plasma Protein Therapeutics Market Forecast by Country, 2022-2032 (US$ million, AGR %): “V” Shaped Recovery
Figure 44 Europe Plasma Protein Therapeutics Market Forecast by Country, 2022-2032 (US$ million, AGR %): “U” Shaped Recovery
Figure 45 Europe Plasma Protein Therapeutics Market Forecast by Country, 2022-2032 (US$ million, AGR %): “W” Shaped Recovery
Figure 46 Europe Plasma Protein Therapeutics Market Forecast by Country, 2022-2032 (US$ million, AGR %): “L” Shaped Recovery
Figure 47 Asia Pacific Plasma Protein Therapeutics Market Forecast by Country 2022-2032 (US$ million)
Figure 48 Asia Pacific Plasma Protein Therapeutics Market Share Forecast by Country 2022, 2027, 2032 (%)
Figure 49 Asia Pacific Plasma Protein Therapeutics Market Forecast by Product, 2022-2032 (US$ million)
Figure 50 Asia Pacific Plasma Protein Therapeutics Market Forecast by Applications, 2022-2032 (US$ million, AGR%)
Figure 51 Japan Plasma Protein Therapeutics Market Forecast, 2022-2032 (US$ million, AGR %)
Figure 52 China Plasma Protein Therapeutics Market Forecast, 2022-2032 (US$ million, AGR %)
Figure 53 India Plasma Protein Therapeutics Market Forecast, 2022-2032 (US$ million, AGR %)
Figure 54 Australia Plasma Protein Therapeutics Market Forecast, 2022-2032 (US$ million, AGR %)
Figure 55 South Korea Plasma Protein Therapeutics Market Forecast, 2022-2032 (US$ million, AGR %)
Figure 56 Rest of Asia Pacific Plasma Protein Therapeutics Market Forecast, 2022-2032 (US$ million, AGR %)
Figure 57 Asia Pacific Plasma Protein Therapeutics Market Forecast by Country, 2022-2032 (US$ million, AGR %): “V” Shaped Recovery
Figure 58 Asia Pacific Plasma Protein Therapeutics Market Forecast by Country, 2022-2032 (US$ million, AGR %): “U” Shaped Recovery
Figure 59 Asia Pacific Plasma Protein Therapeutics Market Forecast by Country, 2022-2032 (US$ million, AGR %): “W” Shaped Recovery
Figure 60 Asia Pacific Plasma Protein Therapeutics Market Forecast by Country, 2022-2032 (US$ million, AGR %): “L” Shaped Recovery
Figure 61 Latin America Plasma Protein Therapeutics Market Forecast by Country 2022-2032 (US$ million)
Figure 62 Latin America Plasma Protein Therapeutics Market Share Forecast by Country 2022, 2027, 2032 (%)
Figure 63 Latin America Plasma Protein Therapeutics Market Forecast by Product, 2022-2032 (US$ million, AGR%)
Figure 64 Latin America Plasma Protein Therapeutics Market Forecast by Applications, 2022-2032 (US$ million, AGR%)
Figure 65 Brazil Plasma Protein Therapeutics Market Forecast, 2022-2032 (US$ million, AGR %)
Figure 66 Mexico Plasma Protein Therapeutics Market Forecast, 2022-2032 (US$ million, AGR %)
Figure 67 Rest of Latin America Plasma Protein Therapeutics Market Forecast, 2022-2032 (US$ million, AGR %)
Figure 68 Latin America Plasma Protein Therapeutics Market Forecast by Country, 2022-2032 (US$ million, AGR %): “V” Shaped Recovery
Figure 69 Latin America Plasma Protein Therapeutics Market Forecast by Country, 2022-2032 (US$ million, AGR %): “U” Shaped Recovery
Figure 70 Latin America Plasma Protein Therapeutics Market Forecast by Country, 2022-2032 (US$ million, AGR %): “W” Shaped Recovery
Figure 71 Latin America Plasma Protein Therapeutics Market Forecast by Country, 2022-2032 (US$ million, AGR %): “L” Shaped Recovery
Figure 72 Middle East and Africa Plasma Protein Therapeutics Market Forecast by Country 2022-2032 (US$ million)
Figure 73 Middle East and Africa Plasma Protein Therapeutics Market Share Forecast by Country 2022, 2027, 2032 (%)
Figure 74 Middle East and Africa Plasma Protein Therapeutics Market Forecast by Product, 2022-2032 (US$ million, AGR%)
Figure 75 Middle East and Africa Plasma Protein Therapeutics Market Forecast by Applications, 2022-2032 (US$ million, AGR%)
Figure 76 GCC Plasma Protein Therapeutics Market Forecast, 2022-2032 (US$ million, AGR %)
Figure 77 South Africa Plasma Protein Therapeutics Market Forecast, 2022-2032 (US$ million, AGR %)
Figure 78 Rest of Middle East and Africa Plasma Protein Therapeutics Market Forecast, 2022-2032 (US$ million, AGR %)
Figure 79 MEA Plasma Protein Therapeutics Market Forecast by Country, 2022-2032 (US$ million, AGR %): “V” Shaped Recovery
Figure 80 MEA Plasma Protein Therapeutics Market Forecast by Country, 2022-2032 (US$ million, AGR %): “U” Shaped Recovery
Figure 81 MEA Plasma Protein Therapeutics Market Forecast by Country, 2022-2032 (US$ million, AGR %): “W” Shaped Recovery
Figure 82 MEA Plasma Protein Therapeutics Market Forecast by Country, 2022-2032 (US$ million, AGR %): “L” Shaped Recovery
Figure 83 ADMA Biologics, Inc.: Net Revenue, 2015-2021 (US$ million, AGR%)
Figure 84 ADMA Biologics, Inc.: R&D Expenses, 2015-2021 (US$ million, AGR%)
Figure 85 ADMA Biologics, Inc.: Gross Profit, 2015-2021 (US$ million, AGR%)
Figure 86 Biotest AG: Net Revenue, 2015-2021 (US$ million, AGR%)
Figure 87 CSL Behring: Net Revenue, 2015-2021 (US$ million, AGR%)
Figure 88 CSL Behring: R&D Expenses, 2015-2021 (US$ million, AGR%)
Figure 89 CSL Behring: Gross Profit, 2015-2021 (US$ million, AGR%)
Figure 90 Grifols SA: Net Revenue, 2015-2021 (US$ million, AGR%)
Figure 91 Grifols SA: R&D Expenses, 2015-2021 (US$ million, AGR%)
Figure 92 Grifols SA: Gross Profit, 2015-2021 (US$ million, AGR%)
Figure 93 Kedrion SpA: Net Revenue, 2018-2020 (US$ million, AGR%)
Figure 94 Kedrion SpA: R&D Expenses, 2018-2020 (US$ million, AGR%)
Figure 95 Kedrion SpA: Gross Profit, 2018-2020 (US$ million, AGR%)
Figure 96 Takeda Pharmaceutical Company Ltd: Net Revenue, 2015-2021 (US$ million, AGR%)
Figure 97 Takeda Pharmaceutical Company Ltd: R&D Expenses, 2015-2021 (US$ million, AGR%)
Figure 98 Takeda Pharmaceutical Company Ltd: Gross Profit, 2015-2021 (US$ million, AGR%)
ページTOPに戻る
本レポートと同分野(その他(治療を主目的としない薬物))の最新刊レポート
Visiongain社のヘルスケアと医薬・化学品分野での最新刊レポート
本レポートと同じKEY WORD(plasma)の最新刊レポート
よくあるご質問
Visiongain社はどのような調査会社ですか?
英国の調査会社ヴィジョンゲイン社(Visiongain)は、通信とエネルギーのほか、自動車や化学・医薬品、金属など、広範な市場を対象に調査を行っています。自動車市場については、市場全般に関する調査のほ... もっと見る
調査レポートの納品までの日数はどの程度ですか?
在庫のあるものは速納となりますが、平均的には 3-4日と見て下さい。
但し、一部の調査レポートでは、発注を受けた段階で内容更新をして納品をする場合もあります。
発注をする前のお問合せをお願いします。
注文の手続きはどのようになっていますか?
1)お客様からの御問い合わせをいただきます。
2)見積書やサンプルの提示をいたします。
3)お客様指定、もしくは弊社の発注書をメール添付にて発送してください。
4)データリソース社からレポート発行元の調査会社へ納品手配します。
5) 調査会社からお客様へ納品されます。最近は、pdfにてのメール納品が大半です。
お支払方法の方法はどのようになっていますか?
納品と同時にデータリソース社よりお客様へ請求書(必要に応じて納品書も)を発送いたします。
お客様よりデータリソース社へ(通常は円払い)の御振り込みをお願いします。
請求書は、納品日の日付で発行しますので、翌月最終営業日までの当社指定口座への振込みをお願いします。振込み手数料は御社負担にてお願いします。
お客様の御支払い条件が60日以上の場合は御相談ください。
尚、初めてのお取引先や個人の場合、前払いをお願いすることもあります。ご了承のほど、お願いします。
データリソース社はどのような会社ですか?
当社は、世界各国の主要調査会社・レポート出版社と提携し、世界各国の市場調査レポートや技術動向レポートなどを日本国内の企業・公官庁及び教育研究機関に提供しております。
世界各国の「市場・技術・法規制などの」実情を調査・収集される時には、データリソース社にご相談ください。
お客様の御要望にあったデータや情報を抽出する為のレポート紹介や調査のアドバイスも致します。
|
|

