がん免疫療法市場レポート:2024-2034
Cancer Immunotherapy Market Report 2024-2034
レポート詳細
がん免疫療法市場レポート 2024-2034年 :本レポートは、業界とその基礎となるダイナミクスをより良く理解したい場合、新たな収益ポケットを目指す大手企業にとって貴重なものとなるで... もっと見る
※上記価格は部署ライセンス(Departmental licence)価格です。
その他の価格についてはデータリソースまでお問合せください。
日本語のページは自動翻訳を利用し作成しています。
実際のレポートは英文のみでご納品いたします。

|
サマリー
レポート詳細
がん免疫療法市場レポート 2024-2034年:本レポートは、業界とその基礎となるダイナミクスをより良く理解したい場合、新たな収益ポケットを目指す大手企業にとって貴重なものとなるでしょう。異業種への進出や新規地域での既存事業の拡大を目指す企業にとっても有用なレポートです。
がん罹患率の増加とがん免疫療法の研究増加が市場成長を牽引
世界保健機関(WHO)が2024年2月に発表したデータによると、がんは世界的な主要死因であり、2022年には約2000万人の新規がん患者と900万人以上の死亡者を占める。2040年までには、人口の高齢化と増加により、世界のがん患者数は2,800万人を超えると米国がん協会は予測している。北米は、がん死亡数で4位、新規症例数で4位であるのに対し、世界最大の人口を抱える中国は、両者とも世界的な割合が最も高い。アルコールとタバコの使用量の増加、食生活の乱れ、運動不足、大気汚染など、世界各地の要因により、がんの負担は将来的に増加する可能性がある。
免疫療法に代表される最新のがん治療は、近年この分野に革命をもたらしている。研究者や腫瘍学者を大いに興奮させている治療法のひとつが、がん免疫療法である。世界的には、長年にわたる集中的な研究の結果、がん免疫療法ががんの治療法として用いられるようになっている。例えば、ドイツの生物医学研究機関BioMed Xと日本最大手の製薬会社である小野薬品工業株式会社は、2023年12月に新たな共同研究の開始を発表した。好中球の抗がん作用を利用して次世代免疫療法を開発することが、この研究の目的である。したがって、この市場の成長を後押しする主な原動力は、免疫療法を向上させる方法についての継続的な研究と、がん治療のための新規免疫療法の継続的な開発である。
償還の課題、高コスト、副作用ががん免疫療法の成長を妨げる可能性
世界中の医療提供者、保険会社、国や地方自治体の組織は、がん免疫療法治療の保険償還を受けることの難しさに直面している。がん免疫療法は最も高価な薬剤の一つであり、患者一人当たり10万ドル以上の費用がかかる。がん免疫療法を受ける患者の多くは重篤な副作用を持つため、この治療費には薬代、入院費、数日間の集中治療費が含まれている。
キイトルーダの製造元であるメルク社は、1回の点滴にかかる自己負担額は1,000ドルから1,950ドルであるとしている。しかし、多くの患者にとってこの割合はまだ高額である。患者がメディキャップまたはメディケア・アドバンテージ(パートC)に加入している場合は、追加の保険が適用される可能性がある。プランによっては、キイトルーダ治療は完全にカバーされる可能性があります。メルク社によると、メディケア・アドバンテージ・プランに加入している患者の41%は自己負担がないと回答している。発展途上国の患者は、免疫療法薬の高額な費用を支払う余裕がない。免疫療法薬を開発する企業が直面する主な障害のひとつは、高額な価格設定である。そのため、予測される期間における同市場の成長を阻害する主な要因の一つとなっている。
市場調査レポートを購入する前にすべき質問とは?
-
がん免疫療法市場はどのように進化しているのか?
-
何ががん免疫療法市場を牽引し、阻害しているのか?
-
ポイントオブケア診断の各サブマーケットは予測期間中にどのように成長し、2034年にはどれくらいの収益を占めるようになるのか?
-
2024年から2034年にかけて、各がん免疫療法サブマーケットの市場シェアはどのように推移するのか?
-
2024年から2034年にかけて、市場全体を牽引する主な要因は何か?
-
主要ながん免疫療法市場はマクロ経済の動きに大枠で追随するのか、それとも個々の国の市場が他を凌駕するのか。
-
2034年までに各国市場のシェアはどのように変化し、どの地域が2034年の市場をリードするのか。
-
主要プレーヤーと予測期間中の見通しは?
-
これらの主要企業によるがん免疫療法プロジェクトとは?
-
2024年から2034年の間に、業界はどのように発展していくのか?現在および今後10年間に実施されるがん免疫療法プロジェクトはどのような意味を持つのか?
-
がん免疫療法市場をさらに拡大するために、製品化の必要性は高まっているのでしょうか?
-
がん免疫療法市場はどこに向かっているのか、そしてどのようにして市場の最前線に立つことができるのか?
-
新商品や新サービスに最適な投資方法とは?
-
企業を新たな成長軌道に乗せ、C-suiteに移行させるための重要な展望とは?
このことが、現在および今後10年間のがん免疫療法市場にどのような影響を与えるかを知る必要がある:
-
286ページにわたるレポートには、117の表、189の図表が掲載されている。
-
本レポートでは、業界における主要な有利分野を取り上げているため、今すぐターゲットを絞ることができる。
-
世界、地域、国の売上高と成長に関する詳細な分析が含まれている。
-
競合他社が成功した主なトレンド、変化、収益予測をハイライトします。
2034年までの予測やその他の分析から、商業的な展望が明らかになる
-
2034年までの収益予測に加え、最近の実績、成長率、市場シェアも提供している。
-
ビジネスの展望や展開など、独自の分析が掲載されている。
-
定性的分析(市場ダイナミクス、促進要因、機会、阻害要因、課題など)、がん免疫療法価格上昇の影響、最近の動向などをご覧いただけます。
レポート対象セグメント
技術
アプリケーション
-
肺がん
-
乳がん
-
大腸がん
-
メラノーマ
-
前立腺がん
-
頭頸部がん
-
卵巣がん
-
膵臓がん
-
その他
エンドユーザー
世界市場全体と各分野の売上予測に加え、5つの地域と25の主要国市場の売上予測も掲載しています:
北米
欧州
-
ドイツ
-
英国
-
フランス
-
イタリア
-
スペイン
-
スイス
-
オランダ
-
その他の欧州地域
アジア太平洋
-
中国
-
日本
-
インド
-
オーストラリア
-
韓国
-
東南アジア
-
その他のアジア太平洋地域
ラテンアメリカ
-
ブラジル
-
メキシコ
-
アルゼンチン
-
その他のラテンアメリカ地域
MEA
本レポートには、がん免疫療法市場の2024年から2034年にかけての主要企業のプロファイルも掲載されており、これらの企業の事業のこのセグメントに焦点を当てている。
報告書に掲載されている主要企業
-
AbbVie Inc.
-
Amgen Inc.
-
AstraZeneca
-
Bayer AG
-
Bristol-Myers Squibb Company
-
F. Hoffmann-La Roche Ltd.
-
Gilead Sciences, Inc.
-
GSK plc
-
Immunocore Ltd.
-
Johnson & Johnson Services, Inc.
-
Lilly
-
Merck & Co., Inc.
-
Novartis AG
-
Pfizer Inc.
-
Sanofi
-
Takeda Pharmaceutical Company Limited
2024年から2034年までのがん免疫療法市場全体の世界売上高は、金額ベースで2024年に1,350億米ドルを突破する。2034年まで力強い収益成長を予測している。当社の調査では、最も大きな可能性を秘めた組織を特定しています。彼らの能力、進歩、商業的展望を発見し、一歩先を行くお手伝いをします。
がん免疫療法市場、2024-2034年レポートはどのように役立つのか?
要約すると、280ページを超えるこのレポートは、以下の知識を提供する:
-
がん免疫療法市場の2024年から2034年までの収益予測、技術、用途、エンドユーザー別の予測、世界および地域レベルでの各予測 - 業界の将来性を発見し、投資と収益に最も有利な場所を見つけることができます。
-
5つの地域と25の主要国市場の2034年までの収益予測 - 北米、欧州、アジア太平洋、中南米、MEAのがん免疫療法市場の2024年から2034年までの予測をご覧ください。また、米国、カナダ、メキシコ、ブラジル、ドイツ、フランス、英国、イタリア、スペイン、スイス、オランダ、中国、インド、日本、オーストラリア、韓国、東南アジア、アルゼンチン、GCC、南アフリカ、エジプトなどの主要経済圏の市場も予測しています。
-
2024年から2034年までの癌免疫療法市場に関わる主要企業16社の企業プロファイルを含む。
独自の予測による定量的・定性的分析をご覧ください。私たちのレポートだけに含まれる情報を入手し、貴重なビジネスインテリジェンスで情報を得ることができます。
他にはない情報
私たちの新しいレポートがあれば、知識に遅れをとったり、チャンスを逃したりする可能性が低くなります。弊社の調査レポートが貴社の調査、分析、意思決定にどのように役立つかをご覧ください。Visiongainの調査は、がん免疫療法市場、2024年から2034年、市場をリードする企業の商業分析を必要とするすべての人のためのものです。データ、トレンド、予測をご覧いただけます。
ページTOPに戻る
目次
1 レポート概要
1.1 研究の目的
1.2 がん免疫療法市場の紹介
1.3 本レポートの内容
1.4 本レポートを読むべき理由
1.5 本分析レポートが回答する主な質問
1.6 本レポートは誰のためのものか?
1.7 方法論
1.7.1 市場の定義
1.7.2 市場評価・予測手法
1.7.3 データの検証
1.7.3.1 一次調査
1.7.3.2 セカンダリーリサーチ
1.8 よくある質問(FAQ)
1.9 Visiongainの関連レポート
1.10 Visiongainについて
2 エグゼクティブ・サマリー
3 市場概要
3.1 主要な調査結果
3.2 市場ダイナミクス
3.3 影響分析
3.3.1 市場促進要因
3.3.1.1 癌の有病率の増加
3.3.1.2 がん免疫療法研究の増加
3.3.1.3 官民によるがん研究への資金提供の増加
3.3.2 市場抑制要因
3.3.2.1 がん免疫療法に対する償還の課題
3.3.2.2 がん免疫療法の高コストと副作用
3.3.3 市場機会
3.3.3.1 先進的治療プロトコルへの注目の高まり
3.3.3.2 癌診断における大きなアンメット・ニーズ
3.3.3.3 がん免疫療法製造におけるAIの利用拡大
3.4 サプライチェーン分析
3.5 規制の枠組み
3.6 新興市場とメガトレンド
3.7 ポーターのファイブフォース分析
3.7.1 買い手の交渉力(高)
3.7.2 供給者の交渉力(低)
3.7.3 新規参入の脅威(低)
3.7.4 代替製品の脅威(高)
3.7.5 競争ライバルの激しさ(高)
3.8 PEST分析
4 がん免疫療法市場分析:技術別
4.1 主な調査結果
4.2 技術セグメント 市場魅力度指数
4.3 技術別のがん免疫療法市場規模の推定と予測
4.4 モノクローナル抗体
4.4.1 2024〜2034年の地域別市場規模(US$ Billion)
4.4.2 地域別市場シェア、2024年・2034年(%)
4.5 免疫調節剤
4.5.1 2024〜2034年の地域別市場規模(US$ Billion)
4.5.2 地域別市場シェア、2024年・2034年(%)
4.6 その他の技術
4.6.1 2024〜2034年の地域別市場規模(US$ Billion)
4.6.2 地域別市場シェア、2024年・2034年(%)
5 がん免疫療法市場:用途別
5.1 主な調査結果
5.2 アプリケーションセグメント 市場魅力度指数
5.3 がん免疫療法市場:用途別
5.4 肺がん
5.4.1 2024〜2034年の地域別市場規模(US$ Billion)
5.4.2 地域別市場シェア、2024年・2034年(%)
5.5 乳がん
5.5.1 2024〜2034年の地域別市場規模(US$ Billion)
5.5.2 地域別市場シェア、2024年・2034年(%)
5.6 大腸がん
5.6.1 2024〜2034年の地域別市場規模(US$ Billion)
5.6.2 地域別市場シェア、2024年・2034年(%)
5.7 メラノーマ
5.7.1 2024〜2034年の地域別市場規模(US$ Billion)
5.7.2 地域別市場シェア、2024年・2034年(%)
5.8 前立腺がん
5.8.1 2024〜2034年の地域別市場規模(US$ Billion)
5.8.2 地域別市場シェア、2024年・2034年(%)
5.9 頭頸部がん
5.9.1 2024〜2034年の地域別市場規模(US$ Billion)
5.9.2 地域別市場シェア、2024年・2034年(%)
5.10 卵巣がん
5.10.1 2024〜2034年の地域別市場規模(US$ Billion)
5.10.2 地域別市場シェア、2024年・2034年(%)
5.11 膵臓がん
5.11.1 2024〜2034年の地域別市場規模(US$ Billion)
5.11.2 地域別市場シェア、2024年・2034年(%)
5.12 その他
5.12.1 2024〜2034年の地域別市場規模(US$ Billion)
5.12.2 地域別市場シェア、2024年・2034年(%)
6 がん免疫療法市場:エンドユーザー別
6.1 主要調査結果
6.2 エンドユーザーセグメント: 市場魅力度指数
6.3 エンドユーザー別がん免疫療法市場予測、2024年〜2034年
6.4 病院
6.4.1 2024〜2034年の地域別市場規模(US$ Billion)
6.4.2 地域別市場シェア、2024年・2034年(%)
6.5 がん研究センター
6.5.1 2024〜2034年の地域別市場規模(US$ Billion)
6.5.2 地域別市場シェア、2024年・2034年(%)
6.6 クリニック
6.6.1 2024〜2034年の地域別市場規模(US$ Billion)
6.6.2 地域別市場シェア、2024年・2034年(%)
7 がん免疫療法市場分析:地域別
7.1 主要な調査結果
7.2 地域別市場規模の推定と予測
8 北米のがん免疫療法市場分析
8.1 主要な調査結果
8.2 北米のがん免疫療法市場魅力度指数
8.3 北米のがん免疫療法国別市場、2024年、2029年、2034年(US$ Billion)
8.4 北米のがん免疫療法市場規模推定と予測:国別
8.5 北米のがん免疫療法市場規模推定と予測:技術別
8.6 北米のがん免疫療法市場規模推定と予測:用途別
8.7 北米のがん免疫療法市場規模推定と予測:エンドユーザー別
8.8 米国のがん免疫療法市場分析
8.9 カナダがん免疫療法市場分析
9 欧州のがん免疫療法の市場分析
9.1 主要な調査結果
9.2 欧州のがん免疫療法市場魅力度指数
9.3 欧州のがん免疫療法の国別市場(2024年、2029年、2034年)(US$ Billion
9.4 欧州のがん免疫療法市場規模推定と予測:国別
9.5 欧州のがん免疫療法市場規模推定と予測:技術別
9.6 欧州のがん免疫療法市場規模推定と予測:用途別
9.7 欧州のがん免疫療法市場規模推定と予測:エンドユーザー別
9.8 ドイツのがん免疫療法市場分析
9.9 イギリスのがん免疫療法市場分析
9.10 フランスのがん免疫療法市場分析
9.11 イタリアのがん免疫療法市場分析
9.12 スペインのがん免疫療法市場分析
9.13 スイスのがん免疫療法市場分析
9.14 オランダのがん免疫療法市場分析
9.15 その他の欧州のがん免疫療法市場分析
10 アジア太平洋地域のがん免疫療法市場分析
10.1 主要な調査結果
10.2 アジア太平洋地域のがん免疫療法市場魅力度指数
10.3 アジア太平洋地域のがん免疫療法国別市場、2024年、2029年、2034年(US$ Billion)
10.4 アジア太平洋地域のがん免疫療法市場規模推定と予測:国別
10.5 アジア太平洋地域のがん免疫療法市場規模推定と予測:技術別
10.6 アジア太平洋地域のがん免疫療法市場規模推定と予測:用途別
10.7 アジア太平洋地域のがん免疫療法市場規模推定と予測:エンドユーザー別
10.8 日本のがん免疫療法の市場分析
10.9 中国のがん免疫療法の市場分析
10.10 インドのがん免疫療法市場分析
10.11 オーストラリアのがん免疫療法市場分析
10.12 韓国のがん免疫療法市場分析
10.13 東南アジアのがん免疫療法市場分析
10.14 その他のアジア太平洋地域のがん免疫療法市場分析
11 ラテンアメリカのがん免疫療法市場分析
11.1 主要な調査結果
11.2 ラテンアメリカがん免疫療法市場魅力度指数
11.3 ラテンアメリカのがん免疫療法国別市場、2024年、2029年、2034年(US$ Billion)
11.4 ラテンアメリカのがん免疫療法市場規模推定と予測:国別
11.5 ラテンアメリカのがん免疫療法市場規模推定と予測:技術別
11.6 ラテンアメリカのがん免疫療法市場規模推定と予測:用途別
11.7 ラテンアメリカのがん免疫療法市場規模推定と予測:エンドユーザー別
11.8 ブラジルのがん免疫療法市場分析
11.9 メキシコのがん免疫療法市場分析
11.10 アルゼンチンがん免疫療法市場分析
11.11 その他のラテンアメリカのがん免疫療法市場分析
12 MEAのがん免疫療法の市場分析
12.1 主要な調査結果
12.2 MEAのがん免疫療法市場魅力度指数
12.3 MEAのがん免疫療法国別市場規模、2024年、2029年、2034年(US$ Billion)
12.4 MEAのがん免疫療法市場規模推定と予測:国別
12.5 MEAのがん免疫療法市場規模推定と予測:技術別
12.6 MEAのがん免疫療法市場規模推定と予測:用途別
12.7 MEAのがん免疫療法市場規模推定と予測:エンドユーザー別
12.8 GCCのがん免疫療法市場分析
12.9 南アフリカのがん免疫療法市場分析
12.10 エジプトのがん免疫療法市場分析
12.11 その他のMEAがん免疫療法市場分析
13 企業のプロフィール
13.1 競争環境、2023年
13.2 戦略的展望
13.3 F. Hoffmann-La Roche Ltd.
13.3.1 会社概要
13.3.2 会社概要
13.3.3 財務分析
13.3.3.1 純収入、2019-2023年
13.3.3.2 R&D、2019-2023年
13.3.3.3 セグメント市場シェア、2023年
13.3.3.4 地域市場シェア(2023年
13.3.4 製品ベンチマーク
13.3.5 戦略的展望
13.4 Merck & Co., Inc.
13.4.1 会社概要
13.4.2 会社概要
13.4.3 財務分析
13.4.3.1 純収入、2019-2023年
13.4.3.2 売上高、2019-2023年
13.4.3.3 セグメント市場シェア、2023年
13.4.3.4 地域市場シェア(2023年
13.4.4 製品ベンチマーク
13.4.5 戦略的展望
13.5 Novartis AG
13.5.1 会社概要
13.5.2 会社概要
13.5.3 財務分析
13.5.3.1 純収入、2019-2023年
13.5.3.2 R&D、2019-2023年
13.5.3.3 セグメント市場シェア、2023年
13.5.3.4 地域市場シェア、2023年
13.5.4 製品ベンチマーク
13.5.5 戦略的展望
13.6 Bristol-Myers Squibb Company
13.6.1 会社概要
13.6.2 会社概要
13.6.3 財務分析
13.6.3.1 純収入、2019-2023年
13.6.3.2 R&D、2019-2023年
13.6.3.3 セグメント市場シェア、2023年
13.6.3.4 地域市場シェア、2023年
13.6.4 製品ベンチマーク
13.6.5 戦略的展望
13.7 Bayer AG
13.7.1 会社概要
13.7.2 会社概要
13.7.3 財務分析
13.7.3.1 純収入、2019-2023年
13.7.3.2 売上高、2019-2023年
13.7.3.3 セグメント市場シェア、2023年
13.7.3.4 地域市場シェア(2023年
13.7.4 製品ベンチマーク
13.7.5 戦略的展望
13.8 AstraZeneca
13.8.1 会社概要
13.8.2 会社概要
13.8.3 財務分析
13.8.3.1 純収入、2019-2023年
13.8.3.2 R&D、2019-2023年
13.8.3.3 セグメント市場シェア、2023年
13.8.3.4 地域市場シェア、2023年
13.8.4 製品ベンチマーク
13.8.5 戦略的展望
13.9 Lilly
13.9.1 会社概要
13.9.2 会社概要
13.9.3 財務分析
13.9.3.1 純収入、2019-2023年
13.9.3.2 R&D、2019-2023年
13.9.3.3 地域市場シェア、2023年
13.9.4 製品ベンチマーク
13.9.5 戦略的展望
13.10 Pfizer Inc.
13.10.1 会社概要
13.10.2 会社概要
13.10.3 財務分析
13.10.3.1 純収入、2019-2023年
13.10.3.2 R&D、2019-2023年
13.10.3.3 セグメント市場シェア、2023年
13.10.3.4 地域市場シェア、2023年
13.10.4 製品ベンチマーク
13.10.5 戦略的展望
13.11 Johnson & Johnson Services, Inc.
13.11.1 会社概要
13.11.2 会社概要
13.11.3 財務分析
13.11.3.1 純収入(2019-2023年
13.11.3.2 売上高、2019-2023年
13.11.3.3 セグメント市場シェア、2023年
13.11.3.4 地域市場シェア(2023年
13.11.4 製品ベンチマーク
13.11.5 戦略的展望
13.12 GSK plc
13.12.1 会社概要
13.12.2 会社概要
13.12.3 財務分析
13.12.3.1 純収入、2019-2023年
13.12.3.2 R&D、2019-2023年
13.12.3.3 セグメント市場シェア、2023年
13.12.3.4 地域市場シェア、2023年
13.12.4 製品ベンチマーク
13.12.5 戦略的展望
13.13 Gilead Sciences, Inc.
13.13.1 会社概要
13.13.2 会社概要
13.13.3 財務分析
13.13.3.1 純収入、2019-2023年
13.13.3.2 R&D、2019-2023年
13.13.3.3 セグメント市場シェア、2023年
13.13.3.4 地域市場シェア、2023年
13.13.4 製品ベンチマーク
13.13.5 戦略的展望
13.14 Amgen Inc.
13.14.1 会社概要
13.14.2 会社概要
13.14.3 財務分析
13.14.3.1 純収入、2019-2023年
13.14.3.2 R&D、2019-2023年
13.14.3.3 地域市場シェア、2023年
13.14.4 製品ベンチマーク
13.14.5 戦略的展望
13.15 AbbVie Inc.
13.15.1 会社概要
13.15.2 会社概要
13.15.3 財務分析
13.15.3.1 純収入、2019-2023年
13.15.3.2 R&D、2019-2023年
13.15.3.3 セグメント市場シェア、2023年
13.15.3.4 地域市場シェア(2023年
13.15.4 製品ベンチマーク
13.15.5 戦略的展望
13.16 Immunocore Ltd.
13.16.1 会社概要
13.16.2 会社概要
13.16.3 財務分析
13.16.3.1 純収入、2019-2023年
13.16.3.2 R&D、2019-2023年
13.16.3.3 地域市場シェア、2023年
13.16.4 製品ベンチマーク
13.16.5 戦略的展望
13.17 Sanofi
13.17.1 会社概要
13.17.2 会社概要
13.17.3 財務分析
13.17.3.1 純収入、2019-2023年
13.17.3.2 R&D、2019-2023年
13.17.3.3 セグメント市場シェア、2023年
13.17.3.4 地域市場シェア(2023年
13.17.4 製品ベンチマーク
13.17.5 戦略的展望
13.18 Takeda Pharmaceutical Company Limited.
13.18.1 会社概要
13.18.2 会社概要
13.18.3 財務分析
13.18.3.1 純売上高、2019-2023年
13.18.3.2 R&D、2019年〜2023年
13.18.3.3 セグメント市場シェア、2023年
13.18.3.4 地域市場シェア、2023年
13.18.4 製品ベンチマーク
13.18.5 戦略的展望
14 結論と提言
14.1 Visiongainからの結びの言葉
14.2 市場プレイヤーへの提言
ページTOPに戻る
図表リスト
表の一覧
表1 がん免疫療法のスナップショット、2024年〜2034年(10億米ドル、CAGR %)
表2 がん免疫療法の技術別市場予測 2024-2034 (10億米ドル, AGR %, CAGR %)
表3 モノクローナル抗体の種類
表4 モノクローナル抗体の種類と承認状況
表5 モノクローナル抗体セグメント地域別市場予測 2024-2034 (億米ドル, AGR %, CAGR %)
表6 免疫調節剤の地域別市場予測、2024-2034年(10億米ドル、AGR %、CAGR %)
表7 その他の技術の地域別市場予測、2024-2034年(10億米ドル、AGR %、CAGR %)
表8 がん免疫療法の用途別市場予測、2024-2034年(10億米ドル、AGR %、CAGR %)
表9 モノクローナル抗体の種類
表10 肺癌の地域別市場予測、2024-2034年(10億米ドル、AGR %、CAGR %)
表11 乳がんの地域別市場予測、2024〜2034年(10億米ドル、AGR %、CAGR %)
表12 大腸癌の地域別市場予測、2024〜2034年(10億米ドル、AGR %、CAGR %)
表13 黒色腫の地域別市場予測、2024〜2034年(10億米ドル、AGR %、CAGR %)
表14 前立腺がんの地域別市場予測、2024〜2034年(10億米ドル、AGR %、CAGR %)
表15 頭頸部がんの地域別市場予測、2024〜2034年(10億米ドル、AGR %、CAGR %)
表16 卵巣癌の地域別市場予測、2024〜2034年(10億米ドル、AGR %、CAGR %)
表17 膵臓癌の地域別市場予測、2024〜2034年(10億米ドル、AGR %、CAGR %)
表18 その他の地域別市場予測、2024〜2034年(10億米ドル、AGR %、CAGR %)
表19 がん免疫療法のエンドユーザー別市場予測:2024〜2034年(10億米ドル、AGR %、CAGR %)
表20 病院の地域別市場予測、2024-2034年(10億米ドル、AGR %、CAGR %)
表21 がん研究センターの地域別市場予測、2024〜2034年(10億米ドル、AGR %、CAGR %)
表22 クリニックの地域別市場予測、2024-2034年(10億米ドル、AGR %、CAGR %)
表23 がん免疫療法の地域別市場予測、2024-2034年(10億米ドル、AGR %、CAGR %)
表24 北米のがん免疫療法国別市場予測、2024-2034年(10億米ドル、AGR %、CAGR %)
表25 北米のがん免疫療法市場技術別予測、2024-2034年(10億米ドル、AGR %、CAGR %)
表26 北米がん免疫療法の用途別市場予測:2024-2034年(10億米ドル、AGR %、CAGR %)
表27 北米のがん免疫療法のエンドユーザー別市場予測:2024-2034年(10億米ドル、AGR %、CAGR %)
表28 米国のがん免疫療法市場予測、2024-2034年(10億米ドル、AGR %、CAGR %)
表29 カナダがん免疫療法の市場予測、2024〜2034年(10億米ドル、AGR %、CAGR %)
表30 欧州がん免疫療法の国別市場予測、2024〜2034年(10億米ドル、AGR %、CAGR %)
表31 欧州がん免疫療法の技術別市場予測、2024-2034年(10億米ドル、AGR %、CAGR %)
表32 欧州がん免疫療法の用途別市場予測:2024-2034年(10億米ドル、AGR %、CAGR %)
表33 欧州がん免疫療法のエンドユーザー別市場予測:2024-2034年(10億米ドル、AGR %、CAGR %)
表34 ドイツがん免疫療法の市場予測、2024-2034年(10億米ドル、AGR %、CAGR %)
表35 イギリスがん免疫療法の市場予測、2024〜2034年(10億米ドル、AGR %、CAGR %)
表36 フランスがん免疫療法の市場予測、2024-2034年(10億米ドル、AGR %、CAGR %)
表37 イタリアがん免疫療法の市場予測、2024〜2034年(10億米ドル、AGR %、CAGR %)
表38 スペインがん免疫療法の市場予測、2024〜2034年(10億米ドル、AGR %、CAGR %)
表39 スイスのがん免疫療法市場の予測、2024〜2034年(10億米ドル、AGR %、CAGR %)
表40 オランダのがん免疫療法市場予測、2024-2034年(10億米ドル、AGR %、CAGR %)
表41 その他のヨーロッパのがん免疫療法市場予測、2024-2034年(10億米ドル、AGR %、CAGR %)
表42 アジア太平洋地域の癌免疫療法の国別市場予測、2024〜2034年(10億米ドル、AGR %、CAGR %)
表43 アジア太平洋地域のがん免疫療法の技術別市場予測、2024-2034年(10億米ドル、AGR %、CAGR %)
表44 アジア太平洋地域のがん免疫療法の用途別市場予測:2024-2034年(10億米ドル、AGR %、CAGR %)
表45 アジア太平洋地域のがん免疫療法のエンドユーザー別市場予測:2024-2034年(10億米ドル、AGR %、CAGR %)
表46 日本がん免疫療法の市場展望、2024-2034年(10億米ドル、AGR %、CAGR %)
表47 中国がん免疫療法の市場予測、2024-2034年(10億米ドル、AGR %、CAGR %)
表48 インドがん免疫療法の市場予測、2024〜2034年(10億米ドル、AGR %、CAGR %)
表49 オーストラリアがん免疫療法の市場予測、2024〜2034年(10億米ドル、AGR %、CAGR %)
表50 韓国がん免疫療法の市場予測、2024-2034年(10億米ドル、AGR %、CAGR %)
表51 東南アジアのがん免疫療法市場予測、2024〜2034年(10億米ドル、AGR %、CAGR %)
表52 その他のアジア太平洋地域のがん免疫療法市場予測、2024-2034年(10億米ドル、AGR %、CAGR %)
表53 ラテンアメリカのがん免疫療法国別市場予測:2024-2034年(10億米ドル、AGR %、CAGR %)
表54 ラテンアメリカのがん免疫療法市場技術別予測、2024-2034年(10億米ドル、AGR %、CAGR %)
表55 ラテンアメリカがん免疫療法の用途別市場予測:2024-2034年(10億米ドル、AGR %、CAGR %)
表56 ラテンアメリカがん免疫療法のエンドユーザー別市場予測:2024-2034年(10億米ドル、AGR %、CAGR %)
表57 ブラジルがん免疫療法の市場予測、2024-2034年(10億米ドル、AGR %、CAGR %)
表58 メキシコがん免疫療法の市場予測、2024〜2034年(10億米ドル、AGR %、CAGR %)
表59 アルゼンチンがん免疫療法の市場予測、2024〜2034年(10億米ドル、AGR %、CAGR %)
表60 その他のラテンアメリカがん免疫療法の市場予測、2024-2034年(10億米ドル、AGR %、CAGR %)
表61 MEAがん免疫療法の国別市場予測 2024-2034 (億米ドル, AGR %, CAGR %)
表62 MEAがん免疫療法の技術別市場予測:2024-2034年(10億米ドル、AGR %、CAGR %)
表63 MEAがん免疫療法の用途別市場予測:2024-2034年(10億米ドル、AGR %、CAGR %)
表64 MEAがん免疫療法のエンドユーザー別市場予測:2024-2034年(10億米ドル、AGR %、CAGR %)
表65 GCCのがん免疫療法市場予測、2024-2034年(10億米ドル、AGR %、CAGR %)
表66 南アフリカがん免疫療法の市場予測、2024〜2034年(10億米ドル、AGR %、CAGR %)
表67 エジプトがん免疫療法の市場予測、2024〜2034年(10億米ドル、AGR %、CAGR %)
表68 その他のMEAがん免疫療法の市場予測、2024-2034年(10億米ドル、AGR %、CAGR %)
表69 戦略的展望
表70 F.ホフマン・ラ・ロシュ社: 主要詳細(CEO, 本社, 売上高, 設立, 従業員数, 企業タイプ, ウェブサイト, 事業セグメント)
表71 F.ホフマン・ラ・ロシュ:製品ベンチマーク
表72 F.ホフマン・ラ・ロシュ:戦略的展望
表73 Merck & Co:主な詳細(CEO, 本社, 売上高, 設立, 従業員数, 企業タイプ, ウェブサイト, 事業セグメント)
表74 Merck & Co:製品ベンチマーク
表75 Merck & Co:戦略的展望
表76 ノバルティスAG:主な詳細(CEO、本社、売上高、設立、従業員数、企業タイプ、ウェブサイト、事業セグメント)
表77 ノバルティスAG:製品ベンチマーク
表78 ノバルティスAG:戦略的展望
表79 ブリストル・マイヤーズ スクイブ社主な詳細(CEO、本社、売上高、設立、従業員数、企業タイプ、ウェブサイト、事業セグメント)
表 80 ブリストル・マイヤーズ スクイブ社製品ベンチマーク
表81 ブリストル・マイヤーズ スクイブ社:製品ベンチマーク戦略的展望
表82 バイエルAG:主要詳細(CEO、本社、売上高、設立、従業員数、企業タイプ、ウェブサイト、事業セグメント)
表83 バイエルAG:製品ベンチマーク
表84 バイエルAG:戦略的展望
表85 アストラゼネカ主な詳細(CEO、本社、売上高、設立、従業員数、企業タイプ、ウェブサイト、事業セグメント)
表 86 アストラゼネカ製品のベンチマーク
表 87 アストラゼネカ戦略的展望
表88 リリー主な詳細(CEO, 本社, 売上高, 設立, 従業員数, 企業タイプ, ウェブサイト, 事業セグメント)
表 89 リリー製品のベンチマーク
表90 リリー:戦略的展望
表91 ファイザー主な詳細(CEO, 本社, 売上高, 設立, 従業員数, 企業タイプ, ウェブサイト, 事業セグメント)
表92 ファイザー製品ベンチマーク
表93 ファイザー:戦略的展望
表94 ジョンソン・エンド・ジョンソンサービス(株主な詳細(CEO, 本社, 売上高, 設立, 従業員数, 企業タイプ, ウェブサイト, 事業セグメント)
表95 ジョンソン・エンド・ジョンソンサービスInc:製品ベンチマーク
表96 ジョンソン・エンド・ジョンソンサービス:戦略的展望戦略的展望
表97 GSK plc:主な詳細(CEO, 本社, 売上高, 設立, 従業員数, 企業タイプ, ウェブサイト, 事業セグメント)
表 98 GSK plc:製品のベンチマーク
表99 GSK plc:戦略的展望
表100 ギリアド・サイエンシズInc:主な詳細(CEO, 本社, 売上高, 設立, 従業員数, 企業タイプ, ウェブサイト, 事業セグメント)
表101 ギリアド・サイエンシズInc:製品ベンチマーク
表102 ギリアド・サイエンシズInc:戦略的展望
表103 アムジェン社主な詳細(CEO, 本社, 売上高, 設立, 従業員数, 企業タイプ, ウェブサイト, 事業セグメント)
表104 アムジェンInc:製品のベンチマーク
表105 アムジェンInc:戦略的展望
表106 AbbVie Inc:主な詳細(CEO, 本社, 売上高, 設立, 従業員数, 企業タイプ, ウェブサイト, 事業セグメント)
表 107 アッヴィー社製品ベンチマーク
表108 アッヴィーInc:戦略的展望
表109 イムノコア社: 主要詳細(CEO, 本社, 売上高, 設立, 従業員数, 企業タイプ, ウェブサイト, 事業セグメント)
表110 イムノコア社製品ベンチマーク
表111 イムノコア社:戦略的展望
表112 サノフィ主な詳細(CEO, 本社, 売上高, 設立, 従業員数, 企業タイプ, ウェブサイト, 事業セグメント)
表113 サノフィ製品のベンチマーク
表114 サノフィ戦略的展望
表115 武田薬品工業:主な内容(CEO、本社、売上高、設立、従業員数、企業タイプ、ウェブサイト、事業セグメント)
表116 武田薬品工業:製品ベンチマーク
表117 武田薬品工業:戦略的展望
図の一覧
図1 がん免疫療法市場のセグメンテーション
図2 がん免疫療法市場の地域別魅力度指数
図3 技術別のがん免疫療法市場市場魅力度指数
図4 がん免疫療法市場:用途別市場魅力度指数
図5 がん免疫療法のエンドユーザー別市場:市場魅力度指数市場魅力度指数
図6 がん免疫療法市場:市場ダイナミクス
図7 がん免疫療法市場:市場ダイナミクスインパクト分析
図8 がん免疫療法産業:サプライチェーン分析サプライチェーン分析
図9 がん免疫療法市場:サプライチェーン分析ポーターのファイブフォース分析
図 10 がん免疫療法市場:PEST分析PEST分析
図11 がん免疫療法市場:技術別市場魅力度指数
図12 がん免疫療法の技術別市場予測(2024年〜2034年、10億米ドル、AGR)
図13 技術別がん免疫療法市場予測:2024年、2029年、2034年(%)
図14 モノクローナル抗体セグメントの地域別市場予測、2024~2034年(10億米ドル、AGR)
図15 モノクローナル抗体セグメント地域別市場シェア予測、2024年&2034年(%)
図16 免疫調節薬の地域別市場予測、2024~2034年 (10億米ドル)
図17 免疫調節剤の地域別市場シェア予測、2024年〜2034年(%)
図18 その他の技術の地域別市場予測、2024~2034年(10億米ドル)
図19 その他の技術の地域別市場シェア予測、2024年&2034年(%)
図20 がん免疫療法の用途別市場市場魅力度指数
図21 がん免疫療法の用途別市場:2024年〜2034年(10億米ドル)
図22 がん免疫療法の用途別市場予測、2024年、2029年、2034年(%)
図23 肺がん地域別市場予測、2024年〜2034年(10億米ドル)
図24 肺がん市場地域別シェア予測、2024年&2034年(%)
図25 乳癌の地域別市場展望、2024〜2034年(億米ドル)
図26 乳がんの地域別市場シェア予測、2024年〜2034年(%)
図27 大腸癌の地域別市場予測、2024年〜2034年(10億米ドル)
図28 大腸癌の地域別市場シェア予測、2024年〜2034年(%)
図29 メラノーマの地域別市場予測、2024年〜2034年(10億米ドル)
図30 黒色腫の地域別市場シェア予測、2024年〜2034年(%)
図31 前立腺癌の地域別市場予測、2024〜2034年(10億米ドル)
図32 前立腺癌の地域別市場シェア予測、2024年〜2034年(%)
図33 頭頸部癌の地域別市場予測、2024〜2034年(10億米ドル)
図34 頭頸部癌の地域別市場シェア予測、2024年〜2034年(%)
図35 卵巣癌の地域別市場展望、2024〜2034年(億米ドル)
図36 卵巣癌の地域別市場シェア予測、2024年〜2034年(%)
図37 膵臓癌の地域別市場予測、2024〜2034年(億米ドル)
図38 膵臓癌の地域別市場シェア予測、2024年〜2034年(%)
図39 その他の地域別市場予測、2024〜2034年 (10億米ドル)
図40 その他の地域別市場シェア予測、2024年&2034年(%)
図41 エンドユーザー別がん免疫療法市場市場魅力度指数
図42 エンドユーザー別がん免疫療法市場:2024年〜2034年(10億米ドル)
図43 エンドユーザー別がん免疫療法市場シェア(2024年、2029年、2034年)
図44 病院市場の地域別予測、2024年~2034年(10億米ドル)
図45 病院市場地域別シェア予測、2024年&2034年(%)
図46 がん研究センターの地域別市場予測、2024~2034年(10億米ドル)
図47 がん研究センターの地域別市場シェア予測、2024年&2034年(%)
図48 クリニックの地域別市場予測、2024~2034年(10億米ドル)
図49 クリニックの地域別市場シェア予測、2024年&2034年(%)
図50 がん免疫療法の地域別市場予測(2024年、2034年)(売上高、CAGR
図51 がん免疫療法の地域別市場予測、2024年、2029年、2034年(%)
図52 がん免疫療法の地域別市場予測(2024年〜2034年、10億米ドル、AGR)
図53 北米のがん免疫療法市場魅力度指数
図54 北米がん免疫療法地域別市場(2024年、2029年&2034年)(10億米ドル
図55 北米がん免疫療法の国別市場予測(2024〜2034年、10億米ドル、AGR)
図56 北米がん免疫療法の国別市場予測、2024年&2034年シェア(%)
図57 北米のがん免疫療法市場技術別予測(2024-2034年) (10億米ドル, AGR %)
図58 北米のがん免疫療法市場技術別シェア予測、2024年〜2034年(%)
図59 北米のがん免疫療法市場規模予測(用途別):2024〜2034年(10億米ドル、AGR
図60 北米のがん免疫療法市場:用途別シェア予測、2024年〜2034年(%)
図61 北米のがん免疫療法市場:エンドユーザー別予測(2024〜2034年、10億米ドル、AGR)
図62 北米のがん免疫療法市場エンドユーザー別予測、2024年〜2034年(%)
図63 米国がん免疫療法市場予測、2024-2034年(10億米ドル、AGR)
図64 カナダがん免疫療法市場予測、2024-2034年(10億米ドル、AGR)
図65 欧州がん免疫療法市場魅力度指数
図66 欧州がん免疫療法国別市場(2024年、2029年&2034年)(10億米ドル
図67 欧州がん免疫療法の国別市場予測(2024〜2034年)(10億米ドル
図68 欧州がん免疫療法国別市場シェア予測、2024年&2034年(%)
図69 欧州がん免疫療法の技術別市場予測(2024〜2034年)(億米ドル)
図70 欧州がん免疫療法市場技術別シェア予測、2024年&2034年(%)
図71 欧州がん免疫療法の用途別市場予測(2024〜2034年)(億米ドル)
図72 欧州がん免疫療法市場:用途別シェア予測、2024年〜2034年(%)
図73 欧州がん免疫療法のエンドユーザー別市場予測:2024年〜2034年(10億米ドル)
図74 欧州がん免疫療法のエンドユーザー別市場展望、2024年〜2034年(%)
図75 ドイツがん免疫療法市場予測、2024年〜2034年(10億米ドル、AGR %)
図76 イギリスがん免疫療法市場予測、2024年〜2034年 (10億米ドル, AGR %)
図77 フランスがん免疫療法の市場展望、2024-2034年 (10億米ドル, AGR %)
図78 イタリアがん免疫療法の市場展望、2024-2034年 (10億米ドル, AGR %)
図79 スペインのがん免疫療法市場予測、2024-2034年 (10億米ドル, AGR %)
図80 スイスがん免疫療法市場予測、2024-2034年(10億米ドル、AGR)
図81 オランダがん免疫療法市場予測、2024-2034年 (10億米ドル、AGR %)
図82 その他のヨーロッパのがん免疫療法市場予測、2024-2034年(10億米ドル、AGR)
図83 アジア太平洋地域のがん免疫療法市場魅力度指数
図84 アジア太平洋地域のがん免疫療法地域別市場(2024年、2029年、2034年)(10億米ドル
図85 アジア太平洋地域のがん免疫療法国別市場予測(2024年〜2034年)(10億米ドル
図86 アジア太平洋地域のがん免疫療法市場国別シェア予測、2024年&2034年(%)
図87 アジア太平洋地域のがん免疫療法市場技術別予測:2024年〜2034年(10億米ドル)
図88 アジア太平洋地域のがん免疫療法市場技術別シェア予測、2024年&2034年(%)
図89 アジア太平洋地域のがん免疫療法市場規模予測(用途別):2024年~2034年(10億米ドル
図90 アジア太平洋地域のがん免疫療法市場:用途別シェア予測、2024年〜2034年(%)
図91 アジア太平洋地域のがん免疫療法市場予測(エンドユーザー別):2024年〜2034年(10億米ドル
図92 アジア太平洋地域のがん免疫療法市場:エンドユーザー別シェア予測、2024年〜2034年(%)
図93 日本のがん免疫療法市場予測、2024年〜2034年(10億米ドル、AGR)
図94 中国がん免疫療法市場予測、2024年〜2034年 (10億米ドル, AGR %)
図95 インドがん免疫療法の市場展望、2024-2034年(10億米ドル、AGR)
図96 オーストラリアがん免疫療法の市場展望、2024-2034年 (10億米ドル, AGR %)
図97 韓国がん免疫療法市場の予測、2024-2034年 (10億米ドル, AGR %)
図98 東南アジアがん免疫療法市場予測、2024-2034年(10億米ドル、AGR)
図99 その他のアジア太平洋地域のがん免疫療法市場予測、2024-2034年(10億米ドル、AGR)
図100 中南米のがん免疫療法市場魅力度指数
図101 ラテンアメリカのがん免疫療法地域別市場(2024年、2029年&2034年)(10億米ドル
図102 ラテンアメリカがん免疫療法の国別市場予測(2024〜2034年)(10億米ドル
図103 中南米のがん免疫療法市場国別シェア予測、2024年&2034年(%)
図104 中南米のがん免疫療法市場技術別予測(2024〜2034年)(億米ドル)
図105 ラテンアメリカがん免疫療法市場技術別シェア予測、2024年〜2034年(%)
図106 中南米のがん免疫療法市場規模予測(用途別):2024〜2034年(10億米ドル
図107 中南米のがん免疫療法市場:用途別シェア予測、2024年〜2034年(%)
図108 中南米のがん免疫療法市場予測(エンドユーザー別):2024年~2034年(10億米ドル
図109 中南米のがん免疫療法市場:エンドユーザー別シェア予測、2024年〜2034年(%)
図110 ブラジルがん免疫療法市場予測、2024年〜2034年(10億米ドル、AGR)
図111 メキシコがん免疫療法市場予測、2024年〜2034年 (10億米ドル, AGR %)
図112 アルゼンチンがん免疫療法の市場展望、2024-2034年 (10億米ドル, AGR %)
図113 その他のラテンアメリカがん免疫療法市場予測、2024-2034年 (10億米ドル, AGR %)
図114 MEAがん免疫療法市場魅力度指数
図115 MEAがん免疫療法の地域別市場規模(2024年、2029年&2034年)(10億米ドル
図116 MEAがん免疫療法の国別市場予測(2024年〜2034年)(10億米ドル
図117 MEAがん免疫療法の国別市場シェア予測、2024年・2034年(%)
図118 MEAがん免疫療法の技術別市場予測(2024〜2034年)(10億米ドル)
図119 MEAがん免疫療法市場技術別シェア予測、2024年〜2034年(%)
図120 MEAがん免疫療法の用途別市場予測(2024-2034年)(10億米ドル)
図121 MEAがん免疫療法の用途別市場シェア予測、2024年〜2034年(%)
図122 MEAがん免疫療法のエンドユーザー別市場予測(2024〜2034年)(億米ドル)
図123 MEAがん免疫療法のエンドユーザー別市場展望、2024年〜2034年(%)
図124 GCCがん免疫療法市場予測、2024-2034年(10億米ドル、AGR)
図125 南アフリカがん免疫療法の市場展望、2024〜2034年 (10億米ドル, AGR %)
図126 エジプトがん免疫療法の市場展望、2024~2034年 (10億米ドル, AGR %)
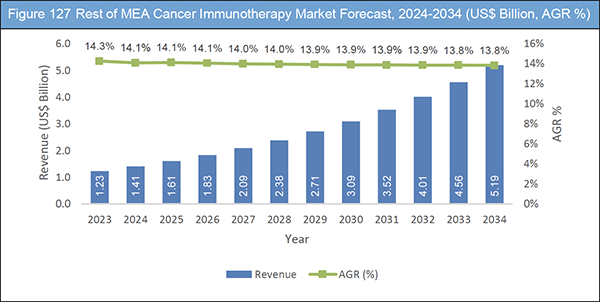
図127 その他のMEAがん免疫療法市場予測、2024-2034年(10億米ドル、AGR)
図128 がん免疫療法市場企業シェア/ランキング(2023年
図129 F.ホフマン・ラ・ロシュ社:純収入、2019-2023年(百万米ドル、AGR %)
図 130 F. ホフマン・ラ・ロシュ社:純収入(百万米ドル、AGRR&D, 2019-2023 (百万米ドル, AGR %)
図 131 F.ホフマン・ラ・ロシュ社:セグメント市場シェア、2023 年
図 132 F. ホフマン・ラ・ロシュ社:セグメント別市場シェア、2023 年ホフマン・ラ・ロシュ社地域別市場シェア(2023
図 133 Merck & Co:純収入、2019年~2023年(百万米ドル、AGR)
図 134 Merck & Co:研究開発費、2019-2023年(百万米ドル、AGR)
図 135 Merck & Co:セグメント別市場シェア(2023年
図 136 Merck & Co:地域別市場シェア(2023年
図 137 ノバルティスAG:純収入、2019-2023年(百万米ドル、AGR)
図138 ノバルティスAG:研究開発費、2019-2023年(百万米ドル、AGR)
図139 ノバルティスAG:セグメント別市場シェア(2023年
図 140 ノバルティスAG:地域別市場シェア(2023年
図 141 ブリストル・マイヤーズ スクイブ社純収入、2019-2023年(百万米ドル、AGR)
図142 ブリストル・マイヤーズ スクイブ社:R&D、2019-2023年(百万米ドル、AGR)
図 143 ブリストル・マイヤーズ スクイブ社:セグメント別市場シェア(2023年
図 144 ブリストル・マイヤーズ スクイブ社:地域別市場シェア(2023年
図 145 バイエル薬品:純収入(百万米ドル、AGR (%)
図146 バイエルAG:R&D、2019-2023年(百万米ドル、AGR)
図147 バイエルAG:セグメント別市場シェア(2023年
図148 バイエルAG:地域別市場シェア(2023年
図 149 アストラゼネカ純収入、2019-2023年(百万米ドル、AGR (%)
図 150 アストラゼネカR&D、2019-2023年(百万米ドル、AGR)
図 151 アストラゼネカ:セグメント別市場シェア(2023年
図 152 アストラゼネカ:地域別市場シェア、2023年
図 153 リリー純収入、2019-2023年(百万米ドル、AGR (%)
図 154 リリーR&D、2019-2023年(百万米ドル、AGR)
図 155 リリー地域別市場シェア、2023年
図 156 ファイザー純収入、2019年~2023年(百万米ドル、AGR %)
図 157 ファイザーR&D、2019年~2023年(百万米ドル、AGR)
図 158 ファイザーセグメント別市場シェア、2023年
図 159 ファイザー地域別市場シェア、2023年
図 160 ジョンソン・エンド・ジョンソン・サービス社:純収入、2019年-2023年(百万米ドル、AGR %)
図 161 ジョンソン・エンド・ジョンソン・サービス・インク:R&D, 2019-2023 (百万米ドル, AGR %)
図 162 ジョンソン・エンド・ジョンソンサービス(株):セグメント別市場シェア(2023 年
図 163 ジョンソン・エンド・ジョンソン サービス, Inc:地域別市場シェア(2023年
図 164 GSK plc:純収入、2019年-2023年 (百万米ドル、AGR %)
図 165 GSK plc:R&D, 2019-2023 (百万米ドル, AGR %)
図 166 GSK plc:セグメント別市場シェア(2023年
図 167 GSK plc:地域別市場シェア、2023年
図 168 Gilead Sciences, Inc:純収入、2019年~2023年(百万米ドル、AGR %)
図 169 ギリアド・サイエンシズInc:R&D、2019年~2023年(百万米ドル、AGR)
図 170 ギリアド・サイエンシズInc:セグメント別市場シェア(2023年
図 171 ギリアド・サイエンシズInc:地域別市場シェア(2023年
図 172 アムジェン社純収入、2019年〜2023年(百万米ドル、AGR %)
図 173 アムジェン社R&D、2019年-2023年(百万米ドル、AGR)
図 174 アムジェン社地域別市場シェア、2023年
図 175 AbbVie Inc:純収入、2019-2023年(百万米ドル、AGR)
図 176 アッヴィ・インク:R&D、2019年-2023年(百万米ドル、AGR)
図 177 AbbVie Inc:セグメント別市場シェア、2023年
図 178 アッヴィー社:地域別市場シェア、2023年
図 179 イムノコア社:純収入、2019年~2023年(百万米ドル、AGR)
図 180 イムノコア社:R&D、2019年-2023年(百万米ドル、AGR)
図181 イムノコアリミテッド:地域別市場シェア、2023年
図 182 サノフィ純収入、2019-2023年(百万米ドル、AGR)
図183 サノフィR&D、2019-2023年(百万米ドル、AGR)
図184 サノフィセグメント別市場シェア(2023年
図 185 サノフィ:地域別市場シェア、2023年
図 186 武田薬品工業純収入、2019-2023年 (百万米ドル、AGR %)
図 187 武田薬品工業R&D, 2019-2023 (百万米ドル, AGR %)
図 188 武田薬品工業セグメント別市場シェア、2023 年
図189 武田薬品工業:地域別市場シェア(2023年
ページTOPに戻る
Summary
Report Details
The Cancer Immunotherapy Market Report 2024-2034: This report will prove invaluable to leading firms striving for new revenue pockets if they wish to better understand the industry and its underlying dynamics. It will be useful for companies that would like to expand into different industries or to expand their existing operations in a new region.
Increasing Prevalence of Cancer and Increasing Research in Cancer Immunotherapy are driving the Market Growth
Cancer is a major cause of death worldwide, accounting for about 20 million new cancer cases and over 9 million deaths in 2022, according to data released by the World Health Organisation in February 2024. By 2040, the American Cancer Society, Inc. projects that the global cancer burden would have increased to over 28 million cases due to present and anticipated population ageing and growth. North America is fourth in terms of cancer deaths and fourth in terms of new cases, whereas China, which has the greatest population in the world, has the highest global proportion of both. The cancer burden may rise in the future due to factors such increased alcohol and tobacco use, poor diet, physical inactivity, and air pollution in many different parts of the world.
Modern cancer treatments, such as those based on immunotherapy, have revolutionised the field in recent years. One such treatment that has greatly excited researchers and oncologists is cancer immunotherapy. Globally, cancer immunotherapy is being used as a treatment for cancer after years of intensive research. For instance, the German biomedical research institute BioMed X and one of the biggest pharmaceutical corporations in Japan, Ono Pharmaceutical Co., Ltd., announced in December 2023 the commencement of a new cooperative research initiative. Using neutrophils’ anticancer properties to create next-generation immunotherapies is the aim of this research endeavour. Therefore, the primary driver propelling the growth of this market is the ongoing research into how to improve immunotherapy and the ongoing development of novel immunotherapies for the treatment of cancer.
Reimbursement Challenges, High Cost and Side-effects may Hamper Cancer Immunotherapy Growth
Healthcare providers, insurance companies, and national and local government organisations all around the world have faced difficulties in getting reimbursement for cancer immunotherapy treatments. Cancer immunotherapy is one of the priciest medications available, costing more than $100,000 per patient. This covers the price of medications, hospital stays, and multiple days of intensive care because many patients receiving cancer immunotherapy treatments have serious adverse effects.
The Keytruda maker, Merck, states that the out-of-pocket expenses for each infusion might vary from $1,000 to $1,950. However, this rate can still be excessively expensive for many patients. In the event that the patient has Medigap or Medicare Advantage (Part C), additional coverage may be obtained. The Keytruda treatment may potentially be completely covered, depending on the plan. In actuality, 41% of patients with Medicare Advantage Plans reported having no out-of-pocket costs, according to Merck. Patients in developing nations cannot afford the high cost of immunotherapy medications. One of the main obstacles facing businesses developing immunotherapy medications is high pricing. Thus, it is one of the main factors impeding this market’s growth over the predicted period.
What Questions Should You Ask Before Buying a Market Research Report?
-
How is the cancer immunotherapy market evolving?
-
What is driving and restraining the cancer immunotherapy market?
-
How will each point of care diagnostic submarket segment grow over the forecast period and how much revenue will these submarkets account for in 2034?
-
How will the market shares for each cancer immunotherapy submarket develop from 2024 to 2034?
-
What will be the main driver for the overall market from 2024 to 2034?
-
Will leading cancer immunotherapy markets broadly follow the macroeconomic dynamics, or will individual national markets outperform others?
-
How will the market shares of the national markets change by 2034 and which geographical region will lead the market in 2034?
-
Who are the leading players and what are their prospects over the forecast period?
-
What are the cancer immunotherapy projects for these leading companies?
-
How will the industry evolve during the period between 2024 and 2034? What are the implications of cancer immunotherapy projects taking place now and over the next 10 years?
-
Is there a greater need for product commercialisation to further scale the cancer immunotherapy market?
-
Where is the cancer immunotherapy market heading and how can you ensure you are at the forefront of the market?
-
What are the best investment options for new product and service lines?
-
What are the key prospects for moving companies into a new growth path and C-suite?
You need to discover how this will impact the Cancer Immunotherapy market today, and over the next 10 years:
-
Our 286-page report provides 117 tables, 189 charts/graphs exclusively to you.
-
The report highlights key lucrative areas in the industry so you can target them – NOW.
-
It contains in-depth analysis of global, regional and national sales and growth.
-
It highlights for you the key successful trends, changes and revenue projections made by your competitors.
Forecasts to 2034 and other analyses reveal commercial prospects
-
In addition to revenue forecasting to 2034, our new study provides you with recent results, growth rates, and market shares.
-
You will find original analyses, with business outlooks and developments.
-
Discover qualitative analyses (including market dynamics, drivers, opportunities, restraints and challenges), impact of rising Cancer Immunotherapy prices and recent developments.
Segments Covered in the Report
Technology
-
Monoclonal Antibodies
-
Immunomodulators
-
Other Technology
Application
-
Lung Cancer
-
Breast Cancer
-
Colorectal Cancer
-
Melanoma
-
Prostate Cancer
-
Head & Neck Cancer
-
Ovarian Cancer
-
Pancreatic Cancer
-
Others
End-users
-
Hospitals
-
Cancer Research Centres
-
Clinics
In addition to the revenue predictions for the overall world market and segments, you will also find revenue forecasts for five regional and 25 leading national markets:
North America
Europe
-
Germany
-
UK
-
France
-
Italy
-
Spain
-
Switzerland
-
Netherlands
-
Rest of Europe
Asia Pacific
-
China
-
Japan
-
India
-
Australia
-
South Korea
-
South East Asia
-
Rest of Asia Pacific
Latin America
-
Brazil
-
Mexico
-
Argentina
-
Rest of Latin America
MEA
-
GCC
-
South Africa
-
Egypt
-
Rest of MEA
The report also includes profiles for some of the leading companies in the Cancer Immunotherapy Market, 2024 to 2034, with a focus on this segment of these companies’ operations.
Leading companies profiled in the report
-
AbbVie Inc.
-
Amgen Inc.
-
AstraZeneca
-
Bayer AG
-
Bristol-Myers Squibb Company
-
F. Hoffmann-La Roche Ltd.
-
Gilead Sciences, Inc.
-
GSK plc
-
Immunocore Ltd.
-
Johnson & Johnson Services, Inc.
-
Lilly
-
Merck & Co., Inc.
-
Novartis AG
-
Pfizer Inc.
-
Sanofi
-
Takeda Pharmaceutical Company Limited
Overall world revenue for Cancer Immunotherapy Market, 2024 to 2034 in terms of value the market will surpass US$135.0 billion in 2024, our work calculates. We predict strong revenue growth through to 2034. Our work identifies which organisations hold the greatest potential. Discover their capabilities, progress, and commercial prospects, helping you stay ahead.
How will the Cancer Immunotherapy Market, 2024 to 2034 report help you?
In summary, our 280+ page report provides you with the following knowledge:
-
Revenue forecasts to 2034 for Cancer Immunotherapy Market, 2024 to 2034, with forecasts for technology, application, end-users, each forecast at a global and regional level – discover the industry’s prospects, finding the most lucrative places for investments and revenues.
-
Revenue forecasts to 2034 for five regional and 25 key national markets – See forecasts for the Cancer Immunotherapy Market, 2024 to 2034 market in North America, Europe, Asia-Pacific, Latin America, and MEA. Also forecasted is the market in the US, Canada, Mexico, Brazil, Germany, France, UK, Italy, Spain, Switzerland, Netherlands, China, India, Japan, Australia, South Korea, South East Asia, Argentina, GCC, South Africa, and Egypt among other prominent economies.
-
Prospects for established firms and those seeking to enter the market – including company profiles for 16 of the major companies involved in the Cancer Immunotherapy Market, 2024 to 2034.
Find quantitative and qualitative analyses with independent predictions. Receive information that only our report contains, staying informed with invaluable business intelligence.
Information found nowhere else
With our new report, you are less likely to fall behind in knowledge or miss out on opportunities. See how our work could benefit your research, analyses, and decisions. Visiongain’s study is for everybody needing commercial analyses for the Cancer Immunotherapy Market, 2024 to 2034, market-leading companies. You will find data, trends and predictions.
ページTOPに戻る
Table of Contents
1 Report Overview
1.1 Objectives of the Study
1.2 Introduction to Cancer Immunotherapy Market
1.3 What This Report Delivers
1.4 Why You Should Read This Report
1.5 Key Questions Answered by This Analytical Report
1.6 Who is This Report for?
1.7 Methodology
1.7.1 Market Definitions
1.7.2 Market Evaluation & Forecasting Methodology
1.7.3 Data Validation
1.7.3.1 Primary Research
1.7.3.2 Secondary Research
1.8 Frequently Asked Questions (FAQs)
1.9 Associated Visiongain Reports
1.10 About Visiongain
2 Executive Summary
3 Market Overview
3.1 Key Findings
3.2 Market Dynamics
3.3 Impact Analysis
3.3.1 Market Driving Factors
3.3.1.1 Increasing Prevalence of Cancer
3.3.1.2 Increasing Research in Cancer Immunotherapy
3.3.1.3 Increasing Funding for the Cancer Research by Government, Public and Private Sector
3.3.2 Market Restraining Factors
3.3.2.1 Reimbursement Challenges for Cancer immunotherapy
3.3.2.2 High Cost and Side-effects of Cancer Immunotherapy
3.3.3 Market Opportunities
3.3.3.1 Increased Focus towards Advanced Treatment Protocols
3.3.3.2 Significant Unmet Need in Cancer Diagnosis
3.3.3.3 Growing use of AI in Cancer immunotherapy Manufacturing
3.4 Supply Chain Analysis
3.5 Regulatory Framework
3.6 Emerging Markets and Megatrends
3.7 Porter’s Five Forces Analysis
3.7.1 Bargaining Power of Buyers (High)
3.7.2 Bargaining Power of Suppliers (Low)
3.7.3 Threat of New Entrants (Low)
3.7.4 Threat of Substitute Products (High)
3.7.5 Intensity of Competitive Rivalry (High)
3.8 PEST Analysis
4 Cancer Immunotherapy Market Analysis by Technology
4.1 Key Findings
4.2 Technology Segment: Market Attractiveness Index
4.3 Cancer Immunotherapy Market Size Estimation and Forecast by Technology
4.4 Monoclonal Antibodies
4.4.1 Market Size by Region, 2024-2034 (US$ Billion)
4.4.2 Market Share by Region, 2024 & 2034 (%)
4.5 Immunomodulators
4.5.1 Market Size by Region, 2024-2034 (US$ Billion)
4.5.2 Market Share by Region, 2024 & 2034 (%)
4.6 Other Technology
4.6.1 Market Size by Region, 2024-2034 (US$ Billion)
4.6.2 Market Share by Region, 2024 & 2034 (%)
5 Cancer Immunotherapy Market by Application
5.1 Key Findings
5.2 Application Segment: Market Attractiveness Index
5.3 Cancer Immunotherapy Market, by Application
5.4 Lung Cancer
5.4.1 Market Size by Region, 2024-2034 (US$ Billion)
5.4.2 Market Share by Region, 2024 & 2034 (%)
5.5 Breast Cancer
5.5.1 Market Size by Region, 2024-2034 (US$ Billion)
5.5.2 Market Share by Region, 2024 & 2034 (%)
5.6 Colorectal Cancer
5.6.1 Market Size by Region, 2024-2034 (US$ Billion)
5.6.2 Market Share by Region, 2024 & 2034 (%)
5.7 Melanoma
5.7.1 Market Size by Region, 2024-2034 (US$ Billion)
5.7.2 Market Share by Region, 2024 & 2034 (%)
5.8 Prostate Cancer
5.8.1 Market Size by Region, 2024-2034 (US$ Billion)
5.8.2 Market Share by Region, 2024 & 2034 (%)
5.9 Head & Neck Cancer
5.9.1 Market Size by Region, 2024-2034 (US$ Billion)
5.9.2 Market Share by Region, 2024 & 2034 (%)
5.10 Ovarian Cancer
5.10.1 Market Size by Region, 2024-2034 (US$ Billion)
5.10.2 Market Share by Region, 2024 & 2034 (%)
5.11 Pancreatic Cancer
5.11.1 Market Size by Region, 2024-2034 (US$ Billion)
5.11.2 Market Share by Region, 2024 & 2034 (%)
5.12 Others
5.12.1 Market Size by Region, 2024-2034 (US$ Billion)
5.12.2 Market Share by Region, 2024 & 2034 (%)
6 Cancer Immunotherapy Market by End-users
6.1 Key Findings
6.2 End-users Segment: Market Attractiveness Index
6.3 Cancer Immunotherapy Market by End-users Forecast, 2024-2034
6.4 Hospitals
6.4.1 Market Size by Region, 2024-2034 (US$ Billion)
6.4.2 Market Share by Region, 2024 & 2034 (%)
6.5 Cancer Research Centers
6.5.1 Market Size by Region, 2024-2034 (US$ Billion)
6.5.2 Market Share by Region, 2024 & 2034 (%)
6.6 Clinics
6.6.1 Market Size by Region, 2024-2034 (US$ Billion)
6.6.2 Market Share by Region, 2024 & 2034 (%)
7 Cancer Immunotherapy Market Analysis by Region
7.1 Key Findings
7.2 Regional Market Size Estimation and Forecast
8 North America Cancer Immunotherapy Market Analysis
8.1 Key Findings
8.2 North America Cancer Immunotherapy Market Attractiveness Index
8.3 North America Cancer Immunotherapy Market by Country, 2024, 2029 & 2034 (US$ Billion)
8.4 North America Cancer Immunotherapy Market Size Estimation and Forecast by Country
8.5 North America Cancer Immunotherapy Market Size Estimation and Forecast by Technology
8.6 North America Cancer Immunotherapy Market Size Estimation and Forecast by Application
8.7 North America Cancer Immunotherapy Market Size Estimation and Forecast by End-users
8.8 U.S. Cancer Immunotherapy Market Analysis
8.9 Canada Cancer Immunotherapy Market Analysis
9 Europe Cancer Immunotherapy Market Analysis
9.1 Key Findings
9.2 Europe Cancer Immunotherapy Market Attractiveness Index
9.3 Europe Cancer Immunotherapy Market by Country, 2024, 2029 & 2034 (US$ Billion)
9.4 Europe Cancer Immunotherapy Market Size Estimation and Forecast by Country
9.5 Europe Cancer Immunotherapy Market Size Estimation and Forecast by Technology
9.6 Europe Cancer Immunotherapy Market Size Estimation and Forecast by Application
9.7 Europe Cancer Immunotherapy Market Size Estimation and Forecast by End-users
9.8 Germany Cancer Immunotherapy Market Analysis
9.9 UK Cancer Immunotherapy Market Analysis
9.10 France Cancer Immunotherapy Market Analysis
9.11 Italy Cancer Immunotherapy Market Analysis
9.12 Spain Cancer Immunotherapy Market Analysis
9.13 Switzerland Cancer Immunotherapy Market Analysis
9.14 Netherlands Cancer Immunotherapy Market Analysis
9.15 Rest of Europe Cancer Immunotherapy Market Analysis
10 Asia Pacific Cancer Immunotherapy Market Analysis
10.1 Key Findings
10.2 Asia Pacific Cancer Immunotherapy Market Attractiveness Index
10.3 Asia Pacific Cancer Immunotherapy Market by Country, 2024, 2029 & 2034 (US$ Billion)
10.4 Asia Pacific Cancer Immunotherapy Market Size Estimation and Forecast by Country
10.5 Asia Pacific Cancer Immunotherapy Market Size Estimation and Forecast by Technology
10.6 Asia Pacific Cancer Immunotherapy Market Size Estimation and Forecast by Application
10.7 Asia Pacific Cancer Immunotherapy Market Size Estimation and Forecast by End-users
10.8 Japan Cancer Immunotherapy Market Analysis
10.9 China Cancer Immunotherapy Market Analysis
10.10 India Cancer Immunotherapy Market Analysis
10.11 Australia Cancer Immunotherapy Market Analysis
10.12 South Korea Cancer Immunotherapy Market Analysis
10.13 South East Asia Cancer Immunotherapy Market Analysis
10.14 Rest of Asia Pacific Cancer Immunotherapy Market Analysis
11 Latin America Cancer Immunotherapy Market Analysis
11.1 Key Findings
11.2 Latin America Cancer Immunotherapy Market Attractiveness Index
11.3 Latin America Cancer Immunotherapy Market by Country, 2024, 2029 & 2034 (US$ Billion)
11.4 Latin America Cancer Immunotherapy Market Size Estimation and Forecast by Country
11.5 Latin America Cancer Immunotherapy Market Size Estimation and Forecast by Technology
11.6 Latin America Cancer Immunotherapy Market Size Estimation and Forecast by Application
11.7 Latin America Cancer Immunotherapy Market Size Estimation and Forecast by End-users
11.8 Brazil Cancer Immunotherapy Market Analysis
11.9 Mexico Cancer Immunotherapy Market Analysis
11.10 Argentina Cancer Immunotherapy Market Analysis
11.11 Rest of Latin America Cancer Immunotherapy Market Analysis
12 MEA Cancer Immunotherapy Market Analysis
12.1 Key Findings
12.2 MEA Cancer Immunotherapy Market Attractiveness Index
12.3 MEA Cancer Immunotherapy Market by Country, 2024, 2029 & 2034 (US$ Billion)
12.4 MEA Cancer Immunotherapy Market Size Estimation and Forecast by Country
12.5 MEA Cancer Immunotherapy Market Size Estimation and Forecast by Technology
12.6 MEA Cancer Immunotherapy Market Size Estimation and Forecast by Application
12.7 MEA Cancer Immunotherapy Market Size Estimation and Forecast by End-users
12.8 GCC Cancer Immunotherapy Market Analysis
12.9 South Africa Cancer Immunotherapy Market Analysis
12.10 Egypt Cancer Immunotherapy Market Analysis
12.11 Rest of MEA Cancer Immunotherapy Market Analysis
13 Company Profiles
13.1 Competitive Landscape, 2023
13.2 Strategic Outlook
13.3 F. Hoffmann-La Roche Ltd.
13.3.1 Company Snapshot
13.3.2 Company Overview
13.3.3 Financial Analysis
13.3.3.1 Net Revenue, 2019-2023
13.3.3.2 R&D, 2019-2023
13.3.3.3 Segment Market Shares, 2023
13.3.3.4 Regional Market Shares, 2023
13.3.4 Product Benchmarking
13.3.5 Strategic Outlook
13.4 Merck & Co., Inc.
13.4.1 Company Snapshot
13.4.2 Company Overview
13.4.3 Financial Analysis
13.4.3.1 Net Revenue, 2019-2023
13.4.3.2 R&D, 2019-2023
13.4.3.3 Segment Market Shares, 2023
13.4.3.4 Regional Market Shares, 2023
13.4.4 Product Benchmarking
13.4.5 Strategic Outlook
13.5 Novartis AG
13.5.1 Company Snapshot
13.5.2 Company Overview
13.5.3 Financial Analysis
13.5.3.1 Net Revenue, 2019-2023
13.5.3.2 R&D, 2019-2023
13.5.3.3 Segment Market Shares, 2023
13.5.3.4 Regional Market Shares, 2023
13.5.4 Product Benchmarking
13.5.5 Strategic Outlook
13.6 Bristol-Myers Squibb Company
13.6.1 Company Snapshot
13.6.2 Company Overview
13.6.3 Financial Analysis
13.6.3.1 Net Revenue, 2019-2023
13.6.3.2 R&D, 2019-2023
13.6.3.3 Segment Market Shares, 2023
13.6.3.4 Regional Market Shares, 2023
13.6.4 Product Benchmarking
13.6.5 Strategic Outlook
13.7 Bayer AG
13.7.1 Company Snapshot
13.7.2 Company Overview
13.7.3 Financial Analysis
13.7.3.1 Net Revenue, 2019-2023
13.7.3.2 R&D, 2019-2023
13.7.3.3 Segment Market Shares, 2023
13.7.3.4 Regional Market Shares, 2023
13.7.4 Product Benchmarking
13.7.5 Strategic Outlook
13.8 AstraZeneca
13.8.1 Company Snapshot
13.8.2 Company Overview
13.8.3 Financial Analysis
13.8.3.1 Net Revenue, 2019-2023
13.8.3.2 R&D, 2019-2023
13.8.3.3 Segment Market Shares, 2023
13.8.3.4 Regional Market Shares, 2023
13.8.4 Product Benchmarking
13.8.5 Strategic Outlook
13.9 Lilly
13.9.1 Company Snapshot
13.9.2 Company Overview
13.9.3 Financial Analysis
13.9.3.1 Net Revenue, 2019-2023
13.9.3.2 R&D, 2019-2023
13.9.3.3 Regional Market Shares, 2023
13.9.4 Product Benchmarking
13.9.5 Strategic Outlook
13.10 Pfizer Inc.
13.10.1 Company Snapshot
13.10.2 Company Overview
13.10.3 Financial Analysis
13.10.3.1 Net Revenue, 2019-2023
13.10.3.2 R&D, 2019-2023
13.10.3.3 Segment Market Shares, 2023
13.10.3.4 Regional Market Shares, 2023
13.10.4 Product Benchmarking
13.10.5 Strategic Outlook
13.11 Johnson & Johnson Services, Inc.
13.11.1 Company Snapshot
13.11.2 Company Overview
13.11.3 Financial Analysis
13.11.3.1 Net Revenue, 2019-2023
13.11.3.2 R&D, 2019-2023
13.11.3.3 Segment Market Shares, 2023
13.11.3.4 Regional Market Shares, 2023
13.11.4 Product Benchmarking
13.11.5 Strategic Outlook
13.12 GSK plc
13.12.1 Company Snapshot
13.12.2 Company Overview
13.12.3 Financial Analysis
13.12.3.1 Net Revenue, 2019-2023
13.12.3.2 R&D, 2019-2023
13.12.3.3 Segment Market Shares, 2023
13.12.3.4 Regional Market Shares, 2023
13.12.4 Product Benchmarking
13.12.5 Strategic Outlook
13.13 Gilead Sciences, Inc.
13.13.1 Company Snapshot
13.13.2 Company Overview
13.13.3 Financial Analysis
13.13.3.1 Net Revenue, 2019-2023
13.13.3.2 R&D, 2019-2023
13.13.3.3 Segment Market Shares, 2023
13.13.3.4 Regional Market Shares, 2023
13.13.4 Product Benchmarking
13.13.5 Strategic Outlook
13.14 Amgen Inc.
13.14.1 Company Snapshot
13.14.2 Company Overview
13.14.3 Financial Analysis
13.14.3.1 Net Revenue, 2019-2023
13.14.3.2 R&D, 2019-2023
13.14.3.3 Regional Market Shares, 2023
13.14.4 Product Benchmarking
13.14.5 Strategic Outlook
13.15 AbbVie Inc.
13.15.1 Company Snapshot
13.15.2 Company Overview
13.15.3 Financial Analysis
13.15.3.1 Net Revenue, 2019-2023
13.15.3.2 R&D, 2019-2023
13.15.3.3 Segment Market Shares, 2023
13.15.3.4 Regional Market Shares, 2023
13.15.4 Product Benchmarking
13.15.5 Strategic Outlook
13.16 Immunocore Ltd.
13.16.1 Company Snapshot
13.16.2 Company Overview
13.16.3 Financial Analysis
13.16.3.1 Net Revenue, 2019-2023
13.16.3.2 R&D, 2019-2023
13.16.3.3 Regional Market Shares, 2023
13.16.4 Product Benchmarking
13.16.5 Strategic Outlook
13.17 Sanofi
13.17.1 Company Snapshot
13.17.2 Company Overview
13.17.3 Financial Analysis
13.17.3.1 Net Revenue, 2019-2023
13.17.3.2 R&D, 2019-2023
13.17.3.3 Segment Market Shares, 2023
13.17.3.4 Regional Market Shares, 2023
13.17.4 Product Benchmarking
13.17.5 Strategic Outlook
13.18 Takeda Pharmaceutical Company Limited.
13.18.1 Company Snapshot
13.18.2 Company Overview
13.18.3 Financial Analysis
13.18.3.1 Net Revenue, 2019-2023
13.18.3.2 R&D, 2019-2023
13.18.3.3 Segment Market Shares, 2023
13.18.3.4 Regional Market Shares, 2023
13.18.4 Product Benchmarking
13.18.5 Strategic Outlook
14 Conclusion and Recommendations
14.1 Concluding Remarks from Visiongain
14.2 Recommendations for Market Players
ページTOPに戻る
List of Tables/Graphs
List of Tables
Table 1 Cancer Immunotherapy Snapshot, 2024 & 2034 (US$ Billion, CAGR %)
Table 2 Cancer Immunotherapy Market Forecast by Technology 2024-2034 (US$ Billion, AGR %, CAGR %)
Table 3 Types of Monoclonal Antibodies
Table 4 Types of Monoclonal Antibodies and Approval Status
Table 5 Monoclonal Antibodies Segment Market Forecast by Region, 2024-2034 (US$ Billion, AGR %, CAGR %)
Table 6 Immunomodulators Market Forecast by Region, 2024-2034 (US$ Billion, AGR %, CAGR %)
Table 7 Other Technology Market Forecast by Region, 2024-2034 (US$ Billion, AGR %, CAGR %)
Table 8 Cancer Immunotherapy Market by Application, 2024-2034 (US$ Billion, AGR %, CAGR %)
Table 9 Types of Monoclonal Antibodies
Table 10 Lung Cancer Market Forecast by Region, 2024-2034 (US$ Billion, AGR %, CAGR %)
Table 11 Breast Cancer Market Forecast by Region, 2024-2034 (US$ Billion, AGR %, CAGR %)
Table 12 Colorectal Cancer Market Forecast by Region, 2024-2034 (US$ Billion, AGR %, CAGR %)
Table 13 Melanoma Market Forecast by Region, 2024-2034 (US$ Billion, AGR %, CAGR %)
Table 14 Prostate Cancer Market Forecast by Region, 2024-2034 (US$ Billion, AGR %, CAGR %)
Table 15 Head & Neck Cancer Market Forecast by Region, 2024-2034 (US$ Billion, AGR %, CAGR %)
Table 16 Ovarian Cancer Market Forecast by Region, 2024-2034 (US$ Billion, AGR %, CAGR %)
Table 17 Pancreatic Cancer Market Forecast by Region, 2024-2034 (US$ Billion, AGR %, CAGR %)
Table 18 Others Market Forecast by Region, 2024-2034 (US$ Billion, AGR %, CAGR %)
Table 19 Cancer Immunotherapy Market by End-users, 2024-2034 (US$ Billion, AGR %, CAGR %)
Table 20 Hospitals Market Forecast by Region, 2024-2034 (US$ Billion, AGR %, CAGR %)
Table 21 Cancer Research Centers Market Forecast by Region, 2024-2034 (US$ Billion, AGR %, CAGR %)
Table 22 Clinics Market Forecast by Region, 2024-2034 (US$ Billion, AGR %, CAGR %)
Table 23 Cancer Immunotherapy Market Forecast by Region, 2024-2034 (US$ Billion, AGR %, CAGR %)
Table 24 North America Cancer Immunotherapy Market Forecast by Country, 2024-2034 (US$ Billion, AGR %, CAGR %)
Table 25 North America Cancer Immunotherapy Market Forecast by Technology, 2024-2034 (US$ Billion, AGR %, CAGR %)
Table 26 North America Cancer Immunotherapy Market Forecast by Application, 2024-2034 (US$ Billion, AGR %, CAGR %)
Table 27 North America Cancer Immunotherapy Market Forecast by End-users, 2024-2034 (US$ Billion, AGR %, CAGR %)
Table 28 U.S. Cancer Immunotherapy Market Forecast, 2024-2034 (US$ Billion, AGR %, CAGR %)
Table 29 Canada Cancer Immunotherapy Market Forecast, 2024-2034 (US$ Billion, AGR %, CAGR %)
Table 30 Europe Cancer Immunotherapy Market Forecast by Country, 2024-2034 (US$ Billion, AGR %, CAGR %)
Table 31 Europe Cancer Immunotherapy Market Forecast by Technology, 2024-2034 (US$ Billion, AGR %, CAGR %)
Table 32 Europe Cancer Immunotherapy Market Forecast by Application, 2024-2034 (US$ Billion, AGR %, CAGR %)
Table 33 Europe Cancer Immunotherapy Market Forecast by End-users, 2024-2034 (US$ Billion, AGR %, CAGR %)
Table 34 Germany Cancer Immunotherapy Market Forecast, 2024-2034 (US$ Billion, AGR %, CAGR %)
Table 35 UK Cancer Immunotherapy Market Forecast, 2024-2034 (US$ Billion, AGR %, CAGR %)
Table 36 France Cancer Immunotherapy Market Forecast, 2024-2034 (US$ Billion, AGR %, CAGR %)
Table 37 Italy Cancer Immunotherapy Market Forecast, 2024-2034 (US$ Billion, AGR %, CAGR %)
Table 38 Spain Cancer Immunotherapy Market Forecast, 2024-2034 (US$ Billion, AGR %, CAGR %)
Table 39 Switzerland Cancer Immunotherapy Market Forecast, 2024-2034 (US$ Billion, AGR %, CAGR %)
Table 40 Netherlands Cancer Immunotherapy Market Forecast, 2024-2034 (US$ Billion, AGR %, CAGR %)
Table 41 Rest of Europe Cancer Immunotherapy Market Forecast, 2024-2034 (US$ Billion, AGR %, CAGR %)
Table 42 Asia Pacific Cancer Immunotherapy Market Forecast by Country, 2024-2034 (US$ Billion, AGR %, CAGR %)
Table 43 Asia Pacific Cancer Immunotherapy Market Forecast by Technology, 2024-2034 (US$ Billion, AGR %, CAGR %)
Table 44 Asia Pacific Cancer Immunotherapy Market Forecast by Application, 2024-2034 (US$ Billion, AGR %, CAGR %)
Table 45 Asia Pacific Cancer Immunotherapy Market Forecast by End-users, 2024-2034 (US$ Billion, AGR %, CAGR %)
Table 46 Japan Cancer Immunotherapy Market Forecast, 2024-2034 (US$ Billion, AGR %, CAGR %)
Table 47 China Cancer Immunotherapy Market Forecast, 2024-2034 (US$ Billion, AGR %, CAGR %)
Table 48 India Cancer Immunotherapy Market Forecast, 2024-2034 (US$ Billion, AGR %, CAGR %)
Table 49 Australia Cancer Immunotherapy Market Forecast, 2024-2034 (US$ Billion, AGR %, CAGR %)
Table 50 South Korea Cancer Immunotherapy Market Forecast, 2024-2034 (US$ Billion, AGR %, CAGR %)
Table 51 South East Asia Cancer Immunotherapy Market Forecast, 2024-2034 (US$ Billion, AGR %, CAGR %)
Table 52 Rest of Asia Pacific Cancer Immunotherapy Market Forecast, 2024-2034 (US$ Billion, AGR %, CAGR %)
Table 53 Latin America Cancer Immunotherapy Market Forecast by Country, 2024-2034 (US$ Billion, AGR %, CAGR %)
Table 54 Latin America Cancer Immunotherapy Market Forecast by Technology, 2024-2034 (US$ Billion, AGR %, CAGR %)
Table 55 Latin America Cancer Immunotherapy Market Forecast by Application, 2024-2034 (US$ Billion, AGR %, CAGR %)
Table 56 Latin America Cancer Immunotherapy Market Forecast by End-users, 2024-2034 (US$ Billion, AGR %, CAGR %)
Table 57 Brazil Cancer Immunotherapy Market Forecast, 2024-2034 (US$ Billion, AGR %, CAGR %)
Table 58 Mexico Cancer Immunotherapy Market Forecast, 2024-2034 (US$ Billion, AGR %, CAGR %)
Table 59 Argentina Cancer Immunotherapy Market Forecast, 2024-2034 (US$ Billion, AGR %, CAGR %)
Table 60 Rest of Latin America Cancer Immunotherapy Market Forecast, 2024-2034 (US$ Billion, AGR %, CAGR %)
Table 61 MEA Cancer Immunotherapy Market Forecast by Country, 2024-2034 (US$ Billion, AGR %, CAGR %)
Table 62 MEA Cancer Immunotherapy Market Forecast by Technology, 2024-2034 (US$ Billion, AGR %, CAGR %)
Table 63 MEA Cancer Immunotherapy Market Forecast by Application, 2024-2034 (US$ Billion, AGR %, CAGR %)
Table 64 MEA Cancer Immunotherapy Market Forecast by End-users, 2024-2034 (US$ Billion, AGR %, CAGR %)
Table 65 GCC Cancer Immunotherapy Market Forecast, 2024-2034 (US$ Billion, AGR %, CAGR %)
Table 66 South Africa Cancer Immunotherapy Market Forecast, 2024-2034 (US$ Billion, AGR %, CAGR %)
Table 67 Egypt Cancer Immunotherapy Market Forecast, 2024-2034 (US$ Billion, AGR %, CAGR %)
Table 68 Rest of MEA Cancer Immunotherapy Market Forecast, 2024-2034 (US$ Billion, AGR %, CAGR %)
Table 69 Strategic Outlook
Table 70 F. Hoffmann-La Roche Ltd.: Key Details, (CEO, HQ, Revenue, Founded, No. of Employees, Company Type, Website, Business Segment)
Table 71 F. Hoffmann-La Roche Ltd. : Product Benchmarking
Table 72 F. Hoffmann-La Roche Ltd.: Strategic Outlook
Table 73 Merck & Co., Inc.: Key Details, (CEO, HQ, Revenue, Founded, No. of Employees, Company Type, Website, Business Segment)
Table 74 Merck & Co., Inc.: Product Benchmarking
Table 75 Merck & Co., Inc.: Strategic Outlook
Table 76 Novartis AG: Key Details, (CEO, HQ, Revenue, Founded, No. of Employees, Company Type, Website, Business Segment)
Table 77 Novartis AG: Product Benchmarking
Table 78 Novartis AG: Strategic Outlook
Table 79 Bristol-Myers Squibb Company: Key Details, (CEO, HQ, Revenue, Founded, No. of Employees, Company Type, Website, Business Segment)
Table 80 Bristol-Myers Squibb Company: Product Benchmarking
Table 81 Bristol-Myers Squibb Company: Strategic Outlook
Table 82 Bayer AG: Key Details, (CEO, HQ, Revenue, Founded, No. of Employees, Company Type, Website, Business Segment)
Table 83 Bayer AG: Product Benchmarking
Table 84 Bayer AG: Strategic Outlook
Table 85 AstraZeneca: Key Details, (CEO, HQ, Revenue, Founded, No. of Employees, Company Type, Website, Business Segment)
Table 86 AstraZeneca: Product Benchmarking
Table 87 AstraZeneca: Strategic Outlook
Table 88 Lilly.: Key Details, (CEO, HQ, Revenue, Founded, No. of Employees, Company Type, Website, Business Segment)
Table 89 Lilly.: Product Benchmarking
Table 90 Lilly: Strategic Outlook
Table 91 Pfizer Inc.: Key Details, (CEO, HQ, Revenue, Founded, No. of Employees, Company Type, Website, Business Segment)
Table 92 Pfizer Inc.: Product Benchmarking
Table 93 Pfizer Inc.: Strategic Outlook
Table 94 Johnson & Johnson Services, Inc.: Key Details, (CEO, HQ, Revenue, Founded, No. of Employees, Company Type, Website, Business Segment)
Table 95 Johnson & Johnson Services, Inc.: Product Benchmarking
Table 96 Johnson & Johnson Services, Inc.: Strategic Outlook
Table 97 GSK plc: Key Details, (CEO, HQ, Revenue, Founded, No. of Employees, Company Type, Website, Business Segment)
Table 98 GSK plc: Product Benchmarking
Table 99 GSK plc: Strategic Outlook
Table 100 Gilead Sciences, Inc.: Key Details, (CEO, HQ, Revenue, Founded, No. of Employees, Company Type, Website, Business Segment)
Table 101 Gilead Sciences, Inc.: Product Benchmarking
Table 102 Gilead Sciences, Inc.: Strategic Outlook
Table 103 Amgen Inc.: Key Details, (CEO, HQ, Revenue, Founded, No. of Employees, Company Type, Website, Business Segment)
Table 104 Amgen Inc.: Product Benchmarking
Table 105 Amgen Inc.: Strategic Outlook
Table 106 AbbVie Inc.: Key Details, (CEO, HQ, Revenue, Founded, No. of Employees, Company Type, Website, Business Segment)
Table 107 AbbVie Inc.: Product Benchmarking
Table 108 AbbVie Inc.: Strategic Outlook
Table 109 Immunocore Ltd.: Key Details, (CEO, HQ, Revenue, Founded, No. of Employees, Company Type, Website, Business Segment)
Table 110 Immunocore Ltd.: Product Benchmarking
Table 111 Immunocore Ltd.: Strategic Outlook
Table 112 Sanofi: Key Details, (CEO, HQ, Revenue, Founded, No. of Employees, Company Type, Website, Business Segment)
Table 113 Sanofi: Product Benchmarking
Table 114 Sanofi: Strategic Outlook
Table 115 Takeda Pharmaceutical Company Limited.: Key Details, (CEO, HQ, Revenue, Founded, No. of Employees, Company Type, Website, Business Segment)
Table 116 Takeda Pharmaceutical Company Limited.: Product Benchmarking
Table 117 Takeda Pharmaceutical Company Limited.: Strategic Outlook
List of Figures
Figure 1 Cancer Immunotherapy Market Segmentation
Figure 2 Cancer Immunotherapy Market Attractiveness Index by Region
Figure 3 Cancer Immunotherapy Market by Technology: Market Attractiveness Index
Figure 4 Cancer Immunotherapy Market by Application: Market Attractiveness Index
Figure 5 Cancer Immunotherapy Market by End-users: Market Attractiveness Index
Figure 6 Cancer Immunotherapy Market: Market Dynamics
Figure 7 Cancer Immunotherapy Market: Impact Analysis
Figure 8 Cancer Immunotherapy Industry: Supply Chain Analysis
Figure 9 Cancer Immunotherapy Market: Porter’s Five Forces Analysis
Figure 10 Cancer Immunotherapy Market: PEST Analysis
Figure 11 Cancer Immunotherapy Market by Technology: Market Attractiveness Index
Figure 12 Cancer Immunotherapy Market Forecast by Technology, 2024-2034 (US$ Billion, AGR %)
Figure 13 Cancer Immunotherapy Market Share Forecast by Technology, 2024, 2029, 2034 (%)
Figure 14 Monoclonal Antibodies Segment Market Forecast by Region, 2024-2034 (US$ Billion, AGR %)
Figure 15 Monoclonal Antibodies Segment Market Share Forecast by Region, 2024 & 2034 (%)
Figure 16 Immunomodulators Market Forecast by Region, 2024-2034 (US$ Billion)
Figure 17 Immunomodulators Market Share Forecast by Region, 2024 & 2034 (%)
Figure 18 Other Technology Market Forecast by Region, 2024-2034 (US$ Billion)
Figure 19 Other Technology Market Share Forecast by Region, 2024 & 2034 (%)
Figure 20 Cancer Immunotherapy Market by Application: Market Attractiveness Index
Figure 21 Cancer Immunotherapy Market by Application, 2024-2034 (US$ Billion)
Figure 22 Cancer Immunotherapy Market Share Forecast by Application, 2024, 2029, 2034 (%)
Figure 23 Lung Cancer Market Forecast by Region, 2024-2034 (US$ Billion)
Figure 24 Lung Cancer Market Share Forecast by Region, 2024 & 2034 (%)
Figure 25 Breast Cancer Market Forecast by Region, 2024-2034 (US$ Billion)
Figure 26 Breast Cancer Market Share Forecast by Region, 2024 & 2034 (%)
Figure 27 Colorectal Cancer Market Forecast by Region, 2024-2034 (US$ Billion)
Figure 28 Colorectal Cancer Market Share Forecast by Region, 2024 & 2034 (%)
Figure 29 Melanoma Market Forecast by Region, 2024-2034 (US$ Billion)
Figure 30 Melanoma Market Share Forecast by Region, 2024 & 2034 (%)
Figure 31 Prostate Cancer Market Forecast by Region, 2024-2034 (US$ Billion)
Figure 32 Prostate Cancer Market Share Forecast by Region, 2024 & 2034 (%)
Figure 33 Head & Neck Cancer Market Forecast by Region, 2024-2034 (US$ Billion)
Figure 34 Head & Neck Cancer Market Share Forecast by Region, 2024 & 2034 (%)
Figure 35 Ovarian Cancer Market Forecast by Region, 2024-2034 (US$ Billion)
Figure 36 Ovarian Cancer Market Share Forecast by Region, 2024 & 2034 (%)
Figure 37 Pancreatic Cancer Market Forecast by Region, 2024-2034 (US$ Billion)
Figure 38 Pancreatic Cancer Market Share Forecast by Region, 2024 & 2034 (%)
Figure 39 Others Market Forecast by Region, 2024-2034 (US$ Billion)
Figure 40 Others Market Share Forecast by Region, 2024 & 2034 (%)
Figure 41 Cancer Immunotherapy Market by End-users: Market Attractiveness Index
Figure 42 Cancer Immunotherapy Market by End-users, 2024-2034 (US$ Billion)
Figure 43 Cancer Immunotherapy Market Share by End-users, 2024, 2029, 2034 (%)
Figure 44 Hospitals Market Forecast by Region, 2024-2034 (US$ Billion)
Figure 45 Hospitals Market Share Forecast by Region, 2024 & 2034 (%)
Figure 46 Cancer Research Centers Market Forecast by Region, 2024-2034 (US$ Billion)
Figure 47 Cancer Research Centers Market Share Forecast by Region, 2024 & 2034 (%)
Figure 48 Clinics Market Forecast by Region, 2024-2034 (US$ Billion)
Figure 49 Clinics Market Share Forecast by Region, 2024 & 2034 (%)
Figure 50 Cancer Immunotherapy Market Forecast by Region 2024 and 2034 (Revenue, CAGR%)
Figure 51 Cancer Immunotherapy Market Share Forecast by Region 2024, 2029, 2034 (%)
Figure 52 Cancer Immunotherapy Market by Region, 2024-2034 (US$ Billion, AGR %)
Figure 53 North America Cancer Immunotherapy Market Attractiveness Index
Figure 54 North America Cancer Immunotherapy Market by Region, 2024, 2029 & 2034 (US$ Billion)
Figure 55 North America Cancer Immunotherapy Market Forecast by Country, 2024-2034 (US$ Billion, AGR %)
Figure 56 North America Cancer Immunotherapy Market Share Forecast by Country, 2024 & 2034 (%)
Figure 57 North America Cancer Immunotherapy Market Forecast by Technology, 2024-2034 (US$ Billion, AGR %)
Figure 58 North America Cancer Immunotherapy Market Share Forecast by Technology, 2024 & 2034 (%)
Figure 59 North America Cancer Immunotherapy Market Forecast by Application, 2024-2034 (US$ Billion, AGR %)
Figure 60 North America Cancer Immunotherapy Market Share Forecast by Application, 2024 & 2034 (%)
Figure 61 North America Cancer Immunotherapy Market Forecast by End-users, 2024-2034 (US$ Billion, AGR %)
Figure 62 North America Cancer Immunotherapy Market Share Forecast by End-users, 2024 & 2034 (%)
Figure 63 U.S. Cancer Immunotherapy Market Forecast, 2024-2034 (US$ Billion, AGR %)
Figure 64 Canada Cancer Immunotherapy Market Forecast, 2024-2034 (US$ Billion, AGR %)
Figure 65 Europe Cancer Immunotherapy Market Attractiveness Index
Figure 66 Europe Cancer Immunotherapy Market by Country, 2024, 2029 & 2034 (US$ Billion)
Figure 67 Europe Cancer Immunotherapy Market Forecast by Country, 2024-2034 (US$ Billion)
Figure 68 Europe Cancer Immunotherapy Market Share Forecast by Country, 2024 & 2034 (%)
Figure 69 Europe Cancer Immunotherapy Market Forecast by Technology, 2024-2034 (US$ Billion)
Figure 70 Europe Cancer Immunotherapy Market Share Forecast by Technology, 2024 & 2034 (%)
Figure 71 Europe Cancer Immunotherapy Market Forecast by Application, 2024-2034 (US$ Billion)
Figure 72 Europe Cancer Immunotherapy Market Share Forecast by Application, 2024 & 2034 (%)
Figure 73 Europe Cancer Immunotherapy Market Forecast by End-users, 2024-2034 (US$ Billion)
Figure 74 Europe Cancer Immunotherapy Market Share Forecast by End-users, 2024 & 2034(%)
Figure 75 Germany Cancer Immunotherapy Market Forecast, 2024-2034 (US$ Billion, AGR %)
Figure 76 UK Cancer Immunotherapy Market Forecast, 2024-2034 (US$ Billion, AGR %)
Figure 77 France Cancer Immunotherapy Market Forecast, 2024-2034 (US$ Billion, AGR %)
Figure 78 Italy Cancer Immunotherapy Market Forecast, 2024-2034 (US$ Billion, AGR %)
Figure 79 Spain Cancer Immunotherapy Market Forecast, 2024-2034 (US$ Billion, AGR %)
Figure 80 Switzerland Cancer Immunotherapy Market Forecast, 2024-2034 (US$ Billion, AGR %)
Figure 81 Netherlands Cancer Immunotherapy Market Forecast, 2024-2034 (US$ Billion, AGR %)
Figure 82 Rest of Europe Cancer Immunotherapy Market Forecast, 2024-2034 (US$ Billion, AGR %)
Figure 83 Asia Pacific Cancer Immunotherapy Market Attractiveness Index
Figure 84 Asia Pacific Cancer Immunotherapy Market by Region, 2024, 2029 & 2034 (US$ Billion)
Figure 85 Asia Pacific Cancer Immunotherapy Market Forecast by Country, 2024-2034 (US$ Billion)
Figure 86 Asia Pacific Cancer Immunotherapy Market Share Forecast by Country, 2024 & 2034 (%)
Figure 87 Asia Pacific Cancer Immunotherapy Market Forecast by Technology, 2024-2034 (US$ Billion)
Figure 88 Asia Pacific Cancer Immunotherapy Market Share Forecast by Technology, 2024 & 2034 (%)
Figure 89 Asia Pacific Cancer Immunotherapy Market Forecast by Application, 2024-2034 (US$ Billion)
Figure 90 Asia Pacific Cancer Immunotherapy Market Share Forecast by Application, 2024 & 2034 (%)
Figure 91 Asia Pacific Cancer Immunotherapy Market Forecast by End-users, 2024-2034 (US$ Billion)
Figure 92 Asia Pacific Cancer Immunotherapy Market Share Forecast by End-users, 2024 & 2034 (%)
Figure 93 Japan Cancer Immunotherapy Market Forecast, 2024-2034 (US$ Billion, AGR %)
Figure 94 China Cancer Immunotherapy Market Forecast, 2024-2034 (US$ Billion, AGR %)
Figure 95 India Cancer Immunotherapy Market Forecast, 2024-2034 (US$ Billion, AGR %)
Figure 96 Australia Cancer Immunotherapy Market Forecast, 2024-2034 (US$ Billion, AGR %)
Figure 97 South Korea Cancer Immunotherapy Market Forecast, 2024-2034 (US$ Billion, AGR %)
Figure 98 South East Asia Cancer Immunotherapy Market Forecast, 2024-2034 (US$ Billion, AGR %)
Figure 99 Rest of Asia Pacific Cancer Immunotherapy Market Forecast, 2024-2034 (US$ Billion, AGR %)
Figure 100 Latin America Cancer Immunotherapy Market Attractiveness Index
Figure 101 Latin America Cancer Immunotherapy Market by Region, 2024, 2029 & 2034 (US$ Billion)
Figure 102 Latin America Cancer Immunotherapy Market Forecast by Country, 2024-2034 (US$ Billion)
Figure 103 Latin America Cancer Immunotherapy Market Share Forecast by Country, 2024 & 2034 (%)
Figure 104 Latin America Cancer Immunotherapy Market Forecast by Technology, 2024-2034 (US$ Billion)
Figure 105 Latin America Cancer Immunotherapy Market Share Forecast by Technology, 2024 & 2034 (%)
Figure 106 Latin America Cancer Immunotherapy Market Forecast by Application, 2024-2034 (US$ Billion)
Figure 107 Latin America Cancer Immunotherapy Market Share Forecast by Application, 2024 & 2034 (%)
Figure 108 Latin America Cancer Immunotherapy Market Forecast by End-users, 2024-2034 (US$ Billion)
Figure 109 Latin America Cancer Immunotherapy Market Share Forecast by End-users, 2024 & 2034 (%)
Figure 110 Brazil Cancer Immunotherapy Market Forecast, 2024-2034 (US$ Billion, AGR %)
Figure 111 Mexico Cancer Immunotherapy Market Forecast, 2024-2034 (US$ Billion, AGR %)
Figure 112 Argentina Cancer Immunotherapy Market Forecast, 2024-2034 (US$ Billion, AGR %)
Figure 113 Rest of Latin America Cancer Immunotherapy Market Forecast, 2024-2034 (US$ Billion, AGR %)
Figure 114 MEA Cancer Immunotherapy Market Attractiveness Index
Figure 115 MEA Cancer Immunotherapy Market by Region, 2024, 2029 & 2034 (US$ Billion)
Figure 116 MEA Cancer Immunotherapy Market Forecast by Country, 2024-2034 (US$ Billion)
Figure 117 MEA Cancer Immunotherapy Market Share Forecast by Country, 2024 & 2034 (%)
Figure 118 MEA Cancer Immunotherapy Market Forecast by Technology, 2024-2034 (US$ Billion)
Figure 119 MEA Cancer Immunotherapy Market Share Forecast by Technology, 2024 & 2034 (%)
Figure 120 MEA Cancer Immunotherapy Market Forecast by Application, 2024-2034 (US$ Billion)
Figure 121 MEA Cancer Immunotherapy Market Share Forecast by Application, 2024 & 2034 (%)
Figure 122 MEA Cancer Immunotherapy Market Forecast by End-users, 2024-2034 (US$ Billion)
Figure 123 MEA Cancer Immunotherapy Market Share Forecast by End-users, 2024 & 2034 (%)
Figure 124 GCC Cancer Immunotherapy Market Forecast, 2024-2034 (US$ Billion, AGR %)
Figure 125 South Africa Cancer Immunotherapy Market Forecast, 2024-2034 (US$ Billion, AGR %)
Figure 126 Egypt Cancer Immunotherapy Market Forecast, 2024-2034 (US$ Billion, AGR %)
Figure 127 Rest of MEA Cancer Immunotherapy Market Forecast, 2024-2034 (US$ Billion, AGR %)
Figure 128 Cancer Immunotherapy Market: Company Share/Ranking, 2023
Figure 129 F. Hoffmann-La Roche Ltd.: Net Revenue, 2019-2023 (US$ Million, AGR %)
Figure 130 F. Hoffmann-La Roche Ltd.: R&D, 2019-2023 (US$ Million, AGR %)
Figure 131 F. Hoffmann-La Roche Ltd.: Segment Market Shares, 2023
Figure 132 F. Hoffmann-La Roche Ltd. Inc.: Regional Market Shares, 2023
Figure 133 Merck & Co., Inc.: Net Revenue, 2019-2023 (US$ Million, AGR %)
Figure 134 Merck & Co., Inc.: R&D, 2019-2023 (US$ Million, AGR %)
Figure 135 Merck & Co., Inc.: Segment Market Shares, 2023
Figure 136 Merck & Co., Inc.: Regional Market Shares, 2023
Figure 137 Novartis AG: Net Revenue, 2019-2023 (US$ Million, AGR %)
Figure 138 Novartis AG: R&D, 2019-2023 (US$ Million, AGR %)
Figure 139 Novartis AG: Segment Market Shares, 2023
Figure 140 Novartis AG: Regional Market Shares, 2023
Figure 141 Bristol-Myers Squibb Company: Net Revenue, 2019-2023 (US$ Million, AGR %)
Figure 142 Bristol-Myers Squibb Company : R&D, 2019-2023 (US$ Million, AGR %)
Figure 143 Bristol-Myers Squibb Company: Segment Market Shares, 2023
Figure 144 Bristol-Myers Squibb Company: Regional Market Shares, 2023
Figure 145 Bayer AG: Net Revenue, 2019-2023 (US$ Million, AGR (%)
Figure 146 Bayer AG: R&D, 2019-2023 (US$ Million, AGR %)
Figure 147 Bayer AG: Segment Market Shares, 2023
Figure 148 Bayer AG: Regional Market Shares, 2023
Figure 149 AstraZeneca: Net Revenue, 2019-2023 (US$ Million, AGR (%)
Figure 150 AstraZeneca: R&D, 2019-2023 (US$ Million, AGR %)
Figure 151 AstraZeneca: Segment Market Shares, 2023
Figure 152 AstraZeneca: Regional Market Shares, 2023
Figure 153 Lilly: Net Revenue, 2019-2023 (US$ Million, AGR (%)
Figure 154 Lilly: R&D, 2019-2023 (US$ Million, AGR %)
Figure 155 Lilly: Regional Market Shares, 2023
Figure 156 Pfizer Inc.: Net Revenue, 2019-2023 (US$ Million, AGR %)
Figure 157 Pfizer Inc.: R&D, 2019-2023 (US$ Million, AGR %)
Figure 158 Pfizer Inc.: Segment Market Shares, 2023
Figure 159 Pfizer Inc.: Regional Market Shares, 2023
Figure 160 Johnson & Johnson Services, Inc.: Net Revenue, 2019-2023 (US$ Million, AGR %)
Figure 161 Johnson & Johnson Services, Inc.: R&D, 2019-2023 (US$ Million, AGR %)
Figure 162 Johnson & Johnson Services, Inc.: Segment Market Shares, 2023
Figure 163 Johnson & Johnson Services, Inc.: Regional Market Shares, 2023
Figure 164 GSK plc: Net Revenue, 2019-2023 (US$ Million, AGR %)
Figure 165 GSK plc: R&D, 2019-2023 (US$ Million, AGR %)
Figure 166 GSK plc: Segment Market Shares, 2023
Figure 167 GSK plc: Regional Market Shares, 2023
Figure 168 Gilead Sciences, Inc.: Net Revenue, 2019-2023 (US$ Million, AGR %)
Figure 169 Gilead Sciences Inc.: R&D, 2019-2023 (US$ Million, AGR %)
Figure 170 Gilead Sciences, Inc.: Segment Market Shares, 2023
Figure 171 Gilead Sciences, Inc.: Regional Market Shares, 2023
Figure 172 Amgen Inc.: Net Revenue, 2019-2023 (US$ Million, AGR %)
Figure 173 Amgen Inc.: R&D, 2019-2023 (US$ Million, AGR %)
Figure 174 Amgen Inc.: Regional Market Shares, 2023
Figure 175 AbbVie Inc.: Net Revenue, 2019-2023 (US$ Million, AGR %)
Figure 176 AbbVie Inc.: R&D, 2019-2023 (US$ Million, AGR %)
Figure 177 AbbVie Inc.: Segment Market Shares, 2023
Figure 178 AbbVie Inc.: Regional Market Shares, 2023
Figure 179 Immunocore Ltd.: Net Revenue, 2019-2023 (US$ Million, AGR %)
Figure 180 Immunocore Ltd.: R&D, 2019-2023 (US$ Million, AGR %)
Figure 181 Immunocore Ltd.: Regional Market Shares, 2023
Figure 182 Sanofi: Net Revenue, 2019-2023 (US$ Million, AGR %)
Figure 183 Sanofi: R&D, 2019-2023 (US$ Million, AGR %)
Figure 184 Sanofi: Segment Market Shares, 2023
Figure 185 Sanofi: Regional Market Shares, 2023
Figure 186 Takeda Pharmaceutical Company Limited: Net Revenue, 2019-2023 (US$ Million, AGR %)
Figure 187 Takeda Pharmaceutical Company Limited: R&D, 2019-2023 (US$ Million, AGR %)
Figure 188 Takeda Pharmaceutical Company Limited: Segment Market Shares, 2023
Figure 189 Takeda Pharmaceutical Company Limited.: Regional Market Shares, 2023
ページTOPに戻る
本レポートと同じKEY WORD(cancer)の最新刊レポート
関連レポート(キーワード「免疫」)
よくあるご質問
Visiongain社はどのような調査会社ですか?
英国の調査会社ヴィジョンゲイン社(Visiongain)は、通信とエネルギーのほか、自動車や化学・医薬品、金属など、広範な市場を対象に調査を行っています。自動車市場については、市場全般に関する調査のほ... もっと見る
調査レポートの納品までの日数はどの程度ですか?
在庫のあるものは速納となりますが、平均的には 3-4日と見て下さい。
但し、一部の調査レポートでは、発注を受けた段階で内容更新をして納品をする場合もあります。
発注をする前のお問合せをお願いします。
注文の手続きはどのようになっていますか?
1)お客様からの御問い合わせをいただきます。
2)見積書やサンプルの提示をいたします。
3)お客様指定、もしくは弊社の発注書をメール添付にて発送してください。
4)データリソース社からレポート発行元の調査会社へ納品手配します。
5) 調査会社からお客様へ納品されます。最近は、pdfにてのメール納品が大半です。
お支払方法の方法はどのようになっていますか?
納品と同時にデータリソース社よりお客様へ請求書(必要に応じて納品書も)を発送いたします。
お客様よりデータリソース社へ(通常は円払い)の御振り込みをお願いします。
請求書は、納品日の日付で発行しますので、翌月最終営業日までの当社指定口座への振込みをお願いします。振込み手数料は御社負担にてお願いします。
お客様の御支払い条件が60日以上の場合は御相談ください。
尚、初めてのお取引先や個人の場合、前払いをお願いすることもあります。ご了承のほど、お願いします。
データリソース社はどのような会社ですか?
当社は、世界各国の主要調査会社・レポート出版社と提携し、世界各国の市場調査レポートや技術動向レポートなどを日本国内の企業・公官庁及び教育研究機関に提供しております。
世界各国の「市場・技術・法規制などの」実情を調査・収集される時には、データリソース社にご相談ください。
お客様の御要望にあったデータや情報を抽出する為のレポート紹介や調査のアドバイスも致します。
|
|


