皮膚科治療薬市場レポート:2024-2034
Dermatological Drugs Market Report 2024-2034
レポート詳細
皮膚科治療薬市場レポート 2024-2034年 :本レポートは、新たな収益機会を求める著名企業にとって不可欠であり、業界とその固有のダイナミクスに関する理解を深めることを目的としてい... もっと見る
※上記価格は部署ライセンス(Departmental licence)価格です。
その他の価格についてはデータリソースまでお問合せください。
日本語のページは自動翻訳を利用し作成しています。
実際のレポートは英文のみでご納品いたします。
サマリー
レポート詳細
皮膚科治療薬市場レポート 2024-2034年:本レポートは、新たな収益機会を求める著名企業にとって不可欠であり、業界とその固有のダイナミクスに関する理解を深めることを目的としています。本レポートは、様々な分野への多角化や新たな地域への事業展開に関心のある企業にとって貴重な洞察を提供します。
皮膚科治療薬の需要を牽引する老年人口
世界人口の高齢化がかつてないペースで進む中、皮膚科用医薬品市場は大幅な拡大が見込まれている。世界保健機関(WHO)によると、2050年までに高齢者の80%が中低所得国に居住するようになるという。高齢化の急速な加速は、過去のトレンドを上回るものであり、これが重要な起爆剤となっている。WHOによれば、2030年までに6人に1人が60歳以上になるという。また、2021年から2050年にかけて、アジアでは65歳以上の人口が5億人以上増加し、皮膚科治療薬の市場が急拡大する。この人口動態の変化は、シワ、シミ、高齢者に多い皮膚疾患など、加齢に関連する皮膚科的な悩みに合わせたスキンケアソリューションに対する需要の増加を意味する。従って、今後数年間は、拡大する老人人口のユニークなニーズが原動力となり、皮膚科医薬品業界にとって有利な時代を迎えることになる。
ナノテクノロジーによる薬物送達が皮膚科治療薬市場に革命をもたらす可能性
皮膚科学のダイナミックな状況において、薬物送達における最先端技術の進歩の統合は、市場をかつてない高みへと押し上げる態勢を整えている。ナノテクノロジーの出現は、皮膚細胞の正確なターゲティングを可能にし、副作用を最小限に抑えながら皮膚科治療薬の有効性を高める。この画期的なアプローチは、よりオーダーメイドで効率的な治療を保証し、患者の転帰と満足度を高める。マイクロニードル・テクノロジーは、皮膚科治療薬の投与を再構築している。これらの低侵襲デバイスは痛みを伴わずに皮膚を貫通し、治療薬の制御された持続的放出を促進する。これは患者のコンプライアンスを向上させるだけでなく、薬剤の吸収を最適化し、より迅速で効果的な結果をもたらす。NanoVibronix社(米国)やNanologica社(スウェーデン)など、スキンケア用途のナノキャリアやスマートデリバリーシステムの研究開発に積極的な企業もある。
さらに、薬剤製剤にスマートポリマーを組み込むことは、皮膚科治療におけるパラダイムシフトを意味する。これらのポリマーは特定の生理学的な合図に反応し、適切なタイミングで適切な量の薬剤を放出する。この精度の高さは治療効果を高め、塗布回数を減らし、副作用を最小限に抑える。
市場調査レポートを購入する前にすべき質問とは?
-
皮膚科治療薬市場はどのように発展しているのか?
-
皮膚科治療薬市場の牽引役と阻害要因は何か?
-
皮膚科治療薬の各サブマーケットは予測期間中にどのように成長し、2034年にはどれくらいの売上を占めるようになるのか?
-
2024年から2034年にかけて、皮膚科治療薬の各サブマーケットの市場シェアはどのように推移するのか?
-
2024年から2034年にかけて、市場全体を牽引する主な要因は何か?
-
主要な皮膚科用医薬品市場はマクロ経済の動きに幅広く追随するのか、それとも個々の国市場が他を凌駕するのか。
-
2034年までに各国市場のシェアはどのように変化し、どの地域が2034年の市場をリードするのか。
-
主要プレーヤーと予測期間中の見通しは?
-
これらの大手企業の皮膚科治療薬プロジェクトとは?
-
2024年から2034年の間に、業界はどのように発展するのか?皮膚科学分野の影響とは?
-
現在、そして今後10年の間に行われる薬物プロジェクトは?
-
皮膚科治療薬市場をさらに拡大するために、製品化の必要性は高まっているのか?
-
皮膚科用医薬品市場はどこに向かっているのか、そしてどのようにすれば市場の最前線に立てるのか?
-
新商品や新サービスに最適な投資方法とは?
-
企業を新たな成長軌道に乗せ、C-suiteに移行させるための重要な展望とは?
このことが、現在、そして今後10年間の皮膚科薬市場にどのような影響を与えるかを見極める必要がある:
-
280ページに及ぶレポートには、113の表と160の図表が掲載されている。
-
について本レポートでは、業界の主要な有利分野を取り上げている。今すぐ
-
世界、地域、国の売上高と成長に関する詳細な分析が含まれている。
-
競合他社が成功した主なトレンド、変化、収益予測をハイライトします。
本レポートは、皮膚科用医薬品市場が今後10年間にどのように発展していくのか、またCOVID-19の景気後退と好転の変動に合わせてどのように発展していくのかをTODAYでお伝えします。この市場は過去10年間のどの時点よりも今が重要である。
2034年までの予測やその他の分析から、商業的な展望が明らかになる
-
2034年までの収益予測に加え、最近の実績、成長率、市場シェアも提供している。
-
ビジネスの展望や展開など、独自の分析が掲載されている。
-
定性的分析(市場ダイナミクス、促進要因、機会、阻害要因、課題など)、コスト構造、皮膚科用医薬品の価格上昇の影響、最近の動向をご覧いただけます。
本レポートには、COVID-19が業界と貴社にどのような影響を与えるかについてのデータ分析と貴重な洞察が含まれている。本レポートでは、COVID-19の4つの回復パターンとその影響、すなわち「V」、「L」、「W」、「U」について論じている。
レポート対象セグメント
投与経路
病気
処方箋モード
流通チャネル
世界市場全体と各分野の売上予測に加え、5つの地域と21の主要国市場の売上予測も掲載しています:
北米
欧州
-
ドイツ
-
英国
-
フランス
-
スペイン
-
イタリア
-
ロシア
-
その他の欧州
アジア太平洋
-
中国
-
日本
-
インド
-
オーストラリア
-
韓国
-
その他のアジア太平洋
ラテンアメリカ
MEA
また、2024年から2034年までの皮膚科治療薬市場における主要企業のプロファイルも掲載している。
報告書に掲載されている主要企業
-
AbbVie Inc.
-
AstraZeneca
-
Bayer AG
-
DermBiont, Inc.
-
F. Hoffmann-La Roche Ltd
-
GSK plc
-
Johnson & Johnson Services, Inc.
-
LEO Pharma A/S
-
Mayne Pharma Group Limited
-
Merck & Co., Inc.
-
Novartis AG
-
Pfizer Inc.
-
Regeneron Pharmaceuticals Inc.
-
Roivant Sciences Ltd.
-
Teva Pharmaceutical Industries Ltd.
-
Verrica Pharmaceuticals
2024年から2034年までの皮膚科治療薬市場全体の世界売上高(金額ベース)は、2024年に300億米ドルを突破する。2034年まで力強い収益成長を予測。当研究所では、最も大きな可能性を秘めた組織を特定しています。各組織の能力、進捗状況、商業的展望を把握することで、常に一歩先を行くことができます。
皮膚科治療薬市場、2024-2034年レポートはどのようにお役に立ちますか?
要約すると、280ページに及ぶこのレポートは、以下のような知識を提供する:
-
皮膚科治療薬市場の2024年から2034年までの収益予測、投与経路、疾患、処方形態、流通経路の各予測を世界および地域レベルで掲載 - 業界の将来性を発見し、投資と収益に最も有利な場所を見つけることができます。
-
5つの地域と21の主要国市場の2034年までの収益予測 - 北米、ヨーロッパ、アジア太平洋、ラテンアメリカ、MEAの皮膚科医薬品市場2024年から2034年までの市場予測をご覧ください。また、米国、カナダ、メキシコ、ブラジル、ドイツ、フランス、英国、イタリア、中国、インド、日本、オーストラリアなどの主要国の市場も予測しています。
-
2024年から2034年までの皮膚科治療薬市場に関わる主要企業16社の企業プロファイルを含む。
独自の予測による定量的・定性的分析をご覧ください。私たちのレポートだけに含まれる情報を入手し、貴重なビジネスインテリジェンスで情報を得ることができます。
他にはない情報
私たちの新しいレポートがあれば、知識に遅れをとったり、チャンスを逃したりする可能性が低くなります。Visiongainの調査レポートが貴社の調査、分析、意思決定にどのように役立つかをご覧ください。Visiongainのこの調査レポートは、皮膚科治療薬市場(2024年~2034年)に関する商業分析を必要とするすべての方、市場のリーディングカンパニーを対象としています。データ、トレンド、予測をご覧いただけます。
ページTOPに戻る
目次
目次
1 レポート概要
1.1 研究の目的
1.2 皮膚科治療薬市場の紹介
1.3 本レポートの内容
1.4 本レポートを読むべき理由
1.5 本分析レポートが回答する主な質問
1.6 本レポートの対象者
1.7 方法論
1.7.1 市場の定義
1.7.2 市場評価・予測手法
1.7.3 データの検証
1.7.3.1 一次調査
1.7.3.2 セカンダリーリサーチ
1.8 よくある質問(FAQ)
1.9 Visiongainの関連レポート
1.10 Visiongainについて
2 エグゼクティブ・サマリー
3 市場概要
3.1 主要な調査結果
3.2 市場ダイナミクス
3.2.1 市場促進要因
3.2.1.1 皮膚疾患の有病率の増加
3.2.1.2 意識の高まりと患者教育
3.2.1.3 グローバル化と都市化
3.2.1.4 皮膚科学への革命:高度な薬物送達技術による市場成長の実現
3.2.1.5 革新的なブレークスルー:R&D投資の急増が皮膚科治療薬市場を牽引
3.2.1.6 皮膚科治療薬市場を牽引する高齢者人口
3.2.2 市場抑制要因
3.2.2.1 ジェネリック競争
3.2.2.2 副作用と安全性への懸念
3.2.2.3 薬剤耐性
3.2.2.4 非薬理学的選択肢:皮膚科治療薬市場成長の阻害要因
3.2.2.5 皮膚科治療薬分野における限られた償還と適用範囲の課題
3.2.2.6 皮膚科治療薬市場成長の障壁となる規制当局の承認プロセス
3.2.3 市場機会
3.2.3.1 新規皮膚科治療薬の承認
3.2.3.2 皮膚科学の研究と技術の進歩
3.2.3.3 遠隔医療とEヘルス
3.3 COVID-19の影響分析
3.4 ポーターのファイブフォース分析
3.4.1 サプライヤーの交渉力
3.4.2 買い手の交渉力
3.4.3 競争相手のライバル関係
3.4.4 代替品による脅威
3.4.5 新規参入企業の脅威
3.5 PEST分析
3.5.1 政治的要因
3.5.2 経済
3.5.3 社会
3.5.4 技術的
4 皮膚科治療薬市場分析:投与経路別
4.1 主要調査結果
4.2 投与経路セグメント 市場魅力度指数
4.3 皮膚科治療薬の投与経路別市場規模推定と予測
4.4 外用剤
4.4.1 2024〜2034年の地域別市場規模(US$ Billion)
4.4.2 地域別市場シェア、2024年・2034年(%)
4.5 経口剤
4.5.1 2024〜2034年の地域別市場規模(US$ Billion)
4.5.2 地域別市場シェア、2024年・2034年(%)
4.6 非経口剤
4.6.1 2024〜2034年の地域別市場規模(US$ Billion)
4.6.2 地域別市場シェア、2024年・2034年(%)
5 皮膚科治療薬市場分析:疾患別
5.1 主な調査結果
5.2 疾患セグメント 市場魅力度指数
5.3 疾患別皮膚科治療薬市場規模の推定と予測
5.4 乾癬
5.4.1 2024〜2034年の地域別市場規模(US$ Billion)
5.4.2 地域別市場シェア、2024年・2034年(%)
5.5 皮膚炎
5.5.1 2024〜2034年の地域別市場規模(US$ Billion)
5.5.2 地域別市場シェア、2024年・2034年(%)
5.6 にきび
5.6.1 2024〜2034年の地域別市場規模(US$ Billion)
5.6.2 地域別市場シェア、2024年・2034年 (%)
5.7 皮膚感染症
5.7.1 2024〜2034年の地域別市場規模(US$ Billion)
5.7.2 地域別市場シェア、2024年・2034年(%)
5.8 その他
5.8.1 2024〜2034年の地域別市場規模(US$ Billion)
5.8.2 地域別市場シェア、2024年・2034年(%)
6 皮膚科治療薬市場分析:処方形態別
6.1 主要調査結果
6.2 処方様式セグメント 市場魅力度指数
6.3 皮膚科治療薬の処方形態別市場規模推定と予測
6.4 処方薬
6.4.1 2024〜2034年の地域別市場規模(US$ Billion)
6.4.2 地域別市場シェア、2024年・2034年(%)
6.5 一般用医薬品
6.5.1 2024〜2034年の地域別市場規模(US$ Billion)
6.5.2 地域別市場シェア、2024年・2034年(%)
7 皮膚科治療薬市場分析:流通チャネル別
7.1 主要調査結果
7.2 流通チャネルセグメント 市場魅力度指数
7.3 流通チャネル別皮膚科治療薬市場規模推定と予測
7.4 小売薬局
7.4.1 2024〜2034年の地域別市場規模(US$ Billion)
7.4.2 地域別市場シェア、2024年・2034年(%)
7.5 病院薬局
7.5.1 2024〜2034年の地域別市場規模(US$ Billion)
7.5.2 地域別市場シェア、2024年・2034年(%)
7.6 オンライン薬局
7.6.1 2024〜2034年の地域別市場規模(US$ Billion)
7.6.2 地域別市場シェア、2024年・2034年(%)
7.7 その他
7.7.1 2024〜2034年の地域別市場規模(US$ Billion)
7.7.2 地域別市場シェア、2024年・2034年(%)
8 皮膚科治療薬市場分析:地域別
8.1 主要な調査結果
8.2 地域別市場規模の推定と予測
9 北米の皮膚科治療薬市場分析
9.1 主要な調査結果
9.2 北米の皮膚科治療薬市場魅力度指数
9.3 北米の皮膚科治療薬国別市場、2024年、2029年、2034年(US$ Billion)
9.4 北米の皮膚科治療薬市場規模推定と予測:国別
9.5 北米の皮膚科治療薬市場規模推定と予測:成分別
9.6 北米の皮膚科治療薬市場規模推定と予測:疾患別
9.7 北米の皮膚科治療薬市場規模推定と予測:処方形態別
9.8 北米の皮膚科治療薬市場規模推定と予測:流通経路別
9.9 アメリカの皮膚科用薬市場分析
9.10 カナダの皮膚科治療薬市場分析
10 欧州の皮膚科治療薬市場分析
10.1 主要な調査結果
10.2 欧州の皮膚科治療薬市場魅力度指数
10.3 欧州の皮膚科治療薬国別市場、2024年、2029年、2034年(US$ Billion)
10.4 欧州の皮膚科治療薬市場規模推定と予測:国別
10.5 欧州の皮膚科治療薬市場規模推定と予測:投与経路別
10.6 欧州の皮膚科治療薬市場規模推定と予測:疾患別
10.7 欧州の皮膚科治療薬市場規模推定と予測:処方形態別
10.8 欧州の皮膚科治療薬市場規模推定と予測:流通経路別
10.9 ドイツの皮膚科治療薬市場分析
10.10 フランスの皮膚科治療薬市場分析
10.11 イギリスの皮膚科治療薬市場分析
10.12 イタリアの皮膚科治療薬市場分析
10.13 スペインの皮膚科治療薬市場分析
10.14 その他の欧州の皮膚科治療薬市場分析
11 アジア太平洋地域の皮膚科治療薬市場分析
11.1 主要な調査結果
11.2 アジア太平洋地域の皮膚科治療薬市場魅力度指数
11.3 アジア太平洋地域の皮膚科治療薬の国別市場規模、2024年、2029年、2034年(US$ Billion)
11.4 アジア太平洋地域の皮膚科治療薬市場規模推定と予測:国別
11.5 アジア太平洋地域の皮膚科治療薬市場規模推定と予測:投与経路別
11.6 アジア太平洋地域の皮膚科治療薬市場規模推定と予測:疾患別
11.7 アジア太平洋地域の皮膚科治療薬市場規模推定と予測:処方形態別
11.8 アジア太平洋地域の皮膚科治療薬市場規模推定と予測:流通経路別
11.9 中国の皮膚科治療薬市場分析
11.10 インドの皮膚科治療薬市場分析
11.11 日本の皮膚科治療薬市場分析
11.12 オーストラリアの皮膚科治療薬市場分析
11.13 韓国の皮膚科治療薬市場分析
11.14 その他のアジア太平洋地域の皮膚科治療薬市場分析
12 ラテンアメリカの皮膚科治療薬市場分析
12.1 主要な調査結果
12.2 ラテンアメリカの皮膚科治療薬市場魅力度指数
12.3 ラテンアメリカの皮膚科治療薬国別市場、2024年、2029年、2034年(US$ Billion)
12.4 ラテンアメリカの皮膚科治療薬市場規模推定と予測:国別
12.5 ラテンアメリカの皮膚科治療薬市場規模推定と予測:投与経路別
12.6 ラテンアメリカの皮膚科治療薬市場規模推定と予測:疾患別
12.7 ラテンアメリカの皮膚科治療薬市場規模推定と予測:処方形態別
12.8 ラテンアメリカの皮膚科治療薬市場規模推定と予測:流通経路別
12.9 ブラジルの皮膚科治療薬市場分析
12.10 メキシコの皮膚科治療薬市場分析
12.11 その他のラテンアメリカの皮膚科治療薬市場分析
13 MEAの皮膚科治療薬市場分析
13.1 主要な調査結果
13.2 MEAの皮膚科治療薬市場魅力度指数
13.3 MEAの皮膚科用医薬品国別市場、2024年、2029年、2034年 (US$ Billion
13.4 MEAの皮膚科用薬剤市場規模推定と予測:国別
13.5 MEAの皮膚科用薬剤市場規模推定と予測:投与経路別
13.6 MEAの皮膚科用薬剤市場規模推定と予測:疾患別
13.7 MEAの皮膚科用薬剤市場規模推定と予測:処方形態別
13.8 MEAの皮膚科用薬剤市場規模推定と予測:流通経路別
13.9 GCCの皮膚科用医薬品市場分析
13.10 南アフリカの皮膚科用薬剤市場分析
13.11 その他のMEAの皮膚科用医薬品市場の分析
14 主要企業のプロファイル
14.1 競争環境、2023年
14.2 戦略的展望
14.3 Novartis AG
14.3.1 会社概要
14.3.2 会社概要
14.3.3 財務分析
14.3.3.1 純収入、2018-2022年
14.3.3.2 地域市場シェア(2022年
14.3.3.3 研究開発費、2018年~2022年
14.3.4 製品ベンチマーク
14.3.5 戦略的展望
14.4 Bayer AG
14.4.1 会社概要
14.4.2 会社概要
14.4.3 財務分析
14.4.3.1 純収入、2018-2022年
14.4.3.2 地域市場シェア、2022年
14.4.3.3 研究開発費、2018年~2022年
14.4.4 製品ベンチマーク
14.5 LEO Pharma A/S
14.5.1 会社概要
14.5.2 会社概要
14.5.3 製品ベンチマーク
14.5.4 戦略的展望
14.6 Pfizer Inc.
14.6.1 会社概要
14.6.2 会社概要
14.6.3 財務分析
14.6.3.1 売上高、2018年〜2022年
14.6.3.2 地域市場シェア、2022年
14.6.3.3 研究開発費、2018〜2022年
14.6.4 製品ベンチマーク
14.6.5 戦略的展望
14.7 Johnson & Johnson Services, Inc.
14.7.1 会社概要
14.7.2 会社概要
14.7.3 財務分析
14.7.3.1 売上高、2018年~2022年
14.7.3.2 地域市場シェア、2022年
14.7.3.3 研究開発費、2018年~2022年
14.7.4 製品ベンチマーク
14.8 Regeneron Pharmaceuticals Inc.
14.8.1 会社概要
14.8.2 会社概要
14.8.3 財務分析
14.8.3.1 売上高、2018-2022年
14.8.3.2 研究開発費、2018年〜2022年
14.8.4 製品ベンチマーク
14.8.5 戦略的展望
14.9 AbbVie Inc.
14.9.1 会社概要
14.9.2 会社概要
14.9.3 財務分析
14.9.3.1 売上高、2018年~2022年
14.9.3.2 地域市場シェア、2022年
14.9.3.3 研究開発費、2018年〜2022年
14.9.4 製品ベンチマーク
14.9.5 戦略的展望
14.10 Verrica Pharmaceuticals
14.10.1 会社概要
14.10.2 会社概要
14.10.3 製品ベンチマーク
14.11 Teva Pharmaceutical Industries Ltd.
14.11.1 企業スナップショット
14.11.2 会社概要
14.11.3 財務分析
14.11.3.1 売上高、2018年〜2022年
14.11.3.2 地域市場シェア、2022年
14.11.3.3 研究開発費、2018年〜2022年
14.11.4 製品ベンチマーク
14.11.5 戦略的展望
14.12 Roivant Sciences Ltd.
14.12.1 会社概要
14.12.2 会社概要
14.12.3 製品ベンチマーク
14.12.4 戦略的展望
14.13 DermBiont, Inc.
14.13.1 会社概要
14.13.2 会社概要
14.13.3 製品ベンチマーク
14.13.4 戦略的展望
14.14 AstraZeneca
14.14.1 会社概要
14.14.2 会社概要
14.14.3 財務分析
14.14.3.1 純収入、2017-2022年
14.14.3.2 地域市場シェア、2022年
14.14.3.3 研究開発費、2018-2022年
14.14.4 製品ベンチマーク
14.14.5 戦略的展望
14.15 Merck & Co., Inc.
14.15.1 会社概要
14.15.2 会社概要
14.15.3 財務分析
14.15.3.1 純収入、2017年~2022年
14.15.3.2 地域市場シェア(2022年
14.15.3.3 研究開発費、2017年〜2022年
14.15.4 製品ベンチマーク
14.16 GSK plc
14.16.1 会社概要
14.16.2 会社概要
14.16.3 財務分析
14.16.3.1 純収入、2017-2022年
14.16.3.2 地域市場シェア(2022年
14.16.3.3 研究開発費、2017年〜2022年
14.16.4 製品ベンチマーク
14.17 F. Hoffmann-La Roche Ltd
14.17.1 会社概要
14.17.2 会社概要
14.17.3 財務分析
14.17.3.1 純収入(2018-2022年
14.17.3.2 研究開発費(2018〜2022年
14.17.4 製品ベンチマーク
14.18 Mayne Pharma Group Limited
14.18.1 会社概要
14.18.2 会社概要
14.18.3 財務分析
14.18.3.1 純収入(2020-2023年
14.18.3.2 研究開発費(2020-2023年
14.18.4 製品ベンチマーク
14.18.5 戦略的展望
15 結論と提言
15.1 Visiongainからの結びの言葉
15.2 市場プレイヤーへの提言
ページTOPに戻る
図表リスト
表の一覧
Table 1 Dermatological Drugs Market Snapshot, 2024 & 2034 (US$ billion, CAGR %)
Table 2 Dermatological Drugs Market Forecast by Region 2024-2034 (US$ Bn, AGR%, CAGR%): "V" Shaped Recovery
Table 3 Dermatological Drugs Market Forecast by Region 2024-2034 (US$ Bn, AGR%, CAGR%): "U" Shaped Recovery
Table 4 Dermatological Drugs Market Forecast by Region 2024-2034 (US$ Bn, AGR%, CAGR%): "W" Shaped Recovery
Table 5 Dermatological Drugs Market Forecast by Region 2024-2034 (US$ Bn, AGR%, CAGR%): "W" Shaped Recovery
Table 6 Dermatological Drugs Market Forecast by Route of Administration, 2024-2034 (US$ Billion, AGR%, CAGR%)
Table 7 Topical Segment Market Forecast by Region, 2024-2034 (US$ Billion, AGR%, CAGR%)
Table 8 Oral Segment Market Forecast by Region, 2024-2034 (US$ Billion, AGR%, CAGR%)
Table 9 Hardware Segment Market Forecast by Region, 2024-2034 (US$ Billion, AGR%, CAGR%)
Table 10 Dermatological Drugs Market Forecast by Disease 2024-2034 (US$ Billion, AGR%, CAGR%)
Table 11 Psoriasis Segment Market Forecast by Region, 2024-2034 (US$ Billion, AGR%, CAGR%)
Table 12 Dermatitis Segment Market Forecast by Region, 2024-2034 (US$ Billion, AGR%, CAGR%)
Table 13 Acne Segment Market Forecast by Region, 2024-2034 (US$ Billion, AGR%, CAGR%)
Table 14 Skin Infections Segment Market Forecast by Region, 2024-2034 (US$ Billion, AGR%, CAGR%)
Table 15 Others Segment Market Forecast by Region, 2024-2034 (US$ Billion, AGR%, CAGR%)
Table 16 Dermatological Drugs Market Forecast by Prescription Mode, 2024-2034 (US$ Billion, AGR%, CAGR%)
Table 17 Prescription Drugs Segment Market Forecast by Region, 2024-2034 (US$ Billion, AGR%, CAGR%)
Table 18 Over-the-Counter (OTC) Drugs Segment Market Forecast by Region, 2024-2034 (US$ Billion, AGR%, CAGR%)
Table 19 Dermatological Drugs Market Forecast by Distribution Channel 2024-2034 (US$ Billion, AGR%, CAGR%)
Table 20 Retail Pharmacies Segment Market Forecast by Region, 2024-2034 (US$ Billion, AGR%, CAGR%)
Table 21 Hospital Pharmacies Segment Market Forecast by Region, 2024-2034 (US$ Billion, AGR%, CAGR%)
Table 22 Online Pharmacies Segment Market Forecast by Region, 2024-2034 (US$ Billion, AGR%, CAGR%)
Table 23 Others Segment Market Forecast by Region, 2024-2034 (US$ Billion, AGR%, CAGR%)
Table 24 Dermatological Drugs Market Forecast by Region, 2024-2034 (US$ Billion, AGR%, CAGR%)
Table 25 North America Dermatological Drugs Market Forecast by Country, 2024-2034 (US$ Billion, AGR%, CAGR%)
Table 26 North America Dermatological Drugs Market Forecast by Route of Administration, 2024-2034 (US$ Billion, AGR%, CAGR%)
Table 27 Dermatological Drugs Market Forecast by Disease 2024-2034 (US$ Billion, AGR%, CAGR%)
Table 28 North America Dermatological Drugs Market Forecast by Prescription Mode 2024-2034 (US$ Billion, AGR%, CAGR%)
Table 29 North America Dermatological Drugs Market Forecast by Distribution Channel 2024-2034 (US$ Billion, AGR%, CAGR%)
Table 30 U.S. Dermatological Drugs Market Forecast by Country, 2024-2034 (US$ Billion, AGR%, CAGR%)
Table 31 Canada Dermatological Drugs Market Forecast by Country, 2024-2034 (US$ Billion, AGR%, CAGR%)
Table 32 Europe Dermatological Drugs Market Forecast by Country, 2024-2034 (US$ Billion, AGR%, CAGR%)
Table 33 Europe Dermatological Drugs Market Forecast by Route of Administration, 2024-2034 (US$ Billion, AGR%, CAGR%)
Table 34 Dermatological Drugs Market Forecast by Disease 2024-2034 (US$ Billion, AGR%, CAGR%)
Table 35 Europe Dermatological Drugs Market Forecast by Prescription Mode 2024-2034 (US$ Billion, AGR%, CAGR%)
Table 36 Europe Dermatological Drugs Market Forecast by Distribution Channel 2024-2034 (US$ Billion, AGR%, CAGR%)
Table 37 Germany Dermatological Drugs Market Forecast by Country, 2024-2034 (US$ Billion, AGR%, CAGR%)
Table 38 France Dermatological Drugs market Forecast, 2024-2034 (US$ Billion, AGR%, CAGR%)
Table 39 U.K. Dermatological Drugs market Forecast, 2024-2034 (US$ Billion, AGR%, CAGR%)
Table 40 Italy Dermatological Drugs Market Forecast, 2024-2034 (US$ Billion, AGR%, CAGR%)
Table 41 Spain Dermatological Drugs Market Forecast, 2024-2034 (US$ Billion, AGR%, CAGR%)
Table 42 Rest of Europe Dermatological Drugs Market Forecast, 2024-2034 (US$ Billion, AGR%, CAGR%)
Table 43 Asia Pacific Dermatological Drugs Market Forecast by Country, 2024-2034 (US$ Billion, AGR%, CAGR%)
Table 44 Asia Pacific Dermatological Drugs Market Forecast by Route of Administration, 2024-2034 (US$ Billion, AGR%, CAGR%)
Table 45 Dermatological Drugs Market Forecast by Disease 2024-2034 (US$ Billion, AGR%, CAGR%)
Table 46 Asia Pacific Dermatological Drugs Market Forecast by Prescription Mode 2024-2034 (US$ Billion, AGR%, CAGR%)
Table 47 Asia Pacific Dermatological Drugs Market Forecast by Distribution Channel 2024-2034 (US$ Billion, AGR%, CAGR%)
Table 48 China Dermatological Drugs Market Forecast, 2024-2034 (US$ Billion, AGR%, CAGR%)
Table 49 India Dermatological Drugs Market Forecast, 2024-2034 (US$ Billion, AGR%, CAGR%)
Table 50 Japan Dermatological Drugs Market Forecast, 2024-2034 (US$ Billion, AGR%, CAGR%)
Table 51 Australia Dermatological Drugs Market Forecast, 2024-2034 (US$ Billion, AGR%, CAGR%)
Table 52 South Korea Dermatological Drugs Market Forecast, 2024-2034 (US$ Billion, AGR%, CAGR%)
Table 53 Rest of Asia-Pacific Dermatological Drugs Market Forecast, 2024-2034 (US$ Billion, AGR%, CAGR%)
Table 54 Latin America Dermatological Drugs Market Forecast by Country, 2024-2034 (US$ Billion, AGR%, CAGR%)
Table 55 Latin America Dermatological Drugs Market Forecast by Route of Administration, 2024-2034 (US$ Billion, AGR%, CAGR%)
Table 56 Dermatological Drugs Market Forecast by Disease 2024-2034 (US$ Billion, AGR%, CAGR%)
Table 57 Latin America Dermatological Drugs Market Forecast by Prescription Mode 2024-2034 (US$ Billion, AGR%, CAGR%)
Table 58 Latin America Dermatological Drugs Market Forecast by Distribution Channel 2024-2034 (US$ Billion, AGR%, CAGR%)
Table 59 Brazil Dermatological Drugs Market Forecast, 2024-2034 (US$ Billion, AGR%, CAGR%)
Table 60 Mexico Dermatological Drugs Market Forecast, 2024-2034 (US$ Billion, AGR%, CAGR%)
Table 61 Rest of Latin America Dermatological Drugs Market Forecast, 2024-2034 (US$ Billion, AGR%, CAGR%)
Table 62 MEA Dermatological Drugs Market Forecast by Country, 2024-2034 (US$ Billion, AGR%, CAGR%)
Table 63 MEA Dermatological Drugs Market Forecast by Route of Administration, 2024-2034 (US$ Billion, AGR%, CAGR%)
Table 64 Dermatological Drugs Market Forecast by Disease 2024-2034 (US$ Billion, AGR%, CAGR%)
Table 65 MEA Dermatological Drugs Market Forecast by Prescription Mode 2024-2034 (US$ Billion, AGR%, CAGR%)
Table 66 MEA Dermatological Drugs Market Forecast by Distribution Channel 2024-2034 (US$ Billion, AGR%, CAGR%)
Table 67 GCC Dermatological Drugs market Forecast, 2024-2034 (US$ Billion, AGR%, CAGR%)
Table 68 South Africa Dermatological Drugs Market Forecast, 2024-2034 (US$ Billion, AGR%, CAGR%)
Table 69 Rest of MEA Dermatological Drugs Market Forecast, 2024-2034 (US$ Billion, AGR%, CAGR%)
Table 70 Strategic Outlook
Table 71 Novartis AG: Key Details, (CEO, HQ, Revenue, Founded, No. of Employees, Company Type, Website, Business Segment)
Table 72 Novartis AG: Product Benchmarking
Table 73 Novartis AG: Strategic Outlook
Table 74 Bayer AG: Key Details, (CEO, HQ, Revenue, Founded, No. of Employees, Company Type, Website, Business Segment)
Table 75 Bayer AG: Product Benchmarking
Table 76 LEO Pharma A/S: Key Details, (CEO, HQ, Revenue, Founded, No. of Employees, Company Type, Website, Business Segment)
Table 77 LEO Pharma A/S: Product Benchmarking
Table 78 LEO Pharma A/S: Strategic Outlook
Table 79 Pfizer Inc.: Key Details, (CEO, HQ, Revenue, Founded, No. of Employees, Company Type, Website, Business Segment)
Table 80 Pfizer Inc.: Product Benchmarking
Table 81 Pfizer Inc.: Strategic Outlook
Table 82 Johnson & Johnson Services, Inc.: Key Details, (CEO, HQ, Revenue, Founded, No. of Employees, Company Type, Website, Business Segment)
Table 83 Johnson & Johnson Services, Inc.: Product Benchmarking
Table 84 Regeneron Pharmaceuticals Inc.: Key Details, (CEO, HQ, Revenue, Founded, No. of Employees, Company Type, Website, Business Segment)
Table 85 Regeneron Pharmaceuticals Inc.: Product Benchmarking
Table 86 Regeneron Pharmaceuticals Inc.: Strategic Outlook
Table 87 AbbVie Inc.: Key Details, (CEO, HQ, Revenue, Founded, No. of Employees, Company Type, Website, Business Segment)
Table 88 AbbVie Inc.: Product Benchmarking
Table 89 AbbVie Inc.: Strategic Outlook
Table 90 Verrica Pharmaceuticals: Key Details, (CEO, HQ, Revenue, Founded, No. of Employees, Company Type, Website, Business Segment)
Table 91 Verrica Pharmaceuticals: Product Benchmarking
Table 92 Teva Pharmaceutical Industries Ltd.: Key Details, (CEO, HQ, Revenue, Founded, No. of Employees, Company Type, Website, Business Segment)
Table 93 Teva Pharmaceutical Industries Ltd.: Product Benchmarking
Table 94 Teva Pharmaceutical Industries Ltd.: Strategic Outlook
Table 95 Roivant Sciences Ltd.: Key Details, (CEO, HQ, Revenue, Founded, No. of Employees, Company Type, Website, Business Segment)
Table 96 Roivant Sciences Ltd.: Product Benchmarking
Table 97 Roivant Sciences Ltd.: Strategic Outlook
Table 98 DermBiont, Inc. : Key Details, (CEO, HQ, Revenue, Founded, No. of Employees, Company Type, Website, Business Segment)
Table 99 DermBiont, Inc.: Product Benchmarking
Table 100 DermBiont, Inc.: Strategic Outlook
Table 101 AstraZeneca: Key Details, (CEO, HQ, Revenue, Founded, No. of Employees, Company Type, Website, Business Segment)
Table 102 AstraZeneca: Product Benchmarking
Table 103 AstraZeneca: Strategic Outlook
Table 104 Merck & Co., Inc.: Key Details, (CEO, HQ, Revenue, Founded, No. of Employees, Company Type, Website, Business Segment)
Table 105 Merck & Co., Inc.: Product Benchmarking
Table 106 GSK plc: Key Details, (CEO, HQ, Revenue, Founded, No. of Employees, Company Type, Website, Business Segment)
Table 107 GSK plc: Product Benchmarking
Table 108 F. Hoffmann-La Roche Ltd: Key Details, (CEO, HQ, Revenue, Founded, No. of Employees, Company Type, Website, Business Segment)
Table 109 F. Hoffmann-La Roche Ltd: Product Benchmarking
Table 110 Mayne Pharma Group Limited: Key Details, (CEO, HQ, Revenue, Founded, No. of Employees, Company Type, Website, Business Segment)
Table 111 Mayne Pharma Group Limited: Product Benchmarking
Table 112 Mayne Pharma Group Limited: Strategic Outlook
図の一覧
Figure 1 Dermatological Drugs Market Segmentation
Figure 2 Dermatological Drugs Market Forecast by Route of Administration: Market Attractiveness Index
Figure 3 Dermatological Drugs Market Forecast by Disease: Market Attractiveness Index
Figure 4 Dermatological Drugs Market Forecast by Prescription Mode: Market Attractiveness Index
Figure 5 Dermatological Drugs Market Forecast by Distribution Channel: Market Attractiveness Index
Figure 6 Dermatological Drugs Market Attractiveness Index by Region
Figure 7 Dermatological Drugs Market: Market Dynamics
Figure 8 Dermatological Drugs Market by region, 2024-2034 (US$ Billion, AGR (%), CAGR (%)): “V” Shaped Recovery
Figure 9 Dermatological Drugs market by Region, 2024-2034 (US$ Billion, AGR (%), CAGR (%)): “U” Shaped Recovery
Figure 10 Dermatological Drugs market by region, 2024-2034 (US$ Billion, AGR (%), CAGR (%)): “W” Shaped Recovery
Figure 11 Dermatological Drugs market by Region, 2024-2034 (US$ Billion, AGR (%), CAGR (%)): “L” Shaped Recovery
Figure 12 Dermatological Drugs Market: Porter’s Five Forces Analysis
Figure 13 Dermatological Drugs: PEST Analysis
Figure 14 Dermatological Drugs Market Forecast by Route of Administration: Market Attractiveness Index
Figure 15 Dermatological Drugs Market Forecast by Route of Administration, 2024-2034 (US$ Billion)
Figure 16 Dermatological Drugs market Share Forecast by Route of Administration, 2024, 2029, 2034 (%)
Figure 17 Topical Market Forecast by Region, 2024-2034 (US$ Billion)
Figure 18 Topical Market Share Forecast by Region, 2024 & 2034 (%)
Figure 19 Oral Market Forecast by Region, 2024-2034 (US$ Billion)
Figure 20 Oral Market Share Forecast by Region, 2024 & 2034 (%)
Figure 21 Parenteral Market Forecast by Region, 2024-2034 (US$ Billion)
Figure 22 Parenteral Market Share Forecast by Region, 2024 & 2034 (%)
Figure 23 Dermatological Drugs Market Forecast by Disease: Market Attractiveness Index
Figure 24 Dermatological Drugs Market Forecast by Disease, 2024-2034 (US$ Billion)
Figure 25 Dermatological Drugs market Share Forecast by Therapeutic Application, 2024, 2029, 2034 (%)
Figure 26 Psoriasis Market Forecast by Region, 2024-2034 (US$ Billion)
Figure 27 Oncology Market Share Forecast by Region, 2024 & 2034 (%)
Figure 28 Dermatitis Market Forecast by Region, 2024-2034 (US$ Billion)
Figure 29 Dermatitis Market Share Forecast by Region, 2024 & 2034 (%)
Figure 30 Acne Market Forecast by Region, 2024-2034 (US$ Billion)
Figure 31 Acne Market Share Forecast by Region, 2024 & 2034 (%)
Figure 32 Skin Infections Market Forecast by Region, 2024-2034 (US$ Billion)
Figure 33 Respiratory Market Share Forecast by Region, 2024 & 2034 (%)
Figure 34 Others Market Forecast by Region, 2024-2034 (US$ Billion)
Figure 35 Others Market Share Forecast by Region, 2024 & 2034 (%)
Figure 36 Dermatological Drugs Market Forecast by Prescription Mode: Market Attractiveness Index
Figure 37 Dermatological Drugs Market Forecast by Prescription Mode, 2024-2034 (US$ Billion)
Figure 38 Dermatological Drugs Market Share Forecast by Prescription Mode, 2024, 2029, 2034 (%)
Figure 39 Prescription Drugs Market Forecast by Region, 2024-2034 (US$ Billion)
Figure 40 Prescription Drugs Market Share Forecast by Region, 2024 & 2034 (%)
Figure 41 Over-the-Counter (OTC) Drugs Market Forecast by Region, 2024-2034 (US$ Billion)
Figure 42 Over-the-Counter (OTC) Drugs Market Share Forecast by Region, 2024 & 2034 (%)
Figure 43 Dermatological Drugs Market Forecast by Distribution Channel: Market Attractiveness Index
Figure 44 Dermatological Drugs Market Forecast by Distribution Channel, 2024-2034 (US$ Billion)
Figure 45 Dermatological Drugs market Share Forecast by Technology, 2024, 2029, 2034 (%)
Figure 46 Retail Pharmacies Segment Market Forecast by Region, 2024-2034 (US$ Billion)
Figure 47 Retail Pharmacies Market Share Forecast by Region, 2024 & 2034 (%)
Figure 48 Hospital Pharmacies Market Forecast by Region, 2024-2034 (US$ Billion)
Figure 49 Hospital Pharmacies Market Share Forecast by Region, 2024 & 2034 (%)
Figure 50 Online Pharmacies Market Forecast by Region, 2024-2034 (US$ Billion)
Figure 51 Online Pharmacies Market Share Forecast by Region, 2024 & 2034 (%)
Figure 52 Others Market Forecast by Region, 2024-2034 (US$ Billion)
Figure 53 Others Market Share Forecast by Region, 2024 & 2034 (%)
Figure 54 Dermatological Drugs Market Forecast by Region 2024 & 2034 (Revenue, CAGR%)
Figure 55 Dermatological Drugs market Share Forecast by Region 2024, 2029, 2034(%)
Figure 56 Dermatological Drugs Market by Region, 2024-2034 (US$ Billion, AGR (%), CAGR (%))
Figure 57 North America Dermatological Drugs Market Attractiveness Index
Figure 58 North America Dermatological Drugs Market by region, 2024, 2029 & 2034 (US$ Billion)
Figure 59 North America Dermatological Drugs Market Forecast by Country, 2024-2034 (US$ billion)
Figure 60 North America Dermatological Drugs Market Share Forecast by Country, 2024 & 2034 (%)
Figure 61 North America Dermatological Drugs Market Forecast by Route of Administration, 2024-2034 (US$ Billion)
Figure 62 North America Dermatological Drugs Market Share Forecast by Route of Administration, 2024 & 2034 (%)
Figure 63 North America Dermatological Drugs Market Forecast by Disease, 2024-2034 (US$ Billion)
Figure 64 North America Dermatological Drugs Market Share Forecast by Disease, 2024 & 2034 (%)
Figure 65 North America Dermatological Drugs Market Forecast by Prescription Mode, 2024-2034 (US$ Billion)
Figure 66 North America Dermatological Drugs Market Share Forecast by Prescription Mode, 2024 & 2034 (%)
Figure 67 North America Dermatological Drugs Market Forecast by Distribution Channel, 2024-2034 (US$ Billion)
Figure 68 North America Dermatological Drugs Market Share Forecast by Distribution Channel, 2024 & 2034 (%)
Figure 69 U.S. Dermatological Drugs market Forecast, 2024-2034 (US$ Billion, AGR %)
Figure 70 Canada Dermatological Drugs Market Forecast, 2024-2034 (US$ Billion, AGR %)
Figure 71 Europe Dermatological Drugs Market Attractiveness Index
Figure 72 Europe Dermatological Drugs market by region, 2024, 2029 & 2034 (US$ billion)
Figure 73 Europe Dermatological Drugs Market Forecast by Country, 2024-2034 (US$ Billion)
Figure 74 Europe Dermatological Drugs Market Share Forecast by Country, 2024 & 2034 (%)
Figure 75 Europe Dermatological Drugs Market Forecast by Route of Administration, 2024-2034 (US$ Billion)
Figure 76 Europe Dermatological Drugs Market Share Forecast by Route of Administration, 2024 & 2034 (%)
Figure 77 Europe Dermatological Drugs Market Forecast by Disease, 2024-2034 (US$ Billion)
Figure 78 Europe Dermatological Drugs Market Share Forecast by Disease, 2024 & 2034 (%)
Figure 79 Europe Dermatological Drugs Market Forecast by Prescription Mode, 2024-2034 (US$ Billion)
Figure 80 Europe Dermatological Drugs Market Share Forecast by Prescription Mode, 2024 & 2034 (%)
Figure 81 Europe Dermatological Drugs Market Forecast by Distribution Channel, 2024-2034 (US$ Billion)
Figure 82 Europe Dermatological Drugs Market Share Forecast by Distribution Channel, 2024 & 2034 (%)
Figure 83 Germany Dermatological Drugs Market Forecast, 2024-2034 (US$ Billion, AGR %)
Figure 84 France Dermatological Drugs Market Forecast, 2024-2034 (US$ Billion, AGR %)
Figure 85 U.K. Dermatological Drugs Market Forecast, 2024-2034 (US$ Billion, AGR %)
Figure 86 Italy Dermatological Drugs Market Forecast, 2024-2034 (US$ Billion, AGR %)
Figure 87 Spain Dermatological Drugs Market Forecast, 2024-2034 (US$ Billion, AGR %)
Figure 88 Rest of Europe Dermatological Drugs Market Forecast, 2024-2034 (US$ billion, AGR %)
Figure 89 Asia Pacific Dermatological Drugs Market Attractiveness Index
Figure 90 Asia Pacific Dermatological Drugs market by Region, 2024, 2029 & 2034 (US$ billion)
Figure 91 Asia Pacific Dermatological Drugs Market Forecast by Country, 2024-2034 (US$ billion)
Figure 92 Asia Pacific Dermatological Drugs Market Share Forecast by Country, 2024 & 2034 (%)
Figure 93 Asia Pacific Dermatological Drugs Market Forecast by Route of Administration, 2024-2034 (US$ Billion)
Figure 94 Asia Pacific Dermatological Drugs Market Share Forecast by Route of Administration, 2024 & 2034 (%)
Figure 95 Asia Pacific Dermatological Drugs Market Forecast by Disease, 2024-2034 (US$ Billion)
Figure 96 Asia Pacific Dermatological Drugs Market Share Forecast by Disease, 2024 & 2034 (%)
Figure 97 Asia Pacific Dermatological Drugs Market Forecast by Prescription Mode, 2024-2034 (US$ Billion)
Figure 98 Asia Pacific Dermatological Drugs Market Share Forecast by Prescription Mode, 2024 & 2034 (%)
Figure 99 Asia Pacific Dermatological Drugs Market Forecast by Distribution Channel, 2024-2034 (US$ Billion)
Figure 100 Asia Pacific Dermatological Drugs Market Share Forecast by Distribution Channel, 2024 & 2034 (%)
Figure 101 China Dermatological Drugs Market Forecast, 2024-2034 (US$ Billion, AGR %)
Figure 102 India Dermatological Drugs Market Forecast, 2024-2034 (US$ billion, AGR %)
Figure 103 Japan Dermatological Drugs Market Forecast, 2024-2034 (US$ billion, AGR %)
Figure 104 Australia Dermatological Drugs Market Forecast, 2024-2034 (US$ billion, AGR %)
Figure 105 South Korea Dermatological Drugs Market Forecast, 2024-2034 (US$ Billion, AGR %)
Figure 106 Rest of Asia Pacific Dermatological Drugs Market Forecast, 2024-2034 (US$ Billion, AGR %)
Figure 107 Latin America Dermatological Drugs Market Attractiveness Index
Figure 108 Latin America Dermatological Drugs market by Region, 2024, 2029 & 2034 (US$ billion)
Figure 109 Latin America Dermatological Drugs Market Forecast by Country, 2024-2034 (US$ Billion)
Figure 110 Latin America Dermatological Drugs Market Share Forecast by Country, 2024 & 2034 (%)
Figure 111 Latin America Dermatological Drugs Market Forecast by Route of Administration, 2024-2034 (US$ Billion)
Figure 112 Latin America Dermatological Drugs Market Share Forecast by Route of Administration, 2024 & 2034 (%)
Figure 113 Latin America Dermatological Drugs Market Forecast by Disease, 2024-2034 (US$ Billion)
Figure 114 Latin America Dermatological Drugs Market Share Forecast by Disease, 2024 & 2034 (%)
Figure 115 Latin America Dermatological Drugs Market Forecast by Prescription Mode, 2024-2034 (US$ Billion)
Figure 116 Latin America Dermatological Drugs Market Share Forecast by Prescription Mode, 2024 & 2034 (%)
Figure 117 Latin America Dermatological Drugs Market Forecast by Distribution Channel, 2024-2034 (US$ Billion)
Figure 118 Latin America Dermatological Drugs Market Share Forecast by Distribution Channel, 2024 & 2034 (%)
Figure 119 Brazil Dermatological Drugs Market Forecast, 2024-2034 (US$ Billion, AGR %)
Figure 120 Mexico Dermatological Drugs Market Forecast, 2024-2034 (US$ Billion, AGR %)
Figure 121 Rest Of Latin America Dermatological Drugs Market Forecast, 2024-2034 (US$ Billion, AGR %)
Figure 122 MEA Dermatological Drugs Market Attractiveness Index
Figure 123 MEA Dermatological Drugs Market by region, 2024, 2029 & 2034 (US$ Billion)
Figure 124 MEA Dermatological Drugs Market Forecast by Country, 2024-2034 (US$ Billion)
Figure 125 MEA Dermatological Drugs market Share Forecast by Country, 2024 & 2034 (%)
Figure 126 MEA Dermatological Drugs Market Forecast by Route of Administration, 2024-2034 (US$ Billion)
Figure 127 MEA Dermatological Drugs Market Share Forecast by Route of Administration, 2024 & 2034 (%)
Figure 128 MEA Dermatological Drugs Market Forecast by Disease, 2024-2034 (US$ Billion)
Figure 129 MEA Dermatological Drugs Market Share Forecast by Disease, 2024 & 2034 (%)
Figure 130 MEA Dermatological Drugs Market Forecast by Prescription Mode, 2024-2034 (US$ Billion)
Figure 131 MEA Dermatological Drugs Market Share Forecast by Prescription Mode, 2024 & 2034 (%)
Figure 132 MEA Dermatological Drugs Market Forecast by Distribution Channel, 2024-2034 (US$ Billion)
Figure 133 MEA Dermatological Drugs Market Share Forecast by Distribution Channel, 2024 & 2034 (%)
Figure 134 GCC Dermatological Drugs market Forecast, 2024-2034 (US$ Billion, AGR %)
Figure 135 South Africa Dermatological Drugs Market Forecast, 2024-2034 (US$ Billion, AGR %)
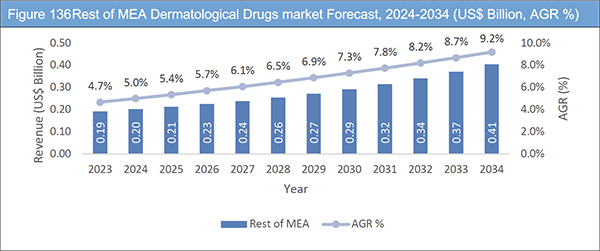
Figure 136 Rest of MEA Dermatological Drugs market Forecast, 2024-2034 (US$ Billion, AGR %)
Figure 137 Dermatological Drugs Market: Company Share Analysis, 2023
Figure 138 Novartis AG: Net Revenue, 2018-2022 (US$ Billion, AGR%)
Figure 139 Novartis AG: Regional Market Shares, 2022
Figure 140 Novartis AG: R&D Expense, 2018-2022 (US$ Billion, AGR%)
Figure 141 Bayer AG: Net Revenue, 2018-2022 (US$ Billion, AGR%)
Figure 142 Bayer AG: Regional Market Shares, 2022
Figure 143 Bayer AG: R&D Expense, 2018-2022 (US$ Billion, AGR%)
Figure 144 Pfizer Inc.: Net Revenue, 2018-2022 (US$ Million, AGR%)
Figure 145 Pfizer Inc.: Regional Market Shares, 2022
Figure 146 Pfizer Inc.: R&D Expense, 2018-2022 (US$ Million, AGR%)
Figure 147 Johnson & Johnson Services, Inc.: Net Revenue, 2018-2022 (US$ Million, AGR%)
Figure 148 Johnson & Johnson Services, Inc.: Regional Market Shares, 2022
Figure 149 Johnson & Johnson Services, Inc.: R&D Expense, 2018-2022 (US$ Million, AGR%)
Figure 150 Regeneron Pharmaceuticals Inc.: Net Revenue, 2018-2022 (US$ Million, AGR%)
Figure 151 Regeneron Pharmaceuticals Inc: R&D Expense, 2018-2022 (US$ Million, AGR%)
Figure 152 AbbVie Inc.: Net Revenue, 2018-2022 (US$ Million, AGR%)
Figure 153 AbbVie Inc.: Regional Market Shares, 2022
Figure 154 AbbVie Inc.: R&D Expense, 2018-2022 (US$ Million, AGR%)
Figure 155 Teva Pharmaceutical Industries Ltd.: Net Revenue, 2018-2022 (US$ Million, AGR%)
Figure 156 Teva Pharmaceutical Industries Ltd: Regional Market Shares, 2022
Figure 157 Teva Pharmaceutical Industries Ltd.: R&D Expense, 2018-2022 (US$ Million, AGR%)
Figure 158 AstraZeneca: Net Revenue, 2017-2022 (US$ Billion, AGR%)
Figure 159 AstraZeneca: Regional Market Shares, 2022
Figure 160 AstraZeneca: R&D Expense, 2017-2022 (US$ Billion, AGR%)
Figure 161 Merck & Co., Inc.: Net Revenue, 2017-2022 (US$ Billion, AGR%)
Figure 162 Merck & Co., Inc.: Regional Market Shares, 2022
Figure 163 Merck & Co., Inc.: R&D Expense, 2017-2022 (US$ Billion, AGR%)
Figure 164 GSK plc: Net Revenue, 2017-2022 (US$ Billion, AGR%)
Figure 165 GSK plc: Regional Market Shares, 2022
Figure 166 GSK plc: R&D Expense, 2017-2022 (US$ Billion, AGR%)
Figure 167 F. Hoffmann-La Roche Ltd: Net Revenue, 2018-2022 (US$ Billion, AGR%)
Figure 168 F. Hoffmann-La Roche Ltd: R&D Expense, 2018-2022 (US$ Billion, AGR%)
Figure 169 Mayne Pharma Group Limited: Net Revenue, 2020-2023 (US$ Million, AGR%)
Figure 170 Mayne Pharma Group Limited: R&D Expense, 2020-2023 (US$ Million, AGR%)
ページTOPに戻る
Summary
Report Details
The Dermatological Drugs Market Report 2024-2034: This report is essential for prominent enterprises seeking fresh revenue opportunities, aiming to enhance their comprehension of the industry and its inherent dynamics. It provides valuable insights for firms interested in diversifying across various sectors or expanding their current activities into new geographical areas.
Geriatric Population Driving Demand for Dermatological Drugs
As the global population ages at an unprecedented pace, the dermatological drugs market is poised for a significant upswing. According to the World Health Organization (WHO), by 2050, 80% of older individuals will reside in low- and middle-income countries. The rapid acceleration in population aging, outpacing historical trends, is a key catalyst. As per WHO, by 2030, one in every 6 person will be aged 60 or over. Also, from 2021 to 2050, population aged over 65 in Asia will grow by more than half-a-billion, creating a burgeoning market for dermatological drugs. This demographic shift signifies an increased demand for skincare solutions tailored to age-related dermatological concerns, such as wrinkles, age spots, and skin conditions prevalent in the elderly. Thus, the coming years will mark a lucrative era for the dermatological drugs industry, driven by the unique needs of the expanding geriatric population.
Nanotechnology in Drug Delivery Could Revolutionize the Dermatological Drugs Market
In the dynamic landscape of dermatology, the integration of cutting-edge technological advancements in drug delivery is poised to propel the market to unprecedented heights. The advent of nanotechnology enables precise targeting of skin cells, enhancing the efficacy of dermatological drugs while minimizing side effects. This revolutionary approach ensures a more tailored and efficient treatment, boosting patient outcomes and satisfaction. Micro-needle technology is reshaping the administration of dermatological drugs. These minimally invasive devices painlessly penetrate the skin, facilitating controlled and sustained release of therapeutic agents. This not only improves patient compliance but also optimizes drug absorption, leading to quicker and more effective results. Several companies are actively researching and developing nanocarriers and smart delivery systems for skincare applications such as NanoVibronix (US) and Nanologica (Sweden).
Furthermore, the incorporation of smart polymers in drug formulations represents a paradigm shift in dermatological treatments. These polymers respond to specific physiological cues, releasing drugs at the right time and in the right amounts. This precision enhances therapeutic outcomes, reduces the frequency of application, and minimizes adverse reactions.
What Questions Should You Ask before Buying a Market Research Report?
-
How is the Dermatological Drugs market evolving?
-
What is driving and restraining the Dermatological Drugs market?
-
How will each Dermatological Drugs submarket segment grow over the forecast period and how much revenue will these submarkets account for in 2034?
-
How will the market shares for each Dermatological Drugs submarket develop from 2024 to 2034?
-
What will be the main driver for the overall market from 2024 to 2034?
-
Will leading Dermatological Drugs markets broadly follow the macroeconomic dynamics, or will individual national markets outperform others?
-
How will the market shares of the national markets change by 2034 and which geographical region will lead the market in 2034?
-
Who are the leading players and what are their prospects over the forecast period?
-
What are the Dermatological Drugs projects for these leading companies?
-
How will the industry evolve during the period between 2024 and 2034? What are the implications of Dermatological
-
Drugs projects taking place now and over the next 10 years?
-
Is there a greater need for product commercialisation to further scale the Dermatological Drugs market?
-
Where is the Dermatological Drugs market heading and how can you ensure you are at the forefront of the market?
-
What are the best investment options for new product and service lines?
-
What are the key prospects for moving companies into a new growth path and C-suite?
You need to discover how this will impact the Dermatological Drugs market today, and over the next 10 years:
-
Our 280-page report provides 113 tables and 160 charts/graphs exclusively to you.
-
The report highlights key lucrative areas in the industry so you can target them – NOW.
-
It contains in-depth analysis of global, regional and national sales and growth.
-
It highlights for you the key successful trends, changes and revenue projections made by your competitors.
This report tells you TODAY how the Dermatological Drugs market will develop in the next 10 years, and in line with the variations in COVID-19 economic recession and bounce. This market is more critical now than at any point over the last 10 years.
Forecasts to 2034 and other analyses reveal commercial prospects
-
In addition to revenue forecasting to 2034, our new study provides you with recent results, growth rates, and market shares.
-
You will find original analyses, with business outlooks and developments.
-
Discover qualitative analyses (including market dynamics, drivers, opportunities, restraints and challenges), cost structure, impact of rising Dermatological Drugs prices and recent developments.
This report includes data analysis and invaluable insight into how COVID-19 will affect the industry and your company. Four COVID-19 recovery patterns and their impact, namely, “V”, “L”, “W” and “U” are discussed in this report.
Segments Covered in the Report
Route of Administration
-
Topical
-
Oral
-
Parenteral Administration
Disease
-
Psoriasis
-
Dermatitis
-
Acne
-
Skin Infections
-
Others
Prescription Mode
-
Prescription Drugs
-
Over-the-Counter (OTC) Drugs
Distribution Channel
-
Retail Pharmacies
-
Hospital Pharmacies
-
Online Pharmacies
In addition to the revenue predictions for the overall world market and segments, you will also find revenue forecasts for five regional and 21 leading national markets:
North America
Europe
-
Germany
-
UK
-
France
-
Spain
-
Italy
-
Russia
-
Rest of Europe
Asia Pacific
-
China
-
Japan
-
India
-
Australia
-
South Korea
-
Rest of Asia Pacific
Latin America
-
Brazil
-
Mexico
-
Rest of Latin America
MEA
-
GCC
-
South Africa
-
Rest of MEA
The report also includes profiles and for some of the leading companies in the Dermatological Drugs Market, 2024 to 2034, with a focus on this segment of these companies’ operations.
Leading companies profiled in the report
-
AbbVie Inc.
-
AstraZeneca
-
Bayer AG
-
DermBiont, Inc.
-
F. Hoffmann-La Roche Ltd
-
GSK plc
-
Johnson & Johnson Services, Inc.
-
LEO Pharma A/S
-
Mayne Pharma Group Limited
-
Merck & Co., Inc.
-
Novartis AG
-
Pfizer Inc.
-
Regeneron Pharmaceuticals Inc.
-
Roivant Sciences Ltd.
-
Teva Pharmaceutical Industries Ltd.
-
Verrica Pharmaceuticals
Overall world revenue for Dermatological Drugs Market, 2024 to 2034 in terms of value the market will surpass US$30.0 billion in 2024, our work calculates. We predict strong revenue growth through to 2034. Our work identifies which organizations hold the greatest potential. Discover their capabilities, progress, and commercial prospects, helping you stay ahead.
How will the Dermatological Drugs Market, 2024 to 2034 report help you?
In summary, our 280-page report provides you with the following knowledge:
-
Revenue forecasts to 2034 for Dermatological Drugs Market 2024 to 2034, with forecasts for route of administration, disease, prescription mode, and distribution channel each forecast at a global and regional level – discover the industry’s prospects, finding the most lucrative places for investments and revenues.
-
Revenue forecasts to 2034 for five regional and 21 key national markets – See forecasts for the Dermatological Drugs Market, 2024 to 2034 market in North America, Europe, Asia-Pacific, Latin America, and MEA. Also forecasted is the market in the US, Canada, Mexico, Brazil, Germany, France, UK, Italy, China, India, Japan, and Australia among other prominent economies.
-
Prospects for established firms and those seeking to enter the market – including company profiles for 16 of the major companies involved in the Dermatological Drugs Market, 2024 to 2034.
Find quantitative and qualitative analyses with independent predictions. Receive information that only our report contains, staying informed with invaluable business intelligence.
Information found nowhere else
With our new report, you are less likely to fall behind in knowledge or miss out on opportunities. See how our work could benefit your research, analyses, and decisions. Visiongain’s study is for everybody needing commercial analyses for the Dermatological Drugs Market, 2024 to 2034, market-leading companies. You will find data, trends and predictions.
ページTOPに戻る
Table of Contents
Table of Contents
1 Report Overview
1.1 Objectives of the Study
1.2 Introduction to Dermatological Drugs Market
1.3 What This Report Delivers
1.4 Why You Should Read This Report
1.5 Key Questions Answered by This Analytical Report
1.6 Who is This Report for?
1.7 Methodology
1.7.1 Market Definitions
1.7.2 Market Evaluation & Forecasting Methodology
1.7.3 Data Validation
1.7.3.1 Primary Research
1.7.3.2 Secondary Research
1.8 Frequently Asked Questions (FAQs)
1.9 Associated Visiongain Reports
1.10 About Visiongain
2 Executive Summary
3 Market Overview
3.1 Key Findings
3.2 Market Dynamics
3.2.1 Market Driving Factors
3.2.1.1 Increasing Prevalence of Skin Disorders
3.2.1.2 Growing Awareness and Patient Education
3.2.1.3 Globalization and Urbanization
3.2.1.4 Revolutionizing Dermatology: Unleashing Market Growth Through Advanced Drug Delivery Technologies
3.2.1.5 Innovative Breakthroughs: Propelling Dermatological Drugs Market Through Surging R&D Investments
3.2.1.6 Geriatric Population Driving Dermatological Drugs Market
3.2.2 Market Restraining Factors
3.2.2.1 Generic Competition
3.2.2.2 Adverse Effects and Safety Concerns
3.2.2.3 Drug Resistance
3.2.2.4 Non-Pharmacological Options: A Hindrance to Dermatological Drugs Market Growth
3.2.2.5 Limited Reimbursement and Coverage Challenges in Dermatological Drugs Sector
3.2.2.6 Regulatory Approval Process Poses Barriers to Dermatological Drugs Market Growth
3.2.3 Market Opportunities
3.2.3.1 Approval of Novel Dermatological Drugs
3.2.3.2 Advancements in Dermatology Research and Technology
3.2.3.3 Telemedicine and E-Health
3.3 COVID-19 Impact Analysis
3.4 Porter’s Five Forces Analysis
3.4.1 Bargaining Power of Suppliers
3.4.2 Bargaining Power of Buyers
3.4.3 Competitive Rivalry
3.4.4 Threat from Substitutes
3.4.5 Threat of New Entrants
3.5 PEST Analysis
3.5.1 Political
3.5.2 Economical
3.5.3 Social
3.5.4 Technological
4 Dermatological Drugs Market Analysis by Route of Administration
4.1 Key Findings
4.2 Route of Administration Segment: Market Attractiveness Index
4.3 Dermatological Drugs Market Size Estimation and Forecast by Route of Administration
4.4 Topical
4.4.1 Market Size by Region, 2024-2034 (US$ Billion)
4.4.2 Market Share by Region, 2024 & 2034 (%)
4.5 Oral
4.5.1 Market Size by Region, 2024-2034 (US$ Billion)
4.5.2 Market Share by Region, 2024 & 2034 (%)
4.6 Parenteral
4.6.1 Market Size by Region, 2024-2034 (US$ Billion)
4.6.2 Market Share by Region, 2024 & 2034 (%)
5 Dermatological Drugs Market Analysis by Disease
5.1 Key Findings
5.2 Disease Segment: Market Attractiveness Index
5.3 Dermatological Drugs Market Size Estimation and Forecast by Disease
5.4 Psoriasis
5.4.1 Market Size by Region, 2024-2034 (US$ Billion)
5.4.2 Market Share by Region, 2024 & 2034 (%)
5.5 Dermatitis
5.5.1 Market Size by Region, 2024-2034 (US$ Billion)
5.5.2 Market Share by Region, 2024 & 2034 (%)
5.6 Acne
5.6.1 Market Size by Region, 2024-2034 (US$ Billion)
5.6.2 Market Share by Region, 2024 & 2034 (%)
5.7 Skin Infections
5.7.1 Market Size by Region, 2024-2034 (US$ Billion)
5.7.2 Market Share by Region, 2024 & 2034 (%)
5.8 Others
5.8.1 Market Size by Region, 2024-2034 (US$ Billion)
5.8.2 Market Share by Region, 2024 & 2034 (%)
6 Dermatological Drugs Market Analysis by Prescription Mode
6.1 Key Findings
6.2 Prescription Mode Segment: Market Attractiveness Index
6.3 Dermatological Drugs Market Size Estimation and Forecast by Prescription Mode
6.4 Prescription Drugs
6.4.1 Market Size by Region, 2024-2034 (US$ Billion)
6.4.2 Market Share by Region, 2024 & 2034 (%)
6.5 Over-the-Counter (OTC) Drugs
6.5.1 Market Size by Region, 2024-2034 (US$ Billion)
6.5.2 Market Share by Region, 2024 & 2034 (%)
7 Dermatological Drugs market Analysis by Distribution Channel
7.1 Key Findings
7.2 Distribution Channel Segment: Market Attractiveness Index
7.3 Dermatological Drugs market Size Estimation and Forecast by Distribution Channel
7.4 Retail Pharmacies
7.4.1 Market Size by Region, 2024-2034 (US$ Billion)
7.4.2 Market Share by Region, 2024 & 2034 (%)
7.5 Hospital Pharmacies
7.5.1 Market Size by Region, 2024-2034 (US$ Billion)
7.5.2 Market Share by Region, 2024 & 2034 (%)
7.6 Online Pharmacies
7.6.1 Market Size by Region, 2024-2034 (US$ Billion)
7.6.2 Market Share by Region, 2024 & 2034 (%)
7.7 Others
7.7.1 Market Size by Region, 2024-2034 (US$ Billion)
7.7.2 Market Share by Region, 2024 & 2034 (%)
8 Dermatological Drugs Market Analysis by Region
8.1 Key Findings
8.2 Regional Market Size Estimation and Forecast
9 North America Dermatological Drugs Market Analysis
9.1 Key Findings
9.2 North America Dermatological Drugs Market Attractiveness Index
9.3 North America Dermatological Drugs market by Country, 2024, 2029 & 2034 (US$ Billion)
9.4 North America Dermatological Drugs Market Size Estimation and Forecast by Country
9.5 North America Dermatological Drugs Market Size Estimation and Forecast by Component
9.6 North America Dermatological Drugs Market Size Estimation and Forecast by Disease
9.7 North America Dermatological Drugs Market Size Estimation and Forecast by Prescription Mode
9.8 North America Dermatological Drugs Market Size Estimation and Forecast by Distribution Channel
9.9 U.S. Dermatological Drugs Market Analysis
9.10 Canada Dermatological Drugs Market Analysis
10 Europe Dermatological Drugs Market Analysis
10.1 Key Findings
10.2 Europe Dermatological Drugs Market Attractiveness Index
10.3 Europe Dermatological Drugs Market by Country, 2024, 2029 & 2034 (US$ Billion)
10.4 Europe Dermatological Drugs market Size Estimation and Forecast by Country
10.5 Europe Dermatological Drugs Market Size Estimation and Forecast by Route of Administration
10.6 Europe Dermatological Drugs Market Size Estimation and Forecast by Disease
10.7 Europe Dermatological Drugs Market Size Estimation and Forecast by Prescription Mode
10.8 Europe Dermatological Drugs Market Size Estimation and Forecast by Distribution Channel
10.9 Germany Dermatological Drugs Market Analysis
10.10 France Dermatological Drugs market Analysis
10.11 U.K. Dermatological Drugs market Analysis
10.12 Italy Dermatological Drugs market Analysis
10.13 Spain Dermatological Drugs Market Analysis
10.14 Rest of Europe Dermatological Drugs market Analysis
11 Asia Pacific Dermatological Drugs Market Analysis
11.1 Key Findings
11.2 Asia Pacific Dermatological Drugs Market Attractiveness Index
11.3 Asia Pacific Dermatological Drugs market by Country, 2024, 2029 & 2034 (US$ Billion)
11.4 Asia Pacific Dermatological Drugs Market Size Estimation and Forecast by Country
11.5 Asia Pacific Dermatological Drugs Market Size Estimation and Forecast by Component
11.6 Asia Pacific Dermatological Drugs Market Size Estimation and Forecast by Disease
11.7 Asia Pacific Dermatological Drugs Market Size Estimation and Forecast by Prescription Mode
11.8 Asia Pacific Dermatological Drugs Market Size Estimation and Forecast by Distribution Channel
11.9 China Dermatological Drugs Market Analysis
11.10 India Dermatological Drugs Market Analysis
11.11 Japan Dermatological Drugs Market Analysis
11.12 Australia Dermatological Drugs Market Analysis
11.13 South Korea Dermatological Drugs Market Analysis
11.14 Rest of Asia Pacific Dermatological Drugs market Analysis
12 Latin America Dermatological Drugs Market Analysis
12.1 Key Findings
12.2 Latin America Dermatological Drugs Market Attractiveness Index
12.3 Latin America Dermatological Drugs market by Country, 2024, 2029 & 2034 (US$ Billion)
12.4 Latin America Dermatological Drugs Market Size Estimation and Forecast by Country
12.5 Latin America Dermatological Drugs Market Size Estimation and Forecast by Component
12.6 Latin America Dermatological Drugs Market Size Estimation and Forecast by Disease
12.7 Latin America Dermatological Drugs Market Size Estimation and Forecast by Prescription Mode
12.8 Latin America Dermatological Drugs Market Size Estimation and Forecast by Distribution Channel
12.9 Brazil Dermatological Drugs Market Analysis
12.10 Mexico Dermatological Drugs market Analysis
12.11 Rest of Latin America Dermatological Drugs Market Analysis
13 MEA Dermatological Drugs market Analysis
13.1 Key Findings
13.2 MEA Dermatological Drugs Market Attractiveness Index
13.3 MEA Dermatological Drugs Market by Country, 2024, 2029 & 2034 (US$ Billion)
13.4 MEA Dermatological Drugs Market Size Estimation and Forecast by Country
13.5 MEA Dermatological Drugs Market Size Estimation and Forecast by Component
13.6 MEA Dermatological Drugs Market Size Estimation and Forecast by Disease
13.7 MEA Dermatological Drugs Market Size Estimation and Forecast by Prescription Mode
13.8 MEA Dermatological Drugs Market Size Estimation and Forecast by Distribution Channel
13.9 GCC Dermatological Drugs market Analysis
13.10 South Africa Dermatological Drugs market Analysis
13.11 Rest of MEA Dermatological Drugs market Analysis
14 Company Profiles
14.1 Competitive Landscape, 2023
14.2 Strategic Outlook
14.3 Novartis AG
14.3.1 Company Snapshot
14.3.2 Company Overview
14.3.3 Financial Analysis
14.3.3.1 Net Revenue, 2018-2022
14.3.3.2 Regional Market Shares, 2022
14.3.3.3 R&D Expense, 2018-2022
14.3.4 Product Benchmarking
14.3.5 Strategic Outlook
14.4 Bayer AG
14.4.1 Company Snapshot
14.4.2 Company Overview
14.4.3 Financial Analysis
14.4.3.1 Net Revenue, 2018-2022
14.4.3.2 Regional Market Shares, 2022
14.4.3.3 R&D Expense, 2018-2022
14.4.4 Product Benchmarking
14.5 LEO Pharma A/S
14.5.1 Company Snapshot
14.5.2 Company Overview
14.5.3 Product Benchmarking
14.5.4 Strategic Outlook
14.6 Pfizer Inc.
14.6.1 Company Snapshot
14.6.2 Company Overview
14.6.3 Financial Analysis
14.6.3.1 Revenue, 2018-2022
14.6.3.2 Regional Market Shares, 2022
14.6.3.3 R&D Expense, 2018-2022
14.6.4 Product Benchmarking
14.6.5 Strategic Outlook
14.7 Johnson & Johnson Services, Inc.
14.7.1 Company Snapshot
14.7.2 Company Overview
14.7.3 Financial Analysis
14.7.3.1 Revenue, 2018-2022
14.7.3.2 Regional Market Shares, 2022
14.7.3.3 R&D Expense, 2018-2022
14.7.4 Product Benchmarking
14.8 Regeneron Pharmaceuticals Inc.
14.8.1 Company Snapshot
14.8.2 Company Overview
14.8.3 Financial Analysis
14.8.3.1 Revenue, 2018-2022
14.8.3.2 R&D Expense, 2018-2022
14.8.4 Product Benchmarking
14.8.5 Strategic Outlook
14.9 AbbVie Inc.
14.9.1 Company Snapshot
14.9.2 Company Overview
14.9.3 Financial Analysis
14.9.3.1 Revenue, 2018-2022
14.9.3.2 Regional Market Shares, 2022
14.9.3.3 R&D Expense, 2018-2022
14.9.4 Product Benchmarking
14.9.5 Strategic Outlook
14.10 Verrica Pharmaceuticals
14.10.1 Company Snapshot
14.10.2 Company Overview
14.10.3 Product Benchmarking
14.11 Teva Pharmaceutical Industries Ltd.
14.11.1 Company Snapshot
14.11.2 Company Overview
14.11.3 Financial Analysis
14.11.3.1 Revenue, 2018-2022
14.11.3.2 Regional Market Shares, 2022
14.11.3.3 R&D Expense, 2018-2022
14.11.4 Product Benchmarking
14.11.5 Strategic Outlook
14.12 Roivant Sciences Ltd.
14.12.1 Company Snapshot
14.12.2 Company Overview
14.12.3 Product Benchmarking
14.12.4 Strategic Outlook
14.13 DermBiont, Inc.
14.13.1 Company Snapshot
14.13.2 Company Overview
14.13.3 Product Benchmarking
14.13.4 Strategic Outlook
14.14 AstraZeneca
14.14.1 Company Snapshot
14.14.2 Company Overview
14.14.3 Financial Analysis
14.14.3.1 Net Revenue, 2017-2022
14.14.3.2 Regional Market Shares, 2022
14.14.3.3 R&D Expense, 2018-2022
14.14.4 Product Benchmarking
14.14.5 Strategic Outlook
14.15 Merck & Co., Inc.
14.15.1 Company Snapshot
14.15.2 Company Overview
14.15.3 Financial Analysis
14.15.3.1 Net Revenue, 2017-2022
14.15.3.2 Regional Market Shares, 2022
14.15.3.3 R&D Expense, 2017-2022
14.15.4 Product Benchmarking
14.16 GSK plc
14.16.1 Company Snapshot
14.16.2 Company Overview
14.16.3 Financial Analysis
14.16.3.1 Net Revenue, 2017-2022
14.16.3.2 Regional Market Shares, 2022
14.16.3.3 R&D Expense, 2017-2022
14.16.4 Product Benchmarking
14.17 F. Hoffmann-La Roche Ltd
14.17.1 Company Snapshot
14.17.2 Company Overview
14.17.3 Financial Analysis
14.17.3.1 Net Revenue, 2018-2022
14.17.3.2 R&D Expense, 2018-2022
14.17.4 Product Benchmarking
14.18 Mayne Pharma Group Limited
14.18.1 Company Snapshot
14.18.2 Company Overview
14.18.3 Financial Analysis
14.18.3.1 Net Revenue, 2020-2023
14.18.3.2 R&D Expense, 2020-2023
14.18.4 Product Benchmarking
14.18.5 Strategic Outlook
15 Conclusion and Recommendations
15.1 Concluding Remarks from Visiongain
15.2 Recommendations for Market Players
ページTOPに戻る
List of Tables/Graphs
List of Tables
Table 1 Dermatological Drugs Market Snapshot, 2024 & 2034 (US$ billion, CAGR %)
Table 2 Dermatological Drugs Market Forecast by Region 2024-2034 (US$ Bn, AGR%, CAGR%): "V" Shaped Recovery
Table 3 Dermatological Drugs Market Forecast by Region 2024-2034 (US$ Bn, AGR%, CAGR%): "U" Shaped Recovery
Table 4 Dermatological Drugs Market Forecast by Region 2024-2034 (US$ Bn, AGR%, CAGR%): "W" Shaped Recovery
Table 5 Dermatological Drugs Market Forecast by Region 2024-2034 (US$ Bn, AGR%, CAGR%): "W" Shaped Recovery
Table 6 Dermatological Drugs Market Forecast by Route of Administration, 2024-2034 (US$ Billion, AGR%, CAGR%)
Table 7 Topical Segment Market Forecast by Region, 2024-2034 (US$ Billion, AGR%, CAGR%)
Table 8 Oral Segment Market Forecast by Region, 2024-2034 (US$ Billion, AGR%, CAGR%)
Table 9 Hardware Segment Market Forecast by Region, 2024-2034 (US$ Billion, AGR%, CAGR%)
Table 10 Dermatological Drugs Market Forecast by Disease 2024-2034 (US$ Billion, AGR%, CAGR%)
Table 11 Psoriasis Segment Market Forecast by Region, 2024-2034 (US$ Billion, AGR%, CAGR%)
Table 12 Dermatitis Segment Market Forecast by Region, 2024-2034 (US$ Billion, AGR%, CAGR%)
Table 13 Acne Segment Market Forecast by Region, 2024-2034 (US$ Billion, AGR%, CAGR%)
Table 14 Skin Infections Segment Market Forecast by Region, 2024-2034 (US$ Billion, AGR%, CAGR%)
Table 15 Others Segment Market Forecast by Region, 2024-2034 (US$ Billion, AGR%, CAGR%)
Table 16 Dermatological Drugs Market Forecast by Prescription Mode, 2024-2034 (US$ Billion, AGR%, CAGR%)
Table 17 Prescription Drugs Segment Market Forecast by Region, 2024-2034 (US$ Billion, AGR%, CAGR%)
Table 18 Over-the-Counter (OTC) Drugs Segment Market Forecast by Region, 2024-2034 (US$ Billion, AGR%, CAGR%)
Table 19 Dermatological Drugs Market Forecast by Distribution Channel 2024-2034 (US$ Billion, AGR%, CAGR%)
Table 20 Retail Pharmacies Segment Market Forecast by Region, 2024-2034 (US$ Billion, AGR%, CAGR%)
Table 21 Hospital Pharmacies Segment Market Forecast by Region, 2024-2034 (US$ Billion, AGR%, CAGR%)
Table 22 Online Pharmacies Segment Market Forecast by Region, 2024-2034 (US$ Billion, AGR%, CAGR%)
Table 23 Others Segment Market Forecast by Region, 2024-2034 (US$ Billion, AGR%, CAGR%)
Table 24 Dermatological Drugs Market Forecast by Region, 2024-2034 (US$ Billion, AGR%, CAGR%)
Table 25 North America Dermatological Drugs Market Forecast by Country, 2024-2034 (US$ Billion, AGR%, CAGR%)
Table 26 North America Dermatological Drugs Market Forecast by Route of Administration, 2024-2034 (US$ Billion, AGR%, CAGR%)
Table 27 Dermatological Drugs Market Forecast by Disease 2024-2034 (US$ Billion, AGR%, CAGR%)
Table 28 North America Dermatological Drugs Market Forecast by Prescription Mode 2024-2034 (US$ Billion, AGR%, CAGR%)
Table 29 North America Dermatological Drugs Market Forecast by Distribution Channel 2024-2034 (US$ Billion, AGR%, CAGR%)
Table 30 U.S. Dermatological Drugs Market Forecast by Country, 2024-2034 (US$ Billion, AGR%, CAGR%)
Table 31 Canada Dermatological Drugs Market Forecast by Country, 2024-2034 (US$ Billion, AGR%, CAGR%)
Table 32 Europe Dermatological Drugs Market Forecast by Country, 2024-2034 (US$ Billion, AGR%, CAGR%)
Table 33 Europe Dermatological Drugs Market Forecast by Route of Administration, 2024-2034 (US$ Billion, AGR%, CAGR%)
Table 34 Dermatological Drugs Market Forecast by Disease 2024-2034 (US$ Billion, AGR%, CAGR%)
Table 35 Europe Dermatological Drugs Market Forecast by Prescription Mode 2024-2034 (US$ Billion, AGR%, CAGR%)
Table 36 Europe Dermatological Drugs Market Forecast by Distribution Channel 2024-2034 (US$ Billion, AGR%, CAGR%)
Table 37 Germany Dermatological Drugs Market Forecast by Country, 2024-2034 (US$ Billion, AGR%, CAGR%)
Table 38 France Dermatological Drugs market Forecast, 2024-2034 (US$ Billion, AGR%, CAGR%)
Table 39 U.K. Dermatological Drugs market Forecast, 2024-2034 (US$ Billion, AGR%, CAGR%)
Table 40 Italy Dermatological Drugs Market Forecast, 2024-2034 (US$ Billion, AGR%, CAGR%)
Table 41 Spain Dermatological Drugs Market Forecast, 2024-2034 (US$ Billion, AGR%, CAGR%)
Table 42 Rest of Europe Dermatological Drugs Market Forecast, 2024-2034 (US$ Billion, AGR%, CAGR%)
Table 43 Asia Pacific Dermatological Drugs Market Forecast by Country, 2024-2034 (US$ Billion, AGR%, CAGR%)
Table 44 Asia Pacific Dermatological Drugs Market Forecast by Route of Administration, 2024-2034 (US$ Billion, AGR%, CAGR%)
Table 45 Dermatological Drugs Market Forecast by Disease 2024-2034 (US$ Billion, AGR%, CAGR%)
Table 46 Asia Pacific Dermatological Drugs Market Forecast by Prescription Mode 2024-2034 (US$ Billion, AGR%, CAGR%)
Table 47 Asia Pacific Dermatological Drugs Market Forecast by Distribution Channel 2024-2034 (US$ Billion, AGR%, CAGR%)
Table 48 China Dermatological Drugs Market Forecast, 2024-2034 (US$ Billion, AGR%, CAGR%)
Table 49 India Dermatological Drugs Market Forecast, 2024-2034 (US$ Billion, AGR%, CAGR%)
Table 50 Japan Dermatological Drugs Market Forecast, 2024-2034 (US$ Billion, AGR%, CAGR%)
Table 51 Australia Dermatological Drugs Market Forecast, 2024-2034 (US$ Billion, AGR%, CAGR%)
Table 52 South Korea Dermatological Drugs Market Forecast, 2024-2034 (US$ Billion, AGR%, CAGR%)
Table 53 Rest of Asia-Pacific Dermatological Drugs Market Forecast, 2024-2034 (US$ Billion, AGR%, CAGR%)
Table 54 Latin America Dermatological Drugs Market Forecast by Country, 2024-2034 (US$ Billion, AGR%, CAGR%)
Table 55 Latin America Dermatological Drugs Market Forecast by Route of Administration, 2024-2034 (US$ Billion, AGR%, CAGR%)
Table 56 Dermatological Drugs Market Forecast by Disease 2024-2034 (US$ Billion, AGR%, CAGR%)
Table 57 Latin America Dermatological Drugs Market Forecast by Prescription Mode 2024-2034 (US$ Billion, AGR%, CAGR%)
Table 58 Latin America Dermatological Drugs Market Forecast by Distribution Channel 2024-2034 (US$ Billion, AGR%, CAGR%)
Table 59 Brazil Dermatological Drugs Market Forecast, 2024-2034 (US$ Billion, AGR%, CAGR%)
Table 60 Mexico Dermatological Drugs Market Forecast, 2024-2034 (US$ Billion, AGR%, CAGR%)
Table 61 Rest of Latin America Dermatological Drugs Market Forecast, 2024-2034 (US$ Billion, AGR%, CAGR%)
Table 62 MEA Dermatological Drugs Market Forecast by Country, 2024-2034 (US$ Billion, AGR%, CAGR%)
Table 63 MEA Dermatological Drugs Market Forecast by Route of Administration, 2024-2034 (US$ Billion, AGR%, CAGR%)
Table 64 Dermatological Drugs Market Forecast by Disease 2024-2034 (US$ Billion, AGR%, CAGR%)
Table 65 MEA Dermatological Drugs Market Forecast by Prescription Mode 2024-2034 (US$ Billion, AGR%, CAGR%)
Table 66 MEA Dermatological Drugs Market Forecast by Distribution Channel 2024-2034 (US$ Billion, AGR%, CAGR%)
Table 67 GCC Dermatological Drugs market Forecast, 2024-2034 (US$ Billion, AGR%, CAGR%)
Table 68 South Africa Dermatological Drugs Market Forecast, 2024-2034 (US$ Billion, AGR%, CAGR%)
Table 69 Rest of MEA Dermatological Drugs Market Forecast, 2024-2034 (US$ Billion, AGR%, CAGR%)
Table 70 Strategic Outlook
Table 71 Novartis AG: Key Details, (CEO, HQ, Revenue, Founded, No. of Employees, Company Type, Website, Business Segment)
Table 72 Novartis AG: Product Benchmarking
Table 73 Novartis AG: Strategic Outlook
Table 74 Bayer AG: Key Details, (CEO, HQ, Revenue, Founded, No. of Employees, Company Type, Website, Business Segment)
Table 75 Bayer AG: Product Benchmarking
Table 76 LEO Pharma A/S: Key Details, (CEO, HQ, Revenue, Founded, No. of Employees, Company Type, Website, Business Segment)
Table 77 LEO Pharma A/S: Product Benchmarking
Table 78 LEO Pharma A/S: Strategic Outlook
Table 79 Pfizer Inc.: Key Details, (CEO, HQ, Revenue, Founded, No. of Employees, Company Type, Website, Business Segment)
Table 80 Pfizer Inc.: Product Benchmarking
Table 81 Pfizer Inc.: Strategic Outlook
Table 82 Johnson & Johnson Services, Inc.: Key Details, (CEO, HQ, Revenue, Founded, No. of Employees, Company Type, Website, Business Segment)
Table 83 Johnson & Johnson Services, Inc.: Product Benchmarking
Table 84 Regeneron Pharmaceuticals Inc.: Key Details, (CEO, HQ, Revenue, Founded, No. of Employees, Company Type, Website, Business Segment)
Table 85 Regeneron Pharmaceuticals Inc.: Product Benchmarking
Table 86 Regeneron Pharmaceuticals Inc.: Strategic Outlook
Table 87 AbbVie Inc.: Key Details, (CEO, HQ, Revenue, Founded, No. of Employees, Company Type, Website, Business Segment)
Table 88 AbbVie Inc.: Product Benchmarking
Table 89 AbbVie Inc.: Strategic Outlook
Table 90 Verrica Pharmaceuticals: Key Details, (CEO, HQ, Revenue, Founded, No. of Employees, Company Type, Website, Business Segment)
Table 91 Verrica Pharmaceuticals: Product Benchmarking
Table 92 Teva Pharmaceutical Industries Ltd.: Key Details, (CEO, HQ, Revenue, Founded, No. of Employees, Company Type, Website, Business Segment)
Table 93 Teva Pharmaceutical Industries Ltd.: Product Benchmarking
Table 94 Teva Pharmaceutical Industries Ltd.: Strategic Outlook
Table 95 Roivant Sciences Ltd.: Key Details, (CEO, HQ, Revenue, Founded, No. of Employees, Company Type, Website, Business Segment)
Table 96 Roivant Sciences Ltd.: Product Benchmarking
Table 97 Roivant Sciences Ltd.: Strategic Outlook
Table 98 DermBiont, Inc. : Key Details, (CEO, HQ, Revenue, Founded, No. of Employees, Company Type, Website, Business Segment)
Table 99 DermBiont, Inc.: Product Benchmarking
Table 100 DermBiont, Inc.: Strategic Outlook
Table 101 AstraZeneca: Key Details, (CEO, HQ, Revenue, Founded, No. of Employees, Company Type, Website, Business Segment)
Table 102 AstraZeneca: Product Benchmarking
Table 103 AstraZeneca: Strategic Outlook
Table 104 Merck & Co., Inc.: Key Details, (CEO, HQ, Revenue, Founded, No. of Employees, Company Type, Website, Business Segment)
Table 105 Merck & Co., Inc.: Product Benchmarking
Table 106 GSK plc: Key Details, (CEO, HQ, Revenue, Founded, No. of Employees, Company Type, Website, Business Segment)
Table 107 GSK plc: Product Benchmarking
Table 108 F. Hoffmann-La Roche Ltd: Key Details, (CEO, HQ, Revenue, Founded, No. of Employees, Company Type, Website, Business Segment)
Table 109 F. Hoffmann-La Roche Ltd: Product Benchmarking
Table 110 Mayne Pharma Group Limited: Key Details, (CEO, HQ, Revenue, Founded, No. of Employees, Company Type, Website, Business Segment)
Table 111 Mayne Pharma Group Limited: Product Benchmarking
Table 112 Mayne Pharma Group Limited: Strategic Outlook
List of Figures
Figure 1 Dermatological Drugs Market Segmentation
Figure 2 Dermatological Drugs Market Forecast by Route of Administration: Market Attractiveness Index
Figure 3 Dermatological Drugs Market Forecast by Disease: Market Attractiveness Index
Figure 4 Dermatological Drugs Market Forecast by Prescription Mode: Market Attractiveness Index
Figure 5 Dermatological Drugs Market Forecast by Distribution Channel: Market Attractiveness Index
Figure 6 Dermatological Drugs Market Attractiveness Index by Region
Figure 7 Dermatological Drugs Market: Market Dynamics
Figure 8 Dermatological Drugs Market by region, 2024-2034 (US$ Billion, AGR (%), CAGR (%)): “V” Shaped Recovery
Figure 9 Dermatological Drugs market by Region, 2024-2034 (US$ Billion, AGR (%), CAGR (%)): “U” Shaped Recovery
Figure 10 Dermatological Drugs market by region, 2024-2034 (US$ Billion, AGR (%), CAGR (%)): “W” Shaped Recovery
Figure 11 Dermatological Drugs market by Region, 2024-2034 (US$ Billion, AGR (%), CAGR (%)): “L” Shaped Recovery
Figure 12 Dermatological Drugs Market: Porter’s Five Forces Analysis
Figure 13 Dermatological Drugs: PEST Analysis
Figure 14 Dermatological Drugs Market Forecast by Route of Administration: Market Attractiveness Index
Figure 15 Dermatological Drugs Market Forecast by Route of Administration, 2024-2034 (US$ Billion)
Figure 16 Dermatological Drugs market Share Forecast by Route of Administration, 2024, 2029, 2034 (%)
Figure 17 Topical Market Forecast by Region, 2024-2034 (US$ Billion)
Figure 18 Topical Market Share Forecast by Region, 2024 & 2034 (%)
Figure 19 Oral Market Forecast by Region, 2024-2034 (US$ Billion)
Figure 20 Oral Market Share Forecast by Region, 2024 & 2034 (%)
Figure 21 Parenteral Market Forecast by Region, 2024-2034 (US$ Billion)
Figure 22 Parenteral Market Share Forecast by Region, 2024 & 2034 (%)
Figure 23 Dermatological Drugs Market Forecast by Disease: Market Attractiveness Index
Figure 24 Dermatological Drugs Market Forecast by Disease, 2024-2034 (US$ Billion)
Figure 25 Dermatological Drugs market Share Forecast by Therapeutic Application, 2024, 2029, 2034 (%)
Figure 26 Psoriasis Market Forecast by Region, 2024-2034 (US$ Billion)
Figure 27 Oncology Market Share Forecast by Region, 2024 & 2034 (%)
Figure 28 Dermatitis Market Forecast by Region, 2024-2034 (US$ Billion)
Figure 29 Dermatitis Market Share Forecast by Region, 2024 & 2034 (%)
Figure 30 Acne Market Forecast by Region, 2024-2034 (US$ Billion)
Figure 31 Acne Market Share Forecast by Region, 2024 & 2034 (%)
Figure 32 Skin Infections Market Forecast by Region, 2024-2034 (US$ Billion)
Figure 33 Respiratory Market Share Forecast by Region, 2024 & 2034 (%)
Figure 34 Others Market Forecast by Region, 2024-2034 (US$ Billion)
Figure 35 Others Market Share Forecast by Region, 2024 & 2034 (%)
Figure 36 Dermatological Drugs Market Forecast by Prescription Mode: Market Attractiveness Index
Figure 37 Dermatological Drugs Market Forecast by Prescription Mode, 2024-2034 (US$ Billion)
Figure 38 Dermatological Drugs Market Share Forecast by Prescription Mode, 2024, 2029, 2034 (%)
Figure 39 Prescription Drugs Market Forecast by Region, 2024-2034 (US$ Billion)
Figure 40 Prescription Drugs Market Share Forecast by Region, 2024 & 2034 (%)
Figure 41 Over-the-Counter (OTC) Drugs Market Forecast by Region, 2024-2034 (US$ Billion)
Figure 42 Over-the-Counter (OTC) Drugs Market Share Forecast by Region, 2024 & 2034 (%)
Figure 43 Dermatological Drugs Market Forecast by Distribution Channel: Market Attractiveness Index
Figure 44 Dermatological Drugs Market Forecast by Distribution Channel, 2024-2034 (US$ Billion)
Figure 45 Dermatological Drugs market Share Forecast by Technology, 2024, 2029, 2034 (%)
Figure 46 Retail Pharmacies Segment Market Forecast by Region, 2024-2034 (US$ Billion)
Figure 47 Retail Pharmacies Market Share Forecast by Region, 2024 & 2034 (%)
Figure 48 Hospital Pharmacies Market Forecast by Region, 2024-2034 (US$ Billion)
Figure 49 Hospital Pharmacies Market Share Forecast by Region, 2024 & 2034 (%)
Figure 50 Online Pharmacies Market Forecast by Region, 2024-2034 (US$ Billion)
Figure 51 Online Pharmacies Market Share Forecast by Region, 2024 & 2034 (%)
Figure 52 Others Market Forecast by Region, 2024-2034 (US$ Billion)
Figure 53 Others Market Share Forecast by Region, 2024 & 2034 (%)
Figure 54 Dermatological Drugs Market Forecast by Region 2024 & 2034 (Revenue, CAGR%)
Figure 55 Dermatological Drugs market Share Forecast by Region 2024, 2029, 2034(%)
Figure 56 Dermatological Drugs Market by Region, 2024-2034 (US$ Billion, AGR (%), CAGR (%))
Figure 57 North America Dermatological Drugs Market Attractiveness Index
Figure 58 North America Dermatological Drugs Market by region, 2024, 2029 & 2034 (US$ Billion)
Figure 59 North America Dermatological Drugs Market Forecast by Country, 2024-2034 (US$ billion)
Figure 60 North America Dermatological Drugs Market Share Forecast by Country, 2024 & 2034 (%)
Figure 61 North America Dermatological Drugs Market Forecast by Route of Administration, 2024-2034 (US$ Billion)
Figure 62 North America Dermatological Drugs Market Share Forecast by Route of Administration, 2024 & 2034 (%)
Figure 63 North America Dermatological Drugs Market Forecast by Disease, 2024-2034 (US$ Billion)
Figure 64 North America Dermatological Drugs Market Share Forecast by Disease, 2024 & 2034 (%)
Figure 65 North America Dermatological Drugs Market Forecast by Prescription Mode, 2024-2034 (US$ Billion)
Figure 66 North America Dermatological Drugs Market Share Forecast by Prescription Mode, 2024 & 2034 (%)
Figure 67 North America Dermatological Drugs Market Forecast by Distribution Channel, 2024-2034 (US$ Billion)
Figure 68 North America Dermatological Drugs Market Share Forecast by Distribution Channel, 2024 & 2034 (%)
Figure 69 U.S. Dermatological Drugs market Forecast, 2024-2034 (US$ Billion, AGR %)
Figure 70 Canada Dermatological Drugs Market Forecast, 2024-2034 (US$ Billion, AGR %)
Figure 71 Europe Dermatological Drugs Market Attractiveness Index
Figure 72 Europe Dermatological Drugs market by region, 2024, 2029 & 2034 (US$ billion)
Figure 73 Europe Dermatological Drugs Market Forecast by Country, 2024-2034 (US$ Billion)
Figure 74 Europe Dermatological Drugs Market Share Forecast by Country, 2024 & 2034 (%)
Figure 75 Europe Dermatological Drugs Market Forecast by Route of Administration, 2024-2034 (US$ Billion)
Figure 76 Europe Dermatological Drugs Market Share Forecast by Route of Administration, 2024 & 2034 (%)
Figure 77 Europe Dermatological Drugs Market Forecast by Disease, 2024-2034 (US$ Billion)
Figure 78 Europe Dermatological Drugs Market Share Forecast by Disease, 2024 & 2034 (%)
Figure 79 Europe Dermatological Drugs Market Forecast by Prescription Mode, 2024-2034 (US$ Billion)
Figure 80 Europe Dermatological Drugs Market Share Forecast by Prescription Mode, 2024 & 2034 (%)
Figure 81 Europe Dermatological Drugs Market Forecast by Distribution Channel, 2024-2034 (US$ Billion)
Figure 82 Europe Dermatological Drugs Market Share Forecast by Distribution Channel, 2024 & 2034 (%)
Figure 83 Germany Dermatological Drugs Market Forecast, 2024-2034 (US$ Billion, AGR %)
Figure 84 France Dermatological Drugs Market Forecast, 2024-2034 (US$ Billion, AGR %)
Figure 85 U.K. Dermatological Drugs Market Forecast, 2024-2034 (US$ Billion, AGR %)
Figure 86 Italy Dermatological Drugs Market Forecast, 2024-2034 (US$ Billion, AGR %)
Figure 87 Spain Dermatological Drugs Market Forecast, 2024-2034 (US$ Billion, AGR %)
Figure 88 Rest of Europe Dermatological Drugs Market Forecast, 2024-2034 (US$ billion, AGR %)
Figure 89 Asia Pacific Dermatological Drugs Market Attractiveness Index
Figure 90 Asia Pacific Dermatological Drugs market by Region, 2024, 2029 & 2034 (US$ billion)
Figure 91 Asia Pacific Dermatological Drugs Market Forecast by Country, 2024-2034 (US$ billion)
Figure 92 Asia Pacific Dermatological Drugs Market Share Forecast by Country, 2024 & 2034 (%)
Figure 93 Asia Pacific Dermatological Drugs Market Forecast by Route of Administration, 2024-2034 (US$ Billion)
Figure 94 Asia Pacific Dermatological Drugs Market Share Forecast by Route of Administration, 2024 & 2034 (%)
Figure 95 Asia Pacific Dermatological Drugs Market Forecast by Disease, 2024-2034 (US$ Billion)
Figure 96 Asia Pacific Dermatological Drugs Market Share Forecast by Disease, 2024 & 2034 (%)
Figure 97 Asia Pacific Dermatological Drugs Market Forecast by Prescription Mode, 2024-2034 (US$ Billion)
Figure 98 Asia Pacific Dermatological Drugs Market Share Forecast by Prescription Mode, 2024 & 2034 (%)
Figure 99 Asia Pacific Dermatological Drugs Market Forecast by Distribution Channel, 2024-2034 (US$ Billion)
Figure 100 Asia Pacific Dermatological Drugs Market Share Forecast by Distribution Channel, 2024 & 2034 (%)
Figure 101 China Dermatological Drugs Market Forecast, 2024-2034 (US$ Billion, AGR %)
Figure 102 India Dermatological Drugs Market Forecast, 2024-2034 (US$ billion, AGR %)
Figure 103 Japan Dermatological Drugs Market Forecast, 2024-2034 (US$ billion, AGR %)
Figure 104 Australia Dermatological Drugs Market Forecast, 2024-2034 (US$ billion, AGR %)
Figure 105 South Korea Dermatological Drugs Market Forecast, 2024-2034 (US$ Billion, AGR %)
Figure 106 Rest of Asia Pacific Dermatological Drugs Market Forecast, 2024-2034 (US$ Billion, AGR %)
Figure 107 Latin America Dermatological Drugs Market Attractiveness Index
Figure 108 Latin America Dermatological Drugs market by Region, 2024, 2029 & 2034 (US$ billion)
Figure 109 Latin America Dermatological Drugs Market Forecast by Country, 2024-2034 (US$ Billion)
Figure 110 Latin America Dermatological Drugs Market Share Forecast by Country, 2024 & 2034 (%)
Figure 111 Latin America Dermatological Drugs Market Forecast by Route of Administration, 2024-2034 (US$ Billion)
Figure 112 Latin America Dermatological Drugs Market Share Forecast by Route of Administration, 2024 & 2034 (%)
Figure 113 Latin America Dermatological Drugs Market Forecast by Disease, 2024-2034 (US$ Billion)
Figure 114 Latin America Dermatological Drugs Market Share Forecast by Disease, 2024 & 2034 (%)
Figure 115 Latin America Dermatological Drugs Market Forecast by Prescription Mode, 2024-2034 (US$ Billion)
Figure 116 Latin America Dermatological Drugs Market Share Forecast by Prescription Mode, 2024 & 2034 (%)
Figure 117 Latin America Dermatological Drugs Market Forecast by Distribution Channel, 2024-2034 (US$ Billion)
Figure 118 Latin America Dermatological Drugs Market Share Forecast by Distribution Channel, 2024 & 2034 (%)
Figure 119 Brazil Dermatological Drugs Market Forecast, 2024-2034 (US$ Billion, AGR %)
Figure 120 Mexico Dermatological Drugs Market Forecast, 2024-2034 (US$ Billion, AGR %)
Figure 121 Rest Of Latin America Dermatological Drugs Market Forecast, 2024-2034 (US$ Billion, AGR %)
Figure 122 MEA Dermatological Drugs Market Attractiveness Index
Figure 123 MEA Dermatological Drugs Market by region, 2024, 2029 & 2034 (US$ Billion)
Figure 124 MEA Dermatological Drugs Market Forecast by Country, 2024-2034 (US$ Billion)
Figure 125 MEA Dermatological Drugs market Share Forecast by Country, 2024 & 2034 (%)
Figure 126 MEA Dermatological Drugs Market Forecast by Route of Administration, 2024-2034 (US$ Billion)
Figure 127 MEA Dermatological Drugs Market Share Forecast by Route of Administration, 2024 & 2034 (%)
Figure 128 MEA Dermatological Drugs Market Forecast by Disease, 2024-2034 (US$ Billion)
Figure 129 MEA Dermatological Drugs Market Share Forecast by Disease, 2024 & 2034 (%)
Figure 130 MEA Dermatological Drugs Market Forecast by Prescription Mode, 2024-2034 (US$ Billion)
Figure 131 MEA Dermatological Drugs Market Share Forecast by Prescription Mode, 2024 & 2034 (%)
Figure 132 MEA Dermatological Drugs Market Forecast by Distribution Channel, 2024-2034 (US$ Billion)
Figure 133 MEA Dermatological Drugs Market Share Forecast by Distribution Channel, 2024 & 2034 (%)
Figure 134 GCC Dermatological Drugs market Forecast, 2024-2034 (US$ Billion, AGR %)
Figure 135 South Africa Dermatological Drugs Market Forecast, 2024-2034 (US$ Billion, AGR %)
Figure 136 Rest of MEA Dermatological Drugs market Forecast, 2024-2034 (US$ Billion, AGR %)
Figure 137 Dermatological Drugs Market: Company Share Analysis, 2023
Figure 138 Novartis AG: Net Revenue, 2018-2022 (US$ Billion, AGR%)
Figure 139 Novartis AG: Regional Market Shares, 2022
Figure 140 Novartis AG: R&D Expense, 2018-2022 (US$ Billion, AGR%)
Figure 141 Bayer AG: Net Revenue, 2018-2022 (US$ Billion, AGR%)
Figure 142 Bayer AG: Regional Market Shares, 2022
Figure 143 Bayer AG: R&D Expense, 2018-2022 (US$ Billion, AGR%)
Figure 144 Pfizer Inc.: Net Revenue, 2018-2022 (US$ Million, AGR%)
Figure 145 Pfizer Inc.: Regional Market Shares, 2022
Figure 146 Pfizer Inc.: R&D Expense, 2018-2022 (US$ Million, AGR%)
Figure 147 Johnson & Johnson Services, Inc.: Net Revenue, 2018-2022 (US$ Million, AGR%)
Figure 148 Johnson & Johnson Services, Inc.: Regional Market Shares, 2022
Figure 149 Johnson & Johnson Services, Inc.: R&D Expense, 2018-2022 (US$ Million, AGR%)
Figure 150 Regeneron Pharmaceuticals Inc.: Net Revenue, 2018-2022 (US$ Million, AGR%)
Figure 151 Regeneron Pharmaceuticals Inc: R&D Expense, 2018-2022 (US$ Million, AGR%)
Figure 152 AbbVie Inc.: Net Revenue, 2018-2022 (US$ Million, AGR%)
Figure 153 AbbVie Inc.: Regional Market Shares, 2022
Figure 154 AbbVie Inc.: R&D Expense, 2018-2022 (US$ Million, AGR%)
Figure 155 Teva Pharmaceutical Industries Ltd.: Net Revenue, 2018-2022 (US$ Million, AGR%)
Figure 156 Teva Pharmaceutical Industries Ltd: Regional Market Shares, 2022
Figure 157 Teva Pharmaceutical Industries Ltd.: R&D Expense, 2018-2022 (US$ Million, AGR%)
Figure 158 AstraZeneca: Net Revenue, 2017-2022 (US$ Billion, AGR%)
Figure 159 AstraZeneca: Regional Market Shares, 2022
Figure 160 AstraZeneca: R&D Expense, 2017-2022 (US$ Billion, AGR%)
Figure 161 Merck & Co., Inc.: Net Revenue, 2017-2022 (US$ Billion, AGR%)
Figure 162 Merck & Co., Inc.: Regional Market Shares, 2022
Figure 163 Merck & Co., Inc.: R&D Expense, 2017-2022 (US$ Billion, AGR%)
Figure 164 GSK plc: Net Revenue, 2017-2022 (US$ Billion, AGR%)
Figure 165 GSK plc: Regional Market Shares, 2022
Figure 166 GSK plc: R&D Expense, 2017-2022 (US$ Billion, AGR%)
Figure 167 F. Hoffmann-La Roche Ltd: Net Revenue, 2018-2022 (US$ Billion, AGR%)
Figure 168 F. Hoffmann-La Roche Ltd: R&D Expense, 2018-2022 (US$ Billion, AGR%)
Figure 169 Mayne Pharma Group Limited: Net Revenue, 2020-2023 (US$ Million, AGR%)
Figure 170 Mayne Pharma Group Limited: R&D Expense, 2020-2023 (US$ Million, AGR%)
ページTOPに戻る
Visiongain社のヘルスケアと医薬・化学品分野での最新刊レポート
本レポートと同じKEY WORD(dermatological)の最新刊レポート
- 本レポートと同じKEY WORDの最新刊レポートはありません。
よくあるご質問
Visiongain社はどのような調査会社ですか?
英国の調査会社ヴィジョンゲイン社(Visiongain)は、通信とエネルギーのほか、自動車や化学・医薬品、金属など、広範な市場を対象に調査を行っています。自動車市場については、市場全般に関する調査のほ... もっと見る
調査レポートの納品までの日数はどの程度ですか?
在庫のあるものは速納となりますが、平均的には 3-4日と見て下さい。
但し、一部の調査レポートでは、発注を受けた段階で内容更新をして納品をする場合もあります。
発注をする前のお問合せをお願いします。
注文の手続きはどのようになっていますか?
1)お客様からの御問い合わせをいただきます。
2)見積書やサンプルの提示をいたします。
3)お客様指定、もしくは弊社の発注書をメール添付にて発送してください。
4)データリソース社からレポート発行元の調査会社へ納品手配します。
5) 調査会社からお客様へ納品されます。最近は、pdfにてのメール納品が大半です。
お支払方法の方法はどのようになっていますか?
納品と同時にデータリソース社よりお客様へ請求書(必要に応じて納品書も)を発送いたします。
お客様よりデータリソース社へ(通常は円払い)の御振り込みをお願いします。
請求書は、納品日の日付で発行しますので、翌月最終営業日までの当社指定口座への振込みをお願いします。振込み手数料は御社負担にてお願いします。
お客様の御支払い条件が60日以上の場合は御相談ください。
尚、初めてのお取引先や個人の場合、前払いをお願いすることもあります。ご了承のほど、お願いします。
データリソース社はどのような会社ですか?
当社は、世界各国の主要調査会社・レポート出版社と提携し、世界各国の市場調査レポートや技術動向レポートなどを日本国内の企業・公官庁及び教育研究機関に提供しております。
世界各国の「市場・技術・法規制などの」実情を調査・収集される時には、データリソース社にご相談ください。
お客様の御要望にあったデータや情報を抽出する為のレポート紹介や調査のアドバイスも致します。
|
|

