陸上石油・ガスパイプライン市場レポート:2024-2034
Onshore Oil & Gas Pipelines Market Report 2024-2034
レポート詳細
陸上石油・ガスパイプライン市場レポート 2024-2034年 :本レポートは、業界とその基礎となる原動力をより良く理解したいと願うならば、新たな収益ポケットを目指す大手企業にとって貴... もっと見る
※上記価格は部署ライセンス(Departmental licence)価格です。
その他の価格についてはデータリソースまでお問合せください。
日本語のページは自動翻訳を利用し作成しています。
実際のレポートは英文のみでご納品いたします。
サマリー
レポート詳細
陸上石油・ガスパイプライン市場レポート 2024-2034年:本レポートは、業界とその基礎となる原動力をより良く理解したいと願うならば、新たな収益ポケットを目指す大手企業にとって貴重なものとなるでしょう。異業種への進出や新規地域での既存事業の拡大を目指す企業にも有用です。
急増する需要に対応するため、政府とエネルギー会社が陸上パイプライン網の拡大に積極投資
同市場は、持続的成長に寄与するいくつかの主要な推進要因によって支えられている。第一に、工業化、都市化、人口増加を背景とした世界的なエネルギー需要の増加が挙げられる。政府やエネルギー企業は、この需要急増に対応するため、陸上パイプライン網の拡大に積極的に投資している。さらに、パイプライン材料、建設技術、コーティング技術の進歩は、パイプラインの完全性、信頼性、寿命の向上に寄与している。監視制御・データ収集(SCADA)システムやスマートピギング技術などのデジタル技術の統合は、運用効率をさらに高め、メンテナンスコストを削減し、陸上パイプラインの運用における全体的な安全性を強化している。
業界が直面する課題の中で、数多くのチャンスも生まれている。持続可能で環境に優しい慣行への注目の高まりは、パイプライン材料とコーティングにおける技術革新の道を示している。さらに、非在来型石油・ガス資源の探査と開発は、陸上パイプライン・ネットワークを拡大する機会を提供する。主要な業界関係者間の戦略的パートナーシップと協力関係は、エネルギー・インフラ整備を支援する政府のイニシアティブと相まって、市場拡大に有利な環境を作り出している。人工知能や機械学習などの先進技術の統合も、パイプラインの運用と予知保全を最適化する扉を開く。
市場調査レポートを購入する前にすべき質問とは?
-
陸上石油・ガスパイプライン市場はどのように発展しているのか?
-
陸上石油・ガスパイプライン市場の推進要因と阻害要因は何か?
-
予測期間中、陸上石油・ガスパイプラインの各サブマーケットはどのように成長し、2034年にはどれくらいの売上を占めるようになるのか?
-
2024年から2034年にかけて、陸上石油・ガスパイプラインの各サブマーケットの市場シェアはどのように推移するのか?
-
2024年から2034年にかけて、市場全体を牽引する主な要因は何か?
-
主要な陸上石油・ガスパイプライン市場は、マクロ経済の動きに幅広く追随するのか、それとも個々の国の市場が他を凌駕するのか。
-
2034年までに各国市場のシェアはどのように変化し、どの地域が2034年の市場をリードするのか。
-
主要プレーヤーは誰か、また予測期間中の見通しは?
-
これらの大手企業の陸上石油・ガス・パイプライン・プロジェクトとは?
-
2024年から2034年の間に、業界はどのように発展していくのか?現在、そして今後10年間に行われる陸上石油・ガスパイプラインプロジェクトにはどのような影響があるのか?
-
陸上石油・ガスパイプライン市場をさらに拡大するためには、製品の商業化がより必要なのでしょうか?
-
陸上石油・ガスパイプライン市場はどこへ向かっているのか。
-
新商品や新サービスに最適な投資方法とは?
-
企業を新たな成長軌道に乗せ、C-suiteに移行させるための重要な展望とは?
このことが陸上石油・ガスパイプライン市場に現在、そして今後10年間でどのような影響を与えるかを知る必要がある:
-
407ページにわたる本レポートでは、122の表と209の図表を掲載しています。
-
本レポートでは、業界における主要な有利分野を取り上げているため、今すぐターゲットを絞ることができます。
-
世界、地域、国の売上と成長に関する詳細な分析が含まれています。
-
競合他社が成功した主なトレンド、変化、収益予測をハイライトしています。
本レポートは、陸上石油・ガスパイプライン市場が今後10年間にどのように発展していくのか、またCOVID-19の景気後退と好転の変動に合わせてどのように発展していくのかをお伝えするものです。この市場は、過去10年間のどの時点よりも今が重要である。
2034年までの予測やその他の分析から、商業的な展望が明らかになる
-
2034年までの収益予測に加え、最新の業績、成長率、市場シェアを提供します。
-
ビジネスの展望と展開に関する独自の分析をご覧いただけます。
-
定性的分析(市場力学、促進要因、機会、阻害要因、課題を含む)、コスト構造、陸上石油・ガスパイプライン価格上昇の影響、最近の動向をご覧いただけます。
本レポートには、COVID-19が業界と貴社にどのような影響を与えるかについてのデータ分析と貴重な洞察が含まれている。本レポートでは、COVID-19の4つの回収パターンとその影響、すなわち「V」、「L」、「W」、「U」について論じている。
レポート対象セグメント
用途別市場セグメント
素材別市場セグメント
コーティング別市場セグメント
-
ー融着エポキシ(ーFBE)コーティング
-
ー3層ポリエチレン (3LPE) コーティング
-
ーコールタールエナメル(CTE)コーティング
-
その他のコーティング
システム別市場セグメント
-
監視制御・データ収集(SCADA)システム
-
スマート・ピギング・テクノロジー
-
漏水検知システム
-
腐食モニタリングシステム
-
その他のシステム
タイプ別市場セグメント
-
電気抵抗溶接(ERW)パイプ
-
スパイラルシーム溶接(SSAW)パイプ
-
縦シーム溶接(LSAW)パイプ
-
ダブルサブマージアーク溶接(DSAW)パイプ
-
電気溶融溶接(EFW)パイプ
-
その他のタイプ
世界市場全体とセグメント別の収益予測に加え、4つの地域と20の主要国市場の収益予測も掲載しています:
北米
欧州
-
ドイツ
-
ロシア
-
イギリス
-
フランス
-
イタリア
-
その他の欧州
アジア太平洋
-
中国
-
日本
-
インド
-
オーストラリア
-
韓国
-
その他のアジア太平洋
ラテンアメリカ
中東・アフリカ
また、2024年から2034年までの陸上石油・ガスパイプライン市場の主要企業のプロファイルも掲載している。
主要企業と市場成長の可能性
-
BP Plc
-
Chevron Corporation
-
China National Petroleum Corporation (CNPC)
-
ConocoPhillips Company
-
Enbridge Inc.
-
Eni S.p.A.
-
Enterprise Products Partners L.P
-
Exxon Mobil Corporation
-
Kinder Morgan, Inc.
-
PetroChina Company Limited
-
Plains All American Pipeline, L.P.
-
Royal Dutch Shell Plc
-
TC Energy Corporation
-
The Williams Companies, Inc.
-
TotalEnergies SE
2024年から2034年までの陸上石油・ガスパイプライン市場全体の世界売上高(金額ベース)は、2024年に60億4,680万米ドルを突破する。2034年まで収益は力強く成長すると予測。当研究所では、最も大きな可能性を秘めた組織を特定している。彼らの能力、進歩、商業的展望を発見し、一歩先を行くお手伝いをします。
このレポートは陸上石油・ガスパイプライン市場の2024-2034年を調査・分析したものです。
要約すると、400ページを超えるこのレポートは、以下の知識を提供する:
-
陸上石油・ガスパイプライン市場の2024年から2034年までの収益予測 用途、素材、コーティング、システム、タイプ別に世界および地域レベルで予測 - 業界の将来性を発見し、投資と収益に最も有利な場所を見つけます。
-
4つの地域と20の主要国市場の2034年までの収益予測 - 北米、欧州、アジア太平洋、中南米、中東・アフリカの陸上石油・ガスパイプライン市場の2024年から2034年までの予測をご覧ください。また、米国、カナダ、ブラジル、ドイツ、フランス、英国、イタリア、中国、インド、日本、オーストラリアなどの主要経済圏の市場も予測しています。
-
既存企業や市場参入を目指す企業の展望 - 陸上石油・ガスパイプライン市場に関わる主要企業15社の企業プロファイルを含む、2024年から2034年までの市場。
独自の予測による定量的・定性的分析をご覧ください。私たちのレポートだけに含まれる情報を入手し、貴重なビジネスインテリジェンスで情報を得ることができます。
他にはない情報
私たちの新しいレポートがあれば、知識に遅れをとったり、チャンスを逃したりする可能性が低くなります。弊社のレポートが貴社の調査、分析、意思決定にどのように役立つかをご覧ください。Visiongainのこの調査レポートは、陸上石油・ガスパイプライン市場(2024年~2034年)の商業分析を必要とする方、市場をリードする企業の方々を対象としています。データ、トレンド、予測をご覧いただけます。
ページTOPに戻る
目次
目次
1 レポート概要
1.1 調査の目的
1.2 陸上石油ガスパイプライン市場の紹介
1.3 本レポートの内容
1.4 本レポートを読むべき理由
1.5 本分析レポートが回答する主な質問
1.6 本レポートは誰のためのものか?
1.7 方法論
1.7.1 市場の定義
1.7.2 市場評価・予測手法
1.7.3 データの検証
1.7.3.1 一次調査
1.7.3.2 セカンダリーリサーチ
1.8 よくある質問(FAQ)
1.9 Visiongainの関連レポート
1.10 Visiongainについて
2 エグゼクティブ・サマリー
3 市場概要
3.1 主要な調査結果
3.2 市場ダイナミクス
3.2.1 市場牽引要因
3.2.1.1 市場成長を牽引するエネルギー需要の増加
3.2.1.2 発展途上地域における急速な都市化と工業化がエネルギー資源需要を促進し、市場成長を牽引
3.2.1.3 市場成長を促進する戦略的レジリエンス計画
3.2.2 市場抑制要因
3.2.2.1 陸上石油・ガスパイプライン市場に重大な障害をもたらす規制上の課題
3.2.2.2 環境意識の高まりとパイプラインプロジェクトの生態系への影響への懸念が業界関係者に課題をもたらす
3.2.2.3 石油・ガス価格の変動は陸上パイプライン事業者に財務上の課題をもたらす
3.2.3 市場機会
3.2.3.1 様々な政府機関によるエネルギー・電力分野への投資の増加 市場成長の機会
3.2.3.2 国境を越えた陸上パイプラインプロジェクトの成長に寄与する業界関係者間の協力努力
3.2.3.3 世界的なエネルギー貿易の拡大が市場成長の機会
3.3 ポーターのファイブフォース分析
3.3.1 サプライヤーの交渉力(中)
3.3.2 買い手の交渉力(中)
3.3.3 競争力(高)
3.3.4 代替品による脅威(低)
3.3.5 新規参入の脅威(中~高)
3.4 COVID-19の影響分析
3.4.1 "V字型回復"
3.4.2 "U字型回復"
3.4.3 "W字型回復"
3.4.4 "L字型回復"
3.5 PEST分析
4 陸上石油・ガスパイプライン市場分析:用途別
4.1 主要な調査結果
4.2 用途別セグメント 市場魅力度指数
4.3 陸上石油・ガスパイプラインの用途別市場規模推定と予測
4.4 石油輸送
4.4.1 2024~2034年の地域別市場規模(US$ Million)
4.4.2 地域別市場シェア、2024年・2034年(%)
4.5 ガス輸送
4.5.1 2024年~2034年の地域別市場規模(US$ Million)
4.5.2 地域別市場シェア、2024年・2034年(%)
5 陸上石油・ガスパイプライン市場分析:材料別
5.1 主要調査結果
5.2 材料セグメント 市場魅力度指数
5.3 陸上石油・ガスパイプラインの素材別市場規模推定と予測
5.4 鋼管
5.4.1 2024~2034年の地域別市場規模(US$ Million)
5.4.2 地域別市場シェア、2024年・2034年(%)
5.5 ポリエチレンパイプ
5.5.1 2024~2034年の地域別市場規模(US$ Million)
5.5.2 地域別市場シェア、2024年・2034年(%)
5.6 複合パイプ
5.6.1 2024~2034年の地域別市場規模(US$ Million)
5.6.2 地域別市場シェア、2024年・2034年(%)
6 陸上石油・ガスパイプライン市場分析:コーティング別
6.1 主な調査結果
6.2 コーティング・セグメント 市場魅力度指数
6.3 陸上石油・ガスパイプラインの被覆別市場規模推定と予測
6.4 融着エポキシ(FBE)コーティング
6.4.1 2024~2034年の地域別市場規模(US$ Million)
6.4.2 地域別市場シェア、2024年・2034年 (%)
6.5 三層ポリエチレン(3LPE)コーティング
6.5.1 2024~2034年の地域別市場規模(US$ Million)
6.5.2 地域別市場シェア、2024年・2034年 (%)
6.6 コールタールエナメル(CTE)塗料
6.6.1 2024~2034年の地域別市場規模(US$ Million)
6.6.2 地域別市場シェア、2024年・2034年 (%)
6.7 その他のコーティング
6.7.1 2024~2034年の地域別市場規模(US$ Million)
6.7.2 地域別市場シェア、2024年・2034年 (%)
7 陸上石油・ガスパイプライン市場分析:システム別
7.1 主要調査結果
7.2 システムセグメント 市場魅力度指数
7.3 陸上石油・ガスパイプラインのシステム別市場規模推定と予測
7.4 監視制御・データ収集(SCADA)システム
7.4.1 2024~2034年の地域別市場規模(US$ Million)
7.4.2 地域別市場シェア、2024年・2034年(%)
7.5 スマートピギング技術
7.5.1 2024~2034年の地域別市場規模(US$ Million)
7.5.2 地域別市場シェア、2024年・2034年(%)
7.6 漏水検知システム
7.6.1 2024~2034年の地域別市場規模(US$ Million)
7.6.2 地域別市場シェア、2024年・2034年(%)
7.7 腐食モニタリングシステム
7.7.1 2024~2034年の地域別市場規模(US$ Million)
7.7.2 地域別市場シェア、2024年・2034年(%)
7.8 その他のシステム
7.8.1 2024年~2034年の地域別市場規模(US$ Million)
7.8.2 地域別市場シェア、2024年・2034年(%)
8 陸上石油・ガスパイプライン市場分析:タイプ別
8.1 主要な調査結果
8.2 タイプ別セグメント 市場魅力度指数
8.3 陸上石油・ガスパイプラインのタイプ別市場規模推定と予測
8.4 電気抵抗溶接(ERW)パイプ
8.4.1 2024~2034年の地域別市場規模(US$ Million)
8.4.2 地域別市場シェア、2024年・2034年(%)
8.5 スパイラルシーム溶接(SSAW)パイプ
8.5.1 2024~2034年の地域別市場規模(US$ Million)
8.5.2 地域別市場シェア、2024年・2034年 (%)
8.6 縦シーム溶接(LSAW)パイプ
8.6.1 2024~2034年の地域別市場規模(US$ Million)
8.6.2 地域別市場シェア、2024年・2034年 (%)
8.7 ダブルサブマージアーク溶接(DSAW)パイプ
8.7.1 2024~2034年の地域別市場規模(US$ Million)
8.7.2 地域別市場シェア、2024年・2034年 (%)
8.8 電気溶融溶接(EFW)パイプ
8.8.1 2024~2034年の地域別市場規模(US$ Million)
8.8.2 地域別市場シェア、2024年・2034年 (%)
8.9 その他のタイプ
8.9.1 2024~2034年の地域別市場規模(US$ Million)
8.9.2 地域別市場シェア、2024年・2034年 (%)
9 陸上石油・ガスパイプライン市場分析:地域別
9.1 主要な調査結果
9.2 地域別市場規模の推定と予測
10 北米の陸上石油・ガスパイプライン市場分析
10.1 主要な調査結果
10.2 北米の陸上石油・ガスパイプライン市場魅力度指数
10.3 北米の陸上石油・ガスパイプライン国別市場、2024年、2029年、2034年(US$ Million)
10.4 北米の陸上石油・ガスパイプライン市場規模の推定と予測
10.5 北米の陸上石油・ガスパイプライン市場規模推定と予測:国別
10.6 北米の陸上石油・ガスパイプライン市場規模推定と予測:用途別
10.7 北米の陸上石油・ガスパイプライン市場規模推定と予測:素材別
10.8 北米の陸上石油・ガスパイプライン市場規模推定と予測:コーティング別
10.9 北米の陸上石油・ガスパイプライン市場規模推定と予測:システム別
10.10 北米の陸上石油・ガスパイプライン市場規模推定と予測:タイプ別
10.11 米国の陸上石油・ガスパイプライン市場分析
10.12 カナダ陸上石油・ガスパイプライン市場分析
11 欧州の陸上石油・ガスパイプライン市場分析
11.1 主要な調査結果
11.2 欧州の陸上石油・ガスパイプライン市場魅力度指数
11.3 欧州の陸上石油・ガスパイプライン国別市場、2024年、2029年、2034年(US$ Million)
11.4 欧州の陸上石油・ガスパイプライン市場規模推定と予測
11.5 欧州の陸上石油・ガスパイプライン市場規模推定と予測:国別
11.6 欧州の陸上石油・ガスパイプライン市場規模推定と予測:用途別
11.7 欧州の陸上石油・ガスパイプライン市場規模推定と予測:素材別
11.8 欧州の陸上石油・ガスパイプライン市場規模推定と予測:コーティング別
11.9 欧州の陸上石油・ガスパイプライン市場規模推定と予測:システム別
11.10 欧州の陸上石油・ガスパイプライン市場規模推定と予測:タイプ別
11.11 ドイツの陸上石油・ガスパイプライン市場分析
11.12 イギリスの陸上石油・ガスパイプライン市場分析
11.13 フランスの陸上石油・ガスパイプライン市場分析
11.14 イタリアの陸上石油・ガスパイプライン市場分析
11.15 ロシアの陸上石油・ガスパイプライン市場分析
11.16 その他の欧州の陸上石油・ガスパイプライン市場分析
12 アジア太平洋の陸上石油ガスパイプライン市場分析
12.1 主要な調査結果
12.2 アジア太平洋の陸上石油・ガスパイプライン市場魅力度指数
12.3 アジア太平洋の陸上石油・ガスパイプライン国別市場、2024年、2029年、2034年(US$ Million)
12.4 アジア太平洋の陸上石油・ガスパイプライン市場規模の推定と予測
12.5 アジア太平洋の陸上石油・ガスパイプライン市場規模推定と予測:国別
12.6 アジア太平洋の陸上石油・ガスパイプライン市場規模推定と予測:用途別
12.7 アジア太平洋の陸上石油・ガスパイプライン市場規模推定と予測:素材別
12.8 アジア太平洋の陸上石油・ガスパイプライン市場規模推定と予測:コーティング別
12.9 アジア太平洋の陸上石油・ガスパイプライン市場規模推定と予測:システム別
12.10 アジア太平洋陸上石油・ガスパイプラインの市場規模推定と予測:タイプ別
12.11 中国の陸上石油・ガスパイプライン市場分析
12.12 インドの陸上石油・ガスパイプライン市場分析
12.13 日本の陸上石油・ガスパイプライン市場分析
12.14 韓国の陸上石油・ガスパイプライン市場分析
12.15 オーストラリアの陸上石油・ガスパイプライン市場分析
12.16 その他のアジア太平洋地域の陸上石油・ガスパイプライン市場分析
13 中東・アフリカの陸上石油・ガスパイプライン市場分析
13.1 主要な調査結果
13.2 中東・アフリカの陸上石油・ガスパイプライン市場魅力度指数
13.3 中東・アフリカの陸上石油・ガスパイプライン国別市場:2024年、2029年、2034年 (US$ Million)
13.4 中東・アフリカの陸上石油・ガスパイプライン市場規模推定と予測
13.5 中東・アフリカの陸上石油・ガスパイプライン市場規模推定と予測:国別
13.6 中東・アフリカの陸上石油・ガスパイプライン市場規模推定と予測:用途別
13.7 中東・アフリカの陸上石油・ガスパイプライン市場規模推定と予測:素材別
13.8 中東・アフリカの陸上石油・ガスパイプライン市場規模推定と予測:コーティング別
13.9 中東・アフリカの陸上石油・ガスパイプライン市場規模推定と予測:システム別
13.10 中東・アフリカの陸上石油・ガスパイプライン市場規模推定と予測:タイプ別
13.11 GCCの陸上石油・ガスパイプライン市場分析
13.12 南アフリカの陸上石油・ガスパイプライン市場分析
13.13 その他の中東・アフリカの陸上石油・ガスパイプライン市場分析
14 ラテンアメリカの陸上石油・ガスパイプライン市場分析
14.1 主要な調査結果
14.2 中南米の陸上石油・ガスパイプライン市場魅力度指数
14.3 ラテンアメリカの陸上石油・ガスパイプライン国別市場、2024年、2029年、2034年 (US$ Million)
14.4 ラテンアメリカの陸上石油・ガスパイプライン市場規模推定と予測
14.5 ラテンアメリカの陸上石油・ガスパイプライン市場規模推定と予測:国別
14.6 ラテンアメリカの陸上石油・ガスパイプライン市場規模推定と予測:用途別
14.7 ラテンアメリカの陸上石油・ガスパイプライン市場規模推定と予測:素材別
14.8 ラテンアメリカの陸上石油・ガスパイプライン市場規模推定と予測:コーティング別
14.9 ラテンアメリカの陸上石油・ガスパイプライン市場規模推定と予測:システム別
14.10ラテンアメリカの陸上石油・ガスパイプライン市場規模推定と予測:タイプ別
14.11 ブラジルの陸上石油・ガスパイプライン市場分析
14.12 メキシコの陸上石油・ガスパイプライン市場分析
14.13 その他のラテンアメリカの陸上石油・ガスパイプライン市場分析
15 会社概要
15.1 競争環境、2022年
15.2 戦略的展望
15.3 China National Petroleum Corporation (CNPC)
15.3.1 会社概要
15.3.2 会社概要
15.3.3 製品のベンチマーク
15.3.4 戦略的展望
15.4 TC Energy Corporation
15.4.1 会社概要
15.4.2 会社概要
15.4.3 財務分析
15.4.3.1 純収入、2018-2022年
15.4.3.2 地域別収益シェア、2022年(%)
15.4.3.3 事業セグメント別売上シェア、2022年(%)
15.4.4 製品ベンチマーク
15.5 Chevron Corporation
15.5.1 会社概要
15.5.2 会社概要
15.5.3 財務分析
15.5.3.1 純収入、2018-2022年
15.5.3.2 R&D、2018年~2022年
15.5.3.3 地域別収益シェア、2022年(%)
15.5.3.4 事業セグメント収益シェア、2022年(%)
15.5.4 製品ベンチマーク
15.5.5 戦略的展望
15.6 Exxon Mobil Corporation
15.6.1 会社概要
15.6.2 会社概要
15.6.3 財務分析
15.6.3.1 純収入(2018年~2022年
15.6.3.2 R&D、2018年~2022年
15.6.3.3 地域別収益シェア、2022年(%)
15.6.3.4 事業セグメント収益シェア、2022年(%)
15.6.4 製品ベンチマーク
15.6.5 戦略的展望
15.7 Royal Dutch Shell Plc
15.7.1 会社概要
15.7.2 会社概要
15.7.3 財務分析
15.7.3.1 純収入、2018-2022年
15.7.3.2 R&D、2018年~2022年
15.7.3.3 地域別収益シェア、2022年(%)
15.7.3.4 事業セグメント収益シェア、2022年(%)
15.7.4 製品ベンチマーク
15.7.5 戦略的展望
15.8 TotalEnergies SE
15.8.1 会社概要
15.8.2 会社概要
15.8.3 財務分析
15.8.3.1 純収入、2018-2022年
15.8.3.2 R&D、2018年~2022年
15.8.3.3 事業セグメント収益シェア、2022年(%)
15.8.4 製品ベンチマーク
15.8.5 戦略的展望
15.9 BP Plc
15.9.1 会社概要
15.9.2 会社概要
15.9.3 財務分析
15.9.3.1 純収入、2018-2022年
15.9.3.2 R&D、2018年~2022年
15.9.3.3 事業セグメント収益シェア、2022年(%)
15.9.4 製品ベンチマーク
15.10 ConocoPhillips Company
15.10.1 会社概要
15.10.2 会社概要
15.10.3 財務分析
15.10.3.1 純収入、2018年~2022年
15.10.3.2 地域別収益シェア、2022年(%)
15.10.3.3 事業セグメント別売上高シェア、2022年(%)
15.10.4 製品のベンチマーク
15.11 Eni S.p.A.
15.11.1 会社概要
15.11.2 会社概要
15.11.3 財務分析
15.11.3.1 純収入、2018-2022年
15.11.3.2 R&D、2018年〜2022年
15.11.3.3 地域別収益シェア、2022年(%)
15.11.3.4 事業セグメント収益シェア、2022年(%)
15.11.4 製品ベンチマーク
15.11.5 戦略的展望
15.12 Enterprise Products Partners L.P
15.12.1 会社概要
15.12.2 会社概要
15.12.3 財務分析
15.12.3.1 純収入、2018-2022年
15.12.3.2 事業セグメント収益シェア、2022年(%)
15.12.4 製品ベンチマーク
15.13 Plains All American Pipeline, L.P.
15.13.1 会社概要
15.13.2 会社概要
15.13.3 財務分析
15.13.3.1 純収入、2018年~2022年
15.13.3.2 地域別収入シェア、2022年(%)
15.13.3.3 事業セグメント別売上シェア、2022年(%)
15.13.4 製品ベンチマーク
15.14 The Williams Companies, Inc
15.14.1 会社概要
15.14.2 会社概要
15.14.3 財務分析
15.14.3.1 純収入、2018-2022年
15.14.4 製品ベンチマーク
15.15 Enbridge Inc
15.15.1 会社概要
15.15.2 会社概要
15.15.3 財務分析
15.15.3.1 純収入、2018年~2022年
15.15.3.2 地域別収入シェア、2022年(%)
15.15.3.3 事業セグメント別売上高シェア、2022年(%)
15.15.4 製品ベンチマーク
15.15.5 戦略的展望
15.16 Kinder Morgan, Inc.
15.16.1 会社概要
15.16.2 会社概要
15.16.3 財務分析
15.16.3.1 純収入、2018年~2022年
15.16.3.2 地域別収入シェア、2022年(%)
15.16.3.3 事業セグメント別売上シェア、2022年(%)
15.16.4 製品ベンチマーク
15.17 PetroChina Company Limited
15.17.1 会社概要
15.17.2 会社概要
15.17.3 製品ベンチマーク
15.17.4 戦略的展望
16 結論と提言
16.1 Visiongainからの結びの言葉
16.2 市場プレイヤーへの提言
ページTOPに戻る
図表リスト
表の一覧
Table 1 Onshore Oil and Gas Pipeline Market Snapshot, 2024 & 2034 (US$ Million, CAGR %)
Table 2 Global Onshore Oil & Gas Pipeline Market by Region, 2024-2034 (US$ Mn, AGR (%), CAGR (%)) (V-Shaped Recovery Scenario)
Table 3 Global Onshore Oil & Gas Pipeline Market by Region, 2024-2034 (US$ Mn, AGR (%), CAGR (%)) (U-Shaped Recovery Scenario)
Table 4 Global Onshore Oil & Gas Pipeline Market by Region, 2024-2034 (US$ Mn, AGR (%), CAGR (%)) (W-Shaped Recovery Scenario)
Table 5 Global Onshore Oil & Gas Pipeline Market by Region, 2024-2034 (US$ Mn, AGR (%), CAGR (%)) (L-Shaped Recovery Scenario)
Table 6 Global Onshore Oil & Gas Pipeline Market by Application, 2024-2034 (US$ Mn, AGR (%), CAGR (%))
Table 7 Oil Transportation Market by Region, 2024-2034 (US$ Mn, AGR (%), CAGR (%))
Table 8 Gas Transportation Market by Region, 2024-2034 (US$ Mn, AGR (%), CAGR (%))
Table 9 Global Onshore Oil & Gas Pipeline Market by Material, 2024-2034 (US$ Mn, AGR (%), CAGR (%))
Table 10 Steel Pipes Market by Region, 2024-2034 (US$ Mn, AGR (%), CAGR (%))
Table 11 Polyethylene Pipes Market by Region, 2024-2034 (US$ Mn, AGR (%), CAGR (%))
Table 12 Composite Pipes Market by Region, 2024-2034 (US$ Mn, AGR (%), CAGR (%))
Table 13 Global Onshore Oil & Gas Pipeline Market by Coating, 2024-2034 (US$ Mn, AGR (%), CAGR (%))
Table 14 Fusion Bonded Epoxy (FBE) Coating Market by Region, 2024-2034 (US$ Mn, AGR (%), CAGR (%))
Table 15 Three-Layer Polyethylene (3LPE) Coating Market by Region, 2024-2034 (US$ Mn, AGR (%), CAGR (%))
Table 16 Coal Tar Enamel (CTE) Coating Market by Region, 2024-2034 (US$ Mn, AGR (%), CAGR (%))
Table 17 Other Coating Market by Region, 2024-2034 (US$ Mn, AGR (%), CAGR (%))
Table 18 Global Onshore Oil & Gas Pipeline Market by Systems, 2024-2034 (US$ Mn, AGR (%), CAGR (%))
Table 19 Supervisory Control and Data Acquisition (SCADA) Systems Market by Region, 2024-2034 (US$ Mn, AGR (%), CAGR (%))
Table 20 Smart Pigging Technology Market by Region, 2024-2034 (US$ Mn, AGR (%), CAGR (%))
Table 21 Leak Detection Systems Market by Region, 2024-2034 (US$ Mn, AGR (%), CAGR (%))
Table 22 Corrosion Monitoring Systems Market by Region, 2024-2034 (US$ Mn, AGR (%), CAGR (%))
Table 23 Other Systems Market by Region, 2024-2034 (US$ Mn, AGR (%), CAGR (%))
Table 24 Global Onshore Oil & Gas Pipeline Market by Type, 2024-2034 (US$ Mn, AGR (%), CAGR (%))
Table 25 Electric Resistance Welded (ERW) Pipe Market by Region, 2024-2034 (US$ Mn, AGR (%), CAGR (%))
Table 26 Spiral Seam Welded (SSAW) Pipe Market by Region, 2024-2034 (US$ Mn, AGR (%), CAGR (%))
Table 27 Longitudinal Seam Welded (LSAW) Pipe Market by Region, 2024-2034 (US$ Mn, AGR (%), CAGR (%))
Table 28 Double Submerged Arc Welded (DSAW) Pipe Market by Region, 2024-2034 (US$ Mn, AGR (%), CAGR (%))
Table 29 Electric Fusion Welded (EFW) Pipe Market by Region, 2024-2034 (US$ Mn, AGR (%), CAGR (%))
Table 30 Other Type Market by Region, 2024-2034 (US$ Mn, AGR (%), CAGR (%))
Table 31 Onshore Oil and Gas Pipeline Market Forecast by Region, 2024-2034 (US$ Million, AGR%, CAGR%)
Table 32 North America Onshore Oil & Gas Pipeline Market by Value, 2024-2034 (US$ Mn, AGR (%), CAGR (%))
Table 33 North America Onshore Oil & Gas Pipeline Market by Country, 2024-2034 (US$ Mn, AGR (%), CAGR (%))
Table 34 North America Onshore Oil & Gas Pipeline Market by Application, 2024-2034 (US$ Mn, AGR (%), CAGR (%))
Table 35 North America Onshore Oil & Gas Pipeline Market by Material, 2024-2034 (US$ Mn, AGR (%), CAGR (%))
Table 36 North America Onshore Oil & Gas Pipeline Market by Coating, 2024-2034 (US$ Mn, AGR (%), CAGR (%))
Table 37 North America Onshore Oil & Gas Pipeline Market by Systems, 2024-2034 (US$ Mn, AGR (%), CAGR (%))
Table 38 North America Onshore Oil & Gas Pipeline Market by Type, 2024-2034 (US$ Mn, AGR (%), CAGR (%))
Table 39 US Onshore Oil & Gas Pipeline Market by Value, 2024-2034 (US$ Mn, AGR (%), CAGR (%))
Table 40 Canada Onshore Oil & Gas Pipeline Market by Value, 2024-2034 (US$ Mn, AGR (%), CAGR (%))
Table 41 Europe Onshore Oil & Gas Pipeline Market by Value, 2024-2034 (US$ Mn, AGR (%), CAGR (%))
Table 42 Europe Onshore Oil & Gas Pipeline Market by Country, 2024-2034 (US$ Mn, AGR (%), CAGR (%))
Table 43 Europe Onshore Oil & Gas Pipeline Market by Application, 2024-2034 (US$ Mn, AGR (%), CAGR (%))
Table 44 Europe Onshore Oil & Gas Pipeline Market by Material, 2024-2034 (US$ Mn, AGR (%), CAGR (%))
Table 45 Europe Onshore Oil & Gas Pipeline Market by Coating, 2024-2034 (US$ Mn, AGR (%), CAGR (%))
Table 46 Europe Onshore Oil & Gas Pipeline Market by Systems, 2024-2034 (US$ Mn, AGR (%), CAGR (%))
Table 47 Europe Onshore Oil & Gas Pipeline Market by Type, 2024-2034 (US$ Mn, AGR (%), CAGR (%))
Table 48 Germany Onshore Oil & Gas Pipeline Market by Value, 2024-2034 (US$ Mn, AGR (%), CAGR (%))
Table 49 UK Onshore Oil & Gas Pipeline Market by Value, 2024-2034 (US$ Mn, AGR (%), CAGR (%))
Table 50 France Onshore Oil & Gas Pipeline Market by Value, 2024-2034 (US$ Mn, AGR (%), CAGR (%))
Table 51 Italy Onshore Oil & Gas Pipeline Market by Value, 2024-2034 (US$ Mn, AGR (%), CAGR (%))
Table 52 Russia Onshore Oil & Gas Pipeline Market by Value, 2024-2034 (US$ Mn, AGR (%), CAGR (%))
Table 53 Rest of Europe Onshore Oil & Gas Pipeline Market by Value, 2024-2034 (US$ Mn, AGR (%), CAGR (%))
Table 54 Asia-Pacific Onshore Oil & Gas Pipeline Market by Value, 2024-2034 (US$ Mn, AGR (%), CAGR (%))
Table 55 Asia-Pacific Onshore Oil & Gas Pipeline Market by Country, 2024-2034 (US$ Mn, AGR (%), CAGR (%))
Table 56 Asia-Pacific Onshore Oil & Gas Pipeline Market by Application, 2024-2034 (US$ Mn, AGR (%), CAGR (%))
Table 57 Asia-Pacific Onshore Oil & Gas Pipeline Market by Material, 2024-2034 (US$ Mn, AGR (%), CAGR (%))
Table 58 Asia-Pacific Onshore Oil & Gas Pipeline Market by Coating, 2024-2034 (US$ Mn, AGR (%), CAGR (%))
Table 59 Asia-Pacific Onshore Oil & Gas Pipeline Market by Systems, 2024-2034 (US$ Mn, AGR (%), CAGR (%))
Table 60 Asia-Pacific Onshore Oil & Gas Pipeline Market by Type, 2024-2034 (US$ Mn, AGR (%), CAGR (%))
Table 61 China Onshore Oil & Gas Pipeline Market by Value, 2024-2034 (US$ Mn, AGR (%), CAGR (%))
Table 62 India Onshore Oil & Gas Pipeline Market by Value, 2024-2034 (US$ Mn, AGR (%), CAGR (%))
Table 63 Japan Onshore Oil & Gas Pipeline Market by Value, 2024-2034 (US$ Mn, AGR (%), CAGR (%))
Table 64 South Korea Onshore Oil & Gas Pipeline Market by Value, 2024-2034 (US$ Mn, AGR (%), CAGR (%))
Table 65 Australia Onshore Oil & Gas Pipeline Market by Value, 2024-2034 (US$ Mn, AGR (%), CAGR (%))
Table 66 Rest of Asia-Pacific Onshore Oil & Gas Pipeline Market by Value, 2024-2034 (US$ Mn, AGR (%), CAGR (%))
Table 67 Middle East & Africa Onshore Oil & Gas Pipeline Market by Value, 2024-2034 (US$ Mn, AGR (%), CAGR (%))
Table 68 Middle East & Africa Onshore Oil & Gas Pipeline Market by Country, 2024-2034 (US$ Mn, AGR (%), CAGR (%))
Table 69 Middle East & Africa Onshore Oil & Gas Pipeline Market by Application, 2024-2034 (US$ Mn, AGR (%), CAGR (%))
Table 70 Middle East & Africa Onshore Oil & Gas Pipeline Market by Material, 2024-2034 (US$ Mn, AGR (%), CAGR (%))
Table 71 Middle East & Africa Onshore Oil & Gas Pipeline Market by Coating, 2024-2034 (US$ Mn, AGR (%), CAGR (%))
Table 72 Middle East & Africa Onshore Oil & Gas Pipeline Market by Systems, 2024-2034 (US$ Mn, AGR (%), CAGR (%))
Table 73 Middle East & Africa Onshore Oil & Gas Pipeline Market by Type, 2024-2034 (US$ Mn, AGR (%), CAGR (%))
Table 74 GCC Onshore Oil & Gas Pipeline Market by Value, 2024-2034 (US$ Mn, AGR (%), CAGR (%))
Table 75 South Africa Onshore Oil & Gas Pipeline Market by Value, 2024-2034 (US$ Mn, AGR (%), CAGR (%))
Table 76 Rest of Middle East & Africa Onshore Oil & Gas Pipeline Market by Value, 2024-2034 (US$ Mn, AGR (%), CAGR (%))
Table 77 Latin America Onshore Oil & Gas Pipeline Market by Value, 2024-2034 (US$ Mn, AGR (%), CAGR (%))
Table 78 Latin America Onshore Oil & Gas Pipeline Market by Country, 2024-2034 (US$ Mn, AGR (%), CAGR (%))
Table 79 Latin America Onshore Oil & Gas Pipeline Market by Application, 2024-2034 (US$ Mn, AGR (%), CAGR (%))
Table 80 Latin America Onshore Oil & Gas Pipeline Market by Material, 2024-2034 (US$ Mn, AGR (%), CAGR (%))
Table 81 Latin America Onshore Oil & Gas Pipeline Market by Coating, 2024-2034 (US$ Mn, AGR (%), CAGR (%))
Table 82 Latin America Onshore Oil & Gas Pipeline Market by Systems, 2024-2034 (US$ Mn, AGR (%), CAGR (%))
Table 83 Latin America Onshore Oil & Gas Pipeline Market by Type, 2024-2034 (US$ Mn, AGR (%), CAGR (%))
Table 84 Brazil Onshore Oil & Gas Pipeline Market by Value, 2024-2034 (US$ Mn, AGR (%), CAGR (%))
Table 85 Mexico Onshore Oil & Gas Pipeline Market by Value, 2024-2034 (US$ Mn, AGR (%), CAGR (%))
Table 86 Rest of Latin America Onshore Oil & Gas Pipeline Market by Value, 2024-2034 (US$ Mn, AGR (%), CAGR (%))
Table 87 Strategic Outlook - Contract
Table 88 China National Petroleum Corporation (CNPC): Key Details, (CEO, HQ, Revenue, Founded, No. of Employees, Company Type, Website, Business Segment)
Table 89 China National Petroleum Corporation (CNPC): Product Benchmarking
Table 90 China National Petroleum Corporation (CNPC): Strategic Outlook
Table 91 TC Energy Corporation: Key Details, (CEO, HQ, Revenue, Founded, No. of Employees, Company Type, Website, Business Segment)
Table 92 TC Energy Corporation: Product Benchmarking
Table 93 Chevron Corporation: Key Details, (CEO, HQ, Revenue, Founded, No. of Employees, Company Type, Website, Business Segment)
Table 94 Chevron Corporation: Product Benchmarking
Table 95 Chevron Corporation: Strategic Outlook
Table 96 Exxon Mobil Corporation: Key Details, (CEO, HQ, Revenue, Founded, No. of Employees, Company Type, Website, Business Segment)
Table 97 Exxon Mobil Corporation: Product Benchmarking
Table 98 Exxon Mobil Corporation: Strategic Outlook
Table 99 Royal Dutch Shell Plc: Key Details, (CEO, HQ, Revenue, Founded, No. of Employees, Company Type, Website, Business Segment)
Table 100 Royal Dutch Shell Plc: Product Benchmarking
Table 101 Royal Dutch Shell Plc: Strategic Outlook
Table 102 TotalEnergies SE: Key Details, (CEO, HQ, Revenue, Founded, No. of Employees, Company Type, Website, Business Segment)
Table 103 TotalEnergies SE: Product Benchmarking
Table 104 TotalEnergies SE: Strategic Outlook
Table 105 BP Plc: Key Details, (CEO, HQ, Revenue, Founded, No. of Employees, Company Type, Website, Business Segment)
Table 106 ConocoPhillips Company: Key Details, (CEO, HQ, Revenue, Founded, No. of Employees, Company Type, Website, Business Segment)
Table 107 ConocoPhillips Company: Product Benchmarking
Table 108 Eni S.p.A.: Key Details, (CEO, HQ, Revenue, Founded, No. of Employees, Company Type, Website, Business Segment)
Table 109 Eni S.p.A.: Product Benchmarking
Table 110 Eni S.p.A.: Strategic Outlook
Table 111 Enterprise Products Partners L.P: Key Details, (CEO, HQ, Revenue, Founded, No. of Employees, Company Type, Website, Business Segment)
Table 112 Enterprise Products Partners L.P: Product Benchmarking
Table 113 Plains All American Pipeline, L.P.: Key Details, (CEO, HQ, Revenue, Founded, No. of Employees, Company Type, Website, Business Segment)
Table 114 Plains All American Pipeline, L.P.: Product Benchmarking
Table 115 The Williams Companies, Inc: Key Details, (CEO, HQ, Revenue, Founded, No. of Employees, Company Type, Website, Business Segment)
Table 116 Enbridge Inc: Key Details, (CEO, HQ, Revenue, Founded, No. of Employees, Company Type, Website, Business Segment)
Table 117 Enbridge Inc: Strategic Outlook
Table 118 Kinder Morgan, Inc.: Key Details, (CEO, HQ, Revenue, Founded, No. of Employees, Company Type, Website, Business Segment)
Table 119 Kinder Morgan, Inc.: Product Benchmarking
Table 120 PetroChina Company Limited: Key Details, (CEO, HQ, Revenue, Founded, No. of Employees, Company Type, Website, Business Segment)
Table 121 PetroChina Company Limited: Product Benchmarking
Table 122 PetroChina Company Limited: Strategic Outlook
図の一覧
Figure 1 Onshore Oil and Gas Pipeline Market Segmentation
Figure 2 Onshore Oil and Gas Pipeline Market by Application: Market Attractiveness Index
Figure 3 Onshore Oil and Gas Pipeline Market by Material: Market Attractiveness Index
Figure 4 Onshore Oil and Gas Pipeline Market by Coating: Market Attractiveness Index
Figure 5 Onshore Oil and Gas Pipeline Market by Systems: Market Attractiveness Index
Figure 6 Onshore Oil and Gas Pipeline Market by Type: Market Attractiveness Index
Figure 7 Onshore Oil and Gas Pipeline Market Attractiveness Index by Region
Figure 8 Onshore Oil and Gas Pipeline Market: Market Dynamics
Figure 9 Onshore Oil and Gas Pipeline Market: Porter’s Five Forces Analysis
Figure 10 Global Onshore Oil and Gas Pipeline Market Share Forecast by COVID, 2024-2034 (%)
Figure 11 Global Onshore Oil & Gas Pipeline Market by Region, 2024-2034 (US$ Mn, AGR (%)) (V-Shaped Recovery Scenario)
Figure 12 Global Onshore Oil & Gas Pipeline Market by Region, 2024-2034 (US$ Mn, AGR (%)) (U-Shaped Recovery Scenario)
Figure 13 Global Onshore Oil & Gas Pipeline Market by Region, 2024-2034 (US$ Mn, AGR (%)) (W-Shaped Recovery Scenario)
Figure 14 Global Onshore Oil & Gas Pipeline Market by Region, 2024-2034 (US$ Mn, AGR (%)) (L-Shaped Recovery Scenario)
Figure 15 Onshore Oil and Gas Pipeline Market: PEST Analysis
Figure 16 Onshore Oil and Gas Pipeline Market by Application: Market Attractiveness Index
Figure 17 Global Onshore Oil & Gas Pipeline Market by Application, 2024-2034 (US$ Mn, AGR (%))
Figure 18 Onshore Oil and Gas Pipeline Market Share Forecast by Application, 2024, 2029, 2034 (%)
Figure 19 Oil Transportation Market by Region, 2024-2034 (US$ Mn, AGR (%))
Figure 20 Oil Transportation Market Share Forecast by Region, 2024 & 2034 (%)
Figure 21 Gas Transportation Market by Region, 2024-2034 (US$ Mn, AGR (%))
Figure 22 Gas Transportation Market Share Forecast by Region, 2024 & 2034 (%)
Figure 23 Onshore Oil and Gas Pipeline Market by Material: Market Attractiveness Index
Figure 24 Global Onshore Oil & Gas Pipeline Market by Material, 2024-2034 (US$ Mn, AGR (%))
Figure 25 Onshore Oil and Gas Pipeline Market Share Forecast by Material, 2024, 2029, 2034 (%)
Figure 26 Steel Pipes Market by Region, 2024-2034 (US$ Mn, AGR (%))
Figure 27 Steel Pipes Market Share Forecast by Region, 2024 & 2034 (%)
Figure 28 Polyethylene Pipes Market by Region, 2024-2034 (US$ Mn, AGR (%))
Figure 29 Polyethylene Pipes Market Share Forecast by Region, 2024 & 2034 (%)
Figure 30 Composite Pipes Market by Region, 2024-2034 (US$ Mn, AGR (%))
Figure 31 Composite Pipes Market Share Forecast by Region, 2024 & 2034 (%)
Figure 32 Onshore Oil and Gas Pipeline Market by Coating: Market Attractiveness Index
Figure 33 Global Onshore Oil & Gas Pipeline Market by Coating, 2024-2034 (US$ Mn, AGR (%))
Figure 34 Onshore Oil and Gas Pipeline Market Share Forecast by Coating, 2024, 2029, 2034 (%)
Figure 35 Fusion Bonded Epoxy (FBE) Coating Market by Region, 2024-2034 (US$ Mn, AGR (%))
Figure 36 Fusion Bonded Epoxy (FBE) Coating Market Share Forecast by Region, 2024 & 2034 (%)
Figure 37 Three-Layer Polyethylene (3LPE) Coating Market by Region, 2024-2034 (US$ Mn, AGR (%))
Figure 38 Three-Layer Polyethylene (3LPE) Coating Market Share Forecast by Region, 2024 & 2034 (%)
Figure 39 Coal Tar Enamel (CTE) Coating Market by Region, 2024-2034 (US$ Mn, AGR (%))
Figure 40 Coal Tar Enamel (CTE) Coating Market Share Forecast by Region, 2024 & 2034 (%)
Figure 41 Other Coating Market by Region, 2024-2034 (US$ Mn, AGR (%))
Figure 42 Other Coating Market Share Forecast by Region, 2024 & 2034 (%)
Figure 43 Onshore Oil and Gas Pipeline Market by Systems: Market Attractiveness Index
Figure 44 Global Onshore Oil & Gas Pipeline Market by Systems, 2024-2034 (US$ Mn, AGR (%))
Figure 45 Onshore Oil and Gas Pipeline Market Share Forecast by Systems, 2024, 2029, 2034 (%)
Figure 46 Supervisory Control and Data Acquisition (SCADA) Systems Market by Region, 2024-2034 (US$ Mn, AGR (%))
Figure 47 Supervisory Control and Data Acquisition (SCADA) Systems Market Share Forecast by Region, 2024 & 2034 (%)
Figure 48 Smart Pigging Technology Market by Region, 2024-2034 (US$ Mn, AGR (%))
Figure 49 Smart Pigging Technology Market Share Forecast by Region, 2024 & 2034 (%)
Figure 50 Leak Detection Systems Market by Region, 2024-2034 (US$ Mn, AGR (%))
Figure 51 Leak Detection Systems Market Share Forecast by Region, 2024 & 2034 (%)
Figure 52 Corrosion Monitoring Systems Market by Region, 2024-2034 (US$ Mn, AGR (%))
Figure 53 Corrosion Monitoring Systems Market Share Forecast by Region, 2024 & 2034 (%)
Figure 54 Other Systems Market by Region, 2024-2034 (US$ Mn, AGR (%))
Figure 55 Other Systems Market Share Forecast by Region, 2024 & 2034 (%)
Figure 56 Onshore Oil and Gas Pipeline Market by Type: Market Attractiveness Index
Figure 57 Global Onshore Oil & Gas Pipeline Market by Type, 2024-2034 (US$ Mn, AGR (%))
Figure 58 Onshore Oil and Gas Pipeline Market Share Forecast by Type, 2024, 2029, 2034 (%)
Figure 59 Electric Resistance Welded (ERW) Pipe Market by Region, 2024-2034 (US$ Mn, AGR (%))
Figure 60 Electric Resistance Welded (ERW) Pipe Market Share Forecast by Region, 2024 & 2034 (%)
Figure 61 Spiral Seam Welded (SSAW) Pipe Market by Region, 2024-2034 (US$ Mn, AGR (%))
Figure 62 Spiral Seam Welded (SSAW) Pipe Market Share Forecast by Region, 2024 & 2034 (%)
Figure 63 Longitudinal Seam Welded (LSAW) Pipe Market by Region, 2024-2034 (US$ Mn, AGR (%))
Figure 64 Longitudinal Seam Welded (LSAW) Pipe Market Share Forecast by Region, 2024 & 2034 (%)
Figure 65 Double Submerged Arc Welded (DSAW) Pipe Market by Region, 2024-2034 (US$ Mn, AGR (%))
Figure 66 Double Submerged Arc Welded (DSAW) Pipe Market Share Forecast by Region, 2024 & 2034 (%)
Figure 67 Electric Fusion Welded (EFW) Pipe Market by Region, 2024-2034 (US$ Mn, AGR (%))
Figure 68 Electric Fusion Welded (EFW) Pipe Market Share Forecast by Region, 2024 & 2034 (%)
Figure 69 Other Type Market by Region, 2024-2034 (US$ Mn, AGR (%))
Figure 70 Other Type Market Share Forecast by Region, 2024 & 2034 (%)
Figure 71 Onshore Oil and Gas Pipeline Market Forecast by Region 2024 and 2034 (Revenue, CAGR%)
Figure 72 Onshore Oil and Gas Pipeline Market Share Forecast by Region 2024, 2029, 2034 (%)
Figure 73 Onshore Oil and Gas Pipeline Market by Region, 2024-2034 (US$ Million, AGR %)
Figure 74 North America Onshore Oil and Gas Pipeline Market Attractiveness Index
Figure 75 North America Onshore Oil and Gas Pipeline Market by Region, 2024, 2029 & 2034 (US$ Million)
Figure 76 North America Onshore Oil & Gas Pipeline Market by Value, 2024-2034 (US$ Mn, AGR (%))
Figure 77 North America Onshore Oil & Gas Pipeline Market by Country, 2024-2034 (US$ Mn, AGR (%))
Figure 78 North America Onshore Oil and Gas Pipeline Market Share Forecast by Country, 2024 & 2034 (%)
Figure 79 North America Onshore Oil & Gas Pipeline Market by Application, 2024-2034 (US$ Mn, AGR (%))
Figure 80 North America Onshore Oil and Gas Pipeline Market Share Forecast Application, 2024 & 2034 (%)
Figure 81 North America Onshore Oil & Gas Pipeline Market by Material, 2024-2034 (US$ Mn, AGR (%))
Figure 82 North America Onshore Oil and Gas Pipeline Market Share Forecast by Material, 2024 & 2034 (%)
Figure 83 North America Onshore Oil & Gas Pipeline Market by Coating, 2024-2034 (US$ Mn, AGR (%))
Figure 84 North America Onshore Oil and Gas Pipeline Market Share Forecast by Coating, 2024 & 2034 (%)
Figure 85 North America Onshore Oil & Gas Pipeline Market by Systems, 2024-2034 (US$ Mn, AGR (%))
Figure 86 North America Onshore Oil and Gas Pipeline Market Share Forecast by Systems, 2024 & 2034 (%)
Figure 87 North America Onshore Oil & Gas Pipeline Market by Type, 2024-2034 (US$ Mn, AGR (%))
Figure 88 North America Onshore Oil and Gas Pipeline Market Share Forecast by Type, 2024 & 2034 (%)
Figure 89 US Onshore Oil & Gas Pipeline Market by Value, 2024-2034 (US$ Mn, AGR (%))
Figure 90 Canada Onshore Oil & Gas Pipeline Market by Value, 2024-2034 (US$ Mn, AGR (%))
Figure 91 Europe Onshore Oil and Gas Pipeline Market Attractiveness Index
Figure 92 Europe Onshore Oil and Gas Pipeline Market by Region, 2024, 2029 & 2034 (US$ Million)
Figure 93 Europe Onshore Oil & Gas Pipeline Market by Value, 2024-2034 (US$ Mn, AGR (%))
Figure 94 Europe Onshore Oil & Gas Pipeline Market by Country, 2024-2034 (US$ Mn, AGR (%))
Figure 95 Europe Onshore Oil and Gas Pipeline Market Share Forecast by Country, 2024 & 2034 (%)
Figure 96 Europe Onshore Oil & Gas Pipeline Market by Application, 2024-2034 (US$ Mn, AGR (%))
Figure 97 Europe Onshore Oil and Gas Pipeline Market Share Forecast Application, 2024 & 2034 (%)
Figure 98 Europe Onshore Oil & Gas Pipeline Market by Material, 2024-2034 (US$ Mn, AGR (%))
Figure 99 Europe Onshore Oil and Gas Pipeline Market Share Forecast by Material, 2024 & 2034 (%)
Figure 100 Europe Onshore Oil & Gas Pipeline Market by Coating, 2024-2034 (US$ Mn, AGR (%))
Figure 101 Europe Onshore Oil and Gas Pipeline Market Share Forecast by Coating, 2024 & 2034 (%)
Figure 102 Europe Onshore Oil & Gas Pipeline Market by Systems, 2024-2034 (US$ Mn, AGR (%))
Figure 103 Europe Onshore Oil and Gas Pipeline Market Share Forecast by Systems, 2024 & 2034 (%)
Figure 104 Europe Onshore Oil & Gas Pipeline Market by Type, 2024-2034 (US$ Mn, AGR (%))
Figure 105 Europe Onshore Oil and Gas Pipeline Market Share Forecast by Type, 2024 & 2034 (%)
Figure 106 Germany Onshore Oil & Gas Pipeline Market by Value, 2024-2034 (US$ Mn, AGR (%))
Figure 107 UK Onshore Oil & Gas Pipeline Market by Value, 2024-2034 (US$ Mn, AGR (%))
Figure 108 France Onshore Oil & Gas Pipeline Market by Value, 2024-2034 (US$ Mn, AGR (%))
Figure 109 Italy Onshore Oil & Gas Pipeline Market by Value, 2024-2034 (US$ Mn, AGR (%))
Figure 110 Russia Onshore Oil & Gas Pipeline Market by Value, 2024-2034 (US$ Mn, AGR (%))
Figure 111 Rest of Europe Onshore Oil & Gas Pipeline Market by Value, 2024-2034 (US$ Mn, AGR (%))
Figure 112 Asia-Pacific Onshore Oil and Gas Pipeline Market Attractiveness Index
Figure 113 Asia-Pacific Onshore Oil and Gas Pipeline Market by Region, 2024, 2029 & 2034 (US$ Million)
Figure 114 Asia-Pacific Onshore Oil & Gas Pipeline Market by Value, 2024-2034 (US$ Mn, AGR (%))
Figure 115 Asia-Pacific Onshore Oil & Gas Pipeline Market by Country, 2024-2034 (US$ Mn, AGR (%))
Figure 116 Asia-Pacific Onshore Oil and Gas Pipeline Market Share Forecast by Country, 2024 & 2034 (%)
Figure 117 Asia-Pacific Onshore Oil & Gas Pipeline Market by Application, 2024-2034 (US$ Mn, AGR (%))
Figure 118 Asia-Pacific Onshore Oil and Gas Pipeline Market Share Forecast Application, 2024 & 2034 (%)
Figure 119 Asia-Pacific Onshore Oil & Gas Pipeline Market by Material, 2024-2034 (US$ Mn, AGR (%))
Figure 120 Asia-Pacific Onshore Oil and Gas Pipeline Market Share Forecast by Material, 2024 & 2034 (%)
Figure 121 Asia-Pacific Onshore Oil & Gas Pipeline Market by Coating, 2024-2034 (US$ Mn, AGR (%))
Figure 122 Asia-Pacific Onshore Oil and Gas Pipeline Market Share Forecast by Coating, 2024 & 2034 (%)
Figure 123 Asia-Pacific Onshore Oil & Gas Pipeline Market by Systems, 2024-2034 (US$ Mn, AGR (%))
Figure 124 Asia-Pacific Onshore Oil and Gas Pipeline Market Share Forecast by Systems, 2024 & 2034 (%)
Figure 125 Asia-Pacific Onshore Oil & Gas Pipeline Market by Type, 2024-2034 (US$ Mn, AGR (%))
Figure 126 Asia-Pacific Onshore Oil and Gas Pipeline Market Share Forecast by Type, 2024 & 2034 (%)
Figure 127 China Onshore Oil & Gas Pipeline Market by Value, 2024-2034 (US$ Mn, AGR (%))
Figure 128 India Onshore Oil & Gas Pipeline Market by Value, 2024-2034 (US$ Mn, AGR (%))
Figure 129 Japan Onshore Oil & Gas Pipeline Market by Value, 2024-2034 (US$ Mn, AGR (%))
Figure 130 South Korea Onshore Oil & Gas Pipeline Market by Value, 2024-2034 (US$ Mn, AGR (%))
Figure 131 Australia Onshore Oil & Gas Pipeline Market by Value, 2024-2034 (US$ Mn, AGR (%))
Figure 132 Rest of Asia-Pacific Onshore Oil & Gas Pipeline Market by Value, 2024-2034 (US$ Mn, AGR (%))
Figure 133 Middle East and Africa Onshore Oil and Gas Pipeline Market Attractiveness Index
Figure 134 Middle East and Africa Onshore Oil and Gas Pipeline Market by Region, 2024, 2029 & 2034 (US$ Million)
Figure 135 Middle East & Africa Onshore Oil & Gas Pipeline Market by Value, 2024-2034 (US$ Mn, AGR (%))
Figure 136 Middle East & Africa Onshore Oil & Gas Pipeline Market by Country, 2024-2034 (US$ Mn, AGR (%))
Figure 137 Middle East and Africa Onshore Oil and Gas Pipeline Market Share Forecast by Country, 2024 & 2034 (%)
Figure 138 Middle East & Africa Onshore Oil & Gas Pipeline Market by Application, 2024-2034 (US$ Mn, AGR (%))
Figure 139 Middle East and Africa Onshore Oil and Gas Pipeline Market Share Forecast Application, 2024 & 2034 (%)
Figure 140 Middle East & Africa Onshore Oil & Gas Pipeline Market by Material, 2024-2034 (US$ Mn, AGR (%))
Figure 141 Middle East and Africa Onshore Oil and Gas Pipeline Market Share Forecast by Material, 2024 & 2034 (%)
Figure 142 Middle East & Africa Onshore Oil & Gas Pipeline Market by Coating, 2024-2034 (US$ Mn, AGR (%))
Figure 143 Middle East and Africa Onshore Oil and Gas Pipeline Market Share Forecast by Coating, 2024 & 2034 (%)
Figure 144 Middle East & Africa Onshore Oil & Gas Pipeline Market by Systems, 2024-2034 (US$ Mn, AGR (%))
Figure 145 Middle East and Africa Onshore Oil and Gas Pipeline Market Share Forecast by Systems, 2024 & 2034 (%)
Figure 146 Middle East & Africa Onshore Oil & Gas Pipeline Market by Type, 2024-2034 (US$ Mn, AGR (%))
Figure 147 Middle East and Africa Onshore Oil and Gas Pipeline Market Share Forecast by Type, 2024 & 2034 (%)
Figure 148 GCC Onshore Oil & Gas Pipeline Market by Value, 2024-2034 (US$ Mn, AGR (%))
Figure 149 South Africa Onshore Oil & Gas Pipeline Market by Value, 2024-2034 (US$ Mn, AGR (%))
Figure 150 Rest of Middle East & Africa Onshore Oil & Gas Pipeline Market by Value, 2024-2034 (US$ Mn, AGR (%))
Figure 151 Latin America Onshore Oil and Gas Pipeline Market Attractiveness Index
Figure 152 Latin America Onshore Oil and Gas Pipeline Market by Region, 2024, 2029 & 2034 (US$ Million)
Figure 153 Latin America Onshore Oil & Gas Pipeline Market by Value, 2024-2034 (US$ Mn, AGR (%))
Figure 154 Latin America Onshore Oil & Gas Pipeline Market by Country, 2024-2034 (US$ Mn, AGR (%))
Figure 155 Latin America Onshore Oil and Gas Pipeline Market Share Forecast by Country, 2024 & 2034 (%)
Figure 156 Latin America Onshore Oil & Gas Pipeline Market by Application, 2024-2034 (US$ Mn, AGR (%))
Figure 157 Latin America Onshore Oil and Gas Pipeline Market Share Forecast Application, 2024 & 2034 (%)
Figure 158 Latin America Onshore Oil & Gas Pipeline Market by Material, 2024-2034 (US$ Mn, AGR (%))
Figure 159 Latin America Onshore Oil and Gas Pipeline Market Share Forecast by Material, 2024 & 2034 (%)
Figure 160 Latin America Onshore Oil & Gas Pipeline Market by Coating, 2024-2034 (US$ Mn, AGR (%))
Figure 161 Latin America Onshore Oil and Gas Pipeline Market Share Forecast by Coating, 2024 & 2034 (%)
Figure 162 Latin America Onshore Oil & Gas Pipeline Market by Systems, 2024-2034 (US$ Mn, AGR (%))
Figure 163 Latin America Onshore Oil and Gas Pipeline Market Share Forecast by Systems, 2024 & 2034 (%)
Figure 164 Latin America Onshore Oil & Gas Pipeline Market by Type, 2024-2034 (US$ Mn, AGR (%))
Figure 165 Latin America Onshore Oil and Gas Pipeline Market Share Forecast by Type, 2024 & 2034 (%)
Figure 166 Brazil Onshore Oil & Gas Pipeline Market by Value, 2024-2034 (US$ Mn, AGR (%))
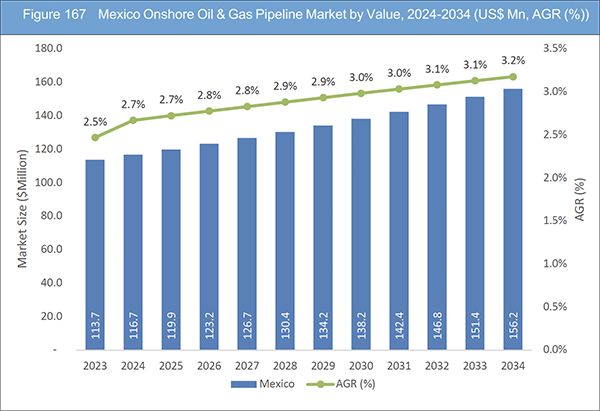
Figure 167 Mexico Onshore Oil & Gas Pipeline Market by Value, 2024-2034 (US$ Mn, AGR (%))
Figure 168 Rest of Latin America Onshore Oil & Gas Pipeline Market by Value, 2024-2034 (US$ Mn, AGR (%))
Figure 169 Onshore Oil and Gas Pipeline Market: Company Share, 2022
Figure 170 TC Energy Corporation.: Net Revenue, 2018-2022 (US$ Million, AGR%)
Figure 171 TC Energy Corporation.: Regional Revenue Share, 2022 (%)
Figure 172 TC Energy Corporation.: Business Segment Revenue Share, 2022 (%)
Figure 173 Chevron Corporation.: Net Revenue, 2018-2022 (US$ Million, AGR%)
Figure 174 Chevron Corporation.: R&D, 2018-2022 (US$ Million, AGR%)
Figure 175 Chevron Corporation.: Regional Revenue Share, 2022 (%)
Figure 176 Chevron Corporation.: Business Segment Revenue Share, 2022 (%)
Figure 177 Exxon Mobil Corporation.: Net Revenue, 2018-2022 (US$ Million, AGR%)
Figure 178 Exxon Mobil Corporation.: R&D, 2018-2022 (US$ Million, AGR%)
Figure 179 Exxon Mobil Corporation.: Regional Revenue Share, 2022 (%)
Figure 180 Exxon Mobil Corporation.: Business Segment Revenue Share, 2022 (%)
Figure 181 Royal Dutch Shell Plc.: Net Revenue, 2018-2022 (US$ Million, AGR%)
Figure 182 Royal Dutch Shell Plc.: R&D, 2018-2022 (US$ Million, AGR%)
Figure 183 Royal Dutch Shell Plc.: Regional Revenue Share, 2022 (%)
Figure 184 Royal Dutch Shell Plc.: Business Segment Revenue Share, 2022 (%)
Figure 185 TotalEnergies SE.: Net Revenue, 2018-2022 (US$ Million, AGR%)
Figure 186 TotalEnergies SE.: R&D, 2018-2022 (US$ Million, AGR%)
Figure 187 TotalEnergies SE.: Business Segment Revenue Share, 2022 (%)
Figure 188 BP Plc.: Net Revenue, 2018-2022 (US$ Million, AGR%)
Figure 189 BP Plc.: R&D, 2018-2022 (US$ Million, AGR%)
Figure 190 BP Plc.: Business Segment Revenue Share, 2022 (%)
Figure 191 ConocoPhillips Company.: Net Revenue, 2018-2022 (US$ Million, AGR%)
Figure 192 ConocoPhillips Company.: Regional Revenue Share, 2022 (%)
Figure 193 ConocoPhillips Company.: Business Segment Revenue Share, 2022 (%)
Figure 194 Eni S.p.A..: Net Revenue, 2018-2022 (US$ Million, AGR%)
Figure 195 Eni S.p.A..: R&D, 2018-2022 (US$ Million, AGR%)
Figure 196 Eni S.p.A..: Regional Revenue Share, 2022 (%)
Figure 197 Eni S.p.A..: Business Segment Revenue Share, 2022 (%)
Figure 198 Enterprise Products Partners L.P.: Net Revenue, 2018-2022 (US$ Million, AGR%)
Figure 199 Enterprise Products Partners L.P.: Business Segment Revenue Share, 2022 (%)
Figure 200 Plains All American Pipeline, L.P..: Net Revenue, 2018-2022 (US$ Million, AGR%)
Figure 201 Plains All American Pipeline, L.P..: Regional Revenue Share, 2022 (%)
Figure 202 Plains All American Pipeline, L.P..: Business Segment Revenue Share, 2022 (%)
Figure 203 The Williams Companies, Inc.: Net Revenue, 2018-2022 (US$ Million, AGR%)
Figure 204 Enbridge Inc.: Net Revenue, 2018-2022 (US$ Million, AGR%)
Figure 205 Enbridge Inc.: Regional Revenue Share, 2022 (%)
Figure 206 Enbridge Inc.: Business Segment Revenue Share, 2022 (%)
Figure 207 Kinder Morgan, Inc..: Net Revenue, 2018-2022 (US$ Million, AGR%)
Figure 208 Kinder Morgan, Inc..: Regional Revenue Share, 2022 (%)
Figure 209 Kinder Morgan, Inc..: Business Segment Revenue Share, 2022 (%)
ページTOPに戻る
Summary
Report Details
The Onshore Oil and Gas Pipeline Market Report 2024-2034: This report will prove invaluable to leading firms striving for new revenue pockets if they wish to better understand the industry and its underlying dynamics. It will be useful for companies that would like to expand into different industries or to expand their existing operations in a new region.
Governments and Energy Companies Are Actively Investing in Expanding Onshore Pipeline Networks to Meet The Surging Demand
The market is propelled by several key drivers that contribute to its sustained growth. Firstly, the rising global demand for energy, driven by industrialization, urbanization, and population growth, is a primary driver. Governments and energy companies are actively investing in expanding onshore pipeline networks to meet this surging demand. Additionally, advancements in pipeline materials, construction techniques, and coating technologies contribute to enhanced pipeline integrity, reliability, and lifespan. The integration of digital technologies, such as Supervisory Control and Data Acquisition (SCADA) systems and smart pigging technology, is further driving operational efficiency, reducing maintenance costs, and enhancing overall safety in onshore pipeline operations.
Amidst the challenges faced by the industry, numerous opportunities arise. The growing focus on sustainable and environmentally friendly practices presents an avenue for innovation in pipeline materials and coatings. Moreover, the exploration and development of unconventional oil and gas resources offer opportunities for expanding onshore pipeline networks. Strategic partnerships and collaborations among key industry players, coupled with government initiatives supporting energy infrastructure development, create a favourable environment for market expansion. The integration of advanced technologies, such as artificial intelligence and machine learning, also opens doors for optimizing pipeline operations and predictive maintenance.
What Questions Should You Ask before Buying a Market Research Report?
-
How is the onshore oil and gas pipeline market evolving?
-
What is driving and restraining the onshore oil and gas pipeline market?
-
How will each onshore oil and gas pipeline submarket segment grow over the forecast period and how much revenue will these submarkets account for in 2034?
-
How will the market shares for each onshore oil and gas pipeline submarket develop from 2024 to 2034?
-
What will be the main driver for the overall market from 2024 to 2034?
-
Will leading onshore oil and gas pipeline markets broadly follow the macroeconomic dynamics, or will individual national markets outperform others?
-
How will the market shares of the national markets change by 2034 and which geographical region will lead the market in 2034?
-
Who are the leading players and what are their prospects over the forecast period?
-
What are the onshore oil and gas pipeline projects for these leading companies?
-
How will the industry evolve during the period between 2024 and 2034? What are the implications of onshore oil and gas pipeline projects taking place now and over the next 10 years?
-
Is there a greater need for product commercialisation to further scale the onshore oil and gas pipeline market?
-
Where is the onshore oil and gas pipeline market heading and how can you ensure you are at the forefront of the market?
-
What are the best investment options for new product and service lines?
-
What are the key prospects for moving companies into a new growth path and C-suite?
You need to discover how this will impact the onshore oil and gas pipeline market today, and over the next 10 years:
-
Our 407-page report provides 122 tables and 209 charts/graphs exclusively to you.
-
The report highlights key lucrative areas in the industry so you can target them – NOW.
-
It contains in-depth analysis of global, regional and national sales and growth.
-
It highlights for you the key successful trends, changes and revenue projections made by your competitors.
This report tells you TODAY how the onshore oil and gas pipeline market will develop in the next 10 years, and in line with the variations in COVID-19 economic recession and bounce. This market is more critical now than at any point over the last 10 years.
Forecasts to 2034 and other analyses reveal commercial prospects
-
In addition to revenue forecasting to 2034, our new study provides you with recent results, growth rates, and market shares.
-
You will find original analyses, with business outlooks and developments.
-
Discover qualitative analyses (including market dynamics, drivers, opportunities, restraints and challenges), cost structure, impact of rising onshore oil and gas pipeline prices and recent developments.
This report includes data analysis and invaluable insight into how COVID-19 will affect the industry and your company. Four COVID-19 recovery patterns and their impact, namely, “V”, “L”, “W” and “U” are discussed in this report.
Segments Covered in the Report
Market Segment by Application
-
Oil Transportation
-
Gas Transportation
Market Segment by Material
-
Steel Pipes
-
Polyethylene Pipes
-
Composite Pipes
Market Segment by Coating
-
Fusion Bonded Epoxy (FBE) Coating
-
Three-Layer Polyethylene (3LPE) Coating
-
Coal Tar Enamel (CTE) Coating
-
Other Coating
Market Segment by Systems
-
Supervisory Control and Data Acquisition (SCADA) Systems
-
Smart Pigging Technology
-
Leak Detection Systems
-
Corrosion Monitoring Systems
-
Other Systems
Market Segment by Type
-
Electric Resistance Welded (ERW) Pipe
-
Spiral Seam Welded (SSAW) Pipe
-
Longitudinal Seam Welded (LSAW) Pipe
-
Double Submerged Arc Welded (DSAW) Pipe
-
Electric Fusion Welded (EFW) Pipe
-
Other Type
In addition to the revenue predictions for the overall world market and segments, you will also find revenue forecasts for four regional and 20 leading national markets:
North America
Europe
-
Germany
-
Russia
-
United Kingdom
-
France
-
Italy
-
Rest of Europe
Asia Pacific
-
China
-
Japan
-
India
-
Australia
-
South Korea
-
Rest of Asia Pacific
Latin America
-
Brazil
-
Mexico
-
Rest of Latin America
Middle East & Africa
-
GCC
-
South Africa
-
Rest of Middle East & Africa
The report also includes profiles and for some of the leading companies in the Onshore Oil and Gas Pipeline Market, 2024 to 2034, with a focus on this segment of these companies’ operations.
Leading companies and the potential for market growth
-
BP Plc
-
Chevron Corporation
-
China National Petroleum Corporation (CNPC)
-
ConocoPhillips Company
-
Enbridge Inc.
-
Eni S.p.A.
-
Enterprise Products Partners L.P
-
Exxon Mobil Corporation
-
Kinder Morgan, Inc.
-
PetroChina Company Limited
-
Plains All American Pipeline, L.P.
-
Royal Dutch Shell Plc
-
TC Energy Corporation
-
The Williams Companies, Inc.
-
TotalEnergies SE
Overall world revenue for Onshore Oil and Gas Pipeline Market, 2024 to 2034 in terms of value the market will surpass US$6,046.8 million in 2024, our work calculates. We predict strong revenue growth through to 2034. Our work identifies which organizations hold the greatest potential. Discover their capabilities, progress, and commercial prospects, helping you stay ahead.
How will the Onshore Oil and Gas Pipeline Market, 2024 to 2034 report help you?
In summary, our 400+ page report provides you with the following knowledge:
-
Revenue forecasts to 2034 for Onshore Oil and Gas Pipeline Market, 2024 to 2034 Market, with forecasts for application, material, coating, systems, and type, each forecast at a global and regional level – discover the industry’s prospects, finding the most lucrative places for investments and revenues.
-
Revenue forecasts to 2034 for four regional and 20 key national markets – See forecasts for the Onshore Oil and Gas Pipeline Market, 2024 to 2034 market in North America, Europe, Asia-Pacific, Latin America and Middle East & Africa. Also forecasted is the market in the US, Canada, Brazil, Germany, France, UK, Italy, China, India, Japan, and Australia among other prominent economies.
-
Prospects for established firms and those seeking to enter the market – including company profiles for 15 of the major companies involved in the Onshore Oil and Gas Pipeline Market, 2024 to 2034.
Find quantitative and qualitative analyses with independent predictions. Receive information that only our report contains, staying informed with invaluable business intelligence.
Information found nowhere else
With our new report, you are less likely to fall behind in knowledge or miss out on opportunities. See how our work could benefit your research, analyses, and decisions. Visiongain’s study is for everybody needing commercial analyses for the Onshore Oil and Gas Pipeline Market, 2024 to 2034, market-leading companies. You will find data, trends and predictions.
ページTOPに戻る
Table of Contents
Table of Contents
1 Report Overview
1.1 Objectives of the Study
1.2 Introduction to Onshore Oil and Gas Pipeline Market
1.3 What This Report Delivers
1.4 Why You Should Read This Report
1.5 Key Questions Answered by This Analytical Report
1.6 Who Is This Report for?
1.7 Methodology
1.7.1 Market Definitions
1.7.2 Market Evaluation & Forecasting Methodology
1.7.3 Data Validation
1.7.3.1 Primary Research
1.7.3.2 Secondary Research
1.8 Frequently Asked Questions (FAQs)
1.9 Associated Visiongain Reports
1.10 About Visiongain
2 Executive Summary
3 Market Overview
3.1 Key Findings
3.2 Market Dynamics
3.2.1 Market Driving Factors
3.2.1.1 Increasing Energy Demand Driving the Market Growth
3.2.1.2 Rapid Urbanization and Industrialization in Developing Regions Drive the Demand for Energy Resources driving the Market Growth
3.2.1.3 Strategic Resilience Planning Driving the Market Growth
3.2.2 Market Restraining Factors
3.2.2.1 Regulatory Challenges Pose Significant Obstacles to the Onshore Oil and Gas Pipeline Market
3.2.2.2 Heightened Environmental Awareness and Concerns about the Ecological Impact of Pipeline Projects Present challenges to Industry Stakeholders.
3.2.2.3 The Volatility of Oil and Gas Prices Poses Financial Challenges for Onshore Pipeline Operators
3.2.3 Market Opportunities
3.2.3.1 The Rising Investment in the Energy and Power Sector by Various Government Bodies Opportunities for the Market Growth
3.2.3.2 Collaborative Efforts Between Industry Stakeholders Contribute to the Growth of Cross-Border Onshore Pipeline Projects
3.2.3.3 Global Energy Trade Expansion Opportunities for the Market Growth
3.3 Porter’s Five Forces Analysis
3.3.1 Bargaining Power of Suppliers (Medium)
3.3.2 Bargaining Power of Buyers (Medium)
3.3.3 Competitive Rivalry (High)
3.3.4 Threat from Substitutes (Low)
3.3.5 Threat of New Entrants (Medium to High)
3.4 COVID-19 Impact Analysis
3.4.1 “V-Shaped Recovery”
3.4.2 “U-Shaped Recovery”
3.4.3 “W-Shaped Recovery”
3.4.4 “L-Shaped Recovery”
3.5 PEST Analysis
4 Onshore Oil and Gas Pipeline Market Analysis by Application
4.1 Key Findings
4.2 Application Segment: Market Attractiveness Index
4.3 Onshore Oil and Gas Pipeline Market Size Estimation and Forecast by Application
4.4 Oil Transportation
4.4.1 Market Size by Region, 2024-2034 (US$ Million)
4.4.2 Market Share by Region, 2024 & 2034 (%)
4.5 Gas Transportation
4.5.1 Market Size by Region, 2024-2034 (US$ Million)
4.5.2 Market Share by Region, 2024 & 2034 (%)
5 Onshore Oil and Gas Pipeline Market Analysis by Material
5.1 Key Findings
5.2 Material Segment: Market Attractiveness Index
5.3 Onshore Oil and Gas Pipeline Market Size Estimation and Forecast by Material
5.4 Steel Pipes
5.4.1 Market Size by Region, 2024-2034 (US$ Million)
5.4.2 Market Share by Region, 2024 & 2034 (%)
5.5 Polyethylene Pipes
5.5.1 Market Size by Region, 2024-2034 (US$ Million)
5.5.2 Market Share by Region, 2024 & 2034 (%)
5.6 Composite Pipes
5.6.1 Market Size by Region, 2024-2034 (US$ Million)
5.6.2 Market Share by Region, 2024 & 2034 (%)
6 Onshore Oil and Gas Pipeline Market Analysis by Coating
6.1 Key Findings
6.2 Coating Segment: Market Attractiveness Index
6.3 Onshore Oil and Gas Pipeline Market Size Estimation and Forecast by Coating
6.4 Fusion Bonded Epoxy (FBE) Coating
6.4.1 Market Size by Region, 2024-2034 (US$ Million)
6.4.2 Market Share by Region, 2024 & 2034 (%)
6.5 Three-Layer Polyethylene (3LPE) Coating
6.5.1 Market Size by Region, 2024-2034 (US$ Million)
6.5.2 Market Share by Region, 2024 & 2034 (%)
6.6 Coal Tar Enamel (CTE) Coating
6.6.1 Market Size by Region, 2024-2034 (US$ Million)
6.6.2 Market Share by Region, 2024 & 2034 (%)
6.7 Other Coating
6.7.1 Market Size by Region, 2024-2034 (US$ Million)
6.7.2 Market Share by Region, 2024 & 2034 (%)
7 Onshore Oil and Gas Pipeline Market Analysis by Systems
7.1 Key Findings
7.2 Systems Segment: Market Attractiveness Index
7.3 Onshore Oil and Gas Pipeline Market Size Estimation and Forecast by Systems
7.4 Supervisory Control and Data Acquisition (SCADA) Systems
7.4.1 Market Size by Region, 2024-2034 (US$ Million)
7.4.2 Market Share by Region, 2024 & 2034 (%)
7.5 Smart Pigging Technology
7.5.1 Market Size by Region, 2024-2034 (US$ Million)
7.5.2 Market Share by Region, 2024 & 2034 (%)
7.6 Leak Detection Systems
7.6.1 Market Size by Region, 2024-2034 (US$ Million)
7.6.2 Market Share by Region, 2024 & 2034 (%)
7.7 Corrosion Monitoring Systems
7.7.1 Market Size by Region, 2024-2034 (US$ Million)
7.7.2 Market Share by Region, 2024 & 2034 (%)
7.8 Other Systems
7.8.1 Market Size by Region, 2024-2034 (US$ Million)
7.8.2 Market Share by Region, 2024 & 2034 (%)
8 Onshore Oil and Gas Pipeline Market Analysis by Type
8.1 Key Findings
8.2 Type Segment: Market Attractiveness Index
8.3 Onshore Oil and Gas Pipeline Market Size Estimation and Forecast by Type
8.4 Electric Resistance Welded (ERW) Pipe
8.4.1 Market Size by Region, 2024-2034 (US$ Million)
8.4.2 Market Share by Region, 2024 & 2034 (%)
8.5 Spiral Seam Welded (SSAW) Pipe
8.5.1 Market Size by Region, 2024-2034 (US$ Million)
8.5.2 Market Share by Region, 2024 & 2034 (%)
8.6 Longitudinal Seam Welded (LSAW) Pipe
8.6.1 Market Size by Region, 2024-2034 (US$ Million)
8.6.2 Market Share by Region, 2024 & 2034 (%)
8.7 Double Submerged Arc Welded (DSAW) Pipe
8.7.1 Market Size by Region, 2024-2034 (US$ Million)
8.7.2 Market Share by Region, 2024 & 2034 (%)
8.8 Electric Fusion Welded (EFW) Pipe
8.8.1 Market Size by Region, 2024-2034 (US$ Million)
8.8.2 Market Share by Region, 2024 & 2034 (%)
8.9 Other Type
8.9.1 Market Size by Region, 2024-2034 (US$ Million)
8.9.2 Market Share by Region, 2024 & 2034 (%)
9 Onshore Oil and Gas Pipeline Market Analysis by Region
9.1 Key Findings
9.2 Regional Market Size Estimation and Forecast
10 North America Onshore Oil and Gas Pipeline Market Analysis
10.1 Key Findings
10.2 North America Onshore Oil and Gas Pipeline Market Attractiveness Index
10.3 North America Onshore Oil and Gas Pipeline Market by Country, 2024, 2029 & 2034 (US$ Million)
10.4 North America Onshore Oil and Gas Pipeline Market Size Estimation and Forecast
10.5 North America Onshore Oil and Gas Pipeline Market Size Estimation and Forecast by Country
10.6 North America Onshore Oil and Gas Pipeline Market Size Estimation and Forecast by Application
10.7 North America Onshore Oil and Gas Pipeline Market Size Estimation and Forecast by Material
10.8 North America Onshore Oil and Gas Pipeline Market Size Estimation and Forecast by Coating
10.9 North America Onshore Oil and Gas Pipeline Market Size Estimation and Forecast by Systems
10.10 North America Onshore Oil and Gas Pipeline Market Size Estimation and Forecast by Type
10.11 U.S. Onshore Oil and Gas Pipeline Market Analysis
10.12 Canada Onshore Oil and Gas Pipeline Market Analysis
11 Europe Onshore Oil and Gas Pipeline Market Analysis
11.1 Key Findings
11.2 Europe Onshore Oil and Gas Pipeline Market Attractiveness Index
11.3 Europe Onshore Oil and Gas Pipeline Market by Country, 2024, 2029 & 2034 (US$ Million)
11.4 Europe Onshore Oil and Gas Pipeline Market Size Estimation and Forecast
11.5 Europe Onshore Oil and Gas Pipeline Market Size Estimation and Forecast by Country
11.6 Europe Onshore Oil and Gas Pipeline Market Size Estimation and Forecast by Application
11.7 Europe Onshore Oil and Gas Pipeline Market Size Estimation and Forecast by Material
11.8 Europe Onshore Oil and Gas Pipeline Market Size Estimation and Forecast by Coating
11.9 Europe Onshore Oil and Gas Pipeline Market Size Estimation and Forecast by Systems
11.10 Europe Onshore Oil and Gas Pipeline Market Size Estimation and Forecast by Type
11.11 Germany Onshore Oil and Gas Pipeline Market Analysis
11.12 UK Onshore Oil and Gas Pipeline Market Analysis
11.13 France Onshore Oil and Gas Pipeline Market Analysis
11.14 Italy Onshore Oil and Gas Pipeline Market Analysis
11.15 Russia Onshore Oil and Gas Pipeline Market Analysis
11.16 Rest of Europe Onshore Oil and Gas Pipeline Market Analysis
12 Asia-Pacific Onshore Oil and Gas Pipeline Market Analysis
12.1 Key Findings
12.2 Asia-Pacific Onshore Oil and Gas Pipeline Market Attractiveness Index
12.3 Asia-Pacific Onshore Oil and Gas Pipeline Market by Country, 2024, 2029 & 2034 (US$ Million)
12.4 Asia-Pacific Onshore Oil and Gas Pipeline Market Size Estimation and Forecast
12.5 Asia-Pacific Onshore Oil and Gas Pipeline Market Size Estimation and Forecast by Country
12.6 Asia-Pacific Onshore Oil and Gas Pipeline Market Size Estimation and Forecast by Application
12.7 Asia-Pacific Onshore Oil and Gas Pipeline Market Size Estimation and Forecast by Material
12.8 Asia-Pacific Onshore Oil and Gas Pipeline Market Size Estimation and Forecast by Coating
12.9 Asia-Pacific Onshore Oil and Gas Pipeline Market Size Estimation and Forecast by Systems
12.10 Asia-Pacific Onshore Oil and Gas Pipeline Market Size Estimation and Forecast by Type
12.11 China Onshore Oil and Gas Pipeline Market Analysis
12.12 India Onshore Oil and Gas Pipeline Market Analysis
12.13 Japan Onshore Oil and Gas Pipeline Market Analysis
12.14 South Korea Onshore Oil and Gas Pipeline Market Analysis
12.15 Australia Onshore Oil and Gas Pipeline Market Analysis
12.16 Rest of Asia-Pacific Onshore Oil and Gas Pipeline Market Analysis
13 Middle East and Africa Onshore Oil and Gas Pipeline Market Analysis
13.1 Key Findings
13.2 Middle East and Africa Onshore Oil and Gas Pipeline Market Attractiveness Index
13.3 Middle East and Africa Onshore Oil and Gas Pipeline Market by Country, 2024, 2029 & 2034 (US$ Million)
13.4 Middle East and Africa Onshore Oil and Gas Pipeline Market Size Estimation and Forecast
13.5 Middle East and Africa Onshore Oil and Gas Pipeline Market Size Estimation and Forecast by Country
13.6 Middle East and Africa Onshore Oil and Gas Pipeline Market Size Estimation and Forecast by Application
13.7 Middle East and Africa Onshore Oil and Gas Pipeline Market Size Estimation and Forecast by Material
13.8 Middle East and Africa Onshore Oil and Gas Pipeline Market Size Estimation and Forecast by Coating
13.9 Middle East and Africa Onshore Oil and Gas Pipeline Market Size Estimation and Forecast by Systems
13.10 Middle East and Africa Onshore Oil and Gas Pipeline Market Size Estimation and Forecast by Type
13.11 GCC Onshore Oil and Gas Pipeline Market Analysis
13.12 South Africa Onshore Oil and Gas Pipeline Market Analysis
13.13 Rest of Middle East & Africa Onshore Oil and Gas Pipeline Market Analysis
14 Latin America Onshore Oil and Gas Pipeline Market Analysis
14.1 Key Findings
14.2 Latin America Onshore Oil and Gas Pipeline Market Attractiveness Index
14.3 Latin America Onshore Oil and Gas Pipeline Market by Country, 2024, 2029 & 2034 (US$ Million)
14.4 Latin America Onshore Oil and Gas Pipeline Market Size Estimation and Forecast
14.5 Latin America Onshore Oil and Gas Pipeline Market Size Estimation and Forecast by Country
14.6 Latin America Onshore Oil and Gas Pipeline Market Size Estimation and Forecast by Application
14.7 Latin America Onshore Oil and Gas Pipeline Market Size Estimation and Forecast by Material
14.8 Latin America Onshore Oil and Gas Pipeline Market Size Estimation and Forecast by Coating
14.9 Latin America Onshore Oil and Gas Pipeline Market Size Estimation and Forecast by Systems
14.10 Latin America Onshore Oil and Gas Pipeline Market Size Estimation and Forecast by Type
14.11 Brazil Onshore Oil and Gas Pipeline Market Analysis
14.12 Mexico Onshore Oil and Gas Pipeline Market Analysis
14.13 Rest of Latin America Onshore Oil and Gas Pipeline Market Analysis
15 Company Profiles
15.1 Competitive Landscape, 2022
15.2 Strategic Outlook
15.3 China National Petroleum Corporation (CNPC)
15.3.1 Company Snapshot
15.3.2 Company Overview
15.3.3 Product Benchmarking
15.3.4 Strategic Outlook
15.4 TC Energy Corporation
15.4.1 Company Snapshot
15.4.2 Company Overview
15.4.3 Financial Analysis
15.4.3.1 Net Revenue, 2018-2022
15.4.3.2 Regional Revenue Share, 2022 (%)
15.4.3.3 Business Segment Revenue Share, 2022 (%)
15.4.4 Product Benchmarking
15.5 Chevron Corporation
15.5.1 Company Snapshot
15.5.2 Company Overview
15.5.3 Financial Analysis
15.5.3.1 Net Revenue, 2018-2022
15.5.3.2 R&D, 2018-2022
15.5.3.3 Regional Revenue Share, 2022 (%)
15.5.3.4 Business Segment Revenue Share, 2022 (%)
15.5.4 Product Benchmarking
15.5.5 Strategic Outlook
15.6 Exxon Mobil Corporation
15.6.1 Company Snapshot
15.6.2 Company Overview
15.6.3 Financial Analysis
15.6.3.1 Net Revenue, 2018-2022
15.6.3.2 R&D, 2018-2022
15.6.3.3 Regional Revenue Share, 2022 (%)
15.6.3.4 Business Segment Revenue Share, 2022 (%)
15.6.4 Product Benchmarking
15.6.5 Strategic Outlook
15.7 Royal Dutch Shell Plc
15.7.1 Company Snapshot
15.7.2 Company Overview
15.7.3 Financial Analysis
15.7.3.1 Net Revenue, 2018-2022
15.7.3.2 R&D, 2018-2022
15.7.3.3 Regional Revenue Share, 2022 (%)
15.7.3.4 Business Segment Revenue Share, 2022 (%)
15.7.4 Product Benchmarking
15.7.5 Strategic Outlook
15.8 TotalEnergies SE
15.8.1 Company Snapshot
15.8.2 Company Overview
15.8.3 Financial Analysis
15.8.3.1 Net Revenue, 2018-2022
15.8.3.2 R&D, 2018-2022
15.8.3.3 Business Segment Revenue Share, 2022 (%)
15.8.4 Product Benchmarking
15.8.5 Strategic Outlook
15.9 BP Plc
15.9.1 Company Snapshot
15.9.2 Company Overview
15.9.3 Financial Analysis
15.9.3.1 Net Revenue, 2018-2022
15.9.3.2 R&D, 2018-2022
15.9.3.3 Business Segment Revenue Share, 2022 (%)
15.9.4 Product Benchmarking
15.10 ConocoPhillips Company
15.10.1 Company Snapshot
15.10.2 Company Overview
15.10.3 Financial Analysis
15.10.3.1 Net Revenue, 2018-2022
15.10.3.2 Regional Revenue Share, 2022 (%)
15.10.3.3 Business Segment Revenue Share, 2022 (%)
15.10.4 Product Benchmarking
15.11 Eni S.p.A.
15.11.1 Company Snapshot
15.11.2 Company Overview
15.11.3 Financial Analysis
15.11.3.1 Net Revenue, 2018-2022
15.11.3.2 R&D, 2018-2022
15.11.3.3 Regional Revenue Share, 2022 (%)
15.11.3.4 Business Segment Revenue Share, 2022 (%)
15.11.4 Product Benchmarking
15.11.5 Strategic Outlook
15.12 Enterprise Products Partners L.P
15.12.1 Company Snapshot
15.12.2 Company Overview
15.12.3 Financial Analysis
15.12.3.1 Net Revenue, 2018-2022
15.12.3.2 Business Segment Revenue Share, 2022 (%)
15.12.4 Product Benchmarking
15.13 Plains All American Pipeline, L.P.
15.13.1 Company Snapshot
15.13.2 Company Overview
15.13.3 Financial Analysis
15.13.3.1 Net Revenue, 2018-2022
15.13.3.2 Regional Revenue Share, 2022 (%)
15.13.3.3 Business Segment Revenue Share, 2022 (%)
15.13.4 Product Benchmarking
15.14 The Williams Companies, Inc
15.14.1 Company Snapshot
15.14.2 Company Overview
15.14.3 Financial Analysis
15.14.3.1 Net Revenue, 2018-2022
15.14.4 Product Benchmarking
15.15 Enbridge Inc
15.15.1 Company Snapshot
15.15.2 Company Overview
15.15.3 Financial Analysis
15.15.3.1 Net Revenue, 2018-2022
15.15.3.2 Regional Revenue Share, 2022 (%)
15.15.3.3 Business Segment Revenue Share, 2022 (%)
15.15.4 Product Benchmarking
15.15.5 Strategic Outlook
15.16 Kinder Morgan, Inc.
15.16.1 Company Snapshot
15.16.2 Company Overview
15.16.3 Financial Analysis
15.16.3.1 Net Revenue, 2018-2022
15.16.3.2 Regional Revenue Share, 2022 (%)
15.16.3.3 Business Segment Revenue Share, 2022 (%)
15.16.4 Product Benchmarking
15.17 PetroChina Company Limited
15.17.1 Company Snapshot
15.17.2 Company Overview
15.17.3 Product Benchmarking
15.17.4 Strategic Outlook
16 Conclusion and Recommendations
16.1 Concluding Remarks from Visiongain
16.2 Recommendations for Market Players
ページTOPに戻る
List of Tables/Graphs
List of Tables
Table 1 Onshore Oil and Gas Pipeline Market Snapshot, 2024 & 2034 (US$ Million, CAGR %)
Table 2 Global Onshore Oil & Gas Pipeline Market by Region, 2024-2034 (US$ Mn, AGR (%), CAGR (%)) (V-Shaped Recovery Scenario)
Table 3 Global Onshore Oil & Gas Pipeline Market by Region, 2024-2034 (US$ Mn, AGR (%), CAGR (%)) (U-Shaped Recovery Scenario)
Table 4 Global Onshore Oil & Gas Pipeline Market by Region, 2024-2034 (US$ Mn, AGR (%), CAGR (%)) (W-Shaped Recovery Scenario)
Table 5 Global Onshore Oil & Gas Pipeline Market by Region, 2024-2034 (US$ Mn, AGR (%), CAGR (%)) (L-Shaped Recovery Scenario)
Table 6 Global Onshore Oil & Gas Pipeline Market by Application, 2024-2034 (US$ Mn, AGR (%), CAGR (%))
Table 7 Oil Transportation Market by Region, 2024-2034 (US$ Mn, AGR (%), CAGR (%))
Table 8 Gas Transportation Market by Region, 2024-2034 (US$ Mn, AGR (%), CAGR (%))
Table 9 Global Onshore Oil & Gas Pipeline Market by Material, 2024-2034 (US$ Mn, AGR (%), CAGR (%))
Table 10 Steel Pipes Market by Region, 2024-2034 (US$ Mn, AGR (%), CAGR (%))
Table 11 Polyethylene Pipes Market by Region, 2024-2034 (US$ Mn, AGR (%), CAGR (%))
Table 12 Composite Pipes Market by Region, 2024-2034 (US$ Mn, AGR (%), CAGR (%))
Table 13 Global Onshore Oil & Gas Pipeline Market by Coating, 2024-2034 (US$ Mn, AGR (%), CAGR (%))
Table 14 Fusion Bonded Epoxy (FBE) Coating Market by Region, 2024-2034 (US$ Mn, AGR (%), CAGR (%))
Table 15 Three-Layer Polyethylene (3LPE) Coating Market by Region, 2024-2034 (US$ Mn, AGR (%), CAGR (%))
Table 16 Coal Tar Enamel (CTE) Coating Market by Region, 2024-2034 (US$ Mn, AGR (%), CAGR (%))
Table 17 Other Coating Market by Region, 2024-2034 (US$ Mn, AGR (%), CAGR (%))
Table 18 Global Onshore Oil & Gas Pipeline Market by Systems, 2024-2034 (US$ Mn, AGR (%), CAGR (%))
Table 19 Supervisory Control and Data Acquisition (SCADA) Systems Market by Region, 2024-2034 (US$ Mn, AGR (%), CAGR (%))
Table 20 Smart Pigging Technology Market by Region, 2024-2034 (US$ Mn, AGR (%), CAGR (%))
Table 21 Leak Detection Systems Market by Region, 2024-2034 (US$ Mn, AGR (%), CAGR (%))
Table 22 Corrosion Monitoring Systems Market by Region, 2024-2034 (US$ Mn, AGR (%), CAGR (%))
Table 23 Other Systems Market by Region, 2024-2034 (US$ Mn, AGR (%), CAGR (%))
Table 24 Global Onshore Oil & Gas Pipeline Market by Type, 2024-2034 (US$ Mn, AGR (%), CAGR (%))
Table 25 Electric Resistance Welded (ERW) Pipe Market by Region, 2024-2034 (US$ Mn, AGR (%), CAGR (%))
Table 26 Spiral Seam Welded (SSAW) Pipe Market by Region, 2024-2034 (US$ Mn, AGR (%), CAGR (%))
Table 27 Longitudinal Seam Welded (LSAW) Pipe Market by Region, 2024-2034 (US$ Mn, AGR (%), CAGR (%))
Table 28 Double Submerged Arc Welded (DSAW) Pipe Market by Region, 2024-2034 (US$ Mn, AGR (%), CAGR (%))
Table 29 Electric Fusion Welded (EFW) Pipe Market by Region, 2024-2034 (US$ Mn, AGR (%), CAGR (%))
Table 30 Other Type Market by Region, 2024-2034 (US$ Mn, AGR (%), CAGR (%))
Table 31 Onshore Oil and Gas Pipeline Market Forecast by Region, 2024-2034 (US$ Million, AGR%, CAGR%)
Table 32 North America Onshore Oil & Gas Pipeline Market by Value, 2024-2034 (US$ Mn, AGR (%), CAGR (%))
Table 33 North America Onshore Oil & Gas Pipeline Market by Country, 2024-2034 (US$ Mn, AGR (%), CAGR (%))
Table 34 North America Onshore Oil & Gas Pipeline Market by Application, 2024-2034 (US$ Mn, AGR (%), CAGR (%))
Table 35 North America Onshore Oil & Gas Pipeline Market by Material, 2024-2034 (US$ Mn, AGR (%), CAGR (%))
Table 36 North America Onshore Oil & Gas Pipeline Market by Coating, 2024-2034 (US$ Mn, AGR (%), CAGR (%))
Table 37 North America Onshore Oil & Gas Pipeline Market by Systems, 2024-2034 (US$ Mn, AGR (%), CAGR (%))
Table 38 North America Onshore Oil & Gas Pipeline Market by Type, 2024-2034 (US$ Mn, AGR (%), CAGR (%))
Table 39 US Onshore Oil & Gas Pipeline Market by Value, 2024-2034 (US$ Mn, AGR (%), CAGR (%))
Table 40 Canada Onshore Oil & Gas Pipeline Market by Value, 2024-2034 (US$ Mn, AGR (%), CAGR (%))
Table 41 Europe Onshore Oil & Gas Pipeline Market by Value, 2024-2034 (US$ Mn, AGR (%), CAGR (%))
Table 42 Europe Onshore Oil & Gas Pipeline Market by Country, 2024-2034 (US$ Mn, AGR (%), CAGR (%))
Table 43 Europe Onshore Oil & Gas Pipeline Market by Application, 2024-2034 (US$ Mn, AGR (%), CAGR (%))
Table 44 Europe Onshore Oil & Gas Pipeline Market by Material, 2024-2034 (US$ Mn, AGR (%), CAGR (%))
Table 45 Europe Onshore Oil & Gas Pipeline Market by Coating, 2024-2034 (US$ Mn, AGR (%), CAGR (%))
Table 46 Europe Onshore Oil & Gas Pipeline Market by Systems, 2024-2034 (US$ Mn, AGR (%), CAGR (%))
Table 47 Europe Onshore Oil & Gas Pipeline Market by Type, 2024-2034 (US$ Mn, AGR (%), CAGR (%))
Table 48 Germany Onshore Oil & Gas Pipeline Market by Value, 2024-2034 (US$ Mn, AGR (%), CAGR (%))
Table 49 UK Onshore Oil & Gas Pipeline Market by Value, 2024-2034 (US$ Mn, AGR (%), CAGR (%))
Table 50 France Onshore Oil & Gas Pipeline Market by Value, 2024-2034 (US$ Mn, AGR (%), CAGR (%))
Table 51 Italy Onshore Oil & Gas Pipeline Market by Value, 2024-2034 (US$ Mn, AGR (%), CAGR (%))
Table 52 Russia Onshore Oil & Gas Pipeline Market by Value, 2024-2034 (US$ Mn, AGR (%), CAGR (%))
Table 53 Rest of Europe Onshore Oil & Gas Pipeline Market by Value, 2024-2034 (US$ Mn, AGR (%), CAGR (%))
Table 54 Asia-Pacific Onshore Oil & Gas Pipeline Market by Value, 2024-2034 (US$ Mn, AGR (%), CAGR (%))
Table 55 Asia-Pacific Onshore Oil & Gas Pipeline Market by Country, 2024-2034 (US$ Mn, AGR (%), CAGR (%))
Table 56 Asia-Pacific Onshore Oil & Gas Pipeline Market by Application, 2024-2034 (US$ Mn, AGR (%), CAGR (%))
Table 57 Asia-Pacific Onshore Oil & Gas Pipeline Market by Material, 2024-2034 (US$ Mn, AGR (%), CAGR (%))
Table 58 Asia-Pacific Onshore Oil & Gas Pipeline Market by Coating, 2024-2034 (US$ Mn, AGR (%), CAGR (%))
Table 59 Asia-Pacific Onshore Oil & Gas Pipeline Market by Systems, 2024-2034 (US$ Mn, AGR (%), CAGR (%))
Table 60 Asia-Pacific Onshore Oil & Gas Pipeline Market by Type, 2024-2034 (US$ Mn, AGR (%), CAGR (%))
Table 61 China Onshore Oil & Gas Pipeline Market by Value, 2024-2034 (US$ Mn, AGR (%), CAGR (%))
Table 62 India Onshore Oil & Gas Pipeline Market by Value, 2024-2034 (US$ Mn, AGR (%), CAGR (%))
Table 63 Japan Onshore Oil & Gas Pipeline Market by Value, 2024-2034 (US$ Mn, AGR (%), CAGR (%))
Table 64 South Korea Onshore Oil & Gas Pipeline Market by Value, 2024-2034 (US$ Mn, AGR (%), CAGR (%))
Table 65 Australia Onshore Oil & Gas Pipeline Market by Value, 2024-2034 (US$ Mn, AGR (%), CAGR (%))
Table 66 Rest of Asia-Pacific Onshore Oil & Gas Pipeline Market by Value, 2024-2034 (US$ Mn, AGR (%), CAGR (%))
Table 67 Middle East & Africa Onshore Oil & Gas Pipeline Market by Value, 2024-2034 (US$ Mn, AGR (%), CAGR (%))
Table 68 Middle East & Africa Onshore Oil & Gas Pipeline Market by Country, 2024-2034 (US$ Mn, AGR (%), CAGR (%))
Table 69 Middle East & Africa Onshore Oil & Gas Pipeline Market by Application, 2024-2034 (US$ Mn, AGR (%), CAGR (%))
Table 70 Middle East & Africa Onshore Oil & Gas Pipeline Market by Material, 2024-2034 (US$ Mn, AGR (%), CAGR (%))
Table 71 Middle East & Africa Onshore Oil & Gas Pipeline Market by Coating, 2024-2034 (US$ Mn, AGR (%), CAGR (%))
Table 72 Middle East & Africa Onshore Oil & Gas Pipeline Market by Systems, 2024-2034 (US$ Mn, AGR (%), CAGR (%))
Table 73 Middle East & Africa Onshore Oil & Gas Pipeline Market by Type, 2024-2034 (US$ Mn, AGR (%), CAGR (%))
Table 74 GCC Onshore Oil & Gas Pipeline Market by Value, 2024-2034 (US$ Mn, AGR (%), CAGR (%))
Table 75 South Africa Onshore Oil & Gas Pipeline Market by Value, 2024-2034 (US$ Mn, AGR (%), CAGR (%))
Table 76 Rest of Middle East & Africa Onshore Oil & Gas Pipeline Market by Value, 2024-2034 (US$ Mn, AGR (%), CAGR (%))
Table 77 Latin America Onshore Oil & Gas Pipeline Market by Value, 2024-2034 (US$ Mn, AGR (%), CAGR (%))
Table 78 Latin America Onshore Oil & Gas Pipeline Market by Country, 2024-2034 (US$ Mn, AGR (%), CAGR (%))
Table 79 Latin America Onshore Oil & Gas Pipeline Market by Application, 2024-2034 (US$ Mn, AGR (%), CAGR (%))
Table 80 Latin America Onshore Oil & Gas Pipeline Market by Material, 2024-2034 (US$ Mn, AGR (%), CAGR (%))
Table 81 Latin America Onshore Oil & Gas Pipeline Market by Coating, 2024-2034 (US$ Mn, AGR (%), CAGR (%))
Table 82 Latin America Onshore Oil & Gas Pipeline Market by Systems, 2024-2034 (US$ Mn, AGR (%), CAGR (%))
Table 83 Latin America Onshore Oil & Gas Pipeline Market by Type, 2024-2034 (US$ Mn, AGR (%), CAGR (%))
Table 84 Brazil Onshore Oil & Gas Pipeline Market by Value, 2024-2034 (US$ Mn, AGR (%), CAGR (%))
Table 85 Mexico Onshore Oil & Gas Pipeline Market by Value, 2024-2034 (US$ Mn, AGR (%), CAGR (%))
Table 86 Rest of Latin America Onshore Oil & Gas Pipeline Market by Value, 2024-2034 (US$ Mn, AGR (%), CAGR (%))
Table 87 Strategic Outlook - Contract
Table 88 China National Petroleum Corporation (CNPC): Key Details, (CEO, HQ, Revenue, Founded, No. of Employees, Company Type, Website, Business Segment)
Table 89 China National Petroleum Corporation (CNPC): Product Benchmarking
Table 90 China National Petroleum Corporation (CNPC): Strategic Outlook
Table 91 TC Energy Corporation: Key Details, (CEO, HQ, Revenue, Founded, No. of Employees, Company Type, Website, Business Segment)
Table 92 TC Energy Corporation: Product Benchmarking
Table 93 Chevron Corporation: Key Details, (CEO, HQ, Revenue, Founded, No. of Employees, Company Type, Website, Business Segment)
Table 94 Chevron Corporation: Product Benchmarking
Table 95 Chevron Corporation: Strategic Outlook
Table 96 Exxon Mobil Corporation: Key Details, (CEO, HQ, Revenue, Founded, No. of Employees, Company Type, Website, Business Segment)
Table 97 Exxon Mobil Corporation: Product Benchmarking
Table 98 Exxon Mobil Corporation: Strategic Outlook
Table 99 Royal Dutch Shell Plc: Key Details, (CEO, HQ, Revenue, Founded, No. of Employees, Company Type, Website, Business Segment)
Table 100 Royal Dutch Shell Plc: Product Benchmarking
Table 101 Royal Dutch Shell Plc: Strategic Outlook
Table 102 TotalEnergies SE: Key Details, (CEO, HQ, Revenue, Founded, No. of Employees, Company Type, Website, Business Segment)
Table 103 TotalEnergies SE: Product Benchmarking
Table 104 TotalEnergies SE: Strategic Outlook
Table 105 BP Plc: Key Details, (CEO, HQ, Revenue, Founded, No. of Employees, Company Type, Website, Business Segment)
Table 106 ConocoPhillips Company: Key Details, (CEO, HQ, Revenue, Founded, No. of Employees, Company Type, Website, Business Segment)
Table 107 ConocoPhillips Company: Product Benchmarking
Table 108 Eni S.p.A.: Key Details, (CEO, HQ, Revenue, Founded, No. of Employees, Company Type, Website, Business Segment)
Table 109 Eni S.p.A.: Product Benchmarking
Table 110 Eni S.p.A.: Strategic Outlook
Table 111 Enterprise Products Partners L.P: Key Details, (CEO, HQ, Revenue, Founded, No. of Employees, Company Type, Website, Business Segment)
Table 112 Enterprise Products Partners L.P: Product Benchmarking
Table 113 Plains All American Pipeline, L.P.: Key Details, (CEO, HQ, Revenue, Founded, No. of Employees, Company Type, Website, Business Segment)
Table 114 Plains All American Pipeline, L.P.: Product Benchmarking
Table 115 The Williams Companies, Inc: Key Details, (CEO, HQ, Revenue, Founded, No. of Employees, Company Type, Website, Business Segment)
Table 116 Enbridge Inc: Key Details, (CEO, HQ, Revenue, Founded, No. of Employees, Company Type, Website, Business Segment)
Table 117 Enbridge Inc: Strategic Outlook
Table 118 Kinder Morgan, Inc.: Key Details, (CEO, HQ, Revenue, Founded, No. of Employees, Company Type, Website, Business Segment)
Table 119 Kinder Morgan, Inc.: Product Benchmarking
Table 120 PetroChina Company Limited: Key Details, (CEO, HQ, Revenue, Founded, No. of Employees, Company Type, Website, Business Segment)
Table 121 PetroChina Company Limited: Product Benchmarking
Table 122 PetroChina Company Limited: Strategic Outlook
List of Figures
Figure 1 Onshore Oil and Gas Pipeline Market Segmentation
Figure 2 Onshore Oil and Gas Pipeline Market by Application: Market Attractiveness Index
Figure 3 Onshore Oil and Gas Pipeline Market by Material: Market Attractiveness Index
Figure 4 Onshore Oil and Gas Pipeline Market by Coating: Market Attractiveness Index
Figure 5 Onshore Oil and Gas Pipeline Market by Systems: Market Attractiveness Index
Figure 6 Onshore Oil and Gas Pipeline Market by Type: Market Attractiveness Index
Figure 7 Onshore Oil and Gas Pipeline Market Attractiveness Index by Region
Figure 8 Onshore Oil and Gas Pipeline Market: Market Dynamics
Figure 9 Onshore Oil and Gas Pipeline Market: Porter’s Five Forces Analysis
Figure 10 Global Onshore Oil and Gas Pipeline Market Share Forecast by COVID, 2024-2034 (%)
Figure 11 Global Onshore Oil & Gas Pipeline Market by Region, 2024-2034 (US$ Mn, AGR (%)) (V-Shaped Recovery Scenario)
Figure 12 Global Onshore Oil & Gas Pipeline Market by Region, 2024-2034 (US$ Mn, AGR (%)) (U-Shaped Recovery Scenario)
Figure 13 Global Onshore Oil & Gas Pipeline Market by Region, 2024-2034 (US$ Mn, AGR (%)) (W-Shaped Recovery Scenario)
Figure 14 Global Onshore Oil & Gas Pipeline Market by Region, 2024-2034 (US$ Mn, AGR (%)) (L-Shaped Recovery Scenario)
Figure 15 Onshore Oil and Gas Pipeline Market: PEST Analysis
Figure 16 Onshore Oil and Gas Pipeline Market by Application: Market Attractiveness Index
Figure 17 Global Onshore Oil & Gas Pipeline Market by Application, 2024-2034 (US$ Mn, AGR (%))
Figure 18 Onshore Oil and Gas Pipeline Market Share Forecast by Application, 2024, 2029, 2034 (%)
Figure 19 Oil Transportation Market by Region, 2024-2034 (US$ Mn, AGR (%))
Figure 20 Oil Transportation Market Share Forecast by Region, 2024 & 2034 (%)
Figure 21 Gas Transportation Market by Region, 2024-2034 (US$ Mn, AGR (%))
Figure 22 Gas Transportation Market Share Forecast by Region, 2024 & 2034 (%)
Figure 23 Onshore Oil and Gas Pipeline Market by Material: Market Attractiveness Index
Figure 24 Global Onshore Oil & Gas Pipeline Market by Material, 2024-2034 (US$ Mn, AGR (%))
Figure 25 Onshore Oil and Gas Pipeline Market Share Forecast by Material, 2024, 2029, 2034 (%)
Figure 26 Steel Pipes Market by Region, 2024-2034 (US$ Mn, AGR (%))
Figure 27 Steel Pipes Market Share Forecast by Region, 2024 & 2034 (%)
Figure 28 Polyethylene Pipes Market by Region, 2024-2034 (US$ Mn, AGR (%))
Figure 29 Polyethylene Pipes Market Share Forecast by Region, 2024 & 2034 (%)
Figure 30 Composite Pipes Market by Region, 2024-2034 (US$ Mn, AGR (%))
Figure 31 Composite Pipes Market Share Forecast by Region, 2024 & 2034 (%)
Figure 32 Onshore Oil and Gas Pipeline Market by Coating: Market Attractiveness Index
Figure 33 Global Onshore Oil & Gas Pipeline Market by Coating, 2024-2034 (US$ Mn, AGR (%))
Figure 34 Onshore Oil and Gas Pipeline Market Share Forecast by Coating, 2024, 2029, 2034 (%)
Figure 35 Fusion Bonded Epoxy (FBE) Coating Market by Region, 2024-2034 (US$ Mn, AGR (%))
Figure 36 Fusion Bonded Epoxy (FBE) Coating Market Share Forecast by Region, 2024 & 2034 (%)
Figure 37 Three-Layer Polyethylene (3LPE) Coating Market by Region, 2024-2034 (US$ Mn, AGR (%))
Figure 38 Three-Layer Polyethylene (3LPE) Coating Market Share Forecast by Region, 2024 & 2034 (%)
Figure 39 Coal Tar Enamel (CTE) Coating Market by Region, 2024-2034 (US$ Mn, AGR (%))
Figure 40 Coal Tar Enamel (CTE) Coating Market Share Forecast by Region, 2024 & 2034 (%)
Figure 41 Other Coating Market by Region, 2024-2034 (US$ Mn, AGR (%))
Figure 42 Other Coating Market Share Forecast by Region, 2024 & 2034 (%)
Figure 43 Onshore Oil and Gas Pipeline Market by Systems: Market Attractiveness Index
Figure 44 Global Onshore Oil & Gas Pipeline Market by Systems, 2024-2034 (US$ Mn, AGR (%))
Figure 45 Onshore Oil and Gas Pipeline Market Share Forecast by Systems, 2024, 2029, 2034 (%)
Figure 46 Supervisory Control and Data Acquisition (SCADA) Systems Market by Region, 2024-2034 (US$ Mn, AGR (%))
Figure 47 Supervisory Control and Data Acquisition (SCADA) Systems Market Share Forecast by Region, 2024 & 2034 (%)
Figure 48 Smart Pigging Technology Market by Region, 2024-2034 (US$ Mn, AGR (%))
Figure 49 Smart Pigging Technology Market Share Forecast by Region, 2024 & 2034 (%)
Figure 50 Leak Detection Systems Market by Region, 2024-2034 (US$ Mn, AGR (%))
Figure 51 Leak Detection Systems Market Share Forecast by Region, 2024 & 2034 (%)
Figure 52 Corrosion Monitoring Systems Market by Region, 2024-2034 (US$ Mn, AGR (%))
Figure 53 Corrosion Monitoring Systems Market Share Forecast by Region, 2024 & 2034 (%)
Figure 54 Other Systems Market by Region, 2024-2034 (US$ Mn, AGR (%))
Figure 55 Other Systems Market Share Forecast by Region, 2024 & 2034 (%)
Figure 56 Onshore Oil and Gas Pipeline Market by Type: Market Attractiveness Index
Figure 57 Global Onshore Oil & Gas Pipeline Market by Type, 2024-2034 (US$ Mn, AGR (%))
Figure 58 Onshore Oil and Gas Pipeline Market Share Forecast by Type, 2024, 2029, 2034 (%)
Figure 59 Electric Resistance Welded (ERW) Pipe Market by Region, 2024-2034 (US$ Mn, AGR (%))
Figure 60 Electric Resistance Welded (ERW) Pipe Market Share Forecast by Region, 2024 & 2034 (%)
Figure 61 Spiral Seam Welded (SSAW) Pipe Market by Region, 2024-2034 (US$ Mn, AGR (%))
Figure 62 Spiral Seam Welded (SSAW) Pipe Market Share Forecast by Region, 2024 & 2034 (%)
Figure 63 Longitudinal Seam Welded (LSAW) Pipe Market by Region, 2024-2034 (US$ Mn, AGR (%))
Figure 64 Longitudinal Seam Welded (LSAW) Pipe Market Share Forecast by Region, 2024 & 2034 (%)
Figure 65 Double Submerged Arc Welded (DSAW) Pipe Market by Region, 2024-2034 (US$ Mn, AGR (%))
Figure 66 Double Submerged Arc Welded (DSAW) Pipe Market Share Forecast by Region, 2024 & 2034 (%)
Figure 67 Electric Fusion Welded (EFW) Pipe Market by Region, 2024-2034 (US$ Mn, AGR (%))
Figure 68 Electric Fusion Welded (EFW) Pipe Market Share Forecast by Region, 2024 & 2034 (%)
Figure 69 Other Type Market by Region, 2024-2034 (US$ Mn, AGR (%))
Figure 70 Other Type Market Share Forecast by Region, 2024 & 2034 (%)
Figure 71 Onshore Oil and Gas Pipeline Market Forecast by Region 2024 and 2034 (Revenue, CAGR%)
Figure 72 Onshore Oil and Gas Pipeline Market Share Forecast by Region 2024, 2029, 2034 (%)
Figure 73 Onshore Oil and Gas Pipeline Market by Region, 2024-2034 (US$ Million, AGR %)
Figure 74 North America Onshore Oil and Gas Pipeline Market Attractiveness Index
Figure 75 North America Onshore Oil and Gas Pipeline Market by Region, 2024, 2029 & 2034 (US$ Million)
Figure 76 North America Onshore Oil & Gas Pipeline Market by Value, 2024-2034 (US$ Mn, AGR (%))
Figure 77 North America Onshore Oil & Gas Pipeline Market by Country, 2024-2034 (US$ Mn, AGR (%))
Figure 78 North America Onshore Oil and Gas Pipeline Market Share Forecast by Country, 2024 & 2034 (%)
Figure 79 North America Onshore Oil & Gas Pipeline Market by Application, 2024-2034 (US$ Mn, AGR (%))
Figure 80 North America Onshore Oil and Gas Pipeline Market Share Forecast Application, 2024 & 2034 (%)
Figure 81 North America Onshore Oil & Gas Pipeline Market by Material, 2024-2034 (US$ Mn, AGR (%))
Figure 82 North America Onshore Oil and Gas Pipeline Market Share Forecast by Material, 2024 & 2034 (%)
Figure 83 North America Onshore Oil & Gas Pipeline Market by Coating, 2024-2034 (US$ Mn, AGR (%))
Figure 84 North America Onshore Oil and Gas Pipeline Market Share Forecast by Coating, 2024 & 2034 (%)
Figure 85 North America Onshore Oil & Gas Pipeline Market by Systems, 2024-2034 (US$ Mn, AGR (%))
Figure 86 North America Onshore Oil and Gas Pipeline Market Share Forecast by Systems, 2024 & 2034 (%)
Figure 87 North America Onshore Oil & Gas Pipeline Market by Type, 2024-2034 (US$ Mn, AGR (%))
Figure 88 North America Onshore Oil and Gas Pipeline Market Share Forecast by Type, 2024 & 2034 (%)
Figure 89 US Onshore Oil & Gas Pipeline Market by Value, 2024-2034 (US$ Mn, AGR (%))
Figure 90 Canada Onshore Oil & Gas Pipeline Market by Value, 2024-2034 (US$ Mn, AGR (%))
Figure 91 Europe Onshore Oil and Gas Pipeline Market Attractiveness Index
Figure 92 Europe Onshore Oil and Gas Pipeline Market by Region, 2024, 2029 & 2034 (US$ Million)
Figure 93 Europe Onshore Oil & Gas Pipeline Market by Value, 2024-2034 (US$ Mn, AGR (%))
Figure 94 Europe Onshore Oil & Gas Pipeline Market by Country, 2024-2034 (US$ Mn, AGR (%))
Figure 95 Europe Onshore Oil and Gas Pipeline Market Share Forecast by Country, 2024 & 2034 (%)
Figure 96 Europe Onshore Oil & Gas Pipeline Market by Application, 2024-2034 (US$ Mn, AGR (%))
Figure 97 Europe Onshore Oil and Gas Pipeline Market Share Forecast Application, 2024 & 2034 (%)
Figure 98 Europe Onshore Oil & Gas Pipeline Market by Material, 2024-2034 (US$ Mn, AGR (%))
Figure 99 Europe Onshore Oil and Gas Pipeline Market Share Forecast by Material, 2024 & 2034 (%)
Figure 100 Europe Onshore Oil & Gas Pipeline Market by Coating, 2024-2034 (US$ Mn, AGR (%))
Figure 101 Europe Onshore Oil and Gas Pipeline Market Share Forecast by Coating, 2024 & 2034 (%)
Figure 102 Europe Onshore Oil & Gas Pipeline Market by Systems, 2024-2034 (US$ Mn, AGR (%))
Figure 103 Europe Onshore Oil and Gas Pipeline Market Share Forecast by Systems, 2024 & 2034 (%)
Figure 104 Europe Onshore Oil & Gas Pipeline Market by Type, 2024-2034 (US$ Mn, AGR (%))
Figure 105 Europe Onshore Oil and Gas Pipeline Market Share Forecast by Type, 2024 & 2034 (%)
Figure 106 Germany Onshore Oil & Gas Pipeline Market by Value, 2024-2034 (US$ Mn, AGR (%))
Figure 107 UK Onshore Oil & Gas Pipeline Market by Value, 2024-2034 (US$ Mn, AGR (%))
Figure 108 France Onshore Oil & Gas Pipeline Market by Value, 2024-2034 (US$ Mn, AGR (%))
Figure 109 Italy Onshore Oil & Gas Pipeline Market by Value, 2024-2034 (US$ Mn, AGR (%))
Figure 110 Russia Onshore Oil & Gas Pipeline Market by Value, 2024-2034 (US$ Mn, AGR (%))
Figure 111 Rest of Europe Onshore Oil & Gas Pipeline Market by Value, 2024-2034 (US$ Mn, AGR (%))
Figure 112 Asia-Pacific Onshore Oil and Gas Pipeline Market Attractiveness Index
Figure 113 Asia-Pacific Onshore Oil and Gas Pipeline Market by Region, 2024, 2029 & 2034 (US$ Million)
Figure 114 Asia-Pacific Onshore Oil & Gas Pipeline Market by Value, 2024-2034 (US$ Mn, AGR (%))
Figure 115 Asia-Pacific Onshore Oil & Gas Pipeline Market by Country, 2024-2034 (US$ Mn, AGR (%))
Figure 116 Asia-Pacific Onshore Oil and Gas Pipeline Market Share Forecast by Country, 2024 & 2034 (%)
Figure 117 Asia-Pacific Onshore Oil & Gas Pipeline Market by Application, 2024-2034 (US$ Mn, AGR (%))
Figure 118 Asia-Pacific Onshore Oil and Gas Pipeline Market Share Forecast Application, 2024 & 2034 (%)
Figure 119 Asia-Pacific Onshore Oil & Gas Pipeline Market by Material, 2024-2034 (US$ Mn, AGR (%))
Figure 120 Asia-Pacific Onshore Oil and Gas Pipeline Market Share Forecast by Material, 2024 & 2034 (%)
Figure 121 Asia-Pacific Onshore Oil & Gas Pipeline Market by Coating, 2024-2034 (US$ Mn, AGR (%))
Figure 122 Asia-Pacific Onshore Oil and Gas Pipeline Market Share Forecast by Coating, 2024 & 2034 (%)
Figure 123 Asia-Pacific Onshore Oil & Gas Pipeline Market by Systems, 2024-2034 (US$ Mn, AGR (%))
Figure 124 Asia-Pacific Onshore Oil and Gas Pipeline Market Share Forecast by Systems, 2024 & 2034 (%)
Figure 125 Asia-Pacific Onshore Oil & Gas Pipeline Market by Type, 2024-2034 (US$ Mn, AGR (%))
Figure 126 Asia-Pacific Onshore Oil and Gas Pipeline Market Share Forecast by Type, 2024 & 2034 (%)
Figure 127 China Onshore Oil & Gas Pipeline Market by Value, 2024-2034 (US$ Mn, AGR (%))
Figure 128 India Onshore Oil & Gas Pipeline Market by Value, 2024-2034 (US$ Mn, AGR (%))
Figure 129 Japan Onshore Oil & Gas Pipeline Market by Value, 2024-2034 (US$ Mn, AGR (%))
Figure 130 South Korea Onshore Oil & Gas Pipeline Market by Value, 2024-2034 (US$ Mn, AGR (%))
Figure 131 Australia Onshore Oil & Gas Pipeline Market by Value, 2024-2034 (US$ Mn, AGR (%))
Figure 132 Rest of Asia-Pacific Onshore Oil & Gas Pipeline Market by Value, 2024-2034 (US$ Mn, AGR (%))
Figure 133 Middle East and Africa Onshore Oil and Gas Pipeline Market Attractiveness Index
Figure 134 Middle East and Africa Onshore Oil and Gas Pipeline Market by Region, 2024, 2029 & 2034 (US$ Million)
Figure 135 Middle East & Africa Onshore Oil & Gas Pipeline Market by Value, 2024-2034 (US$ Mn, AGR (%))
Figure 136 Middle East & Africa Onshore Oil & Gas Pipeline Market by Country, 2024-2034 (US$ Mn, AGR (%))
Figure 137 Middle East and Africa Onshore Oil and Gas Pipeline Market Share Forecast by Country, 2024 & 2034 (%)
Figure 138 Middle East & Africa Onshore Oil & Gas Pipeline Market by Application, 2024-2034 (US$ Mn, AGR (%))
Figure 139 Middle East and Africa Onshore Oil and Gas Pipeline Market Share Forecast Application, 2024 & 2034 (%)
Figure 140 Middle East & Africa Onshore Oil & Gas Pipeline Market by Material, 2024-2034 (US$ Mn, AGR (%))
Figure 141 Middle East and Africa Onshore Oil and Gas Pipeline Market Share Forecast by Material, 2024 & 2034 (%)
Figure 142 Middle East & Africa Onshore Oil & Gas Pipeline Market by Coating, 2024-2034 (US$ Mn, AGR (%))
Figure 143 Middle East and Africa Onshore Oil and Gas Pipeline Market Share Forecast by Coating, 2024 & 2034 (%)
Figure 144 Middle East & Africa Onshore Oil & Gas Pipeline Market by Systems, 2024-2034 (US$ Mn, AGR (%))
Figure 145 Middle East and Africa Onshore Oil and Gas Pipeline Market Share Forecast by Systems, 2024 & 2034 (%)
Figure 146 Middle East & Africa Onshore Oil & Gas Pipeline Market by Type, 2024-2034 (US$ Mn, AGR (%))
Figure 147 Middle East and Africa Onshore Oil and Gas Pipeline Market Share Forecast by Type, 2024 & 2034 (%)
Figure 148 GCC Onshore Oil & Gas Pipeline Market by Value, 2024-2034 (US$ Mn, AGR (%))
Figure 149 South Africa Onshore Oil & Gas Pipeline Market by Value, 2024-2034 (US$ Mn, AGR (%))
Figure 150 Rest of Middle East & Africa Onshore Oil & Gas Pipeline Market by Value, 2024-2034 (US$ Mn, AGR (%))
Figure 151 Latin America Onshore Oil and Gas Pipeline Market Attractiveness Index
Figure 152 Latin America Onshore Oil and Gas Pipeline Market by Region, 2024, 2029 & 2034 (US$ Million)
Figure 153 Latin America Onshore Oil & Gas Pipeline Market by Value, 2024-2034 (US$ Mn, AGR (%))
Figure 154 Latin America Onshore Oil & Gas Pipeline Market by Country, 2024-2034 (US$ Mn, AGR (%))
Figure 155 Latin America Onshore Oil and Gas Pipeline Market Share Forecast by Country, 2024 & 2034 (%)
Figure 156 Latin America Onshore Oil & Gas Pipeline Market by Application, 2024-2034 (US$ Mn, AGR (%))
Figure 157 Latin America Onshore Oil and Gas Pipeline Market Share Forecast Application, 2024 & 2034 (%)
Figure 158 Latin America Onshore Oil & Gas Pipeline Market by Material, 2024-2034 (US$ Mn, AGR (%))
Figure 159 Latin America Onshore Oil and Gas Pipeline Market Share Forecast by Material, 2024 & 2034 (%)
Figure 160 Latin America Onshore Oil & Gas Pipeline Market by Coating, 2024-2034 (US$ Mn, AGR (%))
Figure 161 Latin America Onshore Oil and Gas Pipeline Market Share Forecast by Coating, 2024 & 2034 (%)
Figure 162 Latin America Onshore Oil & Gas Pipeline Market by Systems, 2024-2034 (US$ Mn, AGR (%))
Figure 163 Latin America Onshore Oil and Gas Pipeline Market Share Forecast by Systems, 2024 & 2034 (%)
Figure 164 Latin America Onshore Oil & Gas Pipeline Market by Type, 2024-2034 (US$ Mn, AGR (%))
Figure 165 Latin America Onshore Oil and Gas Pipeline Market Share Forecast by Type, 2024 & 2034 (%)
Figure 166 Brazil Onshore Oil & Gas Pipeline Market by Value, 2024-2034 (US$ Mn, AGR (%))
Figure 167 Mexico Onshore Oil & Gas Pipeline Market by Value, 2024-2034 (US$ Mn, AGR (%))
Figure 168 Rest of Latin America Onshore Oil & Gas Pipeline Market by Value, 2024-2034 (US$ Mn, AGR (%))
Figure 169 Onshore Oil and Gas Pipeline Market: Company Share, 2022
Figure 170 TC Energy Corporation.: Net Revenue, 2018-2022 (US$ Million, AGR%)
Figure 171 TC Energy Corporation.: Regional Revenue Share, 2022 (%)
Figure 172 TC Energy Corporation.: Business Segment Revenue Share, 2022 (%)
Figure 173 Chevron Corporation.: Net Revenue, 2018-2022 (US$ Million, AGR%)
Figure 174 Chevron Corporation.: R&D, 2018-2022 (US$ Million, AGR%)
Figure 175 Chevron Corporation.: Regional Revenue Share, 2022 (%)
Figure 176 Chevron Corporation.: Business Segment Revenue Share, 2022 (%)
Figure 177 Exxon Mobil Corporation.: Net Revenue, 2018-2022 (US$ Million, AGR%)
Figure 178 Exxon Mobil Corporation.: R&D, 2018-2022 (US$ Million, AGR%)
Figure 179 Exxon Mobil Corporation.: Regional Revenue Share, 2022 (%)
Figure 180 Exxon Mobil Corporation.: Business Segment Revenue Share, 2022 (%)
Figure 181 Royal Dutch Shell Plc.: Net Revenue, 2018-2022 (US$ Million, AGR%)
Figure 182 Royal Dutch Shell Plc.: R&D, 2018-2022 (US$ Million, AGR%)
Figure 183 Royal Dutch Shell Plc.: Regional Revenue Share, 2022 (%)
Figure 184 Royal Dutch Shell Plc.: Business Segment Revenue Share, 2022 (%)
Figure 185 TotalEnergies SE.: Net Revenue, 2018-2022 (US$ Million, AGR%)
Figure 186 TotalEnergies SE.: R&D, 2018-2022 (US$ Million, AGR%)
Figure 187 TotalEnergies SE.: Business Segment Revenue Share, 2022 (%)
Figure 188 BP Plc.: Net Revenue, 2018-2022 (US$ Million, AGR%)
Figure 189 BP Plc.: R&D, 2018-2022 (US$ Million, AGR%)
Figure 190 BP Plc.: Business Segment Revenue Share, 2022 (%)
Figure 191 ConocoPhillips Company.: Net Revenue, 2018-2022 (US$ Million, AGR%)
Figure 192 ConocoPhillips Company.: Regional Revenue Share, 2022 (%)
Figure 193 ConocoPhillips Company.: Business Segment Revenue Share, 2022 (%)
Figure 194 Eni S.p.A..: Net Revenue, 2018-2022 (US$ Million, AGR%)
Figure 195 Eni S.p.A..: R&D, 2018-2022 (US$ Million, AGR%)
Figure 196 Eni S.p.A..: Regional Revenue Share, 2022 (%)
Figure 197 Eni S.p.A..: Business Segment Revenue Share, 2022 (%)
Figure 198 Enterprise Products Partners L.P.: Net Revenue, 2018-2022 (US$ Million, AGR%)
Figure 199 Enterprise Products Partners L.P.: Business Segment Revenue Share, 2022 (%)
Figure 200 Plains All American Pipeline, L.P..: Net Revenue, 2018-2022 (US$ Million, AGR%)
Figure 201 Plains All American Pipeline, L.P..: Regional Revenue Share, 2022 (%)
Figure 202 Plains All American Pipeline, L.P..: Business Segment Revenue Share, 2022 (%)
Figure 203 The Williams Companies, Inc.: Net Revenue, 2018-2022 (US$ Million, AGR%)
Figure 204 Enbridge Inc.: Net Revenue, 2018-2022 (US$ Million, AGR%)
Figure 205 Enbridge Inc.: Regional Revenue Share, 2022 (%)
Figure 206 Enbridge Inc.: Business Segment Revenue Share, 2022 (%)
Figure 207 Kinder Morgan, Inc..: Net Revenue, 2018-2022 (US$ Million, AGR%)
Figure 208 Kinder Morgan, Inc..: Regional Revenue Share, 2022 (%)
Figure 209 Kinder Morgan, Inc..: Business Segment Revenue Share, 2022 (%)
ページTOPに戻る
Visiongain社のエネルギーと資源分野での最新刊レポート
本レポートと同じKEY WORD()の最新刊レポート
- 本レポートと同じKEY WORDの最新刊レポートはありません。
よくあるご質問
Visiongain社はどのような調査会社ですか?
英国の調査会社ヴィジョンゲイン社(Visiongain)は、通信とエネルギーのほか、自動車や化学・医薬品、金属など、広範な市場を対象に調査を行っています。自動車市場については、市場全般に関する調査のほ... もっと見る
調査レポートの納品までの日数はどの程度ですか?
在庫のあるものは速納となりますが、平均的には 3-4日と見て下さい。
但し、一部の調査レポートでは、発注を受けた段階で内容更新をして納品をする場合もあります。
発注をする前のお問合せをお願いします。
注文の手続きはどのようになっていますか?
1)お客様からの御問い合わせをいただきます。
2)見積書やサンプルの提示をいたします。
3)お客様指定、もしくは弊社の発注書をメール添付にて発送してください。
4)データリソース社からレポート発行元の調査会社へ納品手配します。
5) 調査会社からお客様へ納品されます。最近は、pdfにてのメール納品が大半です。
お支払方法の方法はどのようになっていますか?
納品と同時にデータリソース社よりお客様へ請求書(必要に応じて納品書も)を発送いたします。
お客様よりデータリソース社へ(通常は円払い)の御振り込みをお願いします。
請求書は、納品日の日付で発行しますので、翌月最終営業日までの当社指定口座への振込みをお願いします。振込み手数料は御社負担にてお願いします。
お客様の御支払い条件が60日以上の場合は御相談ください。
尚、初めてのお取引先や個人の場合、前払いをお願いすることもあります。ご了承のほど、お願いします。
データリソース社はどのような会社ですか?
当社は、世界各国の主要調査会社・レポート出版社と提携し、世界各国の市場調査レポートや技術動向レポートなどを日本国内の企業・公官庁及び教育研究機関に提供しております。
世界各国の「市場・技術・法規制などの」実情を調査・収集される時には、データリソース社にご相談ください。
お客様の御要望にあったデータや情報を抽出する為のレポート紹介や調査のアドバイスも致します。
|
|

