熱攻法石油増進回収法(EOR)市場レポート:2024-2034
Thermal Enhanced Oil Recovery (EOR) Market Report 2024-2034
レポート詳細
熱攻法石油増進回収法(EOR)市場レポート 2024-2034年 :この調査レポートは、業界とその基礎となるダイナミクスをより良く理解することを望むなら、新たな収益ポケットを目指す大手企... もっと見る
※上記価格は部署ライセンス(Departmental licence)価格です。
その他の価格についてはデータリソースまでお問合せください。
日本語のページは自動翻訳を利用し作成しています。
実際のレポートは英文のみでご納品いたします。

|

|
サマリー
レポート詳細
熱攻法石油増進回収法(EOR)市場レポート 2024-2034年:この調査レポートは、業界とその基礎となるダイナミクスをより良く理解することを望むなら、新たな収益ポケットを目指す大手企業にとって貴重なものとなるでしょう。異業種への進出や新地域での既存事業の拡大を目指す企業にも有用です。
電力需要の増大が新たな道を開く
一般的な熱EOR手法のひとつに、蒸気圧入がある。蒸気を油層に注入して石油を加熱し、粘度を下げ、流動特性を改善する。この流動性の向上により、石油の回収が促進される。電力業界は、蒸気発生に必要なエネルギーの供給に間接的に関与している。電力産業は、熱EORプロセスに必要なエネルギーを供給する上で重要な役割を果たしている。このエネルギーは、採用されるEOR法の特定の要件に応じて、電気または熱の形で供給される。
熱EORに伴う高い資本コストと運転コスト
熱攻法石油増進回収法(EOR)を含め、石油増進回収法(EOR)は、確かに高い資本コストと操業コストを伴うことがある。サーマルEORは、油層に熱を注入して油の粘度を下げ、流動性を改善することにより、油層から石油を追加的に抽出するために使用される一連の技術である。サーマルEORの2つの一般的な方法は、蒸気圧入と原位置燃焼である。
熱攻法EORの実施には、坑井、蒸気発生器、地表施設の設置など、大規模なインフラ整備が必要である。これらのインフラ投資は、初期資本コストに大きく寄与する。蒸気圧入は高圧蒸気の発生を伴うが、これは通常、天然ガスやその他の燃料を使用して製造される。蒸気発生器の購入やメンテナンスを含め、蒸気発生に関連するコストは相当なものになる可能性がある。
市場調査レポートを購入する前にすべき質問とは?
-
熱攻法石油増進回収法(EOR)市場はどのように進化しているのか?
-
熱攻法石油増進回収法(EOR)市場の促進要因と抑制要因は何か?
-
熱攻法石油増進回収法(EOR)の各サブマーケットセグメントは予測期間中にどのように成長し、2034年にどれくらいの収益を占めるようになるのか?
-
各熱攻法石油増進回収法(EOR)サブマーケットの市場シェアは2023年から2034年にかけてどのように推移するのか?
-
2024年から2034年までの市場全体の主な牽引役は何か?
-
主要な熱攻法石油増進回収法(EOR)市場はマクロ経済の動きに概ね追随するのか、それとも個々の国市場が他を凌駕するのか?
-
2034年までに各国市場のシェアはどのように変化し、2034年にはどの地域が市場をリードするのか?
-
主要プレーヤーは誰で、予測期間中の見通しは?
-
これらの大手企業の熱攻法石油増進回収法(EOR)プロジェクトは何か?
-
2024年から2034年の間に、業界はどのように発展していくのか?現在および今後10年間に実施される
-
熱攻法石油増進回収法(EOR)プロジェクトにはどのような意味があるのか?
-
熱攻法石油増進回収法(EOR)市場をさらに拡大するために、製品の商業化の必要性は高まっているか?
-
熱攻法石油増進回収法(EOR)市場はどこに向かっているのか、そしてどのようにすれば市場の最前線に立てるのか?
熱攻法石油増進回収法(EOR)市場が現在、そして今後10年間でどのような影響を受けるかを知る必要がある:
-
132の表と160のグラフで構成される275ページのレポート。
-
について本レポートでは、業界の主要な有利分野を取り上げている。今すぐ
-
世界、地域、国の売上高と成長に関する詳細な分析が含まれている。
-
競合他社が成功した主なトレンド、変化、収益予測をハイライトします。
本レポートは、熱攻法石油増進回収法(EOR)市場が今後10年間にどのように発展するか、またCOVID-19の景気後退と好転の変動に合わせてどのように発展するかをお伝えするものです。この市場は、過去10年間のどの時点よりも今が重要である。
2034年までの予測やその他の分析から、商業的な展望が明らかになる
-
2034年までの収益予測に加え、最近の実績、成長率、市場シェアも提供している。
-
ビジネスの展望や展開など、独自の分析が掲載されている。
-
質的分析(市場ダイナミクス、促進要因、機会、阻害要因、課題を含む)、ポーターズファイブフォース分析、PEST分析、最近の動向をご覧いただけます。
レポート対象セグメント(市場規模:売上高および数量)
用途別の見通し
方法のの見通し
-
スチーム・フラッディング
-
周期的蒸気刺激
-
お湯
-
その場燃焼
-
蒸気アシスト重力排水
世界市場全体と各分野の売上予測に加え、5つの地域と17の主要国市場の売上予測も掲載しています:
北米
欧州
アジア太平洋
ラテンアメリカ
-
ブラジル
-
メキシコ
-
コロンビア
-
ベネズエラ
-
トリニダード
中東・アフリカ
本レポートには、熱攻法石油増進回収法(EOR)市場の2024年から2034年までの主要企業のプロファイルも含まれており、これらの企業の事業のこのセグメントに焦点を当てています。
主要企業と市場成長の可能性
-
Aera Energy
-
Canadian Natural Resources
-
Chevron
-
China National Petroleum Corporation
-
Ecopetrol
-
Husky Energy
-
International Petroleum Corp.
-
Lukoil
-
ONGC
-
Pemex
-
Petrobras
-
Petróleos de Venezuela
-
Petrotrin
-
Sinopec
-
Wintershall Dea AG
熱攻法石油増進回収法(EOR)市場全体の2024年から2034年までの売上高は、金額ベースで2023年に300億米ドルを突破した。2033年まで収益は力強く成長すると予測。当社の調査では、最も大きな可能性を秘めた企業を特定しています。各組織の能力、進捗状況、商業的見通しを把握し、一歩先を行くための一助としてください。
2024年から2034年までの熱増進回収法(EOR)市場に関する調査レポートはどのようにお役に立つでしょうか?
要約すると、270ページを超えるこのレポートは、以下のような知識を提供する:
-
熱攻法石油増進回収法(EOR)市場の2024年から2034年までの収益と数量予測 世界、地域レベルでの用途、方法、各予測を掲載 - 業界の展望を発見し、投資と収益に最も有利な場所を見つけます。
-
5つの地域と17の主要国市場の2034年までの収益と数量予測 - 熱攻法石油増進回収法(EOR)市場、北米、ヨーロッパ、アジア太平洋、ラテンアメリカ、中東・アフリカの2024年から2034年までの市場予測をご覧ください。また、米国、カナダ、メキシコ、オランダ、ドイツ、ロシア、中国、インド、インドネシア、オマーンなどの著名経済圏の市場規模の推定と予測も提供しています。
-
熱攻法石油増進回収法(EOR)市場に関わる主要企業15社の企業プロファイルを含む、既存企業および市場参入を目指す企業の展望。
独自の予測による定量的・定性的分析をご覧ください。私たちのレポートだけに含まれる情報を入手し、貴重なビジネスインテリジェンスで情報を得ることができます。
他にはない情報
私たちの新しいレポートがあれば、知識に遅れをとったり、チャンスを逃したりする可能性が低くなります。Visiongainのレポートが貴社の調査、分析、意思決定にどのように役立つかをご覧ください。Visiongainの調査は、熱攻法石油増進回収法(EOR)市場、2024年から2034年、市場をリードする企業の商業分析を必要とするすべての人のためのものです。データ、トレンド、予測をご覧いただけます。
ページTOPに戻る
目次 目次 1 レポート概要
1.1 研究の目的
1.2 サーマル式石油増進回収法(EOR)市場の紹介
1.3 本レポートの内容
1.4 本レポートを読むべき理由
1.5 本分析レポートが回答する主な質問
1.6 本レポートは誰のためのものか?
1.7 方法論
1.7.1 市場の定義
1.7.2 市場評価・予測手法
1.7.3 データの検証
1.7.3.1 一次調査
1.7.3.2 セカンダリーリサーチ
1.8 よくある質問(FAQ)
1.9 Visiongainの関連レポート
1.10 Visiongainについて
2 エグゼクティブ・サマリー
3 市場概要
3.1 主要な調査結果
3.2 市場ダイナミクス
3.2.1 市場促進要因
3.2.1.1 原油価格の高騰がサーマルEOR市場を牽引する
3.2.1.2 世界的な石油探査・生産活動の活発化
3.2.2 市場抑制要因
3.2.2.1 熱EORに伴う高い資本コストと操業コスト
3.2.2.2 サーマルEOR産業に関連する課題
3.2.3 市場機会
3.2.3.1 先進国および発展途上国における石油需要の増加
3.2.3.2 世界的な電力需要の増大が新たな機会を開く
3.3 COVID-19影響分析
3.4 ポーターのファイブフォース分析
3.4.1 サプライヤーの交渉力(中程度?)
3.4.2 買い手の交渉力(中程度)
3.4.3 競争上のライバル(高)
3.4.4 代替品による脅威(低い)
3.4.5 新規参入者の脅威(低)
4 熱増進回収法(EOR)の用途別市場分析
4.1 主要な調査結果
4.2 アプリケーションセグメント市場魅力度指数
4.3 熱化学法石油増進回収法(EOR)の用途別市場規模の推定と予測
4.4 石油増進回収法(EOR)の生産量推定と用途別予測
4.5 陸上
4.5.1 2024〜2034年の地域別市場規模(10億米ドル)
4.5.2 地域別市場シェア、2024年&2034年(%)
4.5.3 2024〜2034年地域別生産量(千バレル/日)
4.6 オフショア
4.6.1 地域別市場規模、2024~2034年(10億米ドル)
4.6.2 地域別市場シェア、2024年~2034年(%)
4.6.3 地域別生産量、2024年~2034年(千バレル/日)
5 熱回収法(EOR)市場の方法別分析
5.1 主要な調査結果
5.2 方法セグメント市場魅力度指数
5.3 熱化学法石油増進回収法(EOR)の方法別市場規模の推定と予測
5.4 熱回収法(EOR)生産量の推定と予測:方法別
5.5 蒸気フラッディング
5.5.1 スチームフラッディングEORの利点
5.5.2 スチームフラッディングの課題と限界
5.5.3 地域別市場規模、2024-2034年(10億米ドル)
5.5.4 地域別市場シェア、2024年&2034年(%)
5.5.5 地域別生産量、2024~2034年(千バレル/日)
5.6 周期的蒸気刺激(CSS)
5.6.1 CSS法の利点と課題
5.6.2 地域別市場規模、2024~2034年(10億米ドル)
5.6.3 地域別市場シェア、2024年&2034年(%)
5.6.4 地域別生産量、2024年~2034年(千バレル/日)
5.7 温水
5.7.1 地域別市場規模、2024~2034年(10億米ドル)
5.7.2 地域別市場シェア、2024年~2034年(%)
5.7.3 地域別生産量、2024年~2034年(千バレル/日)
5.8 現場燃焼
5.8.1 現場燃焼の利点と課題
5.8.2 地域別市場規模、2024~2034年(10億米ドル)
5.8.3 地域別市場シェア、2024年&2034年(%)
5.8.4 地域別生産量、2024~2034年(千バレル/日)
5.9 蒸気補助重力排水法(SAGD)
5.9.1 蒸気補助重力排水法(SAGD)の作業
5.9.2 SAGD法の利点と限界
5.9.3 蒸気油比低減におけるSAGDの意義
5.9.4 2024~2034年の地域別市場規模(10億米ドル)
5.9.5 地域別市場シェア、2024年~2034年(%)
5.9.6 地域別生産量、2024年~2034年(千バレル/日)
6 熱増進回収法(EOR)の地域別市場分析
6.1 主要な調査結果
6.2 地域別市場規模の推定と予測
7 北米における石油増進回収(EOR)市場の分析
7.1 主要な調査結果
7.2 北米における石油増進回収(EOR)市場の魅力度指数
7.3 北米における石油増進回収法(EOR)国別市場(2024年、2029年、2034年)(10億米ドル
7.4 北米における石油増進回収法(EOR)生産量(国別):2024年、2029年、2034年(千バレル/日
7.5 北米における石油増進回収法(EOR)の国別市場規模予測と予測
7.6 北米における石油増進回収法(EOR)の市場規模推計と用途別予測
7.7 北米における石油増進回収(EOR)の市場規模推計と方法別予測
7.8 アメリカの石油増進回収法(EOR)市場分析
7.8.1 米国の石油・天然ガス産業
7.9 カナダの石油増進回収法(EOR)市場分析
7.9.1 カナダのビチューメン生産量が過去最高を記録
8 欧州の熱回収法(EOR)市場分析
8.1 主要な調査結果
8.2 欧州の熱式石油増進回収法(EOR)市場魅力度指数
8.3 欧州の増進回収法(EOR)国別市場:2024年、2029年、2034年(10億米ドル)
8.4 欧州の石油増進回収法(EOR)国別生産量(2024年、2029年、2034年)(千バレル/日
8.5 欧州の石油増進回収法(EOR)国別市場規模の推定と予測
8.6 欧州の石油増進回収法(EOR)市場規模推計と用途別予測
8.7 欧州の石油増進回収法(EOR)市場規模推計・予測:方法別
8.8 オランダの石油増進回収法(EOR)市場分析
8.9 ドイツの増進回収法(EOR)市場分析
8.10 ロシアの増進回収法(EOR)市場分析
9 アジア太平洋地域の石油増進回収(EOR)市場分析
9.1 主要な調査結果
9.2 アジア太平洋地域の石油増進回収(EOR)市場魅力度指数
9.3 アジア太平洋地域の増進回収法(EOR)国別市場:2024年、2029年、2034年(10億米ドル)
9.4 アジア太平洋地域の石油増進回収法(EOR)国別生産量(千バレル/日):2024年、2029年、2034年
9.5 アジア太平洋地域の石油増進回収法(EOR)国別市場規模推計・予測
9.6 アジア太平洋地域の増進回収熱(EOR)市場規模推計と用途別予測
9.7 アジア太平洋地域の原油増進回収法(EOR)の市場規模推計と方法別予測
9.8 中国の石油増進回収法(EOR)市場分析
9.9 インドの増進回収法(EOR)市場分析
9.10 インドネシアの石油増進回収法(EOR)市場分析
9.10.1 インドネシア規制当局SKK MigasがランタウバイEORプロジェクトフェーズ1を承認
9.11 カザフスタンの石油増進回収法(EOR)市場分析
10 ラテンアメリカの熱回収法(EOR)市場分析
10.1 主要な調査結果
10.2 ラテンアメリカの熱式石油増進回収法(EOR)市場魅力度指数
10.3 ラテンアメリカの石油増進回収法(EOR)国別市場:2024年、2029年、2034年(10億米ドル)
10.4 ラテンアメリカの国別増進回収法(EOR)生産量(2024年、2029年、2034年:千バレル/日)
10.5 中南米の石油増進回収法(EOR)国別市場規模予測・予測
10.6 中南米の石油増進回収法(EOR)市場規模予測・用途別予測
10.7 中南米の石油増進回収法(EOR)市場規模推計と方法別予測
10.8 ブラジルの石油増進回収法(EOR)市場分析
10.9 メキシコの石油増進回収法(EOR)市場分析
10.10 コロンビアの石油増進回収法(EOR)市場分析
10.11 ベネズエラの石油増進回収法(EOR)市場分析
10.12 トリニダード石油増進回収法(EOR)の市場分析
11 中東・アフリカの熱増進回収法(EOR)市場分析
11.1 主要な調査結果
11.2 中東・アフリカの原油増進回収法(EOR)市場魅力度指数
11.3 中東・アフリカの国別増進回収法(EOR)市場:2024年、2029年、2034年(10億米ドル)
11.4 中東・アフリカの国別増進回収法(EOR)生産量(2024年、2029年、2034年:千バレル/日)
11.5 中東・アフリカの国別増進回収法(EOR)市場規模推計・予測
11.6 中東・アフリカの増進回収熱(EOR)市場規模予測・用途別予測
11.7 中東・アフリカ地域増進回収法(EOR)市場規模推計・予測:方法別
11.8 エジプトの石油増進回収法(EOR)市場分析
11.9 オマーンの石油増進回収法(EOR)市場分析
11.9.1 オマーンは石油増進回収用に2GWthの太陽熱蒸気プラントを導入へ
11.10 スーダンの石油増進回収法(EOR)市場の分析
12 企業プロフィール
12.1 各社のマーケットシェア
12.2 中国石油総公司
12.2.1 会社概要
12.2.2 会社概要
12.2.3 財務分析
12.2.3.1 純収入、2018年~2022年
12.2.3.2 地域市場シェア、2022年
12.2.4 製品ベンチマーク
12.2.5 戦略的展望
12.3 中国石油化工集団公司
12.3.1 会社概要
12.3.2 会社概要
12.3.3 財務分析
12.3.3.1 純収入、2018年~2022年
12.3.3.2 セグメント市場シェア(2022年
12.3.4 製品ベンチマーク
12.3.5 戦略的展望
12.4 石油天然ガス株式会社
12.4.1 会社概要
12.4.2 会社概要
12.4.3 財務分析
12.4.3.1 純収入、2018年~2022年
12.4.3.2 セグメント市場シェア、2022年
12.4.4 製品ベンチマーク
12.4.5 戦略的展望
12.5 シェブロンコーポレーション
12.5.1 会社概要
12.5.2 会社概要
12.5.3 財務分析
12.5.3.1 純収入、2018年~2022年
12.5.3.2 地域市場シェア、2022年
12.5.3.3 セグメント市場シェア、2022年
12.5.4 製品ベンチマーク
12.5.5 戦略的展望
12.6 ペトロブラス
12.6.1 会社概要
12.6.2 会社概要
12.6.3 財務分析
12.6.3.1 純収入、2018年~2022年
12.6.3.2 セグメント市場シェア、2022年
12.6.4 製品ベンチマーク
12.6.5 戦略的展望
12.7 エコペトロール
12.7.1 会社概要
12.7.2 会社概要
12.7.3 財務分析
12.7.3.1 純収入、2018年~2022年
12.7.3.2 セグメント市場シェア、2022年
12.7.4 製品ベンチマーク
12.7.5 戦略的展望
12.8 ペメックス
12.8.1 会社概要
12.8.2 会社概要
12.8.3 製品ベンチマーク
12.8.4 戦略的展望
12.9 トリニダード・トバゴ石油会社
12.9.1 会社概要
12.9.2 会社概要
12.9.3 製品ベンチマーク
12.10 PDVSA - ベネズエラ石油公社
12.10.1 会社概要
12.10.2 会社概要
12.10.3 製品ベンチマーク
12.10.4 戦略的展望
12.11 ルクオイル
12.11.1 会社概要
12.11.2 会社概要
12.11.3 製品ベンチマーク
12.11.4 戦略的展望
12.12 ウィンターシャル・ディアAG
12.12.1 会社概要
12.12.2 会社概要
12.12.3 財務分析
12.12.3.1 純収入、2018年~2022年
12.12.3.2 セグメント市場シェア、2022年
12.12.4 製品ベンチマーク
12.12.5 戦略的展望
12.13 カナディアン・ナチュラル・リソーシズ・リミテッド
12.13.1 会社概要
12.13.2 会社概要
12.13.3 財務分析
12.13.3.1 純収入、2018年~2022年
12.13.3.2 セグメント市場シェア、2022年
12.13.4 製品ベンチマーク
12.14 アエラエナジー
12.14.1 会社概要
12.14.2 会社概要
12.14.3 製品ベンチマーク
12.14.4 戦略的展望
12.15 ハスキー・エナジー
12.15.1 会社概要
12.15.2 会社概要
12.15.3 製品ベンチマーク
12.15.4 戦略的展望
12.16 インターナショナル・ペトロリアム社
12.16.1 会社概要
12.16.2 会社概要
12.16.3 財務分析
12.16.3.1 純収入、2018年~2022年
12.16.3.2 地域市場シェア、2022年
12.16.4 製品ベンチマーク
13 結論と提言
13.1 ビジョンゲインからの結びの言葉
13.2 推奨事項
ページTOPに戻る
図表リスト
表の一覧
Table 1 Thermal Enhanced Oil Recovery (EOR) Market Snapshot, 2024 & 2034 (Thousand Barrel/d, CAGR %)
Table 2 Thermal Enhanced Oil Recovery (EOR) Market Snapshot, 2024 & 2034 (US$ Billion, CAGR %)
Table 3 Thermal Enhanced Oil Recovery (EOR) Market Forecast by Region, 2024-2034 (US$ Billion, AGR%, CAGR%): “V” Shaped Recovery
Table 4 Thermal Enhanced Oil Recovery (EOR) Market Forecast by Region, 2024-2034 (US$ Billion, AGR%, CAGR%): “U” Shaped Recovery
Table 5 Thermal Enhanced Oil Recovery (EOR) Market Forecast by Region, 2024-2034 (US$ Billion, AGR%, CAGR%): “W” Shaped Recovery
Table 6 Thermal Enhanced Oil Recovery (EOR) Market Forecast by Region, 2024-2034 (US$ Billion, AGR%, CAGR%): “L” Shaped Recovery
Table 7 Thermal Enhanced Oil Recovery (EOR) Market Forecast by Application, 2024-2034 (US$ Billion, AGR%, CAGR%)
Table 8 Thermal Enhanced Oil Recovery (EOR) Production by Application, 2024-2034 (Thousand Barrel/d, AGR%, CAGR%)
Table 9 Onshore Segment Market Forecast by Region, 2024-2034 (US$ Billion, AGR%, CAGR%)
Table 10 Onshore Thermal EOR Production by Region, 2024-2034 (Thousand Barrel/d, AGR%, CAGR%)
Table 11 Offshore Segment Market Forecast by Region, 2024-2034 (US$ Billion, AGR%, CAGR%)
Table 12 Offshore Thermal EOR Production by Region, 2024-2034 (Thousand Barrel/d, AGR%, CAGR%)
Table 13 Thermal Enhanced Oil Recovery (EOR) Market Forecast by Method, 2024-2034 (US$ Billion, AGR%, CAGR%)
Table 14 Thermal Enhanced Oil Recovery (EOR) Production by Method, 2024-2034 (Thousand Barrel/d, AGR%, CAGR%)
Table 15 Steam Flooding Segment Market Forecast by Region, 2024-2034 (US$ Billion, AGR%, CAGR%)
Table 16 Steam Flooding Thermal EOR Production by Region, 2024-2034 (Thousand Barrel/d, AGR%, CAGR%)
Table 17 Cyclic Steam Stimulation (CSS) Segment Market Forecast by Region, 2024-2034 (US$ Billion, AGR%, CAGR%)
Table 18 Cyclic Steam Stimulation (CSS) Thermal EOR Production by Region, 2024-2034 (Thousand Barrel/d, AGR%, CAGR%)
Table 19 Hot Water Segment Market Forecast by Region, 2024-2034 (US$ Billion, AGR%, CAGR%)
Table 20 Hot Water Thermal EOR Production by Region, 2024-2034 (Thousand Barrel/d, AGR%, CAGR%)
Table 21 In-situ Combustion Segment Market Forecast by Region, 2024-2034 (US$ Billion, AGR%, CAGR%)
Table 22 In-situ Combustion Thermal EOR Production by Region, 2024-2034 (Thousand Barrel/d, AGR%, CAGR%)
Table 23 Steam-Assisted Gravity Drainage (SAGD) Segment Market Forecast by Region, 2024-2034 (US$ Billion, AGR%, CAGR%)
Table 24 Steam-Assisted Gravity Drainage (SAGD) Thermal EOR Production by Region, 2024-2034 (Thousand Barrel/d, AGR%, CAGR%)
Table 25 Thermal Enhanced Oil Recovery (EOR) Market Forecast by Region, 2024-2034 (US$ Billion, AGR%, CAGR%)
Table 26 Thermal Enhanced Oil Recovery (EOR) Market Forecast by Region, 2024-2034 (Thousand Barrel/d, AGR%, CAGR%)
Table 27 North America Thermal Enhanced Oil Recovery (EOR) Market Forecast by Country, 2024-2034 (US$ Billion, AGR%, CAGR%)
Table 28 North America Thermal Enhanced Oil Recovery (EOR) Production by Country, 2024-2034 (Thousand Barrel/d, AGR%, CAGR%)
Table 29 North America Thermal Enhanced Oil Recovery (EOR) Market Forecast by Application, 2024-2034 (US$ Billion, AGR%, CAGR%)
Table 30 North America Thermal Enhanced Oil Recovery (EOR) Production by Application, 2024-2034 (Thousand Barrel/d, AGR%, CAGR%)
Table 31 North America Thermal Enhanced Oil Recovery (EOR) Market Forecast by Method, 2024-2034 (US$ Billion, AGR%, CAGR%)
Table 32 North America Thermal Enhanced Oil Recovery (EOR) Production by Method, 2024-2034 (Thousand Barrel/d, AGR%, CAGR%)
Table 33 U.S. Thermal Enhanced Oil Recovery (EOR) Market Forecast, 2024-2034 (US$ Billion, AGR%, CAGR%)
Table 34 U.S. Thermal Enhanced Oil Recovery (EOR) Production, 2024-2034 (Thousand Barrel/d, AGR%, CAGR%)
Table 35 Canada Thermal Enhanced Oil Recovery (EOR) Market Forecast, 2024-2034 (US$ Billion, AGR%, CAGR%)
Table 36 Canada Thermal Enhanced Oil Recovery (EOR) Production, 2024-2034 (Thousand Barrel/d, AGR%, CAGR%)
Table 37 Europe Thermal Enhanced Oil Recovery (EOR) Market Forecast by Country, 2024-2034 (US$ Billion, AGR%, CAGR%)
Table 38 Europe Thermal Enhanced Oil Recovery (EOR) Production by Country, 2024-2034 (Thousand Barrel/d, AGR%, CAGR%)
Table 39 Europe Thermal Enhanced Oil Recovery (EOR) Market Forecast by Application, 2024-2034 (US$ Billion, AGR%, CAGR%)
Table 40 Europe Thermal Enhanced Oil Recovery (EOR) Production by Application, 2024-2034 (Thousand Barrel/d, AGR%, CAGR%)
Table 41 Europe Thermal Enhanced Oil Recovery (EOR) Market Forecast by Method, 2024-2034 (US$ Billion, AGR%, CAGR%)
Table 42 Europe Thermal Enhanced Oil Recovery (EOR) Production by Method, 2024-2034 (Thousand Barrel/d, AGR%, CAGR%)
Table 43 Netherlands Thermal Enhanced Oil Recovery (EOR) Market Forecast, 2024-2034 (US$ Billion, AGR%, CAGR%)
Table 44 Netherlands Thermal Enhanced Oil Recovery (EOR) Production, 2024-2034 (Thousand Barrel/d, AGR%, CAGR%)
Table 45 Germany Thermal Enhanced Oil Recovery (EOR) Market Forecast, 2024-2034 (US$ Billion, AGR%, CAGR%)
Table 46 Germany Thermal Enhanced Oil Recovery (EOR) Production, 2024-2034 (Thousand Barrel/d, AGR%, CAGR%)
Table 47 Russia Thermal Enhanced Oil Recovery (EOR) Market Forecast, 2024-2034 (US$ Billion, AGR%, CAGR%)
Table 48 Russia Thermal Enhanced Oil Recovery (EOR) Production, 2024-2034 (Thousand Barrel/d, AGR%, CAGR%)
Table 49 Asia Pacific Thermal Enhanced Oil Recovery (EOR) Market Forecast by Country, 2024-2034 (US$ Billion, AGR%, CAGR%)
Table 50 Asia Pacific Thermal Enhanced Oil Recovery (EOR) Production by Country, 2024-2034 (Thousand Barrel/d, AGR%, CAGR%)
Table 51 Asia Pacific Thermal Enhanced Oil Recovery (EOR) Market Forecast by Application, 2024-2034 (US$ Billion, AGR%, CAGR%)
Table 52 Asia Pacific Thermal Enhanced Oil Recovery (EOR) Production by Application, 2024-2034 (Thousand Barrel/d, AGR%, CAGR%)
Table 53 Asia Pacific Thermal Enhanced Oil Recovery (EOR) Market Forecast by Method, 2024-2034 (US$ Billion, AGR%, CAGR%)
Table 54 Asia Pacific Thermal Enhanced Oil Recovery (EOR) Production by Method, 2024-2034 (Thousand Barrel/d, AGR%, CAGR%)
Table 55 China Thermal Enhanced Oil Recovery (EOR) Market Forecast, 2024-2034 (US$ Billion, AGR%, CAGR%)
Table 56 China Thermal Enhanced Oil Recovery (EOR) Production, 2024-2034 (Thousand Barrel/d, AGR%, CAGR%)
Table 57 India Thermal Enhanced Oil Recovery (EOR) Market Forecast, 2024-2034 (US$ Billion, AGR%, CAGR%)
Table 58 India Thermal Enhanced Oil Recovery (EOR) Production, 2024-2034 (Thousand Barrel/d, AGR%, CAGR%)
Table 59 Indonesia Thermal Enhanced Oil Recovery (EOR) Market Forecast, 2024-2034 (US$ Billion, AGR%, CAGR%)
Table 60 Indonesia Thermal Enhanced Oil Recovery (EOR) Production, 2024-2034 (Thousand Barrel/d, AGR%, CAGR%)
Table 61 Kazakhstan Thermal Enhanced Oil Recovery (EOR) Market Forecast, 2024-2034 (US$ Billion, AGR%, CAGR%)
Table 62 Kazakhstan Thermal Enhanced Oil Recovery (EOR) Production, 2024-2034 (Thousand Barrel/d, AGR%, CAGR%)
Table 63 Latin America Thermal Enhanced Oil Recovery (EOR) Market Forecast by Country, 2024-2034 (US$ Billion, AGR%, CAGR%)
Table 64 Latin America Thermal Enhanced Oil Recovery (EOR) Production by Country, 2024-2034 (Thousand Barrel/d, AGR%, CAGR%)
Table 65 Latin America Thermal Enhanced Oil Recovery (EOR) Market Forecast by Application, 2024-2034 (US$ Billion, AGR%, CAGR%)
Table 66 Latin America Thermal Enhanced Oil Recovery (EOR) Production by Application, 2024-2034 (Thousand Barrel/d, AGR%, CAGR%)
Table 67 Latin America Thermal Enhanced Oil Recovery (EOR) Market Forecast by Method, 2024-2034 (US$ Billion, AGR%, CAGR%)
Table 68 Latin America Thermal Enhanced Oil Recovery (EOR) Production by Method, 2024-2034 (Thousand Barrel/d, AGR%, CAGR%)
Table 69 Brazil Thermal Enhanced Oil Recovery (EOR) Market Forecast, 2024-2034 (US$ Billion, AGR%, CAGR%)
Table 70 Brazil Thermal Enhanced Oil Recovery (EOR) Production, 2024-2034 (Thousand Barrel/d, AGR%, CAGR%)
Table 71 Mexico Thermal Enhanced Oil Recovery (EOR) Market Forecast, 2024-2034 (US$ Billion, AGR%, CAGR%)
Table 72 Mexico Thermal Enhanced Oil Recovery (EOR) Production, 2024-2034 (Thousand Barrel/d, AGR%, CAGR%)
Table 73 Colombia Thermal Enhanced Oil Recovery (EOR) Market Forecast, 2024-2034 (US$ Billion, AGR%, CAGR%)
Table 74 Colombia Thermal Enhanced Oil Recovery (EOR) Production, 2024-2034 (Thousand Barrel/d, AGR%, CAGR%)
Table 75 Venezuela Thermal Enhanced Oil Recovery (EOR) Market Forecast, 2024-2034 (US$ Billion, AGR%, CAGR%)
Table 76 Venezuela Thermal Enhanced Oil Recovery (EOR) Production, 2024-2034 (Thousand Barrel/d, AGR%, CAGR%)
Table 77 Trinidad Thermal Enhanced Oil Recovery (EOR) Market Forecast, 2024-2034 (US$ Billion, AGR%, CAGR%)
Table 78 Trinidad Thermal Enhanced Oil Recovery (EOR) Production, 2024-2034 (Thousand Barrel/d, AGR%, CAGR%)
Table 79 Middle East & Africa Thermal Enhanced Oil Recovery (EOR) Market Forecast by Country, 2024-2034 (US$ Billion, AGR%, CAGR%)
Table 80 Middle East & Africa Thermal Enhanced Oil Recovery (EOR) Production by Country, 2024-2034 (Thousand Barrel/d, AGR%, CAGR%)
Table 81 Middle East & Africa Thermal Enhanced Oil Recovery (EOR) Market Forecast by Application, 2024-2034 (US$ Billion, AGR%, CAGR%)
Table 82 Middle East & Africa Thermal Enhanced Oil Recovery (EOR) Production by Application, 2024-2034 (Thousand Barrel/d, AGR%, CAGR%)
Table 83 Middle East & Africa Thermal Enhanced Oil Recovery (EOR) Market Forecast by Method, 2024-2034 (US$ Billion, AGR%, CAGR%)
Table 84 North America Thermal Enhanced Oil Recovery (EOR) Production by Method, 2024-2034 (Thousand Barrel/d, AGR%, CAGR%)
Table 85 Egypt Thermal Enhanced Oil Recovery (EOR) Market Forecast, 2024-2034 (US$ Billion, AGR%, CAGR%)
Table 86 Egypt Thermal Enhanced Oil Recovery (EOR) Production, 2024-2034 (Thousand Barrel/d, AGR%, CAGR%)
Table 87 Oman Thermal Enhanced Oil Recovery (EOR) Market Forecast, 2024-2034 (US$ Billion, AGR%, CAGR%)
Table 88 Oman Thermal Enhanced Oil Recovery (EOR) Production, 2024-2034 (Thousand Barrel/d, AGR%, CAGR%)
Table 89 Sudan Thermal Enhanced Oil Recovery (EOR) Market Forecast, 2024-2034 (US$ Billion, AGR%, CAGR%)
Table 90 Sudan Thermal Enhanced Oil Recovery (EOR) Production, 2024-2034 (Thousand Barrel/d, AGR%, CAGR%)
Table 91 Lockheed Martin: Key Details, (CEO, HQ, Revenue, Founded, No. of Employees, Company Type, Website, Business Segment)
Table 92 China National Petroleum Corporation: Product Benchmarking
Table 93 China National Petroleum Corporation: Strategic Outlook
Table 94 Lockheed Martin: Key Details, (CEO, HQ, Revenue, Founded, No. of Employees, Company Type, Website, Business Segment)
Table 95 China Petroleum & Chemical Corporation: Product Benchmarking
Table 96 China Petroleum & Chemical Corporation: Strategic Outlook
Table 97 Oil and Natural Gas Corporation: Key Details, (CEO, HQ, Revenue, Founded, No. of Employees, Company Type, Website, Business Segment)
Table 98 Oil and Natural Gas Corporation: Product Benchmarking
Table 99 Oil and Natural Gas Corporation: Strategic Outlook
Table 100 Chevron Corporation: Key Details, (CEO, HQ, Revenue, Founded, No. of Employees, Company Type, Website, Business Segment)
Table 101 Chevron Corporation: Product Benchmarking
Table 102 Chevron Corporation: Strategic Outlook
Table 103 Petrobras: Key Details, (CEO, HQ, Revenue, Founded, No. of Employees, Company Type, Website, Business Segment)
Table 104 Petrobras: Product Benchmarking
Table 105 Petrobras: Strategic Outlook
Table 106 Lockheed Martin: Key Details, (CEO, HQ, Revenue, Founded, No. of Employees, Company Type, Website, Business Segment)
Table 107 Ecopetrol: Product Benchmarking
Table 108 Ecopetrol: Strategic Outlook
Table 109 Pemex: Key Details, (CEO, HQ, Revenue, Founded, No. of Employees, Company Type, Website, Business Segment)
Table 110 Pemex: Product Benchmarking
Table 111 Pemex: Strategic Outlook
Table 112 Lockheed Martin: Key Details, (CEO, HQ, Revenue, Founded, No. of Employees, Company Type, Website, Business Segment)
Table 113 Petroleum Company of Trinidad and Tobago Limited: Product Benchmarking
Table 114 PDVSA: Key Details, (CEO, HQ, Revenue, Founded, No. of Employees, Company Type, Website, Business Segment)
Table 115 PDVSA - Petróleos de Venezuela: Product Benchmarking
Table 116 PDVSA - Petróleos de Venezuela: Strategic Outlook
Table 117 Lukoil: Key Details, (CEO, HQ, Revenue, Founded, No. of Employees, Company Type, Website, Business Segment)
Table 118 Lukoil: Product Benchmarking
Table 119 Lukoil: Strategic Outlook
Table 120 Wintershall Dea AG: Key Details, (CEO, HQ, Revenue, Founded, No. of Employees, Company Type, Website, Business Segment)
Table 121 Wintershall Dea AG: Product Benchmarking
Table 122 Wintershall Dea AG: Strategic Outlook
Table 123 Canadian Natural Resources Limited: Key Details, (CEO, HQ, Revenue, Founded, No. of Employees, Company Type, Website, Business Segment)
Table 124 Canadian Natural Resources Limited: Product Benchmarking
Table 125 Aera Energy: Key Details, (CEO, HQ, Revenue, Founded, No. of Employees, Company Type, Website, Business Segment)
Table 126 Aera Energy: Product Benchmarking
Table 127 Aera Energy: Strategic Outlook
Table 128 Lockheed Martin: Key Details, (CEO, HQ, Revenue, Founded, No. of Employees, Company Type, Website, Business Segment)
Table 129 Husky Energy: Product Benchmarking
Table 130 Husky Energy: Strategic Outlook
Table 131 Lockheed Martin: Key Details, (CEO, HQ, Revenue, Founded, No. of Employees, Company Type, Website, Business Segment)
Table 132 International Petroleum Corp: Product Benchmarking
図の一覧
Figure 1 Thermal Enhanced Oil Recovery (EOR) Market Segmentation
Figure 2 Thermal Enhanced Oil Recovery (EOR) Market by Application: Market Attractiveness Index
Figure 3 Thermal Enhanced Oil Recovery (EOR) Market by Method: Market Attractiveness Index
Figure 4 Thermal Enhanced Oil Recovery (EOR) Market Attractiveness Index by Region
Figure 5 Thermal Enhanced Oil Recovery (EOR) Market: Market Dynamics
Figure 6 Average Annual Brent Crude Oil Prices, 2015 – 2023 (U.S. dollars per barrel)
Figure 7 Global Oil Production, 2012 – 2022 (thousands of barrels per day)
Figure 8 Global Oil Consumption, 2012 – 2022 (thousands of barrels per day)
Figure 9 Global Electricity Generation, 2012 – 2022 (Terawatt-hours)
Figure 10 Thermal Enhanced Oil Recovery (EOR) Market by Region, 2024-2034 (US$ Billion, AGR %): “V” Shaped Recovery
Figure 11 Thermal Enhanced Oil Recovery (EOR) Market by Region, 2024-2034 (US$ Billion, AGR %): “U” Shaped Recovery
Figure 12 Thermal Enhanced Oil Recovery (EOR) Market by Region, 2024-2034 (US$ Billion, AGR %): “W” Shaped Recovery
Figure 13 Thermal Enhanced Oil Recovery (EOR) Market by Region, 2024-2034 (US$ Billion, AGR %): “L” Shaped Recovery
Figure 14 Thermal Enhanced Oil Recovery (EOR) Market: Porter’s Five Forces Analysis
Figure 15 Thermal Enhanced Oil Recovery (EOR) Market by Application: Market Attractiveness Index
Figure 16 Thermal Enhanced Oil Recovery (EOR) Market Forecast by Application, 2024-2034 (US$ Billion, AGR %)
Figure 17 Thermal Enhanced Oil Recovery (EOR) Market Share Forecast by Application, 2024, 2029, 2034 (%)
Figure 18 Thermal Enhanced Oil Recovery (EOR) Production Market by Application, 2024-2034 (Thousand Barrel/d, AGR %)
Figure 19 Onshore Segment Market Forecast by Region, 2024-2034 (US$ Billion, AGR %)
Figure 20 Onshore Segment Market Share Forecast by Region, 2024 & 2034 (%)
Figure 21 Onshore Thermal EOR Production by Region, 2024-2034 (Thousand Barrel/d, AGR %)
Figure 22 Offshore Segment Market Forecast by Region, 2024-2034 (US$ Billion, AGR %)
Figure 23 Offshore Segment Market Share Forecast by Region, 2024 & 2034 (%)
Figure 24 Offshore Thermal EOR Production by Region, 2024-2034 (Thousand Barrel/d, AGR %)
Figure 25 Thermal Enhanced Oil Recovery (EOR) Market by Method: Market Attractiveness Index
Figure 26 Thermal Enhanced Oil Recovery (EOR) Market Forecast by Method, 2024-2034 (US$ Billion, AGR %)
Figure 27 Thermal Enhanced Oil Recovery (EOR) Market Share Forecast by Method, 2024, 2029, 2034 (%)
Figure 28 Thermal Enhanced Oil Recovery (EOR) Production Market by Method, 2024-2034 (Thousand Barrel/d, AGR %)
Figure 29 Steam Flooding Segment Market Forecast by Region, 2024-2034 (US$ Billion, AGR %)
Figure 30 Steam Flooding Segment Market Share Forecast by Region, 2024 & 2034 (%)
Figure 31 Steam Flooding Thermal EOR Production by Region, 2024-2034 (Thousand Barrel/d, AGR %)
Figure 32 Cyclic Steam Stimulation (CSS) Segment Market Forecast by Region, 2024-2034 (US$ Billion, AGR %)
Figure 33 Cyclic Steam Stimulation (CSS) Segment Market Share Forecast by Region, 2024 & 2034 (%)
Figure 34 Cyclic Steam Stimulation (CSS) Thermal EOR Production by Region, 2024-2034 (Thousand Barrel/d, AGR %)
Figure 35 Hot Water Segment Market Forecast by Region, 2024-2034 (US$ Billion, AGR %)
Figure 36 Hot Water Segment Market Share Forecast by Region, 2024 & 2034 (%)
Figure 37 Hot Water Thermal EOR Production by Region, 2024-2034 (Thousand Barrel/d, AGR %)
Figure 38 In-situ Combustion Segment Market Forecast by Region, 2024-2034 (US$ Billion, AGR %)
Figure 39 In-situ Combustion Segment Market Share Forecast by Region, 2024 & 2034 (%)
Figure 40 In-situ Combustion Thermal EOR Production by Region, 2024-2034 (Thousand Barrel/d, AGR %)
Figure 41 Steam-Assisted Gravity Drainage (SAGD) Segment Market Forecast by Region, 2024-2034 (US$ Billion, AGR %)
Figure 42 Steam-Assisted Gravity Drainage (SAGD) Segment Market Share Forecast by Region, 2024 & 2034 (%)
Figure 43 Steam-Assisted Gravity Drainage (SAGD) Thermal EOR Production by Region, 2024-2034 (Thousand Barrel/d, AGR %)
Figure 44 Thermal Enhanced Oil Recovery (EOR) Market Forecast by Region 2024 and 2034 (US$ Billion, CAGR%)
Figure 45 Thermal Enhanced Oil Recovery (EOR) Market Share Forecast by Region 2024, 2029, 2034 (%)
Figure 46 Thermal Enhanced Oil Recovery (EOR) Market by Region, 2024-2034 (US$ Billion, AGR %)
Figure 47 Thermal Enhanced Oil Recovery (EOR) Market by Region, 2024-2034 (Thousand Barrel/d, AGR %)
Figure 48 North America Thermal Enhanced Oil Recovery (EOR) Market Attractiveness Index
Figure 49 North America Thermal Enhanced Oil Recovery (EOR) Market by Region, 2024, 2029 & 2034 (US$ Billion)
Figure 50 North America Thermal Enhanced Oil Recovery (EOR) Market by Region, 2024, 2029 & 2034 (Thousand Barrel/d)
Figure 51 North America Thermal Enhanced Oil Recovery (EOR) Market Forecast by Country, 2024-2034 (US$ Billion, AGR %)
Figure 52 North America Thermal Enhanced Oil Recovery (EOR) Market Share Forecast by Country, 2024 & 2034 (%)
Figure 53 North America Thermal Enhanced Oil Recovery (EOR) Market Forecast by Country, 2024-2034 (Thousand Barrel/d, AGR %)
Figure 54 North America Thermal Enhanced Oil Recovery (EOR) Market Forecast by Application, 2024-2034 (US$ Billion, AGR %)
Figure 55 North America Thermal Enhanced Oil Recovery (EOR) Market Share Forecast by Application, 2024 & 2034 (%)
Figure 56 North America Thermal Enhanced Oil Recovery (EOR) Production by Application, 2024-2034 (Thousand Barrel/d, AGR %)
Figure 57 North America Thermal Enhanced Oil Recovery (EOR) Market Forecast by Method, 2024-2034 (US$ Billion, AGR %)
Figure 58 North America Thermal Enhanced Oil Recovery (EOR) Market Share Forecast by Method, 2024 & 2034 (%)
Figure 59 North America Thermal Enhanced Oil Recovery (EOR) Production by Method, 2024-2034 (Thousand Barrel/d, AGR %)
Figure 60 U.S. Thermal Enhanced Oil Recovery (EOR) Market Forecast, 2024-2034 (US$ Billion, AGR %)
Figure 61 U.S. Thermal Enhanced Oil Recovery (EOR) Production, 2024-2034 (Thousand Barrel/d, AGR %)
Figure 62 Canada Thermal Enhanced Oil Recovery (EOR) Market Forecast, 2024-2034 (US$ Billion, AGR %)
Figure 63 Canada Thermal Enhanced Oil Recovery (EOR) Production, 2024-2034 (Thousand Barrel/d, AGR %)
Figure 64 Europe Thermal Enhanced Oil Recovery (EOR) Market Attractiveness Index
Figure 65 Europe Thermal Enhanced Oil Recovery (EOR) Market by Region, 2024, 2029 & 2034 (US$ Billion)
Figure 66 Europe Thermal Enhanced Oil Recovery (EOR) Market by Region, 2024, 2029 & 2034 (Thousand Barrel/d)
Figure 67 Europe Thermal Enhanced Oil Recovery (EOR) Market Forecast by Country, 2024-2034 (US$ Billion, AGR %)
Figure 68 Europe Thermal Enhanced Oil Recovery (EOR) Market Share Forecast by Country, 2024 & 2034 (%)
Figure 69 Europe Thermal Enhanced Oil Recovery (EOR) Market Forecast by Country, 2024-2034 (Thousand Barrel/d, AGR %)
Figure 70 Europe Thermal Enhanced Oil Recovery (EOR) Market Forecast by Application, 2024-2034 (US$ Billion, AGR %)
Figure 71 Europe Thermal Enhanced Oil Recovery (EOR) Market Share Forecast by Application, 2024 & 2034 (%)
Figure 72 Europe Thermal Enhanced Oil Recovery (EOR) Production by Application, 2024-2034 (Thousand Barrel/d, AGR %)
Figure 73 Europe Thermal Enhanced Oil Recovery (EOR) Market Forecast by Method, 2024-2034 (US$ Billion, AGR %)
Figure 74 Europe Thermal Enhanced Oil Recovery (EOR) Market Share Forecast by Method, 2024 & 2034 (%)
Figure 75 Europe Thermal Enhanced Oil Recovery (EOR) Production by Method, 2024-2034 (Thousand Barrel/d, AGR %)
Figure 76 Netherlands Thermal Enhanced Oil Recovery (EOR) Market Forecast, 2024-2034 (US$ Billion, AGR %)
Figure 77 Netherlands Thermal Enhanced Oil Recovery (EOR) Production, 2024-2034 (Thousand Barrel/d, AGR %)
Figure 78 Germany Thermal Enhanced Oil Recovery (EOR) Market Forecast, 2024-2034 (US$ Billion, AGR %)
Figure 79 Germany Thermal Enhanced Oil Recovery (EOR) Production, 2024-2034 (Thousand Barrel/d, AGR %)
Figure 80 Russia Thermal Enhanced Oil Recovery (EOR) Market Forecast, 2024-2034 (US$ Billion, AGR %)
Figure 81 Russia Thermal Enhanced Oil Recovery (EOR) Production, 2024-2034 (Thousand Barrel/d, AGR %)
Figure 82 Asia Pacific Thermal Enhanced Oil Recovery (EOR) Market Attractiveness Index
Figure 83 Asia Pacific Thermal Enhanced Oil Recovery (EOR) Market by Region, 2024, 2029 & 2034 (US$ Billion)
Figure 84 Asia Pacific Thermal Enhanced Oil Recovery (EOR) Market by Region, 2024, 2029 & 2034 (Thousand Barrel/d)
Figure 85 Asia Pacific Thermal Enhanced Oil Recovery (EOR) Market Forecast by Country, 2024-2034 (US$ Billion, AGR %)
Figure 86 Asia Pacific Thermal Enhanced Oil Recovery (EOR) Market Share Forecast by Country, 2024 & 2034 (%)
Figure 87 Asia Pacific Thermal Enhanced Oil Recovery (EOR) Market Forecast by Country, 2024-2034 (Thousand Barrel/d, AGR %)
Figure 88 Asia Pacific Thermal Enhanced Oil Recovery (EOR) Market Forecast by Application, 2024-2034 (US$ Billion, AGR %)
Figure 89 Asia Pacific Thermal Enhanced Oil Recovery (EOR) Market Share Forecast by Application, 2024 & 2034 (%)
Figure 90 Asia Pacific Thermal Enhanced Oil Recovery (EOR) Production by Application, 2024-2034 (Thousand Barrel/d, AGR %)
Figure 91 Asia Pacific Thermal Enhanced Oil Recovery (EOR) Market Forecast by Method, 2024-2034 (US$ Billion, AGR %)
Figure 92 Asia Pacific Thermal Enhanced Oil Recovery (EOR) Market Share Forecast by Method, 2024 & 2034 (%)
Figure 93 Asia Pacific Thermal Enhanced Oil Recovery (EOR) Production by Method, 2024-2034 (Thousand Barrel/d, AGR %)
Figure 94 China Thermal Enhanced Oil Recovery (EOR) Market Forecast, 2024-2034 (US$ Billion, AGR %)
Figure 95 China Thermal Enhanced Oil Recovery (EOR) Production, 2024-2034 (Thousand Barrel/d, AGR %)
Figure 96 India Thermal Enhanced Oil Recovery (EOR) Market Forecast, 2024-2034 (US$ Billion, AGR %)
Figure 97 India Thermal Enhanced Oil Recovery (EOR) Production, 2024-2034 (Thousand Barrel/d, AGR %)
Figure 98 Indonesia Thermal Enhanced Oil Recovery (EOR) Market Forecast, 2024-2034 (US$ Billion, AGR %)
Figure 99 Indonesia Thermal Enhanced Oil Recovery (EOR) Production, 2024-2034 (Thousand Barrel/d, AGR %)
Figure 100 Kazakhstan Thermal Enhanced Oil Recovery (EOR) Market Forecast, 2024-2034 (US$ Billion, AGR %)
Figure 101 Kazakhstan Thermal Enhanced Oil Recovery (EOR) Production, 2024-2034 (Thousand Barrel/d, AGR %)
Figure 102 Latin America Thermal Enhanced Oil Recovery (EOR) Market Attractiveness Index
Figure 103 Latin America Thermal Enhanced Oil Recovery (EOR) Market by Region, 2024, 2029 & 2034 (US$ Billion)
Figure 104 Latin America Thermal Enhanced Oil Recovery (EOR) Market by Region, 2024, 2029 & 2034 (Thousand Barrel/d)
Figure 105 Latin America Thermal Enhanced Oil Recovery (EOR) Market Forecast by Country, 2024-2034 (US$ Billion, AGR %)
Figure 106 Latin America Thermal Enhanced Oil Recovery (EOR) Market Share Forecast by Country, 2024 & 2034 (%)
Figure 107 Latin America Thermal Enhanced Oil Recovery (EOR) Market Forecast by Country, 2024-2034 (Thousand Barrel/d, AGR %)
Figure 108 Latin America Thermal Enhanced Oil Recovery (EOR) Market Forecast by Application, 2024-2034 (US$ Billion, AGR %)
Figure 109 Latin America Thermal Enhanced Oil Recovery (EOR) Market Share Forecast by Application, 2024 & 2034 (%)
Figure 110 Latin America Thermal Enhanced Oil Recovery (EOR) Production by Application, 2024-2034 (Thousand Barrel/d, AGR %)
Figure 111 Latin America Thermal Enhanced Oil Recovery (EOR) Market Forecast by Method, 2024-2034 (US$ Billion, AGR %)
Figure 112 Latin America Thermal Enhanced Oil Recovery (EOR) Market Share Forecast by Method, 2024 & 2034 (%)
Figure 113 Latin America Thermal Enhanced Oil Recovery (EOR) Production by Method, 2024-2034 (Thousand Barrel/d, AGR %)
Figure 114 Brazil Thermal Enhanced Oil Recovery (EOR) Market Forecast, 2024-2034 (US$ Billion, AGR %)
Figure 115 Brazil Thermal Enhanced Oil Recovery (EOR) Production, 2024-2034 (Thousand Barrel/d, AGR %)
Figure 116 Mexico Thermal Enhanced Oil Recovery (EOR) Market Forecast, 2024-2034 (US$ Billion, AGR %)
Figure 117 Mexico Thermal Enhanced Oil Recovery (EOR) Production, 2024-2034 (Thousand Barrel/d, AGR %)
Figure 118 Colombia Thermal Enhanced Oil Recovery (EOR) Market Forecast, 2024-2034 (US$ Billion, AGR %)
Figure 119 Colombia Thermal Enhanced Oil Recovery (EOR) Production, 2024-2034 (Thousand Barrel/d, AGR %)
Figure 120 Venezuela Thermal Enhanced Oil Recovery (EOR) Market Forecast, 2024-2034 (US$ Billion, AGR %)
Figure 121 Venezuela Thermal Enhanced Oil Recovery (EOR) Production, 2024-2034 (Thousand Barrel/d, AGR %)
Figure 122 Trinidad Thermal Enhanced Oil Recovery (EOR) Market Forecast, 2024-2034 (US$ Billion, AGR %)
Figure 123 Trinidad Thermal Enhanced Oil Recovery (EOR) Production, 2024-2034 (Thousand Barrel/d, AGR %)
Figure 124 Middle East & Africa Thermal Enhanced Oil Recovery (EOR) Market Attractiveness Index
Figure 125 Middle East & Africa Thermal Enhanced Oil Recovery (EOR) Market by Region, 2024, 2029 & 2034 (US$ Billion)
Figure 126 Middle East & Africa Thermal Enhanced Oil Recovery (EOR) Market by Region, 2024, 2029 & 2034 (Thousand Barrel/d)
Figure 127 Middle East & Africa Thermal Enhanced Oil Recovery (EOR) Market Forecast by Country, 2024-2034 (US$ Billion, AGR %)
Figure 128 Middle East & Africa Thermal Enhanced Oil Recovery (EOR) Market Share Forecast by Country, 2024 & 2034 (%)
Figure 129 Middle East & Africa Thermal Enhanced Oil Recovery (EOR) Market Forecast by Country, 2024-2034 (Thousand Barrel/d, AGR %)
Figure 130 Middle East & Africa Thermal Enhanced Oil Recovery (EOR) Market Forecast by Application, 2024-2034 (US$ Billion, AGR %)
Figure 131 Middle East & Africa Thermal Enhanced Oil Recovery (EOR) Market Share Forecast by Application, 2024 & 2034 (%)
Figure 132 Middle East & Africa Thermal Enhanced Oil Recovery (EOR) Production by Application, 2024-2034 (Thousand Barrel/d, AGR %)
Figure 133 Middle East & Africa Thermal Enhanced Oil Recovery (EOR) Market Forecast by Method, 2024-2034 (US$ Billion, AGR %)
Figure 134 Middle East & Africa Thermal Enhanced Oil Recovery (EOR) Market Share Forecast by Method, 2024 & 2034 (%)
Figure 135 North America Thermal Enhanced Oil Recovery (EOR) Production by Method, 2024-2034 (Thousand Barrel/d, AGR %)
Figure 136 Egypt Thermal Enhanced Oil Recovery (EOR) Market Forecast, 2024-2034 (US$ Billion, AGR %)
Figure 137 Egypt Thermal Enhanced Oil Recovery (EOR) Production, 2024-2034 (Thousand Barrel/d, AGR %)
Figure 138 Oman Thermal Enhanced Oil Recovery (EOR) Market Forecast, 2024-2034 (US$ Billion, AGR %)
Figure 139 Oman Thermal Enhanced Oil Recovery (EOR) Production, 2024-2034 (Thousand Barrel/d, AGR %)
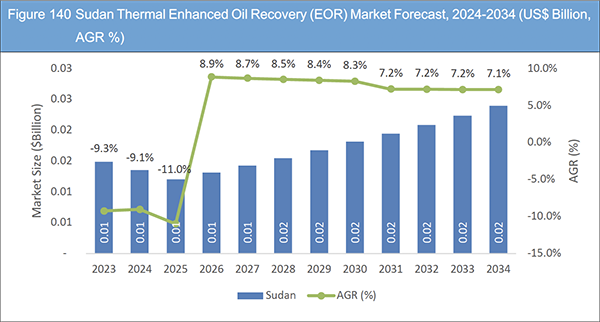
Figure 140 Sudan Thermal Enhanced Oil Recovery (EOR) Market Forecast, 2024-2034 (US$ Billion, AGR %)
Figure 141 Sudan Thermal Enhanced Oil Recovery (EOR) Production, 2024-2034 (Thousand Barrel/d, AGR %)
Figure 142 China National Petroleum Corporation: Net Revenue, 2018-2022 (US$ Billion, AGR%)
Figure 143 China National Petroleum Corporation: Net Revenue, 2018-2022 (US$ Billion, AGR%)
Figure 144 China National Petroleum Corporation: Regional Market Shares, 2022
Figure 145 China Petroleum & Chemical Corporation: Net Revenue, 2018-2022 (US$ Million, AGR%)
Figure 146 China Petroleum & Chemical Corporation: Segment Market Shares, 2022
Figure 147 Oil and Natural Gas Corporation: Net Revenue, 2018-2022 (US$ Billion, AGR%)
Figure 148 Oil and Natural Gas Corporation: Segment Market Shares, 2022
Figure 149 Chevron Corporation: Net Revenue, 2018-2022 (US$ Billion, AGR%)
Figure 150 Chevron Corporation: Regional Market Shares, 2022
Figure 151 Chevron Corporation: Segment Market Shares, 2022
Figure 152 Petrobras: Net Revenue, 2018-2022 (US$ Billion, AGR%)
Figure 153 Petrobras: Segment Market Shares, 2022
Figure 154 Ecopetrol: Net Revenue, 2018-2022 (US$ Billion, AGR%)
Figure 155 Ecopetrol: Segment Market Shares, 2022
Figure 156 Wintershall Dea AG: Net Revenue, 2018-2022 (US$ Billion, AGR%)
Figure 157 Wintershall Dea AG: Segment Market Shares, 2022
Figure 158 Canadian Natural Resources Limited: Net Revenue, 2018-2022 (US$ Billion, AGR%)
Figure 159 Canadian Natural Resources Limited: Segment Market Shares, 2022
Figure 160 International Petroleum Corp: Net Revenue, 2018-2022 (US$ Billion, AGR%)
Figure 161 International Petroleum Corp: Regional Market Shares, 2022
ページTOPに戻る
Summary
Report Details
The Thermal Enhanced Oil Recovery (EOR) Market Report 2024-2034: This report will prove invaluable to leading firms striving for new revenue pockets if they wish to better understand the industry and its underlying dynamics. It will be useful for companies that would like to expand into different industries or to expand their existing operations in a new region.
Growing Power Demand to Open New Avenues
One common thermal EOR method is steam injection. Steam is injected into the reservoir to heat the oil, reduce its viscosity, and improve its flow characteristics. This increased mobility allows for enhanced oil recovery. The power industry may be involved indirectly in supplying the necessary energy for steam generation, especially if the steam is generated using conventional methods like natural gas or coal-fired power plants. The power industry plays a crucial role in providing the energy required for thermal EOR processes. This energy can be in the form of electricity or heat, depending on the specific requirements of the EOR method being employed.
High Capital and Operational Costs Associated with Thermal EOR
Enhanced Oil Recovery (EOR) methods, including Thermal EOR, can indeed be associated with high capital and operational costs. Thermal EOR is a set of techniques used to extract additional oil from reservoirs by injecting heat into the reservoir to reduce the oil’s viscosity and improve its flow. Two common methods of thermal EOR are steam injection and in-situ combustion.
Implementing thermal EOR requires significant infrastructure development, including the installation of wellbores, steam generators, and surface facilities. These infrastructural investments contribute significantly to the initial capital costs. Steam injection involves the generation of high-pressure steam, typically produced using natural gas or other fuels. The costs associated with steam generation, including the purchase and maintenance of steam generators, can be substantial.
What Questions Should You Ask before Buying a Market Research Report?
-
How is the thermal enhanced oil recovery (EOR) market evolving?
-
What is driving and restraining the thermal enhanced oil recovery (EOR) market?
-
How will each thermal enhanced oil recovery (EOR) submarket segment grow over the forecast period and how much revenue will these submarkets account for in 2034?
-
How will the market shares for each thermal enhanced oil recovery (EOR) submarket develops from 2023 to 2034?
-
What will be the main driver for the overall market from 2024 to 2034?
-
Will leading thermal enhanced oil recovery (EOR) markets broadly follow the macroeconomic dynamics, or will individual national markets outperform others?
-
How will the market shares of the national markets change by 2034 and which geographical region will lead the market in 2034?
-
Who are the leading players and what are their prospects over the forecast period?
-
What are the thermal enhanced oil recovery (EOR) projects for these leading companies?
-
How will the industry evolve during the period between 2024 and 2034? What are the implications of thermal enhanced oil recovery (EOR) projects taking place now and over the next 10 years?
-
Is there a greater need for product commercialisation to further scale the thermal enhanced oil recovery (EOR) market?
-
Where is the thermal enhanced oil recovery (EOR) market heading and how can you ensure you are at the forefront of the market?
You need to discover how this will impact the thermal enhanced oil recovery (EOR) market today, and over the next 10 years:
-
Our 275-page report provides 132 tables and 160 charts/graphs exclusively to you.
-
The report highlights key lucrative areas in the industry so you can target them – NOW.
-
It contains in-depth analysis of global, regional and national sales and growth.
-
It highlights for you the key successful trends, changes and revenue projections made by your competitors.
This report tells you TODAY how the thermal enhanced oil recovery (EOR) market will develop in the next 10 years, and in line with the variations in COVID-19 economic recession and bounce. This market is more critical now than at any point over the last 10 years.
Forecasts to 2034 and other analyses reveal commercial prospects
-
In addition to revenue forecasting to 2034, our new study provides you with recent results, growth rates, and market shares.
-
You will find original analyses, with business outlooks and developments.
-
Discover qualitative analyses (including market dynamics, drivers, opportunities, restraints, and challenges), porters five forces analysis, PEST analysis, and recent developments.
Segments Covered in the Report (Market Size in Revenue and Volume)
Application Outlook
Method Outlook
-
Steam Flooding
-
Cyclic Steam Stimulation
-
Hot Water
-
In-situ Combustion
-
Steam-Assisted Gravity Drainage
In addition to the revenue predictions for the overall world market and segments, you will also find revenue forecasts for five regional and 17 leading national markets:
North America
Europe
-
Netherlands
-
Germany
-
Russia
Asia Pacific
-
China
-
India
-
Indonesia
-
Kazakhstan
Latin America
-
Brazil
-
Mexico
-
Colombia
-
Venezuela
-
Trinidad
Middle East & Africa
The report also includes profiles and for some of the leading companies in the Thermal Enhanced Oil Recovery (EOR) Market, 2024 to 2034, with a focus on this segment of these companies’ operations.
Leading companies and the potential for market growth
-
Aera Energy
-
Canadian Natural Resources
-
Chevron
-
China National Petroleum Corporation
-
Ecopetrol
-
Husky Energy
-
International Petroleum Corp.
-
Lukoil
-
ONGC
-
Pemex
-
Petrobras
-
Petróleos de Venezuela
-
Petrotrin
-
Sinopec
-
Wintershall Dea AG
Overall revenue for Thermal Enhanced Oil Recovery (EOR) Market, 2024 to 2034 in terms of value the market surpassed US$30 billion in 2023, our work calculates. We predict strong revenue growth through to 2033. Our work identifies which organisations hold the greatest potential. Discover their capabilities, progress, and commercial prospects, helping you stay ahead.
How will the Thermal Enhanced Oil Recovery (EOR) Market, 2024 to 2034 Market report help you?
In summary, our 270+ page report provides you with the following knowledge:
-
Revenue and volume forecasts to 2034 for Thermal Enhanced Oil Recovery (EOR) Market, 2024 to 2034 Market, with forecasts for application, method, and each forecast at a global, and regional level – discover the industry’s prospects, finding the most lucrative places for investments and revenues.
-
Revenue and volume forecasts to 2034 for five regional and 17 key national markets – See forecasts for the Thermal Enhanced Oil Recovery (EOR) Market, 2024 to 2034 market in North America, Europe, Asia-Pacific, Latin America, and Middle East & Africa. Also, market size estimation and forecast is provided for US, Canada, Mexico, Netherlands, Germany, Russia, China, India, Indonesia, and Oman among other prominent economies.
-
Prospects for established firms and those seeking to enter the market – including company profiles for 15 of the major companies involved in the Thermal Enhanced Oil Recovery (EOR) Market.
Find quantitative and qualitative analyses with independent predictions. Receive information that only our report contains, staying informed with invaluable business intelligence.
Information found nowhere else
With our new report, you are less likely to fall behind in knowledge or miss out on opportunities. See how our work could benefit your research, analyses, and decisions. Visiongain’s study is for everybody needing commercial analyses for the Thermal Enhanced Oil Recovery (EOR) Market, 2024 to 2034, market-leading companies. You will find data, trends and predictions.
ページTOPに戻る
Table of Contents
Table of Contents
1 Report Overview
1.1 Objectives of the Study
1.2 Introduction to Thermal Enhanced Oil Recovery (EOR) Market
1.3 What This Report Delivers
1.4 Why You Should Read This Report
1.5 Key Questions Answered by This Analytical Report
1.6 Who is This Report for?
1.7 Methodology
1.7.1 Market Definitions
1.7.2 Market Evaluation & Forecasting Methodology
1.7.3 Data Validation
1.7.3.1 Primary Research
1.7.3.2 Secondary Research
1.8 Frequently Asked Questions (FAQs)
1.9 Associated Visiongain Reports
1.10 About Visiongain
2 Executive Summary
3 Market Overview
3.1 Key Findings
3.2 Market Dynamics
3.2.1 Market Driving Factors
3.2.1.1 High Crude Oil Prices to Drive Thermal EOR Market
3.2.1.2 Growing Oil Exploration and Production Activities all around the World
3.2.2 Market Restraining Factors
3.2.2.1 High Capital and Operational Costs Associated with Thermal EOR
3.2.2.2 Challenges Associated with Thermal EOR Industry
3.2.3 Market Opportunities
3.2.3.1 Increasing Oil Demand in Developed as well as Developing Economies
3.2.3.2 Growing Power Demand Globally to Open New Opportunities
3.3 COVID-19 Impact Analysis
3.4 Porter’s Five Forces Analysis
3.4.1 Bargaining Power of Suppliers (Moderate – High)
3.4.2 Bargaining Power of Buyers (Moderate)
3.4.3 Competitive Rivalry (High)
3.4.4 Threat from Substitutes (Low)
3.4.5 Threat of New Entrants (Low)
4 Thermal Enhanced Oil Recovery (EOR) Market Analysis by Application
4.1 Key Findings
4.2 Application Segment: Market Attractiveness Index
4.3 Thermal Enhanced Oil Recovery (EOR) Market Size Estimation and Forecast by Application
4.4 Thermal Enhanced Oil Recovery (EOR) Production Estimation and Forecast by Application
4.5 Onshore
4.5.1 Market Size by Region, 2024-2034 (US$ Billion)
4.5.2 Market Share by Region, 2024 & 2034 (%)
4.5.3 Production by Region, 2024-2034 (Thousand Barrel/d)
4.6 Offshore
4.6.1 Market Size by Region, 2024-2034 (US$ Billion)
4.6.2 Market Share by Region, 2024 & 2034 (%)
4.6.3 Production by Region, 2024-2034 (Thousand Barrel/d)
5 Thermal Enhanced Oil Recovery (EOR) Market Analysis by Method
5.1 Key Findings
5.2 Method Segment: Market Attractiveness Index
5.3 Thermal Enhanced Oil Recovery (EOR) Market Size Estimation and Forecast by Method
5.4 Thermal Enhanced Oil Recovery (EOR) Production Estimation and Forecast by Method
5.5 Steam Flooding
5.5.1 Advantages of Steam Flooding EOR
5.5.2 Challenges and Limitations of Steam Flooding
5.5.3 Market Size by Region, 2024-2034 (US$ Billion)
5.5.4 Market Share by Region, 2024 & 2034 (%)
5.5.5 Production by Region, 2024-2034 (Thousand Barrel/d)
5.6 Cyclic Steam Stimulation (CSS)
5.6.1 Benefits and Challenges of CSS Method
5.6.2 Market Size by Region, 2024-2034 (US$ Billion)
5.6.3 Market Share by Region, 2024 & 2034 (%)
5.6.4 Production by Region, 2024-2034 (Thousand Barrel/d)
5.7 Hot Water
5.7.1 Market Size by Region, 2024-2034 (US$ Billion)
5.7.2 Market Share by Region, 2024 & 2034 (%)
5.7.3 Production by Region, 2024-2034 (Thousand Barrel/d)
5.8 In-situ Combustion
5.8.1 Advantages and Challenges of In-situ Combustion
5.8.2 Market Size by Region, 2024-2034 (US$ Billion)
5.8.3 Market Share by Region, 2024 & 2034 (%)
5.8.4 Production by Region, 2024-2034 (Thousand Barrel/d)
5.9 Steam-Assisted Gravity Drainage (SAGD)
5.9.1 Working of Steam-Assisted Gravity Drainage (SAGD)
5.9.2 Advantages and Limitations for SAGD Methods
5.9.3 Significance of SAGD in Reducing Steam-Oil Ratios
5.9.4 Market Size by Region, 2024-2034 (US$ Billion)
5.9.5 Market Share by Region, 2024 & 2034 (%)
5.9.6 Production by Region, 2024-2034 (Thousand Barrel/d)
6 Thermal Enhanced Oil Recovery (EOR) Market Analysis by Region
6.1 Key Findings
6.2 Regional Market Size Estimation and Forecast
7 North America Thermal Enhanced Oil Recovery (EOR) Market Analysis
7.1 Key Findings
7.2 North America Thermal Enhanced Oil Recovery (EOR) Market Attractiveness Index
7.3 North America Thermal Enhanced Oil Recovery (EOR) Market by Country, 2024, 2029, and 2034 (US$ Billion)
7.4 North America Thermal Enhanced Oil Recovery (EOR) Production by Country, 2024, 2029, and 2034 (Thousand Barrel/d)
7.5 North America Thermal Enhanced Oil Recovery (EOR) Market Size Estimation and Forecast by Country
7.6 North America Thermal Enhanced Oil Recovery (EOR) Market Size Estimation and Forecast by Application
7.7 North America Thermal Enhanced Oil Recovery (EOR) Market Size Estimation and Forecast by Method
7.8 U.S. Thermal Enhanced Oil Recovery (EOR) Market Analysis
7.8.1 U.S. Oil and Natural Gas Industry
7.9 Canada Thermal Enhanced Oil Recovery (EOR) Market Analysis
7.9.1 Bitumen Production Hits a Record High in Canada
8 Europe Thermal Enhanced Oil Recovery (EOR) Market Analysis
8.1 Key Findings
8.2 Europe Thermal Enhanced Oil Recovery (EOR) Market Attractiveness Index
8.3 Europe Thermal Enhanced Oil Recovery (EOR) Market by Country, 2024, 2029, and 2034 (US$ Billion)
8.4 Europe Thermal Enhanced Oil Recovery (EOR) Production by Country, 2024, 2029, and 2034 (Thousand Barrel/d)
8.5 Europe Thermal Enhanced Oil Recovery (EOR) Market Size Estimation and Forecast by Country
8.6 Europe Thermal Enhanced Oil Recovery (EOR) Market Size Estimation and Forecast by Application
8.7 Europe Thermal Enhanced Oil Recovery (EOR) Market Size Estimation and Forecast by Method
8.8 Netherlands Thermal Enhanced Oil Recovery (EOR) Market Analysis
8.9 Germany Thermal Enhanced Oil Recovery (EOR) Market Analysis
8.10 Russia Thermal Enhanced Oil Recovery (EOR) Market Analysis
9 Asia Pacific Thermal Enhanced Oil Recovery (EOR) Market Analysis
9.1 Key Findings
9.2 Asia Pacific Thermal Enhanced Oil Recovery (EOR) Market Attractiveness Index
9.3 Asia Pacific Thermal Enhanced Oil Recovery (EOR) Market by Country, 2024, 2029, and 2034 (US$ Billion)
9.4 Asia Pacific Thermal Enhanced Oil Recovery (EOR) Production by Country, 2024, 2029, and 2034 (Thousand Barrel/d)
9.5 Asia Pacific Thermal Enhanced Oil Recovery (EOR) Market Size Estimation and Forecast by Country
9.6 Asia Pacific Thermal Enhanced Oil Recovery (EOR) Market Size Estimation and Forecast by Application
9.7 Asia Pacific Thermal Enhanced Oil Recovery (EOR) Market Size Estimation and Forecast by Method
9.8 China Thermal Enhanced Oil Recovery (EOR) Market Analysis
9.9 India Thermal Enhanced Oil Recovery (EOR) Market Analysis
9.10 Indonesia Thermal Enhanced Oil Recovery (EOR) Market Analysis
9.10.1 Indonesian Regulator SKK Migas Approves Rantaubais EOR Project Phase 1
9.11 Kazakhstan Thermal Enhanced Oil Recovery (EOR) Market Analysis
10 Latin America Thermal Enhanced Oil Recovery (EOR) Market Analysis
10.1 Key Findings
10.2 Latin America Thermal Enhanced Oil Recovery (EOR) Market Attractiveness Index
10.3 Latin America Thermal Enhanced Oil Recovery (EOR) Market by Country, 2024, 2029, and 2034 (US$ Billion)
10.4 Latin America Thermal Enhanced Oil Recovery (EOR) Production by Country, 2024, 2029, and 2034 (Thousand Barrel/d)
10.5 Latin America Thermal Enhanced Oil Recovery (EOR) Market Size Estimation and Forecast by Country
10.6 Latin America Thermal Enhanced Oil Recovery (EOR) Market Size Estimation and Forecast by Application
10.7 Latin America Thermal Enhanced Oil Recovery (EOR) Market Size Estimation and Forecast by Method
10.8 Brazil Thermal Enhanced Oil Recovery (EOR) Market Analysis
10.9 Mexico Thermal Enhanced Oil Recovery (EOR) Market Analysis
10.10 Colombia Thermal Enhanced Oil Recovery (EOR) Market Analysis
10.11 Venezuela Thermal Enhanced Oil Recovery (EOR) Market Analysis
10.12 Trinidad Thermal Enhanced Oil Recovery (EOR) Market Analysis
11 Middle East & Africa Thermal Enhanced Oil Recovery (EOR) Market Analysis
11.1 Key Findings
11.2 Middle East & Africa Thermal Enhanced Oil Recovery (EOR) Market Attractiveness Index
11.3 Middle East & Africa Thermal Enhanced Oil Recovery (EOR) Market by Country, 2024, 2029, and 2034 (US$ Billion)
11.4 Middle East & Africa Thermal Enhanced Oil Recovery (EOR) Production by Country, 2024, 2029, and 2034 (Thousand Barrel/d)
11.5 Middle East & Africa Thermal Enhanced Oil Recovery (EOR) Market Size Estimation and Forecast by Country
11.6 Middle East & Africa Thermal Enhanced Oil Recovery (EOR) Market Size Estimation and Forecast by Application
11.7 Middle East & Africa Thermal Enhanced Oil Recovery (EOR) Market Size Estimation and Forecast by Method
11.8 Egypt Thermal Enhanced Oil Recovery (EOR) Market Analysis
11.9 Oman Thermal Enhanced Oil Recovery (EOR) Market Analysis
11.9.1 Oman to Get 2 GWth Solar Steam Plant for Enhanced Oil Recovery
11.10 Sudan Thermal Enhanced Oil Recovery (EOR) Market Analysis
12 Company Profiles
12.1 Company Market Share
12.2 China National Petroleum Corporation
12.2.1 Company Snapshot
12.2.2 Company Overview
12.2.3 Financial Analysis
12.2.3.1 Net Revenue, 2018-2022
12.2.3.2 Regional Market Shares, 2022
12.2.4 Product Benchmarking
12.2.5 Strategic Outlook
12.3 China Petroleum & Chemical Corporation
12.3.1 Company Snapshot
12.3.2 Company Overview
12.3.3 Financial Analysis
12.3.3.1 Net Revenue, 2018-2022
12.3.3.2 Segment Market Shares, 2022
12.3.4 Product Benchmarking
12.3.5 Strategic Outlook
12.4 Oil and Natural Gas Corporation
12.4.1 Company Snapshot
12.4.2 Company Overview
12.4.3 Financial Analysis
12.4.3.1 Net Revenue, 2018-2022
12.4.3.2 Segment Market Shares, 2022
12.4.4 Product Benchmarking
12.4.5 Strategic Outlook
12.5 Chevron Corporation
12.5.1 Company Snapshot
12.5.2 Company Overview
12.5.3 Financial Analysis
12.5.3.1 Net Revenue, 2018-2022
12.5.3.2 Regional Market Shares, 2022
12.5.3.3 Segment Market Shares, 2022
12.5.4 Product Benchmarking
12.5.5 Strategic Outlook
12.6 Petrobras
12.6.1 Company Snapshot
12.6.2 Company Overview
12.6.3 Financial Analysis
12.6.3.1 Net Revenue, 2018-2022
12.6.3.2 Segment Market Shares, 2022
12.6.4 Product Benchmarking
12.6.5 Strategic Outlook
12.7 Ecopetrol
12.7.1 Company Snapshot
12.7.2 Company Overview
12.7.3 Financial Analysis
12.7.3.1 Net Revenue, 2018-2022
12.7.3.2 Segment Market Shares, 2022
12.7.4 Product Benchmarking
12.7.5 Strategic Outlook
12.8 Pemex
12.8.1 Company Snapshot
12.8.2 Company Overview
12.8.3 Product Benchmarking
12.8.4 Strategic Outlook
12.9 Petroleum Company of Trinidad and Tobago Limited
12.9.1 Company Snapshot
12.9.2 Company Overview
12.9.3 Product Benchmarking
12.10 PDVSA - Petróleos de Venezuela
12.10.1 Company Snapshot
12.10.2 Company Overview
12.10.3 Product Benchmarking
12.10.4 Strategic Outlook
12.11 Lukoil
12.11.1 Company Snapshot
12.11.2 Company Overview
12.11.3 Product Benchmarking
12.11.4 Strategic Outlook
12.12 Wintershall Dea AG
12.12.1 Company Snapshot
12.12.2 Company Overview
12.12.3 Financial Analysis
12.12.3.1 Net Revenue, 2018-2022
12.12.3.2 Segment Market Shares, 2022
12.12.4 Product Benchmarking
12.12.5 Strategic Outlook
12.13 Canadian Natural Resources Limited
12.13.1 Company Snapshot
12.13.2 Company Overview
12.13.3 Financial Analysis
12.13.3.1 Net Revenue, 2018-2022
12.13.3.2 Segment Market Shares, 2022
12.13.4 Product Benchmarking
12.14 Aera Energy
12.14.1 Company Snapshot
12.14.2 Company Overview
12.14.3 Product Benchmarking
12.14.4 Strategic Outlook
12.15 Husky Energy
12.15.1 Company Snapshot
12.15.2 Company Overview
12.15.3 Product Benchmarking
12.15.4 Strategic Outlook
12.16 International Petroleum Corp
12.16.1 Company Snapshot
12.16.2 Company Overview
12.16.3 Financial Analysis
12.16.3.1 Net Revenue, 2018-2022
12.16.3.2 Regional Market Shares, 2022
12.16.4 Product Benchmarking
13 Conclusion and Recommendations
13.1 Concluding Remarks from Visiongain
13.2 Recommendations
ページTOPに戻る
List of Tables/Graphs
List of Tables
Table 1 Thermal Enhanced Oil Recovery (EOR) Market Snapshot, 2024 & 2034 (Thousand Barrel/d, CAGR %)
Table 2 Thermal Enhanced Oil Recovery (EOR) Market Snapshot, 2024 & 2034 (US$ Billion, CAGR %)
Table 3 Thermal Enhanced Oil Recovery (EOR) Market Forecast by Region, 2024-2034 (US$ Billion, AGR%, CAGR%): “V” Shaped Recovery
Table 4 Thermal Enhanced Oil Recovery (EOR) Market Forecast by Region, 2024-2034 (US$ Billion, AGR%, CAGR%): “U” Shaped Recovery
Table 5 Thermal Enhanced Oil Recovery (EOR) Market Forecast by Region, 2024-2034 (US$ Billion, AGR%, CAGR%): “W” Shaped Recovery
Table 6 Thermal Enhanced Oil Recovery (EOR) Market Forecast by Region, 2024-2034 (US$ Billion, AGR%, CAGR%): “L” Shaped Recovery
Table 7 Thermal Enhanced Oil Recovery (EOR) Market Forecast by Application, 2024-2034 (US$ Billion, AGR%, CAGR%)
Table 8 Thermal Enhanced Oil Recovery (EOR) Production by Application, 2024-2034 (Thousand Barrel/d, AGR%, CAGR%)
Table 9 Onshore Segment Market Forecast by Region, 2024-2034 (US$ Billion, AGR%, CAGR%)
Table 10 Onshore Thermal EOR Production by Region, 2024-2034 (Thousand Barrel/d, AGR%, CAGR%)
Table 11 Offshore Segment Market Forecast by Region, 2024-2034 (US$ Billion, AGR%, CAGR%)
Table 12 Offshore Thermal EOR Production by Region, 2024-2034 (Thousand Barrel/d, AGR%, CAGR%)
Table 13 Thermal Enhanced Oil Recovery (EOR) Market Forecast by Method, 2024-2034 (US$ Billion, AGR%, CAGR%)
Table 14 Thermal Enhanced Oil Recovery (EOR) Production by Method, 2024-2034 (Thousand Barrel/d, AGR%, CAGR%)
Table 15 Steam Flooding Segment Market Forecast by Region, 2024-2034 (US$ Billion, AGR%, CAGR%)
Table 16 Steam Flooding Thermal EOR Production by Region, 2024-2034 (Thousand Barrel/d, AGR%, CAGR%)
Table 17 Cyclic Steam Stimulation (CSS) Segment Market Forecast by Region, 2024-2034 (US$ Billion, AGR%, CAGR%)
Table 18 Cyclic Steam Stimulation (CSS) Thermal EOR Production by Region, 2024-2034 (Thousand Barrel/d, AGR%, CAGR%)
Table 19 Hot Water Segment Market Forecast by Region, 2024-2034 (US$ Billion, AGR%, CAGR%)
Table 20 Hot Water Thermal EOR Production by Region, 2024-2034 (Thousand Barrel/d, AGR%, CAGR%)
Table 21 In-situ Combustion Segment Market Forecast by Region, 2024-2034 (US$ Billion, AGR%, CAGR%)
Table 22 In-situ Combustion Thermal EOR Production by Region, 2024-2034 (Thousand Barrel/d, AGR%, CAGR%)
Table 23 Steam-Assisted Gravity Drainage (SAGD) Segment Market Forecast by Region, 2024-2034 (US$ Billion, AGR%, CAGR%)
Table 24 Steam-Assisted Gravity Drainage (SAGD) Thermal EOR Production by Region, 2024-2034 (Thousand Barrel/d, AGR%, CAGR%)
Table 25 Thermal Enhanced Oil Recovery (EOR) Market Forecast by Region, 2024-2034 (US$ Billion, AGR%, CAGR%)
Table 26 Thermal Enhanced Oil Recovery (EOR) Market Forecast by Region, 2024-2034 (Thousand Barrel/d, AGR%, CAGR%)
Table 27 North America Thermal Enhanced Oil Recovery (EOR) Market Forecast by Country, 2024-2034 (US$ Billion, AGR%, CAGR%)
Table 28 North America Thermal Enhanced Oil Recovery (EOR) Production by Country, 2024-2034 (Thousand Barrel/d, AGR%, CAGR%)
Table 29 North America Thermal Enhanced Oil Recovery (EOR) Market Forecast by Application, 2024-2034 (US$ Billion, AGR%, CAGR%)
Table 30 North America Thermal Enhanced Oil Recovery (EOR) Production by Application, 2024-2034 (Thousand Barrel/d, AGR%, CAGR%)
Table 31 North America Thermal Enhanced Oil Recovery (EOR) Market Forecast by Method, 2024-2034 (US$ Billion, AGR%, CAGR%)
Table 32 North America Thermal Enhanced Oil Recovery (EOR) Production by Method, 2024-2034 (Thousand Barrel/d, AGR%, CAGR%)
Table 33 U.S. Thermal Enhanced Oil Recovery (EOR) Market Forecast, 2024-2034 (US$ Billion, AGR%, CAGR%)
Table 34 U.S. Thermal Enhanced Oil Recovery (EOR) Production, 2024-2034 (Thousand Barrel/d, AGR%, CAGR%)
Table 35 Canada Thermal Enhanced Oil Recovery (EOR) Market Forecast, 2024-2034 (US$ Billion, AGR%, CAGR%)
Table 36 Canada Thermal Enhanced Oil Recovery (EOR) Production, 2024-2034 (Thousand Barrel/d, AGR%, CAGR%)
Table 37 Europe Thermal Enhanced Oil Recovery (EOR) Market Forecast by Country, 2024-2034 (US$ Billion, AGR%, CAGR%)
Table 38 Europe Thermal Enhanced Oil Recovery (EOR) Production by Country, 2024-2034 (Thousand Barrel/d, AGR%, CAGR%)
Table 39 Europe Thermal Enhanced Oil Recovery (EOR) Market Forecast by Application, 2024-2034 (US$ Billion, AGR%, CAGR%)
Table 40 Europe Thermal Enhanced Oil Recovery (EOR) Production by Application, 2024-2034 (Thousand Barrel/d, AGR%, CAGR%)
Table 41 Europe Thermal Enhanced Oil Recovery (EOR) Market Forecast by Method, 2024-2034 (US$ Billion, AGR%, CAGR%)
Table 42 Europe Thermal Enhanced Oil Recovery (EOR) Production by Method, 2024-2034 (Thousand Barrel/d, AGR%, CAGR%)
Table 43 Netherlands Thermal Enhanced Oil Recovery (EOR) Market Forecast, 2024-2034 (US$ Billion, AGR%, CAGR%)
Table 44 Netherlands Thermal Enhanced Oil Recovery (EOR) Production, 2024-2034 (Thousand Barrel/d, AGR%, CAGR%)
Table 45 Germany Thermal Enhanced Oil Recovery (EOR) Market Forecast, 2024-2034 (US$ Billion, AGR%, CAGR%)
Table 46 Germany Thermal Enhanced Oil Recovery (EOR) Production, 2024-2034 (Thousand Barrel/d, AGR%, CAGR%)
Table 47 Russia Thermal Enhanced Oil Recovery (EOR) Market Forecast, 2024-2034 (US$ Billion, AGR%, CAGR%)
Table 48 Russia Thermal Enhanced Oil Recovery (EOR) Production, 2024-2034 (Thousand Barrel/d, AGR%, CAGR%)
Table 49 Asia Pacific Thermal Enhanced Oil Recovery (EOR) Market Forecast by Country, 2024-2034 (US$ Billion, AGR%, CAGR%)
Table 50 Asia Pacific Thermal Enhanced Oil Recovery (EOR) Production by Country, 2024-2034 (Thousand Barrel/d, AGR%, CAGR%)
Table 51 Asia Pacific Thermal Enhanced Oil Recovery (EOR) Market Forecast by Application, 2024-2034 (US$ Billion, AGR%, CAGR%)
Table 52 Asia Pacific Thermal Enhanced Oil Recovery (EOR) Production by Application, 2024-2034 (Thousand Barrel/d, AGR%, CAGR%)
Table 53 Asia Pacific Thermal Enhanced Oil Recovery (EOR) Market Forecast by Method, 2024-2034 (US$ Billion, AGR%, CAGR%)
Table 54 Asia Pacific Thermal Enhanced Oil Recovery (EOR) Production by Method, 2024-2034 (Thousand Barrel/d, AGR%, CAGR%)
Table 55 China Thermal Enhanced Oil Recovery (EOR) Market Forecast, 2024-2034 (US$ Billion, AGR%, CAGR%)
Table 56 China Thermal Enhanced Oil Recovery (EOR) Production, 2024-2034 (Thousand Barrel/d, AGR%, CAGR%)
Table 57 India Thermal Enhanced Oil Recovery (EOR) Market Forecast, 2024-2034 (US$ Billion, AGR%, CAGR%)
Table 58 India Thermal Enhanced Oil Recovery (EOR) Production, 2024-2034 (Thousand Barrel/d, AGR%, CAGR%)
Table 59 Indonesia Thermal Enhanced Oil Recovery (EOR) Market Forecast, 2024-2034 (US$ Billion, AGR%, CAGR%)
Table 60 Indonesia Thermal Enhanced Oil Recovery (EOR) Production, 2024-2034 (Thousand Barrel/d, AGR%, CAGR%)
Table 61 Kazakhstan Thermal Enhanced Oil Recovery (EOR) Market Forecast, 2024-2034 (US$ Billion, AGR%, CAGR%)
Table 62 Kazakhstan Thermal Enhanced Oil Recovery (EOR) Production, 2024-2034 (Thousand Barrel/d, AGR%, CAGR%)
Table 63 Latin America Thermal Enhanced Oil Recovery (EOR) Market Forecast by Country, 2024-2034 (US$ Billion, AGR%, CAGR%)
Table 64 Latin America Thermal Enhanced Oil Recovery (EOR) Production by Country, 2024-2034 (Thousand Barrel/d, AGR%, CAGR%)
Table 65 Latin America Thermal Enhanced Oil Recovery (EOR) Market Forecast by Application, 2024-2034 (US$ Billion, AGR%, CAGR%)
Table 66 Latin America Thermal Enhanced Oil Recovery (EOR) Production by Application, 2024-2034 (Thousand Barrel/d, AGR%, CAGR%)
Table 67 Latin America Thermal Enhanced Oil Recovery (EOR) Market Forecast by Method, 2024-2034 (US$ Billion, AGR%, CAGR%)
Table 68 Latin America Thermal Enhanced Oil Recovery (EOR) Production by Method, 2024-2034 (Thousand Barrel/d, AGR%, CAGR%)
Table 69 Brazil Thermal Enhanced Oil Recovery (EOR) Market Forecast, 2024-2034 (US$ Billion, AGR%, CAGR%)
Table 70 Brazil Thermal Enhanced Oil Recovery (EOR) Production, 2024-2034 (Thousand Barrel/d, AGR%, CAGR%)
Table 71 Mexico Thermal Enhanced Oil Recovery (EOR) Market Forecast, 2024-2034 (US$ Billion, AGR%, CAGR%)
Table 72 Mexico Thermal Enhanced Oil Recovery (EOR) Production, 2024-2034 (Thousand Barrel/d, AGR%, CAGR%)
Table 73 Colombia Thermal Enhanced Oil Recovery (EOR) Market Forecast, 2024-2034 (US$ Billion, AGR%, CAGR%)
Table 74 Colombia Thermal Enhanced Oil Recovery (EOR) Production, 2024-2034 (Thousand Barrel/d, AGR%, CAGR%)
Table 75 Venezuela Thermal Enhanced Oil Recovery (EOR) Market Forecast, 2024-2034 (US$ Billion, AGR%, CAGR%)
Table 76 Venezuela Thermal Enhanced Oil Recovery (EOR) Production, 2024-2034 (Thousand Barrel/d, AGR%, CAGR%)
Table 77 Trinidad Thermal Enhanced Oil Recovery (EOR) Market Forecast, 2024-2034 (US$ Billion, AGR%, CAGR%)
Table 78 Trinidad Thermal Enhanced Oil Recovery (EOR) Production, 2024-2034 (Thousand Barrel/d, AGR%, CAGR%)
Table 79 Middle East & Africa Thermal Enhanced Oil Recovery (EOR) Market Forecast by Country, 2024-2034 (US$ Billion, AGR%, CAGR%)
Table 80 Middle East & Africa Thermal Enhanced Oil Recovery (EOR) Production by Country, 2024-2034 (Thousand Barrel/d, AGR%, CAGR%)
Table 81 Middle East & Africa Thermal Enhanced Oil Recovery (EOR) Market Forecast by Application, 2024-2034 (US$ Billion, AGR%, CAGR%)
Table 82 Middle East & Africa Thermal Enhanced Oil Recovery (EOR) Production by Application, 2024-2034 (Thousand Barrel/d, AGR%, CAGR%)
Table 83 Middle East & Africa Thermal Enhanced Oil Recovery (EOR) Market Forecast by Method, 2024-2034 (US$ Billion, AGR%, CAGR%)
Table 84 North America Thermal Enhanced Oil Recovery (EOR) Production by Method, 2024-2034 (Thousand Barrel/d, AGR%, CAGR%)
Table 85 Egypt Thermal Enhanced Oil Recovery (EOR) Market Forecast, 2024-2034 (US$ Billion, AGR%, CAGR%)
Table 86 Egypt Thermal Enhanced Oil Recovery (EOR) Production, 2024-2034 (Thousand Barrel/d, AGR%, CAGR%)
Table 87 Oman Thermal Enhanced Oil Recovery (EOR) Market Forecast, 2024-2034 (US$ Billion, AGR%, CAGR%)
Table 88 Oman Thermal Enhanced Oil Recovery (EOR) Production, 2024-2034 (Thousand Barrel/d, AGR%, CAGR%)
Table 89 Sudan Thermal Enhanced Oil Recovery (EOR) Market Forecast, 2024-2034 (US$ Billion, AGR%, CAGR%)
Table 90 Sudan Thermal Enhanced Oil Recovery (EOR) Production, 2024-2034 (Thousand Barrel/d, AGR%, CAGR%)
Table 91 Lockheed Martin: Key Details, (CEO, HQ, Revenue, Founded, No. of Employees, Company Type, Website, Business Segment)
Table 92 China National Petroleum Corporation: Product Benchmarking
Table 93 China National Petroleum Corporation: Strategic Outlook
Table 94 Lockheed Martin: Key Details, (CEO, HQ, Revenue, Founded, No. of Employees, Company Type, Website, Business Segment)
Table 95 China Petroleum & Chemical Corporation: Product Benchmarking
Table 96 China Petroleum & Chemical Corporation: Strategic Outlook
Table 97 Oil and Natural Gas Corporation: Key Details, (CEO, HQ, Revenue, Founded, No. of Employees, Company Type, Website, Business Segment)
Table 98 Oil and Natural Gas Corporation: Product Benchmarking
Table 99 Oil and Natural Gas Corporation: Strategic Outlook
Table 100 Chevron Corporation: Key Details, (CEO, HQ, Revenue, Founded, No. of Employees, Company Type, Website, Business Segment)
Table 101 Chevron Corporation: Product Benchmarking
Table 102 Chevron Corporation: Strategic Outlook
Table 103 Petrobras: Key Details, (CEO, HQ, Revenue, Founded, No. of Employees, Company Type, Website, Business Segment)
Table 104 Petrobras: Product Benchmarking
Table 105 Petrobras: Strategic Outlook
Table 106 Lockheed Martin: Key Details, (CEO, HQ, Revenue, Founded, No. of Employees, Company Type, Website, Business Segment)
Table 107 Ecopetrol: Product Benchmarking
Table 108 Ecopetrol: Strategic Outlook
Table 109 Pemex: Key Details, (CEO, HQ, Revenue, Founded, No. of Employees, Company Type, Website, Business Segment)
Table 110 Pemex: Product Benchmarking
Table 111 Pemex: Strategic Outlook
Table 112 Lockheed Martin: Key Details, (CEO, HQ, Revenue, Founded, No. of Employees, Company Type, Website, Business Segment)
Table 113 Petroleum Company of Trinidad and Tobago Limited: Product Benchmarking
Table 114 PDVSA: Key Details, (CEO, HQ, Revenue, Founded, No. of Employees, Company Type, Website, Business Segment)
Table 115 PDVSA - Petróleos de Venezuela: Product Benchmarking
Table 116 PDVSA - Petróleos de Venezuela: Strategic Outlook
Table 117 Lukoil: Key Details, (CEO, HQ, Revenue, Founded, No. of Employees, Company Type, Website, Business Segment)
Table 118 Lukoil: Product Benchmarking
Table 119 Lukoil: Strategic Outlook
Table 120 Wintershall Dea AG: Key Details, (CEO, HQ, Revenue, Founded, No. of Employees, Company Type, Website, Business Segment)
Table 121 Wintershall Dea AG: Product Benchmarking
Table 122 Wintershall Dea AG: Strategic Outlook
Table 123 Canadian Natural Resources Limited: Key Details, (CEO, HQ, Revenue, Founded, No. of Employees, Company Type, Website, Business Segment)
Table 124 Canadian Natural Resources Limited: Product Benchmarking
Table 125 Aera Energy: Key Details, (CEO, HQ, Revenue, Founded, No. of Employees, Company Type, Website, Business Segment)
Table 126 Aera Energy: Product Benchmarking
Table 127 Aera Energy: Strategic Outlook
Table 128 Lockheed Martin: Key Details, (CEO, HQ, Revenue, Founded, No. of Employees, Company Type, Website, Business Segment)
Table 129 Husky Energy: Product Benchmarking
Table 130 Husky Energy: Strategic Outlook
Table 131 Lockheed Martin: Key Details, (CEO, HQ, Revenue, Founded, No. of Employees, Company Type, Website, Business Segment)
Table 132 International Petroleum Corp: Product Benchmarking
List of Figures
Figure 1 Thermal Enhanced Oil Recovery (EOR) Market Segmentation
Figure 2 Thermal Enhanced Oil Recovery (EOR) Market by Application: Market Attractiveness Index
Figure 3 Thermal Enhanced Oil Recovery (EOR) Market by Method: Market Attractiveness Index
Figure 4 Thermal Enhanced Oil Recovery (EOR) Market Attractiveness Index by Region
Figure 5 Thermal Enhanced Oil Recovery (EOR) Market: Market Dynamics
Figure 6 Average Annual Brent Crude Oil Prices, 2015 – 2023 (U.S. dollars per barrel)
Figure 7 Global Oil Production, 2012 – 2022 (thousands of barrels per day)
Figure 8 Global Oil Consumption, 2012 – 2022 (thousands of barrels per day)
Figure 9 Global Electricity Generation, 2012 – 2022 (Terawatt-hours)
Figure 10 Thermal Enhanced Oil Recovery (EOR) Market by Region, 2024-2034 (US$ Billion, AGR %): “V” Shaped Recovery
Figure 11 Thermal Enhanced Oil Recovery (EOR) Market by Region, 2024-2034 (US$ Billion, AGR %): “U” Shaped Recovery
Figure 12 Thermal Enhanced Oil Recovery (EOR) Market by Region, 2024-2034 (US$ Billion, AGR %): “W” Shaped Recovery
Figure 13 Thermal Enhanced Oil Recovery (EOR) Market by Region, 2024-2034 (US$ Billion, AGR %): “L” Shaped Recovery
Figure 14 Thermal Enhanced Oil Recovery (EOR) Market: Porter’s Five Forces Analysis
Figure 15 Thermal Enhanced Oil Recovery (EOR) Market by Application: Market Attractiveness Index
Figure 16 Thermal Enhanced Oil Recovery (EOR) Market Forecast by Application, 2024-2034 (US$ Billion, AGR %)
Figure 17 Thermal Enhanced Oil Recovery (EOR) Market Share Forecast by Application, 2024, 2029, 2034 (%)
Figure 18 Thermal Enhanced Oil Recovery (EOR) Production Market by Application, 2024-2034 (Thousand Barrel/d, AGR %)
Figure 19 Onshore Segment Market Forecast by Region, 2024-2034 (US$ Billion, AGR %)
Figure 20 Onshore Segment Market Share Forecast by Region, 2024 & 2034 (%)
Figure 21 Onshore Thermal EOR Production by Region, 2024-2034 (Thousand Barrel/d, AGR %)
Figure 22 Offshore Segment Market Forecast by Region, 2024-2034 (US$ Billion, AGR %)
Figure 23 Offshore Segment Market Share Forecast by Region, 2024 & 2034 (%)
Figure 24 Offshore Thermal EOR Production by Region, 2024-2034 (Thousand Barrel/d, AGR %)
Figure 25 Thermal Enhanced Oil Recovery (EOR) Market by Method: Market Attractiveness Index
Figure 26 Thermal Enhanced Oil Recovery (EOR) Market Forecast by Method, 2024-2034 (US$ Billion, AGR %)
Figure 27 Thermal Enhanced Oil Recovery (EOR) Market Share Forecast by Method, 2024, 2029, 2034 (%)
Figure 28 Thermal Enhanced Oil Recovery (EOR) Production Market by Method, 2024-2034 (Thousand Barrel/d, AGR %)
Figure 29 Steam Flooding Segment Market Forecast by Region, 2024-2034 (US$ Billion, AGR %)
Figure 30 Steam Flooding Segment Market Share Forecast by Region, 2024 & 2034 (%)
Figure 31 Steam Flooding Thermal EOR Production by Region, 2024-2034 (Thousand Barrel/d, AGR %)
Figure 32 Cyclic Steam Stimulation (CSS) Segment Market Forecast by Region, 2024-2034 (US$ Billion, AGR %)
Figure 33 Cyclic Steam Stimulation (CSS) Segment Market Share Forecast by Region, 2024 & 2034 (%)
Figure 34 Cyclic Steam Stimulation (CSS) Thermal EOR Production by Region, 2024-2034 (Thousand Barrel/d, AGR %)
Figure 35 Hot Water Segment Market Forecast by Region, 2024-2034 (US$ Billion, AGR %)
Figure 36 Hot Water Segment Market Share Forecast by Region, 2024 & 2034 (%)
Figure 37 Hot Water Thermal EOR Production by Region, 2024-2034 (Thousand Barrel/d, AGR %)
Figure 38 In-situ Combustion Segment Market Forecast by Region, 2024-2034 (US$ Billion, AGR %)
Figure 39 In-situ Combustion Segment Market Share Forecast by Region, 2024 & 2034 (%)
Figure 40 In-situ Combustion Thermal EOR Production by Region, 2024-2034 (Thousand Barrel/d, AGR %)
Figure 41 Steam-Assisted Gravity Drainage (SAGD) Segment Market Forecast by Region, 2024-2034 (US$ Billion, AGR %)
Figure 42 Steam-Assisted Gravity Drainage (SAGD) Segment Market Share Forecast by Region, 2024 & 2034 (%)
Figure 43 Steam-Assisted Gravity Drainage (SAGD) Thermal EOR Production by Region, 2024-2034 (Thousand Barrel/d, AGR %)
Figure 44 Thermal Enhanced Oil Recovery (EOR) Market Forecast by Region 2024 and 2034 (US$ Billion, CAGR%)
Figure 45 Thermal Enhanced Oil Recovery (EOR) Market Share Forecast by Region 2024, 2029, 2034 (%)
Figure 46 Thermal Enhanced Oil Recovery (EOR) Market by Region, 2024-2034 (US$ Billion, AGR %)
Figure 47 Thermal Enhanced Oil Recovery (EOR) Market by Region, 2024-2034 (Thousand Barrel/d, AGR %)
Figure 48 North America Thermal Enhanced Oil Recovery (EOR) Market Attractiveness Index
Figure 49 North America Thermal Enhanced Oil Recovery (EOR) Market by Region, 2024, 2029 & 2034 (US$ Billion)
Figure 50 North America Thermal Enhanced Oil Recovery (EOR) Market by Region, 2024, 2029 & 2034 (Thousand Barrel/d)
Figure 51 North America Thermal Enhanced Oil Recovery (EOR) Market Forecast by Country, 2024-2034 (US$ Billion, AGR %)
Figure 52 North America Thermal Enhanced Oil Recovery (EOR) Market Share Forecast by Country, 2024 & 2034 (%)
Figure 53 North America Thermal Enhanced Oil Recovery (EOR) Market Forecast by Country, 2024-2034 (Thousand Barrel/d, AGR %)
Figure 54 North America Thermal Enhanced Oil Recovery (EOR) Market Forecast by Application, 2024-2034 (US$ Billion, AGR %)
Figure 55 North America Thermal Enhanced Oil Recovery (EOR) Market Share Forecast by Application, 2024 & 2034 (%)
Figure 56 North America Thermal Enhanced Oil Recovery (EOR) Production by Application, 2024-2034 (Thousand Barrel/d, AGR %)
Figure 57 North America Thermal Enhanced Oil Recovery (EOR) Market Forecast by Method, 2024-2034 (US$ Billion, AGR %)
Figure 58 North America Thermal Enhanced Oil Recovery (EOR) Market Share Forecast by Method, 2024 & 2034 (%)
Figure 59 North America Thermal Enhanced Oil Recovery (EOR) Production by Method, 2024-2034 (Thousand Barrel/d, AGR %)
Figure 60 U.S. Thermal Enhanced Oil Recovery (EOR) Market Forecast, 2024-2034 (US$ Billion, AGR %)
Figure 61 U.S. Thermal Enhanced Oil Recovery (EOR) Production, 2024-2034 (Thousand Barrel/d, AGR %)
Figure 62 Canada Thermal Enhanced Oil Recovery (EOR) Market Forecast, 2024-2034 (US$ Billion, AGR %)
Figure 63 Canada Thermal Enhanced Oil Recovery (EOR) Production, 2024-2034 (Thousand Barrel/d, AGR %)
Figure 64 Europe Thermal Enhanced Oil Recovery (EOR) Market Attractiveness Index
Figure 65 Europe Thermal Enhanced Oil Recovery (EOR) Market by Region, 2024, 2029 & 2034 (US$ Billion)
Figure 66 Europe Thermal Enhanced Oil Recovery (EOR) Market by Region, 2024, 2029 & 2034 (Thousand Barrel/d)
Figure 67 Europe Thermal Enhanced Oil Recovery (EOR) Market Forecast by Country, 2024-2034 (US$ Billion, AGR %)
Figure 68 Europe Thermal Enhanced Oil Recovery (EOR) Market Share Forecast by Country, 2024 & 2034 (%)
Figure 69 Europe Thermal Enhanced Oil Recovery (EOR) Market Forecast by Country, 2024-2034 (Thousand Barrel/d, AGR %)
Figure 70 Europe Thermal Enhanced Oil Recovery (EOR) Market Forecast by Application, 2024-2034 (US$ Billion, AGR %)
Figure 71 Europe Thermal Enhanced Oil Recovery (EOR) Market Share Forecast by Application, 2024 & 2034 (%)
Figure 72 Europe Thermal Enhanced Oil Recovery (EOR) Production by Application, 2024-2034 (Thousand Barrel/d, AGR %)
Figure 73 Europe Thermal Enhanced Oil Recovery (EOR) Market Forecast by Method, 2024-2034 (US$ Billion, AGR %)
Figure 74 Europe Thermal Enhanced Oil Recovery (EOR) Market Share Forecast by Method, 2024 & 2034 (%)
Figure 75 Europe Thermal Enhanced Oil Recovery (EOR) Production by Method, 2024-2034 (Thousand Barrel/d, AGR %)
Figure 76 Netherlands Thermal Enhanced Oil Recovery (EOR) Market Forecast, 2024-2034 (US$ Billion, AGR %)
Figure 77 Netherlands Thermal Enhanced Oil Recovery (EOR) Production, 2024-2034 (Thousand Barrel/d, AGR %)
Figure 78 Germany Thermal Enhanced Oil Recovery (EOR) Market Forecast, 2024-2034 (US$ Billion, AGR %)
Figure 79 Germany Thermal Enhanced Oil Recovery (EOR) Production, 2024-2034 (Thousand Barrel/d, AGR %)
Figure 80 Russia Thermal Enhanced Oil Recovery (EOR) Market Forecast, 2024-2034 (US$ Billion, AGR %)
Figure 81 Russia Thermal Enhanced Oil Recovery (EOR) Production, 2024-2034 (Thousand Barrel/d, AGR %)
Figure 82 Asia Pacific Thermal Enhanced Oil Recovery (EOR) Market Attractiveness Index
Figure 83 Asia Pacific Thermal Enhanced Oil Recovery (EOR) Market by Region, 2024, 2029 & 2034 (US$ Billion)
Figure 84 Asia Pacific Thermal Enhanced Oil Recovery (EOR) Market by Region, 2024, 2029 & 2034 (Thousand Barrel/d)
Figure 85 Asia Pacific Thermal Enhanced Oil Recovery (EOR) Market Forecast by Country, 2024-2034 (US$ Billion, AGR %)
Figure 86 Asia Pacific Thermal Enhanced Oil Recovery (EOR) Market Share Forecast by Country, 2024 & 2034 (%)
Figure 87 Asia Pacific Thermal Enhanced Oil Recovery (EOR) Market Forecast by Country, 2024-2034 (Thousand Barrel/d, AGR %)
Figure 88 Asia Pacific Thermal Enhanced Oil Recovery (EOR) Market Forecast by Application, 2024-2034 (US$ Billion, AGR %)
Figure 89 Asia Pacific Thermal Enhanced Oil Recovery (EOR) Market Share Forecast by Application, 2024 & 2034 (%)
Figure 90 Asia Pacific Thermal Enhanced Oil Recovery (EOR) Production by Application, 2024-2034 (Thousand Barrel/d, AGR %)
Figure 91 Asia Pacific Thermal Enhanced Oil Recovery (EOR) Market Forecast by Method, 2024-2034 (US$ Billion, AGR %)
Figure 92 Asia Pacific Thermal Enhanced Oil Recovery (EOR) Market Share Forecast by Method, 2024 & 2034 (%)
Figure 93 Asia Pacific Thermal Enhanced Oil Recovery (EOR) Production by Method, 2024-2034 (Thousand Barrel/d, AGR %)
Figure 94 China Thermal Enhanced Oil Recovery (EOR) Market Forecast, 2024-2034 (US$ Billion, AGR %)
Figure 95 China Thermal Enhanced Oil Recovery (EOR) Production, 2024-2034 (Thousand Barrel/d, AGR %)
Figure 96 India Thermal Enhanced Oil Recovery (EOR) Market Forecast, 2024-2034 (US$ Billion, AGR %)
Figure 97 India Thermal Enhanced Oil Recovery (EOR) Production, 2024-2034 (Thousand Barrel/d, AGR %)
Figure 98 Indonesia Thermal Enhanced Oil Recovery (EOR) Market Forecast, 2024-2034 (US$ Billion, AGR %)
Figure 99 Indonesia Thermal Enhanced Oil Recovery (EOR) Production, 2024-2034 (Thousand Barrel/d, AGR %)
Figure 100 Kazakhstan Thermal Enhanced Oil Recovery (EOR) Market Forecast, 2024-2034 (US$ Billion, AGR %)
Figure 101 Kazakhstan Thermal Enhanced Oil Recovery (EOR) Production, 2024-2034 (Thousand Barrel/d, AGR %)
Figure 102 Latin America Thermal Enhanced Oil Recovery (EOR) Market Attractiveness Index
Figure 103 Latin America Thermal Enhanced Oil Recovery (EOR) Market by Region, 2024, 2029 & 2034 (US$ Billion)
Figure 104 Latin America Thermal Enhanced Oil Recovery (EOR) Market by Region, 2024, 2029 & 2034 (Thousand Barrel/d)
Figure 105 Latin America Thermal Enhanced Oil Recovery (EOR) Market Forecast by Country, 2024-2034 (US$ Billion, AGR %)
Figure 106 Latin America Thermal Enhanced Oil Recovery (EOR) Market Share Forecast by Country, 2024 & 2034 (%)
Figure 107 Latin America Thermal Enhanced Oil Recovery (EOR) Market Forecast by Country, 2024-2034 (Thousand Barrel/d, AGR %)
Figure 108 Latin America Thermal Enhanced Oil Recovery (EOR) Market Forecast by Application, 2024-2034 (US$ Billion, AGR %)
Figure 109 Latin America Thermal Enhanced Oil Recovery (EOR) Market Share Forecast by Application, 2024 & 2034 (%)
Figure 110 Latin America Thermal Enhanced Oil Recovery (EOR) Production by Application, 2024-2034 (Thousand Barrel/d, AGR %)
Figure 111 Latin America Thermal Enhanced Oil Recovery (EOR) Market Forecast by Method, 2024-2034 (US$ Billion, AGR %)
Figure 112 Latin America Thermal Enhanced Oil Recovery (EOR) Market Share Forecast by Method, 2024 & 2034 (%)
Figure 113 Latin America Thermal Enhanced Oil Recovery (EOR) Production by Method, 2024-2034 (Thousand Barrel/d, AGR %)
Figure 114 Brazil Thermal Enhanced Oil Recovery (EOR) Market Forecast, 2024-2034 (US$ Billion, AGR %)
Figure 115 Brazil Thermal Enhanced Oil Recovery (EOR) Production, 2024-2034 (Thousand Barrel/d, AGR %)
Figure 116 Mexico Thermal Enhanced Oil Recovery (EOR) Market Forecast, 2024-2034 (US$ Billion, AGR %)
Figure 117 Mexico Thermal Enhanced Oil Recovery (EOR) Production, 2024-2034 (Thousand Barrel/d, AGR %)
Figure 118 Colombia Thermal Enhanced Oil Recovery (EOR) Market Forecast, 2024-2034 (US$ Billion, AGR %)
Figure 119 Colombia Thermal Enhanced Oil Recovery (EOR) Production, 2024-2034 (Thousand Barrel/d, AGR %)
Figure 120 Venezuela Thermal Enhanced Oil Recovery (EOR) Market Forecast, 2024-2034 (US$ Billion, AGR %)
Figure 121 Venezuela Thermal Enhanced Oil Recovery (EOR) Production, 2024-2034 (Thousand Barrel/d, AGR %)
Figure 122 Trinidad Thermal Enhanced Oil Recovery (EOR) Market Forecast, 2024-2034 (US$ Billion, AGR %)
Figure 123 Trinidad Thermal Enhanced Oil Recovery (EOR) Production, 2024-2034 (Thousand Barrel/d, AGR %)
Figure 124 Middle East & Africa Thermal Enhanced Oil Recovery (EOR) Market Attractiveness Index
Figure 125 Middle East & Africa Thermal Enhanced Oil Recovery (EOR) Market by Region, 2024, 2029 & 2034 (US$ Billion)
Figure 126 Middle East & Africa Thermal Enhanced Oil Recovery (EOR) Market by Region, 2024, 2029 & 2034 (Thousand Barrel/d)
Figure 127 Middle East & Africa Thermal Enhanced Oil Recovery (EOR) Market Forecast by Country, 2024-2034 (US$ Billion, AGR %)
Figure 128 Middle East & Africa Thermal Enhanced Oil Recovery (EOR) Market Share Forecast by Country, 2024 & 2034 (%)
Figure 129 Middle East & Africa Thermal Enhanced Oil Recovery (EOR) Market Forecast by Country, 2024-2034 (Thousand Barrel/d, AGR %)
Figure 130 Middle East & Africa Thermal Enhanced Oil Recovery (EOR) Market Forecast by Application, 2024-2034 (US$ Billion, AGR %)
Figure 131 Middle East & Africa Thermal Enhanced Oil Recovery (EOR) Market Share Forecast by Application, 2024 & 2034 (%)
Figure 132 Middle East & Africa Thermal Enhanced Oil Recovery (EOR) Production by Application, 2024-2034 (Thousand Barrel/d, AGR %)
Figure 133 Middle East & Africa Thermal Enhanced Oil Recovery (EOR) Market Forecast by Method, 2024-2034 (US$ Billion, AGR %)
Figure 134 Middle East & Africa Thermal Enhanced Oil Recovery (EOR) Market Share Forecast by Method, 2024 & 2034 (%)
Figure 135 North America Thermal Enhanced Oil Recovery (EOR) Production by Method, 2024-2034 (Thousand Barrel/d, AGR %)
Figure 136 Egypt Thermal Enhanced Oil Recovery (EOR) Market Forecast, 2024-2034 (US$ Billion, AGR %)
Figure 137 Egypt Thermal Enhanced Oil Recovery (EOR) Production, 2024-2034 (Thousand Barrel/d, AGR %)
Figure 138 Oman Thermal Enhanced Oil Recovery (EOR) Market Forecast, 2024-2034 (US$ Billion, AGR %)
Figure 139 Oman Thermal Enhanced Oil Recovery (EOR) Production, 2024-2034 (Thousand Barrel/d, AGR %)
Figure 140 Sudan Thermal Enhanced Oil Recovery (EOR) Market Forecast, 2024-2034 (US$ Billion, AGR %)
Figure 141 Sudan Thermal Enhanced Oil Recovery (EOR) Production, 2024-2034 (Thousand Barrel/d, AGR %)
Figure 142 China National Petroleum Corporation: Net Revenue, 2018-2022 (US$ Billion, AGR%)
Figure 143 China National Petroleum Corporation: Net Revenue, 2018-2022 (US$ Billion, AGR%)
Figure 144 China National Petroleum Corporation: Regional Market Shares, 2022
Figure 145 China Petroleum & Chemical Corporation: Net Revenue, 2018-2022 (US$ Million, AGR%)
Figure 146 China Petroleum & Chemical Corporation: Segment Market Shares, 2022
Figure 147 Oil and Natural Gas Corporation: Net Revenue, 2018-2022 (US$ Billion, AGR%)
Figure 148 Oil and Natural Gas Corporation: Segment Market Shares, 2022
Figure 149 Chevron Corporation: Net Revenue, 2018-2022 (US$ Billion, AGR%)
Figure 150 Chevron Corporation: Regional Market Shares, 2022
Figure 151 Chevron Corporation: Segment Market Shares, 2022
Figure 152 Petrobras: Net Revenue, 2018-2022 (US$ Billion, AGR%)
Figure 153 Petrobras: Segment Market Shares, 2022
Figure 154 Ecopetrol: Net Revenue, 2018-2022 (US$ Billion, AGR%)
Figure 155 Ecopetrol: Segment Market Shares, 2022
Figure 156 Wintershall Dea AG: Net Revenue, 2018-2022 (US$ Billion, AGR%)
Figure 157 Wintershall Dea AG: Segment Market Shares, 2022
Figure 158 Canadian Natural Resources Limited: Net Revenue, 2018-2022 (US$ Billion, AGR%)
Figure 159 Canadian Natural Resources Limited: Segment Market Shares, 2022
Figure 160 International Petroleum Corp: Net Revenue, 2018-2022 (US$ Billion, AGR%)
Figure 161 International Petroleum Corp: Regional Market Shares, 2022
ページTOPに戻る
本レポートと同じKEY WORD()の最新刊レポート
- 本レポートと同じKEY WORDの最新刊レポートはありません。
よくあるご質問
Visiongain社はどのような調査会社ですか?
英国の調査会社ヴィジョンゲイン社(Visiongain)は、通信とエネルギーのほか、自動車や化学・医薬品、金属など、広範な市場を対象に調査を行っています。自動車市場については、市場全般に関する調査のほ... もっと見る
調査レポートの納品までの日数はどの程度ですか?
在庫のあるものは速納となりますが、平均的には 3-4日と見て下さい。
但し、一部の調査レポートでは、発注を受けた段階で内容更新をして納品をする場合もあります。
発注をする前のお問合せをお願いします。
注文の手続きはどのようになっていますか?
1)お客様からの御問い合わせをいただきます。
2)見積書やサンプルの提示をいたします。
3)お客様指定、もしくは弊社の発注書をメール添付にて発送してください。
4)データリソース社からレポート発行元の調査会社へ納品手配します。
5) 調査会社からお客様へ納品されます。最近は、pdfにてのメール納品が大半です。
お支払方法の方法はどのようになっていますか?
納品と同時にデータリソース社よりお客様へ請求書(必要に応じて納品書も)を発送いたします。
お客様よりデータリソース社へ(通常は円払い)の御振り込みをお願いします。
請求書は、納品日の日付で発行しますので、翌月最終営業日までの当社指定口座への振込みをお願いします。振込み手数料は御社負担にてお願いします。
お客様の御支払い条件が60日以上の場合は御相談ください。
尚、初めてのお取引先や個人の場合、前払いをお願いすることもあります。ご了承のほど、お願いします。
データリソース社はどのような会社ですか?
当社は、世界各国の主要調査会社・レポート出版社と提携し、世界各国の市場調査レポートや技術動向レポートなどを日本国内の企業・公官庁及び教育研究機関に提供しております。
世界各国の「市場・技術・法規制などの」実情を調査・収集される時には、データリソース社にご相談ください。
お客様の御要望にあったデータや情報を抽出する為のレポート紹介や調査のアドバイスも致します。
|
|

