コンパニオン診断薬(CDx)市場レポート:2024-2034
Companion Diagnostics (CDx) Market Report 2024-2034
レポート詳細
コンパニオン診断薬(CDx)市場レポート 2024-2034 :本レポートは、新たな収益の柱を目指す大手企業にとって、業界とその根底にある力学をより深く理解する上で貴重なものとなるだろう... もっと見る
※上記価格は部署ライセンス(Departmental licence)価格です。
その他の価格についてはデータリソースまでお問合せください。
日本語のページは自動翻訳を利用し作成しています。
実際のレポートは英文のみでご納品いたします。

|

|
サマリー
レポート詳細
コンパニオン診断薬(CDx)市場レポート 2024-2034:本レポートは、新たな収益の柱を目指す大手企業にとって、業界とその根底にある力学をより深く理解する上で貴重なものとなるだろう。また、異業種への進出や既存事業の新地域への展開を目指す企業にとっても有用なものとなるでしょう。
CDx市場における技術向上
CDx市場は技術開発のおかげで拡大している。より優れた、より感度の高い、より焦点を絞ったCDx検査がこれらの開発から生まれている。CDxにおける重要な技術開発には以下のようなものがある:
-
次世代シーケンサー(NGS):高スループットシークエンシング技術であるNGSを用いて腫瘍ゲノム全体の塩基配列を決定することができる。このデータを用いて、特定の薬剤が標的とする遺伝子変異をピンポイントで特定することができる。
-
リキッドバイオプシー:循環中のがん細胞やその他の指標を同定できる、侵襲の少ない検査法がリキッドバイオプシーである。この検査は、がんの経過や治療効果を追跡するために用いることができ、従来の組織生検よりも侵襲性が低い。
-
AI(人工知能):AIは、膨大な量のCDxデータを分析できるコンピューター・アルゴリズムの作成に利用されている。この情報を活用してパターンを発見し、患者の転帰を予測することができる。
このような技術改良はCDx産業に大きな影響を及ぼしており、今後数年間の市場拡大を促進すると予測されている。CDx検査は、このような改良の結果、より正確、高感度、安価になってきており、個別化医療においてますます不可欠な役割を果たすようになってきている。
2023年には、多くの重要な企業がコンパニオン診断薬に多額の投資を行う予定である。以下はその一例である:
-
ロシュ:癌に重点を置くロシュは、コンパニオン診断薬(CDx)市場で著名なプレーヤーである。同社は、ゼルボラフやハーセプチンなどの標的がん治療薬の補完的診断薬を数多く開発している。
-
コンパニオン診断薬ビジネスのもう一つの重要な参加者はアボット・ラボラトリーズである。同社のコンパニオン診断薬クラリスカンは、化学療法薬イリノテカンに対する患者の反応を予測するのに役立つ。
-
サーモフィッシャーサイエンティフィックコンパニオン診断検査用ツールと消耗品のトップサプライヤーはサーモフィッシャーサイエンティフィックである。複数の企業が同社のIon Torrent NGSプラットフォームを使用してコンパニオン診断テストを開発している。
したがって、こうした改良と新製品の導入は、CDx市場のダイナミックな性質と、精密医療を提供することでがん治療に革命をもたらす可能性を浮き彫りにしている。
高い設備投資と低い費用対効果比率が業界の成長を阻むだろう
このような特殊な検査は、設計と検証に多額の資本支出を必要とする。コンパニオン診断薬は、より一般的な診断機器とは対照的に、特定の、より狭い集団を対象としている。このことは、市場が予想ほど大きくない可能性を示しており、R&Dや必要な許認可の取得に伴う高額な費用を回収することが難しくなる。また、これらの検査には高度なインフラや技術が必要とされることが多く、コストはさらに上昇する。
このような特殊な検査の開発と検証には、かなりの資本投入が必要である。コンパニオン診断薬は、より広範な診断機器とは対照的に、より少人数で特定のグループを対象としている。その結果、市場規模が限定され、研究、開発、規制当局の承認にかかる多額の費用を回収することが難しくなる可能性がある。さらに、これらの検査には高価な技術やインフラが必要になることが多く、予算的な負担が大きくなる。
しかし、費用対効果を計算するのは難しいかもしれない。コンパニオン診断薬には、適切な患者が適切な治療を受けられるようにすることで、治療効果を向上させ、無駄を省く可能性がある。その結果、医療システムのコスト削減や患者の予後改善につながる可能性がある。しかし、このような利益を実現するには、対象となるグループの有病率、コンパニオンメディケーションの有効性、検査自体のコストなど、多くの状況が関わってきます。
対象集団が少なかったり、診断費用が高かったりすると、費用便益比はマイナスに偏る可能性がある。製造業者は、たとえコンパニオン診断薬が大きな治療効果をもたらすとしても、投資を控えるかもしれない。
市場調査レポートを購入する前にすべき質問とは?
-
コンパニオン診断薬(CDx)市場はどのように発展していますか?
-
コンパニオン診断薬(CDx)市場の促進要因と抑制要因は何か?
-
コンパニオン診断薬(CDx)サブマーケットの各セグメントは予測期間中にどのように成長し、2034年にはどれくらいの収益を占めるようになるのか?
-
2024年から2034年にかけて、コンパニオン診断薬の各サブマーケットの市場シェアはどのように推移するのか?
-
2024年から2034年にかけて、市場全体を牽引する主な要因は何か?
-
コンパニオン診断薬(CDx)の主要市場はマクロ経済の動きに大枠で追随するのか、それとも個々の国の市場が他を凌駕するのか?
-
2034年までに各国市場のシェアはどのように変化し、どの地域が2034年の市場をリードするのか。
-
主要プレーヤーは誰か、予測期間中の見通しは?
-
これらの主要企業によるコンパニオン診断薬(CDx)プロジェクトとは?
-
2024年から2034年の間に、業界はどのように発展していくのか?現在、そして今後10年間に行われるコンパニオン診断プロジェクトはどのような意味を持つのか?
-
コンパニオン診断薬(CDx)市場をさらに拡大するために、製品化の必要性は高まっていますか?
-
コンパニオン診断薬(CDx)市場はどこに向かっているのか、そしてどのようにして市場の最前線に立つことができるのか?
-
新商品や新サービスに最適な投資方法とは?
-
企業を新たな成長軌道に乗せ、C-suiteに移行させるための重要な展望とは?
このことがコンパニオン診断薬(CDx)市場に現在、そして今後10年間でどのような影響を与えるかを知る必要があります:
-
307ページに及ぶレポートには、100の表と170の図表が掲載されている。
-
本レポートでは、業界の主要な有利分野を取り上げているため、それらをターゲットにすることができます。今すぐ
-
世界、地域、国の売上高と成長に関する詳細な分析が含まれている。
-
競合他社が成功した主なトレンド、変化、収益予測をハイライトします。
本レポートは、コンパニオン診断薬(CDx)市場が今後10年間、COVID-19の景気後退と好転の変動に合わせてどのように発展するかをお伝えします。この市場は、過去10年間のどの時点よりも今が重要です。
2034年までの予測やその他の分析から、商業的な展望が明らかになる
-
2034年までの収益予測に加え、最近の実績、成長率、市場シェアも提供している。
-
ビジネスの展望や展開など、独自の分析が掲載されている。
-
定性的分析(市場ダイナミクス、促進要因、機会、阻害要因、課題を含む)、コスト構造、コンパニオン診断薬価格上昇の影響、最近の動向をご覧ください。
本レポートには、COVID-19が業界と貴社にどのような影響を与えるかについてのデータ分析と貴重な洞察が含まれている。本レポートでは、COVID-19の4つの回復パターンとその影響、すなわち「V」、「L」、「W」、「U」について論じている。
レポート対象セグメント
製品・サービス
テクノロジー
-
ポリメラーゼ連鎖反応(PCR)
-
次世代シーケンス(NGS)
-
インサイチュハイブリダイゼーション(ISH)
-
免疫組織化学(IHC)
-
その他の技術
表示
エンドユーザー
-
製薬・バイオ製薬企業
-
レファレンス・ラボラトリーズ
-
医薬品開発業務受託機関(CRO)
-
その他エンドユーザー
世界市場全体と各分野の収益予測に加え、5つの地域と米国、中国、英国、インド、ブラジルの主要国市場の収益予測も掲載している:
北米
欧州
-
ドイツ
-
英国
-
フランス
-
スペイン
-
イタリア
-
その他の欧州
アジア太平洋
-
中国
-
日本
-
インド
-
オーストラリア
-
韓国
-
その他のアジア太平洋
ラテンアメリカ
MEA
本レポートには、コンパニオン診断薬(CDx)市場の2024年から2034年までの主要企業のプロファイルも含まれており、これらの企業の事業のこのセグメントに焦点を当てています。
報告書に掲載されている主要企業
-
Abbott
-
Agilent Technologies, Inc.
-
Almac Group
-
bioMerieux
-
Danaher Corporation
-
F. Hoffmann-La Roche Ltd
-
Guardant Health
-
Illumina, Inc.
-
Myriad Genetics, Inc.
-
QIAGEN
-
Sysmex Corporation
-
Thermo Fisher Scientific Inc.
コンパニオン診断薬(CDx)市場の2024年から2034年までの世界全体の売上高は、金額ベースで2024年に65億米ドルを超えると弊社は計算しています。2034年まで力強い収益成長を予測しています。当研究所では、最も大きな可能性を秘めた組織を特定しています。各組織の能力、進捗状況、商業的展望を把握することで、常に一歩先を行くことができます。
コンパニオン診断薬(CDx)市場、2024年~2034年レポートはどのようにお役に立ちますか?
まとめると、300ページを超えるこのレポートは、以下のような知識を提供する:
-
コンパニオン診断薬(CDx)市場の2024年から2034年までの収益予測。製品&サービス、技術、適応症、エンドユーザーの各予測を世界および地域レベルで掲載。
-
5つの地域と16の主要国市場の2034年までの収益予測 - コンパニオン診断薬(CDx)市場の2024年から2034年までの北米、ヨーロッパ、アジア太平洋、ラテンアメリカ、MEAの市場予測をご覧ください。また、米国、カナダ、メキシコ、ブラジル、ドイツ、フランス、英国、イタリア、中国、インド、日本、オーストラリアの市場も予測されています。
-
Abbott, Agilent Technologies, Inc., Almac Group, bioMerieux, Danaher Corporation, F. Hoffmann-La Roche Ltd, Guardant Health, Illumina, Myriad Genetics, Inc,, QIAGEN, Sysmex Corporation, Thermo Fisher Scientific Inc.など、コンパニオン診断薬(CDx)市場に関わる主要企業の会社概要を含む。
独自の予測による定量的・定性的分析をご覧ください。私たちのレポートだけに含まれる情報を入手し、貴重なビジネスインテリジェンスで情報を得ることができます。
他にはない情報
私たちの新しいレポートがあれば、知識に遅れをとったり、チャンスを逃したりする可能性が低くなります。弊社のレポートが貴社の調査、分析、意思決定にどのように役立つかをご覧ください。Visiongainの調査は、コンパニオン診断薬(CDx)市場、2024年から2034年、市場をリードする企業の商業分析を必要とするすべての人のためのものです。データ、トレンド、予測をご覧いただけます。
ページTOPに戻る
目次
目次
1 レポート概要
1.1 研究の目的
1.2 コンパニオン診断薬(CDx)市場の紹介
1.3 本レポートの内容
1.4 本レポートを読むべき理由
1.5 本分析レポートが回答する主な質問
1.6 本レポートの対象者
1.7 方法論
1.7.1 市場の定義
1.7.2 市場評価・予測手法
1.7.3 データの検証
1.7.3.1 一次調査
1.7.3.2 セカンダリーリサーチ
1.8 よくある質問(FAQ)
1.9 Visiongainの関連レポート
1.10 Visiongainについて
2 エグゼクティブ・サマリー
3 市場概要
3.1 主要な調査結果
3.2 市場ダイナミクス
3.2.1 市場促進要因
3.2.1.1 慢性疾患の割合の増加
3.2.1.2 CDx市場における技術改善
3.2.1.3 個別化医療に対する意識の高まり
3.2.1.4 標的療法のニーズの高まり
3.2.1.5 個別化医療の重要性の高まり
3.2.1.6 世界的ながん罹患率の増加
3.2.1.7 コンパニオン診断薬の応用分野の拡大
3.2.2 市場抑制要因
3.2.2.1 深刻な問題と多額の医療費
3.2.2.2 CDx検査の作成と承認は困難で複雑なプロセスである
3.2.2.3 高い設備投資と低い費用便益率
3.2.2.4 各地域における不透明な償還シナリオ
3.2.2.5 免疫療法治療の高コスト
3.2.3 市場機会
3.2.3.1 新規標的薬のための新しいCDx検査の創出
3.2.3.2 政府の好意的な政策
3.2.3.3 新市場への進出
3.2.3.4 CDxにおける次世代シーケンサーの需要の増加
3.2.3.5 医薬品開発におけるコンパニオン診断薬の重要性の高まり
3.2.3.6 臨床試験数の増加
3.3 COVID-19の影響分析
3.4 ポーター分析
3.5 PEST分析
4 コンパニオン診断薬(CDx)市場分析:製品・サービス別
4.1 主要な調査結果
4.2 製品・サービスセグメント 市場魅力度指数
4.3 製品・サービス別のコンパニオン診断(CDx)市場規模の推定と予測
4.4 アッセイ、キット、試薬
4.4.1 2024〜2034年の地域別市場規模(US$ Million)
4.4.2 地域別市場シェア、2024年・2034年(%)
4.5 ソフトウェア&サービス
4.5.1 2024年~2034年の地域別市場規模(US$ Million)
4.5.2 地域別市場シェア、2024年・2034年(%)
5 コンパニオン診断薬(CDx)市場分析:適応症別
5.1 主な調査結果
5.2 適応症セグメント 市場魅力度指数
5.3 コンパニオン診断薬(CDx)の適応症別市場規模の推定と予測
5.4 癌
5.4.1 2024〜2034年の地域別市場規模(US$ Million)
5.4.2 地域別市場シェア、2024年・2034年(%)
5.5 感染症
5.5.1 2024〜2034年の地域別市場規模(US$ Million)
5.5.2 地域別市場シェア、2024年・2034年(%)
5.6 循環器疾患
5.6.1 2024〜2034年の地域別市場規模(US$ Million)
5.6.2 地域別市場シェア、2024年・2034年(%)
5.7 神経疾患
5.7.1 2024〜2034年の地域別市場規模(US$ Million)
5.7.2 地域別市場シェア、2024年・2034年(%)
5.8 その他の適応症
5.8.1 2024〜2034年の地域別市場規模(US$ Million)
5.8.2 地域別市場シェア、2024年・2034年(%)
6 コンパニオン診断薬(CDx)市場分析:技術別
6.1 主な調査結果
6.2 技術セグメント 市場魅力度指数
6.3 コンパニオン診断薬(CDx)の技術別市場規模の推定と予測
6.4 ポリメラーゼ連鎖反応(PCR)
6.4.1 2024〜2034年の地域別市場規模(US$ Million)
6.4.2 地域別市場シェア、2024年・2034年(%)
6.5 次世代シーケンサー(NGS)
6.5.1 2024〜2034年の地域別市場規模(US$ Million)
6.5.2 地域別市場シェア、2024年・2034年(%)
6.6 インサイチュハイブリダイゼーション(ISH)
6.6.1 2024〜2034年の地域別市場規模(US$ Million)
6.6.2 地域別市場シェア、2024年・2034年(%)
6.7 免疫組織化学(IHC)
6.7.1 2024〜2034年の地域別市場規模(US$ Million)
6.7.2 地域別市場シェア、2024年・2034年(%)
6.8 その他の技術
6.8.1 2024年~2034年の地域別市場規模(US$ Million)
6.8.2 地域別市場シェア、2024年・2034年(%)
7 コンパニオン診断薬(CDx)市場:エンドユーザー別分析
7.1 主要な調査結果
7.2 エンドユーザーセグメント: 市場魅力度指数
7.3 エンドユーザー別コンパニオン診断(CDx)市場規模の推定と予測
7.4 製薬・バイオ医薬品企業
7.4.1 2024〜2034年の地域別市場規模(US$ Million)
7.4.2 地域別市場シェア、2024年・2034年(%)
7.5 リファレンスラボ
7.5.1 2024年~2034年の地域別市場規模(US$ Million)
7.5.2 地域別市場シェア、2024年・2034年(%)
7.6 CRO(医薬品開発業務受託機関)
7.6.1 2024年~2034年の地域別市場規模(US$ Million)
7.6.2 地域別市場シェア、2024年・2034年(%)
7.7 その他のエンドユーザー
7.7.1 2024〜2034年の地域別市場規模(US$ Million)
7.7.2 地域別市場シェア、2024年・2034年(%)
8 コンパニオン診断薬(CDx)市場分析:地域別
8.1 主要な調査結果
8.2 地域別市場規模の推定と予測
9 北米のコンパニオン診断薬(CDx)市場分析
9.1 主要な調査結果
9.2 北米のコンパニオン診断薬(CDx)市場魅力度指数
9.3 北米のコンパニオン診断薬(CDx)国別市場、2024年、2029年、2034年(US$ Million)
9.4 北米のコンパニオン診断薬(CDx)市場規模推定と予測:国別
9.5 北米のコンパニオン診断薬(CDx)市場規模推定と予測:製品・サービス別
9.6 北米のコンパニオン診断薬(CDx)市場規模推定と予測:適応症別
9.7 北米のコンパニオン診断薬(CDx)市場規模推定と予測:技術別
9.8 北米のコンパニオン診断薬(CDx)市場規模推定と予測:エンドユーザー別
9.9 アメリカのコンパニオン診断薬(CDx)市場分析
9.10 カナダのコンパニオン診断薬(CDx)市場分析
10 欧州のコンパニオン診断薬(CDx)市場分析
10.1 主要な調査結果
10.2 欧州のコンパニオン診断薬(CDx)市場魅力度指数
10.3 欧州のコンパニオン診断薬(CDx)国別市場、2024年、2029年、2034年(US$ Million)
10.4 欧州のコンパニオン診断薬(CDx)国別市場規模推定と予測
10.5 欧州のコンパニオン診断薬(CDx)市場規模推定と予測:製品・サービス別
10.6 欧州のコンパニオン診断薬(CDx)市場規模推定と予測:適応症別
10.7 欧州のコンパニオン診断薬(CDx)市場規模推定と予測:技術別
10.8 欧州のコンパニオン診断薬(CDx)市場規模推定と予測:エンドユーザー別
10.9 ドイツのコンパニオン診断薬(CDx)市場分析
10.10 イギリスのコンパニオン診断薬(CDx)市場分析
10.11 フランスのコンパニオン診断薬(CDx)市場分析
10.12 イタリアのコンパニオン診断薬(CDx)市場分析
10.13 スペインのコンパニオン診断薬(CDx)市場分析
10.14 その他の欧州のコンパニオン診断薬(CDx)市場分析
11 アジア太平洋地域のコンパニオン診断薬(CDx)市場分析
11.1 主要な調査結果
11.2 アジア太平洋地域のコンパニオン診断薬(CDx)市場魅力度指数
11.3 アジア太平洋地域のコンパニオン診断薬(CDx)国別市場、2024年、2029年、2034年(US$ Million)
11.4 アジア太平洋地域のコンパニオン診断薬(CDx)国別市場規模推定と予測
11.5 アジア太平洋地域のコンパニオン診断薬(CDx)市場規模推定と予測:製品・サービス別
11.6 アジア太平洋地域のコンパニオン診断薬(CDx)市場規模推定と予測:適応症別
11.7 アジア太平洋地域のコンパニオン診断薬(CDx)市場規模推定と予測:技術別
11.8 アジア太平洋地域のコンパニオン診断薬(CDx)市場規模推定と予測:エンドユーザー別
11.9 中国のコンパニオン診断薬(CDx)市場分析
11.10 日本のコンパニオン診断薬(CDx)市場分析
11.11 インドのコンパニオン診断薬(CDx)市場分析
11.12 オーストラリアのコンパニオン診断薬(CDx)市場分析
11.13 韓国のコンパニオン診断薬(CDx)の市場分析
11.14 その他のアジア太平洋地域のコンパニオン診断薬(CDx)市場分析
12 ラテンアメリカのコンパニオン診断薬(CDx)市場分析
12.1 主要な調査結果
12.2 ラテンアメリカのコンパニオン診断薬(CDx)市場魅力度指数
12.3 ラテンアメリカのコンパニオン診断薬(CDx)国別市場、2024年、2029年、2034年 (US$ Million)
12.4 ラテンアメリカのコンパニオン診断薬(CDx)国別市場規模推定と予測
12.5 ラテンアメリカのコンパニオン診断薬(CDx)市場規模推定と予測:製品・サービス別
12.6 ラテンアメリカのコンパニオン診断薬(CDx)市場規模推定と予測:適応症別
12.7 ラテンアメリカのコンパニオン診断薬(CDx)市場規模推定と予測:技術別
12.8 ラテンアメリカのコンパニオン診断薬(CDx)市場規模推定と予測:エンドユーザー別
12.9 ブラジルのコンパニオン診断薬(CDx)市場分析
12.10 メキシコのコンパニオン診断薬(CDx)市場分析
12.11 その他のラテンアメリカのコンパニオン診断薬(CDx)市場分析
13 MEAのコンパニオン診断薬(CDx)市場分析
13.1 主要な調査結果
13.2 MEAのコンパニオン診断薬(CDx)市場魅力度指数
13.3 MEAのコンパニオン診断薬(CDx)国別市場、2024年、2029年、2034年(US$ Million)
13.4 MEAのコンパニオン診断薬(CDx)国別市場規模推定と予測
13.5 MEAのコンパニオン診断薬(CDx)市場規模推定と予測:製品・サービス別
13.6 MEAのコンパニオン診断薬(CDx)市場規模推定と予測:適応症別
13.7 MEAのコンパニオン診断薬(CDx)市場規模推定と予測:技術別
13.8 MEAのコンパニオン診断薬(CDx)市場規模推定と予測:エンドユーザー別
13.9 南アフリカのコンパニオン診断薬(CDx)市場分析
13.10 GCCのコンパニオン診断薬(CDx)市場分析
13.11 その他のMEAコンパニオン診断薬(CDx)市場分析
14 主要企業のプロファイル
14.1 戦略的展望
14.2 F. Hoffmann-La Roche Ltd
14.2.1 会社概要
14.2.2 会社概要
14.2.3 財務分析
14.2.3.1 純収入、2017-2022年
14.2.3.2 R&D、2017-2022年
14.2.3.3 地域市場シェア、2022年
14.2.4 製品ベンチマーク
14.2.5 戦略的展望
14.3 Agilent Technologies, Inc.
14.3.1 会社概要
14.3.2 会社概要
14.3.3 財務分析
14.3.3.1 純収入、2017-2022年
14.3.3.2 R&D、2017-2022年
14.3.3.3 地域市場シェア、2022年
14.3.4 製品ベンチマーク
14.3.5 戦略的展望
14.4 QIAGEN
14.4.1 会社概要
14.4.2 会社概要
14.4.3 財務分析
14.4.3.1 純収入、2017-2022年
14.4.3.2 R&D、2017-2022年
14.4.3.3 地域市場シェア、2022年
14.4.4 製品ベンチマーク
14.5 Thermo Fisher Scientific Inc.
14.5.1 会社概要
14.5.2 会社概要
14.5.3 財務分析
14.5.3.1 純収入、2017-2022年
14.5.3.2 地域市場シェア、2022年
14.5.4 製品ベンチマーク
14.6 Abbott
14.6.1 会社概要
14.6.2 会社概要
14.6.3 財務分析
14.6.3.1 純収入、2017-2022年
14.6.3.2 R&D、2017年〜2022年
14.6.3.3 地域市場シェア、2022年
14.6.4 製品ベンチマーク
14.7 Almac Group
14.7.1 会社概要
14.7.2 会社概要
14.7.3 製品ベンチマーク
14.7.4 戦略的展望
14.8 Danaher Corporation
14.8.1 会社概要
14.8.2 会社概要
14.8.3 財務分析
14.8.3.1 純収入、2017-2022年
14.8.3.2 地域市場シェア、2022年
14.8.4 製品ベンチマーク
14.9 Illumina, Inc.
14.9.1 会社概要
14.9.2 会社概要
14.9.3 財務分析
14.9.3.1 純収入、2017-2022年
14.9.3.2 R&D、2017年〜2022年
14.9.3.3 地域市場シェア、2022年
14.9.4 製品ベンチマーク
14.9.5 戦略的展望
14.10 bioMerieux
14.10.1 会社概要
14.10.2 会社概要
14.10.3 財務分析
14.10.3.1 純収入、2017年~2022年
14.10.3.2 地域市場シェア、2022年
14.10.4 製品ベンチマーク
14.11 Myriad Genetics, Inc.
14.11.1 会社概要
14.11.2 会社概要
14.11.3 財務分析
14.11.3.1 純収入、2017-2022年
14.11.3.2 R&D、2017年〜2022年
14.11.3.3 地域市場シェア、2022年
14.11.4 製品ベンチマーク
14.12 Sysmex Corporation
14.12.1 会社概要
14.12.2 会社概要
14.12.3 財務分析
14.12.3.1 純収入、2017-2022年
14.12.3.2 R&D、2017-2022年
14.12.3.3 地域市場シェア、2022年
14.12.4 製品ベンチマーク
14.13 Guardant Health
14.13.1 会社概要
14.13.2 会社概要
14.13.3 財務分析
14.13.3.1 純収入、2017-2022年
14.13.3.2 R&D、2017-2022年
14.13.3.3 地域市場シェア、2022年
14.13.4 製品ベンチマーク
15 結論と提言
15.1 Visiongainからの結びの言葉
15.2 市場プレイヤーへの提言
ページTOPに戻る
図表リスト
表の一覧
Table 1 Companion Diagnostics (CDx) Market Snapshot, 2024 & 2034 (US$ Million, AGR %)
Table 2 Companion Diagnostics (CDx) Market Forecast by Region, 2024-2034 (US$ Million, CAGR%): “V” Shaped Recovery
Table 3 Companion Diagnostics (CDx) Market Forecast by Region, 2024-2034 (US$ Million, CAGR%): “U” Shaped Recovery
Table 4 Companion Diagnostics (CDx) Market Forecast by Region, 2024-2034 (US$ Million, CAGR%): “W” Shaped Recovery
Table 5 Companion Diagnostics (CDx) Market Forecast by Region, 2024-2034 (US$ Million, CAGR%): “L” Shaped Recovery
Table 6 Companion Diagnostic Market Forecast by Product & Services, 2024-2034 (US$ Million, CAGR%)
Table 7 Assays, Kits & Reagents Segment Market Forecast by Region, 2024-2034 (US$ Million, CAGR%)
Table 8 Software & Services Segment Market Forecast by Region, 2024-2034 (US$ Million, CAGR%)
Table 9 Companion Diagnostic Market Forecast by Indication, 2024-2034 (US$ Million, CAGR%)
Table 10 Cancer Segment Market Forecast by Region, 2024-2034 (US$ Million, CAGR%)
Table 11 Infectious Disease Segment Market Forecast by Region, 2024-2034 (US$ Million, CAGR%)
Table 12 Cardiovascular Diseases Segment Market Forecast by Region, 2024-2034 (US$ Million, CAGR%)
Table 13 Neurological Diseases Segment Market Forecast by Region, 2024-2034 (US$ Million, CAGR%)
Table 14 Other Indications Segment Market Forecast by Region, 2024-2034 (US$ Million, CAGR%)
Table 15 Companion Diagnostic Market Forecast by Technology, 2024-2034 (US$ Million, CAGR%)
Table 16 PCR Segment Market Forecast by Region, 2024-2034 (US$ Million, CAGR%)
Table 17 Next-Generation Sequencing (NGS) Segment Market Forecast by Region, 2024-2034 (US$ Million, CAGR%)
Table 18 In Situ Hybridization (ISH) Segment Market Forecast by Region, 2024-2034 (US$ Million, CAGR%)
Table 19 Immunohistochemistry (IHC) Segment Market Forecast by Region, 2024-2034 (US$ Million, CAGR%)
Table 20 Other Technologies Segment Market Forecast by Region, 2024-2034 (US$ Million, CAGR%)
Table 21 Companion Diagnostic Market Forecast by End-users, 2024-2034 (US$ Million, CAGR%)
Table 22 Pharmaceutical & Biopharmaceutical Companies Segment Market Forecast by Region, 2024-2034 (US$ Million, CAGR%)
Table 23 Reference Laboratories Segment Market Forecast by Region, 2024-2034 (US$ Million, AGR%, CAGR%)
Table 24 Contract Research Organizations (CROs) Segment Market Forecast by Region, 2024-2034 (US$ Million, CAGR%)
Table 25 Other End-users Segment Market Forecast by Region, 2024-2034 (US$ Million, CAGR%)
Table 26 Companion Diagnostics (CDx) Market Forecast by Region, 2024-2034 (US$ Million, AGR %)
Table 27 North America Companion Diagnostics (CDx) Market Forecast by Country, 2024-2034 (US$ Million, AGR %)
Table 28 North America Companion Diagnostics (CDx) Market Forecast by Product & Services, 2024-2034 (US$ Million, AGR %)
Table 29 North America Companion Diagnostics (CDx) Market Forecast by Indication, 2024-2034 (US$ Million, AGR %)
Table 30 North America Companion Diagnostics (CDx) Market Forecast by Technology, 2024-2034 (US$ Million, AGR %)
Table 31 North America Companion Diagnostics (CDx) Market Forecast by End-users, 2024-2034 (US$ Million, AGR %)
Table 32 U.S. Companion Diagnostics (CDx) Market Forecast, 2024-2034 (US$ Million, AGR %)
Table 33 Canada Companion Diagnostics (CDx) Market Forecast, 2024-2034 (US$ Million, AGR %)
Table 34 Europe Companion Diagnostics (CDx) Market Forecast by Country, 2024-2034 (US$ Million, AGR %)
Table 35 Europe Companion Diagnostics (CDx) Market Forecast by Product & Services, 2024-2034 (US$ Million, AGR %)
Table 36 Europe Companion Diagnostics (CDx) Market Forecast by Indication, 2024-2034 (US$ Million, AGR %)
Table 37 Europe Companion Diagnostics (CDx) Market Forecast by Technology, 2024-2034 (US$ Million, AGR %)
Table 38 Europe Companion Diagnostics (CDx) Market Forecast by End-users, 2024-2034 (US$ Million, AGR %)
Table 39 Germany Companion Diagnostics (CDx) Market Forecast, 2024-2034 (US$ Million, AGR %)
Table 40 UK Companion Diagnostics (CDx) Market Forecast, 2024-2034 (US$ Million, AGR %)
Table 41 France Companion Diagnostics (CDx) Market Forecast, 2024-2034 (US$ Million, AGR %)
Table 42 Italy Companion Diagnostics (CDx) Market Forecast, 2024-2034 (US$ Million, AGR %)
Table 43 Spain Companion Diagnostics (CDx) Market Forecast, 2024-2034 (US$ Million, AGR %)
Table 44 Rest of Europe Companion Diagnostics (CDx) Market Forecast, 2024-2034 (US$ Million, AGR %)
Table 45 Asia Pacific Companion Diagnostics (CDx) Market Forecast by Country, 2024-2034 (US$ Million, AGR %)
Table 46 Asia Pacific Companion Diagnostics (CDx) Market Forecast by Product & Services, 2024-2034 (US$ Million, AGR %)
Table 47 Asia Pacific Companion Diagnostics (CDx) Market Forecast by Indication, 2024-2034 (US$ Million, AGR %)
Table 48 Asia Pacific Companion Diagnostics (CDx) Market Forecast by Technology, 2024-2034 (US$ Million, AGR %)
Table 49 Asia Pacific Companion Diagnostics (CDx) Market Forecast by End-users, 2024-2034 (US$ Million, AGR %)
Table 50 China Companion Diagnostics (CDx) Market Forecast, 2024-2034 (US$ Million, AGR %)
Table 51 Japan Companion Diagnostics (CDx) Market Forecast, 2024-2034 (US$ Million, AGR %)
Table 52 India Companion Diagnostics (CDx) Market Forecast, 2024-2034 (US$ Million, AGR %)
Table 53 Australia Companion Diagnostics (CDx) Market Forecast, 2024-2034 (US$ Million, AGR %)
Table 54 South Korea Companion Diagnostics (CDx) Market Forecast, 2024-2034 (US$ Million, AGR %)
Table 55 Rest of Asia Pacific Companion Diagnostics (CDx) Market Forecast, 2024-2034 (US$ Million, AGR %)
Table 56 Latin America Companion Diagnostics (CDx) Market Forecast by Country, 2024-2034 (US$ Million, AGR %)
Table 57 Latin America Companion Diagnostics (CDx) Market Forecast by Product & Services, 2024-2034 (US$ Million, AGR %)
Table 58 Latin America Companion Diagnostics (CDx) Market Forecast by Indication, 2024-2034 (US$ Million, AGR %)
Table 59 Latin America Companion Diagnostics (CDx) Market Forecast by Technology, 2024-2034 (US$ Million, AGR %)
Table 60 Latin America Companion Diagnostics (CDx) Market Forecast by End-users, 2024-2034 (US$ Million, AGR %)
Table 61 Brazil Companion Diagnostics (CDx) Market Forecast, 2024-2034 (US$ Million, AGR %)
Table 62 Mexico Companion Diagnostics (CDx) Market Forecast, 2024-2034 (US$ Million, AGR %)
Table 63 Rest of Latin America Companion Diagnostics (CDx) Market Forecast, 2024-2034 (US$ Million, AGR %)
Table 64 MEA Companion Diagnostics (CDx) Market Forecast by Country, 2024-2034 (US$ Million, AGR %)
Table 65 MEA Companion Diagnostics (CDx) Market Forecast by Product & Services, 2024-2034 (US$ Million, AGR %)
Table 66 MEA Companion Diagnostics (CDx) Market Forecast by Indication, 2024-2034 (US$ Million, AGR %)
Table 67 MEA Companion Diagnostics (CDx) Market Forecast by Technology, 2024-2034 (US$ Million, AGR %)
Table 68 MEA Companion Diagnostics (CDx) Market Forecast by End-users, 2024-2034 (US$ Million, AGR %)
Table 69 South Africa Companion Diagnostics (CDx) Market Forecast, 2024-2034 (US$ Million, AGR %)
Table 70 GCC Companion Diagnostics (CDx) Market Forecast, 2024-2034 (US$ Million, AGR %)
Table 71 Rest of MEA Companion Diagnostics (CDx) Market Forecast, 2024-2034 (US$ Million, AGR %)
Table 72 Strategic Outlook
Table 73 F. Hoffmann-La Roche Ltd: Key Details, (CEO, HQ, Revenue, Founded, No. of Employees, Company Type, Website, Business Segment)
Table 74 F. Hoffmann-La Roche Ltd: Product Benchmarking
Table 75 F. Hoffmann-La Roche Ltd: Strategic Outlook
Table 76 Agilent Technologies, Inc.: Key Details, (CEO, HQ, Revenue, Founded, No. of Employees, Company Type, Website, Business Segment)
Table 77 Agilent Technologies, Inc.: Product Benchmarking
Table 78 Agilent Technologies, Inc.: Strategic Outlook
Table 79 QIAGEN: Key Details, (CEO, HQ, Revenue, Founded, No. of Employees, Company Type, Website, Business Segment)
Table 80 QIAGEN: Product Benchmarking
Table 81 Thermo Fisher Scientific: Key Details, (CEO, HQ, Revenue, Founded, No. of Employees, Company Type, Website, Business Segment)
Table 82 Thermo Fisher Scientific.: Product Benchmarking
Table 83 Abbott: Key Details, (CEO, HQ, Revenue, Founded, No. of Employees, Company Type, Website, Business Segment)
Table 84 Abbott: Product Benchmarking
Table 85 Almac Group: Key Details, (CEO, HQ, Revenue, Founded, No. of Employees, Company Type, Website, Business Segment)
Table 86 Almac Group: Product Benchmarking
Table 87 Almac Group: Strategic Outlook
Table 88 Danaher Corporation: Key Details, (CEO, HQ, Revenue, Founded, No. of Employees, Company Type, Website, Business Segment)
Table 89 Danaher Corporation: Product Benchmarking
Table 90 Illumina: Key Details, (CEO, HQ, Revenue, Founded, No. of Employees, Company Type, Website, Business Segment)
Table 91 Illumina: Product Benchmarking
Table 92 Illumina: Strategic Outlook
Table 93 bioMerieux: Key Details, (CEO, HQ, Revenue, Founded, No. of Employees, Company Type, Website, Business Segment)
Table 94 Biomurieux: Product Benchmarking
Table 95 Myriad Genetics, Inc.: Key Details, (CEO, HQ, Revenue, Founded, No. of Employees, Company Type, Website, Business Segment)
Table 96 MYRIAD GENETICS, INC.: Product Benchmarking
Table 97 Sysmex Corporation: Key Details, (CEO, HQ, Revenue, Founded, No. of Employees, Company Type, Website, Business Segment)
Table 98 Sysmex Corporation: Product Benchmarking
Table 99 Guardant Health: Key Details, (CEO, HQ, Revenue, Founded, No. of Employees, Company Type, Website, Business Segment)
Table 100 GUARDANT HEALTH: Product Benchmarking
図の一覧
Figure 1 Companion Diagnostics (CDx) Market Segmentation
Figure 2 Companion Diagnostics (CDx) Market by Technology: Market Attractiveness Index
Figure 3 Companion Diagnostics (CDx) Market by Indication: Market Attractiveness Index
Figure 4 Companion Diagnostics (CDx) Market by Product & Services: Market Attractiveness Index
Figure 5 Companion Diagnostics (CDx) Market by End-users: Market Attractiveness Index
Figure 6 Companion Diagnostics (CDx) Market Attractiveness Index by Region
Figure 7 Companion Diagnostics (CDx) Market: Market Dynamics
Figure 8 Companion Diagnostics (CDx) Market by Region, 2024-2034 (US$ Million, AGR %): “V” Shaped Recovery
Figure 9 Companion Diagnostics (CDx) Market by Region, 2024-2034 (US$ Million, AGR %): “U” Shaped Recovery
Figure 10 Companion Diagnostic Market by Region, 2024-2034 (US$ Million, AGR %): “W” Shaped Recovery
Figure 11 Companion Diagnostic Market by Region, 2024-2034 (US$ Million, AGR %): “L” Shaped Recovery
Figure 12 PEST Analysis of Companion Diagnostic Market
Figure 13 Companion Diagnostics (CDx) Market by Product & Services: Market Attractiveness Index
Figure 14 Companion Diagnostics (CDx) Market Forecast by Product & Services, 2024-2034 (US$ Million, AGR %)
Figure 15 Companion Diagnostics (CDx) Market Share Forecast by Product & Services, 2024, 2029, 2034 (%)
Figure 16 Assays, Kits & Reagents Segment Market Forecast by Region, 2024-2034 (US$ Million, AGR %)
Figure 17 Assays, Kits & Reagents Segment Market Share Forecast by Region, 2024 & 2034 (%)
Figure 18 Software & Services Segment Market Forecast by Region, 2024-2034 (US$ Million, AGR %)
Figure 19 Software & Services Segment Market Share Forecast by Region, 2024 & 2034 (%)
Figure 20 Companion Diagnostics (CDx) Market by Indication: Market Attractiveness Index
Figure 21 Companion Diagnostics (CDx) Market Forecast by Indication, 2024-2034 (US$ Million, AGR %)
Figure 22 Companion Diagnostics (CDx) Market Share Forecast by Indication, 2024, 2029, 2034 (%)
Figure 23 Cancer Segment Market Forecast by Region, 2024-2034 (US$ Million, AGR %)
Figure 24 Cancer Segment Market Share Forecast by Region, 2024 & 2034 (%)
Figure 25 Infectious Disease Segment Market Forecast by Region, 2024-2034 (US$ Million, AGR %)
Figure 26 Infectious Disease Segment Market Share Forecast by Region, 2024 & 2034 (%)
Figure 27 Cardiovascular Diseases Segment Market Forecast by Region, 2024-2034 (US$ Million, AGR %)
Figure 28 Cardiovascular Diseases Segment Market Share Forecast by Region, 2024 & 2034 (%)
Figure 29 Neurological Diseases Segment Market Forecast by Region, 2024-2034 (US$ Million, AGR %)
Figure 30 Neurological Diseases Segment Market Share Forecast by Region, 2024 & 2034 (%)
Figure 31 Other Indications Segment Market Forecast by Region, 2024-2034 (US$ Million, AGR %)
Figure 32 Other Indications Segment Market Share Forecast by Region, 2024 & 2034 (%)
Figure 33 Companion Diagnostics (CDx) Market by Technology: Market Attractiveness Index
Figure 34 Companion Diagnostics (CDx) Market Forecast by Technology, 2024-2034 (US$ Million, AGR %)
Figure 35 Companion Diagnostics (CDx) Market Share Forecast by Technology, 2024, 2029, 2034 (%)
Figure 36 Polymerase Chain Reaction (PCR) Segment Market Forecast by Region, 2024-2034 (US$ Million, AGR %)
Figure 37 Polymerase Chain Reaction (PCR) Segment Market Share Forecast by Region, 2024 & 2034 (%)
Figure 38 Next-Generation Sequencing (NGS) Segment Market Forecast by Region, 2024-2034 (US$ Million, AGR %)
Figure 39 Next-Generation Sequencing (NGS) Segment Market Share Forecast by Region, 2024 & 2034 (%)
Figure 40 In Situ Hybridization (ISH) Segment Market Forecast by Region, 2024-2034 (US$ Million, AGR %)
Figure 41 In Situ Hybridization (ISH) Segment Market Share Forecast by Region, 2024 & 2034 (%)
Figure 42 Immunohistochemistry (IHC) Segment Market Forecast by Region, 2024-2034 (US$ Million, AGR %)
Figure 43 Immunohistochemistry (IHC) Segment Market Share Forecast by Region, 2024 & 2034 (%)
Figure 44 Other Technologies Segment Market Forecast by Region, 2024-2034 (US$ Million, AGR %)
Figure 45 Other Technologies Segment Market Share Forecast by Region, 2024 & 2034 (%)
Figure 46 Companion Diagnostics (CDx) Market by End-users: Market Attractiveness Index
Figure 47 Companion Diagnostics (CDx) Market Forecast by End-users, 2024-2034 (US$ Million, AGR %)
Figure 48 Companion Diagnostics (CDx) Market Share Forecast by End-users, 2024, 2029, 2034 (%)
Figure 49 Pharmaceutical & Biopharmaceutical Companies Segment Market Forecast by Region, 2024-2034 (US$ Million, AGR %)
Figure 50 Pharmaceutical & Biopharmaceutical Companies Segment Market Share Forecast by Region, 2024 & 2034 (%)
Figure 51 Reference Laboratories Segment Market Forecast by Region, 2024-2034 (US$ Million, AGR %)
Figure 52 Reference Laboratories Segment Market Share Forecast by Region, 2024 & 2034 (%)
Figure 53 Contract Research Organizations (CROs) Segment Market Forecast by Region, 2024-2034 (US$ Million, AGR %)
Figure 54 Contract Research Organizations (CROs) Segment Market Share Forecast by Region, 2024 & 2034 (%)
Figure 55 Other End-users Segment Market Forecast by Region, 2024-2034 (US$ Million, AGR %)
Figure 56 Other End-users Segment Market Share Forecast by Region, 2024 & 2034 (%)
Figure 57 Companion Diagnostics (CDx) Market Forecast by Region 2024 and 2034 (Revenue, CAGR%)
Figure 58 Companion Diagnostics (CDx) Market Share Forecast by Region 2024, 2029, 2034 (%)
Figure 59 Companion Diagnostics (CDx) Market by Region, 2024-2034 (US$ Million, AGR %)
Figure 60 North America Companion Diagnostics (CDx) Market Attractiveness Index
Figure 61 North America Companion Diagnostics (CDx) Market by Region, 2024, 2029 & 2034 (US$ Million)
Figure 62 North America Companion Diagnostics (CDx) Market Forecast by Country, 2024-2034 (US$ Million, AGR %)
Figure 63 North America Companion Diagnostics (CDx) Market Share Forecast by Country, 2024 & 2034 (%)
Figure 64 North America Companion Diagnostics (CDx) Market Forecast by Product & Services, 2024-2034 (US$ Million, AGR %)
Figure 65 North America Companion Diagnostics (CDx) Market Share Forecast by Product & Services, 2024 & 2034 (%)
Figure 66 North America Companion Diagnostics (CDx) Market Forecast by Indication, 2024-2034 (US$ Million, AGR %)
Figure 67 North America Companion Diagnostics (CDx) Market Share Forecast by Indication, 2024 & 2034 (%)
Figure 68 North America Companion Diagnostics (CDx) Market Forecast by Technology, 2024-2034 (US$ Million, AGR %)
Figure 69 North America Companion Diagnostics (CDx) Market Share Forecast by Technology, 2024 & 2034 (%)
Figure 70 North America Companion Diagnostics (CDx) Market Forecast by End-users, 2024-2034 (US$ Million, AGR %)
Figure 71 North America Companion Diagnostics (CDx) Market Share Forecast by End-users, 2024 & 2034 (%)
Figure 72 U.S. Companion Diagnostics (CDx) Market Forecast, 2024-2034 (US$ Million, AGR %)
Figure 73 Canada Companion Diagnostics (CDx) Market Forecast, 2024-2034 (US$ Million, AGR %)
Figure 74 Europe Companion Diagnostics (CDx) Market Attractiveness Index
Figure 75 Europe Companion Diagnostics (CDx) Market by Region, 2024, 2029 & 2034 (US$ Million)
Figure 76 Europe Companion Diagnostics (CDx) Market Forecast by Country, 2024-2034 (US$ Million, AGR %)
Figure 77 Europe Companion Diagnostics (CDx) Market Share Forecast by Country, 2024 & 2034 (%)
Figure 78 Europe Companion Diagnostics (CDx) Market Forecast by Product & Services, 2024-2034 (US$ Million, AGR %)
Figure 79 Europe Companion Diagnostics (CDx) Market Share Forecast by Product & Services, 2024 & 2034 (%)
Figure 80 Europe Companion Diagnostics (CDx) Market Forecast by Indication, 2024-2034 (US$ Million, AGR %)
Figure 81 Europe Companion Diagnostics (CDx) Market Share Forecast by Indication, 2024 & 2034 (%)
Figure 82 Europe Companion Diagnostics (CDx) Market Forecast by Technology, 2024-2034 (US$ Million, AGR %)
Figure 83 Europe Companion Diagnostics (CDx) Market Share Forecast by Technology, 2024 & 2034 (%)
Figure 84 Europe Companion Diagnostics (CDx) Market Forecast by End-user, 2024-2034 (US$ Million, AGR %)
Figure 85 Europe Companion Diagnostics (CDx) Market Share Forecast by End-user, 2024 & 2034 (%)
Figure 86 Germany Companion Diagnostics (CDx) Market Forecast, 2024-2034 (US$ Million, AGR %)
Figure 87 UK Companion Diagnostics (CDx) Market Forecast, 2024-2034 (US$ Million, AGR %)
Figure 88 France Companion Diagnostics (CDx) Market Forecast, 2024-2034 (US$ Million, AGR %)
Figure 89 Italy Companion Diagnostics (CDx) Market Forecast, 2024-2034 (US$ Million, AGR %)
Figure 90 Spain Companion Diagnostics (CDx) Market Forecast, 2024-2034 (US$ Million, AGR %)
Figure 91 Rest of Europe Companion Diagnostics (CDx) Market Forecast, 2024-2034 (US$ Million, AGR %)
Figure 92 Asia Pacific Companion Diagnostics (CDx) Market Attractiveness Index
Figure 93 Asia Pacific Companion Diagnostics (CDx) Market by Region, 2024, 2029 & 2034 (US$ Million)
Figure 94 Asia Pacific Companion Diagnostics (CDx) Market Forecast by Country, 2024-2034 (US$ Million, AGR %)
Figure 95 Asia Pacific Companion Diagnostics (CDx) Market Share Forecast by Country, 2024 & 2034 (%)
Figure 96 Asia Pacific Companion Diagnostics (CDx) Market Forecast by Product & Services, 2024-2034 (US$ Million, AGR %)
Figure 97 Asia Pacific Companion Diagnostics (CDx) Market Share Forecast by Product & Services, 2024 & 2034 (%)
Figure 98 Asia Pacific Companion Diagnostics (CDx) Market Forecast by Indication, 2024-2034 (US$ Million, AGR %)
Figure 99 Asia Pacific Companion Diagnostics (CDx) Market Share Forecast by Indication, 2024 & 2034 (%)
Figure 100 Asia Pacific Companion Diagnostics (CDx) Market Forecast by Technology, 2024-2034 (US$ Million, AGR %)
Figure 101 Asia Pacific Companion Diagnostics (CDx) Market Share Forecast by Technology, 2024 & 2034 (%)
Figure 102 Asia Pacific Companion Diagnostics (CDx) Market Forecast by End-users, 2024-2034 (US$ Million, AGR %)
Figure 103 Asia Pacific Companion Diagnostics (CDx) Market Share Forecast by End-users, 2024 & 2034 (%)
Figure 104 China Companion Diagnostics (CDx) Market Forecast, 2024-2034 (US$ Million, AGR %)
Figure 105 Japan Companion Diagnostics (CDx) Market Forecast, 2024-2034 (US$ Million, AGR %)
Figure 106 India Companion Diagnostics (CDx) Market Forecast, 2024-2034 (US$ Million, AGR %)
Figure 107 Australia Companion Diagnostics (CDx) Market Forecast, 2024-2034 (US$ Million, AGR %)
Figure 108 South Korea Companion Diagnostics (CDx) Market Forecast, 2024-2034 (US$ Million, AGR %)
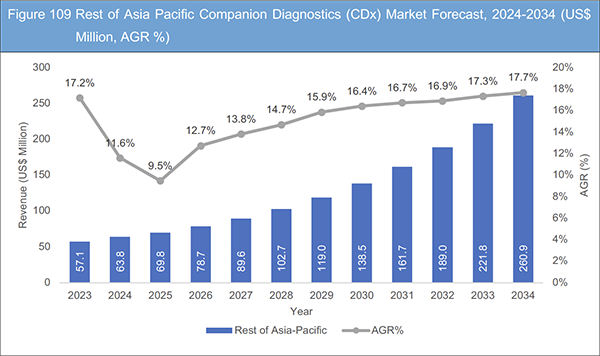
Figure 109 Rest of Asia Pacific Companion Diagnostics (CDx) Market Forecast, 2024-2034 (US$ Million, AGR %)
Figure 110 Latin America Companion Diagnostics (CDx) Market Attractiveness Index
Figure 111 Latin America Companion Diagnostics (CDx) Market by Region, 2024, 2029 & 2034 (US$ Million)
Figure 112 Latin America Companion Diagnostics (CDx) Market Forecast by Country, 2024-2034 (US$ Million, AGR %)
Figure 113 Latin America Companion Diagnostics (CDx) Market Share Forecast by Country, 2024 & 2034 (%)
Figure 114 Latin America Companion Diagnostics (CDx) Market Forecast by Product & Services, 2024-2034 (US$ Million, AGR %)
Figure 115 Latin America Companion Diagnostics (CDx) Market Share Forecast by Product & Services, 2024 & 2034 (%)
Figure 116 Latin America Companion Diagnostics (CDx) Market Forecast by Indication, 2024-2034 (US$ Million, AGR %)
Figure 117 Latin America Companion Diagnostics (CDx) Market Share Forecast by Indication, 2024 & 2034 (%)
Figure 118 Latin America Companion Diagnostics (CDx) Market Forecast by Technology, 2024-2034 (US$ Million, AGR %)
Figure 119 Latin America Companion Diagnostics (CDx) Market Share Forecast by Technology, 2024 & 2034 (%)
Figure 120 Latin America Companion Diagnostics (CDx) Market Forecast by End-users, 2024-2034 (US$ Million, AGR %)
Figure 121 Latin America Companion Diagnostics (CDx) Market Share Forecast by End-users, 2024 & 2034 (%)
Figure 122 Brazil Companion Diagnostics (CDx) Market Forecast, 2024-2034 (US$ Million, AGR %)
Figure 123 Mexico Companion Diagnostics (CDx) Market Forecast, 2024-2034 (US$ Million, AGR %)
Figure 124 Rest of Latin America Companion Diagnostics (CDx) Market Forecast, 2024-2034 (US$ Million, AGR %)
Figure 125 MEA Companion Diagnostics (CDx) Market Attractiveness Index
Figure 126 MEA Companion Diagnostics (CDx) Market by Region, 2024, 2029 & 2034 (US$ Million)
Figure 127 MEA Companion Diagnostics (CDx) Market Forecast by Country, 2024-2034 (US$ Million, AGR %)
Figure 128 MEA Companion Diagnostics (CDx) Market Share Forecast by Country, 2024 & 2034 (%)
Figure 129 MEA Companion Diagnostics (CDx) Market Forecast by Product & Services, 2024-2034 (US$ Million, AGR %)
Figure 130 MEA Companion Diagnostics (CDx) Market Share Forecast by Product & Services, 2024 & 2034 (%)
Figure 131 MEA Companion Diagnostics (CDx) Market Forecast by Indication, 2024-2034 (US$ Million, AGR %)
Figure 132 MEA Companion Diagnostics (CDx) Market Share Forecast by Indication, 2024 & 2034 (%)
Figure 133 MEA Companion Diagnostics (CDx) Market Forecast by Technology, 2024-2034 (US$ Million, AGR %)
Figure 134 MEA Companion Diagnostics (CDx) Market Share Forecast by Technology, 2024 & 2034 (%)
Figure 135 MEA Companion Diagnostics (CDx) Market Forecast by End-users, 2024-2034 (US$ Million, AGR %)
Figure 136 MEA Companion Diagnostics (CDx) Market Share Forecast by End-users, 2024 & 2034 (%)
Figure 137 South Africa Companion Diagnostics (CDx) Market Forecast, 2024-2034 (US$ Million, AGR %)
Figure 138 GCC Companion Diagnostics (CDx) Market Forecast, 2024-2034 (US$ Million, AGR %)
Figure 139 Rest of MEA Companion Diagnostics (CDx) Market Forecast, 2024-2034 (US$ Million, AGR %)
Figure 140 F. Hoffmann-La Roche Ltd: Net Revenue, 2017-2022 (US$ Million, AGR%)
Figure 141 F. Hoffmann-La Roche Ltd: R&D, 2017-2022 (US$ Million, AGR%)
Figure 142 F. Hoffmann-La Roche Ltd: Regional Market Shares, 2022
Figure 143 Agilent Technologies, Inc.: Net Revenue, 2017-2022 (US$ Million, AGR%)
Figure 144 Agilent Technologies, Inc.: R&D, 2017-2022 (US$ Million, AGR%)
Figure 145 Agilent Technologies, Inc.: Regional Market Shares, 2022
Figure 146 QIAGEN: Net Revenue, 2017-2022 (US$ Million, AGR%)
Figure 147 QIAGEN: R&D, 2017-2022 (US$ Million, AGR%)
Figure 148 QIAGEN: Regional Market Shares, 2022
Figure 149 Thermo Fisher Scientific: Net Revenue, 2017-2022 (US$ Million, AGR%)
Figure 150 Thermo Fisher Scientific.: Regional Market Shares, 2022
Figure 151 Abbott: Net Revenue, 2017-2022 (US$ Million, AGR%)
Figure 152 Abbott: R&D, 2017-2022 (US$ Million, AGR%)
Figure 153 Abbott: Regional Market Shares, 2022
Figure 154 Danaher Corporation: Net Revenue, 2017-2022 (US$ Million, AGR%)
Figure 155 Danaher Corporation: Regional Market Shares, 2022
Figure 156 Illumina: Net Revenue, 2017-2022 (US$ Million, AGR%)
Figure 157 Illumina: R&D, 2017-2022 (US$ Million, AGR%)
Figure 158 Illumina: Regional Market Shares, 2022
Figure 159 bioMerieux: Net Revenue, 2017-2022 (US$ Million, AGR%)
Figure 160 bioMerieux: Regional Market Shares, 2022
Figure 161 Myriad Genetics, Inc.: Net Revenue, 2017-2022 (US$ Million, AGR%)
Figure 162 Myriad Genetics, Inc.: R&D, 2017-2022 (US$ Million, AGR%)
Figure 163 Myriad Genetics, Inc.: Regional Market Shares, 2022
Figure 164 Sysmex Corp: Net Revenue, 2017-2022 (US$ Million, AGR%)
Figure 165 Sysmex Corp: R&D, 2017-2022 (US$ Million, AGR%)
Figure 166 Sysmex Corp: Regional Market Shares, 2022
Figure 167 Guardant Health: Net Revenue, 2017-2022 (US$ Million, AGR%)
Figure 168 Guardant Health: R&D, 2017-2022 (US$ Million, AGR%)
Figure 169 GUARDANT HEALTH, INC: Regional Market Shares, 2022
ページTOPに戻る
Summary
Report Details
The Companion Diagnostics (CDx) Market Report 2024-2034: This report will prove invaluable to leading firms striving for new revenue pockets if they wish to understand the industry and its underlying dynamics better. It will be useful for companies that want to expand into different industries or their existing operations in a new region.
Technological Improvements in the CDx Market
The market for CDx is expanding thanks in large part to technological developments. Better, more sensitive, and more focused CDx tests are coming from these developments. Important technical developments in CDx include the following:
-
Next-generation sequencing (NGS): Entire tumour genomes can be sequenced using NGS, a high-throughput sequencing technology. This data can be used to pinpoint genetic mutations that particular medications can target.
-
Liquid biopsy: A less intrusive procedure that can identify cancer cells and other indicators in the circulation is liquid biopsy. This test can be used to track the course of cancer and the effectiveness of treatment and is less intrusive than conventional tissue biopsies.
-
AI (artificial intelligence): AI is being used to create computer algorithms capable of analysing enormous amounts of CDx data. This information can be utilised to spot patterns and forecast patient outcomes.
These technological improvements are having a significant impact on the CDx industry and are projected to fuel market expansion in the coming years. CDx tests are getting more accurate, sensitive, and inexpensive as a result of these improvements, and they are playing an increasingly essential role in personalised medicine.
In 2023, a number of significant businesses plan to make significant investments in companion diagnostics. Here are few instances:
-
Roche: With a strong emphasis on cancer, Roche is a prominent player in the companion diagnostics (CDx) market. The business has created a number of complementary diagnostics for its targeted cancer treatments, including Zelboraf and Herceptin.
-
Another significant participant in the companion diagnostics business is Abbott Laboratories. The Clariscan companion diagnostic test from the company assists in forecasting a patient’s reaction to the chemotherapy medication irinotecan.
-
Thermo Fisher Scientific: This top supplier of tools and supplies for companion diagnostic testing is Thermo Fisher Scientific. Several firms are developing companion diagnostic tests using the company’s Ion Torrent NGS platform.
Hence, these improvements and new product introductions highlight the CDx market’s dynamic nature and its potential to revolutionise cancer therapy by providing precision medicine.
High Capital Investment and Low Cost-benefit Ratio Likely to Challenge Industry Growth
These specialised tests require significant capital expenditure to design and validate. Companion diagnostics, in contrast to more general diagnostic instruments, serve a specific and narrower population. This indicates that the market may not be as large as expected, which would make it difficult to recover the high expenses associated with R&D and obtaining necessary permits. These tests also frequently need for advanced infrastructure and technologies, which raises the cost even further.
The development and validation of these specialised tests necessitates substantial capital commitment. Companion diagnostics, as opposed to broader diagnostic instruments, target a smaller, more specific group. As a result, the market size may be limited, making it difficult to recoup the significant expenditures of research, development, and regulatory approvals. Furthermore, these examinations frequently necessitate expensive technology and infrastructure, which increases the budgetary load.
However, calculating the cost-benefit ratio might be difficult. Companion diagnostics have the potential to improve treatment efficacy and reduce waste by ensuring that the right patients receive the proper treatment. This can result in cost reductions for healthcare systems as well as better patient outcomes. However, realising these benefits is contingent on a number of circumstances, including the prevalence of the targeted group, the efficacy of the companion medication, and the cost of the test itself.
When the target population is small or the diagnostic cost is high, the cost-benefit ratio may be skewed to the negative. Manufacturers may be discouraged from investing in companion diagnostics, even if they provide great therapeutic value.
What Questions Should You Ask Before Buying a Market Research Report?
-
How is the companion diagnostics (CDx) market evolving?
-
What is driving and restraining companion diagnostics (CDx) market?
-
How will each companion diagnostics (CDx) submarket segment grow over the forecast period, and how much revenue will these submarkets account for in 2034?
-
How will the market shares for each companion diagnostics submarket develop from 2024 to 2034?
-
What will be the main driver for the overall market from 2024 to 2034?
-
Will leading companion diagnostics (CDx) markets broadly follow the macroeconomic dynamics, or will individual national markets outperform others?
-
How will the market shares of the national markets change by 2034, and which geographical region will lead the market in 2034?
-
Who are the leading players, and what are their prospects over the forecast period?
-
What are the companion diagnostics (CDx) projects for these leading companies?
-
How will the industry evolve during the period between 2024 and 2034? What are the implications of companion diagnostics projects taking place now and over the next 10 years?
-
Is there a greater need for product commercialization to further scale companion diagnostics (CDx) market?
-
Where is the companion diagnostics (CDx) market heading and how can you ensure you are at the forefront of the market?
-
What are the best investment options for new product and service lines?
-
What are the key prospects for moving companies into a new growth path and C-suite?
You need to discover how this will impact the Companion Diagnostics (CDx) Market today, and over the next 10 years:
-
Our 307-page report provides 100 tables and 170 charts/graphs exclusively to you.
-
The report highlights key lucrative areas in the industry so you can target them – NOW.
-
It contains in-depth analysis of global, regional and national sales and growth.
-
It highlights for you the key successful trends, changes and revenue projections made by your competitors.
This report tells you TODAY how the Companion Diagnostics (CDx) Market will develop in the next 10 years, and in line with the variations in COVID-19 economic recession and bounce. This market is more critical now than at any point over the last 10 years.
Forecasts to 2034 and other analyses reveal commercial prospects
-
In addition to revenue forecasting to 2034, our new study provides you with recent results, growth rates, and market shares.
-
You will find original analyses, with business outlooks and developments.
-
Discover qualitative analyses (including market dynamics, drivers, opportunities, restraints and challenges), cost structure, impact of rising Companion Diagnostics prices and recent developments.
This report includes data analysis and invaluable insight into how COVID-19 will affect the industry and your company. Four COVID-19 recovery patterns and their impact, namely, “V”, “L”, “W” and “U” are discussed in this report.
Segments Covered in the Report
Product & Services
-
Assays, Kits & Reagents
-
Software & Services
Technology
-
Polymerase Chain Reaction (PCR)
-
Next-Generation Sequencing (NGS)
-
In Situ Hybridization (ISH)
-
Immunohistochemistry (IHC)
-
Other Technologies
Indication
-
Cancer
-
Infectious Diseases
-
Cardiovascular Diseases
-
Neurological Diseases
-
Other Indications
End-users
-
Pharmaceutical & Biopharmaceutical Companies
-
Reference Laboratories
-
Contract Research Organizations (CROs)
-
Other End-users
In addition to the revenue predictions for the overall world market and segments, you will also find revenue forecasts for five regional and the U.S., China, U.K., India, and Brazil leading national markets:
North America
Europe
-
Germany
-
UK
-
France
-
Spain
-
Italy
-
Rest of Europe
Asia Pacific
-
China
-
Japan
-
India
-
Australia
-
South Korea
-
Rest of Asia Pacific
Latin America
-
Brazil
-
Mexico
-
Rest of Latin America
MEA
-
GCC
-
South Africa
-
Rest of MEA
The report also includes profiles and for some of the leading companies in the Companion Diagnostics (CDx) Market, 2024 to 2034, with a focus on this segment of these companies’ operations.
Leading Companies profiled in the report
-
Abbott
-
Agilent Technologies, Inc.
-
Almac Group
-
bioMerieux
-
Danaher Corporation
-
F. Hoffmann-La Roche Ltd
-
Guardant Health
-
Illumina, Inc.
-
Myriad Genetics, Inc.
-
QIAGEN
-
Sysmex Corporation
-
Thermo Fisher Scientific Inc.
Overall world revenue for Companion Diagnostics (CDx) Market, 2024 to 2034 in terms of value the market will surpass US$6,500 million in 2024, our work calculates. We predict strong revenue growth through to 2034. Our work identifies which organizations hold the greatest potential. Discover their capabilities, progress, and commercial prospects, helping you stay ahead.
How will the Companion Diagnostics (CDx) Market, 2024 to 2034 report help you?
In summary, our 300+ page report provides you with the following knowledge:
-
Revenue forecasts to 2034 for Companion Diagnostics (CDx) Market, 2024 to 2034, with forecasts for product & services, technology, indication, and end-users each forecast at a global and regional level – discover the industry’s prospects, finding the most lucrative places for investments and revenues.
-
Revenue forecasts to 2034 for five regional and 16 key national markets – See forecasts for the Companion Diagnostics (CDx) Market, 2024 to 2034 market in North America, Europe, Asia-Pacific, Latin America, and MEA. Also forecasted is the market in the US, Canada, Mexico, Brazil, Germany, France, UK, Italy, China, India, Japan, and Australia among other prominent economies.
-
Prospects for established firms and those seeking to enter the market – including company profiles for Abbott, Agilent Technologies, Inc., Almac Group, bioMerieux, Danaher Corporation, F. Hoffmann-La Roche Ltd, Guardant Health, Illumina, Myriad Genetics, Inc,, QIAGEN, Sysmex Corporation, and Thermo Fisher Scientific Inc. and other major companies involved in the Companion Diagnostics (CDx) Market.
Find quantitative and qualitative analyses with independent predictions. Receive information that only our report contains, staying informed with invaluable business intelligence.
Information found nowhere else
With our new report, you are less likely to fall behind in knowledge or miss out on opportunities. See how our work could benefit your research, analyses, and decisions. Visiongain’s study is for everybody needing commercial analyses for the Companion Diagnostics (CDx) Market, 2024 to 2034, market-leading companies. You will find data, trends and predictions.
ページTOPに戻る
Table of Contents
Table of Contents
1 Report Overview
1.1 Objectives of the Study
1.2 Introduction to Companion Diagnostics (CDx) Market
1.3 What This Report Delivers
1.4 Why You Should Read This Report
1.5 Key Questions Answered by This Analytical Report
1.6 Who is This Report for?
1.7 Methodology
1.7.1 Market Definitions
1.7.2 Market Evaluation & Forecasting Methodology
1.7.3 Data Validation
1.7.3.1 Primary Research
1.7.3.2 Secondary Research
1.8 Frequently Asked Questions (FAQs)
1.9 Associated Visiongain Reports
1.10 About Visiongain
2 Executive Summary
3 Market Overview
3.1 Key Findings
3.2 Market Dynamics
3.2.1 Market Driving Factors
3.2.1.1 Increasing Rate of Chronic Illnesses
3.2.1.2 Technological Improvements in the CDx Market
3.2.1.3 Increasing Public Awareness of Personalised Medicine
3.2.1.4 Growing Need for Targeted Therapy
3.2.1.5 Rising Importance of Personalized Medicine
3.2.1.6 Increasing Global Incidence of Cancer
3.2.1.7 Growing Application Areas of Companion Diagnostics
3.2.2 Market Restraining Factors
3.2.2.1 Serious Issues and Substantial Medical Costs
3.2.2.2 Creating and Approving CDx Tests is a Challenging and Intricate Process.
3.2.2.3 High Capital Investment and Low Cost-benefit Ratio
3.2.2.4 Uncertain Reimbursement Scenario in Different Regions
3.2.2.5 High Cost of Immunotherapy Treatment
3.2.3 Market Opportunities
3.2.3.1 Creating New CDx Tests for Novel Targeted Medicines
3.2.3.2 Favourable Government Policies
3.2.3.3 Expansion into New Geographic Markets
3.2.3.4 Increasing Demand for Next-Generation Sequencing in CDx
3.2.3.5 Growing Significance of Companion Diagnostics in Drug Development
3.2.3.6 Higher Number of Clinical Trials
3.3 COVID-19 Impact Analysis
3.4 Porter Analysis
3.5 PEST Analysis
4 Companion Diagnostics (CDx) Market Analysis by Product & Services
4.1 Key Findings
4.2 Product & Services Segment: Market Attractiveness Index
4.3 Companion Diagnostics (CDx) Market Size Estimation and Forecast by Product & Services
4.4 Assays, Kits & Reagents
4.4.1 Market Size by Region, 2024-2034 (US$ Million)
4.4.2 Market Share by Region, 2024 & 2034 (%)
4.5 Software & Services
4.5.1 Market Size by Region, 2024-2034 (US$ Million)
4.5.2 Market Share by Region, 2024 & 2034 (%)
5 Companion Diagnostics (CDx) Market Analysis by Indication
5.1 Key Findings
5.2 Indication Segment: Market Attractiveness Index
5.3 Companion Diagnostics (CDx) Market Size Estimation and Forecast by Indication
5.4 Cancer
5.4.1 Market Size by Region, 2024-2034 (US$ Million)
5.4.2 Market Share by Region, 2024 & 2034 (%)
5.5 Infectious Disease
5.5.1 Market Size by Region, 2024-2034 (US$ Million)
5.5.2 Market Share by Region, 2024 & 2034 (%)
5.6 Cardiovascular Diseases
5.6.1 Market Size by Region, 2024-2034 (US$ Million)
5.6.2 Market Share by Region, 2024 & 2034 (%)
5.7 Neurological Diseases
5.7.1 Market Size by Region, 2024-2034 (US$ Million)
5.7.2 Market Share by Region, 2024 & 2034 (%)
5.8 Other Indications
5.8.1 Market Size by Region, 2024-2034 (US$ Million)
5.8.2 Market Share by Region, 2024 & 2034 (%)
6 Companion Diagnostics (CDx) Market Analysis by Technology
6.1 Key Findings
6.2 Technology Segment: Market Attractiveness Index
6.3 Companion Diagnostics (CDx) Market Size Estimation and Forecast by Technology
6.4 Polymerase Chain Reaction (PCR)
6.4.1 Market Size by Region, 2024-2034 (US$ Million)
6.4.2 Market Share by Region, 2024 & 2034 (%)
6.5 Next-Generation Sequencing (NGS)
6.5.1 Market Size by Region, 2024-2034 (US$ Million)
6.5.2 Market Share by Region, 2024 & 2034 (%)
6.6 In Situ Hybridization (ISH)
6.6.1 Market Size by Region, 2024-2034 (US$ Million)
6.6.2 Market Share by Region, 2024 & 2034 (%)
6.7 Immunohistochemistry (IHC)
6.7.1 Market Size by Region, 2024-2034 (US$ Million)
6.7.2 Market Share by Region, 2024 & 2034 (%)
6.8 Other Technologies
6.8.1 Market Size by Region, 2024-2034 (US$ Million)
6.8.2 Market Share by Region, 2024 & 2034 (%)
7 Companion Diagnostics (CDx) Market Analysis by End-users
7.1 Key Findings
7.2 End-users Segment: Market Attractiveness Index
7.3 Companion Diagnostics (CDx) Market Size Estimation and Forecast by End-users
7.4 Pharmaceutical & Biopharmaceutical Companies
7.4.1 Market Size by Region, 2024-2034 (US$ Million)
7.4.2 Market Share by Region, 2024 & 2034 (%)
7.5 Reference Laboratories
7.5.1 Market Size by Region, 2024-2034 (US$ Million)
7.5.2 Market Share by Region, 2024 & 2034 (%)
7.6 Contract Research Organizations (CROs)
7.6.1 Market Size by Region, 2024-2034 (US$ Million)
7.6.2 Market Share by Region, 2024 & 2034 (%)
7.7 Other End-users
7.7.1 Market Size by Region, 2024-2034 (US$ Million)
7.7.2 Market Share by Region, 2024 & 2034 (%)
8 Companion Diagnostics (CDx) Market Analysis by Region
8.1 Key Findings
8.2 Regional Market Size Estimation and Forecast
9 North America Companion Diagnostics (CDx) Market Analysis
9.1 Key Findings
9.2 North America Companion Diagnostics (CDx) Market Attractiveness Index
9.3 North America Companion Diagnostics (CDx) Market by Country, 2024, 2029 & 2034 (US$ Million)
9.4 North America Companion Diagnostics (CDx) Market Size Estimation and Forecast by Country
9.5 North America Companion Diagnostics (CDx) Market Size Estimation and Forecast by Product & Services
9.6 North America Companion Diagnostics (CDx) Market Size Estimation and Forecast by Indication
9.7 North America Companion Diagnostics (CDx) Market Size Estimation and Forecast by Technology
9.8 North America Companion Diagnostics (CDx) Market Size Estimation and Forecast by End-users
9.9 U.S. Companion Diagnostics (CDx) Market Analysis
9.10 Canada Companion Diagnostics (CDx) Market Analysis
10 Europe Companion Diagnostics (CDx) Market Analysis
10.1 Key Findings
10.2 Europe Companion Diagnostics (CDx) Market Attractiveness Index
10.3 Europe Companion Diagnostics (CDx) Market by Country, 2024, 2029 & 2034 (US$ Million)
10.4 Europe Companion Diagnostics (CDx) Market Size Estimation and Forecast by Country
10.5 Europe Companion Diagnostics (CDx) Market Size Estimation and Forecast by Product & Services
10.6 Europe Companion Diagnostics (CDx) Market Size Estimation and Forecast by Indication
10.7 Europe Companion Diagnostics (CDx) Market Size Estimation and Forecast by Technology
10.8 Europe Companion Diagnostics (CDx) Market Size Estimation and Forecast by End-users
10.9 Germany Companion Diagnostics (CDx) Market Analysis
10.10 UK Companion Diagnostics (CDx) Market Analysis
10.11 France Companion Diagnostics (CDx) Market Analysis
10.12 Italy Companion Diagnostics (CDx) Market Analysis
10.13 Spain Companion Diagnostics (CDx) Market Analysis
10.14 Rest of Europe Companion Diagnostics (CDx) Market Analysis
11 Asia Pacific Companion Diagnostics (CDx) Market Analysis
11.1 Key Findings
11.2 Asia Pacific Companion Diagnostics (CDx) Market Attractiveness Index
11.3 Asia Pacific Companion Diagnostics (CDx) Market by Country, 2024, 2029 & 2034 (US$ Million)
11.4 Asia Pacific Companion Diagnostics (CDx) Market Size Estimation and Forecast by Country
11.5 Asia Pacific Companion Diagnostics (CDx) Market Size Estimation and Forecast by Product & Services
11.6 Asia Pacific Companion Diagnostics (CDx) Market Size Estimation and Forecast by Indication
11.7 Asia Pacific Companion Diagnostics (CDx) Market Size Estimation and Forecast by Technology
11.8 Asia Pacific Companion Diagnostics (CDx) Market Size Estimation and Forecast by End-users
11.9 China Companion Diagnostics (CDx) Market Analysis
11.10 Japan Companion Diagnostics (CDx) Market Analysis
11.11 India Companion Diagnostics (CDx) Market Analysis
11.12 Australia Companion Diagnostics (CDx) Market Analysis
11.13 South Korea Companion Diagnostics (CDx) Market Analysis
11.14 Rest of Asia Pacific Companion Diagnostics (CDx) Market Analysis
12 Latin America Companion Diagnostics (CDx) Market Analysis
12.1 Key Findings
12.2 Latin America Companion Diagnostics (CDx) Market Attractiveness Index
12.3 Latin America Companion Diagnostics (CDx) Market by Country, 2024, 2029 & 2034 (US$ Million)
12.4 Latin America Companion Diagnostics (CDx) Market Size Estimation and Forecast by Country
12.5 Latin America Companion Diagnostics (CDx) Market Size Estimation and Forecast by Product & Services
12.6 Latin America Companion Diagnostics (CDx) Market Size Estimation and Forecast by Indication
12.7 Latin America Companion Diagnostics (CDx) Market Size Estimation and Forecast by Technology
12.8 Latin America Companion Diagnostics (CDx) Market Size Estimation and Forecast by End-users
12.9 Brazil Companion Diagnostics (CDx) Market Analysis
12.10 Mexico Companion Diagnostics (CDx) Market Analysis
12.11 Rest of Latin America Companion Diagnostics (CDx) Market Analysis
13 MEA Companion Diagnostics (CDx) Market Analysis
13.1 Key Findings
13.2 MEA Companion Diagnostics (CDx) Market Attractiveness Index
13.3 MEA Companion Diagnostics (CDx) Market by Country, 2024, 2029 & 2034 (US$ Million)
13.4 MEA Companion Diagnostics (CDx) Market Size Estimation and Forecast by Country
13.5 MEA Companion Diagnostics (CDx) Market Size Estimation and Forecast by Product & Services
13.6 MEA Companion Diagnostics (CDx) Market Size Estimation and Forecast by Indication
13.7 MEA Companion Diagnostics (CDx) Market Size Estimation and Forecast by Technology
13.8 MEA Companion Diagnostics (CDx) Market Size Estimation and Forecast by End-users
13.9 South Africa Companion Diagnostics (CDx) Market Analysis
13.10 GCC Companion Diagnostics (CDx) Market Analysis
13.11 Rest of MEA Companion Diagnostics (CDx) Market Analysis
14 Company Profiles
14.1 Strategic Outlook
14.2 F. Hoffmann-La Roche Ltd
14.2.1 Company Snapshot
14.2.2 Company Overview
14.2.3 Financial Analysis
14.2.3.1 Net Revenue, 2017-2022
14.2.3.2 R&D, 2017-2022
14.2.3.3 Regional Market Shares, 2022
14.2.4 Product Benchmarking
14.2.5 Strategic Outlook
14.3 Agilent Technologies, Inc.
14.3.1 Company Snapshot
14.3.2 Company Overview
14.3.3 Financial Analysis
14.3.3.1 Net Revenue, 2017-2022
14.3.3.2 R&D, 2017-2022
14.3.3.3 Regional Market Shares, 2022
14.3.4 Product Benchmarking
14.3.5 Strategic Outlook
14.4 QIAGEN
14.4.1 Company Snapshot
14.4.2 Company Overview
14.4.3 Financial Analysis
14.4.3.1 Net Revenue, 2017-2022
14.4.3.2 R&D, 2017-2022
14.4.3.3 Regional Market Shares, 2022
14.4.4 Product Benchmarking
14.5 Thermo Fisher Scientific Inc.
14.5.1 Company Snapshot
14.5.2 Company Overview
14.5.3 Financial Analysis
14.5.3.1 Net Revenue, 2017-2022
14.5.3.2 Regional Market Shares, 2022
14.5.4 Product Benchmarking
14.6 Abbott
14.6.1 Company Snapshot
14.6.2 Company Overview
14.6.3 Financial Analysis
14.6.3.1 Net Revenue, 2017-2022
14.6.3.2 R&D, 2017-2022
14.6.3.3 Regional Market Shares, 2022
14.6.4 Product Benchmarking
14.7 Almac Group
14.7.1 Company Snapshot
14.7.2 Company Overview
14.7.3 Product Benchmarking
14.7.4 Strategic Outlook
14.8 Danaher Corporation
14.8.1 Company Snapshot
14.8.2 Company Overview
14.8.3 Financial Analysis
14.8.3.1 Net Revenue, 2017-2022
14.8.3.2 Regional Market Shares, 2022
14.8.4 Product Benchmarking
14.9 Illumina, Inc.
14.9.1 Company Snapshot
14.9.2 Company Overview
14.9.3 Financial Analysis
14.9.3.1 Net Revenue, 2017-2022
14.9.3.2 R&D, 2017-2022
14.9.3.3 Regional Market Shares, 2022
14.9.4 Product Benchmarking
14.9.5 Strategic Outlook
14.10 bioMerieux
14.10.1 Company Snapshot
14.10.2 Company Overview
14.10.3 Financial Analysis
14.10.3.1 Net Revenue, 2017-2022
14.10.3.2 Regional Market Shares, 2022
14.10.4 Product Benchmarking
14.11 Myriad Genetics, Inc.
14.11.1 Company Snapshot
14.11.2 Company Overview
14.11.3 Financial Analysis
14.11.3.1 Net Revenue, 2017-2022
14.11.3.2 R&D, 2017-2022
14.11.3.3 Regional Market Shares, 2022
14.11.4 Product Benchmarking
14.12 Sysmex Corporation
14.12.1 Company Snapshot
14.12.2 Company Overview
14.12.3 Financial Analysis
14.12.3.1 Net Revenue, 2017-2022
14.12.3.2 R&D, 2017-2022
14.12.3.3 Regional Market Shares, 2022
14.12.4 Product Benchmarking
14.13 Guardant Health
14.13.1 Company Snapshot
14.13.2 Company Overview
14.13.3 Financial Analysis
14.13.3.1 Net Revenue, 2017-2022
14.13.3.2 R&D, 2017-2022
14.13.3.3 Regional Market Shares, 2022
14.13.4 Product Benchmarking
15 Conclusion and Recommendations
15.1 Concluding Remarks from Visiongain
15.2 Recommendations for Market Players
ページTOPに戻る
List of Tables/Graphs
List of Tables
Table 1 Companion Diagnostics (CDx) Market Snapshot, 2024 & 2034 (US$ Million, AGR %)
Table 2 Companion Diagnostics (CDx) Market Forecast by Region, 2024-2034 (US$ Million, CAGR%): “V” Shaped Recovery
Table 3 Companion Diagnostics (CDx) Market Forecast by Region, 2024-2034 (US$ Million, CAGR%): “U” Shaped Recovery
Table 4 Companion Diagnostics (CDx) Market Forecast by Region, 2024-2034 (US$ Million, CAGR%): “W” Shaped Recovery
Table 5 Companion Diagnostics (CDx) Market Forecast by Region, 2024-2034 (US$ Million, CAGR%): “L” Shaped Recovery
Table 6 Companion Diagnostic Market Forecast by Product & Services, 2024-2034 (US$ Million, CAGR%)
Table 7 Assays, Kits & Reagents Segment Market Forecast by Region, 2024-2034 (US$ Million, CAGR%)
Table 8 Software & Services Segment Market Forecast by Region, 2024-2034 (US$ Million, CAGR%)
Table 9 Companion Diagnostic Market Forecast by Indication, 2024-2034 (US$ Million, CAGR%)
Table 10 Cancer Segment Market Forecast by Region, 2024-2034 (US$ Million, CAGR%)
Table 11 Infectious Disease Segment Market Forecast by Region, 2024-2034 (US$ Million, CAGR%)
Table 12 Cardiovascular Diseases Segment Market Forecast by Region, 2024-2034 (US$ Million, CAGR%)
Table 13 Neurological Diseases Segment Market Forecast by Region, 2024-2034 (US$ Million, CAGR%)
Table 14 Other Indications Segment Market Forecast by Region, 2024-2034 (US$ Million, CAGR%)
Table 15 Companion Diagnostic Market Forecast by Technology, 2024-2034 (US$ Million, CAGR%)
Table 16 PCR Segment Market Forecast by Region, 2024-2034 (US$ Million, CAGR%)
Table 17 Next-Generation Sequencing (NGS) Segment Market Forecast by Region, 2024-2034 (US$ Million, CAGR%)
Table 18 In Situ Hybridization (ISH) Segment Market Forecast by Region, 2024-2034 (US$ Million, CAGR%)
Table 19 Immunohistochemistry (IHC) Segment Market Forecast by Region, 2024-2034 (US$ Million, CAGR%)
Table 20 Other Technologies Segment Market Forecast by Region, 2024-2034 (US$ Million, CAGR%)
Table 21 Companion Diagnostic Market Forecast by End-users, 2024-2034 (US$ Million, CAGR%)
Table 22 Pharmaceutical & Biopharmaceutical Companies Segment Market Forecast by Region, 2024-2034 (US$ Million, CAGR%)
Table 23 Reference Laboratories Segment Market Forecast by Region, 2024-2034 (US$ Million, AGR%, CAGR%)
Table 24 Contract Research Organizations (CROs) Segment Market Forecast by Region, 2024-2034 (US$ Million, CAGR%)
Table 25 Other End-users Segment Market Forecast by Region, 2024-2034 (US$ Million, CAGR%)
Table 26 Companion Diagnostics (CDx) Market Forecast by Region, 2024-2034 (US$ Million, AGR %)
Table 27 North America Companion Diagnostics (CDx) Market Forecast by Country, 2024-2034 (US$ Million, AGR %)
Table 28 North America Companion Diagnostics (CDx) Market Forecast by Product & Services, 2024-2034 (US$ Million, AGR %)
Table 29 North America Companion Diagnostics (CDx) Market Forecast by Indication, 2024-2034 (US$ Million, AGR %)
Table 30 North America Companion Diagnostics (CDx) Market Forecast by Technology, 2024-2034 (US$ Million, AGR %)
Table 31 North America Companion Diagnostics (CDx) Market Forecast by End-users, 2024-2034 (US$ Million, AGR %)
Table 32 U.S. Companion Diagnostics (CDx) Market Forecast, 2024-2034 (US$ Million, AGR %)
Table 33 Canada Companion Diagnostics (CDx) Market Forecast, 2024-2034 (US$ Million, AGR %)
Table 34 Europe Companion Diagnostics (CDx) Market Forecast by Country, 2024-2034 (US$ Million, AGR %)
Table 35 Europe Companion Diagnostics (CDx) Market Forecast by Product & Services, 2024-2034 (US$ Million, AGR %)
Table 36 Europe Companion Diagnostics (CDx) Market Forecast by Indication, 2024-2034 (US$ Million, AGR %)
Table 37 Europe Companion Diagnostics (CDx) Market Forecast by Technology, 2024-2034 (US$ Million, AGR %)
Table 38 Europe Companion Diagnostics (CDx) Market Forecast by End-users, 2024-2034 (US$ Million, AGR %)
Table 39 Germany Companion Diagnostics (CDx) Market Forecast, 2024-2034 (US$ Million, AGR %)
Table 40 UK Companion Diagnostics (CDx) Market Forecast, 2024-2034 (US$ Million, AGR %)
Table 41 France Companion Diagnostics (CDx) Market Forecast, 2024-2034 (US$ Million, AGR %)
Table 42 Italy Companion Diagnostics (CDx) Market Forecast, 2024-2034 (US$ Million, AGR %)
Table 43 Spain Companion Diagnostics (CDx) Market Forecast, 2024-2034 (US$ Million, AGR %)
Table 44 Rest of Europe Companion Diagnostics (CDx) Market Forecast, 2024-2034 (US$ Million, AGR %)
Table 45 Asia Pacific Companion Diagnostics (CDx) Market Forecast by Country, 2024-2034 (US$ Million, AGR %)
Table 46 Asia Pacific Companion Diagnostics (CDx) Market Forecast by Product & Services, 2024-2034 (US$ Million, AGR %)
Table 47 Asia Pacific Companion Diagnostics (CDx) Market Forecast by Indication, 2024-2034 (US$ Million, AGR %)
Table 48 Asia Pacific Companion Diagnostics (CDx) Market Forecast by Technology, 2024-2034 (US$ Million, AGR %)
Table 49 Asia Pacific Companion Diagnostics (CDx) Market Forecast by End-users, 2024-2034 (US$ Million, AGR %)
Table 50 China Companion Diagnostics (CDx) Market Forecast, 2024-2034 (US$ Million, AGR %)
Table 51 Japan Companion Diagnostics (CDx) Market Forecast, 2024-2034 (US$ Million, AGR %)
Table 52 India Companion Diagnostics (CDx) Market Forecast, 2024-2034 (US$ Million, AGR %)
Table 53 Australia Companion Diagnostics (CDx) Market Forecast, 2024-2034 (US$ Million, AGR %)
Table 54 South Korea Companion Diagnostics (CDx) Market Forecast, 2024-2034 (US$ Million, AGR %)
Table 55 Rest of Asia Pacific Companion Diagnostics (CDx) Market Forecast, 2024-2034 (US$ Million, AGR %)
Table 56 Latin America Companion Diagnostics (CDx) Market Forecast by Country, 2024-2034 (US$ Million, AGR %)
Table 57 Latin America Companion Diagnostics (CDx) Market Forecast by Product & Services, 2024-2034 (US$ Million, AGR %)
Table 58 Latin America Companion Diagnostics (CDx) Market Forecast by Indication, 2024-2034 (US$ Million, AGR %)
Table 59 Latin America Companion Diagnostics (CDx) Market Forecast by Technology, 2024-2034 (US$ Million, AGR %)
Table 60 Latin America Companion Diagnostics (CDx) Market Forecast by End-users, 2024-2034 (US$ Million, AGR %)
Table 61 Brazil Companion Diagnostics (CDx) Market Forecast, 2024-2034 (US$ Million, AGR %)
Table 62 Mexico Companion Diagnostics (CDx) Market Forecast, 2024-2034 (US$ Million, AGR %)
Table 63 Rest of Latin America Companion Diagnostics (CDx) Market Forecast, 2024-2034 (US$ Million, AGR %)
Table 64 MEA Companion Diagnostics (CDx) Market Forecast by Country, 2024-2034 (US$ Million, AGR %)
Table 65 MEA Companion Diagnostics (CDx) Market Forecast by Product & Services, 2024-2034 (US$ Million, AGR %)
Table 66 MEA Companion Diagnostics (CDx) Market Forecast by Indication, 2024-2034 (US$ Million, AGR %)
Table 67 MEA Companion Diagnostics (CDx) Market Forecast by Technology, 2024-2034 (US$ Million, AGR %)
Table 68 MEA Companion Diagnostics (CDx) Market Forecast by End-users, 2024-2034 (US$ Million, AGR %)
Table 69 South Africa Companion Diagnostics (CDx) Market Forecast, 2024-2034 (US$ Million, AGR %)
Table 70 GCC Companion Diagnostics (CDx) Market Forecast, 2024-2034 (US$ Million, AGR %)
Table 71 Rest of MEA Companion Diagnostics (CDx) Market Forecast, 2024-2034 (US$ Million, AGR %)
Table 72 Strategic Outlook
Table 73 F. Hoffmann-La Roche Ltd: Key Details, (CEO, HQ, Revenue, Founded, No. of Employees, Company Type, Website, Business Segment)
Table 74 F. Hoffmann-La Roche Ltd: Product Benchmarking
Table 75 F. Hoffmann-La Roche Ltd: Strategic Outlook
Table 76 Agilent Technologies, Inc.: Key Details, (CEO, HQ, Revenue, Founded, No. of Employees, Company Type, Website, Business Segment)
Table 77 Agilent Technologies, Inc.: Product Benchmarking
Table 78 Agilent Technologies, Inc.: Strategic Outlook
Table 79 QIAGEN: Key Details, (CEO, HQ, Revenue, Founded, No. of Employees, Company Type, Website, Business Segment)
Table 80 QIAGEN: Product Benchmarking
Table 81 Thermo Fisher Scientific: Key Details, (CEO, HQ, Revenue, Founded, No. of Employees, Company Type, Website, Business Segment)
Table 82 Thermo Fisher Scientific.: Product Benchmarking
Table 83 Abbott: Key Details, (CEO, HQ, Revenue, Founded, No. of Employees, Company Type, Website, Business Segment)
Table 84 Abbott: Product Benchmarking
Table 85 Almac Group: Key Details, (CEO, HQ, Revenue, Founded, No. of Employees, Company Type, Website, Business Segment)
Table 86 Almac Group: Product Benchmarking
Table 87 Almac Group: Strategic Outlook
Table 88 Danaher Corporation: Key Details, (CEO, HQ, Revenue, Founded, No. of Employees, Company Type, Website, Business Segment)
Table 89 Danaher Corporation: Product Benchmarking
Table 90 Illumina: Key Details, (CEO, HQ, Revenue, Founded, No. of Employees, Company Type, Website, Business Segment)
Table 91 Illumina: Product Benchmarking
Table 92 Illumina: Strategic Outlook
Table 93 bioMerieux: Key Details, (CEO, HQ, Revenue, Founded, No. of Employees, Company Type, Website, Business Segment)
Table 94 Biomurieux: Product Benchmarking
Table 95 Myriad Genetics, Inc.: Key Details, (CEO, HQ, Revenue, Founded, No. of Employees, Company Type, Website, Business Segment)
Table 96 MYRIAD GENETICS, INC.: Product Benchmarking
Table 97 Sysmex Corporation: Key Details, (CEO, HQ, Revenue, Founded, No. of Employees, Company Type, Website, Business Segment)
Table 98 Sysmex Corporation: Product Benchmarking
Table 99 Guardant Health: Key Details, (CEO, HQ, Revenue, Founded, No. of Employees, Company Type, Website, Business Segment)
Table 100 GUARDANT HEALTH: Product Benchmarking
List of Figures
Figure 1 Companion Diagnostics (CDx) Market Segmentation
Figure 2 Companion Diagnostics (CDx) Market by Technology: Market Attractiveness Index
Figure 3 Companion Diagnostics (CDx) Market by Indication: Market Attractiveness Index
Figure 4 Companion Diagnostics (CDx) Market by Product & Services: Market Attractiveness Index
Figure 5 Companion Diagnostics (CDx) Market by End-users: Market Attractiveness Index
Figure 6 Companion Diagnostics (CDx) Market Attractiveness Index by Region
Figure 7 Companion Diagnostics (CDx) Market: Market Dynamics
Figure 8 Companion Diagnostics (CDx) Market by Region, 2024-2034 (US$ Million, AGR %): “V” Shaped Recovery
Figure 9 Companion Diagnostics (CDx) Market by Region, 2024-2034 (US$ Million, AGR %): “U” Shaped Recovery
Figure 10 Companion Diagnostic Market by Region, 2024-2034 (US$ Million, AGR %): “W” Shaped Recovery
Figure 11 Companion Diagnostic Market by Region, 2024-2034 (US$ Million, AGR %): “L” Shaped Recovery
Figure 12 PEST Analysis of Companion Diagnostic Market
Figure 13 Companion Diagnostics (CDx) Market by Product & Services: Market Attractiveness Index
Figure 14 Companion Diagnostics (CDx) Market Forecast by Product & Services, 2024-2034 (US$ Million, AGR %)
Figure 15 Companion Diagnostics (CDx) Market Share Forecast by Product & Services, 2024, 2029, 2034 (%)
Figure 16 Assays, Kits & Reagents Segment Market Forecast by Region, 2024-2034 (US$ Million, AGR %)
Figure 17 Assays, Kits & Reagents Segment Market Share Forecast by Region, 2024 & 2034 (%)
Figure 18 Software & Services Segment Market Forecast by Region, 2024-2034 (US$ Million, AGR %)
Figure 19 Software & Services Segment Market Share Forecast by Region, 2024 & 2034 (%)
Figure 20 Companion Diagnostics (CDx) Market by Indication: Market Attractiveness Index
Figure 21 Companion Diagnostics (CDx) Market Forecast by Indication, 2024-2034 (US$ Million, AGR %)
Figure 22 Companion Diagnostics (CDx) Market Share Forecast by Indication, 2024, 2029, 2034 (%)
Figure 23 Cancer Segment Market Forecast by Region, 2024-2034 (US$ Million, AGR %)
Figure 24 Cancer Segment Market Share Forecast by Region, 2024 & 2034 (%)
Figure 25 Infectious Disease Segment Market Forecast by Region, 2024-2034 (US$ Million, AGR %)
Figure 26 Infectious Disease Segment Market Share Forecast by Region, 2024 & 2034 (%)
Figure 27 Cardiovascular Diseases Segment Market Forecast by Region, 2024-2034 (US$ Million, AGR %)
Figure 28 Cardiovascular Diseases Segment Market Share Forecast by Region, 2024 & 2034 (%)
Figure 29 Neurological Diseases Segment Market Forecast by Region, 2024-2034 (US$ Million, AGR %)
Figure 30 Neurological Diseases Segment Market Share Forecast by Region, 2024 & 2034 (%)
Figure 31 Other Indications Segment Market Forecast by Region, 2024-2034 (US$ Million, AGR %)
Figure 32 Other Indications Segment Market Share Forecast by Region, 2024 & 2034 (%)
Figure 33 Companion Diagnostics (CDx) Market by Technology: Market Attractiveness Index
Figure 34 Companion Diagnostics (CDx) Market Forecast by Technology, 2024-2034 (US$ Million, AGR %)
Figure 35 Companion Diagnostics (CDx) Market Share Forecast by Technology, 2024, 2029, 2034 (%)
Figure 36 Polymerase Chain Reaction (PCR) Segment Market Forecast by Region, 2024-2034 (US$ Million, AGR %)
Figure 37 Polymerase Chain Reaction (PCR) Segment Market Share Forecast by Region, 2024 & 2034 (%)
Figure 38 Next-Generation Sequencing (NGS) Segment Market Forecast by Region, 2024-2034 (US$ Million, AGR %)
Figure 39 Next-Generation Sequencing (NGS) Segment Market Share Forecast by Region, 2024 & 2034 (%)
Figure 40 In Situ Hybridization (ISH) Segment Market Forecast by Region, 2024-2034 (US$ Million, AGR %)
Figure 41 In Situ Hybridization (ISH) Segment Market Share Forecast by Region, 2024 & 2034 (%)
Figure 42 Immunohistochemistry (IHC) Segment Market Forecast by Region, 2024-2034 (US$ Million, AGR %)
Figure 43 Immunohistochemistry (IHC) Segment Market Share Forecast by Region, 2024 & 2034 (%)
Figure 44 Other Technologies Segment Market Forecast by Region, 2024-2034 (US$ Million, AGR %)
Figure 45 Other Technologies Segment Market Share Forecast by Region, 2024 & 2034 (%)
Figure 46 Companion Diagnostics (CDx) Market by End-users: Market Attractiveness Index
Figure 47 Companion Diagnostics (CDx) Market Forecast by End-users, 2024-2034 (US$ Million, AGR %)
Figure 48 Companion Diagnostics (CDx) Market Share Forecast by End-users, 2024, 2029, 2034 (%)
Figure 49 Pharmaceutical & Biopharmaceutical Companies Segment Market Forecast by Region, 2024-2034 (US$ Million, AGR %)
Figure 50 Pharmaceutical & Biopharmaceutical Companies Segment Market Share Forecast by Region, 2024 & 2034 (%)
Figure 51 Reference Laboratories Segment Market Forecast by Region, 2024-2034 (US$ Million, AGR %)
Figure 52 Reference Laboratories Segment Market Share Forecast by Region, 2024 & 2034 (%)
Figure 53 Contract Research Organizations (CROs) Segment Market Forecast by Region, 2024-2034 (US$ Million, AGR %)
Figure 54 Contract Research Organizations (CROs) Segment Market Share Forecast by Region, 2024 & 2034 (%)
Figure 55 Other End-users Segment Market Forecast by Region, 2024-2034 (US$ Million, AGR %)
Figure 56 Other End-users Segment Market Share Forecast by Region, 2024 & 2034 (%)
Figure 57 Companion Diagnostics (CDx) Market Forecast by Region 2024 and 2034 (Revenue, CAGR%)
Figure 58 Companion Diagnostics (CDx) Market Share Forecast by Region 2024, 2029, 2034 (%)
Figure 59 Companion Diagnostics (CDx) Market by Region, 2024-2034 (US$ Million, AGR %)
Figure 60 North America Companion Diagnostics (CDx) Market Attractiveness Index
Figure 61 North America Companion Diagnostics (CDx) Market by Region, 2024, 2029 & 2034 (US$ Million)
Figure 62 North America Companion Diagnostics (CDx) Market Forecast by Country, 2024-2034 (US$ Million, AGR %)
Figure 63 North America Companion Diagnostics (CDx) Market Share Forecast by Country, 2024 & 2034 (%)
Figure 64 North America Companion Diagnostics (CDx) Market Forecast by Product & Services, 2024-2034 (US$ Million, AGR %)
Figure 65 North America Companion Diagnostics (CDx) Market Share Forecast by Product & Services, 2024 & 2034 (%)
Figure 66 North America Companion Diagnostics (CDx) Market Forecast by Indication, 2024-2034 (US$ Million, AGR %)
Figure 67 North America Companion Diagnostics (CDx) Market Share Forecast by Indication, 2024 & 2034 (%)
Figure 68 North America Companion Diagnostics (CDx) Market Forecast by Technology, 2024-2034 (US$ Million, AGR %)
Figure 69 North America Companion Diagnostics (CDx) Market Share Forecast by Technology, 2024 & 2034 (%)
Figure 70 North America Companion Diagnostics (CDx) Market Forecast by End-users, 2024-2034 (US$ Million, AGR %)
Figure 71 North America Companion Diagnostics (CDx) Market Share Forecast by End-users, 2024 & 2034 (%)
Figure 72 U.S. Companion Diagnostics (CDx) Market Forecast, 2024-2034 (US$ Million, AGR %)
Figure 73 Canada Companion Diagnostics (CDx) Market Forecast, 2024-2034 (US$ Million, AGR %)
Figure 74 Europe Companion Diagnostics (CDx) Market Attractiveness Index
Figure 75 Europe Companion Diagnostics (CDx) Market by Region, 2024, 2029 & 2034 (US$ Million)
Figure 76 Europe Companion Diagnostics (CDx) Market Forecast by Country, 2024-2034 (US$ Million, AGR %)
Figure 77 Europe Companion Diagnostics (CDx) Market Share Forecast by Country, 2024 & 2034 (%)
Figure 78 Europe Companion Diagnostics (CDx) Market Forecast by Product & Services, 2024-2034 (US$ Million, AGR %)
Figure 79 Europe Companion Diagnostics (CDx) Market Share Forecast by Product & Services, 2024 & 2034 (%)
Figure 80 Europe Companion Diagnostics (CDx) Market Forecast by Indication, 2024-2034 (US$ Million, AGR %)
Figure 81 Europe Companion Diagnostics (CDx) Market Share Forecast by Indication, 2024 & 2034 (%)
Figure 82 Europe Companion Diagnostics (CDx) Market Forecast by Technology, 2024-2034 (US$ Million, AGR %)
Figure 83 Europe Companion Diagnostics (CDx) Market Share Forecast by Technology, 2024 & 2034 (%)
Figure 84 Europe Companion Diagnostics (CDx) Market Forecast by End-user, 2024-2034 (US$ Million, AGR %)
Figure 85 Europe Companion Diagnostics (CDx) Market Share Forecast by End-user, 2024 & 2034 (%)
Figure 86 Germany Companion Diagnostics (CDx) Market Forecast, 2024-2034 (US$ Million, AGR %)
Figure 87 UK Companion Diagnostics (CDx) Market Forecast, 2024-2034 (US$ Million, AGR %)
Figure 88 France Companion Diagnostics (CDx) Market Forecast, 2024-2034 (US$ Million, AGR %)
Figure 89 Italy Companion Diagnostics (CDx) Market Forecast, 2024-2034 (US$ Million, AGR %)
Figure 90 Spain Companion Diagnostics (CDx) Market Forecast, 2024-2034 (US$ Million, AGR %)
Figure 91 Rest of Europe Companion Diagnostics (CDx) Market Forecast, 2024-2034 (US$ Million, AGR %)
Figure 92 Asia Pacific Companion Diagnostics (CDx) Market Attractiveness Index
Figure 93 Asia Pacific Companion Diagnostics (CDx) Market by Region, 2024, 2029 & 2034 (US$ Million)
Figure 94 Asia Pacific Companion Diagnostics (CDx) Market Forecast by Country, 2024-2034 (US$ Million, AGR %)
Figure 95 Asia Pacific Companion Diagnostics (CDx) Market Share Forecast by Country, 2024 & 2034 (%)
Figure 96 Asia Pacific Companion Diagnostics (CDx) Market Forecast by Product & Services, 2024-2034 (US$ Million, AGR %)
Figure 97 Asia Pacific Companion Diagnostics (CDx) Market Share Forecast by Product & Services, 2024 & 2034 (%)
Figure 98 Asia Pacific Companion Diagnostics (CDx) Market Forecast by Indication, 2024-2034 (US$ Million, AGR %)
Figure 99 Asia Pacific Companion Diagnostics (CDx) Market Share Forecast by Indication, 2024 & 2034 (%)
Figure 100 Asia Pacific Companion Diagnostics (CDx) Market Forecast by Technology, 2024-2034 (US$ Million, AGR %)
Figure 101 Asia Pacific Companion Diagnostics (CDx) Market Share Forecast by Technology, 2024 & 2034 (%)
Figure 102 Asia Pacific Companion Diagnostics (CDx) Market Forecast by End-users, 2024-2034 (US$ Million, AGR %)
Figure 103 Asia Pacific Companion Diagnostics (CDx) Market Share Forecast by End-users, 2024 & 2034 (%)
Figure 104 China Companion Diagnostics (CDx) Market Forecast, 2024-2034 (US$ Million, AGR %)
Figure 105 Japan Companion Diagnostics (CDx) Market Forecast, 2024-2034 (US$ Million, AGR %)
Figure 106 India Companion Diagnostics (CDx) Market Forecast, 2024-2034 (US$ Million, AGR %)
Figure 107 Australia Companion Diagnostics (CDx) Market Forecast, 2024-2034 (US$ Million, AGR %)
Figure 108 South Korea Companion Diagnostics (CDx) Market Forecast, 2024-2034 (US$ Million, AGR %)
Figure 109 Rest of Asia Pacific Companion Diagnostics (CDx) Market Forecast, 2024-2034 (US$ Million, AGR %)
Figure 110 Latin America Companion Diagnostics (CDx) Market Attractiveness Index
Figure 111 Latin America Companion Diagnostics (CDx) Market by Region, 2024, 2029 & 2034 (US$ Million)
Figure 112 Latin America Companion Diagnostics (CDx) Market Forecast by Country, 2024-2034 (US$ Million, AGR %)
Figure 113 Latin America Companion Diagnostics (CDx) Market Share Forecast by Country, 2024 & 2034 (%)
Figure 114 Latin America Companion Diagnostics (CDx) Market Forecast by Product & Services, 2024-2034 (US$ Million, AGR %)
Figure 115 Latin America Companion Diagnostics (CDx) Market Share Forecast by Product & Services, 2024 & 2034 (%)
Figure 116 Latin America Companion Diagnostics (CDx) Market Forecast by Indication, 2024-2034 (US$ Million, AGR %)
Figure 117 Latin America Companion Diagnostics (CDx) Market Share Forecast by Indication, 2024 & 2034 (%)
Figure 118 Latin America Companion Diagnostics (CDx) Market Forecast by Technology, 2024-2034 (US$ Million, AGR %)
Figure 119 Latin America Companion Diagnostics (CDx) Market Share Forecast by Technology, 2024 & 2034 (%)
Figure 120 Latin America Companion Diagnostics (CDx) Market Forecast by End-users, 2024-2034 (US$ Million, AGR %)
Figure 121 Latin America Companion Diagnostics (CDx) Market Share Forecast by End-users, 2024 & 2034 (%)
Figure 122 Brazil Companion Diagnostics (CDx) Market Forecast, 2024-2034 (US$ Million, AGR %)
Figure 123 Mexico Companion Diagnostics (CDx) Market Forecast, 2024-2034 (US$ Million, AGR %)
Figure 124 Rest of Latin America Companion Diagnostics (CDx) Market Forecast, 2024-2034 (US$ Million, AGR %)
Figure 125 MEA Companion Diagnostics (CDx) Market Attractiveness Index
Figure 126 MEA Companion Diagnostics (CDx) Market by Region, 2024, 2029 & 2034 (US$ Million)
Figure 127 MEA Companion Diagnostics (CDx) Market Forecast by Country, 2024-2034 (US$ Million, AGR %)
Figure 128 MEA Companion Diagnostics (CDx) Market Share Forecast by Country, 2024 & 2034 (%)
Figure 129 MEA Companion Diagnostics (CDx) Market Forecast by Product & Services, 2024-2034 (US$ Million, AGR %)
Figure 130 MEA Companion Diagnostics (CDx) Market Share Forecast by Product & Services, 2024 & 2034 (%)
Figure 131 MEA Companion Diagnostics (CDx) Market Forecast by Indication, 2024-2034 (US$ Million, AGR %)
Figure 132 MEA Companion Diagnostics (CDx) Market Share Forecast by Indication, 2024 & 2034 (%)
Figure 133 MEA Companion Diagnostics (CDx) Market Forecast by Technology, 2024-2034 (US$ Million, AGR %)
Figure 134 MEA Companion Diagnostics (CDx) Market Share Forecast by Technology, 2024 & 2034 (%)
Figure 135 MEA Companion Diagnostics (CDx) Market Forecast by End-users, 2024-2034 (US$ Million, AGR %)
Figure 136 MEA Companion Diagnostics (CDx) Market Share Forecast by End-users, 2024 & 2034 (%)
Figure 137 South Africa Companion Diagnostics (CDx) Market Forecast, 2024-2034 (US$ Million, AGR %)
Figure 138 GCC Companion Diagnostics (CDx) Market Forecast, 2024-2034 (US$ Million, AGR %)
Figure 139 Rest of MEA Companion Diagnostics (CDx) Market Forecast, 2024-2034 (US$ Million, AGR %)
Figure 140 F. Hoffmann-La Roche Ltd: Net Revenue, 2017-2022 (US$ Million, AGR%)
Figure 141 F. Hoffmann-La Roche Ltd: R&D, 2017-2022 (US$ Million, AGR%)
Figure 142 F. Hoffmann-La Roche Ltd: Regional Market Shares, 2022
Figure 143 Agilent Technologies, Inc.: Net Revenue, 2017-2022 (US$ Million, AGR%)
Figure 144 Agilent Technologies, Inc.: R&D, 2017-2022 (US$ Million, AGR%)
Figure 145 Agilent Technologies, Inc.: Regional Market Shares, 2022
Figure 146 QIAGEN: Net Revenue, 2017-2022 (US$ Million, AGR%)
Figure 147 QIAGEN: R&D, 2017-2022 (US$ Million, AGR%)
Figure 148 QIAGEN: Regional Market Shares, 2022
Figure 149 Thermo Fisher Scientific: Net Revenue, 2017-2022 (US$ Million, AGR%)
Figure 150 Thermo Fisher Scientific.: Regional Market Shares, 2022
Figure 151 Abbott: Net Revenue, 2017-2022 (US$ Million, AGR%)
Figure 152 Abbott: R&D, 2017-2022 (US$ Million, AGR%)
Figure 153 Abbott: Regional Market Shares, 2022
Figure 154 Danaher Corporation: Net Revenue, 2017-2022 (US$ Million, AGR%)
Figure 155 Danaher Corporation: Regional Market Shares, 2022
Figure 156 Illumina: Net Revenue, 2017-2022 (US$ Million, AGR%)
Figure 157 Illumina: R&D, 2017-2022 (US$ Million, AGR%)
Figure 158 Illumina: Regional Market Shares, 2022
Figure 159 bioMerieux: Net Revenue, 2017-2022 (US$ Million, AGR%)
Figure 160 bioMerieux: Regional Market Shares, 2022
Figure 161 Myriad Genetics, Inc.: Net Revenue, 2017-2022 (US$ Million, AGR%)
Figure 162 Myriad Genetics, Inc.: R&D, 2017-2022 (US$ Million, AGR%)
Figure 163 Myriad Genetics, Inc.: Regional Market Shares, 2022
Figure 164 Sysmex Corp: Net Revenue, 2017-2022 (US$ Million, AGR%)
Figure 165 Sysmex Corp: R&D, 2017-2022 (US$ Million, AGR%)
Figure 166 Sysmex Corp: Regional Market Shares, 2022
Figure 167 Guardant Health: Net Revenue, 2017-2022 (US$ Million, AGR%)
Figure 168 Guardant Health: R&D, 2017-2022 (US$ Million, AGR%)
Figure 169 GUARDANT HEALTH, INC: Regional Market Shares, 2022
ページTOPに戻る
本レポートと同じKEY WORD()の最新刊レポート
- 本レポートと同じKEY WORDの最新刊レポートはありません。
よくあるご質問
Visiongain社はどのような調査会社ですか?
英国の調査会社ヴィジョンゲイン社(Visiongain)は、通信とエネルギーのほか、自動車や化学・医薬品、金属など、広範な市場を対象に調査を行っています。自動車市場については、市場全般に関する調査のほ... もっと見る
調査レポートの納品までの日数はどの程度ですか?
在庫のあるものは速納となりますが、平均的には 3-4日と見て下さい。
但し、一部の調査レポートでは、発注を受けた段階で内容更新をして納品をする場合もあります。
発注をする前のお問合せをお願いします。
注文の手続きはどのようになっていますか?
1)お客様からの御問い合わせをいただきます。
2)見積書やサンプルの提示をいたします。
3)お客様指定、もしくは弊社の発注書をメール添付にて発送してください。
4)データリソース社からレポート発行元の調査会社へ納品手配します。
5) 調査会社からお客様へ納品されます。最近は、pdfにてのメール納品が大半です。
お支払方法の方法はどのようになっていますか?
納品と同時にデータリソース社よりお客様へ請求書(必要に応じて納品書も)を発送いたします。
お客様よりデータリソース社へ(通常は円払い)の御振り込みをお願いします。
請求書は、納品日の日付で発行しますので、翌月最終営業日までの当社指定口座への振込みをお願いします。振込み手数料は御社負担にてお願いします。
お客様の御支払い条件が60日以上の場合は御相談ください。
尚、初めてのお取引先や個人の場合、前払いをお願いすることもあります。ご了承のほど、お願いします。
データリソース社はどのような会社ですか?
当社は、世界各国の主要調査会社・レポート出版社と提携し、世界各国の市場調査レポートや技術動向レポートなどを日本国内の企業・公官庁及び教育研究機関に提供しております。
世界各国の「市場・技術・法規制などの」実情を調査・収集される時には、データリソース社にご相談ください。
お客様の御要望にあったデータや情報を抽出する為のレポート紹介や調査のアドバイスも致します。
|
|


