放射性廃棄物管理市場レポート:2024-2034
Nuclear Waste Management Market Report 2024-2034
レポート詳細
放射性廃棄物管理市場レポート 2024-2034年 :本レポートは、業界とその基礎となる原動力をより良く理解したいと望むなら、新たな収益ポケットを目指す大手企業にとって貴重なものとな... もっと見る
※上記価格は部署ライセンス(Departmental licence)価格です。
その他の価格についてはデータリソースまでお問合せください。
日本語のページは自動翻訳を利用し作成しています。
実際のレポートは英文のみでご納品いたします。

|

|
サマリー
レポート詳細
放射性廃棄物管理市場レポート 2024-2034年:本レポートは、業界とその基礎となる原動力をより良く理解したいと望むなら、新たな収益ポケットを目指す大手企業にとって貴重なものとなるでしょう。異業種への進出や新地域での既存事業の拡大を目指す企業にも有用です。
技術の進歩 廃棄物処理ソリューションの開拓
放射性廃棄物管理における技術の進歩は、放射性物質の処理方法に革命をもたらしている。高度なロボット工学のような技術革新は、放射性廃棄物の正確な取り扱いと輸送を可能にし、人体への被ばくを最小限に抑えます。廃棄物をガラスやセラミックに固定化するガラス固化技術は、環境への溶出を防ぎ、安定した長期保管ソリューションを提供します。さらに、材料科学の研究により、耐久性の高い容器や遮蔽材が開発され、貯蔵や輸送の安全性が向上している。これらの進歩は、廃棄物処理の効率を向上させるだけでなく、安全プロトコルを大幅に強化し、プロセスの信頼性と安全性を高めている。
厳しい規制の枠組み コンプライアンスと安全性の確保
放射性廃棄物管理の分野では、強固な規制の枠組みが不可欠である。安全基準へのコンプライアンスを確保するために、国や国際機関によって厳しい規制が設けられている。これらの規制は、廃棄物の分類や梱包から輸送や保管に至るまで、あらゆる側面をカバーしている。規制を遵守することで、廃棄物管理業務の透明性が確保され、環境にやさしく、作業員と周辺地域社会の両方にとって安全であることが保証される。これらの規制を遵守することは、廃棄物処理プロセスの安全性を保証するだけでなく、業界の長期的な持続可能性にとって極めて重要な、社会からの信頼と信用を築くことにもなる。
市場調査レポートを購入する前にすべき質問とは?
- 放射性廃棄物管理市場はどのように進化しているのか?
- 放射性廃棄物管理市場の推進要因と抑制要因は何か?
- 放射性廃棄物管理の各サブマーケットセグメントは予測期間中にどのように成長し、2034年にはどれくらいの収益を占めるようになるのか?
- 2024年から2034年にかけて、放射性廃棄物管理の各サブマーケットの市場シェアはどのように推移するのか?
- 2024年から2034年までの市場全体の主な牽引役は何か?
- 主要な放射性廃棄物管理市場はマクロ経済の動きに概ね追随するのか、それとも個々の国別市場が他を凌駕するのか?
- 2034年までに各国市場のシェアはどのように変化し、2034年にはどの地域が市場をリードするのか?
- 主要プレーヤーは誰で、予測期間中の見通しは?
- これらの大手企業の放射性廃棄物管理プロジェクトは何か?
- 2024年から2034年の間に産業はどのように発展していくのか?現在および今後10年間に実施される放射性廃棄物管理プロジェクトにはどのような意味があるのか?
- 放射性廃棄物管理市場をさらに拡大するために、製品の商業化の必要性は高まっているか?
- 放射性廃棄物管理市場はどこへ向かっているのか、そしてどのようにすれば市場の最前線に立てるのか?
- 新製品やサービスラインに対する最適な投資オプションは何か?
- 企業を新たな成長軌道に乗せ、C-suiteに移行させるための重要な展望とは?
このことが、現在、そして今後10年間の放射性廃棄物管理市場にどのような影響を与えるかを見極める必要がある:
- 359ページにわたる本レポートでは、119の表と158の図表を掲載しています。
- 本レポートは、業界における主要な有利分野にハイライトを当てているため、今すぐターゲットを絞ることができます。
- 世界、地域、国の売上と成長に関する詳細な分析が含まれています。
- 競合他社が成功した主なトレンド、変化、収益予測をハイライトしています。
本レポートは、放射性廃棄物管理市場が今後10年間でどのように発展するか、またCOVID-19の景気後退と好転の変動に合わせて、今日あなたに伝えます。この市場は、過去10年間のどの時点よりも今が重要です。
2034年までの予測やその他の分析から、商業的な展望が明らかになる
- 2034年までの収益予測に加え、直近の実績、成長率、市場シェアを提供します。
- ビジネスの展望と展開に関する独自の分析をご覧いただけます。
- 定性的分析(市場力学、促進要因、機会、阻害要因、課題を含む)、コスト構造、放射性廃棄物管理価格上昇の影響、最近の動向をご覧いただけます。
本レポートには、COVID-19が業界と貴社にどのような影響を与えるかについてのデータ分析と貴重な洞察が含まれている。本レポートでは、COVID-19の4つの回復パターンとその影響、すなわち「V」、「L」、「W」、「U」について論じている。
レポート対象セグメント
ソリューション別市場セグメント
- 廃棄物選別
- 廃棄物の処理と調整
- 廃棄物の保管と処理
タイプ別市場セグメント
- 超低レベル廃棄物(VLLW)
- 低レベル廃棄物(LLW)
- 中間レベル廃棄物(ILW)
- 高レベル廃棄物(HLW)
処分方法別市場セグメント
- 核変換
- 海底処分
- 宇宙処分
- カプセル化と埋設
- 人工岩盤
ソース別市場セグメント
- 廃炉/修復
- 原子炉運転
- 軍事・防衛プログラム
- 原子力用途
- 燃料再処理
- 燃料製造/濃縮
世界市場全体とセグメント別の収益予測に加え、4つの地域と20の主要国市場の収益予測も掲載しています:
北米
- アメリカ
- カナダ
欧州
- ロシア
- 英国
- フランス
- ベルギー
- フィンランド
- その他の欧州
アジア太平洋
- 中国
- 日本
- インド
- パキスタン
- 韓国
- その他のアジア太平洋地域
ラテンアメリカ
- ブラジル
- アルゼンチン
- その他のラテンアメリカ
中東・アフリカ
- GCC
- 南アフリカ
- その他の中東・アフリカ
また、このレポートには、放射性廃棄物管理市場の2024年から2034年までの主要企業のプロファイルと、これらの企業の事業のこのセグメントに焦点を当てています。
主要企業と市場成長の可能性
・ AECOM
・ Bechtel Corporation
・ Enercon Services, Inc
・ EnergySolutions
・ Fluor Corporation
・ Holtec International
・ Jacobs Solutions Inc.
・ Magnox Ltd
・ NUKEM Technologies GmbH
・ Orano SA
・ Studsvik
・ Swedish Nuclear Fuel and Waste Management Company
・ Veolia Environnement S.A.
・ Waste Control Specialists LLC
・ Westinghouse Electric Company LLC
放射性廃棄物管理市場の2024年から2034年までの世界全体の売上高(金額ベース)は、2024年に49億1,750万米ドルを突破する。2034年まで力強い収益成長を予測。当研究所では、最も大きな可能性を秘めた組織を特定している。彼らの能力、進歩、商業的展望を発見し、一歩先を行くお手伝いをします。
2024年から2034年までの放射性廃棄物管理市場に関する報告書はどのように役立つのか?
要約すると、350ページを超えるこのレポートは、以下の知識を提供する:
- 放射性廃棄物管理市場の2024年から2034年までの収益予測 ソリューション、タイプ、処分方法、発生源の各予測を世界および地域レベルで掲載 - 業界の将来性を発見し、投資と収益に最も有利な場所を見つけることができます。
- 4つの地域と20の主要国市場の2034年までの収益予測 - 放射性廃棄物管理市場の2024年から2034年までの北米、ヨーロッパ、アジア太平洋、ラテンアメリカ、中東&アフリカの市場予測をご覧ください。また、米国、カナダ、ブラジル、ドイツ、フランス、英国、ベルギー、フィンランド、中国、インド、日本、オーストラリアなどの著名な経済圏の市場も予測しています。
- 既に市場を確立している企業や市場参入を目指す企業の展望 - 放射性廃棄物管理市場に関わる主要企業15社の企業プロファイルを含む、2024年から2034年までの市場。
独自の予測による定量的・定性的分析をご覧ください。私たちのレポートだけに含まれる情報を入手し、貴重なビジネスインテリジェンスで情報を得ることができます。
他にはない情報
私たちの新しいレポートがあれば、知識に遅れをとったり、チャンスを逃したりする可能性が低くなります。弊社の調査レポートが貴社の調査、分析、意思決定にどのように役立つかをご覧ください。Visiongainの調査は、核廃棄物管理市場、2024年から2034年、市場をリードする企業の商業分析を必要とするすべての人のためのものです。データ、トレンド、予測をご覧いただけます。
ページTOPに戻る
目次
目次
1 レポート概要
1.1 研究の目的
1.2 放射性廃棄物管理市場の紹介
1.3 本レポートの内容
1.4 本レポートを読むべき理由
1.5 本分析レポートが回答する主な質問
1.6 本レポートは誰のためのものか?
1.7 方法論
1.7.1 市場の定義
1.7.2 市場評価・予測手法
1.7.3 データの検証
1.7.3.1 一次調査
1.7.3.2 セカンダリーリサーチ
1.8 よくある質問(FAQ)
1.9 Visiongainの関連レポート
1.10 Visiongainについて
2 エグゼクティブ・サマリー
3 市場の概要
3.1 主要な調査結果
3.2 市場ダイナミクス
3.2.1 市場牽引要因
3.2.1.1 恒久的な廃棄代替手段の欠如が市場成長を牽引
3.2.1.2 減容化と長期的ソリューションが市場成長を牽引
3.2.1.3 省資源とエネルギー生成が市場成長を促進する
3.2.2 市場抑制要因
3.2.2.1 環境リスクと放射性ハザードが市場成長を抑制する可能性
3.2.2.2 放射性廃棄物の輸送に伴うリスクと処理コストの高さが市場成長を抑制する可能性
3.2.2.3 高コストと厳しい規制が市場成長を抑制する可能性がある
3.2.3 市場機会
3.2.3.1 先進的な廃棄物処理技術は市場成長の機会
3.2.3.2 再生可能エネルギー源へのシフトが放射性廃棄物管理分野での多様化の機会をもたらす
3.2.3.3 放射性廃棄物管理プロジェクトに対する政府の支援(廃棄物処分場への資金提供や規制当局の承認など)は、同部門の企業に機会をもたらす
3.3 ポーターのファイブフォース分析
3.3.1 サプライヤーの交渉力(低~中)
3.3.2 買い手の交渉力(高)
3.3.3 競争ライバル(中)
3.3.4 代替品による脅威(低)
3.3.5 新規参入の脅威(高)
3.4 COVID-19の影響分析
3.4.1 "V字回復"
3.4.2 "U字型回復"
3.4.3 "W字型回復"
3.4.4 "L字型回復"
3.5 PEST分析
4 放射性廃棄物管理市場分析:ソリューション別
4.1 主要調査結果
4.2 ソリューションセグメント 市場魅力度指数
4.3 放射性廃棄物管理:ソリューション別市場規模の推定と予測
4.4 仕分け
4.4.1 2024~2034年の地域別市場規模(US$ Million)
4.4.2 地域別市場シェア、2024年・2034年(%)
4.5 トリートメントとコンディショニング
4.5.1 2024〜2034年の地域別市場規模(US$ Million)
4.5.2 地域別市場シェア、2024年・2034年(%)
4.6 保管と廃棄
4.6.1 2024〜2034年の地域別市場規模(US$ Million)
4.6.2 地域別市場シェア、2024年及び2034年(%)
5 放射性廃棄物管理市場分析:タイプ別
5.1 主要調査結果
5.2 タイプ別セグメント 市場魅力度指数
5.3 放射性廃棄物管理のタイプ別市場規模の推定と予測
5.4 超低レベル廃棄物(VLLW)
5.4.1 2024年~2034年の地域別市場規模(US$ Million)
5.4.2 地域別市場シェア、2024年・2034年(%)
5.5 低レベル廃棄物(LLW)
5.5.1 2024年~2034年の地域別市場規模(US$ Million)
5.5.2 地域別市場シェア、2024年・2034年(%)
5.6 中間レベル廃棄物(ILW)
5.6.1 2024年~2034年の地域別市場規模(US$ Million)
5.6.2 地域別市場シェア、2024年・2034年(%)
5.7 高レベル廃棄物(HLW)
5.7.1 2024~2034年の地域別市場規模(US$ Million)
5.7.2 地域別市場シェア、2024年・2034年(%)
6 放射性廃棄物管理市場分析:処分方法別
6.1 主要調査結果
6.2 処分方法セグメント 市場魅力度指数
6.3 廃棄方法別の放射性廃棄物管理市場規模の推定と予測
6.4 核変換
6.4.1 2024〜2034年の地域別市場規模(US$ Million)
6.4.2 地域別市場シェア、2024年・2034年(%)
6.5 海底処分
6.5.1 2024~2034年の地域別市場規模(US$ Million)
6.5.2 地域別市場シェア、2024年・2034年(%)
6.6 宇宙処分
6.6.1 2024〜2034年の地域別市場規模(US$ Million)
6.6.2 地域別市場シェア、2024年・2034年(%)
6.7 カプセル化と埋設
6.7.1 2024~2034年の地域別市場規模(US$ Million)
6.7.2 地域別市場シェア、2024年・2034年(%)
6.8 合成岩層
6.8.1 2024~2034年の地域別市場規模(US$ Million)
6.8.2 地域別市場シェア、2024年及び2034年(%)
7 放射性廃棄物管理市場分析: ソース別
7.1 主要調査結果
7.2 発生源セグメント 市場魅力度指数
7.3 放射性廃棄物管理の発生源別市場規模の推定と予測
7.4 廃炉/修復
7.4.1 2024〜2034年の地域別市場規模(US$ Million)
7.4.2 地域別市場シェア、2024年・2034年(%)
7.5 原子炉運転
7.5.1 2024~2034年の地域別市場規模(US$ Million)
7.5.2 地域別市場シェア、2024年・2034年(%)
7.6 軍事・防衛計画
7.6.1 2024〜2034年の地域別市場規模(US$ Million)
7.6.2 地域別市場シェア、2024年・2034年(%)
7.7 原子力用途
7.7.1 2024年~2034年の地域別市場規模(US$ Million)
7.7.2 地域別市場シェア、2024年・2034年(%)
7.8 燃料再処理
7.8.1 2024~2034年の地域別市場規模(US$ Million)
7.8.2 地域別市場シェア、2024年・2034年(%)
7.9 燃料製造/濃縮
7.9.1 2024~2034年の地域別市場規模(US$ Million)
7.9.2 地域別市場シェア、2024年・2034年(%)
8 放射性廃棄物管理市場分析:地域別
8.1 主要な調査結果
8.2 地域別市場規模の推定と予測
9 北米の放射性廃棄物管理市場分析
9.1 主要な調査結果
9.2 北米の放射性廃棄物管理市場魅力度指数
9.3 北米の放射性廃棄物管理市場国別市場規模、2024年、2029年、2034年(US$ Million)
9.4 北米の放射性廃棄物管理市場規模推定と予測
9.5 北米の放射性廃棄物管理市場規模推定と予測:国別
9.6 北米の放射性廃棄物管理市場規模推定と予測:ソリューション別
9.7 北米の放射性廃棄物管理市場規模推定と予測:タイプ別
9.8 北米の放射性廃棄物管理市場規模推定と予測:処分方法別
9.9 北米の放射性廃棄物管理市場規模推定と予測: ソース別
9.10 米国の放射性廃棄物管理市場分析
9.11 カナダの放射性廃棄物管理市場分析
10 欧州の放射性廃棄物管理市場分析
10.1 主要な調査結果
10.2 欧州放射性廃棄物管理市場魅力度指数
10.3 欧州の放射性廃棄物管理市場国別市場規模、2024年、2029年、2034年(US$ Million)
10.4 欧州の放射性廃棄物管理市場規模推定と予測
10.5 欧州の放射性廃棄物管理市場規模推定と予測:国別
10.6 欧州の放射性廃棄物管理市場規模推定と予測:ソリューション別
10.7 欧州の放射性廃棄物管理市場規模推定と予測:タイプ別
10.8 欧州の放射性廃棄物管理市場規模推定と予測:廃棄方法別
10.9 欧州の放射性廃棄物管理市場規模推定と予測:ソース別
10.10 ロシアの放射性廃棄物管理市場分析
10.11 イギリスの放射性廃棄物管理市場分析
10.12 フランスの放射性廃棄物管理市場分析
10.13 ベルギーの放射性廃棄物管理市場分析
10.14 フィンランドの放射性廃棄物管理市場分析
10.15 その他の欧州の放射性廃棄物市場分析
11 アジア太平洋地域の放射性廃棄物管理市場分析
11.1 主要な調査結果
11.2 アジア太平洋地域の放射性廃棄物管理市場魅力度指数
11.3 アジア太平洋地域の放射性廃棄物管理市場国別市場規模、2024年、2029年、2034年(US$ Million)
11.4 アジア太平洋地域の放射性廃棄物管理市場規模推定と予測
11.5 アジア太平洋地域の放射性廃棄物管理市場規模推計と予測:国別
11.6 アジア太平洋地域の放射性廃棄物管理市場規模推定と予測:ソリューション別
11.7 アジア太平洋地域の放射性廃棄物管理市場規模推定と予測:タイプ別
11.8 アジア太平洋地域の放射性廃棄物管理市場規模推定と予測:廃棄方法別
11.9 アジア太平洋地域の放射性廃棄物管理市場規模推定と予測:ソース別
11.10 中国の放射性廃棄物管理市場分析
11.11 インドの放射性廃棄物管理市場分析
11.12 日本の放射性廃棄物管理市場分析
11.13 韓国の放射性廃棄物管理市場分析
11.14 パキスタンの放射性廃棄物市場分析
11.15 その他のアジア太平洋地域の放射性廃棄物市場分析
12 中東・アフリカの放射性廃棄物管理市場分析
12.1 主要な調査結果
12.2 中東・アフリカの放射性廃棄物管理市場魅力度指数
12.3 中東・アフリカの放射性廃棄物管理国別市場、2024年、2029年、2034年(US$ Million)
12.4 中東・アフリカの放射性廃棄物管理市場規模推定と予測
12.5 中東・アフリカの放射性廃棄物管理市場規模推定と予測:国別
12.6 中東・アフリカの放射性廃棄物管理市場規模推定と予測:ソリューション別
12.7 中東・アフリカの放射性廃棄物管理市場規模推定と予測:タイプ別
12.8 中東・アフリカの放射性廃棄物管理市場規模推定と予測:処分方法別
12.9 中東・アフリカの放射性廃棄物管理市場規模推定と予測:ソース別
12.10 GCCの放射性廃棄物管理市場分析
12.11 南アフリカの放射性廃棄物管理市場分析
12.12 その他の中東・アフリカ放射性廃棄物管理市場分析
13 ラテンアメリカの放射性廃棄物管理市場分析
13.1 主要な調査結果
13.2 ラテンアメリカの放射性廃棄物管理市場魅力度指数
13.3 ラテンアメリカの放射性廃棄物管理市場国別市場規模、2024年、2029年、2034年(US$ Million)
13.4 ラテンアメリカの放射性廃棄物管理市場規模推定と予測
13.5 ラテンアメリカの放射性廃棄物管理市場規模推定と予測:国別
13.6 ラテンアメリカの放射性廃棄物管理市場規模推定と予測:ソリューション別
13.7 ラテンアメリカの放射性廃棄物管理市場規模推定と予測:タイプ別
13.8 ラテンアメリカの放射性廃棄物管理市場規模推定と予測:廃棄方法別
13.9 ラテンアメリカの放射性廃棄物管理市場規模推定と予測:ソース別
13.10 ブラジルの放射性廃棄物管理市場分析
13.11 アルゼンチンの放射性廃棄物管理市場分析
13.12 その他のラテンアメリカの放射性廃棄物管理市場の分析
14 企業のプロフィール
14.1 競争環境、2022年
14.2 戦略的展望
14.3 AECOM
14.3.1 会社概要
14.3.2 会社概要
14.3.3 財務分析
14.3.3.1 純収入、2018年~2022年
14.3.3.2 地域別収益シェア、2022年(%)
14.3.4 製品ベンチマーク
14.3.5 戦略的展望
14.4 Bechtel Corporation
14.4.1 会社概要
14.4.2 会社概要
14.4.3 製品ベンチマーク
14.4.4 戦略的展望
14.5 Fluor Corporation
14.5.1 会社概要
14.5.2 会社概要
14.5.3 財務分析
14.5.3.1 純収入、2018-2022年
14.5.3.2 地域別収益シェア、2022年(%)
14.5.3.3 事業セグメント別収益シェア、2022年(%)
14.5.4 製品ベンチマーク
14.5.5 戦略的展望
14.6 Studsvik
14.6.1 会社概要
14.6.2 会社概要
14.6.3 製品ベンチマーク
14.6.4 戦略的展望
14.7 Westinghouse Electric Company LLC
14.7.1 会社概要
14.7.2 会社概要
14.7.3 製品ベンチマーク
14.7.4 戦略的展望
14.8 Orano SA
14.8.1 会社概要
14.8.2 会社概要
14.8.3 製品ベンチマーク
14.9 Jacobs Solutions Inc
14.9.1 会社概要
14.9.2 会社概要
14.9.3 財務分析
14.9.3.1 純収入、2018-2022年
14.9.4 製品ベンチマーク
14.9.5 戦略的展望
14.10 Energy Solutions
14.10.1 会社概要
14.10.2 会社概要
14.10.3 製品ベンチマーク
14.11 Enercon Services, Inc
14.11.1 会社概要
14.11.2 会社概要
14.11.3 製品ベンチマーク
14.11.4 戦略的展望
14.12 Magnox Ltd
14.12.1 会社概要
14.12.2 会社概要
14.12.3 製品ベンチマーク
14.12.4 戦略的展望
14.13 NUKEM Technologies GmbH
14.13.1 会社概要
14.13.2 会社概要
14.13.3 製品ベンチマーク
14.14 Holtec International
14.14.1 会社概要
14.14.2 会社概要
14.14.3 製品ベンチマーク
14.15 Veolia Environnement S.A.
14.15.1 会社概要
14.15.2 会社概要
14.15.3 財務分析
14.15.3.1 純収入、2018年〜2022年
14.15.4 製品ベンチマーク
14.15.5 戦略的展望
14.16 Waste Control Specialists LLC
14.16.1 会社概要
14.16.2 会社概要
14.16.3 製品ベンチマーク
14.17 Swedish Nuclear Fuel and Waste Management Company
14.17.1 会社概要
14.17.2 会社概要
14.17.3 製品ベンチマーク
15 結論と提言
15.1 Visiongainの結論
15.2 市場プレイヤーへの提言
ページTOPに戻る
図表リスト
表の一覧
Table 1 Nuclear Waste Management Market Snapshot, 2024 & 2034 (US$ Million, CAGR %)
Table 2 Global Nuclear Waste Management Market by Region, 2024-2034 (US$ Mn, AGR (%), CAGR (%)) (V-Shaped Recovery Scenario)
Table 3 Global Nuclear Waste Management Market by Region, 2024-2034 (US$ Mn, AGR (%), CAGR (%)) (U-Shaped Recovery Scenario)
Table 4 Global Nuclear Waste Management Market by Region, 2024-2034 (US$ Mn, AGR (%), CAGR (%)) (W-Shaped Recovery Scenario)
Table 5 Global Nuclear Waste Management Market by Region, 2024-2034 (US$ Mn, AGR (%), CAGR (%)) (L-Shaped Recovery Scenario)
Table 6 Global Nuclear Waste Management Market by Solutions, 2024-2034 (US$ Mn, AGR (%), CAGR (%))
Table 7 Waste Sorting Market by Region, 2024-2034 (US$ Mn, AGR (%), CAGR (%))
Table 8 Waste Treatment and Conditioning Market by Region, 2024-2034 (US$ Mn, AGR (%), CAGR (%))
Table 9 Waste Storage and Disposal Market by Region, 2024-2034 (US$ Mn, AGR (%), CAGR (%))
Table 10 Global Nuclear Waste Management Market by Type, 2024-2034 (US$ Mn, AGR (%), CAGR (%))
Table 11 Nuclear waste inventory (IAEA estimates, 2022)
Table 12 Very-Low-Level Waste (VLLW) Market by Region, 2024-2034 (US$ Mn, AGR (%), CAGR (%))
Table 13 Low-Level Waste (LLW) Market by Region, 2024-2034 (US$ Mn, AGR (%), CAGR (%))
Table 14 Intermediate-Level Waste (ILW) Market by Region, 2024-2034 (US$ Mn, AGR (%), CAGR (%))
Table 15 High Level Waste (HLW), Market by Region, 2024-2034 (US$ Mn, AGR (%), CAGR (%))
Table 16 Global Nuclear Waste Management Market by Disposal Method, 2024-2034 (US$ Mn, AGR (%), CAGR (%))
Table 17 Transmutation Market by Region, 2024-2034 (US$ Mn, AGR (%), CAGR (%))
Table 18 Seabed Disposal Market by Region, 2024-2034 (US$ Mn, AGR (%), CAGR (%))
Table 19 Space Disposal Market by Region, 2024-2034 (US$ Mn, AGR (%), CAGR (%))
Table 20 Encapsulation and Burial Market by Region, 2024-2034 (US$ Mn, AGR (%), CAGR (%))
Table 21 Synthetic Rock Formations Market by Region, 2024-2034 (US$ Mn, AGR (%), CAGR (%))
Table 22 Global Nuclear Waste Management Market by Source, 2024-2034 (US$ Mn, AGR (%), CAGR (%))
Table 23 Decommissioning/Remediation Market by Region, 2024-2034 (US$ Mn, AGR (%), CAGR (%))
Table 24 Reactor Operations Market by Region, 2024-2034 (US$ Mn, AGR (%), CAGR (%))
Table 25 Military and Defence Programs Market by Region, 2024-2034 (US$ Mn, AGR (%), CAGR (%))
Table 26 Nuclear Applications Market by Region, 2024-2034 (US$ Mn, AGR (%), CAGR (%))
Table 27 Fuel Reprocessing Market by Region, 2024-2034 (US$ Mn, AGR (%), CAGR (%))
Table 28 Fuel Fabrication/Enrichment Market by Region, 2024-2034 (US$ Mn, AGR (%), CAGR (%))
Table 29 Nuclear Waste Management Market Forecast by Region, 2024-2034 (US$ Million, AGR%, CAGR%)
Table 30 North America Nuclear Waste Management Market by Value, 2024-2034 (US$ Mn, AGR (%), CAGR (%))
Table 31 North America Nuclear Waste Management Market by Country, 2024-2034 (US$ Mn, AGR (%), CAGR (%))
Table 32 North America Nuclear Waste Management Market by Solutions, 2024-2034 (US$ Mn, AGR (%), CAGR (%))
Table 33 North America Nuclear Waste Management Market by Type, 2024-2034 (US$ Mn, AGR (%), CAGR (%))
Table 34 North America Nuclear Waste Management Market by Disposal Method, 2024-2034 (US$ Mn, AGR (%), CAGR (%))
Table 35 North America Nuclear Waste Management Market by Source, 2024-2034 (US$ Mn, AGR (%), CAGR (%))
Table 36 US Nuclear Waste Management Market by Value, 2024-2034 (US$ Mn, AGR (%), CAGR (%))
Table 37 Canada Nuclear Waste Management Market by Value, 2024-2034 (US$ Mn, AGR (%), CAGR (%))
Table 38 Europe Nuclear Waste Management Market by Value, 2024-2034 (US$ Mn, AGR (%), CAGR (%))
Table 39 Europe Nuclear Waste Management Market by Country, 2024-2034 (US$ Mn, AGR (%), CAGR (%))
Table 40 Europe Nuclear Waste Management Market by Solutions, 2024-2034 (US$ Mn, AGR (%), CAGR (%))
Table 41 Europe Nuclear Waste Management Market by Type, 2024-2034 (US$ Mn, AGR (%), CAGR (%))
Table 42 Europe Nuclear Waste Management Market by Disposal Method, 2024-2034 (US$ Mn, AGR (%), CAGR (%))
Table 43 Europe Nuclear Waste Management Market by Source, 2024-2034 (US$ Mn, AGR (%), CAGR (%))
Table 44 Russia Nuclear Waste Management Market by Value, 2024-2034 (US$ Mn, AGR (%), CAGR (%))
Table 45 UK Nuclear Waste Management Market by Value, 2024-2034 (US$ Mn, AGR (%), CAGR (%))
Table 46 France Nuclear Waste Management Market by Value, 2024-2034 (US$ Mn, AGR (%), CAGR (%))
Table 47 Belgium Nuclear Waste Management Market by Value, 2024-2034 (US$ Mn, AGR (%), CAGR (%))
Table 48 Finland Nuclear Waste Management Market by Value, 2024-2034 (US$ Mn, AGR (%), CAGR (%))
Table 49 Rest of Europe Nuclear Waste Management Market by Value, 2024-2034 (US$ Mn, AGR (%), CAGR (%))
Table 50 Asia-Pacific Nuclear Waste Management Market by Value, 2024-2034 (US$ Mn, AGR (%), CAGR (%))
Table 51 Asia-Pacific Nuclear Waste Management Market by Country, 2024-2034 (US$ Mn, AGR (%), CAGR (%))
Table 52 Asia-Pacific Nuclear Waste Management Market by Solutions, 2024-2034 (US$ Mn, AGR (%), CAGR (%))
Table 53 Asia-Pacific Nuclear Waste Management Market by Type, 2024-2034 (US$ Mn, AGR (%), CAGR (%))
Table 54 Asia-Pacific Nuclear Waste Management Market by Disposal Method, 2024-2034 (US$ Mn, AGR (%), CAGR (%))
Table 55 Asia-Pacific Nuclear Waste Management Market by Source, 2024-2034 (US$ Mn, AGR (%), CAGR (%))
Table 56 China Nuclear Waste Management Market by Value, 2024-2034 (US$ Mn, AGR (%), CAGR (%))
Table 57 India Nuclear Waste Management Market by Value, 2024-2034 (US$ Mn, AGR (%), CAGR (%))
Table 58 Japan Nuclear Waste Management Market by Value, 2024-2034 (US$ Mn, AGR (%), CAGR (%))
Table 59 South Korea Nuclear Waste Management Market by Value, 2024-2034 (US$ Mn, AGR (%), CAGR (%))
Table 60 Pakistan Nuclear Waste Management Market by Value, 2024-2034 (US$ Mn, AGR (%), CAGR (%))
Table 61 Rest of Asia-Pacific Nuclear Waste Management Market by Value, 2024-2034 (US$ Mn, AGR (%), CAGR (%))
Table 62 Middle East & Africa Nuclear Waste Management Market by Value, 2024-2034 (US$ Mn, AGR (%), CAGR (%))
Table 63 Middle East & Africa Nuclear Waste Management Market by Country, 2024-2034 (US$ Mn, AGR (%), CAGR (%))
Table 64 Middle East & Africa Nuclear Waste Management Market by Solutions, 2024-2034 (US$ Mn, AGR (%), CAGR (%))
Table 65 Middle East & Africa Nuclear Waste Management Market by Type, 2024-2034 (US$ Mn, AGR (%), CAGR (%))
Table 66 Middle East & Africa Nuclear Waste Management Market by Disposal Method, 2024-2034 (US$ Mn, AGR (%), CAGR (%))
Table 67 Middle East & Africa Nuclear Waste Management Market by Source, 2024-2034 (US$ Mn, AGR (%), CAGR (%))
Table 68 GCC Nuclear Waste Management Market by Value, 2024-2034 (US$ Mn, AGR (%), CAGR (%))
Table 69 South Africa Nuclear Waste Management Market by Value, 2024-2034 (US$ Mn, AGR (%), CAGR (%))
Table 70 Rest of Middle East & Africa Nuclear Waste Management Market by Value, 2024-2034 (US$ Mn, AGR (%), CAGR (%))
Table 71 Latin America Nuclear Waste Management Market by Value, 2024-2034 (US$ Mn, AGR (%), CAGR (%))
Table 72 Latin America Nuclear Waste Management Market by Country, 2024-2034 (US$ Mn, AGR (%), CAGR (%))
Table 73 Latin America Nuclear Waste Management Market by Solutions, 2024-2034 (US$ Mn, AGR (%), CAGR (%))
Table 74 Latin America Nuclear Waste Management Market by Type, 2024-2034 (US$ Mn, AGR (%), CAGR (%))
Table 75 Latin America Nuclear Waste Management Market by Disposal Method, 2024-2034 (US$ Mn, AGR (%), CAGR (%))
Table 76 Latin America Nuclear Waste Management Market by Source, 2024-2034 (US$ Mn, AGR (%), CAGR (%))
Table 77 Brazil Nuclear Waste Management Market by Value, 2024-2034 (US$ Mn, AGR (%), CAGR (%))
Table 78 Argentina Nuclear Waste Management Market by Value, 2024-2034 (US$ Mn, AGR (%), CAGR (%))
Table 79 Rest of Latin America Nuclear Waste Management Market by Value, 2024-2034 (US$ Mn, AGR (%), CAGR (%))
Table 80 Strategic Outlook - Contract
Table 81 AECOM: Key Details, (CEO, HQ, Revenue, Founded, No. of Employees, Company Type, Website, Business Segment)
Table 82 AECOM: Product Benchmarking
Table 83 AECOM: Strategic Outlook
Table 84 Bechtel Corporation: Key Details, (CEO, HQ, Revenue, Founded, No. of Employees, Company Type, Website, Business Segment)
Table 85 Bechtel Corporation: Product Benchmarking
Table 86 Bechtel Corporation: Strategic Outlook
Table 87 Fluor Corporation: Key Details, (CEO, HQ, Revenue, Founded, No. of Employees, Company Type, Website, Business Segment)
Table 88 Fluor Corporation: Product Benchmarking
Table 89 Fluor Corporation: Strategic Outlook
Table 90 Studsvik: Key Details, (CEO, HQ, Revenue, Founded, No. of Employees, Company Type, Website, Business Segment)
Table 91 Studsvik: Product Benchmarking
Table 92 Studsvik: Strategic Outlook
Table 93 Westinghouse Electric Company LLC: Key Details, (CEO, HQ, Revenue, Founded, No. of Employees, Company Type, Website, Business Segment)
Table 94 Westinghouse Electric Company LLC: Product Benchmarking
Table 95 Westinghouse Electric Company LLC: Strategic Outlook
Table 96 Orano SA :Key Details, (CEO, HQ, Revenue, Founded, No. of Employees, Company Type, Website, Business Segment)
Table 97 Orano SA: Product Benchmarking
Table 98 Jacobs Solutions Inc: Key Details, (CEO, HQ, Revenue, Founded, No. of Employees, Company Type, Website, Business Segment)
Table 99 Jacobs Solutions Inc: Product Benchmarking
Table 100 Jacobs Solutions Inc: Strategic Outlook
Table 101 Energy Solutions: Key Details, (CEO, HQ, Revenue, Founded, No. of Employees, Company Type, Website, Business Segment)
Table 102 Energy Solutions: Product Benchmarking
Table 103 Enercon Services, Inc: Key Details, (CEO, HQ, Revenue, Founded, No. of Employees, Company Type, Website, Business Segment)
Table 104 Enercon Services, Inc: Product Benchmarking
Table 105 Enercon Services, Inc: Strategic Outlook
Table 106 Magnox Ltd: Key Details, (CEO, HQ, Revenue, Founded, No. of Employees, Company Type, Website, Business Segment)
Table 107 Magnox Ltd: Product Benchmarking
Table 108 Magnox Ltd: Strategic Outlook
Table 109 NUKEM Technologies GmbH: Key Details, (CEO, HQ, Revenue, Founded, No. of Employees, Company Type, Website, Business Segment)
Table 110 NUKEM Technologies GmbH: Product Benchmarking
Table 111 Holtec International: Key Details, (CEO, HQ, Revenue, Founded, No. of Employees, Company Type, Website, Business Segment)
Table 112 Holtec International: Product Benchmarking
Table 113 Veolia Environnement S.A.: Key Details, (CEO, HQ, Revenue, Founded, No. of Employees, Company Type, Website, Business Segment)
Table 114 Veolia Environnement S.A.: Product Benchmarking
Table 115 Veolia Environnement S.A.: Strategic Outlook
Table 116 Waste Control Specialists LLC: Key Details, (CEO, HQ, Revenue, Founded, No. of Employees, Company Type, Website, Business Segment)
Table 117 Waste Control Specialists LLC: Product Benchmarking
Table 118 Swedish Nuclear Fuel and Waste Management Company: Key Details, (CEO, HQ, Revenue, Founded, No. of Employees, Company Type, Website, Business Segment)
Table 119 Swedish Nuclear Fuel and Waste Management Company: Product Benchmarking
図の一覧
Figure 1 Nuclear Waste Management Market Segmentation
Figure 2 Nuclear Waste Management Market by Solutions: Market Attractiveness Index
Figure 3 Nuclear Waste Management Market by Type: Market Attractiveness Index
Figure 4 Nuclear Waste Management Market by Disposal Method: Market Attractiveness Index
Figure 5 Nuclear Waste Management Market by Source: Market Attractiveness Index
Figure 6 Nuclear Waste Management Market Attractiveness Index by Region
Figure 7 Nuclear Waste Management Market: Market Dynamics
Figure 8 Nuclear Waste Management Market: Porter’s Five Forces Analysis
Figure 9 Global Nuclear Waste Management Market Share Forecast by COVID, 2024-2034 (%)
Figure 10 Global Nuclear Waste Management Market by Region, 2024-2034 (US$ Mn, AGR (%)) (V-Shaped Recovery Scenario)
Figure 11 Global Nuclear Waste Management Market by Region, 2024-2034 (US$ Mn, AGR (%)) (U-Shaped Recovery Scenario)
Figure 12 Global Nuclear Waste Management Market by Region, 2024-2034 (US$ Mn, AGR (%)) (W-Shaped Recovery Scenario)
Figure 13 Global Nuclear Waste Management Market by Region, 2024-2034 (US$ Mn, AGR (%)) (L-Shaped Recovery Scenario)
Figure 14 Nuclear Waste Management Market: PEST Analysis
Figure 15 Nuclear Waste Management Market by Solutions: Market Attractiveness Index
Figure 16 Global Nuclear Waste Management Market by Solutions, 2024-2034 (US$ Mn, AGR (%))
Figure 17 Nuclear Waste Management Market Share Forecast by Solutions, 2024, 2029, 2034 (%)
Figure 18 Waste Sorting Market by Region, 2024-2034 (US$ Mn, AGR (%))
Figure 19 Sorting Market Share Forecast by Region, 2024 & 2034 (%)
Figure 20 Waste Treatment and Conditioning Market by Region, 2024-2034 (US$ Mn, AGR (%))
Figure 21 Treatment and Conditioning Market Share Forecast by Region, 2024 & 2034 (%)
Figure 22 Waste Storage and Disposal Market by Region, 2024-2034 (US$ Mn, AGR (%))
Figure 23 Storage and Disposal Market Share Forecast by Region, 2024 & 2034 (%)
Figure 24 Nuclear Waste Management Market by Type: Market Attractiveness Index
Figure 25 Global Nuclear Waste Management Market by Type, 2024-2034 (US$ Mn, AGR (%))
Figure 26 Nuclear Waste Management Market Share Forecast by Type, 2024, 2029, 2034 (%)
Figure 27 Very-Low-Level Waste (VLLW) Market by Region, 2024-2034 (US$ Mn, AGR (%))
Figure 28 Very-Low-Level Waste (VLLW) Market Share Forecast by Region, 2024 & 2034 (%)
Figure 29 Low-Level Waste (LLW) Market by Region, 2024-2034 (US$ Mn, AGR (%))
Figure 30 Low-Level Waste (LLW) Market Share Forecast by Region, 2024 & 2034 (%)
Figure 31 Intermediate-Level Waste (ILW) Market by Region, 2024-2034 (US$ Mn, AGR (%))
Figure 32 Intermediate-Level Waste (ILW) Market Share Forecast by Region, 2024 & 2034 (%)
Figure 33 High Level Waste (HLW), Market by Region, 2024-2034 (US$ Mn, AGR (%))
Figure 34 High Level Waste (HLW) Market Share Forecast by Region, 2024 & 2034 (%)
Figure 35 Nuclear Waste Management Market by Disposal Method: Market Attractiveness Index
Figure 36 Global Nuclear Waste Management Market by Disposal Method, 2024-2034 (US$ Mn, AGR (%))
Figure 37 Nuclear Waste Management Market Share Forecast by Disposal Method, 2024, 2029, 2034 (%)
Figure 38 Transmutation Market by Region, 2024-2034 (US$ Mn, AGR (%))
Figure 39 Transmutation Market Share Forecast by Region, 2024 & 2034 (%)
Figure 40 Seabed Disposal Market by Region, 2024-2034 (US$ Mn, AGR (%))
Figure 41 Seabed Disposal Market Share Forecast by Region, 2024 & 2034 (%)
Figure 42 Space Disposal Market by Region, 2024-2034 (US$ Mn, AGR (%))
Figure 43 Space Disposal Market Share Forecast by Region, 2024 & 2034 (%)
Figure 44 Encapsulation and Burial Market by Region, 2024-2034 (US$ Mn, AGR (%))
Figure 45 Encapsulation and Burial Market Share Forecast by Region, 2024 & 2034 (%)
Figure 46 Synthetic Rock Formations Market by Region, 2024-2034 (US$ Mn, AGR (%))
Figure 47 Synthetic Rock Formations Market Share Forecast by Region, 2024 & 2034 (%)
Figure 48 Nuclear Waste Management Market by Source: Market Attractiveness Index
Figure 49 Global Nuclear Waste Management Market by Source, 2024-2034 (US$ Mn, AGR (%))
Figure 50 Nuclear Waste Management Market Share Forecast by Source, 2024, 2029, 2034 (%)
Figure 51 Decommissioning/Remediation Market by Region, 2024-2034 (US$ Mn, AGR (%))
Figure 52 Decommissioning/Remediation Market Share Forecast by Region, 2024 & 2034 (%)
Figure 53 Reactor Operations Market by Region, 2024-2034 (US$ Mn, AGR (%))
Figure 54 Reactor Operations Market Share Forecast by Region, 2024 & 2034 (%)
Figure 55 Military and Defence Programs Market by Region, 2024-2034 (US$ Mn, AGR (%))
Figure 56 Military and Defence Programs Market Share Forecast by Region, 2024 & 2034 (%)
Figure 57 Nuclear Applications Market by Region, 2024-2034 (US$ Mn, AGR (%))
Figure 58 Nuclear Applications Market Share Forecast by Region, 2024 & 2034 (%)
Figure 59 Fuel Reprocessing Market by Region, 2024-2034 (US$ Mn, AGR (%))
Figure 60 Fuel Reprocessing Market Share Forecast by Region, 2024 & 2034 (%)
Figure 61 Fuel Fabrication/Enrichment Market by Region, 2024-2034 (US$ Mn, AGR (%))
Figure 62 Fuel Fabrication/Enrichment Market Share Forecast by Region, 2024 & 2034 (%)
Figure 63 Nuclear Waste Management Market Forecast by Region 2024 and 2034 (Revenue, CAGR%)
Figure 64 Nuclear Waste Management Market Share Forecast by Region 2024, 2029, 2034 (%)
Figure 65 Nuclear Waste Management Market by Region, 2024-2034 (US$ Million, AGR %)
Figure 66 North America Nuclear Waste Management Market Attractiveness Index
Figure 67 North America Nuclear Waste Management Market by Region, 2024, 2029 & 2034 (US$ Million)
Figure 68 North America Nuclear Waste Management Market by Value, 2024-2034 (US$ Mn, AGR (%))
Figure 69 North America Nuclear Waste Management Market by Country, 2024-2034 (US$ Mn, AGR (%))
Figure 70 North America Nuclear Waste Management Market Share Forecast by Country, 2024 & 2034 (%)
Figure 71 North America Nuclear Waste Management Market by Solutions, 2024-2034 (US$ Mn, AGR (%))
Figure 72 North America Nuclear Waste Management Market Share Forecast Solutions, 2024 & 2034 (%)
Figure 73 North America Nuclear Waste Management Market by Type, 2024-2034 (US$ Mn, AGR (%))
Figure 74 North America Nuclear Waste Management Market Share Forecast by Type, 2024 & 2034 (%)
Figure 75 North America Nuclear Waste Management Market by Disposal Method, 2024-2034 (US$ Mn, AGR (%))
Figure 76 North America Nuclear Waste Management Market Share Forecast by Disposal Method, 2024 & 2034 (%)
Figure 77 North America Nuclear Waste Management Market by Source, 2024-2034 (US$ Mn, AGR (%))
Figure 78 North America Nuclear Waste Management Market Share Forecast by Source, 2024 & 2034 (%)
Figure 79 US Nuclear Waste Management Market by Value, 2024-2034 (US$ Mn, AGR (%))
Figure 80 Canada Nuclear Waste Management Market by Value, 2024-2034 (US$ Mn, AGR (%))
Figure 81 Europe Nuclear Waste Management Market Attractiveness Index
Figure 82 Europe Nuclear Waste Management Market by Region, 2024, 2029 & 2034 (US$ Million)
Figure 83 Europe Nuclear Waste Management Market by Value, 2024-2034 (US$ Mn, AGR (%))
Figure 84 Europe Nuclear Waste Management Market by Country, 2024-2034 (US$ Mn, AGR (%))
Figure 85 Europe Nuclear Waste Management Market Share Forecast by Country, 2024 & 2034 (%)
Figure 86 Europe Nuclear Waste Management Market by Solutions, 2024-2034 (US$ Mn, AGR (%))
Figure 87 Europe Nuclear Waste Management Market Share Forecast Solutions, 2024 & 2034 (%)
Figure 88 Europe Nuclear Waste Management Market by Type, 2024-2034 (US$ Mn, AGR (%))
Figure 89 Europe Nuclear Waste Management Market Share Forecast by Type, 2024 & 2034 (%)
Figure 90 Europe Nuclear Waste Management Market by Disposal Method, 2024-2034 (US$ Mn, AGR (%))
Figure 91 Europe Nuclear Waste Management Market Share Forecast by Disposal Method, 2024 & 2034 (%)
Figure 92 Europe Nuclear Waste Management Market by Source, 2024-2034 (US$ Mn, AGR (%))
Figure 93 Europe Nuclear Waste Management Market Share Forecast by Source, 2024 & 2034 (%)
Figure 94 Russia Nuclear Waste Management Market by Value, 2024-2034 (US$ Mn, AGR (%))
Figure 95 UK Nuclear Waste Management Market by Value, 2024-2034 (US$ Mn, AGR (%))
Figure 96 France Nuclear Waste Management Market by Value, 2024-2034 (US$ Mn, AGR (%))
Figure 97 Belgium Nuclear Waste Management Market by Value, 2024-2034 (US$ Mn, AGR (%))
Figure 98 Finland Nuclear Waste Management Market by Value, 2024-2034 (US$ Mn, AGR (%))
Figure 99 Rest of Europe Nuclear Waste Management Market by Value, 2024-2034 (US$ Mn, AGR (%))
Figure 100 Asia-Pacific Nuclear Waste Management Market Attractiveness Index
Figure 101 Asia-Pacific Nuclear Waste Management Market by Region, 2024, 2029 & 2034 (US$ Million)
Figure 102 Asia-Pacific Nuclear Waste Management Market by Value, 2024-2034 (US$ Mn, AGR (%))
Figure 103 Asia-Pacific Nuclear Waste Management Market by Country, 2024-2034 (US$ Mn, AGR (%))
Figure 104 Asia-Pacific Nuclear Waste Management Market Share Forecast by Country, 2024 & 2034 (%)
Figure 105 Asia-Pacific Nuclear Waste Management Market by Solutions, 2024-2034 (US$ Mn, AGR (%))
Figure 106 Asia-Pacific Nuclear Waste Management Market Share Forecast Solutions, 2024 & 2034 (%)
Figure 107 Asia-Pacific Nuclear Waste Management Market by Type, 2024-2034 (US$ Mn, AGR (%))
Figure 108 Asia-Pacific Nuclear Waste Management Market Share Forecast by Type, 2024 & 2034 (%)
Figure 109 Asia-Pacific Nuclear Waste Management Market by Disposal Method, 2024-2034 (US$ Mn, AGR (%))
Figure 110 Asia-Pacific Nuclear Waste Management Market Share Forecast by Disposal Method, 2024 & 2034 (%)
Figure 111 Asia-Pacific Nuclear Waste Management Market by Source, 2024-2034 (US$ Mn, AGR (%))
Figure 112 Asia-Pacific Nuclear Waste Management Market Share Forecast by Source, 2024 & 2034 (%)
Figure 113 China Nuclear Waste Management Market by Value, 2024-2034 (US$ Mn, AGR (%))
Figure 114 India Nuclear Waste Management Market by Value, 2024-2034 (US$ Mn, AGR (%))
Figure 115 Japan Nuclear Waste Management Market by Value, 2024-2034 (US$ Mn, AGR (%))
Figure 116 South Korea Nuclear Waste Management Market by Value, 2024-2034 (US$ Mn, AGR (%))
Figure 117 Pakistan Nuclear Waste Management Market by Value, 2024-2034 (US$ Mn, AGR (%))
Figure 118 Rest of Asia-Pacific Nuclear Waste Management Market by Value, 2024-2034 (US$ Mn, AGR (%))
Figure 119 Middle East and Africa Nuclear Waste Management Market Attractiveness Index
Figure 120 Middle East and Africa Nuclear Waste Management Market by Region, 2024, 2029 & 2034 (US$ Million)
Figure 121 Middle East & Africa Nuclear Waste Management Market by Value, 2024-2034 (US$ Mn, AGR (%))
Figure 122 Middle East & Africa Nuclear Waste Management Market by Country, 2024-2034 (US$ Mn, AGR (%))
Figure 123 Middle East and Africa Nuclear Waste Management Market Share Forecast by Country, 2024 & 2034 (%)
Figure 124 Middle East & Africa Nuclear Waste Management Market by Solutions, 2024-2034 (US$ Mn, AGR (%))
Figure 125 Middle East and Africa Nuclear Waste Management Market Share Forecast Solutions, 2024 & 2034 (%)
Figure 126 Middle East & Africa Nuclear Waste Management Market by Type, 2024-2034 (US$ Mn, AGR (%))
Figure 127 Middle East and Africa Nuclear Waste Management Market Share Forecast by Type, 2024 & 2034 (%)
Figure 128 Middle East & Africa Nuclear Waste Management Market by Disposal Method, 2024-2034 (US$ Mn, AGR (%))
Figure 129 Middle East and Africa Nuclear Waste Management Market Share Forecast by Disposal Method, 2024 & 2034 (%)
Figure 130 Middle East & Africa Nuclear Waste Management Market by Source, 2024-2034 (US$ Mn, AGR (%))
Figure 131 Middle East and Africa Nuclear Waste Management Market Share Forecast by Source, 2024 & 2034 (%)
Figure 132 GCC Nuclear Waste Management Market by Value, 2024-2034 (US$ Mn, AGR (%))
Figure 133 South Africa Nuclear Waste Management Market by Value, 2024-2034 (US$ Mn, AGR (%))
Figure 134 Rest of Middle East & Africa Nuclear Waste Management Market by Value, 2024-2034 (US$ Mn, AGR (%))
Figure 135 Latin America Nuclear Waste Management Market Attractiveness Index
Figure 136 Latin America Nuclear Waste Management Market by Region, 2024, 2029 & 2034 (US$ Million)
Figure 137 Latin America Nuclear Waste Management Market by Value, 2024-2034 (US$ Mn, AGR (%))
Figure 138 Latin America Nuclear Waste Management Market by Country, 2024-2034 (US$ Mn, AGR (%))
Figure 139 Latin America Nuclear Waste Management Market Share Forecast by Country, 2024 & 2034 (%)
Figure 140 Latin America Nuclear Waste Management Market by Solutions, 2024-2034 (US$ Mn, AGR (%))
Figure 141 Latin America Nuclear Waste Management Market Share Forecast Solutions, 2024 & 2034 (%)
Figure 142 Latin America Nuclear Waste Management Market by Type, 2024-2034 (US$ Mn, AGR (%))
Figure 143 Latin America Nuclear Waste Management Market Share Forecast by Type, 2024 & 2034 (%)
Figure 144 Latin America Nuclear Waste Management Market by Disposal Method, 2024-2034 (US$ Mn, AGR (%))
Figure 145 Latin America Nuclear Waste Management Market Share Forecast by Disposal Method, 2024 & 2034 (%)
Figure 146 Latin America Nuclear Waste Management Market by Source, 2024-2034 (US$ Mn, AGR (%))
Figure 147 Latin America Nuclear Waste Management Market Share Forecast by Source, 2024 & 2034 (%)
Figure 148 Brazil Nuclear Waste Management Market by Value, 2024-2034 (US$ Mn, AGR (%))
Figure 149 Argentina Nuclear Waste Management Market by Value, 2024-2034 (US$ Mn, AGR (%))
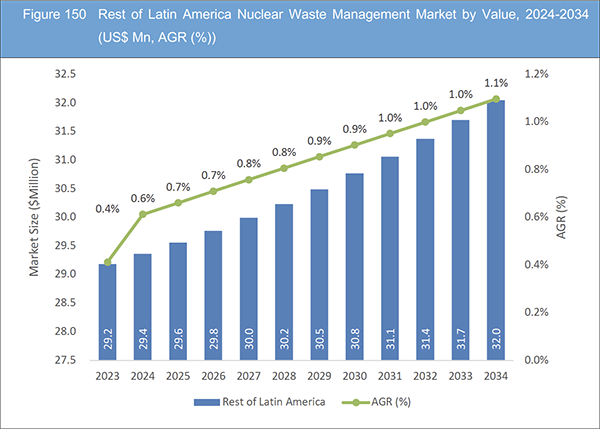
Figure 150 Rest of Latin America Nuclear Waste Management Market by Value, 2024-2034 (US$ Mn, AGR (%))
Figure 151 Rest of Latin America Nuclear Waste Management Market by Value, 2024-2034 (US$ Mn, AGR (%))
Figure 152 AECOM.: Net Revenue, 2018-2022 (US$ Million, AGR%)
Figure 153 AECOM.: Regional Revenue Share, 2022 (%)
Figure 154 Fluor Corporation.: Net Revenue, 2018-2022 (US$ Million, AGR%)
Figure 155 Fluor Corporation.: Regional Revenue Share, 2022 (%)
Figure 156 Fluor Corporation.: Business Segment Revenue Share, 2022 (%)
Figure 157 Jacobs Solutions Inc.: Net Revenue, 2018-2022 (US$ Million, AGR%)
Figure 158 Veolia Environnement S.A..: Net Revenue, 2018-2022 (US$ Million, AGR%)
ページTOPに戻る
Summary
Report Details
The Nuclear Waste Management Market Report 2024-2034: This report will prove invaluable to leading firms striving for new revenue pockets if they wish to better understand the industry and its underlying dynamics. It will be useful for companies that would like to expand into different industries or to expand their existing operations in a new region.
Technological Advancements: Pioneering Waste Disposal Solutions
Technological advancements in nuclear waste management are revolutionizing how we handle radioactive materials. Innovations like advanced robotics allow for precise handling and transportation of nuclear waste, ensuring minimal human exposure. Vitrification techniques, where waste is immobilized in glass or ceramic, offer a stable, long-term storage solution, preventing leaching into the environment. Additionally, research in materials science has led to the development of highly durable containers and shielding materials, enhancing the safety of storage and transportation. These advancements not only improve the efficiency of waste disposal but also significantly enhance the safety protocols, making the process more reliable and secure.
Stringent Regulatory Framework: Ensuring Compliance and Safety
A robust regulatory framework is imperative in the nuclear waste management sector. Stringent regulations are put in place by national and international bodies to ensure compliance with safety standards. These regulations cover every aspect, from waste categorization and packaging to transportation and storage. Compliance ensures that waste management practices are transparent, environmentally friendly, and safe for both workers and the surrounding communities. Adhering to these regulations not only guarantees the safety of the disposal process but also builds public trust and confidence, crucial for the industry’s long-term sustainability.
What Questions Should You Ask before Buying a Market Research Report?
• How is the nuclear waste management market evolving?
• What is driving and restraining the nuclear waste management market?
• How will each nuclear waste management submarket segment grow over the forecast period and how much revenue will these submarkets account for in 2034?
• How will the market shares for each nuclear waste management submarket develop from 2024 to 2034?
• What will be the main driver for the overall market from 2024 to 2034?
• Will leading nuclear waste management markets broadly follow the macroeconomic dynamics, or will individual national markets outperform others?
• How will the market shares of the national markets change by 2034 and which geographical region will lead the market in 2034?
• Who are the leading players and what are their prospects over the forecast period?
• What are the nuclear waste management projects for these leading companies?
• How will the industry evolve during the period between 2024 and 2034? What are the implications of nuclear waste management projects taking place now and over the next 10 years?
• Is there a greater need for product commercialisation to further scale the nuclear waste management market?
• Where is the nuclear waste management market heading and how can you ensure you are at the forefront of the market?
• What are the best investment options for new product and service lines?
• What are the key prospects for moving companies into a new growth path and C-suite?
You need to discover how this will impact the nuclear waste management market today, and over the next 10 years:
• Our 359-page report provides 119 tables and 158 charts/graphs exclusively to you.
• The report highlights key lucrative areas in the industry so you can target them – NOW.
• It contains in-depth analysis of global, regional and national sales and growth.
• It highlights for you the key successful trends, changes and revenue projections made by your competitors.
This report tells you TODAY how the nuclear waste management market will develop in the next 10 years, and in line with the variations in COVID-19 economic recession and bounce. This market is more critical now than at any point over the last 10 years.
Forecasts to 2034 and other analyses reveal commercial prospects
• In addition to revenue forecasting to 2034, our new study provides you with recent results, growth rates, and market shares.
• You will find original analyses, with business outlooks and developments.
• Discover qualitative analyses (including market dynamics, drivers, opportunities, restraints and challenges), cost structure, impact of rising nuclear waste management prices and recent developments.
This report includes data analysis and invaluable insight into how COVID-19 will affect the industry and your company. Four COVID-19 recovery patterns and their impact, namely, “V”, “L”, “W” and “U” are discussed in this report.
Segments Covered in the Report
Market Segment by Solutions
• Waste Sorting
• Waste Treatment and Conditioning
• Waste Storage and Disposal
Market Segment by Type
• Very-Low-Level Waste (VLLW)
• Low-Level Waste (LLW)
• Intermediate-Level Waste (ILW)
• High Level Waste (HLW),
Market Segment by Disposal Method
• Transmutation
• Seabed Disposal
• Space Disposal
• Encapsulation and Burial
• Synthetic Rock Formations
Market Segment by Source
• Decommissioning/Remediation
• Reactor Operations
• Military and Defence Programs
• Nuclear Applications
• Fuel Reprocessing
• Fuel Fabrication/Enrichment
In addition to the revenue predictions for the overall world market and segments, you will also find revenue forecasts for four regional and 20 leading national markets:
North America
• U.S.
• Canada
Europe
• Russia
• UK
• France
• Belgium
• Finland
• Rest of Europe
Asia Pacific
• China
• Japan
• India
• Pakistan
• South Korea
• Rest of Asia Pacific
Latin America
• Brazil
• Argentina
• Rest of Latin America
Middle East & Africa
• GCC
• South Africa
• Rest of Middle East & Africa
The report also includes profiles and for some of the leading companies in the Nuclear Waste Management Market, 2024 to 2034, with a focus on this segment of these companies’ operations.
Leading companies and the potential for market growth
• AECOM
• Bechtel Corporation
• Enercon Services, Inc
• EnergySolutions
• Fluor Corporation
• Holtec International
• Jacobs Solutions Inc.
• Magnox Ltd
• NUKEM Technologies GmbH
• Orano SA
• Studsvik
• Swedish Nuclear Fuel and Waste Management Company
• Veolia Environnement S.A.
• Waste Control Specialists LLC
• Westinghouse Electric Company LLC
Overall world revenue for Nuclear Waste Management Market, 2024 to 2034 in terms of value the market will surpass US$4,917.5 million in 2024, our work calculates. We predict strong revenue growth through to 2034. Our work identifies which organizations hold the greatest potential. Discover their capabilities, progress, and commercial prospects, helping you stay ahead.
How will the Nuclear Waste Management Market, 2024 to 2034 report help you?
In summary, our 350+ page report provides you with the following knowledge:
• Revenue forecasts to 2034 for Nuclear Waste Management Market, 2024 to 2034 Market, with forecasts for solutions, type, disposal method, and source, each forecast at a global and regional level – discover the industry’s prospects, finding the most lucrative places for investments and revenues.
• Revenue forecasts to 2034 for four regional and 20 key national markets – See forecasts for the Nuclear Waste Management Market, 2024 to 2034 market in North America, Europe, Asia-Pacific, Latin America and Middle East & Africa. Also forecasted is the market in the US, Canada, Brazil, Germany, France, UK, Belgium, Finland, China, India, Japan, and Australia among other prominent economies.
• Prospects for established firms and those seeking to enter the market – including company profiles for 15 of the major companies involved in the Nuclear Waste Management Market, 2024 to 2034.
Find quantitative and qualitative analyses with independent predictions. Receive information that only our report contains, staying informed with invaluable business intelligence.
Information found nowhere else
With our new report, you are less likely to fall behind in knowledge or miss out on opportunities. See how our work could benefit your research, analyses, and decisions. Visiongain’s study is for everybody needing commercial analyses for the Nuclear Waste Management Market, 2024 to 2034, market-leading companies. You will find data, trends and predictions.
ページTOPに戻る
Table of Contents
Table of Contents
1 Report Overview
1.1 Objectives of the Study
1.2 Introduction to Nuclear Waste Management Market
1.3 What This Report Delivers
1.4 Why You Should Read This Report
1.5 Key Questions Answered by This Analytical Report
1.6 Who Is This Report for?
1.7 Methodology
1.7.1 Market Definitions
1.7.2 Market Evaluation & Forecasting Methodology
1.7.3 Data Validation
1.7.3.1 Primary Research
1.7.3.2 Secondary Research
1.8 Frequently Asked Questions (FAQs)
1.9 Associated Visiongain Reports
1.10 About Visiongain
2 Executive Summary
3 Market Overview
3.1 Key Findings
3.2 Market Dynamics
3.2.1 Market Driving Factors
3.2.1.1 Lack of Permanent Disposal Alternatives Driving the Market Growth
3.2.1.2 Volume Reduction and Long-Term Solutions Driving the Market Growth
3.2.1.3 Resource Conservation and Energy Generation Driving the Market Growth
3.2.2 Market Restraining Factors
3.2.2.1 Environmental Risk and Radioactive Hazards Can be Restrain the Market Growth
3.2.2.2 Risk Associated with Transportation of Nuclear Waste and the High Cost of Treatment can be Restrain the Market Growth
3.2.2.3 High Cost and Stringent Regulations Can be Restrain the Market Growth
3.2.3 Market Opportunities
3.2.3.1 Advanced Waste Treatment Technologies opportunities for the Market Growth
3.2.3.2 The Shift Towards Renewable Energy Sources Presents Opportunities for Diversification Within the Nuclear Waste Management Sector
3.2.3.3 Government Support for Nuclear Waste Management Projects, Such as Funding and Regulatory Approvals for Waste Disposal Sites, Creates Opportunities for Companies in the Sector
3.3 Porter’s Five Forces Analysis
3.3.1 Bargaining Power of Suppliers (Low to Medium)
3.3.2 Bargaining Power of Buyers (High)
3.3.3 Competitive Rivalry (Medium)
3.3.4 Threat from Substitutes (Low)
3.3.5 Threat of New Entrants (High)
3.4 COVID-19 Impact Analysis
3.4.1 “V-Shaped Recovery”
3.4.2 “U-Shaped Recovery”
3.4.3 “W-Shaped Recovery”
3.4.4 “L-Shaped Recovery”
3.5 PEST Analysis
4 Nuclear Waste Management Market Analysis by Solutions
4.1 Key Findings
4.2 Solutions Segment: Market Attractiveness Index
4.3 Nuclear Waste Management Market Size Estimation and Forecast by Solutions
4.4 Sorting
4.4.1 Market Size by Region, 2024-2034 (US$ Million)
4.4.2 Market Share by Region, 2024 & 2034 (%)
4.5 Treatment and Conditioning
4.5.1 Market Size by Region, 2024-2034 (US$ Million)
4.5.2 Market Share by Region, 2024 & 2034 (%)
4.6 Storage and Disposal
4.6.1 Market Size by Region, 2024-2034 (US$ Million)
4.6.2 Market Share by Region, 2024 & 2034 (%)
5 Nuclear Waste Management Market Analysis by Type
5.1 Key Findings
5.2 Type Segment: Market Attractiveness Index
5.3 Nuclear Waste Management Market Size Estimation and Forecast by Type
5.4 Very-Low-Level Waste (VLLW)
5.4.1 Market Size by Region, 2024-2034 (US$ Million)
5.4.2 Market Share by Region, 2024 & 2034 (%)
5.5 Low-Level Waste (LLW)
5.5.1 Market Size by Region, 2024-2034 (US$ Million)
5.5.2 Market Share by Region, 2024 & 2034 (%)
5.6 Intermediate-Level Waste (ILW)
5.6.1 Market Size by Region, 2024-2034 (US$ Million)
5.6.2 Market Share by Region, 2024 & 2034 (%)
5.7 High Level Waste (HLW)
5.7.1 Market Size by Region, 2024-2034 (US$ Million)
5.7.2 Market Share by Region, 2024 & 2034 (%)
6 Nuclear Waste Management Market Analysis by Disposal Method
6.1 Key Findings
6.2 Disposal Method Segment: Market Attractiveness Index
6.3 Nuclear Waste Management Market Size Estimation and Forecast by Disposal Method
6.4 Transmutation
6.4.1 Market Size by Region, 2024-2034 (US$ Million)
6.4.2 Market Share by Region, 2024 & 2034 (%)
6.5 Seabed Disposal
6.5.1 Market Size by Region, 2024-2034 (US$ Million)
6.5.2 Market Share by Region, 2024 & 2034 (%)
6.6 Space Disposal
6.6.1 Market Size by Region, 2024-2034 (US$ Million)
6.6.2 Market Share by Region, 2024 & 2034 (%)
6.7 Encapsulation and Burial
6.7.1 Market Size by Region, 2024-2034 (US$ Million)
6.7.2 Market Share by Region, 2024 & 2034 (%)
6.8 Synthetic Rock Formations
6.8.1 Market Size by Region, 2024-2034 (US$ Million)
6.8.2 Market Share by Region, 2024 & 2034 (%)
7 Nuclear Waste Management Market Analysis by Source
7.1 Key Findings
7.2 Source Segment: Market Attractiveness Index
7.3 Nuclear Waste Management Market Size Estimation and Forecast by Source
7.4 Decommissioning/Remediation
7.4.1 Market Size by Region, 2024-2034 (US$ Million)
7.4.2 Market Share by Region, 2024 & 2034 (%)
7.5 Reactor Operations
7.5.1 Market Size by Region, 2024-2034 (US$ Million)
7.5.2 Market Share by Region, 2024 & 2034 (%)
7.6 Military and Defence Programs
7.6.1 Market Size by Region, 2024-2034 (US$ Million)
7.6.2 Market Share by Region, 2024 & 2034 (%)
7.7 Nuclear Applications
7.7.1 Market Size by Region, 2024-2034 (US$ Million)
7.7.2 Market Share by Region, 2024 & 2034 (%)
7.8 Fuel Reprocessing
7.8.1 Market Size by Region, 2024-2034 (US$ Million)
7.8.2 Market Share by Region, 2024 & 2034 (%)
7.9 Fuel Fabrication/Enrichment
7.9.1 Market Size by Region, 2024-2034 (US$ Million)
7.9.2 Market Share by Region, 2024 & 2034 (%)
8 Nuclear Waste Management Market Analysis by Region
8.1 Key Findings
8.2 Regional Market Size Estimation and Forecast
9 North America Nuclear Waste Management Market Analysis
9.1 Key Findings
9.2 North America Nuclear Waste Management Market Attractiveness Index
9.3 North America Nuclear Waste Management Market by Country, 2024, 2029 & 2034 (US$ Million)
9.4 North America Nuclear Waste Management Market Size Estimation and Forecast
9.5 North America Nuclear Waste Management Market Size Estimation and Forecast by Country
9.6 North America Nuclear Waste Management Market Size Estimation and Forecast by Solutions
9.7 North America Nuclear Waste Management Market Size Estimation and Forecast by Type
9.8 North America Nuclear Waste Management Market Size Estimation and Forecast by Disposal Method
9.9 North America Nuclear Waste Management Market Size Estimation and Forecast by Source
9.10 U.S. Nuclear Waste Management Market Analysis
9.11 Canada Nuclear Waste Management Market Analysis
10 Europe Nuclear Waste Management Market Analysis
10.1 Key Findings
10.2 Europe Nuclear Waste Management Market Attractiveness Index
10.3 Europe Nuclear Waste Management Market by Country, 2024, 2029 & 2034 (US$ Million)
10.4 Europe Nuclear Waste Management Market Size Estimation and Forecast
10.5 Europe Nuclear Waste Management Market Size Estimation and Forecast by Country
10.6 Europe Nuclear Waste Management Market Size Estimation and Forecast by Solutions
10.7 Europe Nuclear Waste Management Market Size Estimation and Forecast by Type
10.8 Europe Nuclear Waste Management Market Size Estimation and Forecast by Disposal Method
10.9 Europe Nuclear Waste Management Market Size Estimation and Forecast by Source
10.10 Russia Nuclear Waste Management Market Analysis
10.11 UK Nuclear Waste Management Market Analysis
10.12 France Nuclear Waste Management Market Analysis
10.13 Belgium Nuclear Waste Management Market Analysis
10.14 Finland Nuclear Waste Management Market Analysis
10.15 Rest of Europe Nuclear Waste Management Market Analysis
11 Asia-Pacific Nuclear Waste Management Market Analysis
11.1 Key Findings
11.2 Asia-Pacific Nuclear Waste Management Market Attractiveness Index
11.3 Asia-Pacific Nuclear Waste Management Market by Country, 2024, 2029 & 2034 (US$ Million)
11.4 Asia-Pacific Nuclear Waste Management Market Size Estimation and Forecast
11.5 Asia-Pacific Nuclear Waste Management Market Size Estimation and Forecast by Country
11.6 Asia-Pacific Nuclear Waste Management Market Size Estimation and Forecast by Solutions
11.7 Asia-Pacific Nuclear Waste Management Market Size Estimation and Forecast by Type
11.8 Asia-Pacific Nuclear Waste Management Market Size Estimation and Forecast by Disposal Method
11.9 Asia-Pacific Nuclear Waste Management Market Size Estimation and Forecast by Source
11.10 China Nuclear Waste Management Market Analysis
11.11 India Nuclear Waste Management Market Analysis
11.12 Japan Nuclear Waste Management Market Analysis
11.13 South Korea Nuclear Waste Management Market Analysis
11.14 Pakistan Nuclear Waste Management Market Analysis
11.15 Rest of Asia-Pacific Nuclear Waste Management Market Analysis
12 Middle East and Africa Nuclear Waste Management Market Analysis
12.1 Key Findings
12.2 Middle East and Africa Nuclear Waste Management Market Attractiveness Index
12.3 Middle East and Africa Nuclear Waste Management Market by Country, 2024, 2029 & 2034 (US$ Million)
12.4 Middle East and Africa Nuclear Waste Management Market Size Estimation and Forecast
12.5 Middle East and Africa Nuclear Waste Management Market Size Estimation and Forecast by Country
12.6 Middle East and Africa Nuclear Waste Management Market Size Estimation and Forecast by Solutions
12.7 Middle East and Africa Nuclear Waste Management Market Size Estimation and Forecast by Type
12.8 Middle East and Africa Nuclear Waste Management Market Size Estimation and Forecast by Disposal Method
12.9 Middle East and Africa Nuclear Waste Management Market Size Estimation and Forecast by Source
12.10 GCC Nuclear Waste Management Market Analysis
12.11 South Africa Nuclear Waste Management Market Analysis
12.12 Rest of Middle East & Africa Nuclear Waste Management Market Analysis
13 Latin America Nuclear Waste Management Market Analysis
13.1 Key Findings
13.2 Latin America Nuclear Waste Management Market Attractiveness Index
13.3 Latin America Nuclear Waste Management Market by Country, 2024, 2029 & 2034 (US$ Million)
13.4 Latin America Nuclear Waste Management Market Size Estimation and Forecast
13.5 Latin America Nuclear Waste Management Market Size Estimation and Forecast by Country
13.6 Latin America Nuclear Waste Management Market Size Estimation and Forecast by Solutions
13.7 Latin America Nuclear Waste Management Market Size Estimation and Forecast by Type
13.8 Latin America Nuclear Waste Management Market Size Estimation and Forecast by Disposal Method
13.9 Latin America Nuclear Waste Management Market Size Estimation and Forecast by Source
13.10 Brazil Nuclear Waste Management Market Analysis
13.11 Argentina Nuclear Waste Management Market Analysis
13.12 Rest of Latin America Nuclear Waste Management Market Analysis
14 Company Profiles
14.1 Competitive Landscape, 2022
14.2 Strategic Outlook
14.3 AECOM
14.3.1 Company Snapshot
14.3.2 Company Overview
14.3.3 Financial Analysis
14.3.3.1 Net Revenue, 2018-2022
14.3.3.2 Regional Revenue Share, 2022 (%)
14.3.4 Product Benchmarking
14.3.5 Strategic Outlook
14.4 Bechtel Corporation
14.4.1 Company Snapshot
14.4.2 Company Overview
14.4.3 Product Benchmarking
14.4.4 Strategic Outlook
14.5 Fluor Corporation
14.5.1 Company Snapshot
14.5.2 Company Overview
14.5.3 Financial Analysis
14.5.3.1 Net Revenue, 2018-2022
14.5.3.2 Regional Revenue Share, 2022 (%)
14.5.3.3 Business Segment Revenue Share, 2022 (%)
14.5.4 Product Benchmarking
14.5.5 Strategic Outlook
14.6 Studsvik
14.6.1 Company Snapshot
14.6.2 Company Overview
14.6.3 Product Benchmarking
14.6.4 Strategic Outlook
14.7 Westinghouse Electric Company LLC
14.7.1 Company Snapshot
14.7.2 Company Overview
14.7.3 Product Benchmarking
14.7.4 Strategic Outlook
14.8 Orano SA
14.8.1 Company Snapshot
14.8.2 Company Overview
14.8.3 Product Benchmarking
14.9 Jacobs Solutions Inc
14.9.1 Company Snapshot
14.9.2 Company Overview
14.9.3 Financial Analysis
14.9.3.1 Net Revenue, 2018-2022
14.9.4 Product Benchmarking
14.9.5 Strategic Outlook
14.10 Energy Solutions
14.10.1 Company Snapshot
14.10.2 Company Overview
14.10.3 Product Benchmarking
14.11 Enercon Services, Inc
14.11.1 Company Snapshot
14.11.2 Company Overview
14.11.3 Product Benchmarking
14.11.4 Strategic Outlook
14.12 Magnox Ltd
14.12.1 Company Snapshot
14.12.2 Company Overview
14.12.3 Product Benchmarking
14.12.4 Strategic Outlook
14.13 NUKEM Technologies GmbH
14.13.1 Company Snapshot
14.13.2 Company Overview
14.13.3 Product Benchmarking
14.14 Holtec International
14.14.1 Company Snapshot
14.14.2 Company Overview
14.14.3 Product Benchmarking
14.15 Veolia Environnement S.A.
14.15.1 Company Snapshot
14.15.2 Company Overview
14.15.3 Financial Analysis
14.15.3.1 Net Revenue, 2018-2022
14.15.4 Product Benchmarking
14.15.5 Strategic Outlook
14.16 Waste Control Specialists LLC
14.16.1 Company Snapshot
14.16.2 Company Overview
14.16.3 Product Benchmarking
14.17 Swedish Nuclear Fuel and Waste Management Company
14.17.1 Company Snapshot
14.17.2 Company Overview
14.17.3 Product Benchmarking
15 Conclusion and Recommendations
15.1 Concluding Remarks from Visiongain
15.2 Recommendations for Market Players
ページTOPに戻る
List of Tables/Graphs
List of Tables
Table 1 Nuclear Waste Management Market Snapshot, 2024 & 2034 (US$ Million, CAGR %)
Table 2 Global Nuclear Waste Management Market by Region, 2024-2034 (US$ Mn, AGR (%), CAGR (%)) (V-Shaped Recovery Scenario)
Table 3 Global Nuclear Waste Management Market by Region, 2024-2034 (US$ Mn, AGR (%), CAGR (%)) (U-Shaped Recovery Scenario)
Table 4 Global Nuclear Waste Management Market by Region, 2024-2034 (US$ Mn, AGR (%), CAGR (%)) (W-Shaped Recovery Scenario)
Table 5 Global Nuclear Waste Management Market by Region, 2024-2034 (US$ Mn, AGR (%), CAGR (%)) (L-Shaped Recovery Scenario)
Table 6 Global Nuclear Waste Management Market by Solutions, 2024-2034 (US$ Mn, AGR (%), CAGR (%))
Table 7 Waste Sorting Market by Region, 2024-2034 (US$ Mn, AGR (%), CAGR (%))
Table 8 Waste Treatment and Conditioning Market by Region, 2024-2034 (US$ Mn, AGR (%), CAGR (%))
Table 9 Waste Storage and Disposal Market by Region, 2024-2034 (US$ Mn, AGR (%), CAGR (%))
Table 10 Global Nuclear Waste Management Market by Type, 2024-2034 (US$ Mn, AGR (%), CAGR (%))
Table 11 Nuclear waste inventory (IAEA estimates, 2022)
Table 12 Very-Low-Level Waste (VLLW) Market by Region, 2024-2034 (US$ Mn, AGR (%), CAGR (%))
Table 13 Low-Level Waste (LLW) Market by Region, 2024-2034 (US$ Mn, AGR (%), CAGR (%))
Table 14 Intermediate-Level Waste (ILW) Market by Region, 2024-2034 (US$ Mn, AGR (%), CAGR (%))
Table 15 High Level Waste (HLW), Market by Region, 2024-2034 (US$ Mn, AGR (%), CAGR (%))
Table 16 Global Nuclear Waste Management Market by Disposal Method, 2024-2034 (US$ Mn, AGR (%), CAGR (%))
Table 17 Transmutation Market by Region, 2024-2034 (US$ Mn, AGR (%), CAGR (%))
Table 18 Seabed Disposal Market by Region, 2024-2034 (US$ Mn, AGR (%), CAGR (%))
Table 19 Space Disposal Market by Region, 2024-2034 (US$ Mn, AGR (%), CAGR (%))
Table 20 Encapsulation and Burial Market by Region, 2024-2034 (US$ Mn, AGR (%), CAGR (%))
Table 21 Synthetic Rock Formations Market by Region, 2024-2034 (US$ Mn, AGR (%), CAGR (%))
Table 22 Global Nuclear Waste Management Market by Source, 2024-2034 (US$ Mn, AGR (%), CAGR (%))
Table 23 Decommissioning/Remediation Market by Region, 2024-2034 (US$ Mn, AGR (%), CAGR (%))
Table 24 Reactor Operations Market by Region, 2024-2034 (US$ Mn, AGR (%), CAGR (%))
Table 25 Military and Defence Programs Market by Region, 2024-2034 (US$ Mn, AGR (%), CAGR (%))
Table 26 Nuclear Applications Market by Region, 2024-2034 (US$ Mn, AGR (%), CAGR (%))
Table 27 Fuel Reprocessing Market by Region, 2024-2034 (US$ Mn, AGR (%), CAGR (%))
Table 28 Fuel Fabrication/Enrichment Market by Region, 2024-2034 (US$ Mn, AGR (%), CAGR (%))
Table 29 Nuclear Waste Management Market Forecast by Region, 2024-2034 (US$ Million, AGR%, CAGR%)
Table 30 North America Nuclear Waste Management Market by Value, 2024-2034 (US$ Mn, AGR (%), CAGR (%))
Table 31 North America Nuclear Waste Management Market by Country, 2024-2034 (US$ Mn, AGR (%), CAGR (%))
Table 32 North America Nuclear Waste Management Market by Solutions, 2024-2034 (US$ Mn, AGR (%), CAGR (%))
Table 33 North America Nuclear Waste Management Market by Type, 2024-2034 (US$ Mn, AGR (%), CAGR (%))
Table 34 North America Nuclear Waste Management Market by Disposal Method, 2024-2034 (US$ Mn, AGR (%), CAGR (%))
Table 35 North America Nuclear Waste Management Market by Source, 2024-2034 (US$ Mn, AGR (%), CAGR (%))
Table 36 US Nuclear Waste Management Market by Value, 2024-2034 (US$ Mn, AGR (%), CAGR (%))
Table 37 Canada Nuclear Waste Management Market by Value, 2024-2034 (US$ Mn, AGR (%), CAGR (%))
Table 38 Europe Nuclear Waste Management Market by Value, 2024-2034 (US$ Mn, AGR (%), CAGR (%))
Table 39 Europe Nuclear Waste Management Market by Country, 2024-2034 (US$ Mn, AGR (%), CAGR (%))
Table 40 Europe Nuclear Waste Management Market by Solutions, 2024-2034 (US$ Mn, AGR (%), CAGR (%))
Table 41 Europe Nuclear Waste Management Market by Type, 2024-2034 (US$ Mn, AGR (%), CAGR (%))
Table 42 Europe Nuclear Waste Management Market by Disposal Method, 2024-2034 (US$ Mn, AGR (%), CAGR (%))
Table 43 Europe Nuclear Waste Management Market by Source, 2024-2034 (US$ Mn, AGR (%), CAGR (%))
Table 44 Russia Nuclear Waste Management Market by Value, 2024-2034 (US$ Mn, AGR (%), CAGR (%))
Table 45 UK Nuclear Waste Management Market by Value, 2024-2034 (US$ Mn, AGR (%), CAGR (%))
Table 46 France Nuclear Waste Management Market by Value, 2024-2034 (US$ Mn, AGR (%), CAGR (%))
Table 47 Belgium Nuclear Waste Management Market by Value, 2024-2034 (US$ Mn, AGR (%), CAGR (%))
Table 48 Finland Nuclear Waste Management Market by Value, 2024-2034 (US$ Mn, AGR (%), CAGR (%))
Table 49 Rest of Europe Nuclear Waste Management Market by Value, 2024-2034 (US$ Mn, AGR (%), CAGR (%))
Table 50 Asia-Pacific Nuclear Waste Management Market by Value, 2024-2034 (US$ Mn, AGR (%), CAGR (%))
Table 51 Asia-Pacific Nuclear Waste Management Market by Country, 2024-2034 (US$ Mn, AGR (%), CAGR (%))
Table 52 Asia-Pacific Nuclear Waste Management Market by Solutions, 2024-2034 (US$ Mn, AGR (%), CAGR (%))
Table 53 Asia-Pacific Nuclear Waste Management Market by Type, 2024-2034 (US$ Mn, AGR (%), CAGR (%))
Table 54 Asia-Pacific Nuclear Waste Management Market by Disposal Method, 2024-2034 (US$ Mn, AGR (%), CAGR (%))
Table 55 Asia-Pacific Nuclear Waste Management Market by Source, 2024-2034 (US$ Mn, AGR (%), CAGR (%))
Table 56 China Nuclear Waste Management Market by Value, 2024-2034 (US$ Mn, AGR (%), CAGR (%))
Table 57 India Nuclear Waste Management Market by Value, 2024-2034 (US$ Mn, AGR (%), CAGR (%))
Table 58 Japan Nuclear Waste Management Market by Value, 2024-2034 (US$ Mn, AGR (%), CAGR (%))
Table 59 South Korea Nuclear Waste Management Market by Value, 2024-2034 (US$ Mn, AGR (%), CAGR (%))
Table 60 Pakistan Nuclear Waste Management Market by Value, 2024-2034 (US$ Mn, AGR (%), CAGR (%))
Table 61 Rest of Asia-Pacific Nuclear Waste Management Market by Value, 2024-2034 (US$ Mn, AGR (%), CAGR (%))
Table 62 Middle East & Africa Nuclear Waste Management Market by Value, 2024-2034 (US$ Mn, AGR (%), CAGR (%))
Table 63 Middle East & Africa Nuclear Waste Management Market by Country, 2024-2034 (US$ Mn, AGR (%), CAGR (%))
Table 64 Middle East & Africa Nuclear Waste Management Market by Solutions, 2024-2034 (US$ Mn, AGR (%), CAGR (%))
Table 65 Middle East & Africa Nuclear Waste Management Market by Type, 2024-2034 (US$ Mn, AGR (%), CAGR (%))
Table 66 Middle East & Africa Nuclear Waste Management Market by Disposal Method, 2024-2034 (US$ Mn, AGR (%), CAGR (%))
Table 67 Middle East & Africa Nuclear Waste Management Market by Source, 2024-2034 (US$ Mn, AGR (%), CAGR (%))
Table 68 GCC Nuclear Waste Management Market by Value, 2024-2034 (US$ Mn, AGR (%), CAGR (%))
Table 69 South Africa Nuclear Waste Management Market by Value, 2024-2034 (US$ Mn, AGR (%), CAGR (%))
Table 70 Rest of Middle East & Africa Nuclear Waste Management Market by Value, 2024-2034 (US$ Mn, AGR (%), CAGR (%))
Table 71 Latin America Nuclear Waste Management Market by Value, 2024-2034 (US$ Mn, AGR (%), CAGR (%))
Table 72 Latin America Nuclear Waste Management Market by Country, 2024-2034 (US$ Mn, AGR (%), CAGR (%))
Table 73 Latin America Nuclear Waste Management Market by Solutions, 2024-2034 (US$ Mn, AGR (%), CAGR (%))
Table 74 Latin America Nuclear Waste Management Market by Type, 2024-2034 (US$ Mn, AGR (%), CAGR (%))
Table 75 Latin America Nuclear Waste Management Market by Disposal Method, 2024-2034 (US$ Mn, AGR (%), CAGR (%))
Table 76 Latin America Nuclear Waste Management Market by Source, 2024-2034 (US$ Mn, AGR (%), CAGR (%))
Table 77 Brazil Nuclear Waste Management Market by Value, 2024-2034 (US$ Mn, AGR (%), CAGR (%))
Table 78 Argentina Nuclear Waste Management Market by Value, 2024-2034 (US$ Mn, AGR (%), CAGR (%))
Table 79 Rest of Latin America Nuclear Waste Management Market by Value, 2024-2034 (US$ Mn, AGR (%), CAGR (%))
Table 80 Strategic Outlook - Contract
Table 81 AECOM: Key Details, (CEO, HQ, Revenue, Founded, No. of Employees, Company Type, Website, Business Segment)
Table 82 AECOM: Product Benchmarking
Table 83 AECOM: Strategic Outlook
Table 84 Bechtel Corporation: Key Details, (CEO, HQ, Revenue, Founded, No. of Employees, Company Type, Website, Business Segment)
Table 85 Bechtel Corporation: Product Benchmarking
Table 86 Bechtel Corporation: Strategic Outlook
Table 87 Fluor Corporation: Key Details, (CEO, HQ, Revenue, Founded, No. of Employees, Company Type, Website, Business Segment)
Table 88 Fluor Corporation: Product Benchmarking
Table 89 Fluor Corporation: Strategic Outlook
Table 90 Studsvik: Key Details, (CEO, HQ, Revenue, Founded, No. of Employees, Company Type, Website, Business Segment)
Table 91 Studsvik: Product Benchmarking
Table 92 Studsvik: Strategic Outlook
Table 93 Westinghouse Electric Company LLC: Key Details, (CEO, HQ, Revenue, Founded, No. of Employees, Company Type, Website, Business Segment)
Table 94 Westinghouse Electric Company LLC: Product Benchmarking
Table 95 Westinghouse Electric Company LLC: Strategic Outlook
Table 96 Orano SA :Key Details, (CEO, HQ, Revenue, Founded, No. of Employees, Company Type, Website, Business Segment)
Table 97 Orano SA: Product Benchmarking
Table 98 Jacobs Solutions Inc: Key Details, (CEO, HQ, Revenue, Founded, No. of Employees, Company Type, Website, Business Segment)
Table 99 Jacobs Solutions Inc: Product Benchmarking
Table 100 Jacobs Solutions Inc: Strategic Outlook
Table 101 Energy Solutions: Key Details, (CEO, HQ, Revenue, Founded, No. of Employees, Company Type, Website, Business Segment)
Table 102 Energy Solutions: Product Benchmarking
Table 103 Enercon Services, Inc: Key Details, (CEO, HQ, Revenue, Founded, No. of Employees, Company Type, Website, Business Segment)
Table 104 Enercon Services, Inc: Product Benchmarking
Table 105 Enercon Services, Inc: Strategic Outlook
Table 106 Magnox Ltd: Key Details, (CEO, HQ, Revenue, Founded, No. of Employees, Company Type, Website, Business Segment)
Table 107 Magnox Ltd: Product Benchmarking
Table 108 Magnox Ltd: Strategic Outlook
Table 109 NUKEM Technologies GmbH: Key Details, (CEO, HQ, Revenue, Founded, No. of Employees, Company Type, Website, Business Segment)
Table 110 NUKEM Technologies GmbH: Product Benchmarking
Table 111 Holtec International: Key Details, (CEO, HQ, Revenue, Founded, No. of Employees, Company Type, Website, Business Segment)
Table 112 Holtec International: Product Benchmarking
Table 113 Veolia Environnement S.A.: Key Details, (CEO, HQ, Revenue, Founded, No. of Employees, Company Type, Website, Business Segment)
Table 114 Veolia Environnement S.A.: Product Benchmarking
Table 115 Veolia Environnement S.A.: Strategic Outlook
Table 116 Waste Control Specialists LLC: Key Details, (CEO, HQ, Revenue, Founded, No. of Employees, Company Type, Website, Business Segment)
Table 117 Waste Control Specialists LLC: Product Benchmarking
Table 118 Swedish Nuclear Fuel and Waste Management Company: Key Details, (CEO, HQ, Revenue, Founded, No. of Employees, Company Type, Website, Business Segment)
Table 119 Swedish Nuclear Fuel and Waste Management Company: Product Benchmarking
List of Figures
Figure 1 Nuclear Waste Management Market Segmentation
Figure 2 Nuclear Waste Management Market by Solutions: Market Attractiveness Index
Figure 3 Nuclear Waste Management Market by Type: Market Attractiveness Index
Figure 4 Nuclear Waste Management Market by Disposal Method: Market Attractiveness Index
Figure 5 Nuclear Waste Management Market by Source: Market Attractiveness Index
Figure 6 Nuclear Waste Management Market Attractiveness Index by Region
Figure 7 Nuclear Waste Management Market: Market Dynamics
Figure 8 Nuclear Waste Management Market: Porter’s Five Forces Analysis
Figure 9 Global Nuclear Waste Management Market Share Forecast by COVID, 2024-2034 (%)
Figure 10 Global Nuclear Waste Management Market by Region, 2024-2034 (US$ Mn, AGR (%)) (V-Shaped Recovery Scenario)
Figure 11 Global Nuclear Waste Management Market by Region, 2024-2034 (US$ Mn, AGR (%)) (U-Shaped Recovery Scenario)
Figure 12 Global Nuclear Waste Management Market by Region, 2024-2034 (US$ Mn, AGR (%)) (W-Shaped Recovery Scenario)
Figure 13 Global Nuclear Waste Management Market by Region, 2024-2034 (US$ Mn, AGR (%)) (L-Shaped Recovery Scenario)
Figure 14 Nuclear Waste Management Market: PEST Analysis
Figure 15 Nuclear Waste Management Market by Solutions: Market Attractiveness Index
Figure 16 Global Nuclear Waste Management Market by Solutions, 2024-2034 (US$ Mn, AGR (%))
Figure 17 Nuclear Waste Management Market Share Forecast by Solutions, 2024, 2029, 2034 (%)
Figure 18 Waste Sorting Market by Region, 2024-2034 (US$ Mn, AGR (%))
Figure 19 Sorting Market Share Forecast by Region, 2024 & 2034 (%)
Figure 20 Waste Treatment and Conditioning Market by Region, 2024-2034 (US$ Mn, AGR (%))
Figure 21 Treatment and Conditioning Market Share Forecast by Region, 2024 & 2034 (%)
Figure 22 Waste Storage and Disposal Market by Region, 2024-2034 (US$ Mn, AGR (%))
Figure 23 Storage and Disposal Market Share Forecast by Region, 2024 & 2034 (%)
Figure 24 Nuclear Waste Management Market by Type: Market Attractiveness Index
Figure 25 Global Nuclear Waste Management Market by Type, 2024-2034 (US$ Mn, AGR (%))
Figure 26 Nuclear Waste Management Market Share Forecast by Type, 2024, 2029, 2034 (%)
Figure 27 Very-Low-Level Waste (VLLW) Market by Region, 2024-2034 (US$ Mn, AGR (%))
Figure 28 Very-Low-Level Waste (VLLW) Market Share Forecast by Region, 2024 & 2034 (%)
Figure 29 Low-Level Waste (LLW) Market by Region, 2024-2034 (US$ Mn, AGR (%))
Figure 30 Low-Level Waste (LLW) Market Share Forecast by Region, 2024 & 2034 (%)
Figure 31 Intermediate-Level Waste (ILW) Market by Region, 2024-2034 (US$ Mn, AGR (%))
Figure 32 Intermediate-Level Waste (ILW) Market Share Forecast by Region, 2024 & 2034 (%)
Figure 33 High Level Waste (HLW), Market by Region, 2024-2034 (US$ Mn, AGR (%))
Figure 34 High Level Waste (HLW) Market Share Forecast by Region, 2024 & 2034 (%)
Figure 35 Nuclear Waste Management Market by Disposal Method: Market Attractiveness Index
Figure 36 Global Nuclear Waste Management Market by Disposal Method, 2024-2034 (US$ Mn, AGR (%))
Figure 37 Nuclear Waste Management Market Share Forecast by Disposal Method, 2024, 2029, 2034 (%)
Figure 38 Transmutation Market by Region, 2024-2034 (US$ Mn, AGR (%))
Figure 39 Transmutation Market Share Forecast by Region, 2024 & 2034 (%)
Figure 40 Seabed Disposal Market by Region, 2024-2034 (US$ Mn, AGR (%))
Figure 41 Seabed Disposal Market Share Forecast by Region, 2024 & 2034 (%)
Figure 42 Space Disposal Market by Region, 2024-2034 (US$ Mn, AGR (%))
Figure 43 Space Disposal Market Share Forecast by Region, 2024 & 2034 (%)
Figure 44 Encapsulation and Burial Market by Region, 2024-2034 (US$ Mn, AGR (%))
Figure 45 Encapsulation and Burial Market Share Forecast by Region, 2024 & 2034 (%)
Figure 46 Synthetic Rock Formations Market by Region, 2024-2034 (US$ Mn, AGR (%))
Figure 47 Synthetic Rock Formations Market Share Forecast by Region, 2024 & 2034 (%)
Figure 48 Nuclear Waste Management Market by Source: Market Attractiveness Index
Figure 49 Global Nuclear Waste Management Market by Source, 2024-2034 (US$ Mn, AGR (%))
Figure 50 Nuclear Waste Management Market Share Forecast by Source, 2024, 2029, 2034 (%)
Figure 51 Decommissioning/Remediation Market by Region, 2024-2034 (US$ Mn, AGR (%))
Figure 52 Decommissioning/Remediation Market Share Forecast by Region, 2024 & 2034 (%)
Figure 53 Reactor Operations Market by Region, 2024-2034 (US$ Mn, AGR (%))
Figure 54 Reactor Operations Market Share Forecast by Region, 2024 & 2034 (%)
Figure 55 Military and Defence Programs Market by Region, 2024-2034 (US$ Mn, AGR (%))
Figure 56 Military and Defence Programs Market Share Forecast by Region, 2024 & 2034 (%)
Figure 57 Nuclear Applications Market by Region, 2024-2034 (US$ Mn, AGR (%))
Figure 58 Nuclear Applications Market Share Forecast by Region, 2024 & 2034 (%)
Figure 59 Fuel Reprocessing Market by Region, 2024-2034 (US$ Mn, AGR (%))
Figure 60 Fuel Reprocessing Market Share Forecast by Region, 2024 & 2034 (%)
Figure 61 Fuel Fabrication/Enrichment Market by Region, 2024-2034 (US$ Mn, AGR (%))
Figure 62 Fuel Fabrication/Enrichment Market Share Forecast by Region, 2024 & 2034 (%)
Figure 63 Nuclear Waste Management Market Forecast by Region 2024 and 2034 (Revenue, CAGR%)
Figure 64 Nuclear Waste Management Market Share Forecast by Region 2024, 2029, 2034 (%)
Figure 65 Nuclear Waste Management Market by Region, 2024-2034 (US$ Million, AGR %)
Figure 66 North America Nuclear Waste Management Market Attractiveness Index
Figure 67 North America Nuclear Waste Management Market by Region, 2024, 2029 & 2034 (US$ Million)
Figure 68 North America Nuclear Waste Management Market by Value, 2024-2034 (US$ Mn, AGR (%))
Figure 69 North America Nuclear Waste Management Market by Country, 2024-2034 (US$ Mn, AGR (%))
Figure 70 North America Nuclear Waste Management Market Share Forecast by Country, 2024 & 2034 (%)
Figure 71 North America Nuclear Waste Management Market by Solutions, 2024-2034 (US$ Mn, AGR (%))
Figure 72 North America Nuclear Waste Management Market Share Forecast Solutions, 2024 & 2034 (%)
Figure 73 North America Nuclear Waste Management Market by Type, 2024-2034 (US$ Mn, AGR (%))
Figure 74 North America Nuclear Waste Management Market Share Forecast by Type, 2024 & 2034 (%)
Figure 75 North America Nuclear Waste Management Market by Disposal Method, 2024-2034 (US$ Mn, AGR (%))
Figure 76 North America Nuclear Waste Management Market Share Forecast by Disposal Method, 2024 & 2034 (%)
Figure 77 North America Nuclear Waste Management Market by Source, 2024-2034 (US$ Mn, AGR (%))
Figure 78 North America Nuclear Waste Management Market Share Forecast by Source, 2024 & 2034 (%)
Figure 79 US Nuclear Waste Management Market by Value, 2024-2034 (US$ Mn, AGR (%))
Figure 80 Canada Nuclear Waste Management Market by Value, 2024-2034 (US$ Mn, AGR (%))
Figure 81 Europe Nuclear Waste Management Market Attractiveness Index
Figure 82 Europe Nuclear Waste Management Market by Region, 2024, 2029 & 2034 (US$ Million)
Figure 83 Europe Nuclear Waste Management Market by Value, 2024-2034 (US$ Mn, AGR (%))
Figure 84 Europe Nuclear Waste Management Market by Country, 2024-2034 (US$ Mn, AGR (%))
Figure 85 Europe Nuclear Waste Management Market Share Forecast by Country, 2024 & 2034 (%)
Figure 86 Europe Nuclear Waste Management Market by Solutions, 2024-2034 (US$ Mn, AGR (%))
Figure 87 Europe Nuclear Waste Management Market Share Forecast Solutions, 2024 & 2034 (%)
Figure 88 Europe Nuclear Waste Management Market by Type, 2024-2034 (US$ Mn, AGR (%))
Figure 89 Europe Nuclear Waste Management Market Share Forecast by Type, 2024 & 2034 (%)
Figure 90 Europe Nuclear Waste Management Market by Disposal Method, 2024-2034 (US$ Mn, AGR (%))
Figure 91 Europe Nuclear Waste Management Market Share Forecast by Disposal Method, 2024 & 2034 (%)
Figure 92 Europe Nuclear Waste Management Market by Source, 2024-2034 (US$ Mn, AGR (%))
Figure 93 Europe Nuclear Waste Management Market Share Forecast by Source, 2024 & 2034 (%)
Figure 94 Russia Nuclear Waste Management Market by Value, 2024-2034 (US$ Mn, AGR (%))
Figure 95 UK Nuclear Waste Management Market by Value, 2024-2034 (US$ Mn, AGR (%))
Figure 96 France Nuclear Waste Management Market by Value, 2024-2034 (US$ Mn, AGR (%))
Figure 97 Belgium Nuclear Waste Management Market by Value, 2024-2034 (US$ Mn, AGR (%))
Figure 98 Finland Nuclear Waste Management Market by Value, 2024-2034 (US$ Mn, AGR (%))
Figure 99 Rest of Europe Nuclear Waste Management Market by Value, 2024-2034 (US$ Mn, AGR (%))
Figure 100 Asia-Pacific Nuclear Waste Management Market Attractiveness Index
Figure 101 Asia-Pacific Nuclear Waste Management Market by Region, 2024, 2029 & 2034 (US$ Million)
Figure 102 Asia-Pacific Nuclear Waste Management Market by Value, 2024-2034 (US$ Mn, AGR (%))
Figure 103 Asia-Pacific Nuclear Waste Management Market by Country, 2024-2034 (US$ Mn, AGR (%))
Figure 104 Asia-Pacific Nuclear Waste Management Market Share Forecast by Country, 2024 & 2034 (%)
Figure 105 Asia-Pacific Nuclear Waste Management Market by Solutions, 2024-2034 (US$ Mn, AGR (%))
Figure 106 Asia-Pacific Nuclear Waste Management Market Share Forecast Solutions, 2024 & 2034 (%)
Figure 107 Asia-Pacific Nuclear Waste Management Market by Type, 2024-2034 (US$ Mn, AGR (%))
Figure 108 Asia-Pacific Nuclear Waste Management Market Share Forecast by Type, 2024 & 2034 (%)
Figure 109 Asia-Pacific Nuclear Waste Management Market by Disposal Method, 2024-2034 (US$ Mn, AGR (%))
Figure 110 Asia-Pacific Nuclear Waste Management Market Share Forecast by Disposal Method, 2024 & 2034 (%)
Figure 111 Asia-Pacific Nuclear Waste Management Market by Source, 2024-2034 (US$ Mn, AGR (%))
Figure 112 Asia-Pacific Nuclear Waste Management Market Share Forecast by Source, 2024 & 2034 (%)
Figure 113 China Nuclear Waste Management Market by Value, 2024-2034 (US$ Mn, AGR (%))
Figure 114 India Nuclear Waste Management Market by Value, 2024-2034 (US$ Mn, AGR (%))
Figure 115 Japan Nuclear Waste Management Market by Value, 2024-2034 (US$ Mn, AGR (%))
Figure 116 South Korea Nuclear Waste Management Market by Value, 2024-2034 (US$ Mn, AGR (%))
Figure 117 Pakistan Nuclear Waste Management Market by Value, 2024-2034 (US$ Mn, AGR (%))
Figure 118 Rest of Asia-Pacific Nuclear Waste Management Market by Value, 2024-2034 (US$ Mn, AGR (%))
Figure 119 Middle East and Africa Nuclear Waste Management Market Attractiveness Index
Figure 120 Middle East and Africa Nuclear Waste Management Market by Region, 2024, 2029 & 2034 (US$ Million)
Figure 121 Middle East & Africa Nuclear Waste Management Market by Value, 2024-2034 (US$ Mn, AGR (%))
Figure 122 Middle East & Africa Nuclear Waste Management Market by Country, 2024-2034 (US$ Mn, AGR (%))
Figure 123 Middle East and Africa Nuclear Waste Management Market Share Forecast by Country, 2024 & 2034 (%)
Figure 124 Middle East & Africa Nuclear Waste Management Market by Solutions, 2024-2034 (US$ Mn, AGR (%))
Figure 125 Middle East and Africa Nuclear Waste Management Market Share Forecast Solutions, 2024 & 2034 (%)
Figure 126 Middle East & Africa Nuclear Waste Management Market by Type, 2024-2034 (US$ Mn, AGR (%))
Figure 127 Middle East and Africa Nuclear Waste Management Market Share Forecast by Type, 2024 & 2034 (%)
Figure 128 Middle East & Africa Nuclear Waste Management Market by Disposal Method, 2024-2034 (US$ Mn, AGR (%))
Figure 129 Middle East and Africa Nuclear Waste Management Market Share Forecast by Disposal Method, 2024 & 2034 (%)
Figure 130 Middle East & Africa Nuclear Waste Management Market by Source, 2024-2034 (US$ Mn, AGR (%))
Figure 131 Middle East and Africa Nuclear Waste Management Market Share Forecast by Source, 2024 & 2034 (%)
Figure 132 GCC Nuclear Waste Management Market by Value, 2024-2034 (US$ Mn, AGR (%))
Figure 133 South Africa Nuclear Waste Management Market by Value, 2024-2034 (US$ Mn, AGR (%))
Figure 134 Rest of Middle East & Africa Nuclear Waste Management Market by Value, 2024-2034 (US$ Mn, AGR (%))
Figure 135 Latin America Nuclear Waste Management Market Attractiveness Index
Figure 136 Latin America Nuclear Waste Management Market by Region, 2024, 2029 & 2034 (US$ Million)
Figure 137 Latin America Nuclear Waste Management Market by Value, 2024-2034 (US$ Mn, AGR (%))
Figure 138 Latin America Nuclear Waste Management Market by Country, 2024-2034 (US$ Mn, AGR (%))
Figure 139 Latin America Nuclear Waste Management Market Share Forecast by Country, 2024 & 2034 (%)
Figure 140 Latin America Nuclear Waste Management Market by Solutions, 2024-2034 (US$ Mn, AGR (%))
Figure 141 Latin America Nuclear Waste Management Market Share Forecast Solutions, 2024 & 2034 (%)
Figure 142 Latin America Nuclear Waste Management Market by Type, 2024-2034 (US$ Mn, AGR (%))
Figure 143 Latin America Nuclear Waste Management Market Share Forecast by Type, 2024 & 2034 (%)
Figure 144 Latin America Nuclear Waste Management Market by Disposal Method, 2024-2034 (US$ Mn, AGR (%))
Figure 145 Latin America Nuclear Waste Management Market Share Forecast by Disposal Method, 2024 & 2034 (%)
Figure 146 Latin America Nuclear Waste Management Market by Source, 2024-2034 (US$ Mn, AGR (%))
Figure 147 Latin America Nuclear Waste Management Market Share Forecast by Source, 2024 & 2034 (%)
Figure 148 Brazil Nuclear Waste Management Market by Value, 2024-2034 (US$ Mn, AGR (%))
Figure 149 Argentina Nuclear Waste Management Market by Value, 2024-2034 (US$ Mn, AGR (%))
Figure 150 Rest of Latin America Nuclear Waste Management Market by Value, 2024-2034 (US$ Mn, AGR (%))
Figure 151 Rest of Latin America Nuclear Waste Management Market by Value, 2024-2034 (US$ Mn, AGR (%))
Figure 152 AECOM.: Net Revenue, 2018-2022 (US$ Million, AGR%)
Figure 153 AECOM.: Regional Revenue Share, 2022 (%)
Figure 154 Fluor Corporation.: Net Revenue, 2018-2022 (US$ Million, AGR%)
Figure 155 Fluor Corporation.: Regional Revenue Share, 2022 (%)
Figure 156 Fluor Corporation.: Business Segment Revenue Share, 2022 (%)
Figure 157 Jacobs Solutions Inc.: Net Revenue, 2018-2022 (US$ Million, AGR%)
Figure 158 Veolia Environnement S.A..: Net Revenue, 2018-2022 (US$ Million, AGR%)
ページTOPに戻る
よくあるご質問
Visiongain社はどのような調査会社ですか?
英国の調査会社ヴィジョンゲイン社(Visiongain)は、通信とエネルギーのほか、自動車や化学・医薬品、金属など、広範な市場を対象に調査を行っています。自動車市場については、市場全般に関する調査のほ... もっと見る
調査レポートの納品までの日数はどの程度ですか?
在庫のあるものは速納となりますが、平均的には 3-4日と見て下さい。
但し、一部の調査レポートでは、発注を受けた段階で内容更新をして納品をする場合もあります。
発注をする前のお問合せをお願いします。
注文の手続きはどのようになっていますか?
1)お客様からの御問い合わせをいただきます。
2)見積書やサンプルの提示をいたします。
3)お客様指定、もしくは弊社の発注書をメール添付にて発送してください。
4)データリソース社からレポート発行元の調査会社へ納品手配します。
5) 調査会社からお客様へ納品されます。最近は、pdfにてのメール納品が大半です。
お支払方法の方法はどのようになっていますか?
納品と同時にデータリソース社よりお客様へ請求書(必要に応じて納品書も)を発送いたします。
お客様よりデータリソース社へ(通常は円払い)の御振り込みをお願いします。
請求書は、納品日の日付で発行しますので、翌月最終営業日までの当社指定口座への振込みをお願いします。振込み手数料は御社負担にてお願いします。
お客様の御支払い条件が60日以上の場合は御相談ください。
尚、初めてのお取引先や個人の場合、前払いをお願いすることもあります。ご了承のほど、お願いします。
データリソース社はどのような会社ですか?
当社は、世界各国の主要調査会社・レポート出版社と提携し、世界各国の市場調査レポートや技術動向レポートなどを日本国内の企業・公官庁及び教育研究機関に提供しております。
世界各国の「市場・技術・法規制などの」実情を調査・収集される時には、データリソース社にご相談ください。
お客様の御要望にあったデータや情報を抽出する為のレポート紹介や調査のアドバイスも致します。
|
|


