バイオプリザベーション市場レポート:2023-2033
Biopreservation Market Report 2023-2033
レポート詳細
バイオプリザベーション市場レポート 2023-2033 :本レポートは、新たな収益源の開拓を目指すリーディングカンパニーにとって、業界とその基礎となる力学をより深く理解する上で、非常に... もっと見る
※上記価格は部署ライセンス(Departmental licence)価格です。
その他の価格についてはデータリソースまでお問合せください。
日本語のページは自動翻訳を利用し作成しています。
実際のレポートは英文のみでご納品いたします。
サマリー
レポート詳細
バイオプリザベーション市場レポート 2023-2033:本レポートは、新たな収益源の開拓を目指すリーディングカンパニーにとって、業界とその基礎となる力学をより深く理解する上で、非常に貴重なものとなるでしょう。また、異業種への進出や新地域での既存事業の拡大を目指す企業にとっても有益なレポートです。
研究開発・製品開発の活発化が市場成長を促進する
バイオプリザベーション市場で事業を展開する企業、研究団体、非政府組織などの関係者は、バイオプリザベーション産業の分野における革新的な技術の研究・開発への取り組みを強化することに注力しています。例えば、2021年11月、スペインは、バイオバンクと生体分子研究に重点を置いた欧州研究インフラパートナーシップBBMRI- ERIC(Biobanks and Biomolecular Resources Research Infrastructure Consortium)の新しいオブサーバーとして正式に認定されました。
一方、医療機器の初期購入価格や継続的なメンテナンス費用などのコスト高が、市場の成長を阻害する大きな要因となっていることが予想されます。医療機器のコストが高いと、医療従事者や医療機関がこれらのツールを購入し、維持することが困難になることがあります。高度で専門的な器具の購入費用はかなり高額になる可能性があり、これらの器具のメンテナンスや修理にかかる費用も時間の経過とともにかさむ可能性があります。このような経済的負担は、これらの機器の導入と使用を制限し、ひいては市場の成長を鈍化させる可能性があります。
さらに、保存中に組織が損傷するリスクもあり、これも悪い結果につながり、潜在的に市場成長に悪影響を及ぼす可能性があります。これらの要因が重なると、予測期間中の市場成長に支障をきたす可能性があります。
効率的な温度管理の欠如が、産業発展の妨げになる可能性がある。
新しい保存技術開発の主な課題の一つは、室温保存を維持・調整する必要性です。例えば、米国では毎年300万人近くの命を救っているワクチンですが、不適切な冷蔵・保管により、毎年約2000万米ドル相当のワクチンが紛失・放棄されています。凍結や解凍によって組織や細胞に傷がつくことが多いため、市場の収益を阻害しています。とはいえ、今後の市場予測は、遺伝子、ワクチン、その他のバイオ保存製品のような製品の耐久性についての継続的な研究によって推進されるでしょう。
マーケットリサーチレポートを購入する前に、どのような質問をするべきか?
- バイオプリザベーション市場はどのように進化しているのか?
- バイオプリザベーション市場を牽引し、抑制しているものは何か?
- バイオプリザベーションの各サブマーケットは予測期間中にどのように成長し、2033年にはどれくらいの売上を占めるようになるのでしょうか?
- 2023年から2033年にかけて、バイオプリザベーションの各サブマーケットの市場シェアはどのように推移するのか?
- 2023年から2033年にかけて、市場全体の主要な牽引役となるのは何か?
- バイオプリザベーションの主要市場はマクロ経済ダイナミクスに概ね追随するのか、それとも個々の国別市場が他を凌駕するのか?
- 2033年までに各国市場のシェアはどのように変化し、2033年に市場をリードするのはどの地域か?
- 主要プレイヤーは誰で、予測期間中の見通しはどうなっているのか?
- これらの主要企業のバイオプリザベーション製品開発プロジェクトは何か?
- 2023年から2033年の間に、業界はどのように進化していくのか?現在および今後10年間に実施されるバイオプリザベーション製品開発プロジェクトはどのような意味を持つのか?
- バイオプリザベーション市場をさらに拡大するために、製品の商業化の必要性は高まっているのか?
- バイオプリザベーション市場はどこへ向かっているのか、そして市場の最前線に立つためにはどうすればよいのか?
- 新製品やサービスラインへの最適な投資方法とは?
- 企業を新たな成長軌道に乗せ、C-suiteに移行させるための重要な展望は何か?
このことが、現在、そして今後10年間のバイオ保存市場にどのような影響を与えるかを知る必要があります:
- 277ページにわたる本レポートでは、115の表と174のチャート/グラフを独占的に提供します。
- 本レポートでは、業界における主要な収益性の高い分野を取り上げているため、今すぐその分野をターゲットにすることができます。
- 世界、地域、国の売上高と成長率を詳細に分析しています。
- 競合他社が成功した主要なトレンド、変化、収益予測をハイライトしています。
本レポートは、バイオプリザベーション市場が今後10年間にどのように発展するか、またCOVID-19の景気後退や景気回復の変化に合わせて、今日あなたにお伝えします。この市場は、過去10年間のどの時点よりも今が重要です。
2033年までの予測やその他の分析により、商業的な展望を明らかにする。
- 2033年までの収益予測に加え、直近の実績や成長率、市場シェアなど、本調査では
- ビジネスの展望や展開など、独自の分析がご覧いただけます。
- 定性的な分析(市場力学、促進要因、機会、阻害要因、課題など)、コスト構造、バイオプリザベーション製品価格上昇の影響、最近の動向などをご覧いただけます。
本レポートには、COVID-19が業界や貴社にどのような影響を与えるかについてのデータ分析および貴重な洞察が含まれています。COVID-19の4つの回収パターンとその影響、すなわち「V」「L」「W」「U」については、本レポートで解説しています。
報告書の対象セグメント
製品別
・設備
- 冷凍機
- 冷蔵庫
- 消耗品
- 液体窒素
・メディア
- プリフォーム
- ホームブリュー
- ラボラトリー情報管理システム(LIMS)
用途別
・再生医療
- 細胞治療
- 遺伝子治療
- その他
・バイオバンク
- ヒトの卵
- ヒト精子
- 動物用体外受精
・ドラッグディスカバリー
セルプロバイダー別
- CD34+
- CD19+
- MSC
- iPSC
- hESC
- 腫瘍細胞
- その他
世界市場全体およびセグメントの収益予測に加え、5地域および16の主要国市場の収益予測も掲載しています:
北米
- アメリカ
- カナダ
欧州
- ドイツ
- 英国
- フランス
- スペイン
- イタリア
- その他の欧州
アジア太平洋
- 中国
- 日本
- インド
- オーストラリア
- 韓国
- その他のアジア太平洋地域
ラテンアメリカ
- ブラジル
- メキシコ
- その他のラテンアメリカ地域
MEA
- GCC
- 南ア
- MEAの残りの地域
また、バイオプリザベーション市場の2023年から2033年にかけての主要企業のプロファイルと、これらの企業のこのセグメントに焦点を当てたいくつかの企業についても記載しています。
主要企業と市場成長の可能性
・ Arctiko
・ Azenta
・ BioLife Solutions Inc.
・ Biomatrica
・ Cryoport Systems, LLC
・ Eppendorf SE
・ Helmer Scientific Inc.
・ Merck KGaA
・ PHC Holdings Corporation
・ Qiagen
・ Taylor- Wharton Cryogenics LLC
・ Thermo Fisher Scientific Inc.
・ VWR International
バイオプリザベーション市場の世界全体の収益、2023年から2033年までの金額ベースの市場は、2023年に58億6,100万米ドルを突破すると、私たちの仕事は計算されます。2033年まで収益が大きく伸びることが予測されます。当社の調査では、最も大きな可能性を秘めた組織を特定します。彼らの能力、進歩、商業的な展望を発見し、あなたが一歩先を行くのを支援します。
バイオ保存市場、2023年から2033年までのレポートはどのように役立つのでしょうか?
まとめると、270ページを超えるレポートでは、以下のような知識を得ることができます:
- バイオプリザベーション市場、2023年から2033年までの収益予測(製品の種類、アプリケーションの種類、細胞提供者の種類、それぞれ世界と地域レベルでの予測) - 業界の展望を発見し、投資と収益に最も有利な場所を見つけることができます。
- 5つの地域と16の主要国市場の2033年までの収益予測 - バイオプリザベーション市場、2023年から2033年の北米、欧州、アジア太平洋、ラテンアメリカと中東・アフリカの市場予測をご覧ください。また、米国、カナダ、メキシコ、ブラジル、ドイツ、フランス、英国、イタリア、中国、インド、日本、オーストラリアなど著名な経済圏の市場も予測されています。
- 既存企業および市場参入を目指す企業の展望 - バイオプリザベーション市場に関わる主要企業の企業プロファイルを含む、2023年から2033年の市場。
独自の予測による定量・定性分析をご覧いただけます。私たちのレポートだけが持つ情報を入手し、貴重なビジネスインテリジェンスとして情報を得ることができます。
他にはない情報
私たちの新しいレポートがあれば、知識に遅れをとったり、チャンスを逃したりする可能性は低くなります。私たちの仕事があなたの研究、分析、意思決定にどのように役立つかをご覧ください。Visiongainの研究は、バイオプリザベーション市場、2023年から2033年、市場をリードする企業のための商業分析を必要とするすべての人のためのものです。データ、トレンド、予測を見つけることができます。
ページTOPに戻る
目次
目次
1 レポートの概要
1.1 研究の目的
1.2 バイオプリザベーション市場の紹介
1.3 本レポートの特徴
1.4 本レポートを読むべき理由
1.5 本分析レポートが回答する主な質問事項
1.6 本レポートは誰のためのものなのか?
1.7 方法論
1.7.1 市場の定義
1.7.2 市場評価・予測手法
1.7.3 データバリデーション
1.7.3.1 一次調査
1.7.3.2 セカンダリーリサーチ
1.8 よくある質問(FAQ)
1.9 Visiongainの関連レポート
1.10 Visiongainについて
2 エグゼクティブサマリー
3 市場の概要
3.1 主要な調査結果
3.2 マーケットダイナミクス
3.2.1 市場促進要因
3.2.1.1 研究開発促進のための投資拡大
3.2.1.2 バイオプリザベーション技術の応用拡大
3.2.1.3 再生医療への需要の高まり
3.2.2 市場の抑制要因
3.2.2.1 バイオプリザベーション産業に関連する厳しい規制
3.2.2.2 バイオ試料を常温で保存するメディアソリューションの不足
3.2.3 マーケットオポチュニティ
3.2.3.1 受胎能力温存プログラムの急増
3.2.3.2 バイオバンキング分野の勃興
3.3 COVID-19の影響度分析
3.4 ポーターのファイブフォース分析
3.4.1 サプライヤーのバーゲニングパワー
3.4.2 バイヤーのバーゲニングパワー
3.4.3 競合他社のライバル関係
3.4.4 代替品の脅威
3.4.5 新規参入の脅威
3.5 PEST分析
4 バイオプリザベーション市場分析:製品別
4.1 主要な調査結果
4.2 製品セグメント 市場吸引力指数
4.3 バイオプリザベーションの製品別市場規模の推定と予測
4.4 機器
4.4.1 バイオプリザベーションの機器別市場予測,2023-2033 (US$ Mn)
4.4.1.1 地域別市場規模、2023-2033年 (US$ Mn)
4.4.1.2 地域別市場シェア、2023年&2033年(%)
4.4.2 冷凍機
4.4.2.1 地域別市場規模、2023-2033年 (US$ Mn)
4.4.2.2 地域別市場シェア、2023年&2033年(%)
4.4.3 冷蔵庫
4.4.3.1 地域別市場規模、2023-2033年 (US$ Mn)
4.4.3.2 地域別市場シェア、2023年&2033年(%)
4.4.4 消耗品
4.4.4.1 地域別市場規模、2023-2033年 (US$ Mn)
4.4.4.2 地域別市場シェア、2023年&2033年(%)
4.4.5 液体窒素
4.4.5.1 地域別市場規模、2023-2033年 (US$ Mn)
4.4.5.2 地域別市場シェア、2023年&2033年(%)
4.5 メディア
4.5.1 バイオプリザベーションのメディア別市場予測、2023-2033年 (US$ Mn)
4.5.1.1 地域別市場規模、2023-2033年 (US$ Mn)
4.5.1.2 地域別市場シェア、2023年&2033年(%)
4.5.2 プレフォーミュレーテッド
4.5.2.1 地域別市場規模、2023-2033年 (US$ Mn)
4.5.2.2 地域別市場シェア、2023年&2033年(%)
4.5.3 自家製ビール
4.5.3.1 地域別市場規模、2023-2033年 (US$ Mn)
4.5.3.2 地域別市場シェア、2023年&2033年(%)
4.6 臨床検査情報管理システム(LIMS)
4.6.1 地域別市場規模、2023-2033年(US$ Mn)
4.6.2 地域別市場シェア、2023年&2033年(%)
5 バイオプリザベーション市場分析:用途別
5.1 キーファインディング
5.2 用途別セグメント:市場魅力度指数
5.3 バイオプレザベーションの用途別市場規模の推定と予測
5.4 再生医療
5.4.1 再生医療による生体保存の市場予測、2023-2033年(US$ Mn)
5.4.1.1 地域別市場規模、2023-2033年(US$ Mn)
5.4.1.2 地域別市場シェア、2023年&2033年(%)
5.4.2 細胞療法
5.4.2.1 地域別市場規模、2023-2033年(US$ Mn)
5.4.2.2 地域別市場シェア、2023年&2033年(%)
5.4.3 遺伝子治療
5.4.3.1 地域別市場規模、2023-2033年(US$ Mn)
5.4.3.2 地域別市場シェア、2023年&2033年(%)
5.4.4 その他
5.4.4.1 地域別市場規模、2023-2033年(US$ Mn)
5.4.4.2 地域別市場シェア、2023年&2033年(%)
5.5 バイオバンク
5.5.1 バイオバンクによる生体保存市場の予測、2023-2033年 (US$ Mn)
5.5.1.1 地域別市場規模、2023-2033年(US$ Mn)
5.5.1.2 地域別市場シェア、2023年&2033年(%)
5.5.2 ヒト卵
5.5.2.1 地域別市場規模、2023-2033年(US$ Mn)
5.5.2.2 地域別市場シェア、2023年&2033年(%)
5.5.3 ヒト精子
5.5.3.1 地域別市場規模、2023-2033年(US$ Mn)
5.5.3.2 地域別市場シェア、2023年&2033年(%)
5.5.4 動物用体外受精
5.5.4.1 地域別市場規模、2023-2033年(US$ Mn)
5.5.4.2 地域別市場シェア、2023年&2033年(%)
5.6 ドラッグディスカバリー
5.6.1 地域別市場規模、2023-2033年(US$ Mn)
5.6.2 地域別市場シェア、2023年&2033年(%)
6 バイオプリザベーション市場分析:セルプロバイダー別
6.1 主要な調査結果
6.2 セルプロバイダーセグメント 市場魅力度指数
6.3 バイオプリザベーションのセルプロバイダー別市場規模の推定と予測
6.4 CD34+
6.4.1 地域別市場規模、2023-2033年(US$ Mn)
6.4.2 地域別市場シェア、2023年&2033年(%)
6.5 CD19+
6.5.1 地域別市場規模、2023-2033年(US$ Mn)
6.5.2 地域別市場シェア、2023年&2033年(%)
6.6 MSC(間葉系幹細胞)
6.6.1 地域別市場規模、2023-2033年(US$ Mn)
6.6.2 地域別市場シェア、2023年&2033年(%)
6.7 iPSC (人工多能性幹細胞)
6.7.1 地域別市場規模、2023-2033年(US$ Mn)
6.7.2 地域別市場シェア、2023年&2033年(%)
6.8 hESC(ヒト胚性幹細胞)
6.8.1 地域別市場規模、2023-2033年(US$ Mn)
6.8.2 地域別市場シェア、2023年&2033年(%)
6.9 腫瘍細胞
6.9.1 地域別市場規模、2023-2033年(US$ Mn)
6.9.2 地域別市場シェア、2023年&2033年(%)
6.10 その他
6.10.1 地域別市場規模、2023-2033年(US$ Mn)
6.10.2 地域別市場シェア、2023年&2033年(%)
7 バイオプリザベーション市場分析:地域別
7.1 キーファインディング
7.2 地域別セグメント:市場魅力度指数
7.3 バイオプリザベーションの市場規模の推定と予測
8 北米のバイオプリザベーション市場分析
8.1 主要な調査結果
8.2 北米バイオプリザベーション市場魅力度指数
8.3 北米バイオプリザベーション国別市場:2023年、2028年、2033年(US$ Mn)
8.4 北米バイオプリザベーションの国別市場規模の推定と予測
8.5 北米バイオプリザベーションの製品別市場規模の推定と予測
8.6 北米バイオプリザベーションの用途別市場規模の推定と予測
8.7 北米バイオプリザベーションのセルプロバイダー別場規模の推定と予測
8.8 米国のバイオプリザベーション市場分析
8.9 カナダのバイオプリザベーション市場分析
9 欧州バイオプリザベーション市場分析
9.1 主要な調査結果
9.2 欧州バイオプリザベーション市場魅力度指数
9.3 欧州バイオプリザベーション市場の国別推移、2023年、2028年、2033年(US$ Mn)
9.4 欧州バイオプリザベーションの国別市場規模の推定と予測
9.5 欧州バイオプリザベーションの製品別市場規模の推定と予測
9.6 欧州バイオプリザベーションの用途別市場規模の推定と予測
9.7 欧州バイオプリザベーションのセルプロバイダー別市場規模の推定と予測
9.8 ドイツ バイオプリザベーション市場分析
9.9 フランス バイオプリザベーション市場分析
9.10 イギリス バイオプリザベーション市場分析
9.11 イタリア バイオプリザベーション市場分析
9.12 スペイン バイオプリザベーション市場分析
9.13 ロシア バイオプリザベーション市場分析
9.14 その他の欧州のバイオプリザベーション市場分析
10 アジア太平洋地域のバイオプリザベーション市場分析
10.1 主要な調査結果
10.2 アジア太平洋地域のバイオプリザベーション市場魅力度指数
10.3 アジア太平洋地域のバイオプリザベーション国別市場、2023年、2028年、2033年 (US$ Mn)
10.4 アジア太平洋地域のバイオプリザベーションの国別市場規模の推定と予測
10.5 アジア太平洋地域のバイオプリザベーションの製品別市場規模の推定と予測
10.6 アジア太平洋地域のバイオプリザベーションの用途別市場規模の推定と予測
10.7 アジア太平洋地域のバイオプリザベーションのセルプロバイダー別市場規模の推定と予測
10.8 日本バイオプリザベーション市場分析
10.9 中国バイオプリザベーション市場分析
10.10 インド バイオプリザベーションの市場分析
10.11 オーストラリア バイオプリザベーションの市場分析
10.12 韓国 バイオプリザベーション市場分析
10.13 その他のアジア太平洋地域のバイオプリザベーション市場分析
11 ラテンアメリカのバイオプリザベーション市場分析
11.1 主要な調査結果
11.2 ラテンアメリカ バイオプリザベーション市場魅力度指数
11.3 ラテンアメリカ バイオプリザベーション国別市場 2023年、2028年、2033年 (US$ Mn)
11.4 ラテンアメリカ バイオプリザベーションの国別市場規模の推定と予測
11.5 ラテンアメリカ バイオプリザベーションの製品別市場規模の推定と予測
11.6 ラテンアメリカ バイオプリザベーションの用途別市場規模推定と予測
11.7 ラテンアメリカ バイオプリザベーションのセルプロバイダー別市場規模の推定と予測
11.8 ブラジルのバイオプリザベーションの市場分析
11.9 メキシコ バイオプリザベーションの市場分析
11.10 その他のラテンアメリカ地域 バイオプリザベーションの市場分析
12 MEAのバイオプリザベーションの市場分析
12.1 キーファインディング
12.2 MEAバイオプリザベーション市場魅力度指数
12.3 MEAバイオプリザベーション市場の国別推移、2023年、2028年、2033年 (US$ Mn)
12.4 MEAバイオプリザベーションの国別市場規模の推定と予測
12.5 MEAバイオプリザベーションの製品別市場規模の推定と予測
12.6 MEAバイオプリザベーションの用途別市場規模推定と予測
12.7 MEAバイオプリザベーションのセルプロバイダー別市場規模の推定と予測
12.8 GCCバイオプリザベーションの市場分析
12.9 南アフリカ バイオプリザベーションの市場分析
12.10 その他のMEA地域 バイオプリザベーションの市場分析
13 会社概要
13.1 企業シェア分析、2022年
13.1.1 Thermo Fisher Scientific Inc.
13.1.2 PHC Holdings Corporation
13.1.3 VWR International (Avantor, Inc.)
13.2 Arctiko
13.2.1 企業スナップショット
13.2.2 会社概要
13.2.3 製品ベンチマーキング
13.2.4 戦略的な展望
13.3 Azenta, Inc.
13.3.1 企業スナップショット
13.3.2 会社概要
13.3.3 財務分析
13.3.3.1 純収益、2017-2021年
13.3.3.2 R&D、2017年~2021年
13.3.3.3 地域別市場シェア、2021年
13.3.4 製品ベンチマーキング
13.3.5 戦略的な展望
13.4 BioLife Solutions Inc.
13.4.1 企業スナップショット
13.4.2 会社概要
13.4.3 財務分析
13.4.3.1 純収益、2017-2021年
13.4.3.2 R&D、2017年~2021年
13.4.3.3 地域別市場シェア(2021年
13.4.4 製品ベンチマーキング
13.4.5 戦略的な展望
13.5 Biomatrica, Inc. (Exact Sciences)
13.5.1 企業スナップショット
13.5.2 会社概要
13.5.3 製品ベンチマーキング
13.6 Cryoport Systems, LLC
13.6.1 企業スナップショット
13.6.2 会社概要
13.6.3 財務分析
13.6.3.1 純収益、2017-2021年
13.6.3.2 R&D、2017年~2021年
13.6.3.3 地域別市場シェア(2021年
13.6.4 製品ベンチマーキング
13.6.5 戦略的な展望
13.7 Eppendorf SE
13.7.1 企業スナップショット
13.7.2 会社概要
13.7.3 財務分析
13.7.3.1 純収益、2017-2021年
13.7.3.2 R&D、2017年~2021年
13.7.3.3 地域別市場占有率、2021年
13.7.4 製品ベンチマーキング
13.7.5 戦略的な展望
13.8 Helmer Scientific Inc.
13.8.1 企業スナップショット
13.8.2 会社概要
13.8.3 製品ベンチマーキング
13.8.4 戦略的な展望
13.9 Merck KGaA
13.9.1 企業スナップショット
13.9.2 会社概要
13.9.3 財務分析
13.9.3.1 純収益、2017-2021年
13.9.3.2 R&D、2017年~2021年
13.9.3.3 地域別市場占有率、2021年
13.9.4 製品ベンチマーキング
13.9.5 戦略的な展望
13.10 PHC Holdings Corporation
13.10.1 企業スナップショット
13.10.2 会社概要
13.10.3 財務分析
13.10.3.1 純収益、2017-2021年
13.10.3.2 R&D、2017年~2021年
13.10.3.3 地域別市場占有率、2021年
13.10.4 製品ベンチマーキング
13.10.5 戦略的な展望
13.11 QIAGEN
13.11.1 企業スナップショット
13.11.2 会社概要
13.11.3 財務分析
13.11.3.1 純収益、2017年~2022年
13.11.3.2 R&D、2017年~2022年
13.11.3.3 地域別市場占有率、2022年
13.11.4 製品ベンチマーキング
13.11.5 戦略的な展望
13.12 Taylor-Wharton
13.12.1 企業スナップショット
13.12.2 会社概要
13.12.3 製品ベンチマーキング
13.13 Thermo Fisher Scientific Inc.
13.13.1 企業スナップショット
13.13.2 会社概要
13.13.3 財務分析
13.13.3.1 純収益、2017-2021年
13.13.3.2 R&D、2017年~2021年
13.13.3.3 地域別市場シェア(2021年
13.13.4 製品ベンチマーキング
13.13.5 戦略的な展望
13.14 VWR International, LLC (Avantor)
13.14.1 企業スナップショット
13.14.2 会社概要
13.14.3 財務分析
13.14.3.1 純収益、2017-2021年
13.14.3.2 R&D、2017年~2021年
13.14.3.3 地域別市場シェア(2021年
13.14.4 製品ベンチマーキング
14 結論と提言
14.1 ビジョンゲインからの結びの言葉
14.2 市場関係者への提言
表の一覧
Table 1 Biopreservation Market Snapshot, 2023 & 2033 (US$ million, CAGR %)
Table 2 Biopreservation Market by Region, 2023-2033 (US$ Mn, AGR (%), CAGR (%)): “V” Shaped Recovery Scenario
Table 3 Biopreservation Market by Region, 2023-2033 (US$ Mn, AGR (%), CAGR (%)): “U” Shaped Recovery Scenario
Table 4 Biopreservation Market by Region, 2023-2033 (US$ Mn, AGR (%), CAGR (%)): “W” Shaped Recovery Scenario
Table 5 Biopreservation Market by Region, 2023-2033 (US$ Mn, AGR (%), CAGR (%)): “L” Shaped Recovery Scenario
Table 6 Biopreservation Market by Product, 2023-2033 (US$ Mn, AGR (%), CAGR (%))
Table 7 Biopreservation Market Forecast by Equipment, 2023-2033 (US$ Mn, AGR (%), CAGR (%))
Table 8 Equipment Segment Market Forecast by Region, 2023-2033 (US$ Mn, AGR%, CAGR%)
Table 9 Freezers Segment Market Forecast by Region, 2023-2033 (US$ Mn, AGR%, CAGR%)
Table 10 Refrigerators Segment Market Forecast by Region, 2023-2033 (US$ Mn, AGR%, CAGR%)
Table 11 Consumables Segment Market Forecast by Region, 2023-2033 (US$ Mn, AGR%, CAGR%)
Table 12 Liquid Nitrogen Segment Market Forecast by Region, 2023-2033 (US$ Mn, AGR%, CAGR%)
Table 13 Biopreservation Segment Market Forecast by Media, 2023-2033 (US$ Mn, AGR (%), CAGR (%))
Table 14 Media Segment Market Forecast by Region, 2023-2033 (US$ Mn, AGR%, CAGR%)
Table 15 Pre-formulated Segment Market Forecast by Region, 2023-2033 (US$ Mn, AGR%, CAGR%)
Table 16 Home-brew Segment Market Forecast by Region, 2023-2033 (US$ Mn, AGR%, CAGR%)
Table 17 Laboratory information management systems (LIMS) Segment Market Forecast by Region, 2023-2033 (US$ Mn, AGR%, CAGR%)
Table 18 Biopreservation Market Forecast by Application, 2023-2033 (US$ Mn, AGR (%), CAGR (%))
Table 19 Biopreservation Market Forecast by Regenerative Medicine, 2023-2033 (US$ Mn, AGR (%), CAGR (%))
Table 20 Regenerative Medicine Segment Market Forecast by Region, 2023-2033 (US$ Mn, AGR%, CAGR%)
Table 21 Cell Therapy Segment Market Forecast by Region, 2023-2033 (US$ Mn, AGR%, CAGR%)
Table 22 Gene Therapy Segment Market Forecast by Region, 2023-2033 (US$ Mn, AGR%, CAGR%)
Table 23 Others Segment Market Forecast by Region, 2023-2033 (US$ Mn, AGR%, CAGR%)
Table 24 Biopreservation Segment Market Forecast by Biobanking, 2023-2033 (US$ Mn, AGR (%), CAGR (%))
Table 25 Biobanking Segment Market Forecast by Region, 2023-2033 (US$ Mn, AGR%, CAGR%)
Table 26 Human Eggs Segment Market Forecast by Region, 2023-2033 (US$ Mn, AGR%, CAGR%)
Table 27 Human Sperm Segment Market Forecast by Region, 2023-2033 (US$ Mn, AGR%, CAGR%)
Table 28 Veterinary IVF Segment Market Forecast by Region, 2023-2033 (US$ Mn, AGR%, CAGR%)
Table 29 Drug Discovery Segment Market Forecast by Region, 2023-2033 (US$ Mn, AGR%, CAGR%)
Table 30 Biopreservation Market Size Estimation and Forecast by Cell Provider, 2023-2033 (US$ Mn, AGR (%), CAGR (%))
Table 31 CD34+ Segment Market Forecast by Region, 2023-2033 (US$ Mn, AGR%, CAGR%)
Table 32 CD19+ Segment Market Forecast by Region, 2023-2033 (US$ Mn, AGR%, CAGR%)
Table 33 MSC Segment Market Forecast by Region, 2023-2033 (US$ Mn, AGR%, CAGR%)
Table 34 iPSC Segment Market Forecast by Region, 2023-2033 (US$ Mn, AGR%, CAGR%)
Table 35 hESC Segment Market Forecast by Region, 2023-2033 (US$ Mn, AGR%, CAGR%)
Table 36 Tumor Cells Segment Market Forecast by Region, 2023-2033 (US$ Mn, AGR%, CAGR%)
Table 37 Others Segment Market Forecast by Region, 2023-2033 (US$ Mn, AGR%, CAGR%)
Table 38 Biopreservation Market by Region, 2023-2033 (US$ Mn, AGR (%), CAGR (%))
Table 39 North America Biopreservation Market Forecast by Country
Table 40 North America Biopreservation Market Forecast by Product, 2023-2033 (US$ Mn, AGR (%), CAGR (%))
Table 41 North America Biopreservation Market Forecast by Application, 2023-2033 (US$ Mn, AGR (%), CAGR (%))
Table 42 North America Biopreservation Market Forecast by Cell Provider, 2023-2033 (US$ Mn, AGR (%), CAGR (%))
Table 43 U.S. Biopreservation Market Forecast, 2023-2033 (US$ Mn, AGR %, CAGR %)
Table 44 Canada Biopreservation Market Forecast, 2023-2033 (US$ Mn, AGR %, CAGR %)
Table 45 Europe Biopreservation Market Forecast by Country, 2023-2033 (US$ Mn, AGR%, CAGR%)
Table 46 Europe Biopreservation Market Forecast by Product, 2023-2033 (US$ Mn, AGR (%), CAGR (%))
Table 47 Europe Biopreservation Market Forecast by Application, 2023-2033 (US$ Mn, AGR (%), CAGR (%))
Table 48 Europe Biopreservation Market Forecast by Cell Provider, 2023-2033 (US$ Mn, AGR (%), CAGR (%))
Table 49 Germany Biopreservation Market Forecast, 2023-2033 (US$ Mn, AGR%, CAGR%)
Table 50 France Biopreservation Market Forecast, 2023-2033 (US$ Mn, AGR%, CAGR%)
Table 51 UK Biopreservation Market Forecast, 2023-2033 (US$ Mn, AGR%, CAGR%)
Table 52 Italy Biopreservation Market Forecast, 2023-2033 (US$ Mn, AGR%, CAGR%)
Table 53 Spain Biopreservation Market Forecast, 2023-2033 (US$ Mn, AGR%, CAGR%)
Table 54 Russia Biopreservation Market Forecast, 2023-2033 (US$ Mn, AGR%, CAGR%)
Table 55 Rest of Europe Biopreservation Market Forecast, 2023-2033 (US$ Mn, AGR%, CAGR%)
Table 56 Asia Pacific Biopreservation Market forecast by Country 2023-2033 (US$ Mn, AGR%, CAGR%)
Table 57 Biopreservation Market Forecast by Product, 2023-2033 (US$ Mn, AGR (%), CAGR (%))
Table 58 Asia Pacific Biopreservation Market Forecast by Application, 2023-2033 (US$ Mn, AGR (%), CAGR (%))
Table 59 Asia Pacific Biopreservation Market Forecast by Cell Provider, 2023-2033 (US$ Mn, AGR (%), CAGR (%))
Table 60 Japan Biopreservation Market Forecast, 2023-2033 (US$ million, AGR %)
Table 61 China Biopreservation Market Forecast, 2023-2033 (US$ Mn, AGR%, CAGR%)
Table 62 India Biopreservation Market Forecast, 2023-2033 (US$ Mn, AGR%, CAGR%)
Table 63 Australia Biopreservation Market Forecast, 2023-2033 (US$ Mn, AGR%, CAGR%)
Table 64 South Korea Biopreservation Market Forecast, 2023-2033 (US$ million, AGR %)
Table 65 Rest of Asia Pacific Biopreservation Market Forecast, 2023-2033 (US$ Mn, AGR%, CAGR%)
Table 66 Latin America Biopreservation Drugs Forecast, 2023-2033 (US$ Mn, AGR%, CAGR%)
Table 67 Latin America Biopreservation Market Forecast by Product, 2023-2033 (US$ Mn, AGR (%), CAGR (%))
Table 68 Latin America Biopreservation Market Forecast by Application, 2023-2033 (US$ Mn, AGR (%), CAGR (%))
Table 69 Latin America Biopreservation Market Forecast by Cell Provider, 2023-2033 (US$ Mn, AGR (%), CAGR (%))
Table 70 Brazil Biopreservation Market Forecast, 2023-2033 (US$ Mn, AGR%, CAGR%)
Table 71 Mexico Biopreservation Market Forecast, 2023-2033 (US$ Mn, AGR%, CAGR%)
Table 72 Rest of Latin America Biopreservation Drugs Forecast, 2023-2033 (US$ Mn, AGR%, CAGR%)
Table 73 MEA Biopreservation Drugs forecast by Country 2023-2033 (US$ Mn, AGR%, CAGR%)
Table 74 MEA Biopreservation Market Forecast by Product, 2023-2033 (US$ Mn, AGR (%), CAGR (%))
Table 75 MEA Biopreservation Market Forecast by Application, 2023-2033 (US$ Mn, AGR (%), CAGR (%))
Table 76 MEA Biopreservation Market Forecast by Cell Provider, 2023-2033 (US$ Mn, AGR (%), CAGR (%))
Table 77 GCC Biopreservation Market Forecast, 2023-2033 (US$ Mn, AGR%, CAGR%)
Table 78 South Africa Biopreservation Market Forecast, 2023-2033 (US$ Mn, AGR%, CAGR%)
Table 79 Rest of MEA Biopreservation Market Forecast, 2023-2033 (US$ Mn, AGR%, CAGR%)
Table 80 Arctiko: Key Details, (CEO, HQ, Revenue, Founded, No. of Employees, Company Type, Website, Business Segment)
Table 81 Arctiko: Product Benchmarking
Table 82 Arctiko: Strategic Outlook
Table 83 Azenta, Inc.: Key Details, (CEO, HQ, Revenue, Founded, No. of Employees, Company Type, Website, Business Segment)
Table 84 Azenta, Inc.: Product Benchmarking
Table 85 Azenta, Inc.: Strategic Outlook
Table 86 BioLife Solutions Inc.: Key Details, (CEO, HQ, Revenue, Founded, No. of Employees, Company Type, Website, Business Segment)
Table 87 BioLife Solutions, Inc.: Product Benchmarking
Table 88 BioLife Solutions, Inc.: Strategic Outlook
Table 89 Biomatrica, Inc. (Exact Sciences): Key Details, (CEO, HQ, Revenue, Founded, No. of Employees, Company Type, Website, Business Segment)
Table 90 Biomatrica, Inc. (Exact Sciences): Product Benchmarking
Table 91 Cryoport Systems, LLC: Key Details, (CEO, HQ, Revenue, Founded, No. of Employees, Company Type, Website, Business Segment)
Table 92 Cryoport LLC: Product Benchmarking
Table 93 Cryoport LLC: Strategic Outlook
Table 94 Eppendorf SE: Key Details, (CEO, HQ, Revenue, Founded, No. of Employees, Company Type, Website, Business Segment)
Table 95 Eppendorf SE: Product Benchmarking
Table 96 Eppendorf SE: Strategic Outlook
Table 97 Helmer Scientific Inc.: Key Details, (CEO, HQ, Revenue, Founded, No. of Employees, Company Type, Website, Business Segment)
Table 98 Helmer Scientific Inc.: Product Benchmarking
Table 99 Helmer Scientific: Strategic Outlook
Table 100 Merck KGaA: Key Details, (CEO, HQ, Revenue, Founded, No. of Employees, Company Type, Website, Business Segment)
Table 101 Merck KGaA: Product Benchmarking
Table 102 Merck KGaA: Strategic Outlook
Table 103 PHC Holdings Corporation: (CEO, HQ, Revenue, Founded, No. of Employees, Company Type, Website, Business Segment)
Table 104 PHC Holdings Corporation: Product Benchmarking
Table 105 PHC Holdings Corporation: Strategic Outlook
Table 106 QIAGEN :(CEO, HQ, Revenue, Founded, No. of Employees, Company Type, Website, Business Segment)
Table 107 QIAGEN: Product Benchmarking
Table 108 QIAGEN: Strategic Outlook
Table 109 Taylor-Wharton: (CEO, HQ, Revenue, Founded, No. of Employees, Company Type, Website, Business Segment)
Table 110 Taylor-Wharton: Product Benchmarking
Table 111 Thermo Fisher Scientific Inc. :(CEO, HQ, Revenue, Founded, No. of Employees, Company Type, Website, Business Segment)
Table 112 Thermo Fisher Scientific Inc.: Product Benchmarking
Table 113 Thermo Fisher Scientific Inc..: Strategic Outlook
Table 114 VWR International, LLC (Avantor):(CEO, HQ, Revenue, Founded, No. of Employees, Company Type, Website, Business Segment)
Table 115 VWR International, LLC (Avantor): Product Benchmarking
図の一覧
Figure 1 Biopreservation Market Segmentation
Figure 2 Biopreservation Market by Product: Market Attractiveness Index
Figure 3 Biopreservation Market Attractiveness Index by Application
Figure 4 Biopreservation Market Attractiveness Index by Cell Provider
Figure 5 Biopreservation Market Attractiveness Index by Region
Figure 6 Biopreservation Market: Market Dynamics
Figure 7 COVID Impact Analysis: Biopreservation Market Recovery Scenarios
Figure 8 Biopreservation Market by Region, 2023-2033 (US$ Mn, AGR (%), CAGR (%)): “V” Shaped Recovery
Figure 9 Biopreservation Market by Region, 2023-2033 (US$ Mn, AGR (%), CAGR (%)): “U” Shaped Recovery
Figure 10 Biopreservation Market by Region, 2023-2033 (US$ Mn, AGR (%), CAGR (%)): “W” Shaped Recovery
Figure 11 Biopreservation Market by Region, 2023-2033 (US$ Mn, AGR (%), CAGR (%)): “L” Shaped Recovery
Figure 12 Biopreservation Market: Porter’s Five Forces Analysis
Figure 13 Biopreservation Market: PEST Analysis
Figure 14 Biopreservation Market by Product: Market Attractiveness Index
Figure 15 Biopreservation Market Forecast by Product, 2023-2033 (US$ million)
Figure 16 Biopreservation Market Share Forecast by Product, 2023-2033 (%)
Figure 17 Equipment Market Forecast by Region, 2023-2033 (US$ million)
Figure 18 Equipment Segment Market Share Forecast by Region, 2023 & 2033 (%)
Figure 19 Freezers Segment Market Forecast by Region, 2023-2033 (US$ million)
Figure 20 Freezers Segment Market Share Forecast by Region, 2023 & 2033 (%)
Figure 21 Refrigerators Segment Market Forecast by Region, 2023-2033 (US$ million)
Figure 22 Refrigerators Segment Market Share Forecast by Region, 2023 & 2033 (%)
Figure 23 Consumables Segment Market Forecast by Region, 2023-2033 (US$ million)
Figure 24 Consumables Segment Market Share Forecast by Region, 2023 & 2033 (%)
Figure 25 Liquid Nitrogen Segment Market Forecast by Region, 2023-2033 (US$ million)
Figure 26 Liquid Nitrogen Segment Market Share Forecast by Region, 2023 & 2033 (%)
Figure 27 Media Segment Market Forecast by Region, 2023-2033 (US$ million)
Figure 28 Media Segment Market Share Forecast by Region, 2023 & 2033 (%)
Figure 29 Pre-formulated Segment Market Forecast by Region, 2023-2033 (US$ million)
Figure 30 Pre-formulated Segment Market Share Forecast by Region, 2023 & 2033 (%)
Figure 31 Home-brew Segment Market Forecast by Region, 2023-2033 (US$ million)
Figure 32 Home-brew Segment Market Share Forecast by Region, 2023 & 2033 (%)
Figure 33 Laboratory information management systems (LIMS) Segment Market Forecast by Region, 2023-2033 (US$ million)
Figure 34 Laboratory Information Management Systems (LIMS) Segment Market Share Forecast by Region, 2023 & 2033 (%)
Figure 35 Biopreservation Market by Application: Market Attractiveness Index
Figure 36 Biopreservation Market Forecast by Application, 2023-2033 (US$ million)
Figure 37 Biopreservation Market Share Forecast by Application, 2023-2033 (%)
Figure 38 Regenerative Medicine Segment Market Forecast by Region, 2023-2033 (US$ million)
Figure 39 Regenerative Medicine Segment Market Share Forecast by Region, 2023 & 2033 (%)
Figure 40 Cell Therapy Segment Market Forecast by Region, 2023-2033 (US$ million)
Figure 41 Cell Therapy Segment Market Share Forecast by Region, 2023 & 2033 (%)
Figure 42 Gene Therapy Segment Market Forecast by Region, 2023-2033 (US$ million)
Figure 43 Gene Therapy Segment Market Share Forecast by Region, 2023 & 2033 (%)
Figure 44 Others Segment Market Forecast by Region, 2023-2033 (US$ million)
Figure 45 Others Segment Market Share Forecast by Region, 2023 & 2033 (%)
Figure 46 Biobanking Segment Market Forecast by Region, 2023-2033 (US$ million)
Figure 47 Biobanking Segment Market Share Forecast by Region, 2023 & 2033 (%)
Figure 48 Human Eggs Segment Market Forecast by Region, 2023-2033 (US$ million)
Figure 49 Human Eggs Segment Market Share Forecast by Region, 2023 & 2033 (%)
Figure 50 Human Sperm Segment Market Forecast by Region, 2023-2033 (US$ million)
Figure 51 Human Sperm Segment Market Share Forecast by Region, 2023 & 2033 (%)
Figure 52 Veterinary IVF Segment Market Forecast by Region, 2023-2033 (US$ million)
Figure 53 Veterinary IVF Segment Market Share Forecast by Region, 2023 & 2033 (%)
Figure 54 Drug Discovery Segment Market Forecast by Region, 2023-2033 (US$ million)
Figure 55 Drug Discovery Segment Market Share Forecast by Region, 2023 & 2033 (%)
Figure 56 Biopreservation Market by Cell Provider: Market Attractiveness Index
Figure 57 Biopreservation Market Forecast by Cell Provider, 2023-2033 (US$ million)
Figure 58 Biopreservation Market Share Forecast by Cell Provider, 2023-2033 (%)
Figure 59 CD34+ Segment Market Forecast by Region, 2023-2033 (US$ million)
Figure 60 CD34+ Segment Market Share Forecast by Region, 2023 & 2033 (%)
Figure 61 CD19+ Segment Market Forecast by Region, 2023-2033 (US$ million)
Figure 62 CD19+ Segment Market Share Forecast by Region, 2023 & 2033 (%)
Figure 63 MSC Segment Market Forecast by Region, 2023-2033 (US$ million)
Figure 64 MSC Segment Market Share Forecast by Region, 2023 & 2033 (%)
Figure 65 iPSC Segment Market Forecast by Region, 2023-2033 (US$ million)
Figure 66 iPSC Segment Market Share Forecast by Region, 2023 & 2033 (%)
Figure 67 hESC Segment Market Forecast by Region, 2023-2033 (US$ million)
Figure 68 hESC Segment Market Share Forecast by Region, 2023 & 2033 (%)
Figure 69 Tumor Cells Segment Market Forecast by Region, 2023-2033 (US$ million)
Figure 70 Tumor Cells Segment Market Share Forecast by Region, 2023 & 2033 (%)
Figure 71 Others Segment Market Forecast by Region, 2023-2033 (US$ million)
Figure 72 Others Segment Market Share Forecast by Region, 2023 & 2033 (%)
Figure 73 Biopreservation Market by Region: Market Attractiveness Index
Figure 74 Biopreservation Market by Region, 2023-2033 (US$ Mn)
Figure 75 Biopreservation Market Share Forecast by Region 2023, 2033(%)
Figure 76 North America Biopreservation Market Attractiveness Index
Figure 77 North America Biopreservation Market by Region, 2023, 2028 & 2033 (US$ million)
Figure 78 North America Biopreservation Market Forecast by Country, 2023-2033 (US$ million)
Figure 79 North America Biopreservation Market Share Forecast by Country, 2023 & 2033 (%)
Figure 80 North America Biopreservation Market Forecast by Product, 2023-2033 (US$ million)
Figure 81 North America Biopreservation Market Share Forecast by Product, 2023 & 2033 (%)
Figure 82 North America Biopreservation Market Forecast by Application, 2023-2033 (US$ million)
Figure 83 North America Biopreservation Market Share Forecast by Application, 2023 & 2033 (%)
Figure 84 North America Biopreservation Market Forecast by Cell Provider, 2023-2033 (US$ million)
Figure 85 North America Biopreservation Market Share Forecast Cell Provider, 2023 & 2033 (%)
Figure 86 U.S. Biopreservation Market Forecast, 2023-2033 (US$ million, AGR %)
Figure 87 Canada Biopreservation Market Forecast, 2023-2033 (US$ million, AGR %)
Figure 88 Europe Biopreservation Market Attractiveness Index
Figure 89 Europe Biopreservation Market by Region, 2023, 2028 & 2033 (US$ million)
Figure 90 Europe Biopreservation Market Forecast by Country, 2023-2033 (US$ million)
Figure 91 Europe Biopreservation Market Share Forecast by Country, 2023 & 2033 (%)
Figure 92 Europe Biopreservation Market Forecast by Product, 2023-2033 (US$ million)
Figure 93 Europe Biopreservation Market Share Forecast by Product, 2023 & 2033 (%)
Figure 94 Europe Biopreservation Market Forecast by Application, 2023-2033 (US$ million)
Figure 95 Europe Biopreservation Market Share Forecast by Application, 2023 & 2033 (%)
Figure 96 Europe Biopreservation Market Forecast by Cell Provider, 2023-2033 (US$ million)
Figure 97 Europe Biopreservation Market Share Forecast by Cell Provider, 2023 & 2033 (%)
Figure 98 Germany Biopreservation Market Forecast, 2023-2033 (US$ million, AGR %)
Figure 99 France Biopreservation Market Forecast, 2023-2033 (US$ million, AGR %)
Figure 100 UK Biopreservation Market Forecast, 2023-2033 (US$ million, AGR %)
Figure 101 Italy Biopreservation Market Forecast, 2023-2033 (US$ million, AGR %)
Figure 102 Spain Biopreservation Market Forecast, 2023-2033 (US$ million, AGR %)
Figure 103 Russia Biopreservation Market Forecast, 2023-2033 (US$ million, AGR %)
Figure 104 Rest of Europe Biopreservation Market Forecast, 2023-2033 (US$ million, AGR %)
Figure 105 Asia Pacific Biopreservation Market Attractiveness Index
Figure 106 Asia Pacific Biopreservation Market by Region, 2023, 2028 & 2033 (US$ million)
Figure 107 Asia Pacific Biopreservation Market Forecast, 2023-2033 (US$ million, AGR %)
Figure 108 Asia Pacific Biopreservation Market Share Forecast by Country, 2023 & 2033 (%)
Figure 109 Asia Pacific Biopreservation Market Forecast by Product, 2023-2033 (US$ million)
Figure 110 Asia Pacific Biopreservation Market Share Forecast by Product, 2023 & 2033 (%)
Figure 111 Asia Pacific Biopreservation Market Forecast by Application, 2023-2033 (US$ million)
Figure 112 Asia Pacific Biopreservation Market Share Forecast by Application, 2023 & 2033 (%)
Figure 113 Asia Pacific Biopreservation Market Forecast by Cell Provider, 2023-2033 (US$ million)
Figure 114 Asia Pacific Biopreservation Market Share Forecast by Cell Provider, 2023 & 2033 (%)
Figure 115 Japan Biopreservation Market Forecast, 2023-2033 (US$ million, AGR %)
Figure 116 China Biopreservation Market Forecast, 2023-2033 (US$ million, AGR %)
Figure 117 India Biopreservation Market Forecast, 2023-2033 (US$ million, AGR %)
Figure 118 Australia Biopreservation Market Forecast, 2023-2033 (US$ million, AGR %)
Figure 119 South Korea Biopreservation Market Forecast, 2023-2033 (US$ million, AGR %)
Figure 120 Rest of Asia Pacific Biopreservation Market Forecast, 2023-2033 (US$ million, AGR %)
Figure 121 Latin America Biopreservation Market Attractiveness Index
Figure 122 Latin America Biopreservation Market by Country, 2023, 2028 & 2033 (US$ million)
Figure 123 Latin America Biopreservation Market Forecast by Country, 2023-2033 (US$ million)
Figure 124 Latin America Biopreservation Market Share Forecast by Country, 2023 & 2033 (%)
Figure 125 Latin America Biopreservation Market Forecast by Product, 2023-2033 (US$ million)
Figure 126 Latin America Biopreservation Market Share Forecast by Product, 2023 & 2033 (%)
Figure 127 Latin America Biopreservation Market Forecast by Application, 2023-2033 (US$ million)
Figure 128 Latin America Biopreservation Market Share Forecast by Application, 2023 & 2033 (%)
Figure 129 Latin America Biopreservation Market Forecast by Cell Provider, 2023-2033 (US$ million)
Figure 130 Latin America Biopreservation Market Share Forecast by Cell Provider, 2023 & 2033 (%)
Figure 131 Brazil Biopreservation Market Forecast, 2023-2033 (US$ million, AGR %)
Figure 132 Mexico Biopreservation Market Forecast, 2023-2033 (US$ million, AGR %)
Figure 133 Rest of Latin America Biopreservation Market Forecast, 2023-2033 (US$ million, AGR %)
Figure 134 MEA Biopreservation Market Attractiveness Index
Figure 135 MEA Biopreservation Market by Country, 2023, 2028 & 2033 (US$ million)
Figure 136 MEA Biopreservation Market Forecast by Country, 2023-2033 (US$ million)
Figure 137 MEA Biopreservation Market Share Forecast by Country, 2023 & 2033 (%)
Figure 138 MEA Biopreservation Market Forecast by Product, 2023-2033 (US$ million)
Figure 139 MEA Biopreservation Market Share Forecast by Product, 2023 & 2033 (%)
Figure 140 MEA Biopreservation Market Forecast by Application, 2023-2033 (US$ million)
Figure 141 MEA Biopreservation Market Share Forecast by Application, 2023 & 2033 (%)
Figure 142 MEA Biopreservation Market Forecast by Cell Provider, 2023-2033 (US$ million)
Figure 143 MEA Biopreservation Market Share Forecast by Cell Provider, 2023 & 2033 (%)
Figure 144 GCC Biopreservation Market Forecast, 2023-2033 (US$ million, AGR %)
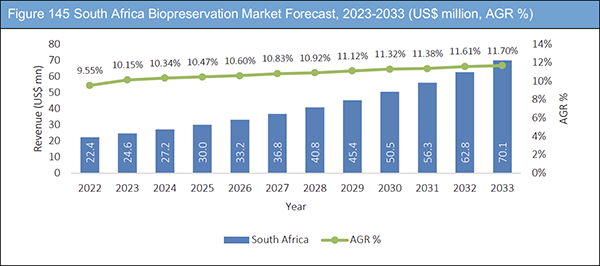
Figure 145 South Africa Biopreservation Market Forecast, 2023-2033 (US$ million, AGR %)
Figure 146 Rest of MEA Biopreservation Market Forecast, 2023-2033 (US$ million, AGR %)
Figure 147 Company Share Analysis, 2022
Figure 148 Azenta, Inc.: Net Revenue, 2017-2021 (US$ million, AGR%)
Figure 149 Azenta, Inc.: R&D, 2017-2021 (US$ million, AGR%)
Figure 150 Azenta, Inc.: Regional Market Shares, 2022
Figure 151 BioLife Solutions, Inc.: Net Revenue, 2017-2021 (US$ million, AGR%)
Figure 152 BioLife Solutions, Inc.: R&D, 2017-2021 (US$ million, AGR%)
Figure 153 BioLife Solutions, Inc.: Regional Market Shares, 2021
Figure 154 Cryoport Systems, LLC: Net Revenue, 2017-2021 (US$ million, AGR%)
Figure 155 Cryoport Systems, LLC: R&D, 2017-2021 (US$ million, AGR%)
Figure 156 Cryoport Systems, LLC: Regional Market Shares, 2021
Figure 157 Eppendorf SE: Net Revenue, 2017-2021 (US$ million, AGR%)
Figure 158 Eppendorf SE: R&D, 2017-2021 (US$ million, AGR%)
Figure 159 Eppendorf SE: Regional Market Shares, 2021
Figure 160 Merck KGaA: Net Revenue, 2017-2021 (US$ million, AGR%)
Figure 161 Merck KGaA: R&D, 2017-2021 (US$ million, AGR%)
Figure 162 Merck KGaA: Regional Market Shares, 2021
Figure 163 PHC Holdings Corporation.: Net Revenue, 2017-2021 (US$ million, AGR%)
Figure 164 PHC Holdings Corporation.: R&D, 2017-2021 (US$ million, AGR%)
Figure 165 PHC Holdings Corporation: Regional Market Shares, 2021
Figure 166 QIAGEN.: Net Revenue, 2017-2022 (US$ million, AGR%)
Figure 167 QIAGEN.: R&D, 2017-2022 (US$ million, AGR%)
Figure 168 QIAGEN: Regional Market Shares, 2022
Figure 169 Thermo Fisher Scientific Inc.: Net Revenue, 2017-2021 (US$ million, AGR%)
Figure 170 Thermo Fisher Scientific Inc.: R&D, 2017-2021 (US$ million, AGR%)
Figure 171 Thermo Fisher Scientific Inc: Regional Market Shares, 2021
Figure 172 VWR International LLC (Avantor): Net Revenue, 2017-2021 (US$ million, AGR%)
Figure 173 VWR International, LLC (Avantor).: R&D, 2017-2021 (US$ million, AGR%)
Figure 174 VWR International, LLC (Avantor): Regional Market Shares, 2021
ページTOPに戻る
Summary
Report Details
The Biopreservation Market Report 2023-2033: This report will prove invaluable to leading firms striving for new revenue pockets if they wish to better understand the industry and its underlying dynamics. It will be useful for companies that would like to expand into different industries or to expand their existing operations in a new region.
Upsurge in R&D and Product Development to Bolster Market Growth
The companies operating in the biopreservation market, research associations, and non- governmental organizations, among other stakeholders, are focused on increasing their efforts in research and development of innovative techniques in the field of biopreservation industry. For instance, in November 2021, Spain was formally recognised as a new Observer in the European research infrastructure partnership BBMRI- ERIC (Biobanks and Biomolecular Resources Research Infrastructure Consortium), with an emphasis on biobanking and biomolecular research.
On the other hand, the high cost of medical instruments, including their initial purchase price and ongoing maintenance expenses, is a major factor that is expected to hinder the growth of the market. The high cost of medical instruments can make it difficult for healthcare providers and institutions to purchase and maintain these tools. The cost of purchasing advanced and specialized instruments can be quite high, and the cost of maintaining and repairing these instruments can also add up over time. This financial burden can limit the adoption and usage of these instruments, which can in turn slow down the growth of the market.
Additionally, there is a risk of tissue injury during the preservation, which can also lead to negative outcomes and potentially harm the market growth. These factors combined are likely to challenge market growth over the forecast period.
Lack of Efficient Temperate Control Could Impede Industry Development
One of the main challenges for the development of new storage technologies is the need to maintain and regulate the room temperature storage. For instance, vaccines save almost 3 million lives each year in the United States, but due to improper refrigeration and storage, vaccines worth about US$20 million are lost or abandoned each year. The frequent tissue or cell injury that results from freezing and thawing is impeding market revenue. Nevertheless, future market projections will be driven by continuous research into the durability of products like genes, vaccines, and other bio preserved products.
What Questions Should You Ask before Buying a Market Research Report?
• How is the Biopreservation Market evolving?
• What is driving and restraining the Biopreservation Market?
• How will each Biopreservation submarket grow over the forecast period and how much revenue will these submarkets account for in 2033?
• How will the market shares for each Biopreservation submarket develop from 2023 to 2033?
• What will be the main driver for the overall market from 2023 to 2033?
• Will leading Biopreservation Markets broadly follow the macroeconomic dynamics, or will individual national markets outperform others?
• How will the market shares of the national markets change by 2033 and which geographical region will lead the market in 2033?
• Who are the leading players and what are their prospects over the forecast period?
• What are the Biopreservation product development projects for these leading companies?
• How will the industry evolve during the period between 2023 and 2033? What are the implications of Biopreservation product development projects taking place now and over the next 10 years?
• Is there a greater need for product commercialisation to further scale the Biopreservation Market?
• Where is the Biopreservation Market heading and how can you ensure you are at the forefront of the market?
• What are the best investment options for new product and service lines?
• What are the key prospects for moving companies into a new growth path and C- suite?
You need to discover how this will impact the Biopreservation Market today, and over the next 10 years:
• Our 277- page report provides 115 tables and 174 charts/graphs exclusively to you.
• The report highlights key lucrative areas in the industry so you can target them – NOW.
• It contains in- depth analysis of global, regional and national sales and growth.
• It highlights for you the key successful trends, changes and revenue projections made by your competitors.
This report tells you TODAY how the Biopreservation Market will develop in the next 10 years, and in line with the variations in COVID-19 economic recession and bounce. This market is more critical now than at any point over the last 10 years.
Forecasts to 2033 and other analyses reveal commercial prospects
• In addition to revenue forecasting to 2033, our new study provides you with recent results, growth rates, and market shares.
• You will find original analyses, with business outlooks and developments.
• Discover qualitative analyses (including market dynamics, drivers, opportunities, restraints and challenges), cost structure, impact of rising biopreservation product prices and recent developments.
This report includes data analysis and invaluable insight into how COVID-19 will affect the industry and your company. Four COVID-19 recovery patterns and their impact, namely, “V”, “L”, “W” and “U” are discussed in this report.
Segments Covered in the Report
By Product
• Equipment
– Freezers
– Refrigerators
– Consumables
– Liquid Nitrogen
• Media
– Pre- formulated
– Home- brew
• Laboratory Information Management Systems (LIMS)
By Application
• Regenerative Medicine
– Cell Therapy
– Gene Therapy
– Others
• Biobanking
– Human Eggs
– Human Sperm
– Veterinary IVF
• Drug Discovery
By Cell Provider
• CD34+
• CD19+
• MSC
• iPSC
• hESC
• Tumour cells
• Others
In addition to the revenue predictions for the overall world market and segments, you will also find revenue forecasts for five regional and 16 leading national markets:
North America
• U.S.
• Canada
Europe
• Germany
• UK
• France
• Spain
• Italy
• Rest of Europe
Asia-Pacific
• China
• Japan
• India
• Australia
• South Korea
• Rest of Asia-Pacific
Latin America
• Brazil
• Mexico
• Rest of Latin America
MEA
• GCC
• South Africa
• Rest of MEA
The report also includes profiles and for some of the leading companies in the Biopreservation Market, 2023 to 2033, with a focus on this segment of these companies’ operations.
Leading companies and the potential for market growth
• Arctiko
• Azenta
• BioLife Solutions Inc.
• Biomatrica
• Cryoport Systems, LLC
• Eppendorf SE
• Helmer Scientific Inc.
• Merck KGaA
• PHC Holdings Corporation
• Qiagen
• Taylor- Wharton Cryogenics LLC
• Thermo Fisher Scientific Inc.
• VWR International
Overall world revenue for Biopreservation Market, 2023 to 2033 in terms of value the market will surpass US$5,861.0 million in 2023, our work calculates. We predict strong revenue growth through to 2033. Our work identifies which organizations hold the greatest potential. Discover their capabilities, progress, and commercial prospects, helping you stay ahead.
How will the Biopreservation Market, 2023 to 2033 report help you?
In summary, our 270+ page report provides you with the following knowledge:
• Revenue forecasts to 2033 for Biopreservation Market, 2023 to 2033 Market, with forecasts for Type of Product, Type of Application, Type of Cell provider, each forecast at a global and regional level – discover the industry’s prospects, finding the most lucrative places for investments and revenues.
• Revenue forecasts to 2033 for five regional and 16 key national markets – See forecasts for the Biopreservation Market, 2023 to 2033 market in North America, Europe, Asia-Pacific and Latin America and Middle East and Africa. Also forecasted is the market in the US, Canada, Mexico, Brazil, Germany, France, UK, Italy, China, India, Japan, and Australia among other prominent economies.
• Prospects for established firms and those seeking to enter the market – including company profiles of the major companies involved in the Biopreservation Market, 2023 to 2033.
Find quantitative and qualitative analyses with independent predictions. Receive information that only our report contains, staying informed with invaluable business intelligence.
Information found nowhere else
With our new report, you are less likely to fall behind in knowledge or miss out on opportunities. See how our work could benefit your research, analyses, and decisions. Visiongain’s study is for everybody needing commercial analyses for the Biopreservation Market, 2023 to 2033, market-leading companies. You will find data, trends and predictions.
ページTOPに戻る
Table of Contents
Table of Contents
1 Report Overview
1.1 Objectives of the Study
1.2 Introduction to Biopreservation Market
1.3 What This Report Delivers
1.4 Why You Should Read This Report
1.5 Key Questions Answered by This Analytical Report
1.6 Who is This Report for?
1.7 Methodology
1.7.1 Market Definitions
1.7.2 Market Evaluation & Forecasting Methodology
1.7.3 Data Validation
1.7.3.1 Primary Research
1.7.3.2 Secondary Research
1.8 Frequently Asked Questions (FAQs)
1.9 Associated Visiongain Reports
1.10 About Visiongain
2 Executive Summary
3 Market Overview
3.1 Key Findings
3.2 Market Dynamics
3.2.1 Market Driving Factors
3.2.1.1 Growing Investments in Furthering Research and Development
3.2.1.2 Increasing Applications of Biopreservation Techniques
3.2.1.3 Rising Demand for Regenerative Medicines
3.2.2 Market Restraining Factors
3.2.2.1 Stringent Regulations Pertaining to Biopreservation Industry
3.2.2.2 Lack of Media Solutions Storing Bio-specimens at Room Temperature
3.2.3 Market Opportunities
3.2.3.1 Surge in Fertility Preservation Programmes
3.2.3.2 Emergence of Biobanking Sector
3.3 COVID-19 Impact Analysis
3.4 Porter’s Five Forces Analysis
3.4.1 Bargaining Power of Suppliers
3.4.2 Bargaining Power of Buyers
3.4.3 Competitive Rivalry
3.4.4 Threat from Substitutes
3.4.5 Threat of New Entrants
3.5 PEST Analysis
4 Biopreservation Market Analysis by Product
4.1 Key Findings
4.2 Product Segment: Market Attractiveness Index
4.3 Biopreservation Market Size Estimation and Forecast by Product
4.4 Equipment
4.4.1 Biopreservation Market Forecast by Equipment,2023-2033 (US$ Mn)
4.4.1.1 Market Size by Region, 2023-2033 (US$ Mn)
4.4.1.2 Market Share by Region, 2023 & 2033 (%)
4.4.2 Freezers
4.4.2.1 Market Size by Region, 2023-2033 (US$ Mn)
4.4.2.2 Market Share by Region, 2023 & 2033 (%)
4.4.3 Refrigerators
4.4.3.1 Market Size by Region, 2023-2033 (US$ Mn)
4.4.3.2 Market Share by Region, 2023 & 2033 (%)
4.4.4 Consumables
4.4.4.1 Market Size by Region, 2023-2033 (US$ Mn)
4.4.4.2 Market Share by Region, 2023 & 2033 (%)
4.4.5 Liquid Nitrogen
4.4.5.1 Market Size by Region, 2023-2033 (US$ Mn)
4.4.5.2 Market Share by Region, 2023 & 2033 (%)
4.5 Media
4.5.1 Biopreservation Market Forecast by Media, 2023-2033 (US$ Mn)
4.5.1.1 Market Size by Region, 2023-2033 (US$ Mn)
4.5.1.2 Market Share by Region, 2023 & 2033 (%)
4.5.2 Pre-formulated
4.5.2.1 Market Size by Region, 2023-2033 (US$ Mn)
4.5.2.2 Market Share by Region, 2023 & 2033 (%)
4.5.3 Home-brew
4.5.3.1 Market Size by Region, 2023-2033 (US$ Mn)
4.5.3.2 Market Share by Region, 2023 & 2033 (%)
4.6 Laboratory Information Management Systems (LIMS)
4.6.1 Market Size by Region, 2023-2033 (US$ Mn)
4.6.2 Market Share by Region, 2023 & 2033 (%)
5 Biopreservation Market Analysis by Application
5.1 Key Findings
5.2 Application Segment: Market Attractiveness Index
5.3 Biopreservation Market Size Estimation and Forecast by Application
5.4 Regenerative Medicine
5.4.1 Biopreservation Market Forecast by Regenerative Medicine, 2023-2033 (US$ Mn)
5.4.1.1 Market Size by Region, 2023-2033 (US$ Mn)
5.4.1.2 Market Share by Region, 2023 & 2033 (%)
5.4.2 Cell Therapy
5.4.2.1 Market Size by Region, 2023-2033 (US$ Mn)
5.4.2.2 Market Share by Region, 2023 & 2033 (%)
5.4.3 Gene Therapy
5.4.3.1 Market Size by Region, 2023-2033 (US$ Mn)
5.4.3.2 Market Share by Region, 2023 & 2033 (%)
5.4.4 Others
5.4.4.1 Market Size by Region, 2023-2033 (US$ Mn)
5.4.4.2 Market Share by Region, 2023 & 2033 (%)
5.5 Biobanking
5.5.1 Biopreservation Market Forecast by Biobanking, 2023-2033 (US$ Mn)
5.5.1.1 Market Size by Region, 2023-2033 (US$ Mn)
5.5.1.2 Market Share by Region, 2023 & 2033 (%)
5.5.2 Human Eggs
5.5.2.1 Market Size by Region, 2023-2033 (US$ Mn)
5.5.2.2 Market Share by Region, 2023 & 2033 (%)
5.5.3 Human Sperm
5.5.3.1 Market Size by Region, 2023-2033 (US$ Mn)
5.5.3.2 Market Share by Region, 2023 & 2033 (%)
5.5.4 Veterinary IVF
5.5.4.1 Market Size by Region, 2023-2033 (US$ Mn)
5.5.4.2 Market Share by Region, 2023 & 2033 (%)
5.6 Drug Discovery
5.6.1 Market Size by Region, 2023-2033 (US$ Mn)
5.6.2 Market Share by Region, 2023 & 2033 (%)
6 Biopreservation Market Analysis by Cell Provider
6.1 Key Findings
6.2 Cell Provider Segment: Market Attractiveness Index
6.3 Biopreservation Market Size Estimation and Forecast by Cell Provider
6.4 CD34+
6.4.1 Market Size by Region, 2023-2033 (US$ Mn)
6.4.2 Market Share by Region, 2023 & 2033 (%)
6.5 CD19+
6.5.1 Market Size by Region, 2023-2033 (US$ Mn)
6.5.2 Market Share by Region, 2023 & 2033 (%)
6.6 MSC (Mesenchymal stem cells)
6.6.1 Market Size by Region, 2023-2033 (US$ Mn)
6.6.2 Market Share by Region, 2023 & 2033 (%)
6.7 iPSC (Induced Pluripotent Stem Cells)
6.7.1 Market Size by Region, 2023-2033 (US$ Mn)
6.7.2 Market Share by Region, 2023 & 2033 (%)
6.8 hESC (Human embryonic stem cells)
6.8.1 Market Size by Region, 2023-2033 (US$ Mn)
6.8.2 Market Share by Region, 2023 & 2033 (%)
6.9 Tumor Cells
6.9.1 Market Size by Region, 2023-2033 (US$ Mn)
6.9.2 Market Share by Region, 2023 & 2033 (%)
6.10 Others
6.10.1 Market Size by Region, 2023-2033 (US$ Mn)
6.10.2 Market Share by Region, 2023 & 2033 (%)
7 Biopreservation Market Analysis by Region
7.1 Key Findings
7.2 Regional Segment: Market Attractiveness Index
7.3 Biopreservation Market Size Estimation and Forecast
8 North America Biopreservation Market Analysis
8.1 Key Findings
8.2 North America Biopreservation Market Attractiveness Index
8.3 North America Biopreservation Market by Country, 2023, 2028 & 2033 (US$ Mn)
8.4 North America Biopreservation Market Size Estimation and Forecast by Country
8.5 North America Biopreservation Market Size Estimation and Forecast by Product
8.6 North America Biopreservation Market Size Estimation and Forecast by Application
8.7 North America Biopreservation Market Size Estimation and Forecast by Cell Provider
8.8 U.S. Biopreservation Market Analysis
8.9 Canada Biopreservation Market Analysis
9 Europe Biopreservation Market Analysis
9.1 Key Findings
9.2 Europe Biopreservation Market Attractiveness Index
9.3 Europe Biopreservation Market by Country, 2023, 2028 & 2033 (US$ Mn)
9.4 Europe Biopreservation Market Size Estimation and Forecast by Country
9.5 Europe Biopreservation Market Size Estimation and Forecast by Product
9.6 Europe Biopreservation Market Size Estimation and Forecast by Application
9.7 Europe Biopreservation Market Size Estimation and Forecast by Cell Provider
9.8 Germany Biopreservation Market Analysis
9.9 France Biopreservation Market Analysis
9.10 UK Biopreservation Market Analysis
9.11 Italy Biopreservation Market Analysis
9.12 Spain Biopreservation Market Analysis
9.13 Russia Biopreservation Market Analysis
9.14 Rest of Europe Biopreservation Market Analysis
10 Asia Pacific Biopreservation Market Analysis
10.1 Key Findings
10.2 Asia Pacific Biopreservation Market Attractiveness Index
10.3 Asia Pacific Biopreservation Market by Country, 2023, 2028 & 2033 (US$ Mn)
10.4 Asia Pacific Biopreservation Market Size Estimation and Forecast by Country
10.5 Asia Pacific Biopreservation Market Size Estimation and Forecast by Product
10.6 Asia Pacific Biopreservation Market Size Estimation and Forecast by Application
10.7 Asia Pacific Biopreservation Market Size Estimation and Forecast by Cell Provider
10.8 Japan Biopreservation Market Analysis
10.9 China Biopreservation Market Analysis
10.10 India Biopreservation Market Analysis
10.11 Australia Biopreservation Market Analysis
10.12 South Korea Biopreservation Market Analysis
10.13 Rest of Asia Pacific Biopreservation Market Analysis
11 Latin America Biopreservation Market Analysis
11.1 Key Findings
11.2 Latin America Biopreservation Market Attractiveness Index
11.3 Latin America Biopreservation Market by Country, 2023, 2028 & 2033 (US$ Mn)
11.4 Latin America Biopreservation Market Size Estimation and Forecast by Country
11.5 Latin America Biopreservation Market Size Estimation and Forecast by Product
11.6 Latin America Biopreservation Market Size Estimation and Forecast by Application
11.7 Latin America Biopreservation Market Size Estimation and Forecast by Cell Provider
11.8 Brazil Biopreservation Market Analysis
11.9 Mexico Biopreservation Market Analysis
11.10 Rest of Latin America Biopreservation Market Analysis
12 MEA Biopreservation Market Analysis
12.1 Key Findings
12.2 MEA Biopreservation Market Attractiveness Index
12.3 MEA Biopreservation Market by Country, 2023, 2028 & 2033 (US$ Mn)
12.4 MEA Biopreservation Market Size Estimation and Forecast by Country
12.5 MEA Biopreservation Market Size Estimation and Forecast by Product
12.6 MEA Biopreservation Market Size Estimation and Forecast by Application
12.7 MEA Biopreservation Market Size Estimation and Forecast by Cell Provider
12.8 GCC Biopreservation Market Analysis
12.9 South Africa Biopreservation Market Analysis
12.10 Rest of MEA Biopreservation Market Analysis
13 Company Profiles
13.1 Company Share Analysis, 2022
13.1.1 Thermo Fisher Scientific Inc.
13.1.2 PHC Holdings Corporation
13.1.3 VWR International (Avantor, Inc.)
13.2 Arctiko
13.2.1 Company Snapshot
13.2.2 Company Overview
13.2.3 Product Benchmarking
13.2.4 Strategic Outlook
13.3 Azenta, Inc.
13.3.1 Company Snapshot
13.3.2 Company Overview
13.3.3 Financial Analysis
13.3.3.1 Net Revenue, 2017-2021
13.3.3.2 R&D, 2017-2021
13.3.3.3 Regional Market Shares, 2021
13.3.4 Product Benchmarking
13.3.5 Strategic Outlook
13.4 BioLife Solutions Inc.
13.4.1 Company Snapshot
13.4.2 Company Overview
13.4.3 Financial Analysis
13.4.3.1 Net Revenue, 2017-2021
13.4.3.2 R&D, 2017-2021
13.4.3.3 Regional Market Shares, 2021
13.4.4 Product Benchmarking
13.4.5 Strategic Outlook
13.5 Biomatrica, Inc. (Exact Sciences)
13.5.1 Company Snapshot
13.5.2 Company Overview
13.5.3 Product Benchmarking
13.6 Cryoport Systems, LLC
13.6.1 Company Snapshot
13.6.2 Company Overview
13.6.3 Financial Analysis
13.6.3.1 Net Revenue, 2017-2021
13.6.3.2 R&D, 2017-2021
13.6.3.3 Regional Market Shares, 2021
13.6.4 Product Benchmarking
13.6.5 Strategic Outlook
13.7 Eppendorf SE
13.7.1 Company Snapshot
13.7.2 Company Overview
13.7.3 Financial Analysis
13.7.3.1 Net Revenue, 2017-2021
13.7.3.2 R&D, 2017-2021
13.7.3.3 Regional Market Shares, 2021
13.7.4 Product Benchmarking
13.7.5 Strategic Outlook
13.8 Helmer Scientific Inc.
13.8.1 Company Snapshot
13.8.2 Company Overview
13.8.3 Product Benchmarking
13.8.4 Strategic Outlook
13.9 Merck KGaA
13.9.1 Company Snapshot
13.9.2 Company Overview
13.9.3 Financial Analysis
13.9.3.1 Net Revenue, 2017-2021
13.9.3.2 R&D, 2017-2021
13.9.3.3 Regional Market Shares, 2021
13.9.4 Product Benchmarking
13.9.5 Strategic Outlook
13.10 PHC Holdings Corporation
13.10.1 Company Snapshot
13.10.2 Company Overview
13.10.3 Financial Analysis
13.10.3.1 Net Revenue, 2017-2021
13.10.3.2 R&D, 2017-2021
13.10.3.3 Regional Market Shares, 2021
13.10.4 Product Benchmarking
13.10.5 Strategic Outlook
13.11 QIAGEN
13.11.1 Company Snapshot
13.11.2 Company Overview
13.11.3 Financial Analysis
13.11.3.1 Net Revenue, 2017-2022
13.11.3.2 R&D, 2017-2022
13.11.3.3 Regional Market Shares, 2022
13.11.4 Product Benchmarking
13.11.5 Strategic Outlook
13.12 Taylor-Wharton
13.12.1 Company Snapshot
13.12.2 Company Overview
13.12.3 Product Benchmarking
13.13 Thermo Fisher Scientific Inc.
13.13.1 Company Snapshot
13.13.2 Company Overview
13.13.3 Financial Analysis
13.13.3.1 Net Revenue, 2017-2021
13.13.3.2 R&D, 2017-2021
13.13.3.3 Regional Market Shares, 2021
13.13.4 Product Benchmarking
13.13.5 Strategic Outlook
13.14 VWR International, LLC (Avantor)
13.14.1 Company Snapshot
13.14.2 Company Overview
13.14.3 Financial Analysis
13.14.3.1 Net Revenue, 2017-2021
13.14.3.2 R&D, 2017-2021
13.14.3.3 Regional Market Shares, 2021
13.14.4 Product Benchmarking
14 Conclusion and Recommendations
14.1 Concluding Remarks from Visiongain
14.2 Recommendations for Market Players
List of Tables
Table 1 Biopreservation Market Snapshot, 2023 & 2033 (US$ million, CAGR %)
Table 2 Biopreservation Market by Region, 2023-2033 (US$ Mn, AGR (%), CAGR (%)): “V” Shaped Recovery Scenario
Table 3 Biopreservation Market by Region, 2023-2033 (US$ Mn, AGR (%), CAGR (%)): “U” Shaped Recovery Scenario
Table 4 Biopreservation Market by Region, 2023-2033 (US$ Mn, AGR (%), CAGR (%)): “W” Shaped Recovery Scenario
Table 5 Biopreservation Market by Region, 2023-2033 (US$ Mn, AGR (%), CAGR (%)): “L” Shaped Recovery Scenario
Table 6 Biopreservation Market by Product, 2023-2033 (US$ Mn, AGR (%), CAGR (%))
Table 7 Biopreservation Market Forecast by Equipment, 2023-2033 (US$ Mn, AGR (%), CAGR (%))
Table 8 Equipment Segment Market Forecast by Region, 2023-2033 (US$ Mn, AGR%, CAGR%)
Table 9 Freezers Segment Market Forecast by Region, 2023-2033 (US$ Mn, AGR%, CAGR%)
Table 10 Refrigerators Segment Market Forecast by Region, 2023-2033 (US$ Mn, AGR%, CAGR%)
Table 11 Consumables Segment Market Forecast by Region, 2023-2033 (US$ Mn, AGR%, CAGR%)
Table 12 Liquid Nitrogen Segment Market Forecast by Region, 2023-2033 (US$ Mn, AGR%, CAGR%)
Table 13 Biopreservation Segment Market Forecast by Media, 2023-2033 (US$ Mn, AGR (%), CAGR (%))
Table 14 Media Segment Market Forecast by Region, 2023-2033 (US$ Mn, AGR%, CAGR%)
Table 15 Pre-formulated Segment Market Forecast by Region, 2023-2033 (US$ Mn, AGR%, CAGR%)
Table 16 Home-brew Segment Market Forecast by Region, 2023-2033 (US$ Mn, AGR%, CAGR%)
Table 17 Laboratory information management systems (LIMS) Segment Market Forecast by Region, 2023-2033 (US$ Mn, AGR%, CAGR%)
Table 18 Biopreservation Market Forecast by Application, 2023-2033 (US$ Mn, AGR (%), CAGR (%))
Table 19 Biopreservation Market Forecast by Regenerative Medicine, 2023-2033 (US$ Mn, AGR (%), CAGR (%))
Table 20 Regenerative Medicine Segment Market Forecast by Region, 2023-2033 (US$ Mn, AGR%, CAGR%)
Table 21 Cell Therapy Segment Market Forecast by Region, 2023-2033 (US$ Mn, AGR%, CAGR%)
Table 22 Gene Therapy Segment Market Forecast by Region, 2023-2033 (US$ Mn, AGR%, CAGR%)
Table 23 Others Segment Market Forecast by Region, 2023-2033 (US$ Mn, AGR%, CAGR%)
Table 24 Biopreservation Segment Market Forecast by Biobanking, 2023-2033 (US$ Mn, AGR (%), CAGR (%))
Table 25 Biobanking Segment Market Forecast by Region, 2023-2033 (US$ Mn, AGR%, CAGR%)
Table 26 Human Eggs Segment Market Forecast by Region, 2023-2033 (US$ Mn, AGR%, CAGR%)
Table 27 Human Sperm Segment Market Forecast by Region, 2023-2033 (US$ Mn, AGR%, CAGR%)
Table 28 Veterinary IVF Segment Market Forecast by Region, 2023-2033 (US$ Mn, AGR%, CAGR%)
Table 29 Drug Discovery Segment Market Forecast by Region, 2023-2033 (US$ Mn, AGR%, CAGR%)
Table 30 Biopreservation Market Size Estimation and Forecast by Cell Provider, 2023-2033 (US$ Mn, AGR (%), CAGR (%))
Table 31 CD34+ Segment Market Forecast by Region, 2023-2033 (US$ Mn, AGR%, CAGR%)
Table 32 CD19+ Segment Market Forecast by Region, 2023-2033 (US$ Mn, AGR%, CAGR%)
Table 33 MSC Segment Market Forecast by Region, 2023-2033 (US$ Mn, AGR%, CAGR%)
Table 34 iPSC Segment Market Forecast by Region, 2023-2033 (US$ Mn, AGR%, CAGR%)
Table 35 hESC Segment Market Forecast by Region, 2023-2033 (US$ Mn, AGR%, CAGR%)
Table 36 Tumor Cells Segment Market Forecast by Region, 2023-2033 (US$ Mn, AGR%, CAGR%)
Table 37 Others Segment Market Forecast by Region, 2023-2033 (US$ Mn, AGR%, CAGR%)
Table 38 Biopreservation Market by Region, 2023-2033 (US$ Mn, AGR (%), CAGR (%))
Table 39 North America Biopreservation Market Forecast by Country
Table 40 North America Biopreservation Market Forecast by Product, 2023-2033 (US$ Mn, AGR (%), CAGR (%))
Table 41 North America Biopreservation Market Forecast by Application, 2023-2033 (US$ Mn, AGR (%), CAGR (%))
Table 42 North America Biopreservation Market Forecast by Cell Provider, 2023-2033 (US$ Mn, AGR (%), CAGR (%))
Table 43 U.S. Biopreservation Market Forecast, 2023-2033 (US$ Mn, AGR %, CAGR %)
Table 44 Canada Biopreservation Market Forecast, 2023-2033 (US$ Mn, AGR %, CAGR %)
Table 45 Europe Biopreservation Market Forecast by Country, 2023-2033 (US$ Mn, AGR%, CAGR%)
Table 46 Europe Biopreservation Market Forecast by Product, 2023-2033 (US$ Mn, AGR (%), CAGR (%))
Table 47 Europe Biopreservation Market Forecast by Application, 2023-2033 (US$ Mn, AGR (%), CAGR (%))
Table 48 Europe Biopreservation Market Forecast by Cell Provider, 2023-2033 (US$ Mn, AGR (%), CAGR (%))
Table 49 Germany Biopreservation Market Forecast, 2023-2033 (US$ Mn, AGR%, CAGR%)
Table 50 France Biopreservation Market Forecast, 2023-2033 (US$ Mn, AGR%, CAGR%)
Table 51 UK Biopreservation Market Forecast, 2023-2033 (US$ Mn, AGR%, CAGR%)
Table 52 Italy Biopreservation Market Forecast, 2023-2033 (US$ Mn, AGR%, CAGR%)
Table 53 Spain Biopreservation Market Forecast, 2023-2033 (US$ Mn, AGR%, CAGR%)
Table 54 Russia Biopreservation Market Forecast, 2023-2033 (US$ Mn, AGR%, CAGR%)
Table 55 Rest of Europe Biopreservation Market Forecast, 2023-2033 (US$ Mn, AGR%, CAGR%)
Table 56 Asia Pacific Biopreservation Market forecast by Country 2023-2033 (US$ Mn, AGR%, CAGR%)
Table 57 Biopreservation Market Forecast by Product, 2023-2033 (US$ Mn, AGR (%), CAGR (%))
Table 58 Asia Pacific Biopreservation Market Forecast by Application, 2023-2033 (US$ Mn, AGR (%), CAGR (%))
Table 59 Asia Pacific Biopreservation Market Forecast by Cell Provider, 2023-2033 (US$ Mn, AGR (%), CAGR (%))
Table 60 Japan Biopreservation Market Forecast, 2023-2033 (US$ million, AGR %)
Table 61 China Biopreservation Market Forecast, 2023-2033 (US$ Mn, AGR%, CAGR%)
Table 62 India Biopreservation Market Forecast, 2023-2033 (US$ Mn, AGR%, CAGR%)
Table 63 Australia Biopreservation Market Forecast, 2023-2033 (US$ Mn, AGR%, CAGR%)
Table 64 South Korea Biopreservation Market Forecast, 2023-2033 (US$ million, AGR %)
Table 65 Rest of Asia Pacific Biopreservation Market Forecast, 2023-2033 (US$ Mn, AGR%, CAGR%)
Table 66 Latin America Biopreservation Drugs Forecast, 2023-2033 (US$ Mn, AGR%, CAGR%)
Table 67 Latin America Biopreservation Market Forecast by Product, 2023-2033 (US$ Mn, AGR (%), CAGR (%))
Table 68 Latin America Biopreservation Market Forecast by Application, 2023-2033 (US$ Mn, AGR (%), CAGR (%))
Table 69 Latin America Biopreservation Market Forecast by Cell Provider, 2023-2033 (US$ Mn, AGR (%), CAGR (%))
Table 70 Brazil Biopreservation Market Forecast, 2023-2033 (US$ Mn, AGR%, CAGR%)
Table 71 Mexico Biopreservation Market Forecast, 2023-2033 (US$ Mn, AGR%, CAGR%)
Table 72 Rest of Latin America Biopreservation Drugs Forecast, 2023-2033 (US$ Mn, AGR%, CAGR%)
Table 73 MEA Biopreservation Drugs forecast by Country 2023-2033 (US$ Mn, AGR%, CAGR%)
Table 74 MEA Biopreservation Market Forecast by Product, 2023-2033 (US$ Mn, AGR (%), CAGR (%))
Table 75 MEA Biopreservation Market Forecast by Application, 2023-2033 (US$ Mn, AGR (%), CAGR (%))
Table 76 MEA Biopreservation Market Forecast by Cell Provider, 2023-2033 (US$ Mn, AGR (%), CAGR (%))
Table 77 GCC Biopreservation Market Forecast, 2023-2033 (US$ Mn, AGR%, CAGR%)
Table 78 South Africa Biopreservation Market Forecast, 2023-2033 (US$ Mn, AGR%, CAGR%)
Table 79 Rest of MEA Biopreservation Market Forecast, 2023-2033 (US$ Mn, AGR%, CAGR%)
Table 80 Arctiko: Key Details, (CEO, HQ, Revenue, Founded, No. of Employees, Company Type, Website, Business Segment)
Table 81 Arctiko: Product Benchmarking
Table 82 Arctiko: Strategic Outlook
Table 83 Azenta, Inc.: Key Details, (CEO, HQ, Revenue, Founded, No. of Employees, Company Type, Website, Business Segment)
Table 84 Azenta, Inc.: Product Benchmarking
Table 85 Azenta, Inc.: Strategic Outlook
Table 86 BioLife Solutions Inc.: Key Details, (CEO, HQ, Revenue, Founded, No. of Employees, Company Type, Website, Business Segment)
Table 87 BioLife Solutions, Inc.: Product Benchmarking
Table 88 BioLife Solutions, Inc.: Strategic Outlook
Table 89 Biomatrica, Inc. (Exact Sciences): Key Details, (CEO, HQ, Revenue, Founded, No. of Employees, Company Type, Website, Business Segment)
Table 90 Biomatrica, Inc. (Exact Sciences): Product Benchmarking
Table 91 Cryoport Systems, LLC: Key Details, (CEO, HQ, Revenue, Founded, No. of Employees, Company Type, Website, Business Segment)
Table 92 Cryoport LLC: Product Benchmarking
Table 93 Cryoport LLC: Strategic Outlook
Table 94 Eppendorf SE: Key Details, (CEO, HQ, Revenue, Founded, No. of Employees, Company Type, Website, Business Segment)
Table 95 Eppendorf SE: Product Benchmarking
Table 96 Eppendorf SE: Strategic Outlook
Table 97 Helmer Scientific Inc.: Key Details, (CEO, HQ, Revenue, Founded, No. of Employees, Company Type, Website, Business Segment)
Table 98 Helmer Scientific Inc.: Product Benchmarking
Table 99 Helmer Scientific: Strategic Outlook
Table 100 Merck KGaA: Key Details, (CEO, HQ, Revenue, Founded, No. of Employees, Company Type, Website, Business Segment)
Table 101 Merck KGaA: Product Benchmarking
Table 102 Merck KGaA: Strategic Outlook
Table 103 PHC Holdings Corporation: (CEO, HQ, Revenue, Founded, No. of Employees, Company Type, Website, Business Segment)
Table 104 PHC Holdings Corporation: Product Benchmarking
Table 105 PHC Holdings Corporation: Strategic Outlook
Table 106 QIAGEN :(CEO, HQ, Revenue, Founded, No. of Employees, Company Type, Website, Business Segment)
Table 107 QIAGEN: Product Benchmarking
Table 108 QIAGEN: Strategic Outlook
Table 109 Taylor-Wharton: (CEO, HQ, Revenue, Founded, No. of Employees, Company Type, Website, Business Segment)
Table 110 Taylor-Wharton: Product Benchmarking
Table 111 Thermo Fisher Scientific Inc. :(CEO, HQ, Revenue, Founded, No. of Employees, Company Type, Website, Business Segment)
Table 112 Thermo Fisher Scientific Inc.: Product Benchmarking
Table 113 Thermo Fisher Scientific Inc..: Strategic Outlook
Table 114 VWR International, LLC (Avantor):(CEO, HQ, Revenue, Founded, No. of Employees, Company Type, Website, Business Segment)
Table 115 VWR International, LLC (Avantor): Product Benchmarking
List of Figures
Figure 1 Biopreservation Market Segmentation
Figure 2 Biopreservation Market by Product: Market Attractiveness Index
Figure 3 Biopreservation Market Attractiveness Index by Application
Figure 4 Biopreservation Market Attractiveness Index by Cell Provider
Figure 5 Biopreservation Market Attractiveness Index by Region
Figure 6 Biopreservation Market: Market Dynamics
Figure 7 COVID Impact Analysis: Biopreservation Market Recovery Scenarios
Figure 8 Biopreservation Market by Region, 2023-2033 (US$ Mn, AGR (%), CAGR (%)): “V” Shaped Recovery
Figure 9 Biopreservation Market by Region, 2023-2033 (US$ Mn, AGR (%), CAGR (%)): “U” Shaped Recovery
Figure 10 Biopreservation Market by Region, 2023-2033 (US$ Mn, AGR (%), CAGR (%)): “W” Shaped Recovery
Figure 11 Biopreservation Market by Region, 2023-2033 (US$ Mn, AGR (%), CAGR (%)): “L” Shaped Recovery
Figure 12 Biopreservation Market: Porter’s Five Forces Analysis
Figure 13 Biopreservation Market: PEST Analysis
Figure 14 Biopreservation Market by Product: Market Attractiveness Index
Figure 15 Biopreservation Market Forecast by Product, 2023-2033 (US$ million)
Figure 16 Biopreservation Market Share Forecast by Product, 2023-2033 (%)
Figure 17 Equipment Market Forecast by Region, 2023-2033 (US$ million)
Figure 18 Equipment Segment Market Share Forecast by Region, 2023 & 2033 (%)
Figure 19 Freezers Segment Market Forecast by Region, 2023-2033 (US$ million)
Figure 20 Freezers Segment Market Share Forecast by Region, 2023 & 2033 (%)
Figure 21 Refrigerators Segment Market Forecast by Region, 2023-2033 (US$ million)
Figure 22 Refrigerators Segment Market Share Forecast by Region, 2023 & 2033 (%)
Figure 23 Consumables Segment Market Forecast by Region, 2023-2033 (US$ million)
Figure 24 Consumables Segment Market Share Forecast by Region, 2023 & 2033 (%)
Figure 25 Liquid Nitrogen Segment Market Forecast by Region, 2023-2033 (US$ million)
Figure 26 Liquid Nitrogen Segment Market Share Forecast by Region, 2023 & 2033 (%)
Figure 27 Media Segment Market Forecast by Region, 2023-2033 (US$ million)
Figure 28 Media Segment Market Share Forecast by Region, 2023 & 2033 (%)
Figure 29 Pre-formulated Segment Market Forecast by Region, 2023-2033 (US$ million)
Figure 30 Pre-formulated Segment Market Share Forecast by Region, 2023 & 2033 (%)
Figure 31 Home-brew Segment Market Forecast by Region, 2023-2033 (US$ million)
Figure 32 Home-brew Segment Market Share Forecast by Region, 2023 & 2033 (%)
Figure 33 Laboratory information management systems (LIMS) Segment Market Forecast by Region, 2023-2033 (US$ million)
Figure 34 Laboratory Information Management Systems (LIMS) Segment Market Share Forecast by Region, 2023 & 2033 (%)
Figure 35 Biopreservation Market by Application: Market Attractiveness Index
Figure 36 Biopreservation Market Forecast by Application, 2023-2033 (US$ million)
Figure 37 Biopreservation Market Share Forecast by Application, 2023-2033 (%)
Figure 38 Regenerative Medicine Segment Market Forecast by Region, 2023-2033 (US$ million)
Figure 39 Regenerative Medicine Segment Market Share Forecast by Region, 2023 & 2033 (%)
Figure 40 Cell Therapy Segment Market Forecast by Region, 2023-2033 (US$ million)
Figure 41 Cell Therapy Segment Market Share Forecast by Region, 2023 & 2033 (%)
Figure 42 Gene Therapy Segment Market Forecast by Region, 2023-2033 (US$ million)
Figure 43 Gene Therapy Segment Market Share Forecast by Region, 2023 & 2033 (%)
Figure 44 Others Segment Market Forecast by Region, 2023-2033 (US$ million)
Figure 45 Others Segment Market Share Forecast by Region, 2023 & 2033 (%)
Figure 46 Biobanking Segment Market Forecast by Region, 2023-2033 (US$ million)
Figure 47 Biobanking Segment Market Share Forecast by Region, 2023 & 2033 (%)
Figure 48 Human Eggs Segment Market Forecast by Region, 2023-2033 (US$ million)
Figure 49 Human Eggs Segment Market Share Forecast by Region, 2023 & 2033 (%)
Figure 50 Human Sperm Segment Market Forecast by Region, 2023-2033 (US$ million)
Figure 51 Human Sperm Segment Market Share Forecast by Region, 2023 & 2033 (%)
Figure 52 Veterinary IVF Segment Market Forecast by Region, 2023-2033 (US$ million)
Figure 53 Veterinary IVF Segment Market Share Forecast by Region, 2023 & 2033 (%)
Figure 54 Drug Discovery Segment Market Forecast by Region, 2023-2033 (US$ million)
Figure 55 Drug Discovery Segment Market Share Forecast by Region, 2023 & 2033 (%)
Figure 56 Biopreservation Market by Cell Provider: Market Attractiveness Index
Figure 57 Biopreservation Market Forecast by Cell Provider, 2023-2033 (US$ million)
Figure 58 Biopreservation Market Share Forecast by Cell Provider, 2023-2033 (%)
Figure 59 CD34+ Segment Market Forecast by Region, 2023-2033 (US$ million)
Figure 60 CD34+ Segment Market Share Forecast by Region, 2023 & 2033 (%)
Figure 61 CD19+ Segment Market Forecast by Region, 2023-2033 (US$ million)
Figure 62 CD19+ Segment Market Share Forecast by Region, 2023 & 2033 (%)
Figure 63 MSC Segment Market Forecast by Region, 2023-2033 (US$ million)
Figure 64 MSC Segment Market Share Forecast by Region, 2023 & 2033 (%)
Figure 65 iPSC Segment Market Forecast by Region, 2023-2033 (US$ million)
Figure 66 iPSC Segment Market Share Forecast by Region, 2023 & 2033 (%)
Figure 67 hESC Segment Market Forecast by Region, 2023-2033 (US$ million)
Figure 68 hESC Segment Market Share Forecast by Region, 2023 & 2033 (%)
Figure 69 Tumor Cells Segment Market Forecast by Region, 2023-2033 (US$ million)
Figure 70 Tumor Cells Segment Market Share Forecast by Region, 2023 & 2033 (%)
Figure 71 Others Segment Market Forecast by Region, 2023-2033 (US$ million)
Figure 72 Others Segment Market Share Forecast by Region, 2023 & 2033 (%)
Figure 73 Biopreservation Market by Region: Market Attractiveness Index
Figure 74 Biopreservation Market by Region, 2023-2033 (US$ Mn)
Figure 75 Biopreservation Market Share Forecast by Region 2023, 2033(%)
Figure 76 North America Biopreservation Market Attractiveness Index
Figure 77 North America Biopreservation Market by Region, 2023, 2028 & 2033 (US$ million)
Figure 78 North America Biopreservation Market Forecast by Country, 2023-2033 (US$ million)
Figure 79 North America Biopreservation Market Share Forecast by Country, 2023 & 2033 (%)
Figure 80 North America Biopreservation Market Forecast by Product, 2023-2033 (US$ million)
Figure 81 North America Biopreservation Market Share Forecast by Product, 2023 & 2033 (%)
Figure 82 North America Biopreservation Market Forecast by Application, 2023-2033 (US$ million)
Figure 83 North America Biopreservation Market Share Forecast by Application, 2023 & 2033 (%)
Figure 84 North America Biopreservation Market Forecast by Cell Provider, 2023-2033 (US$ million)
Figure 85 North America Biopreservation Market Share Forecast Cell Provider, 2023 & 2033 (%)
Figure 86 U.S. Biopreservation Market Forecast, 2023-2033 (US$ million, AGR %)
Figure 87 Canada Biopreservation Market Forecast, 2023-2033 (US$ million, AGR %)
Figure 88 Europe Biopreservation Market Attractiveness Index
Figure 89 Europe Biopreservation Market by Region, 2023, 2028 & 2033 (US$ million)
Figure 90 Europe Biopreservation Market Forecast by Country, 2023-2033 (US$ million)
Figure 91 Europe Biopreservation Market Share Forecast by Country, 2023 & 2033 (%)
Figure 92 Europe Biopreservation Market Forecast by Product, 2023-2033 (US$ million)
Figure 93 Europe Biopreservation Market Share Forecast by Product, 2023 & 2033 (%)
Figure 94 Europe Biopreservation Market Forecast by Application, 2023-2033 (US$ million)
Figure 95 Europe Biopreservation Market Share Forecast by Application, 2023 & 2033 (%)
Figure 96 Europe Biopreservation Market Forecast by Cell Provider, 2023-2033 (US$ million)
Figure 97 Europe Biopreservation Market Share Forecast by Cell Provider, 2023 & 2033 (%)
Figure 98 Germany Biopreservation Market Forecast, 2023-2033 (US$ million, AGR %)
Figure 99 France Biopreservation Market Forecast, 2023-2033 (US$ million, AGR %)
Figure 100 UK Biopreservation Market Forecast, 2023-2033 (US$ million, AGR %)
Figure 101 Italy Biopreservation Market Forecast, 2023-2033 (US$ million, AGR %)
Figure 102 Spain Biopreservation Market Forecast, 2023-2033 (US$ million, AGR %)
Figure 103 Russia Biopreservation Market Forecast, 2023-2033 (US$ million, AGR %)
Figure 104 Rest of Europe Biopreservation Market Forecast, 2023-2033 (US$ million, AGR %)
Figure 105 Asia Pacific Biopreservation Market Attractiveness Index
Figure 106 Asia Pacific Biopreservation Market by Region, 2023, 2028 & 2033 (US$ million)
Figure 107 Asia Pacific Biopreservation Market Forecast, 2023-2033 (US$ million, AGR %)
Figure 108 Asia Pacific Biopreservation Market Share Forecast by Country, 2023 & 2033 (%)
Figure 109 Asia Pacific Biopreservation Market Forecast by Product, 2023-2033 (US$ million)
Figure 110 Asia Pacific Biopreservation Market Share Forecast by Product, 2023 & 2033 (%)
Figure 111 Asia Pacific Biopreservation Market Forecast by Application, 2023-2033 (US$ million)
Figure 112 Asia Pacific Biopreservation Market Share Forecast by Application, 2023 & 2033 (%)
Figure 113 Asia Pacific Biopreservation Market Forecast by Cell Provider, 2023-2033 (US$ million)
Figure 114 Asia Pacific Biopreservation Market Share Forecast by Cell Provider, 2023 & 2033 (%)
Figure 115 Japan Biopreservation Market Forecast, 2023-2033 (US$ million, AGR %)
Figure 116 China Biopreservation Market Forecast, 2023-2033 (US$ million, AGR %)
Figure 117 India Biopreservation Market Forecast, 2023-2033 (US$ million, AGR %)
Figure 118 Australia Biopreservation Market Forecast, 2023-2033 (US$ million, AGR %)
Figure 119 South Korea Biopreservation Market Forecast, 2023-2033 (US$ million, AGR %)
Figure 120 Rest of Asia Pacific Biopreservation Market Forecast, 2023-2033 (US$ million, AGR %)
Figure 121 Latin America Biopreservation Market Attractiveness Index
Figure 122 Latin America Biopreservation Market by Country, 2023, 2028 & 2033 (US$ million)
Figure 123 Latin America Biopreservation Market Forecast by Country, 2023-2033 (US$ million)
Figure 124 Latin America Biopreservation Market Share Forecast by Country, 2023 & 2033 (%)
Figure 125 Latin America Biopreservation Market Forecast by Product, 2023-2033 (US$ million)
Figure 126 Latin America Biopreservation Market Share Forecast by Product, 2023 & 2033 (%)
Figure 127 Latin America Biopreservation Market Forecast by Application, 2023-2033 (US$ million)
Figure 128 Latin America Biopreservation Market Share Forecast by Application, 2023 & 2033 (%)
Figure 129 Latin America Biopreservation Market Forecast by Cell Provider, 2023-2033 (US$ million)
Figure 130 Latin America Biopreservation Market Share Forecast by Cell Provider, 2023 & 2033 (%)
Figure 131 Brazil Biopreservation Market Forecast, 2023-2033 (US$ million, AGR %)
Figure 132 Mexico Biopreservation Market Forecast, 2023-2033 (US$ million, AGR %)
Figure 133 Rest of Latin America Biopreservation Market Forecast, 2023-2033 (US$ million, AGR %)
Figure 134 MEA Biopreservation Market Attractiveness Index
Figure 135 MEA Biopreservation Market by Country, 2023, 2028 & 2033 (US$ million)
Figure 136 MEA Biopreservation Market Forecast by Country, 2023-2033 (US$ million)
Figure 137 MEA Biopreservation Market Share Forecast by Country, 2023 & 2033 (%)
Figure 138 MEA Biopreservation Market Forecast by Product, 2023-2033 (US$ million)
Figure 139 MEA Biopreservation Market Share Forecast by Product, 2023 & 2033 (%)
Figure 140 MEA Biopreservation Market Forecast by Application, 2023-2033 (US$ million)
Figure 141 MEA Biopreservation Market Share Forecast by Application, 2023 & 2033 (%)
Figure 142 MEA Biopreservation Market Forecast by Cell Provider, 2023-2033 (US$ million)
Figure 143 MEA Biopreservation Market Share Forecast by Cell Provider, 2023 & 2033 (%)
Figure 144 GCC Biopreservation Market Forecast, 2023-2033 (US$ million, AGR %)
Figure 145 South Africa Biopreservation Market Forecast, 2023-2033 (US$ million, AGR %)
Figure 146 Rest of MEA Biopreservation Market Forecast, 2023-2033 (US$ million, AGR %)
Figure 147 Company Share Analysis, 2022
Figure 148 Azenta, Inc.: Net Revenue, 2017-2021 (US$ million, AGR%)
Figure 149 Azenta, Inc.: R&D, 2017-2021 (US$ million, AGR%)
Figure 150 Azenta, Inc.: Regional Market Shares, 2022
Figure 151 BioLife Solutions, Inc.: Net Revenue, 2017-2021 (US$ million, AGR%)
Figure 152 BioLife Solutions, Inc.: R&D, 2017-2021 (US$ million, AGR%)
Figure 153 BioLife Solutions, Inc.: Regional Market Shares, 2021
Figure 154 Cryoport Systems, LLC: Net Revenue, 2017-2021 (US$ million, AGR%)
Figure 155 Cryoport Systems, LLC: R&D, 2017-2021 (US$ million, AGR%)
Figure 156 Cryoport Systems, LLC: Regional Market Shares, 2021
Figure 157 Eppendorf SE: Net Revenue, 2017-2021 (US$ million, AGR%)
Figure 158 Eppendorf SE: R&D, 2017-2021 (US$ million, AGR%)
Figure 159 Eppendorf SE: Regional Market Shares, 2021
Figure 160 Merck KGaA: Net Revenue, 2017-2021 (US$ million, AGR%)
Figure 161 Merck KGaA: R&D, 2017-2021 (US$ million, AGR%)
Figure 162 Merck KGaA: Regional Market Shares, 2021
Figure 163 PHC Holdings Corporation.: Net Revenue, 2017-2021 (US$ million, AGR%)
Figure 164 PHC Holdings Corporation.: R&D, 2017-2021 (US$ million, AGR%)
Figure 165 PHC Holdings Corporation: Regional Market Shares, 2021
Figure 166 QIAGEN.: Net Revenue, 2017-2022 (US$ million, AGR%)
Figure 167 QIAGEN.: R&D, 2017-2022 (US$ million, AGR%)
Figure 168 QIAGEN: Regional Market Shares, 2022
Figure 169 Thermo Fisher Scientific Inc.: Net Revenue, 2017-2021 (US$ million, AGR%)
Figure 170 Thermo Fisher Scientific Inc.: R&D, 2017-2021 (US$ million, AGR%)
Figure 171 Thermo Fisher Scientific Inc: Regional Market Shares, 2021
Figure 172 VWR International LLC (Avantor): Net Revenue, 2017-2021 (US$ million, AGR%)
Figure 173 VWR International, LLC (Avantor).: R&D, 2017-2021 (US$ million, AGR%)
Figure 174 VWR International, LLC (Avantor): Regional Market Shares, 2021
ページTOPに戻る
Visiongain社のヘルスケアと医薬・化学品分野での最新刊レポート
本レポートと同じKEY WORD()の最新刊レポート
- 本レポートと同じKEY WORDの最新刊レポートはありません。
よくあるご質問
Visiongain社はどのような調査会社ですか?
英国の調査会社ヴィジョンゲイン社(Visiongain)は、通信とエネルギーのほか、自動車や化学・医薬品、金属など、広範な市場を対象に調査を行っています。自動車市場については、市場全般に関する調査のほ... もっと見る
調査レポートの納品までの日数はどの程度ですか?
在庫のあるものは速納となりますが、平均的には 3-4日と見て下さい。
但し、一部の調査レポートでは、発注を受けた段階で内容更新をして納品をする場合もあります。
発注をする前のお問合せをお願いします。
注文の手続きはどのようになっていますか?
1)お客様からの御問い合わせをいただきます。
2)見積書やサンプルの提示をいたします。
3)お客様指定、もしくは弊社の発注書をメール添付にて発送してください。
4)データリソース社からレポート発行元の調査会社へ納品手配します。
5) 調査会社からお客様へ納品されます。最近は、pdfにてのメール納品が大半です。
お支払方法の方法はどのようになっていますか?
納品と同時にデータリソース社よりお客様へ請求書(必要に応じて納品書も)を発送いたします。
お客様よりデータリソース社へ(通常は円払い)の御振り込みをお願いします。
請求書は、納品日の日付で発行しますので、翌月最終営業日までの当社指定口座への振込みをお願いします。振込み手数料は御社負担にてお願いします。
お客様の御支払い条件が60日以上の場合は御相談ください。
尚、初めてのお取引先や個人の場合、前払いをお願いすることもあります。ご了承のほど、お願いします。
データリソース社はどのような会社ですか?
当社は、世界各国の主要調査会社・レポート出版社と提携し、世界各国の市場調査レポートや技術動向レポートなどを日本国内の企業・公官庁及び教育研究機関に提供しております。
世界各国の「市場・技術・法規制などの」実情を調査・収集される時には、データリソース社にご相談ください。
お客様の御要望にあったデータや情報を抽出する為のレポート紹介や調査のアドバイスも致します。
|
|

