再生医療市場レポート:2023-2033
Regenerative Medicine Market Report 2023-2033
レポート詳細
再生医療市場レポート 2023-2033 :本レポートは、新たな収益源の開拓を目指すリーディングカンパニーにとって、業界とその基礎となる力学をより深く理解する上で、非常に貴重なものとな... もっと見る
※上記価格は部署ライセンス(Departmental licence)価格です。
その他の価格についてはデータリソースまでお問合せください。
日本語のページは自動翻訳を利用し作成しています。
実際のレポートは英文のみでご納品いたします。

|
サマリー
レポート詳細
再生医療市場レポート 2023-2033:本レポートは、新たな収益源の開拓を目指すリーディングカンパニーにとって、業界とその基礎となる力学をより深く理解する上で、非常に貴重なものとなるでしょう。また、異業種への進出や新地域での既存事業の拡大を目指す企業にとっても有益なレポートです。
ジョイントベンチャーの増加が市場成長を促進する
組織工学、細胞療法、幹細胞利用における画期的な技術への需要は、慢性疾患の有病率の上昇や臨床試験により増加しています。様々な企業による継続的なジョイントベンチャー、合併、買収、その他の戦略的活動が、再生医療市場の繁栄を支えています。例えば、2022年10月、Vanessa Rodriguez Pares博士と、バイオテクノロジーと貨幣価値に特化したテクノロジー企業であるMeso Numismatics, Inc.(MSSV)は、新しいクリニック施設「STEM LIFE」と提携した。このコラボレーションは、再生医療の高水準の普及を目指すものです。これと同様に、アステラス製薬株式会社とPantherna Therapeutics GmbHは、2022年10月に技術評価契約を締結し、直接リプログラミング(トランス分化)を採用したmRNAベースの再生医療プログラムを作成するための研究を実施した。さらに、2020年10月には、世界最大の製薬企業であるBayerが、スペインのサン・セバスティアン、エディンバラ、パリに事業所を持つ遺伝子治療事業のAsklepios BioPharmaceuticalを、最大40億米ドルの取引で買収しました。このような動きは、再生医療市場の成長ペースに大きな影響を与えます。
製品リコールが市場成長の妨げになる可能性
再生医療は、急速に発展している分野で、損傷した組織や臓器を修復したり置き換えたりするために、様々な技術を使用することが含まれます。このような製品の普及と使用の増加に伴い、再生医療市場では製品回収の事例が発生しています。再生医療市場の成長は、製品回収の増加により阻害される可能性があります。バイオテクノロジー企業は、製品回収のリスクや遺伝子医薬の市場投入などの困難に直面し続けている。例えば、米国の遺伝子治療企業であるBluebird Bio社は、ドイツの保健当局と治療費について合意に至らなかったため、2021年4月に希少血液疾患に対する遺伝子治療をドイツ市場から取り下げた。このリコールは、同社の売上とブランドイメージに影響を与えた。同様に、小規模な企業は、強固なキャッシュフローとブランド認知がないまま事業を行うため、製品リコールによる損失を回復できず、深刻な影響を受けます。
マーケットリサーチレポートを購入する前に、どのような質問をするべきか?
- 再生医療市場はどのように進化しているのか?
- 再生医療市場を牽引し、抑制しているものは何か?
- 各再生医療サブマーケットは予測期間中にどのように成長し、2033年にこれらのサブマーケットが占める収益はどの程度か?
- 2023年から2033年にかけて、各再生医療サブマーケットの市場シェアはどのように推移するのか?
- 2023年から2033年にかけて、市場全体の主な牽引役となるのは何か?
- 主要な再生医療市場はマクロ経済ダイナミクスに広く追随するのか、それとも個々の国別市場が他を凌駕するのか?
- 2033年までに各国市場のシェアはどのように変化し、2033年に市場をリードするのはどの地域か?
- 主要プレイヤーは誰で、予測期間中の見通しはどうなっているのか?
- これらの主要企業の再生医療開発プロジェクトは何か?
- 2023年から2033年の間に、業界はどのように進化していくのでしょうか?現在および今後10年間に実施される再生医療開発プロジェクトにはどのような意味があるのか?
- 再生医療市場をさらに拡大するために、製品の商業化の必要性は高まっているのか?
- 再生医療市場はどこに向かっているのか、そして市場の最前線に立つためにはどうすればよいのか?
- 新製品やサービスラインに対する最適な投資オプションは何か?
- 企業を新たな成長軌道に乗せ、C-suiteに移行させるための重要な展望は何か?
このことが、現在、そして今後10年間の再生医療市場にどのような影響を与えるかを知る必要があります:
- 232ページにわたる本レポートでは、101の表と108のチャート/グラフを独占的に提供します。
- 本レポートでは、業界における主要な収益性の高い分野を取り上げており、今すぐその分野をターゲットにすることができます。
- 世界、地域、国の売上と成長に関する詳細な分析が含まれています。
- 競合他社が成功した主要なトレンド、変化、収益予測をハイライトしています。
本レポートでは、以下の情報を提供します。今後10年間、再生医療市場はどのように発展していくのか、COVID-19の景気後退や景気回復の変動に合わせて、どのように変化していくのか。この市場は、過去10年間のどの時点よりも今が重要です。
2033年までの予測やその他の分析により、商業的な展望を明らかにする。
- 2033年までの収益予測に加え、直近の実績や成長率、市場シェアなど、本調査では
- ビジネスの展望や展開など、独自の分析がご覧いただけます。
- 定性的分析(市場力学、促進要因、機会、阻害要因、課題など)、コスト構造、再生医療の価格上昇の影響、最近の動向などをご覧いただけます。
本レポートでは、COVID-19が業界や貴社にどのような影響を与えるかについて、データ分析および貴重な知見を提供しています。COVID-19の4つの回収パターン、すなわち「V」「L」「W」「U」の回収パターンとその影響について考察しています。
報告書の対象セグメント
製品別
・ 幹細胞治療
- 自家製
- アロジェニック
・ 組織工学
- 足場
- ハイドロゲル
・ 遺伝子治療
・ その他
用途別
・ 再生医療
- オンコロジー
- 皮膚科学
- 筋骨格系
- 神経学
- 心血管系
- 創傷治癒
- 眼科
- その他
世界市場全体およびセグメントの収益予測に加え、5地域および16の主要国市場の収益予測も掲載しています:
北米
- 米国
- カナダ
欧州
- ドイツ
- イギリス
- フランス
- スペイン
- イタリア
- その他の欧州地域
アジア太平洋
- 中国
- 日本
- インド
- オーストラリア
- 韓国
- その他のアジア太平洋地域
ラテンアメリカ
- ブラジル
- メキシコ
- その他の地域 ラテンアメリカ 中南米
MEA
- GCC
- 南アフリカ
- その他のMEA地域
再生医療市場の2023年から2033年にかけての主要企業のプロファイルと、これらの企業のこのセグメントに焦点を当てたいくつかの企業についても報告しています。
主要企業と市場成長の可能性
・ Amgen
・ Anterogen
・ Avita Medical Inc.
・ Bio Solutions. Co. Ltd
・ Bluebird Bio Inc.
・ Bristol Myers Squibb
・ Gilead Sciences, Inc.
・ Integra Life Sciences
・ Misoblast Ltd
・ Novartis AG
・ Organogenesis Inc.
・ Sarepta Therapeutics,Inc
・ Sibino GeneTech Co. Ltd
・ Smith & Nephew plc
・ Terumo BCT
再生医療市場の世界全体の収益、金額ベースで2023年から2033年まで、市場は2023年に591.5億米ドルを突破すると、我々の仕事は計算されます。2033年まで収益が大きく伸びることが予測されます。当社の調査では、最も大きな可能性を秘めた組織を特定しています。彼らの能力、進歩、商業的展望を知ることで、常に先を行くことができるようになります。
再生医療市場、2023年から2033年までのレポートはどのように役立つのでしょうか?
要約すると、232ページのレポートでは、以下のような知識を得ることができます:
- 再生医療市場、2023年から2033年までの収益予測 世界および地域レベルでの製品の種類とアプリケーションの予測 - 業界の展望を発見し、投資と収益のための最も有利な場所を見つけることができます。
- 5つの地域と16の主要国市場の2033年までの収益予測 - 北米、欧州、アジア太平洋、ラテンアメリカ、中東・アフリカの再生医療市場、2023年から2033年までの市場予測をご覧いただけます。また、米国、カナダ、メキシコ、ブラジル、ドイツ、フランス、英国、イタリア、中国、インド、日本、オーストラリアなど著名な経済圏の市場も予測されています。
- 既存企業および市場参入を目指す企業の展望 - 再生医療市場に関わる主要企業の企業プロファイルを含む、2023年から2033年の市場。
独自の予測による定量・定性分析をご覧いただけます。私たちのレポートだけが持つ情報を入手し、貴重なビジネスインテリジェンスとして情報を得ることができます。
他にはない情報
私たちの新しいレポートがあれば、知識に遅れをとったり、チャンスを逃したりする可能性は低くなります。私たちの仕事があなたの研究、分析、意思決定にどのように役立つかをご覧ください。Visiongainの研究は、再生医療市場、2023年から2033年、市場をリードする企業のための商業分析を必要とするすべての人のためのものです。データ、トレンド、予測を見つけることができます。
ページTOPに戻る
目次
目次
1 レポートの概要
1.1 研究の目的
1.2 再生医療市場の紹介
1.3 この報告書がもたらすもの
1.4 本レポートを読むべき理由
1.本分析レポートが回答する5つの重要な質問
1.6 本レポートは誰のためのものなのか?
1.7 方法論
1.7.1 市場の定義
1.7.2 市場評価・予測手法
1.7.3 データバリデーション
1.7.3.1 一次調査
1.7.3.2 セカンダリーリサーチ
1.8 よくある質問(FAQ)
1.9 関連するVisiongainのレポート
1.10 ビジョンゲインについて
2 エグゼクティブサマリー
3 市場概要
3.1 キーファインディング
3.2 マーケットダイナミクス
3.2.1 市場促進要因
3.2.1.1 戦略的な活動やコラボレーションを増やす
3.2.1.2 研究開発プロジェクトの増加
3.2.1.3 政府支援の急増
3.2.2 市場の抑制要因
3.2.2.1 膨大な製品回収数
3.2.2.2 市場における未承認製品について
3.2.3 マーケットオポチュニティ
3.2.3.1 世界の先進国および発展途上国での研究パートナーシップの拡大
3.2.3.2 医学研究の進歩に対する意識の高まり
3.2.3.3 成長する投資と資金調達
3.2.4 .COVID-19の影響度分析
3.3 ポーターのファイブフォース分析
3.3.1 サプライヤーのバーゲニングパワー
3.3.2 バイヤーのバーゲニングパワー
3.3.3 競合他社の対抗馬
3.3.4 代替品による脅威
3.3.5 新規参入の脅威
3.4 PEST分析
4 再生医療市場分析:製品別
4.1 キーファインディング
4.2 製品セグメント:市場魅力度指数
4.3 再生医療の製品別市場規模の推定と予測
4.4 幹細胞治療
4.4.1 幹細胞療法による再生医療市場の予測、2023-2033年(US$ Bn)
4.4.1.1 地域別市場規模、2023-2033年(US$ Bn)
4.4.1.2 2023年&2033年地域別市場シェア(%)
4.5 ティシューエンジニアリング
4.5.1.1 組織工学による再生医療市場の予測(2023-2033年)(US$ Bn)
4.5.1.2 地域別市場規模、2023-2033年(US$ Bn)
4.5.1.3 地域別市場シェア、2023年&2033年 (%)
4.6 遺伝子治療
4.6.1.1 地域別市場規模、2023-2033年(US$ Bn)
4.6.1.2 2023年&2033年地域別市場シェア(%)
4.7 その他
4.7.1.1 地域別市場規模、2023-2033年(US$ Bn)
4.7.1.2 2023年&2033年地域別市場シェア(%)
5 再生医療市場分析:用途別
5.1 キーファインディング
5.2 製品セグメント:市場魅力度指数
5.3 再生医療の用途別市場規模の推定と予測
5.4 オンコロジー
5.4.1 地域別市場規模、2023-2033年(US$ Bn)
5.4.2 2023年&2033年地域別市場シェア(%)
5.5 皮膚科
5.5.1 地域別市場規模、2023-2033年(US$ Bn)
5.5.2 2023年&2033年地域別市場シェア(%)
5.6 筋骨格系
5.6.1 地域別市場規模、2023-2033年(US$ Bn)
5.6.2 2023年&2033年地域別市場シェア(%)
5.7 ニューロロジー
5.7.1 地域別市場規模、2023-2033年(US$ Bn)
5.7.2 2023年&2033年地域別市場シェア(%)
5.8 心血管
5.8.1 地域別市場規模、2023-2033年(US$ Bn)
5.8.2 2023年&2033年地域別市場シェア(%)
5.9 創傷治癒
5.9.1 地域別市場規模、2023-2033年(US$ Bn)
5.9.2 2023年&2033年地域別市場シェア(%)
5.10 眼科
5.10.1 地域別市場規模、2023-2033年(US$ Bn)
5.10.2 2023年&2033年地域別市場シェア(%)
5.11 その他
5.11.1 地域別市場規模、2023-2033年(US$ Bn)
5.11.2 2023年&2033年地域別市場シェア(%)
6 再生医療市場分析:地域別
6.1 キーファインディング
6.2 地域別セグメント:市場魅力度指数
6.3 再生医療の市場規模の推定と予測
7 北米の再生医療市場の分析
7.1 キーファインディング
7.2 北米再生医療市場魅力度指数
7.3 北米再生医療市場の国別推移、2023年、2028年、2033年(US$ Bn)
7.4 北米再生医療市場の国別規模推定と予測
7.5 北米再生医療市場の製品別規模推定と予測
7.6 北米再生医療市場の用途別規模推定と予測
7.7 米国の再生医療市場分析
7.8 カナダ再生医療市場分析
8 欧州の再生医療市場分析
8.1 キーファインディング
8.2 欧州再生医療市場魅力度指数
8.3 欧州再生医療市場の国別推移、2023年、2028年、2033年(US$ Bn)
8.4 欧州再生医療市場の国別規模推定と予測
8.5 欧州再生医療市場の製品別規模推定と予測
8.6 欧州再生医療市場の用途別規模推推定と予測
8.7 ドイツ再生医療市場の分析
8.8 フランス再生医療市場の分析
8.9 英国再生医療市場の分析
8.10 イタリア再生医療市場の分析
8.11 スペインの再生医療市場の分析
8.12 ロシア 再生医療市場の分析
8.13 その他の欧州の再生医療市場の分析
9 アジア太平洋地域の再生医療市場分析
9.1 キーファインディング
9.2 アジア太平洋地域の再生医療市場魅力度指数
9.3 アジア太平洋地域の再生医療市場の国別推移、2023年、2028年、2033年(US$ Bn)
9.4 アジア太平洋地域の再生医療市場の国別規模推定と予測
9.5 アジア太平洋地域の再生医療市場の製品別規模推定と予測
9.6 アジア太平洋地域の再生医療市場の用途別規模推定と予測
9.7 日本再生医療市場の分析
9.8 中国再生医療市場の分析
9.9 インド再生医療市場の分析
9.10 オーストラリア再生医療市場の分析
9.11 韓国再生医療市場の分析
9.12 その他のアジア太平洋地域の再生医療市場の分析
10 ラテンアメリカの再生医療市場分析
10.1 主要な調査結果
10.2 ラテンアメリカの再生医療市場魅力度指数
10.3 ラテンアメリカ再生医療市場の国別推移、2023年、2028年、2033年(US$ Bn)
10.4 ラテンアメリカ再生医療市場の国別規模推定と予測
10.5 ラテンアメリカ再生医療市場の製品別規模推定と予測
10.6 ラテンアメリカ再生医療市場の用途別規模推定と予測
10.7 ブラジル再生医療市場分析
10.8 メキシコ再生医療市場の分析
10.9 その他のラテンアメリカ地域の再生医療市場分析
11 MEAの再生医療市場分析
11.1 キーファインディング
11.2 MEA再生医療市場魅力度指数
11.3 MEA再生医療市場の国別推移、2023年、2028年、2033年(US$ Bn)
11.4 MEA再生医療市場の国別規模推定と予測
11.5 MEA再生医療市場の製品別規模推定と予測
11.6 MEA再生医療市場の用途別規模推定と予測
11.7 GCC再生医療市場の分析
11.8 南アフリカの再生医療市場の分析
11.9 その他のMEA地域の再生医療市場の分析
12 企業のプロフィール
12.1 企業シェア分析、2021年
12.2 Amgen
12.2.1 企業スナップショット
12.2.2 会社概要
12.2.3 財務分析
12.2.3.1 純収益、2017-2021年
12.2.3.2 R&D、2017年~2021年
12.2.3.3 地域別市場シェア、2021年
12.2.4 製品ベンチマーキング
12.2.5 戦略的な展望
12.3 Anterogen
12.3.1 企業スナップショット
12.3.2 会社概要
12.3.3 財務分析
12.3.3.1 純収益、2017-2021年
12.3.3.2 R&D、2017年~2021年
12.3.4 製品ベンチマーキング
12.4 Avita Medical, Inc.
12.4.1 企業スナップショット
12.4.2 会社概要
12.4.3 財務分析
12.4.3.1 純収益、2017-2021年
12.4.3.2 R&D、2017年~2021年
12.4.3.3 地域別市場シェア、2021年
12.4.4 製品ベンチマーキング
12.4.5 戦略的な展望
12.5 Bio Solution Co. Ltd.
12.5.1 会社概要
12.5.2 会社概要
12.5.3 財務分析
12.5.3.1 純収益、2017-2021年
12.5.4 製品ベンチマーキング
12.5.5 戦略的な展望
12.6 Bluebird Bio, Inc.
12.6.1 企業スナップショット
12.6.2 会社概要
12.6.3 財務分析
12.6.3.1 純収益、2017-2021年
12.6.3.2 R&D、2017年~2021年
12.6.4 製品ベンチマーキング
12.6.5 戦略的な展望
12.7 Bristol Myers Squibb
12.7.1 企業スナップショット
12.7.2 会社概要
12.7.3 財務分析
12.7.3.1 純収益、2017年~2022年
12.7.3.2 R&D、2017年~2022年
12.7.3.3 地域別市場シェア、2022年
12.7.4 製品ベンチマーキング
12.7.5 戦略的な展望
12.8 Gilead Sciences, Inc.
12.8.1 企業スナップショット
12.8.2 会社概要
12.8.3 財務分析
12.8.3.1 純収益、2017年~2022年
12.8.3.2 R&D、2017年~2021年
12.8.3.3 地域別市場占有率、2022年
12.8.4 製品ベンチマーキング
12.8.5 戦略的な展望
12.9 Integra LifeSciences
12.9.1 企業スナップショット
12.9.2 会社概要
12.9.3 財務分析
12.9.3.1 純収益、2017-2021年
12.9.3.2 R&D、2017年~2021年
12.9.3.3 地域別市場占有率、2021年
12.9.4 製品ベンチマーキング
12.9.5 戦略的な展望
12.10 Mesoblast Ltd
12.10.1 企業スナップショット
12.10.2 会社概要
12.10.3 財務分析
12.10.3.1 純収益、2017年~2022年
12.10.3.2 R&D、2017年~2021年
12.10.4 製品ベンチマーキング
12.10.5 戦略的な展望
12.11 Novartis AG
12.11.1 企業スナップショット
12.11.2 会社概要
12.11.3 財務分析
12.11.3.1 純収益、2017年~2022年
12.11.3.2 R&D、2017年~2022年
12.11.3.3 地域別市場占有率、2022年
12.11.4 製品ベンチマーキング
12.11.5 戦略的な展望
12.12 Organogenesis Inc.
12.12.1 企業スナップショット
12.12.2 会社概要
12.12.3 財務分析
12.12.3.1 純収益、2017-2021年
12.12.3.2 R&D、2017年~2021年
12.12.4 製品ベンチマーキング
12.12.5 戦略的な展望
12.13 Sarepta Therapeutics, Inc.
12.13.1 企業スナップショット
12.13.2 会社概要
12.13.3 財務分析
12.13.3.1 純収益、2017-2021年
12.13.3.2 R&D、2017年~2021年
12.13.4 製品ベンチマーキング
12.13.5 戦略的な展望
12.14 Sibiono GeneTech Co.Ltd.
12.14.1 企業スナップショット
12.14.2 会社概要
12.14.3 製品ベンチマーキング
12.15 Smith & Nephew plc
12.15.1 企業スナップショット
12.15.2 会社概要
12.15.3 財務分析
12.15.3.1 純収益、2017-2021年
12.15.3.2 R&D、2017年~2021年
12.15.3.3 地域別市場シェア、2021年
12.15.4 製品ベンチマーキング
12.15.5 戦略的な展望
12.16 Terumo BCT
12.16.1 企業スナップショット
12.16.2 会社概要
12.16.3 財務分析
12.16.3.1 純収益、2017-2021年
12.16.3.2 R&D、2017年~2021年
12.16.3.3 地域別市場シェア、2021年
12.16.4 製品ベンチマーキング
12.16.5 戦略的な展望
13 結論と提言
13.1 ビジョンゲインからの結びの言葉
13.2 市場関係者への提言
表の一覧
Table 1 Regenerative Medicine Market Snapshot, 2023 & 2033 (US$ billion, CAGR %)
Table 2 Regenerative Medicine Market by Region, 2023-2033 (US$ bn, AGR (%), CAGR (%)): “V” Shaped Recovery Scenario
Table 3 Regenerative Medicine Market by Region, 2023-2033 (US$ bn, AGR (%), CAGR (%)): “U” Shaped Recovery Scenario
Table 4 Regenerative Medicine Market by Region, 2023-2033 (US$ bn, AGR (%), CAGR (%)): “W” Shaped Recovery Scenario
Table 5 Regenerative Medicine Market by Region, 2023-2033 (US$ bn, AGR (%), CAGR (%)): “L” Shaped Recovery Scenario
Table 6 Regenerative Medicine Market Forecast by Product, 2023-2033 (US$ bn, AGR (%), CAGR (%))
Table 7 Regenerative Medicine Market Forecast by Stem Cell Therapy, 2023-2033 (US$ bn, AGR (%), CAGR (%))
Table 8 Stem Cell Therapy Market Forecast by Region, 2023-2033 (US$ bn, AGR%, CAGR%)
Table 9 Regenerative Medicine Market Forecast by Tissue Engineering, 2023-2033 (US$ bn, AGR (%), CAGR (%))
Table 10 Tissue Engineering Market Forecast by Region, 2023-2033 (US$ bn, AGR%, CAGR %)
Table 11 Gene Therapy Market Forecast by Region, 2023-2033 (US$ bn, AGR%, CAGR %)
Table 12 Others Market Forecast by Region, 2023-2033 (US$ bn, AGR%, CAGR %)
Table 13 Regenerative Medicine Market Forecast by Application, 2023-2033 (US$ bn, AGR (%), CAGR (%))
Table 14 Oncology Market Forecast by Region, 2023-2033 (US$ bn, AGR%, CAGR %)
Table 15 Dermatology Market Forecast by Region, 2023-2033 (US$ bn, AGR%, CAGR %)
Table 16 Musculoskeletal Market Forecast by Region, 2023-2033 (US$ bn, AGR%, CAGR %)
Table 17 Neurology Market Forecast by Region, 2023-2033 (US$ bn, AGR%, CAGR %)
Table 18 Cardiovascular Market Forecast by Region, 2023-2033 (US$ bn, AGR%, CAGR %)
Table 19 Wound Healing Market Forecast by Region, 2023-2033 (US$ bn, AGR%, CAGR %)
Table 20 Ophthalmology Market Forecast by Region, 2023-2033 (US$ bn, AGR%, CAGR %)
Table 21 Others Market Forecast by Region, 2023-2033 (US$ bn, AGR%, CAGR %)
Table 22 Regenerative Medicine Market by Region, 2023-2033 (US$ bn, AGR (%), CAGR (%))
Table 23 North America Regenerative Medicine Market Forecast by Country 2023-2033 (US$ bn, AGR%, CAGR %)
Table 24 Regenerative Medicine Market Forecast by Product, 2023-2033 (US$ bn, AGR (%), CAGR (%))
Table 25 Regenerative Medicine Market Forecast by Application, 2023-2033 (US$ bn, AGR (%), CAGR (%))
Table 26 U.S. Regenerative Medicine Market Forecast, 2023-2033 (US$ bn, AGR %, CAGR %)
Table 27 Canada Regenerative Medicine Market Forecast, 2023-2033 (US$ bn, AGR %, CAGR %)
Table 28 Europe Regenerative Medicine Market Forecast by Country, 2023-2033 (US$ bn, AGR%, CAGR %)
Table 29 Regenerative Medicine Market Forecast by Product, 2023-2033 (US$ bn, AGR (%), CAGR (%))
Table 30 Regenerative Medicine Market Forecast by Application, 2023-2033 (US$ bn, AGR (%), CAGR (%))
Table 31 Germany Regenerative Medicine Market Forecast, 2023-2033 (US$ bn, AGR%, CAGR %)
Table 32 France Regenerative Medicine Market Forecast, 2023-2033 (US$ bn, AGR%, CAGR %)
Table 33 UK Regenerative Medicine Market Forecast, 2023-2033 (US$ bn, AGR%, CAGR %)
Table 34 Italy Regenerative Medicine Market Forecast, 2023-2033 (US$ bn, AGR%, CAGR %)
Table 35 Spain Regenerative Medicine Market Forecast, 2023-2033 (US$ bn, AGR%, CAGR %)
Table 36 Russia Regenerative Medicine Market Forecast, 2023-2033 (US$ bn, AGR%, CAGR %)
Table 37 Rest of Europe Regenerative Medicine Market Forecast, 2023-2033 (US$ bn, AGR%, CAGR %)
Table 38 Asia Pacific Regenerative Medicine Market forecast by Country 2023-2033 (US$ bn, AGR%, CAGR %)
Table 39 Regenerative Medicine Market Forecast by Product, 2023-2033 (US$ bn, AGR (%), CAGR (%))
Table 40 Regenerative Medicine Market Forecast by Application, 2023-2033 (US$ bn, AGR (%), CAGR (%))
Table 41 Japan Regenerative Medicine Market Forecast, 2023-2033 (US$ billion, AGR %)
Table 42 China Regenerative Medicine Market Forecast, 2023-2033 (US$ bn, AGR%, CAGR %)
Table 43 India Regenerative Medicine Market Forecast, 2023-2033 (US$ bn, AGR%, CAGR %)
Table 44 Australia Regenerative Medicine Market Forecast, 2023-2033 (US$ bn, AGR%, CAGR %)
Table 45 South Korea Regenerative Medicine Market Forecast, 2023-2033 (US$ billion, AGR %)
Table 46 Rest of Asia Pacific Regenerative Medicine Market Forecast, 2023-2033 (US$ bn, AGR%, CAGR %)
Table 47 Latin America Regenerative Medicine Market Forecast, 2023-2033 (US$ bn, AGR%, CAGR %)
Table 48 Regenerative Medicine Market Forecast by Product, 2023-2033 (US$ bn, AGR (%), CAGR (%))
Table 49 Regenerative Medicine Market Forecast by Application, 2023-2033 (US$ bn, AGR (%), CAGR (%))
Table 50 Brazil Regenerative Medicine Market Forecast, 2023-2033 (US$ bn, AGR%, CAGR %)
Table 51 Mexico Regenerative Medicine Market Forecast, 2023-2033 (US$ bn, AGR%, CAGR %)
Table 52 Rest of Latin America Regenerative Drugs Forecast, 2023-2033 (US$ bn, AGR%, CAGR %)
Table 53 MEA Regenerative Drugs forecast by Country 2023-2033 (US$ bn, AGR%, CAGR %)
Table 54 Regenerative Medicine Market Forecast by Product, 2023-2033 (US$ Bn, AGR (%), CAGR (%))
Table 55 Regenerative Medicine Market Forecast by Application, 2023-2033 (US$ Bn, AGR (%), CAGR (%))
Table 56 GCC Regenerative Medicine Market Forecast, 2023-2033 (US$ bn, AGR%, CAGR %)
Table 57 South Africa Regenerative Medicine Market Forecast, 2023-2033 (US$ bn, AGR%, CAGR %)
Table 58 Rest of MEA Regenerative Medicine Market Forecast, 2023-2033 (US$ bn, AGR%, CAGR %)
Table 59 Amgen : Key Details, (CEO, HQ, Revenue, Founded, No. of Employees, Company Type, Website, Business Segment)
Table 60 Amgen : Product Benchmarking
Table 61 Amgen : Strategic Outlook
Table 62 Anterogen : Key Details, (CEO, HQ, Revenue, Founded, No. of Employees, Company Type, Website, Business Segment)
Table 63 Anterogen : Product Benchmarking
Table 64 Avita Medical, Inc. : Key Details, (CEO, HQ, Revenue, Founded, No. of Employees, Company Type, Website, Business Segment)
Table 65 Avita Medical , Inc. : Product Benchmarking
Table 66 Avita Medical , Inc. : Strategic Outlook
Table 67 Bio Solution Co. Ltd.: Key Details, (CEO, HQ, Revenue, Founded, No. of Employees, Company Type, Website, Business Segment)
Table 68 Bio Solution Co. Ltd .: Product Benchmarking
Table 69 Bio Solution Co. Ltd .: Strategic Outlook
Table 70 Bluebird Bio, Inc.: Key Details, (CEO, HQ, Revenue, Founded, No. of Employees, Company Type, Website, Business Segment)
Table 71 Bluebird Bio, Inc.: Product Benchmarking
Table 72 Bluebird Bio, Inc.: Strategic Outlook
Table 73 Bristol Myers Squibb : Key Details, (CEO, HQ, Revenue, Founded, No. of Employees, Company Type, Website, Business Segment)
Table 74 Bristol Myers Squibb : Product Benchmarking
Table 75 Bristol Myers Squibb : Strategic Outlook
Table 76 Gilead Sciences, Inc. : Key Details, (CEO, HQ, Revenue, Founded, No. of Employees, Company Type, Website, Business Segment)
Table 77 Gilead Sciences, Inc. : Product Benchmarking
Table 78 Gilead Science, Inc. : Strategic Outlook
Table 79 Integra LifeSciences :(CEO, HQ, Revenue, Founded, No. of Employees, Company Type, Website, Business Segment)
Table 80 Integra LifeSciences : Product Benchmarking
Table 81 Integra LifeSciences .: Strategic Outlook
Table 82 Mesoblast Ltd : (CEO, HQ, Revenue, Founded, No. of Employees, Company Type, Website, Business Segment)
Table 83 Mesoblast Ltd : Product Benchmarking
Table 84 Mesoblast Ltd .: Strategic Outlook
Table 85 Novartis AG ,: Key Details, (CEO, HQ, Revenue, Founded, No. of Employees, Company Type, Website, Business Segment)
Table 86 Novartis AG: : Product Benchmarking
Table 87 Novartis AG: .: Strategic Outlook
Table 88 Organogenesis Inc. :(CEO, HQ, Revenue, Founded, No. of Employees, Company Type, Website, Business Segment)
Table 89 Organogenesis Inc. : Product Benchmarking
Table 90 Organogenesis Inc.: Strategic Outlook
Table 91 Sarepta Therapeutics, Inc. :(CEO, HQ, Revenue, Founded, No. of Employees, Company Type, Website, Business Segment)
Table 92 Sarepta Therapeutics, Inc.: Product Benchmarking
Table 93 Sarepta Therapeutics, Inc..: Strategic Outlook
Table 94 Sibiono GeneTech Co. Ltd :(CEO, HQ, Revenue, Founded, No. of Employees, Company Type, Website, Business Segment)
Table 95 Sibiono GeneTech Co. Ltd : Product Benchmarking
Table 96 Smith & Nephew plc,: Key Details, (CEO, HQ, Revenue, Founded, No. of Employees, Company Type, Website, Business Segment)
Table 97 Smith & Nephew: : Product Benchmarking
Table 98 Smith & Nephew: .: Strategic Outlook
Table 99 Terumo BCT,: Key Details, (CEO, HQ, Revenue, Founded, No. of Employees, Company Type, Website, Business Segment)
Table 100 Terumo BCT: : Product Benchmarking
Table 101 Terumo BCT: .: Strategic Outlook
図の一覧
Figure 1 Regenerative Medicine Market Segmentation
Figure 2 Regenerative Medicine Market by Product: Market Attractiveness Index
Figure 3 Regenerative Medicine Market Attractiveness Index by Application
Figure 4 Regenerative Medicine Market Attractiveness Index by Region
Figure 5 Regenerative Medicine Market: Market Dynamics
Figure 6 COVID Impact Analysis: Regenerative Medicine Market Recovery Scenarios
Figure 7 Regenerative Medicine Market by Region, 2023-2033 (US$ bn, AGR (%), CAGR (%)): “V” Shaped Recovery
Figure 8 Regenerative Medicine Market by Region, 2023-2033 (US$ bn, AGR (%), CAGR (%)): “U” Shaped Recovery
Figure 9 Regenerative Medicine Market by Region, 2023-2033 (US$ bn, AGR (%), CAGR (%)): “W” Shaped Recovery
Figure 10 Regenerative Medicine Market by Region, 2023-2033 (US$ bn, AGR (%), CAGR (%)): “L” Shaped Recovery
Figure 11 Regenerative Medicine Market: Porter’s Five Forces Analysis
Figure 12 Regenerative Medicine Market: PEST Analysis
Figure 13 Regenerative Medicine Market by Product: Market Attractiveness Index
Figure 14 Regenerative Medicine Market Forecast by Product , 2023-2033 (US$ billion)
Figure 15 Regenerative Medicine Market Share Forecast by Product, 2023-2033 (%)
Figure 16 Stem Cell Therapy Market Forecast by Region, 2023-2033 (US$ billion)
Figure 17 Stem Cell Therapy Market Share Forecast by Region, 2023 & 2033 (%)
Figure 18 Tissue Engineering Market Forecast by Region, 2023-2033 (US$ billion)
Figure 19 Tissue Engineering Market Share Forecast by Region, 2023 & 2033 (%)
Figure 20 Gene Therapy Market Forecast by Region, 2023-2033 (US$ billion)
Figure 21 Gene Therapy Market Share Forecast by Region, 2023 & 2033 (%)
Figure 22 Others Market Forecast by Region, 2023-2033 (US$ billion)
Figure 23 Others Market Share Forecast by Region, 2023 & 2033 (%)
Figure 24 Regenerative Medicine Market by Application: Market Attractiveness Index
Figure 25 Regenerative Medicine Market Forecast by Application , 2023-2033 (US$ billion)
Figure 26 Regenerative Medicine Market Share Forecast by Application, 2023-2033 (%)
Figure 27 Oncology Market Forecast by Region, 2023-2033 (US$ billion)
Figure 28 Oncology Market Share Forecast by Region, 2023 & 2033 (%)
Figure 29 Dermatology Market Forecast by Region, 2023-2033 (US$ billion)
Figure 30 Dermatology Market Share Forecast by Region, 2023 & 2033 (%)
Figure 31 Musculoskeletal Market Forecast by Region, 2023-2033 (US$ billion)
Figure 32 Musculoskeletal Market Share Forecast by Region, 2023 & 2033 (%)
Figure 33 Neurology Market Forecast by Region, 2023-2033 (US$ billion)
Figure 34 Neurology Market Share Forecast by Region, 2023 & 2033 (%)
Figure 1 Cardiovascular Market Forecast by Region, 2023-2033 (US$ billion)
Figure 2 Cardiovascular Market Share Forecast by Region, 2023 & 2033 (%)
Figure 3 Wound Healing Market Forecast by Region, 2023-2033 (US$ billion)
Figure 4 Wound Healing Market Share Forecast by Region, 2023 & 2033 (%)
Figure 5 Ophthalmology Market Forecast by Region, 2023-2033 (US$ billion)
Figure 6 Ophthalmology Market Share Forecast by Region, 2023 & 2033 (%)
Figure 7 Others Market Forecast by Region, 2023-2033 (US$ billion)
Figure 8 Others Market Share Forecast by Region, 2023 & 2033 (%)
Figure 9 Regenerative Medicine Market by Region: Market Attractiveness Index
Figure 10 Regenerative Medicine Market by Region, 2023-2033 (US$ bn)
Figure 11 Regenerative Medicine Market Share Forecast by Region 2023, 2033(%)
Figure 12 North America Regenerative Medicine Market Attractiveness Index
Figure 13 North America Regenerative Medicine Market by Region, 2023, 2028 & 2033 (US$ billion)
Figure 14 North America Regenerative Medicine Market Forecast by Country, 2023-2033 (US$ billion)
Figure 15 North America Regenerative Medicine Market Share Forecast by Country, 2023 & 2033 (%)
Figure 16 North America Regenerative Medicine Market Forecast by Product, 2023-2033 (US$ billion)
Figure 17 North America Regenerative Medicine Market Share Forecast by Product, 2023 & 2033 (%)
Figure 18 North America Regenerative Medicine Market Forecast by Application, 2023-2033 (US$ billion)
Figure 19 North America Regenerative Medicine Market Share Forecast by Application, 2023 & 2033 (%)
Figure 20 U.S. Regenerative Medicine Market Forecast, 2023-2033 (US$ billion, AGR %)
Figure 21 Canada Regenerative Medicine Market Forecast, 2023-2033 (US$ billion, AGR %)
Figure 22 Europe Regenerative Medicine Market Attractiveness Index
Figure 23 Europe Regenerative Medicine Market by Region, 2023, 2028 & 2033 (US$ billion)
Figure 24 Europe Regenerative Medicine Market Forecast by Country, 2023-2033 (US$ billion)
Figure 25 Europe Regenerative Medicine Market Share Forecast by Country, 2023 & 2033 (%)
Figure 26 Europe Regenerative Medicine Market Forecast by Product, 2023-2033 (US$ billion)
Figure 27 Europe Regenerative Medicine Market Share Forecast by Product, 2023 & 2033 (%)
Figure 28 Europe Regenerative Medicine Market Forecast by Application, 2023-2033 (US$ billion)
Figure 29 Europe Regenerative Medicine Market Share Forecast by Application, 2023 & 2033 (%)
Figure 30 Germany Regenerative Medicine Market Forecast, 2023-2033 (US$ billion, AGR %)
Figure 31 France Regenerative Medicine Market Forecast, 2023-2033 (US$ billion, AGR %)
Figure 32 UK Regenerative Medicine Market Forecast, 2023-2033 (US$ billion, AGR %)
Figure 33 Italy Regenerative Medicine Market Forecast, 2023-2033 (US$ billion, AGR %)
Figure 34 Spain Regenerative Medicine Market Forecast, 2023-2033 (US$ billion, AGR %)
Figure 35 Russia Regenerative Medicine Market Forecast, 2023-2033 (US$ billion, AGR %)
Figure 36 Rest of Europe Regenerative Medicine Market Forecast, 2023-2033 (US$ billion, AGR %)
Figure 37 Asia Pacific Regenerative Medicine Market Attractiveness Index
Figure 38 Asia Pacific Regenerative Medicine Market by Region, 2023, 2028 & 2033 (US$ billion)
Figure 39 Asia Pacific Regenerative Medicine Market Forecast, 2023-2033 (US$ billion, AGR %)
Figure 40 Asia Pacific Regenerative Medicine Market Share Forecast by Country, 2023 & 2033 (%)
Figure 41 Asia Pacific Regenerative Medicine Market Forecast by Product, 2023-2033 (US$ billion)
Figure 42 Asia Pacific Regenerative Medicine Market Share Forecast by Product, 2023 & 2033 (%)
Figure 43 Asia Pacific Regenerative Medicine Market Forecast by Application, 2023-2033 (US$ billion)
Figure 44 Asia Pacific Regenerative Medicine Market Share Forecast by Application, 2023 & 2033 (%)
Figure 45 Japan Regenerative Medicine Market Forecast, 2023-2033 (US$ billion, AGR %)
Figure 46 China Regenerative Medicine Market Forecast, 2023-2033 (US$ billion, AGR %)
Figure 47 India Regenerative Medicine Market Forecast, 2023-2033 (US$ billion, AGR %)
Figure 48 Australia Regenerative Medicine Market Forecast, 2023-2033 (US$ billion, AGR %)
Figure 49 South Korea Regenerative Medicine Market Forecast, 2023-2033 (US$ billion, AGR %)
Figure 50 Rest of Asia Pacific Regenerative Medicine Market Forecast, 2023-2033 (US$ billion, AGR %)
Figure 51 Latin America Regenerative Medicine Market Attractiveness Index
Figure 52 Latin America Regenerative Medicine Market by Country, 2023, 2028 & 2033 (US$ billion)
Figure 53 Latin America Regenerative Medicine Market Forecast by Country, 2023-2033 (US$ billion)
Figure 54 Latin America Regenerative Medicine Market Share Forecast by Country, 2023 & 2033 (%)
Figure 55 Latin America Regenerative Medicine Market Forecast by Product, 2023-2033 (US$ billion)
Figure 56 Latin America Regenerative Medicine Market Share Forecast by Product, 2023 & 2033 (%)
Figure 57 Latin America Regenerative Medicine Market Forecast by Application, 2023-2033 (US$ billion)
Figure 58 Latin America Regenerative Medicine Market Share Forecast by Application, 2023 & 2033 (%)
Figure 59 Brazil Regenerative Medicine Market Forecast, 2023-2033 (US$ billion, AGR %)
Figure 60 Mexico Regenerative Medicine Market Forecast, 2023-2033 (US$ billion, AGR %)
Figure 61 Rest of Latin America Regenerative Medicine Market Forecast, 2023-2033 (US$ billion, AGR %)
Figure 62 MEA Regenerative Medicine Market Attractiveness Index
Figure 63 MEA Regenerative Medicine Market by Country, 2023, 2028 & 2033 (US$ billion)
Figure 64 MEA Regenerative Medicine Market Forecast by Country, 2023-2033 (US$ billion)
Figure 65 MEA Regenerative Medicine Market Share Forecast by Country, 2023 & 2033 (%)
Figure 66 MEA Regenerative Medicine Market Forecast by Product, 2023-2033 (US$ billion)
Figure 67 MEA Regenerative Medicine Market Share Forecast by Product, 2023 & 2033 (%)
Figure 68 MEA Regenerative Medicine Market Forecast by Application, 2023-2033 (US$ billion)
Figure 69 MEA Regenerative Medicine Market Share Forecast by Application, 2023 & 2033 (%)
Figure 70 GCC Regenerative Medicine Market Forecast, 2023-2033 (US$ billion, AGR %)
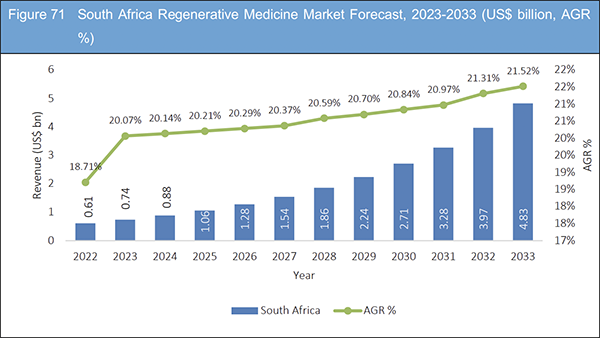
Figure 71 South Africa Regenerative Medicine Market Forecast, 2023-2033 (US$ billion, AGR %)
Figure 72 Rest of MEA Regenerative Medicine Market Forecast, 2023-2033 (US$ billion, AGR %)
Figure 73 Company Share Analysis, 2021
Figure 74 Amgen; Net Revenue, 2017-2021 (US$ million, AGR %)
Figure 75 Amgen; R&D, 2017-2021 (US$ million, AGR %)
Figure 76 Amgen: Regional Market Shares, 2021
Figure 77 Anterogen; Net Revenue, 2017-2021 (US$ million, AGR %)
Figure 78 Anterogen; R&D, 2017-2021 (US$ million, AGR %)
Figure 79 Avita Medical Inc.: Net Revenue, 2017-2021 (US$ million, AGR %)
Figure 80 Avita Medical, Inc.: R&D, 2017-2021 (US$ million, AGR %)
Figure 81 Avita Medical , Inc.: Regional Market Shares, 2021
Figure 82 Bio Solution Co. Ltd: Net Revenue, 2017-2021 (US$ million, AGR %)
Figure 83 Bluebird Bio, Inc.: Net Revenue, 2017-2021 (US$ million, AGR %)
Figure 84 Bluebird Bio, Inc.: R&D, 2017-2021 (US$ million, AGR %)
Figure 85 Bristol Myers Squibb: Net Revenue, 2017-2022 (US$ million, AGR%)
Figure 86 Bristol Myers Squibb; R&D, 2017-2022 (US$ million, AGR %)
Figure 87 Bristol Myers Squibb: Regional Market Shares, 2022
Figure 88 Gilead Sciences, Inc.: Net Revenue, 2017-2022 (US$ million, AGR%)
Figure 89 Gilead Sciences, Inc.: R&D, 2017-2022 (US$ million, AGR %)
Figure 90 Gilead Sciences, Inc.: Regional Market Shares, 2022
Figure 91 Integra LifeSciences.: Net Revenue, 2017-2021 (US$ million, AGR %)
Figure 92 Integra LifeSciences.: R&D, 2017-2021 (US$ million, AGR %)
Figure 93 Integra LifeSciences: Regional Market Shares, 2021
Figure 94 Mesoblast Ltd.: Net Revenue, 2017-2022 (US$ million, AGR %)
Figure 95 Mesoblast Ltd.: R&D, 2017-2021 (US$ million, AGR %)
Figure 96 Novartis AG: Net Revenue, 2017-2022 (US$ million, AGR %)
Figure 97 Novartis AG: R&D, 2017-2022 (US$ million, AGR %)
Figure 98 Novartis AG:: Regional Market Shares, 2022
Figure 99 Organogenesis Inc.: Net Revenue, 2017-2021 (US$ million, AGR %)
Figure 100 Organogenesis Inc.: R&D, 2017-2021 (US$ million, AGR %)
Figure 101 Sarepta Therapeutics, Inc..: Net Revenue, 2017-2021 (US$ million, AGR %)
Figure 102 Sarepta Therapeutics, Inc.: R&D, 2017-2021 (US$ million, AGR %)
Figure 103 Smith & Nephew: Net Revenue, 2017-2021 (US$ million, AGR%)
Figure 104 Smith & Nephew:; R&D, 2017-2021 (US$ million, AGR%)
Figure 105 Smith & Nephew:: Regional Market Shares, 2021
Figure 106 Terumo BCT: Net Revenue, 2017-2021 (US$ million, AGR%)
Figure 107 Terumo BCT: R&D, 2017-2021 (US$ million, AGR %)
Figure 108 Terumo BCT:: Regional Market Shares, 2021
ページTOPに戻る
Summary
Report Details
The Regenerative Medicine Market Report 2023-2033: This report will prove invaluable to leading firms striving for new revenue pockets if they wish to better understand the industry and its underlying dynamics. It will be useful for companies that would like to expand into different industries or to expand their existing operations in a new region.
Growing number of Joint Ventures to fuel market growth
The demand for breakthrough techniques in tissue engineering, cell therapy, and stem cell use is increasing due to the rising prevalence of chronic diseases and clinical trials. Continuous joint ventures, mergers, acquisitions, and other strategic activity by various companies is helping the regenerative medicine market thrive. For instance, in October 2022, Dr. Vanessa Rodriguez Pares and Meso Numismatics, Inc. (MSSV), a biotech and numismatics-focused technology company, partnered with the new STEM LIFE clinic facility. This collaboration aims to promote regenerative medicine’s high standards. Similar to this, Astellas Pharma Inc. and Pantherna Therapeutics GmbH entered into a technology evaluation agreement in October 2022 to carry out research to create mRNA-based regenerative medicine programmes employing direct reprogramming (trans-differentiation). Additionally, in October 2020, the world’s largest pharmaceutical corporation Bayer bought Asklepios BioPharmaceutical, a gene therapy business with operations in San Sebastián, Spain, Edinburgh, and Paris, in a deal valued at up to US$ 4 billion. Such actions significantly influence the market for regenerative medicine’s growth pace.
Product Recalls may hamper the market growth
Regenerative medicine is a speedily evolving field and involves the use of wide array of techniques to repair or replace damaged tissues and organs. With the increasing popularity and use of these products, there have been instances of product recalls in the regenerative medicine market. The growth of the regenerative medicine market can be impeded owing to the increasing number of product recalls. Biotech companies continue to face difficulties such as risk of product recalls and marketing their genetic medicine in the market. For instance, Bluebird Bio, a US-based gene therapy company, withdrew its gene therapy for a rare blood disorder from the German market in April 2021 after failing to reach an agreement on the treatment’s cost with German health authorities. This recall impacted the company’s sales and brand image. Similarly, small-scale companies are severely affected as they fail to recover from losses due to product recalls because they operate without robust cash flow and brand recognition.
What Questions Should You Ask before Buying a Market Research Report?
• How is the Regenerative Medicine Market evolving?
• What is driving and restraining the Regenerative Medicine Market?
• How will each Regenerative Medicine submarket grow over the forecast period and how much revenue will these submarkets account for in 2033?
• How will the market shares for each Regenerative Medicine submarket develop from 2023 to 2033?
• What will be the main driver for the overall market from 2023 to 2033?
• Will leading Regenerative Medicine Markets broadly follow the macroeconomic dynamics, or will individual national markets outperform others?
• How will the market shares of the national markets change by 2033 and which geographical region will lead the market in 2033?
• Who are the leading players and what are their prospects over the forecast period?
• What are the Regenerative Medicine development projects for these leading companies?
• How will the industry evolve during the period between 2023 and 2033? What are the implications of Regenerative Medicine development projects taking place now and over the next 10 years?
• Is there a greater need for product commercialisation to further scale the Regenerative Medicine Market?
• Where is the Regenerative Medicine Market heading and how can you ensure you are at the forefront of the market?
• What are the best investment options for new product and service lines?
• What are the key prospects for moving companies into a new growth path and C-suite?
You need to discover how this will impact the Regenerative Medicine Market today, and over the next 10 years:
• Our 232-page report provides 101 tables and 108 charts/graphs exclusively to you.
• The report highlights key lucrative areas in the industry so you can target them – NOW.
• It contains in-depth analysis of global, regional and national sales and growth.
• It highlights for you the key successful trends, changes and revenue projections made by your competitors.
This report tells you TODAY how the Regenerative Medicine Market will develop in the next 10 years, and in line with the variations in COVID-19 economic recession and bounce. This market is more critical now than at any point over the last 10 years.
Forecasts to 2033 and other analyses reveal commercial prospects
• In addition to revenue forecasting to 2033, our new study provides you with recent results, growth rates, and market shares.
• You will find original analyses, with business outlooks and developments.
• Discover qualitative analyses (including market dynamics, drivers, opportunities, restraints and challenges), cost structure, impact of rising prices of regenerative medicines and recent developments.
This report includes data analysis and invaluable insight into how COVID-19 will affect the industry and your company. Four COVID-19 recovery patterns and their impact, namely, “V”, “L”, “W” and “U” are discussed in this report.
Segments Covered in the Report
By Product
• Stem Cell Therapy
– Autologous
– Allogenic
• Tissue Engineering
– Scaffold
– Hydrogels
• Gene Therapy
• Others
By Application
• Regenerative Medicine
– Oncology
– Dermatology
– Musculoskeletal
– Neurology
– Cardiovascular
– Wound Healing
– Ophthalmology
– Others
In addition to the revenue predictions for the overall world market and segments, you will also find revenue forecasts for five regional and 16 leading national markets:
North America
• U.S.
• Canada
Europe
• Germany
• UK
• France
• Spain
• Italy
• Rest of Europe
Asia Pacific
• China
• Japan
• India
• Australia
• South Korea
• Rest of Asia Pacific
Latin America
• Brazil
• Mexico
• Rest of Latin America Latin America
MEA
• GCC
• South Africa
• Rest of MEA
The report also includes profiles and for some of the leading companies in the Regenerative Medicine Market, 2023 to 2033, with a focus on this segment of these companies’ operations.
Leading companies and the potential for market growth
• Amgen
• Anterogen
• Avita Medical Inc.
• Bio Solutions. Co. Ltd
• Bluebird Bio Inc.
• Bristol Myers Squibb
• Gilead Sciences, Inc.
• Integra Life Sciences
• Misoblast Ltd
• Novartis AG
• Organogenesis Inc.
• Sarepta Therapeutics,Inc
• Sibino GeneTech Co. Ltd
• Smith & Nephew plc
• Terumo BCT
Overall world revenue for Regenerative Medicine Market, 2023 to 2033 in terms of value the market will surpass US$ 59.15 billion in 2023, our work calculates. We predict strong revenue growth through to 2033. Our work identifies which organizations hold the greatest potential. Discover their capabilities, progress, and commercial prospects, helping you stay ahead.
How will the Regenerative Medicine Market, 2023 to 2033 report help you?
In summary, our 232-page report provides you with the following knowledge:
• Revenue forecasts to 2033 for Regenerative Medicine Market, 2023 to 2033 Market, with forecasts for Type of Product and Application at a global and regional level – discover the industry’s prospects, finding the most lucrative places for investments and revenues.
• Revenue forecasts to 2033 for five regional and 16 key national markets – See forecasts for the Regenerative Medicine Market, 2023 to 2033 market in North America, Europe, Asia-Pacific and Latin America and Middle East and Africa. Also forecasted is the market in the US, Canada, Mexico, Brazil, Germany, France, UK, Italy, China, India, Japan, and Australia among other prominent economies.
• Prospects for established firms and those seeking to enter the market – including company profiles of the major companies involved in the Regenerative Medicine Market, 2023 to 2033.
Find quantitative and qualitative analyses with independent predictions. Receive information that only our report contains, staying informed with invaluable business intelligence.
Information found nowhere else
With our new report, you are less likely to fall behind in knowledge or miss out on opportunities. See how our work could benefit your research, analyses, and decisions. Visiongain’s study is for everybody needing commercial analyses for the Regenerative Medicine Market, 2023 to 2033, market-leading companies. You will find data, trends and predictions.
ページTOPに戻る
Table of Contents
Table of Contents
1 Report Overview
1.1 Objectives of the Study
1.2 Introduction to Regenerative Medicine Market
1.3 What This Report Delivers
1.4 Why You Should Read This Report
1.5 Key Questions Answered by This Analytical Report
1.6 Who is This Report for?
1.7 Methodology
1.7.1 Market Definitions
1.7.2 Market Evaluation & Forecasting Methodology
1.7.3 Data Validation
1.7.3.1 Primary Research
1.7.3.2 Secondary Research
1.8 Frequently Asked Questions (FAQs)
1.9 Associated Visiongain Reports
1.10 About Visiongain
2 Executive Summary
3 Market Overview
3.1 Key Findings
3.2 Market Dynamics
3.2.1 Market Driving Factors
3.2.1.1 Increasing Strategic Activities and Collaborations
3.2.1.2 Rise in Research and Development Projects
3.2.1.3 Surging Government Support
3.2.2 Market Restraining Factors
3.2.2.1 Substantial Number of Product Recalls
3.2.2.2 Unapproved Products in the Market
3.2.3 Market Opportunities
3.2.3.1 Growing Research Partnership in Developed and Developing Countries across the globe
3.2.3.2 Growing awareness about the advances in medical research
3.2.3.3 Growing Investment and Funding
3.2.4 .COVID-19 Impact Analysis
3.3 Porter’s Five Forces Analysis
3.3.1 Bargaining Power of Suppliers
3.3.2 Bargaining Power of Buyers
3.3.3 Competitive Rivalry
3.3.4 Threat from Substitutes
3.3.5 Threat of New Entrants
3.4 PEST Analysis
4 Regenerative Medicine Market Analysis by Product
4.1 Key Findings
4.2 Product Segment: Market Attractiveness Index
4.3 Regenerative Medicine Market Size Estimation and Forecast by Product
4.4 Stem Cell Therapy
4.4.1 Regenerative Medicine Market Forecast by Stem Cell Therapy, 2023-2033 (US$ Bn)
4.4.1.1 Market Size by Region, 2023-2033 (US$ Bn)
4.4.1.2 Market Share by Region, 2023 & 2033 (%)
4.5 Tissue Engineering
4.5.1.1 Regenerative Medicine Market Forecast by Tissue Engineering, 2023-2033 (US$ Bn)
4.5.1.2 Market Size by Region, 2023-2033 (US$ Bn)
4.5.1.3 Market Share by Region, 2023 & 2033 (%)
4.6 Gene Therapy
4.6.1.1 Market Size by Region, 2023-2033 (US$ Bn)
4.6.1.2 Market Share by Region, 2023 & 2033 (%)
4.7 Others
4.7.1.1 Market Size by Region, 2023-2033 (US$ Bn)
4.7.1.2 Market Share by Region, 2023 & 2033 (%)
5 Regenerative Medicine Market Analysis by Application
5.1 Key Findings
5.2 Product Segment: Market Attractiveness Index
5.3 Regenerative Medicine Market Size Estimation and Forecast by Application
5.4 Oncology
5.4.1 Market Size by Region, 2023-2033 (US$ Bn)
5.4.2 Market Share by Region, 2023 & 2033 (%)
5.5 Dermatology
5.5.1 Market Size by Region, 2023-2033 (US$ Bn)
5.5.2 Market Share by Region, 2023 & 2033 (%)
5.6 Musculoskeletal
5.6.1 Market Size by Region, 2023-2033 (US$ Bn)
5.6.2 Market Share by Region, 2023 & 2033 (%)
5.7 Neurology
5.7.1 Market Size by Region, 2023-2033 (US$ Bn)
5.7.2 Market Share by Region, 2023 & 2033 (%)
5.8 Cardiovascular
5.8.1 Market Size by Region, 2023-2033 (US$ Bn)
5.8.2 Market Share by Region, 2023 & 2033 (%)
5.9 Wound Healing
5.9.1 Market Size by Region, 2023-2033 (US$ Bn)
5.9.2 Market Share by Region, 2023 & 2033 (%)
5.10 Ophthalmology
5.10.1 Market Size by Region, 2023-2033 (US$ Bn)
5.10.2 Market Share by Region, 2023 & 2033 (%)
5.11 Others
5.11.1 Market Size by Region, 2023-2033 (US$ Bn)
5.11.2 Market Share by Region, 2023 & 2033 (%)
6 Regenerative Medicine Market Analysis by Region
6.1 Key Findings
6.2 Regional Segment: Market Attractiveness Index
6.3 Regenerative Medicine Market Size Estimation and Forecast
7 North America Regenerative Medicine Market Analysis
7.1 Key Findings
7.2 North America Regenerative Medicine Market Attractiveness Index
7.3 North America Regenerative Medicine Market by Country, 2023, 2028 & 2033 (US$ Bn)
7.4 North America Regenerative Medicine Market Size Estimation and Forecast by Country
7.5 North America Regenerative Medicine Market Size Estimation and Forecast by Product
7.6 North America Regenerative Medicine Market Size Estimation and Forecast by Application
7.7 U.S. Regenerative Medicine Market Analysis
7.8 Canada Regenerative Medicine Market Analysis
8 Europe Regenerative Medicine Market Analysis
8.1 Key Findings
8.2 Europe Regenerative Medicine Market Attractiveness Index
8.3 Europe Regenerative Medicine Market by Country, 2023, 2028 & 2033 (US$ Bn)
8.4 Europe Regenerative Medicine Market Size Estimation and Forecast by Country
8.5 Europe Regenerative Medicine Market Size Estimation and Forecast by Product
8.6 Europe Regenerative Medicine Market Size Estimation and Forecast by Application
8.7 Germany Regenerative Medicine Market Analysis
8.8 France Regenerative Medicine Market Analysis
8.9 UK Regenerative Medicine Market Analysis
8.10 Italy Regenerative Medicine Market Analysis
8.11 Spain Regenerative Medicine Market Analysis
8.12 Russia Regenerative Medicine Market Analysis
8.13 Rest of Europe Regenerative Medicine Market Analysis
9 Asia Pacific Regenerative Medicine Market Analysis
9.1 Key Findings
9.2 Asia Pacific Regenerative Medicine Market Attractiveness Index
9.3 Asia Pacific Regenerative Medicine Market by Country, 2023, 2028 & 2033 (US$ Bn)
9.4 Asia Pacific Regenerative Medicine Market Size Estimation and Forecast by Country
9.5 Asia Pacific Regenerative Medicine Market Size Estimation and Forecast by Product
9.6 Asia Pacific Regenerative Medicine Market Size Estimation and Forecast by Application
9.7 Japan Regenerative Medicine Market Analysis
9.8 China Regenerative Medicine Market Analysis
9.9 India Regenerative Medicine Market Analysis
9.10 Australia Regenerative Medicine Market Analysis
9.11 South Korea Regenerative Medicine Market Analysis
9.12 Rest of Asia Pacific Regenerative Medicine Market Analysis
10 Latin America Regenerative Medicine Market Analysis
10.1 Key Findings
10.2 Latin America Regenerative Medicine Market Attractiveness Index
10.3 Latin America Regenerative Medicine Market by Country, 2023, 2028 & 2033 (US$ Bn)
10.4 Latin America Regenerative Medicine Market Size Estimation and Forecast by Country
10.5 Latin America Regenerative Medicine Market Size Estimation and Forecast by Product
10.6 Latin America Regenerative Medicine Market Size Estimation and Forecast by Application
10.7 Brazil Regenerative Medicine Market Analysis
10.8 Mexico Regenerative Medicine Market Analysis
10.9 Rest of Latin America Regenerative Medicine Market Analysis
11 MEA Regenerative Medicine Market Analysis
11.1 Key Findings
11.2 MEA Regenerative Medicine Market Attractiveness Index
11.3 MEA Regenerative Medicine Market by Country, 2023, 2028 & 2033 (US$ Bn)
11.4 MEA Regenerative Medicine Market Size Estimation and Forecast by Country
11.5 MEA Regenerative Medicine Market Size Estimation and Forecast by Product
11.6 MEA Regenerative Medicine Market Size Estimation and Forecast by Application
11.7 GCC Regenerative Medicine Market Analysis
11.8 South Africa Regenerative Medicine Market Analysis
11.9 Rest of MEA Regenerative Medicine Market Analysis
12 Company Profiles
12.1 Company share analysis, 2021
12.2 Amgen
12.2.1 Company Snapshot
12.2.2 Company Overview
12.2.3 Financial Analysis
12.2.3.1 Net Revenue, 2017-2021
12.2.3.2 R&D, 2017-2021
12.2.3.3 Regional Market Shares, 2021
12.2.4 Product Benchmarking
12.2.5 Strategic Outlook
12.3 Anterogen
12.3.1 Company Snapshot
12.3.2 Company Overview
12.3.3 Financial Analysis
12.3.3.1 Net Revenue, 2017-2021
12.3.3.2 R&D, 2017-2021
12.3.4 Product Benchmarking
12.4 Avita Medical, Inc.
12.4.1 Company Snapshot
12.4.2 Company Overview
12.4.3 Financial Analysis
12.4.3.1 Net Revenue, 2017-2021
12.4.3.2 R&D, 2017-2021
12.4.3.3 Regional Market Shares, 2021
12.4.4 Product Benchmarking
12.4.5 Strategic Outlook
12.5 Bio Solution Co. Ltd.
12.5.1 Company Snapshot
12.5.2 Company Overview
12.5.3 Financial Analysis
12.5.3.1 Net Revenue, 2017-2021
12.5.4 Product Benchmarking
12.5.5 Strategic Outlook
12.6 Bluebird Bio, Inc.
12.6.1 Company Snapshot
12.6.2 Company Overview
12.6.3 Financial Analysis
12.6.3.1 Net Revenue, 2017-2021
12.6.3.2 R&D, 2017-2021
12.6.4 Product Benchmarking
12.6.5 Strategic Outlook
12.7 Bristol Myers Squibb
12.7.1 Company Snapshot
12.7.2 Company Overview
12.7.3 Financial Analysis
12.7.3.1 Net Revenue, 2017-2022
12.7.3.2 R&D, 2017-2022
12.7.3.3 Regional Market Shares, 2022
12.7.4 Product Benchmarking
12.7.5 Strategic Outlook
12.8 Gilead Sciences, Inc.
12.8.1 Company Snapshot
12.8.2 Company Overview
12.8.3 Financial Analysis
12.8.3.1 Net Revenue, 2017-2022
12.8.3.2 R&D, 2017-2021
12.8.3.3 Regional Market Shares, 2022
12.8.4 Product Benchmarking
12.8.5 Strategic Outlook
12.9 Integra LifeSciences
12.9.1 Company Snapshot
12.9.2 Company Overview
12.9.3 Financial Analysis
12.9.3.1 Net Revenue, 2017-2021
12.9.3.2 R&D, 2017-2021
12.9.3.3 Regional Market Shares, 2021
12.9.4 Product Benchmarking
12.9.5 Strategic Outlook
12.10 Mesoblast Ltd
12.10.1 Company Snapshot
12.10.2 Company Overview
12.10.3 Financial Analysis
12.10.3.1 Net Revenue, 2017-2022
12.10.3.2 R&D, 2017-2021
12.10.4 Product Benchmarking
12.10.5 Strategic Outlook
12.11 Novartis AG
12.11.1 Company Snapshot
12.11.2 Company Overview
12.11.3 Financial Analysis
12.11.3.1 Net Revenue, 2017-2022
12.11.3.2 R&D, 2017-2022
12.11.3.3 Regional Market Shares, 2022
12.11.4 Product Benchmarking
12.11.5 Strategic Outlook
12.12 Organogenesis Inc.
12.12.1 Company Snapshot
12.12.2 Company Overview
12.12.3 Financial Analysis
12.12.3.1 Net Revenue, 2017-2021
12.12.3.2 R&D, 2017-2021
12.12.4 Product Benchmarking
12.12.5 Strategic Outlook
12.13 Sarepta Therapeutics, Inc.
12.13.1 Company Snapshot
12.13.2 Company Overview
12.13.3 Financial Analysis
12.13.3.1 Net Revenue, 2017-2021
12.13.3.2 R&D, 2017-2021
12.13.4 Product Benchmarking
12.13.5 Strategic Outlook
12.14 Sibiono GeneTech Co. Ltd
12.14.1 Company Snapshot
12.14.2 Company Overview
12.14.3 Product Benchmarking
12.15 Smith & Nephew plc
12.15.1 Company Snapshot
12.15.2 Company Overview
12.15.3 Financial Analysis
12.15.3.1 Net Revenue, 2017-2021
12.15.3.2 R&D, 2017-2021
12.15.3.3 Regional Market Shares, 2021
12.15.4 Product Benchmarking
12.15.5 Strategic Outlook
12.16 Terumo BCT
12.16.1 Company Snapshot
12.16.2 Company Overview
12.16.3 Financial Analysis
12.16.3.1 Net Revenue, 2017-2021
12.16.3.2 R&D, 2017-2021
12.16.3.3 Regional Market Shares, 2021
12.16.4 Product Benchmarking
12.16.5 Strategic Outlook
13 Conclusion and Recommendations
13.1 Concluding Remarks from Visiongain
13.2 Recommendations for Market Players
List of Tables
Table 1 Regenerative Medicine Market Snapshot, 2023 & 2033 (US$ billion, CAGR %)
Table 2 Regenerative Medicine Market by Region, 2023-2033 (US$ bn, AGR (%), CAGR (%)): “V” Shaped Recovery Scenario
Table 3 Regenerative Medicine Market by Region, 2023-2033 (US$ bn, AGR (%), CAGR (%)): “U” Shaped Recovery Scenario
Table 4 Regenerative Medicine Market by Region, 2023-2033 (US$ bn, AGR (%), CAGR (%)): “W” Shaped Recovery Scenario
Table 5 Regenerative Medicine Market by Region, 2023-2033 (US$ bn, AGR (%), CAGR (%)): “L” Shaped Recovery Scenario
Table 6 Regenerative Medicine Market Forecast by Product, 2023-2033 (US$ bn, AGR (%), CAGR (%))
Table 7 Regenerative Medicine Market Forecast by Stem Cell Therapy, 2023-2033 (US$ bn, AGR (%), CAGR (%))
Table 8 Stem Cell Therapy Market Forecast by Region, 2023-2033 (US$ bn, AGR%, CAGR%)
Table 9 Regenerative Medicine Market Forecast by Tissue Engineering, 2023-2033 (US$ bn, AGR (%), CAGR (%))
Table 10 Tissue Engineering Market Forecast by Region, 2023-2033 (US$ bn, AGR%, CAGR %)
Table 11 Gene Therapy Market Forecast by Region, 2023-2033 (US$ bn, AGR%, CAGR %)
Table 12 Others Market Forecast by Region, 2023-2033 (US$ bn, AGR%, CAGR %)
Table 13 Regenerative Medicine Market Forecast by Application, 2023-2033 (US$ bn, AGR (%), CAGR (%))
Table 14 Oncology Market Forecast by Region, 2023-2033 (US$ bn, AGR%, CAGR %)
Table 15 Dermatology Market Forecast by Region, 2023-2033 (US$ bn, AGR%, CAGR %)
Table 16 Musculoskeletal Market Forecast by Region, 2023-2033 (US$ bn, AGR%, CAGR %)
Table 17 Neurology Market Forecast by Region, 2023-2033 (US$ bn, AGR%, CAGR %)
Table 18 Cardiovascular Market Forecast by Region, 2023-2033 (US$ bn, AGR%, CAGR %)
Table 19 Wound Healing Market Forecast by Region, 2023-2033 (US$ bn, AGR%, CAGR %)
Table 20 Ophthalmology Market Forecast by Region, 2023-2033 (US$ bn, AGR%, CAGR %)
Table 21 Others Market Forecast by Region, 2023-2033 (US$ bn, AGR%, CAGR %)
Table 22 Regenerative Medicine Market by Region, 2023-2033 (US$ bn, AGR (%), CAGR (%))
Table 23 North America Regenerative Medicine Market Forecast by Country 2023-2033 (US$ bn, AGR%, CAGR %)
Table 24 Regenerative Medicine Market Forecast by Product, 2023-2033 (US$ bn, AGR (%), CAGR (%))
Table 25 Regenerative Medicine Market Forecast by Application, 2023-2033 (US$ bn, AGR (%), CAGR (%))
Table 26 U.S. Regenerative Medicine Market Forecast, 2023-2033 (US$ bn, AGR %, CAGR %)
Table 27 Canada Regenerative Medicine Market Forecast, 2023-2033 (US$ bn, AGR %, CAGR %)
Table 28 Europe Regenerative Medicine Market Forecast by Country, 2023-2033 (US$ bn, AGR%, CAGR %)
Table 29 Regenerative Medicine Market Forecast by Product, 2023-2033 (US$ bn, AGR (%), CAGR (%))
Table 30 Regenerative Medicine Market Forecast by Application, 2023-2033 (US$ bn, AGR (%), CAGR (%))
Table 31 Germany Regenerative Medicine Market Forecast, 2023-2033 (US$ bn, AGR%, CAGR %)
Table 32 France Regenerative Medicine Market Forecast, 2023-2033 (US$ bn, AGR%, CAGR %)
Table 33 UK Regenerative Medicine Market Forecast, 2023-2033 (US$ bn, AGR%, CAGR %)
Table 34 Italy Regenerative Medicine Market Forecast, 2023-2033 (US$ bn, AGR%, CAGR %)
Table 35 Spain Regenerative Medicine Market Forecast, 2023-2033 (US$ bn, AGR%, CAGR %)
Table 36 Russia Regenerative Medicine Market Forecast, 2023-2033 (US$ bn, AGR%, CAGR %)
Table 37 Rest of Europe Regenerative Medicine Market Forecast, 2023-2033 (US$ bn, AGR%, CAGR %)
Table 38 Asia Pacific Regenerative Medicine Market forecast by Country 2023-2033 (US$ bn, AGR%, CAGR %)
Table 39 Regenerative Medicine Market Forecast by Product, 2023-2033 (US$ bn, AGR (%), CAGR (%))
Table 40 Regenerative Medicine Market Forecast by Application, 2023-2033 (US$ bn, AGR (%), CAGR (%))
Table 41 Japan Regenerative Medicine Market Forecast, 2023-2033 (US$ billion, AGR %)
Table 42 China Regenerative Medicine Market Forecast, 2023-2033 (US$ bn, AGR%, CAGR %)
Table 43 India Regenerative Medicine Market Forecast, 2023-2033 (US$ bn, AGR%, CAGR %)
Table 44 Australia Regenerative Medicine Market Forecast, 2023-2033 (US$ bn, AGR%, CAGR %)
Table 45 South Korea Regenerative Medicine Market Forecast, 2023-2033 (US$ billion, AGR %)
Table 46 Rest of Asia Pacific Regenerative Medicine Market Forecast, 2023-2033 (US$ bn, AGR%, CAGR %)
Table 47 Latin America Regenerative Medicine Market Forecast, 2023-2033 (US$ bn, AGR%, CAGR %)
Table 48 Regenerative Medicine Market Forecast by Product, 2023-2033 (US$ bn, AGR (%), CAGR (%))
Table 49 Regenerative Medicine Market Forecast by Application, 2023-2033 (US$ bn, AGR (%), CAGR (%))
Table 50 Brazil Regenerative Medicine Market Forecast, 2023-2033 (US$ bn, AGR%, CAGR %)
Table 51 Mexico Regenerative Medicine Market Forecast, 2023-2033 (US$ bn, AGR%, CAGR %)
Table 52 Rest of Latin America Regenerative Drugs Forecast, 2023-2033 (US$ bn, AGR%, CAGR %)
Table 53 MEA Regenerative Drugs forecast by Country 2023-2033 (US$ bn, AGR%, CAGR %)
Table 54 Regenerative Medicine Market Forecast by Product, 2023-2033 (US$ Bn, AGR (%), CAGR (%))
Table 55 Regenerative Medicine Market Forecast by Application, 2023-2033 (US$ Bn, AGR (%), CAGR (%))
Table 56 GCC Regenerative Medicine Market Forecast, 2023-2033 (US$ bn, AGR%, CAGR %)
Table 57 South Africa Regenerative Medicine Market Forecast, 2023-2033 (US$ bn, AGR%, CAGR %)
Table 58 Rest of MEA Regenerative Medicine Market Forecast, 2023-2033 (US$ bn, AGR%, CAGR %)
Table 59 Amgen : Key Details, (CEO, HQ, Revenue, Founded, No. of Employees, Company Type, Website, Business Segment)
Table 60 Amgen : Product Benchmarking
Table 61 Amgen : Strategic Outlook
Table 62 Anterogen : Key Details, (CEO, HQ, Revenue, Founded, No. of Employees, Company Type, Website, Business Segment)
Table 63 Anterogen : Product Benchmarking
Table 64 Avita Medical, Inc. : Key Details, (CEO, HQ, Revenue, Founded, No. of Employees, Company Type, Website, Business Segment)
Table 65 Avita Medical , Inc. : Product Benchmarking
Table 66 Avita Medical , Inc. : Strategic Outlook
Table 67 Bio Solution Co. Ltd.: Key Details, (CEO, HQ, Revenue, Founded, No. of Employees, Company Type, Website, Business Segment)
Table 68 Bio Solution Co. Ltd .: Product Benchmarking
Table 69 Bio Solution Co. Ltd .: Strategic Outlook
Table 70 Bluebird Bio, Inc.: Key Details, (CEO, HQ, Revenue, Founded, No. of Employees, Company Type, Website, Business Segment)
Table 71 Bluebird Bio, Inc.: Product Benchmarking
Table 72 Bluebird Bio, Inc.: Strategic Outlook
Table 73 Bristol Myers Squibb : Key Details, (CEO, HQ, Revenue, Founded, No. of Employees, Company Type, Website, Business Segment)
Table 74 Bristol Myers Squibb : Product Benchmarking
Table 75 Bristol Myers Squibb : Strategic Outlook
Table 76 Gilead Sciences, Inc. : Key Details, (CEO, HQ, Revenue, Founded, No. of Employees, Company Type, Website, Business Segment)
Table 77 Gilead Sciences, Inc. : Product Benchmarking
Table 78 Gilead Science, Inc. : Strategic Outlook
Table 79 Integra LifeSciences :(CEO, HQ, Revenue, Founded, No. of Employees, Company Type, Website, Business Segment)
Table 80 Integra LifeSciences : Product Benchmarking
Table 81 Integra LifeSciences .: Strategic Outlook
Table 82 Mesoblast Ltd : (CEO, HQ, Revenue, Founded, No. of Employees, Company Type, Website, Business Segment)
Table 83 Mesoblast Ltd : Product Benchmarking
Table 84 Mesoblast Ltd .: Strategic Outlook
Table 85 Novartis AG ,: Key Details, (CEO, HQ, Revenue, Founded, No. of Employees, Company Type, Website, Business Segment)
Table 86 Novartis AG: : Product Benchmarking
Table 87 Novartis AG: .: Strategic Outlook
Table 88 Organogenesis Inc. :(CEO, HQ, Revenue, Founded, No. of Employees, Company Type, Website, Business Segment)
Table 89 Organogenesis Inc. : Product Benchmarking
Table 90 Organogenesis Inc.: Strategic Outlook
Table 91 Sarepta Therapeutics, Inc. :(CEO, HQ, Revenue, Founded, No. of Employees, Company Type, Website, Business Segment)
Table 92 Sarepta Therapeutics, Inc.: Product Benchmarking
Table 93 Sarepta Therapeutics, Inc..: Strategic Outlook
Table 94 Sibiono GeneTech Co. Ltd :(CEO, HQ, Revenue, Founded, No. of Employees, Company Type, Website, Business Segment)
Table 95 Sibiono GeneTech Co. Ltd : Product Benchmarking
Table 96 Smith & Nephew plc,: Key Details, (CEO, HQ, Revenue, Founded, No. of Employees, Company Type, Website, Business Segment)
Table 97 Smith & Nephew: : Product Benchmarking
Table 98 Smith & Nephew: .: Strategic Outlook
Table 99 Terumo BCT,: Key Details, (CEO, HQ, Revenue, Founded, No. of Employees, Company Type, Website, Business Segment)
Table 100 Terumo BCT: : Product Benchmarking
Table 101 Terumo BCT: .: Strategic Outlook
List of Figures
Figure 1 Regenerative Medicine Market Segmentation
Figure 2 Regenerative Medicine Market by Product: Market Attractiveness Index
Figure 3 Regenerative Medicine Market Attractiveness Index by Application
Figure 4 Regenerative Medicine Market Attractiveness Index by Region
Figure 5 Regenerative Medicine Market: Market Dynamics
Figure 6 COVID Impact Analysis: Regenerative Medicine Market Recovery Scenarios
Figure 7 Regenerative Medicine Market by Region, 2023-2033 (US$ bn, AGR (%), CAGR (%)): “V” Shaped Recovery
Figure 8 Regenerative Medicine Market by Region, 2023-2033 (US$ bn, AGR (%), CAGR (%)): “U” Shaped Recovery
Figure 9 Regenerative Medicine Market by Region, 2023-2033 (US$ bn, AGR (%), CAGR (%)): “W” Shaped Recovery
Figure 10 Regenerative Medicine Market by Region, 2023-2033 (US$ bn, AGR (%), CAGR (%)): “L” Shaped Recovery
Figure 11 Regenerative Medicine Market: Porter’s Five Forces Analysis
Figure 12 Regenerative Medicine Market: PEST Analysis
Figure 13 Regenerative Medicine Market by Product: Market Attractiveness Index
Figure 14 Regenerative Medicine Market Forecast by Product , 2023-2033 (US$ billion)
Figure 15 Regenerative Medicine Market Share Forecast by Product, 2023-2033 (%)
Figure 16 Stem Cell Therapy Market Forecast by Region, 2023-2033 (US$ billion)
Figure 17 Stem Cell Therapy Market Share Forecast by Region, 2023 & 2033 (%)
Figure 18 Tissue Engineering Market Forecast by Region, 2023-2033 (US$ billion)
Figure 19 Tissue Engineering Market Share Forecast by Region, 2023 & 2033 (%)
Figure 20 Gene Therapy Market Forecast by Region, 2023-2033 (US$ billion)
Figure 21 Gene Therapy Market Share Forecast by Region, 2023 & 2033 (%)
Figure 22 Others Market Forecast by Region, 2023-2033 (US$ billion)
Figure 23 Others Market Share Forecast by Region, 2023 & 2033 (%)
Figure 24 Regenerative Medicine Market by Application: Market Attractiveness Index
Figure 25 Regenerative Medicine Market Forecast by Application , 2023-2033 (US$ billion)
Figure 26 Regenerative Medicine Market Share Forecast by Application, 2023-2033 (%)
Figure 27 Oncology Market Forecast by Region, 2023-2033 (US$ billion)
Figure 28 Oncology Market Share Forecast by Region, 2023 & 2033 (%)
Figure 29 Dermatology Market Forecast by Region, 2023-2033 (US$ billion)
Figure 30 Dermatology Market Share Forecast by Region, 2023 & 2033 (%)
Figure 31 Musculoskeletal Market Forecast by Region, 2023-2033 (US$ billion)
Figure 32 Musculoskeletal Market Share Forecast by Region, 2023 & 2033 (%)
Figure 33 Neurology Market Forecast by Region, 2023-2033 (US$ billion)
Figure 34 Neurology Market Share Forecast by Region, 2023 & 2033 (%)
Figure 1 Cardiovascular Market Forecast by Region, 2023-2033 (US$ billion)
Figure 2 Cardiovascular Market Share Forecast by Region, 2023 & 2033 (%)
Figure 3 Wound Healing Market Forecast by Region, 2023-2033 (US$ billion)
Figure 4 Wound Healing Market Share Forecast by Region, 2023 & 2033 (%)
Figure 5 Ophthalmology Market Forecast by Region, 2023-2033 (US$ billion)
Figure 6 Ophthalmology Market Share Forecast by Region, 2023 & 2033 (%)
Figure 7 Others Market Forecast by Region, 2023-2033 (US$ billion)
Figure 8 Others Market Share Forecast by Region, 2023 & 2033 (%)
Figure 9 Regenerative Medicine Market by Region: Market Attractiveness Index
Figure 10 Regenerative Medicine Market by Region, 2023-2033 (US$ bn)
Figure 11 Regenerative Medicine Market Share Forecast by Region 2023, 2033(%)
Figure 12 North America Regenerative Medicine Market Attractiveness Index
Figure 13 North America Regenerative Medicine Market by Region, 2023, 2028 & 2033 (US$ billion)
Figure 14 North America Regenerative Medicine Market Forecast by Country, 2023-2033 (US$ billion)
Figure 15 North America Regenerative Medicine Market Share Forecast by Country, 2023 & 2033 (%)
Figure 16 North America Regenerative Medicine Market Forecast by Product, 2023-2033 (US$ billion)
Figure 17 North America Regenerative Medicine Market Share Forecast by Product, 2023 & 2033 (%)
Figure 18 North America Regenerative Medicine Market Forecast by Application, 2023-2033 (US$ billion)
Figure 19 North America Regenerative Medicine Market Share Forecast by Application, 2023 & 2033 (%)
Figure 20 U.S. Regenerative Medicine Market Forecast, 2023-2033 (US$ billion, AGR %)
Figure 21 Canada Regenerative Medicine Market Forecast, 2023-2033 (US$ billion, AGR %)
Figure 22 Europe Regenerative Medicine Market Attractiveness Index
Figure 23 Europe Regenerative Medicine Market by Region, 2023, 2028 & 2033 (US$ billion)
Figure 24 Europe Regenerative Medicine Market Forecast by Country, 2023-2033 (US$ billion)
Figure 25 Europe Regenerative Medicine Market Share Forecast by Country, 2023 & 2033 (%)
Figure 26 Europe Regenerative Medicine Market Forecast by Product, 2023-2033 (US$ billion)
Figure 27 Europe Regenerative Medicine Market Share Forecast by Product, 2023 & 2033 (%)
Figure 28 Europe Regenerative Medicine Market Forecast by Application, 2023-2033 (US$ billion)
Figure 29 Europe Regenerative Medicine Market Share Forecast by Application, 2023 & 2033 (%)
Figure 30 Germany Regenerative Medicine Market Forecast, 2023-2033 (US$ billion, AGR %)
Figure 31 France Regenerative Medicine Market Forecast, 2023-2033 (US$ billion, AGR %)
Figure 32 UK Regenerative Medicine Market Forecast, 2023-2033 (US$ billion, AGR %)
Figure 33 Italy Regenerative Medicine Market Forecast, 2023-2033 (US$ billion, AGR %)
Figure 34 Spain Regenerative Medicine Market Forecast, 2023-2033 (US$ billion, AGR %)
Figure 35 Russia Regenerative Medicine Market Forecast, 2023-2033 (US$ billion, AGR %)
Figure 36 Rest of Europe Regenerative Medicine Market Forecast, 2023-2033 (US$ billion, AGR %)
Figure 37 Asia Pacific Regenerative Medicine Market Attractiveness Index
Figure 38 Asia Pacific Regenerative Medicine Market by Region, 2023, 2028 & 2033 (US$ billion)
Figure 39 Asia Pacific Regenerative Medicine Market Forecast, 2023-2033 (US$ billion, AGR %)
Figure 40 Asia Pacific Regenerative Medicine Market Share Forecast by Country, 2023 & 2033 (%)
Figure 41 Asia Pacific Regenerative Medicine Market Forecast by Product, 2023-2033 (US$ billion)
Figure 42 Asia Pacific Regenerative Medicine Market Share Forecast by Product, 2023 & 2033 (%)
Figure 43 Asia Pacific Regenerative Medicine Market Forecast by Application, 2023-2033 (US$ billion)
Figure 44 Asia Pacific Regenerative Medicine Market Share Forecast by Application, 2023 & 2033 (%)
Figure 45 Japan Regenerative Medicine Market Forecast, 2023-2033 (US$ billion, AGR %)
Figure 46 China Regenerative Medicine Market Forecast, 2023-2033 (US$ billion, AGR %)
Figure 47 India Regenerative Medicine Market Forecast, 2023-2033 (US$ billion, AGR %)
Figure 48 Australia Regenerative Medicine Market Forecast, 2023-2033 (US$ billion, AGR %)
Figure 49 South Korea Regenerative Medicine Market Forecast, 2023-2033 (US$ billion, AGR %)
Figure 50 Rest of Asia Pacific Regenerative Medicine Market Forecast, 2023-2033 (US$ billion, AGR %)
Figure 51 Latin America Regenerative Medicine Market Attractiveness Index
Figure 52 Latin America Regenerative Medicine Market by Country, 2023, 2028 & 2033 (US$ billion)
Figure 53 Latin America Regenerative Medicine Market Forecast by Country, 2023-2033 (US$ billion)
Figure 54 Latin America Regenerative Medicine Market Share Forecast by Country, 2023 & 2033 (%)
Figure 55 Latin America Regenerative Medicine Market Forecast by Product, 2023-2033 (US$ billion)
Figure 56 Latin America Regenerative Medicine Market Share Forecast by Product, 2023 & 2033 (%)
Figure 57 Latin America Regenerative Medicine Market Forecast by Application, 2023-2033 (US$ billion)
Figure 58 Latin America Regenerative Medicine Market Share Forecast by Application, 2023 & 2033 (%)
Figure 59 Brazil Regenerative Medicine Market Forecast, 2023-2033 (US$ billion, AGR %)
Figure 60 Mexico Regenerative Medicine Market Forecast, 2023-2033 (US$ billion, AGR %)
Figure 61 Rest of Latin America Regenerative Medicine Market Forecast, 2023-2033 (US$ billion, AGR %)
Figure 62 MEA Regenerative Medicine Market Attractiveness Index
Figure 63 MEA Regenerative Medicine Market by Country, 2023, 2028 & 2033 (US$ billion)
Figure 64 MEA Regenerative Medicine Market Forecast by Country, 2023-2033 (US$ billion)
Figure 65 MEA Regenerative Medicine Market Share Forecast by Country, 2023 & 2033 (%)
Figure 66 MEA Regenerative Medicine Market Forecast by Product, 2023-2033 (US$ billion)
Figure 67 MEA Regenerative Medicine Market Share Forecast by Product, 2023 & 2033 (%)
Figure 68 MEA Regenerative Medicine Market Forecast by Application, 2023-2033 (US$ billion)
Figure 69 MEA Regenerative Medicine Market Share Forecast by Application, 2023 & 2033 (%)
Figure 70 GCC Regenerative Medicine Market Forecast, 2023-2033 (US$ billion, AGR %)
Figure 71 South Africa Regenerative Medicine Market Forecast, 2023-2033 (US$ billion, AGR %)
Figure 72 Rest of MEA Regenerative Medicine Market Forecast, 2023-2033 (US$ billion, AGR %)
Figure 73 Company Share Analysis, 2021
Figure 74 Amgen; Net Revenue, 2017-2021 (US$ million, AGR %)
Figure 75 Amgen; R&D, 2017-2021 (US$ million, AGR %)
Figure 76 Amgen: Regional Market Shares, 2021
Figure 77 Anterogen; Net Revenue, 2017-2021 (US$ million, AGR %)
Figure 78 Anterogen; R&D, 2017-2021 (US$ million, AGR %)
Figure 79 Avita Medical Inc.: Net Revenue, 2017-2021 (US$ million, AGR %)
Figure 80 Avita Medical, Inc.: R&D, 2017-2021 (US$ million, AGR %)
Figure 81 Avita Medical , Inc.: Regional Market Shares, 2021
Figure 82 Bio Solution Co. Ltd: Net Revenue, 2017-2021 (US$ million, AGR %)
Figure 83 Bluebird Bio, Inc.: Net Revenue, 2017-2021 (US$ million, AGR %)
Figure 84 Bluebird Bio, Inc.: R&D, 2017-2021 (US$ million, AGR %)
Figure 85 Bristol Myers Squibb: Net Revenue, 2017-2022 (US$ million, AGR%)
Figure 86 Bristol Myers Squibb; R&D, 2017-2022 (US$ million, AGR %)
Figure 87 Bristol Myers Squibb: Regional Market Shares, 2022
Figure 88 Gilead Sciences, Inc.: Net Revenue, 2017-2022 (US$ million, AGR%)
Figure 89 Gilead Sciences, Inc.: R&D, 2017-2022 (US$ million, AGR %)
Figure 90 Gilead Sciences, Inc.: Regional Market Shares, 2022
Figure 91 Integra LifeSciences.: Net Revenue, 2017-2021 (US$ million, AGR %)
Figure 92 Integra LifeSciences.: R&D, 2017-2021 (US$ million, AGR %)
Figure 93 Integra LifeSciences: Regional Market Shares, 2021
Figure 94 Mesoblast Ltd.: Net Revenue, 2017-2022 (US$ million, AGR %)
Figure 95 Mesoblast Ltd.: R&D, 2017-2021 (US$ million, AGR %)
Figure 96 Novartis AG: Net Revenue, 2017-2022 (US$ million, AGR %)
Figure 97 Novartis AG: R&D, 2017-2022 (US$ million, AGR %)
Figure 98 Novartis AG:: Regional Market Shares, 2022
Figure 99 Organogenesis Inc.: Net Revenue, 2017-2021 (US$ million, AGR %)
Figure 100 Organogenesis Inc.: R&D, 2017-2021 (US$ million, AGR %)
Figure 101 Sarepta Therapeutics, Inc..: Net Revenue, 2017-2021 (US$ million, AGR %)
Figure 102 Sarepta Therapeutics, Inc.: R&D, 2017-2021 (US$ million, AGR %)
Figure 103 Smith & Nephew: Net Revenue, 2017-2021 (US$ million, AGR%)
Figure 104 Smith & Nephew:; R&D, 2017-2021 (US$ million, AGR%)
Figure 105 Smith & Nephew:: Regional Market Shares, 2021
Figure 106 Terumo BCT: Net Revenue, 2017-2021 (US$ million, AGR%)
Figure 107 Terumo BCT: R&D, 2017-2021 (US$ million, AGR %)
Figure 108 Terumo BCT:: Regional Market Shares, 2021
ページTOPに戻る
本レポートと同じKEY WORD(gene)の最新刊レポート
よくあるご質問
Visiongain社はどのような調査会社ですか?
英国の調査会社ヴィジョンゲイン社(Visiongain)は、通信とエネルギーのほか、自動車や化学・医薬品、金属など、広範な市場を対象に調査を行っています。自動車市場については、市場全般に関する調査のほ... もっと見る
調査レポートの納品までの日数はどの程度ですか?
在庫のあるものは速納となりますが、平均的には 3-4日と見て下さい。
但し、一部の調査レポートでは、発注を受けた段階で内容更新をして納品をする場合もあります。
発注をする前のお問合せをお願いします。
注文の手続きはどのようになっていますか?
1)お客様からの御問い合わせをいただきます。
2)見積書やサンプルの提示をいたします。
3)お客様指定、もしくは弊社の発注書をメール添付にて発送してください。
4)データリソース社からレポート発行元の調査会社へ納品手配します。
5) 調査会社からお客様へ納品されます。最近は、pdfにてのメール納品が大半です。
お支払方法の方法はどのようになっていますか?
納品と同時にデータリソース社よりお客様へ請求書(必要に応じて納品書も)を発送いたします。
お客様よりデータリソース社へ(通常は円払い)の御振り込みをお願いします。
請求書は、納品日の日付で発行しますので、翌月最終営業日までの当社指定口座への振込みをお願いします。振込み手数料は御社負担にてお願いします。
お客様の御支払い条件が60日以上の場合は御相談ください。
尚、初めてのお取引先や個人の場合、前払いをお願いすることもあります。ご了承のほど、お願いします。
データリソース社はどのような会社ですか?
当社は、世界各国の主要調査会社・レポート出版社と提携し、世界各国の市場調査レポートや技術動向レポートなどを日本国内の企業・公官庁及び教育研究機関に提供しております。
世界各国の「市場・技術・法規制などの」実情を調査・収集される時には、データリソース社にご相談ください。
お客様の御要望にあったデータや情報を抽出する為のレポート紹介や調査のアドバイスも致します。
|
|


