RNAベースの治療薬とワクチン市場レポート:2022-2032
RNA Based Therapeutics and Vaccines Market Report 2022-2032
レポート詳細
RNAベースの治療薬とワクチン市場レポート 2022-2032 :本レポートは、新たな収益の柱を目指すリーディングカンパニーが、業界とその背景にあるダイナミクスをより深く理解する上で、非... もっと見る
※上記価格は部署ライセンス(Departmental licence)価格です。
その他の価格についてはデータリソースまでお問合せください。
日本語のページは自動翻訳を利用し作成しています。
実際のレポートは英文のみでご納品いたします。

|

|
サマリー
レポート詳細
RNAベースの治療薬とワクチン市場レポート 2022-2032:本レポートは、新たな収益の柱を目指すリーディングカンパニーが、業界とその背景にあるダイナミクスをより深く理解する上で、非常に有益なものとなるはずです。また、異業種への進出や新地域での既存事業の拡大を目指す企業にとっても有用なレポートです。
CRISPRベースのRNA編集は有利な成長見通しを提供する
CRISPR(Clustered Regularly Interspaced Short Palindromic Repeat)は、バクテリアから得られるCas9タンパク質を用いて、ゲノムの特定部位に二本鎖切断を挿入するRNA誘導型の遺伝子編集技術である。この技術を用いることで、細菌は侵入してきた病原体から短い核酸配列を奪い取り、CRISPR遺伝子座の繰り返し配列と混在させることができる。CRISPR遺伝子座の転写によって生成された低分子RNAによって、細菌のエンドヌクレアーゼ群が誘導され、侵入してきた病原体のゲノムを分割する。この方法は、日常生活の中でゲノム編集を可能にする有力な方法として受け入れられている
いくつかの新規および既存のDNA編集企業がRNA分野への進出を宣言しており、マサチューセッツ州ボストンを拠点とするビーム・セラピューティクスは、いくつかの血液疾患の治療法としてCRISPR DNA編集を研究しています。また、サンディエゴに拠点を置くLocana社は、ハンチントン病や運動ニューロン障害といった病気の治療法として、CRISPRを用いたRNA編集を研究しています。
RNAベースの医薬品の数多くの開発ポテンシャル
RNAベースの治療法は、一般的な遺伝子疾患と稀な遺伝子疾患の両方を治療できる可能性があるため、RNAベースの治療法は多くの研究を集めている。この種の研究はまだ進行中であり、したがって、これらの治療法を最初に商業化した企業は、ライバルに対して競争上の優位性を持つことになる。現在、アンチセンス技術に基づくRNAベースの医薬品は、わずか3種類しか市販されていない。ヌシネルセン(Ionis Pharmaceuticals)、エテプリルセン(Sarepta Therapeutics)、イノテルセン(Ionis Pharmaceuticals and Akcea Therapeutics)の3つのASO医薬品がこれまでにFDAによって承認されている。このように、近い将来、RNAを利用した医薬品の開発・販売には多くの可能性があります。
マーケットリサーチレポートを購入する前に、どのような質問をすべきでしょうか?
- RNA治療薬市場はどのように進化しているのか?
- RNA治療薬市場の推進要因と抑制要因は何か?
- 各RNA治療薬サブマーケットセグメントは予測期間中にどのように成長し、2032年にこれらのサブマーケットが占める収益はどの程度になるのでしょうか?
- 2022年から2032年にかけて、各RNA治療薬サブマーケットの市場シェアはどのように推移するのでしょうか?
- 2022年から2032年にかけて、市場全体の主な推進力は何でしょうか?
- 主要なRNA治療薬市場はマクロ経済の力学に概ね従うのか、それとも個々の国内市場が他を凌駕するのか?
- 2032年までに各国市場のシェアはどのように変化し、どの地域が2032年に市場をリードするのでしょうか?
- 主要プレイヤーは誰か、予測期間中の展望は?
- これらの主要企業のRNA治療薬プロジェクトはどのようなものでしょうか?
- 2022年から2032年の間に、業界はどのように進化していくのでしょうか?また
現在および今後10年間に実施されるRNA治療薬プロジェクトにはどのような意味がありますか?
- RNA治療薬市場をさらに拡大するために、製品の商業化の必要性は高まっていますか?
- RNA治療薬市場はどこに向かい、どのようにすれば市場の最前線に立てるか?
- 新製品やサービスラインに対する最適な投資オプションは何か?
- 企業を新たな成長軌道に乗せ、C-suiteに移行させるための重要な展望とは?
このことが、現在、そして今後10年間のRNA治療薬市場にどのような影響を与えるかを知る必要があります。
- 223ページにわたる本レポートでは、96の表と146のグラフを独占的に提供します。
- このレポートでは、業界における主要な収益性の高い分野に焦点を当て、お客様が今すぐターゲットとできるような情報を提供しています。
- 世界、地域、国別の売上高と成長率を詳細に分析しています。
- 競合他社が成功した主なトレンド、変化、収益予測をハイライトしています。
本レポートは、RNA治療薬市場が今後10年間にどのように発展し、COVID-19の景気後退と回復の変動に沿うものであるかを今日あなたに教えてくれます。この市場は、過去10年間のどの時点よりも、今がより重要なのです。
2032年までの予測やその他の分析により、商業的な展望が見えてくる
- 2032年までの収益予測に加え、直近の実績、成長率、市場シェアもご覧いただけます。
- ビジネスの展望や展開など、独自の分析もご覧いただけます。
- 定性的分析(市場力学、ドライバー、機会、阻害要因など)、ポーターの5つの力分析、PEST分析、最近の動向などをご覧いただけます。
本レポートでは、COVID-19が業界と貴社にどのような影響を及ぼすかについて、データ分析と貴重な洞察を掲載しています。本レポートでは、COVID-19の4つの回収パターンとその影響、すなわち「V」、「L」、「W」、「U」について論じています。
報告書の対象セグメント
タイプ
- RNAアンチセンス技術
- RNA干渉(RNAi)技術
アプリケーション
・遺伝性疾患
- 脊髄性筋萎縮症(SMA)
- 癌
- 急性肝性ポルフィリン症 (AHP)
- デュシェンヌ型筋ジストロフィー(DMD)
- その他
・自己免疫疾患
- 眼科領域
- 腫瘍学
- 糖尿病
- 関節リウマチ(RA)
- その他
エンドユーザー
- 研究機関
- 病院・クリニック
世界市場全体とセグメントの収益予測に加え、5つの地域と20の主要国市場の収益予測も掲載しています。
北米
- 米国
- カナダ
欧州
- ドイツ
- 英国
- フランス
- イタリア
- スペイン
- その他の欧州
アジア太平洋
- 日本
- 中国
- インド
- オーストラリア
- 韓国
- その他のアジア太平洋地域
ラテンアメリカ
- ブラジル
- メキシコ
- その他のラテンアメリカ地域
MEA
- GCC
- 南アフリカ
- その他のMEA
RNA治療薬市場の主要企業のプロファイルと2022年から2032年まで、これらの企業のこのセグメントに焦点を当てた内容も含まれています。
主要企業と市場成長の可能性
・ Alnylam Pharmaceuticals, Inc.
・ Arbutus Biopharma
・ Arrowhead Pharmaceuticals, Inc.
・ Benitec Biopharma
・ Biogen
・ Genzyme (Sanofi)
・ Gradalis, Inc.
・ Ionis Pharmaceuticals, Inc.
・ Orna Therapeutics
・ Sarepta Therapeutics, Inc.
・ Silence Therapeutics
RNA治療薬市場の世界全体の収益、2022年から2032年まで 金額ベースで、市場は2022年に69億9210万米ドルを超えると、当研究所は算出しています。2032年までの間に収益が大きく伸びると予測しています。本調査では、最も大きな可能性を秘めた組織を特定します。彼らの能力、進歩、商業的展望を知ることで、一歩先を行くことができます。
RNA治療薬市場、2022年から2032年までのレポートはどのように役立つのでしょうか?
210ページを超えるレポートでは、要約すると以下のような知識を得ることができます。
- RNA治療薬市場、2022年から2032年までの収益予測 世界と地域レベルでタイプ、用途、エンドユーザーごとに予測 - 業界の展望を見出し、投資と収益に最も有利な場所を発見します。
- 5つの地域と20の主要国市場の2032年までの収益予測 - RNA治療薬市場、北米、欧州、アジア太平洋、中南米、MEAの2022年から2032年までの市場予測をご覧いただけます。また、米国、カナダ、メキシコ、ブラジル、ドイツ、フランス、英国、イタリア、中国、インド、日本、オーストラリアなどの主要経済圏の市場も予測されています。
- 既存企業および市場参入を目指す企業の展望 - RNA治療薬市場に関わる主要企業11社の企業プロファイルを含む、2022年から2032年までの展望。
定量的・定性的な分析と独自の予測をご覧いただけます。私たちのレポートだけが持つ情報を入手し、貴重なビジネスインテリジェンスを得ることができます。
他にはない情報
私たちの新しいレポートがあれば、知識の遅れを取り戻し、チャンスを逃す可能性が低くなります。私たちの研究が貴社の研究、分析、意思決定にどのように役立つかをご覧ください。Visiongainの研究は、RNA治療薬市場、2022年から2032年、市場をリードする企業のための商業分析を必要とするすべての人のためのものです。データ、トレンド、予測をご覧いただけます。
ページTOPに戻る
目次
目次
1.レポートの概要
1.1 研究の目的
1.2 RNA治療薬市場の紹介
1.3 本レポートが提供するもの
1.4 本レポートを読むべき理由
1.5 本分析レポートが回答する主な質問には以下が含まれます
1.6 本レポートは誰のためのものなのか
1.7 方法論
1.7.1 市場の定義
1.7.2 市場評価・予測手法
1.7.3 データの検証
1.8 よくある質問と回答(FAQ)
1.9 関連するVisiongainレポート
1.10 Visiongainについて
2 エグゼクティブサマリー
3 市場の概要
3.1 主要な調査結果
3.2 マーケットダイナミクス
3.2.1 市場の推進要因
3.2.2 市場の抑制要因
3.2.3 市場機会
3.3 市場動向
3.3.1 DNA療法に代わるより安全な治療法
3.3.2 勢いを増す新たな治療法
3.3.3 RNA分子の多用途性
3.3.4 RNA治療薬のパイプライン分析
3.4 COVID-19の影響度分析
3.5 ポーターのファイブフォース分析
3.5.1 供給者パワー
3.5.2 バイヤーパワー
3.5.3 競合他社の競争力
3.5.4 代替品による脅威
3.5.5 新規参入者の脅威
3.6 RNA療法 医薬品別売上高予測(2022年~2025年)
4 RNA治療薬市場分析:技術別
4.1 主な調査結果
4.2 タイプ別成長展望
4.3 RNA治療薬のタイプ別市場規模の推定と予測
4.4 RNAアンチセンス技術
4.4.1 地域別市場予測、2022年~2032年 (US$ Mn)
4.4.2 地域別市場シェア、2022年&2032年(%)
4.5 RNA干渉(RNAi)技術
4.5.1 地域別市場予測、2022年~2032年(US$ Mn)
4.5.2 地域別市場シェア、2022年&2032年(%)
5 RNA治療薬市場分析:用途別
5.1 主な調査結果
5.2 用途別成長展望
5.3 RNA治療薬の用途別市場規模の推定と予測
5.4 遺伝子疾患
5.4.1 地域別市場予測、2022年〜2032年 (US$ Mn)
5.4.2 地域別市場シェア、2022年&2032年(%)
5.4.3 遺伝子疾患別市場予測、2022年~2032年(US$ Mn)
5.5 自己免疫疾患
5.5.1 地域別市場予測、2022年〜2032年 (US$ Mn)
5.5.2 地域別市場シェア、2022年&2032年(%)
5.5.3 自己免疫疾患別市場予測、2022年~2032年 (US$ Mn)
6 RNA治療薬市場分析:エンドユーザー別
6.1 主な調査結果
6.2 エンドユーザーセグメントの成長展望
6.3 RNA治療薬のエンドユーザー別市場規模の推定と予測
6.4 研究機関
6.4.1 地域別市場予測、2022年〜2032年 (US$ Mn)
6.4.2 地域別市場シェア、2022年&2032年(%)
6.5 病院・診療所
6.5.1 地域別市場予測、2022年~2032年 (US$ Mn)
6.5.2 地域別市場シェア、2022年&2032年(%)
7 RNA治療薬市場分析:地域別
7.1 主要な調査結果
7.2 地域別市場規模の推定と予測
7.3 COVID-19のインパクト分析。回復シナリオ(V, U, W, L)
8 北米のRNA治療薬市場分析
8.1 主な調査結果
8.2 北米RNA治療薬市場の魅力度指数
8.3 国別市場規模、2022年、2027年&2032年(US$ Mn)
8.4 国別市場規模予測・予測、2022年~2032年(US$ Mn)
8.5 タイプ別市場規模推定・予測、2022年~2032年(US$ Mn)
8.6 用途別市場規模予測・予測、2022年~2032年 (US$ Mn)
8.7 エンドユーザー別市場規模推定・予測、2022年~2032年 (US$ Mn)
8.8 米国
8.9 カナダ
9 欧州のRNA治療薬市場分析
9.1 主な調査結果
9.2 欧州RNA治療薬市場の魅力度指数
9.3 国別市場規模、2022年、2027年&2032年(US$ Mn)
9.4 国別市場規模予測・予測、2022年~2032年(US$ Mn)
9.5 タイプ別市場規模推定・予測、2022年~2032年(US$ Mn)
9.6 用途別市場規模予測・予測、2022年~2032年 (US$ Mn)
9.7 エンドユーザー別市場規模予測・予測、2022年~2032年 (US$ Mn)
9.8 ドイツ
9.9 イギリス
9.10 フランス
9.11 イタリア
9.12 スペイン
9.13 その他の欧州
10 アジア太平洋地域のRNA治療薬市場分析
10.1 主な調査結果
10.2 アジア太平洋地域のRNA治療薬市場の魅力度指数
10.3 国別市場規模、2022年、2027年&2032年 (US$Mn)
10.4 国別市場規模予測・予測、2022年~2032年(US$ Mn)
10.5 タイプ別市場規模推定・予測、2022年~2032年(US$ Mn)
10.6 用途別市場規模予測・予測、2022年~2032年 (US$ Mn)
10.7 エンドユーザー別市場規模予測・予測、2022年~2032年 (US$ Mn)
10.8 日本
10.9 中国
10.10 インド
10.11 オーストラリア
10.12 韓国
10.13 その他のアジア太平洋地域
11 ラテンアメリカのRNA治療薬市場分析
11.1 主な調査結果
11.2 ラテンアメリカのRNA治療薬市場の魅力度指数
11.3 国別市場規模、2022年、2027年&2032年 (US$Mn)
11.4 国別市場規模予測・予測、2022年~2032年(US$ Mn)
11.5 タイプ別市場規模推定・予測、2022年~2032年(US$ Mn)
11.6 用途別市場規模予測・予測、2022年~2032年 (US$ Mn)
11.7 エンドユーザー別市場規模予測・予測、2022年~2032年 (US$ Mn)
11.8 ブラジル
11.9 メキシコ
11.10 ラテンアメリカの残りの地域
12 MEAのRNA治療薬市場分析
12.1 主要な調査結果
12.2 MEAのRNA治療薬市場の魅力度指数
12.3 国別市場規模、2022年、2027年&2032年 (US$Mn)
12.4 国別市場規模予測・予測、2022年~2032年(US$ Mn)
12.5 タイプ別市場規模推定・予測、2022年~2032年(US$ Mn)
12.6 用途別市場規模予測・予測、2022年~2032年 (US$ Mn)
12.7 エンドユーザー別市場規模推定・予測、2022年~2032年 (US$ Mn)
12.8 GCC
12.9 南アフリカ
12.10 MEAの残りの地域
13 会社概要
13.1 主要な事業戦略
13.2 アルニラム社
13.2.1 会社概要
13.2.2 会社概要
13.2.3 財務分析
13.2.4 製品ベンチマーク
13.2.5 戦略的な展望
13.3 アービュタス・バイオファーマ
13.3.1 会社概要
13.3.2 会社概要
13.3.3 財務分析
13.3.4 製品ベンチマーク
13.3.5 戦略的展望
13.4 アローヘッド・ファーマシューティカルズ・インク
13.4.1 企業スナップショット
13.4.2 会社概要
13.4.3 財務分析
13.4.4 製品ベンチマーク
13.4.5 戦略的展望
13.5 ベニテックバイオファーマ
13.5.1 企業スナップショット
13.5.2 会社概要
13.5.3 財務分析
13.5.4 製品ベンチマーク
13.6 バイオジェン
13.6.1 企業スナップショット
13.6.2 会社概要
13.6.3 財務分析
13.6.4 製品ベンチマーク
13.6.5 戦略的展望
13.7 ジェンザイム(サノフィ)
13.7.1 企業スナップショット
13.7.2 会社概要
13.7.3 財務分析
13.7.4 製品ベンチマーク
13.7.5 戦略的展望
13.8 グラダリス社
13.8.1 企業スナップショット
13.8.2 会社概要
13.8.3 製品ベンチマーク
13.9 イオニス・ファーマシューティカルズ・インク
13.9.1 企業スナップショット
13.9.2 会社概要
13.9.3 財務分析
13.9.4 ベンチマーキング
13.9.5 戦略的展望
13.10 オルナ セラピューティック
13.10.1 会社概要
13.10.2 会社概要
13.10.3 製品ベンチマーク
13.10.4 戦略的展望
13.11 サレプタ・セラピューティクス
13.11.1 企業スナップショット
13.11.2 会社概要
13.11.3 財務分析
13.11.4 製品ベンチマーク
13.11.5 戦略的な展望
13.12 サイレンス・セラピューティック
13.12.1 企業スナップショット
13.12.2 会社概要
13.12.3 財務分析
13.12.4 製品ベンチマーク
14 結論と提言
14.1 ビジョンゲインからの結論
14.2 市場関係者への提言
表の一覧
Table 1 RNA Therapeutics Market Snapshot, 2022 & 2032 (US$ million, CAGR %)
Table 2 Status of RNA Therapies
Table 3 RNA Therapeutics Pipeline Analysis
Table 4 RNA Therapeutics Market Forecast by Region, 2022-2032 (US$ mn, AGR%, CAGR%): "V" Shaped Recovery
Table 5 RNA Therapeutics Market Forecast by Region, 2022-2032 (US$ mn, AGR%, CAGR%): "U" Shaped Recovery
Table 6 RNA Therapeutics Market Forecast by Region, 2022-2032 (US$ mn, AGR%, CAGR%): "W" Shaped Recovery
Table 7 RNA Therapeutics Market Forecast by Region, 2022-2032 (US$ mn, AGR%, CAGR%): "L" Shaped Recovery
Table 8 RNA Therapies Sales Forecast, 2022-2025 (US$ mn, AGR%)
Table 9 Spinraza Market Shares by Region, 2019-2021
Table 10 RNA Therapeutics Market Forecast by Technology, 2022-2032 (US$ mn, AGR%, CAGR%)
Table 11 RNA Antisense Technologies Segment Market Forecast by Region, 2022-2032 (US$ mn, AGR%, CAGR%)
Table 12 RNA Interference (RNAi) Technologies Segment Market Forecast by Region, 2022-2032 (US$ mn, AGR%, CAGR%)
Table 13 RNA Therapeutics Market Forecast by Application, 2022-2032 (US$ mn, AGR%, CAGR%)
Table 14 Genetic Disorders Segment Market Forecast by Region, 2022-2032 (US$ mn, AGR%, CAGR%)
Table 15 RNA Therapeutics Market Forecast by Genetic Disorders, 2022-2032 (US$ mn, AGR%, CAGR%)
Table 16 Autoimmune Disorders Segment Market Forecast by Region, 2022-2032 (US$ mn, AGR%, CAGR%)
Table 17 RNA Therapeutics Market Forecast by Autoimmune Disorders, 2022-2032 (US$ mn, AGR%, CAGR%)
Table 18 RNA Therapeutics Market Forecast by End-user, 2022-2032 (US$ mn, AGR%, CAGR%)
Table 19 Research Institutes Segment Market Forecast by Region, 2022-2032 (US$ mn, AGR%, CAGR%)
Table 20 Hospitals & Clinics Segment Market Forecast by Region, 2022-2032 (US$ mn, AGR%, CAGR%)
Table 21 RNA Therapeutics Market Forecast by Region, 2022-2032 (US$ mn, AGR%, CAGR%)
Table 22 RNA Therapeutics Market Forecast by Region, 2022-2032 (US$ mn, AGR%, CAGR%): "V" Shaped Recovery
Table 23 RNA Therapeutics Market Forecast by Region, 2022-2032 (US$ mn, AGR%, CAGR%): "U" Shaped Recovery
Table 24 RNA Therapeutics Market Forecast by Region, 2022-2032 (US$ mn, AGR%, CAGR%): "W" Shaped Recovery
Table 25 RNA Therapeutics Market Forecast by Region, 2022-2032 (US$ mn, AGR%, CAGR%): "L" Shaped Recovery
Table 26 North America RNA Therapeutics Market Forecast by Country, 2022-2032 (US$ mn, AGR%, CAGR%)
Table 27 North America RNA Therapeutics Market Forecast by Type, 2022-2032 (US$ mn, AGR%, CAGR%)
Table 28 North America RNA Therapeutics Market Forecast by Application, 2022-2032 (US$ mn, AGR%, CAGR%)
Table 29 North America RNA Therapeutics Market Forecast by End-user, 2022-2032 (US$ mn, AGR%, CAGR%)
Table 30 U.S. RNA Therapeutics Market Forecast, 2022-2032 (US$ mn, AGR%, CAGR%)
Table 31 Canada RNA Therapeutics Market Forecast, 2022-2032 (US$ mn, AGR%, CAGR%)
Table 32 Europe RNA Therapeutics Market Forecast by Country, 2022-2032 (US$ mn, AGR%, CAGR%)
Table 33 Europe RNA Therapeutics Market Forecast by Type, 2022-2032 (US$ mn, AGR%, CAGR%)
Table 34 Europe RNA Therapeutics Market Forecast by Application, 2022-2032 (US$ mn, AGR%, CAGR%)
Table 35 Europe RNA Therapeutics Market Forecast by End-user, 2022-2032 (US$ mn, AGR%, CAGR%)
Table 36 Germany RNA Therapeutics Market Forecast, 2022-2032 (US$ mn, AGR%, CAGR%)
Table 37 UK RNA Therapeutics Market Forecast, 2022-2032 (US$ mn, AGR%, CAGR%)
Table 38 France RNA Therapeutics Market Forecast, 2022-2032 (US$ mn, AGR%, CAGR%)
Table 39 Italy RNA Therapeutics Market Forecast, 2022-2032 (US$ mn, AGR%, CAGR%)
Table 40 Spain RNA Therapeutics Market Forecast, 2022-2032 (US$ mn, AGR%, CAGR%)
Table 41 Rest of Europe RNA Therapeutics Market Forecast, 2022-2032 (US$ mn, AGR%, CAGR%)
Table 42 Asia Pacific RNA Therapeutics Market Forecast by Country, 2022-2032 (US$ mn, AGR%, CAGR%)
Table 43 Asia Pacific RNA Therapeutics Market Forecast by Type, 2022-2032 (US$ mn, AGR%, CAGR%)
Table 44 Asia Pacific RNA Therapeutics Market Forecast by Application, 2022-2032 (US$ mn, AGR%, CAGR%)
Table 45 Asia Pacific RNA Therapeutics Market Forecast by End-user, 2022-2032 (US$ mn, AGR%, CAGR%)
Table 46 Japan RNA Therapeutics Market Forecast, 2022-2032 (US$ mn, AGR%, CAGR%)
Table 47 China RNA Therapeutics Market Forecast, 2022-2032 (US$ mn, AGR%, CAGR%)
Table 48 India RNA Therapeutics Market Forecast, 2022-2032 (US$ mn, AGR%, CAGR%)
Table 49 Australia RNA Therapeutics Market Forecast, 2022-2032 (US$ mn, AGR%, CAGR%)
Table 50 South Korea RNA Therapeutics Market Forecast, 2022-2032 (US$ mn, AGR%, CAGR%)
Table 51 Rest of Asia Pacific RNA Therapeutics Market Forecast, 2022-2032 (US$ mn, AGR%, CAGR%)
Table 52 Latin America RNA Therapeutics Market Forecast by Country, 2022-2032 (US$ mn, AGR%, CAGR%)
Table 53 Latin America RNA Therapeutics Market Forecast by Type, 2022-2032 (US$ mn, AGR%, CAGR%)
Table 54 Latin America RNA Therapeutics Market Forecast by Application, 2022-2032 (US$ mn, AGR%, CAGR%)
Table 55 Latin America RNA Therapeutics Market Forecast by End-user, 2022-2032 (US$ mn, AGR%, CAGR%)
Table 56 Brazil RNA Therapeutics Market Forecast, 2022-2032 (US$ mn, AGR%, CAGR%)
Table 57 Mexico RNA Therapeutics Market Forecast, 2022-2032 (US$ mn, AGR%, CAGR%)
Table 58 Rest of Latin America RNA Therapeutics Market Forecast, 2022-2032 (US$ mn, AGR%, CAGR%)
Table 59 MEA RNA Therapeutics Market Forecast by Country, 2022-2032 (US$ mn, AGR%, CAGR%)
Table 60 MEA RNA Therapeutics Market Forecast by Type, 2022-2032 (US$ mn, AGR%, CAGR%)
Table 61 MEA RNA Therapeutics Market Forecast by Application, 2022-2032 (US$ mn, AGR%, CAGR%)
Table 62 MEA RNA Therapeutics Market Forecast by End-user, 2022-2032 (US$ mn, AGR%, CAGR%)
Table 63 GCC RNA Therapeutics Market Forecast, 2022-2032 (US$ mn, AGR%, CAGR%)
Table 64 South Africa RNA Therapeutics Market Forecast, 2022-2032 (US$ mn, AGR%, CAGR%)
Table 65 Rest of MEA RNA Therapeutics Market Forecast, 2022-2032 (US$ mn, AGR%, CAGR%)
Table 66 Key Business Strategies
Table 67 Alnylam Pharmaceuticals, Inc.: Key Details, (CEO, HQ, Revenue, Founded, No. of Employees, Company Type, Website, Business Segment)
Table 68 Alnylam Pharmaceuticals, Inc.: Product Benchmarking
Table 69 Alnylam Pharmaceuticals, Inc.: Strategic Outlook
Table 70 Arbutus Biopharma: Key Details, (CEO, HQ, Revenue, Founded, No. of Employees, Company Type, Website, Business Segment)
Table 71 Arbutus Biopharma: Product Benchmarking
Table 72 Arbutus Biopharma: Strategic Outlook
Table 73 Arrowhead Pharmaceuticals, Inc.: Key Details, (CEO, HQ, Revenue, Founded, No. of Employees, Company Type, Website, Business Segment)
Table 74 Arrowhead Pharmaceuticals, Inc.: Product Benchmarking
Table 75 Arrowhead Pharmaceuticals, Inc.: Strategic Outlook
Table 76 Benitec Biopharma: Key Details, (CEO, HQ, Revenue, Founded, No. of Employees, Company Type, Website, Business Segment)
Table 77 Benitec Biopharma: Product Benchmarking
Table 78 Biogen: Key Details, (CEO, HQ, Revenue, Founded, No. of Employees, Company Type, Website, Business Segment)
Table 79 Biogen: Product Benchmarking
Table 80 Biogen: Strategic Outlook
Table 81 Genzyme (Sanofi): Key Details, (CEO, HQ, Revenue, Founded, No. of Employees, Company Type, Website, Business Segment)
Table 82 Genzyme (Sanofi): Product Benchmarking
Table 83 Genzyme (Sanofi): Strategic Outlook
Table 84 Gradalis, Inc.: Key Details, (CEO, HQ, Revenue, Founded, No. of Employees, Company Type, Website, Business Segment)
Table 85 Gradalis, Inc.: Product Benchmarking
Table 86 Ionis Pharmaceuticals, Inc.: Key Details, (CEO, HQ, Revenue, Founded, No. of Employees, Company Type, Website, Business Segment)
Table 87 Ionis Pharmaceuticals, Inc.: Product Benchmarking
Table 88 Ionis Pharmaceuticals, Inc.: Strategic Outlook
Table 89 Orna Therapeutics: Key Details, (CEO, HQ, Revenue, Founded, No. of Employees, Company Type, Website, Business Segment)
Table 90 Orna Therapeutics: Product Benchmarking
Table 91 Orna Therapeutics: Strategic Outlook
Table 92 Sarepta Therapeutics, Inc.: Key Details, (CEO, HQ, Revenue, Founded, No. of Employees, Company Type, Website, Business Segment)
Table 93 Sarepta Therapeutics, Inc.: Product Benchmarking
Table 94 Sarepta Therapeutics, Inc.: Strategic Outlook
Table 95 Silence Therapeutics: Key Details, (CEO, HQ, Revenue, Founded, No. of Employees, Company Type, Website, Business Segment)
Table 96 Silence Therapeutics: Product Benchmarking
図の一覧
Figure 1 RNA Therapeutics Market Segmentation
Figure 2 RNA Therapeutics Market by Type: Market Attractiveness Index
Figure 3 RNA Therapeutics Market by Application: Market Attractiveness Index
Figure 4 RNA Therapeutics Market by End-user: Market Attractiveness Index
Figure 5 RNA Therapeutics Market Attractiveness Index by Region
Figure 6 RNA Therapeutics Market: Market Dynamics
Figure 7 Alliance, Acquisition, and Financing in Gene, Cell, & RNA Therapy
Figure 8 RNA Therapy Pipeline: Most Common Modalities
Figure 9 RNA Therapy Clinical Trials Pipeline
Figure 10 COVID Impact Analysis: RNA Therapeutics Market Recovery Scenarios
Figure 11 RNA Therapeutics Market by Region, 2022-2032 (US$ Mn, AGR %): “V” Shaped Recovery
Figure 12 RNA Therapeutics Market by Region, 2022-2032 (US$ Mn, AGR %): “U” Shaped Recovery
Figure 13 RNA Therapeutics Market by Region, 2022-2032 (US$ Mn, AGR %): “W” Shaped Recovery
Figure 14 RNA Therapeutics Market by Region, 2022-2032 (US$ Mn, AGR %): “L” Shaped Recovery
Figure 15 RNA Therapeutics Market: Porter’s Five Forces Analysis
Figure 16 RNA Therapeutics Market Attractiveness Index by Technology
Figure 17 RNA Therapeutics Market Forecast by Type, 2022-2032 (US$ million)
Figure 18 RNA Therapeutics Market Share Forecast by Type, 2022, 2027, 2032 (%)
Figure 19 RNA Antisense Technologies Market Forecast by Region, 2022-2032 (US$ million)
Figure 20 RNA Antisense Technologies Market Share Forecast by Region, 2022 & 2032 (%)
Figure 21 RNA Interference (RNAi) Technologies Market Forecast by Region, 2022-2032 (US$ million)
Figure 22 RNA Interference (RNAi) Technologies Market Share Forecast by Region, 2022 & 2032 (%)
Figure 23 RNA Therapeutics Market Attractiveness Index by Type
Figure 24 RNA Therapeutics Market Forecast by Application, 2022-2032 (US$ million)
Figure 25 RNA Therapeutics Market Share Forecast by Application, 2022, 2027, 2032 (%)
Figure 26 Genetic Disorders Market Forecast by Region, 2022-2032 (US$ million)
Figure 27 Genetic Disorders Market Share Forecast by Region, 2022 & 2032 (%)
Figure 28 RNA Therapeutics Market Forecast by Genetic Disorders, 2022-2032 (US$ million)
Figure 29 Autoimmune Disorders Market Forecast by Region, 2022-2032 (US$ million)
Figure 30 Autoimmune Disorders Market Share Forecast by Region, 2022 & 2032 (%)
Figure 31 RNA Therapeutics Market Forecast by Autoimmune Disorders, 2022-2032 (US$ million)
Figure 32 RNA Therapeutics Market Attractiveness Index by End-user
Figure 33 RNA Therapeutics Market Forecast by End-user, 2022-2032 (US$ million)
Figure 34 RNA Therapeutics Market Share Forecast by End-user, 2022, 2027, 2032 (%)
Figure 35 Research Institutes Market Forecast by Region, 2022-2032 (US$ million)
Figure 36 Research Institutes Market Share Forecast by Region, 2022 & 2032 (%)
Figure 37 Hospitals & Clinics Market Forecast by Region, 2022-2032 (US$ million)
Figure 38 Hospitals & Clinics Market Share Forecast by Region, 2022 & 2032 (%)
Figure 39 RNA Therapeutics Market Forecast by Region 2022 & 2032 (Revenue, CAGR%)
Figure 40 RNA Therapeutics Market Share Forecast by Region 2022, 2027, 2032(%)
Figure 41 RNA Therapeutics Market by Region, 2022-2032 (US$ Mn)
Figure 42 RNA Therapeutics Market by Region, 2022-2032 (US$ Mn, AGR %): “V” Shaped Recovery
Figure 43 RNA Therapeutics Market by Region, 2022-2032 (US$ Mn, AGR %): “U” Shaped Recovery
Figure 44 RNA Therapeutics Market by Region, 2022-2032 (US$ Mn, AGR %): “W” Shaped Recovery
Figure 45 RNA Therapeutics Market by Region, 2022-2032 (US$ Mn, AGR %): “L” Shaped Recovery
Figure 46 North America RNA Therapeutics Market Attractiveness Index
Figure 47 North America RNA Therapeutics Market by Region, 2022, 2027 & 2032 (US$ million)
Figure 48 North America RNA Therapeutics Market Forecast by Country, 2022-2032 (US$ million)
Figure 49 North America RNA Therapeutics Market Share Forecast by Country, 2022 & 2032 (%)
Figure 50 North America RNA Therapeutics Market Forecast by Type, 2022-2032 (US$ million)
Figure 51 North America RNA Therapeutics Market Share Forecast by Type, 2022 & 2032 (%)
Figure 52 North America RNA Therapeutics Market Forecast by Application, 2022-2032 (US$ million)
Figure 53 North America RNA Therapeutics Market Share Forecast by Application, 2022 & 2032 (%)
Figure 54 North America RNA Therapeutics Market Forecast by End-user, 2022-2032 (US$ million)
Figure 55 North America RNA Therapeutics Market Share Forecast by End-user, 2022 & 2032 (%)
Figure 56 U.S. RNA Therapeutics Market Forecast, 2022-2032 (US$ million)
Figure 57 Canada RNA Therapeutics Market Forecast, 2022-2032 (US$ million)
Figure 58 Europe RNA Therapeutics Market Attractiveness Index
Figure 59 Europe RNA Therapeutics Market by Region, 2022, 2027 & 2032 (US$ million)
Figure 60 Europe RNA Therapeutics Market Forecast by Country, 2022-2032 (US$ million)
Figure 61 Europe RNA Therapeutics Market Share Forecast by Country, 2022 & 2032 (%)
Figure 62 Europe RNA Therapeutics Market Forecast by Type, 2022-2032 (US$ million)
Figure 63 Europe RNA Therapeutics Market Share Forecast by Type, 2022 & 2032 (%)
Figure 64 Europe RNA Therapeutics Market Forecast by Application, 2022-2032 (US$ million)
Figure 65 Europe RNA Therapeutics Market Share Forecast by Application, 2022 & 2032 (%)
Figure 66 Europe RNA Therapeutics Market Forecast by End-user, 2022-2032 (US$ million)
Figure 67 Europe RNA Therapeutics Market Share Forecast by End-user, 2022 & 2032 (%)
Figure 68 Germany RNA Therapeutics Market Forecast, 2022-2032 (US$ million)
Figure 69 UK RNA Therapeutics Market Forecast, 2022-2032 (US$ million)
Figure 70 France RNA Therapeutics Market Forecast, 2022-2032 (US$ million)
Figure 71 Italy RNA Therapeutics Market Forecast, 2022-2032 (US$ million)
Figure 72 Spain RNA Therapeutics Market Forecast, 2022-2032 (US$ million)
Figure 73 Rest of Europe RNA Therapeutics Market Forecast, 2022-2032 (US$ million)
Figure 74 Asia Pacific RNA Therapeutics Market Attractiveness Index
Figure 75 Asia Pacific RNA Therapeutics Market by Region, 2022, 2027 & 2032 (US$ million)
Figure 76 Asia Pacific RNA Therapeutics Market Forecast by Country, 2022-2032 (US$ million)
Figure 77 Asia Pacific RNA Therapeutics Market Share Forecast by Country, 2022 & 2032 (%)
Figure 78 Asia Pacific RNA Therapeutics Market Forecast by Type, 2022-2032 (US$ million)
Figure 79 Asia Pacific RNA Therapeutics Market Share Forecast by Type, 2022 & 2032 (%)
Figure 80 Asia Pacific RNA Therapeutics Market Forecast by Application, 2022-2032 (US$ million)
Figure 81 Asia Pacific RNA Therapeutics Market Share Forecast by Application, 2022 & 2032 (%)
Figure 82 Asia Pacific RNA Therapeutics Market Forecast by End-user, 2022-2032 (US$ million)
Figure 83 Asia Pacific RNA Therapeutics Market Share Forecast by End-user, 2022 & 2032 (%)
Figure 84 Japan RNA Therapeutics Market Forecast, 2022-2032 (US$ million)
Figure 85 China RNA Therapeutics Market Forecast, 2022-2032 (US$ million)
Figure 86 India RNA Therapeutics Market Forecast, 2022-2032 (US$ million)
Figure 87 Australia RNA Therapeutics Market Forecast, 2022-2032 (US$ million)
Figure 88 South Korea RNA Therapeutics Market Forecast, 2022-2032 (US$ million)
Figure 89 Rest of Asia Pacific RNA Therapeutics Market Forecast, 2022-2032 (US$ million)
Figure 90 Latin America RNA Therapeutics Market Attractiveness Index
Figure 91 Latin America RNA Therapeutics Market by Region, 2022, 2027 & 2032 (US$ million)
Figure 92 Latin America RNA Therapeutics Market Forecast by Country, 2022-2032 (US$ million)
Figure 93 Latin America RNA Therapeutics Market Share Forecast by Country, 2022 & 2032 (%)
Figure 94 Latin America RNA Therapeutics Market Forecast by Type, 2022-2032 (US$ million)
Figure 95 Latin America RNA Therapeutics Market Share Forecast by Type, 2022 & 2032 (%)
Figure 96 Latin America RNA Therapeutics Market Forecast by Application, 2022-2032 (US$ million)
Figure 97 Latin America RNA Therapeutics Market Share Forecast by Application, 2022 & 2032 (%)
Figure 98 Latin America RNA Therapeutics Market Forecast by End-user, 2022-2032 (US$ million)
Figure 99 Latin America RNA Therapeutics Market Share Forecast by End-user, 2022 & 2032 (%)
Figure 100 Brazil RNA Therapeutics Market Forecast, 2022-2032 (US$ million)
Figure 101 Mexico RNA Therapeutics Market Forecast, 2022-2032 (US$ million)
Figure 102 Rest of Latin America RNA Therapeutics Market Forecast, 2022-2032 (US$ million)
Figure 103 MEA RNA Therapeutics Market Attractiveness Index
Figure 104 MEA RNA Therapeutics Market by Region, 2022, 2027 & 2032 (US$ million)
Figure 105 MEA RNA Therapeutics Market Forecast by Country, 2022-2032 (US$ million)
Figure 106 MEA RNA Therapeutics Market Share Forecast by Country, 2022 & 2032 (%)
Figure 107 MEA RNA Therapeutics Market Forecast by Type, 2022-2032 (US$ million)
Figure 108 MEA RNA Therapeutics Market Share Forecast by Type, 2022 & 2032 (%)
Figure 109 MEA RNA Therapeutics Market Forecast by Application, 2022-2032 (US$ million)
Figure 110 MEA RNA Therapeutics Market Share Forecast by Application, 2022 & 2032 (%)
Figure 111 MEA RNA Therapeutics Market Forecast by End-user, 2022-2032 (US$ million)
Figure 112 MEA RNA Therapeutics Market Share Forecast by End-user, 2022 & 2032 (%)
Figure 113 GCC RNA Therapeutics Market Forecast, 2022-2032 (US$ million)
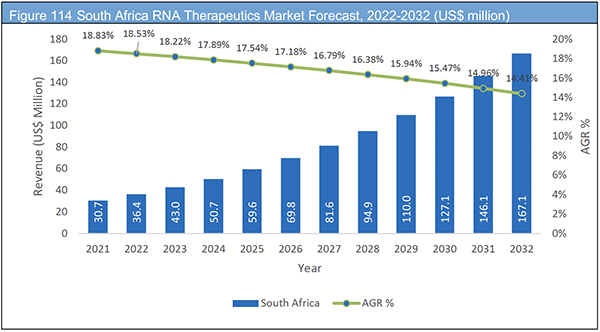
Figure 114 South Africa RNA Therapeutics Market Forecast, 2022-2032 (US$ million)
Figure 115 Rest of MEA RNA Therapeutics Market Forecast, 2022-2032 (US$ million)
Figure 116 Alnylam Pharmaceuticals, Inc.: Net Revenue, 2017-2021 (US$ million, AGR%)
Figure 117 Alnylam Pharmaceuticals, Inc.: Product Revenue Shares (%), 2021
Figure 118 Alnylam Pharmaceuticals, Inc.: Business Operations Shares (%), 2021
Figure 119 Alnylam Pharmaceuticals, Inc.: Gross Profit, 2017-2021 (US$ million, AGR%)
Figure 120 Alnylam Pharmaceuticals, Inc.: R&D, 2017-2021 (US$ million, AGR%)
Figure 121 Arbutus Biopharma: Net Revenue, 2017-2021 (US$ million, AGR%)
Figure 122 Arbutus Biopharma: Gross Profit, 2017-2021 (US$ million, AGR%)
Figure 123 Arbutus Biopharma: R&D, 2017-2021 (US$ million, AGR%)
Figure 124 Arrowhead Pharmaceuticals, Inc.: Net Revenue, 2017-2021 (US$ million, AGR%)
Figure 125 Arrowhead Pharmaceuticals, Inc.: Gross Profit, 2017-2021 (US$ million, AGR%)
Figure 126 Arrowhead Pharmaceuticals, Inc.: R&D, 2017-2021 (US$ million, AGR%)
Figure 127 Benitec Biopharma: Net Revenue, 2017-2021 (US$ million, AGR%)
Figure 128 Benitec Biopharma: Gross Profit, 2017-2021 (US$ million, AGR%)
Figure 129 Benitec Biopharma: R&D, 2017-2021 (US$ million, AGR%)
Figure 130 Biogen: Net Revenue, 2017-2021 (US$ million, AGR%)
Figure 131 Biogen: Regional Market Shares (%), 2021
Figure 132 Biogen: Gross Profit, 2017-2021 (US$ million, AGR%)
Figure 133 Biogen: R&D, 2017-2021 (US$ million, AGR%)
Figure 134 Genzyme (Sanofi): Net Revenue, 2017-2021 (US$ million, AGR%)
Figure 135 Genzyme (Sanofi): Regional Market Shares (%), 2021
Figure 136 Genzyme (Sanofi): Gross Profit, 2017-2021 (US$ million, AGR%)
Figure 137 Genzyme (Sanofi): R&D, 2017-2021 (US$ million, AGR%)
Figure 138 Ionis Pharmaceuticals, Inc.: Net Revenue, 2017-2021 (US$ million, AGR%)
Figure 139 Ionis Pharmaceuticals, Inc.: Gross Profit, 2017-2021 (US$ million, AGR%)
Figure 140 Ionis Pharmaceuticals, Inc.: R&D, 2017-2021 (US$ million, AGR%)
Figure 141 Sarepta Therapeutics, Inc.: Net Revenue, 2017-2021 (US$ million, AGR%)
Figure 142 Sarepta Therapeutics, Inc.: Gross Profit, 2017-2021 (US$ million, AGR%)
Figure 143 Sarepta Therapeutics, Inc.: R&D, 2017-2021 (US$ million, AGR%)
Figure 144 Silence Therapeutics: Net Revenue, 2020-2021 (US$ million)
Figure 145 Silence Therapeutics: Gross Profit, 2020-2021 (US$ million)
Figure 146 Silence Therapeutics: R&D, 2020-2021 (US$ million)
ページTOPに戻る
Summary
この調査レポートは世界のRNAベースの治療薬とワクチン市場を調査し、タイプ別、用途別、エンドユーザー別、地域別に2022年から2032年までの予測結果を掲載しています。また関連企業情報を提供しています。
主な掲載内容(目次より抜粋)
-
レポート概要
-
エグゼクティブサマリー
-
市場概要
-
RNA治療薬市場分析:技術別
-
RNA治療薬市場分析:用途別
-
RNA治療薬市場分析:エンドユーザー別
-
RNA治療薬市場分析:地域別
-
北米のRNA治療薬市場の分析
-
欧州のRNA治療薬市場の分析
-
アジア太平洋地域のRNA治療薬市場の分析
-
ラテンアメリカのRNA治療薬市場の分析
-
MEAのRNA治療薬市場の分析
-
主要企業のプロフィール
Report Details
The RNA Based Therapeutics and Vaccines Market Report 2022-2032: This report will prove invaluable to leading firms striving for new revenue pockets if they wish to better understand the industry and its underlying dynamics. It will be useful for companies that would like to expand into different industries or expand their existing operations in a new region.
CRISPR-based RNA Editing to Offer Lucrative Growth Prospects
CRISPR (Clustered Regularly Interspaced Short Palindromic Repeat) is an RNA-guided gene editing technique that inserts a double-strand break at a specific site in the genome using the Cas9 protein, which is obtained from bacteria. By using this technique, bacteria are able to seize brief nucleic acid sequences from invasive pathogens and mix them with the repeats in CRISPR loci. A group of bacterial endonucleases is directed by small RNAs generated by transcription of CRISPR loci to divide the genomes of invasive pathogens. This approach has gained acceptance as a potent method that makes genome editing possible in everyday life
Several new & existing DNA-editing companies have declared their ambition to expand into the RNA segment, and these include Boston, Massachusetts-based Beam Therapeutics, which has been researching CRISPR DNA editing as a treatment for several blood disorders. San Diego-based firm named Locana is also studying CRISPR-based RNA editing as a potential treatment for diseases like Huntington’s disease and motor-neuron disorder.
Numerous Development Potential of RNA-based Medicines
Since RNA-based therapies have the potential to cure both common and rare genetic illnesses, RNA-based therapies have attracted a lot of research. These types of studies are still in the pipeline, therefore businesses that commercialise these treatments first would have a competitive advantage over rivals. There are now just three commercially available RNA-based medicines based on antisense technology. Three ASO medicines have so far been approved by the FDA: nusinersen (Ionis Pharmaceuticals), eteplirsen (Sarepta Therapeutics), and inotersen (Ionis Pharmaceuticals and Akcea Therapeutics). As a result, there are numerous potential for the development and marketing of RNA-based medicines in the near future.
What Questions Should You Ask before Buying a Market Research Report?
• How is the RNA therapeutics market evolving?
• What is driving and restraining the RNA therapeutics market?
• How will each RNA therapeutics submarket segment grow over the forecast period and how much revenue will these submarkets account for in 2032?
• How will the market shares for each RNA therapeutics submarket develop from 2022 to 2032?
• What will be the main driver for the overall market from 2022 to 2032?
• Will leading RNA therapeutics markets broadly follow the macroeconomic dynamics, or will individual national markets outperform others?
• How will the market shares of the national markets change by 2032 and which geographical region will lead the market in 2032?
• Who are the leading players and what are their prospects over the forecast period?
• What are the RNA therapeutics projects for these leading companies?
• How will the industry evolve during the period between 2022 and 2032? What are the implications of
RNA therapeutics projects taking place now and over the next 10 years?
• Is there a greater need for product commercialization to further scale the RNA therapeutics market?
• Where is the RNA therapeutics market heading and how can you ensure you are at the forefront of the market?
• What are the best investment options for new product and service lines?
• What are the key prospects for moving companies into a new growth path and C-suite?
You need to discover how this will impact the RNA therapeutics market today, and over the next 10 years:
• Our 223-page report provides 96 tables and 146 charts/graphs exclusively to you.
• The report highlights key lucrative areas in the industry so you can target them – NOW.
• It contains in-depth analysis of global, regional and national sales and growth.
• It highlights for you the key successful trends, changes and revenue projections made by your competitors.
This report tells you TODAY how the RNA therapeutics market will develop in the next 10 years, and in line with the variations in COVID-19 economic recession and bounce. This market is more critical now than at any point over the last 10 years.
Forecasts to 2032 and other analyses reveal commercial prospects
• In addition to revenue forecasting to 2032, our new study provides you with recent results, growth rates, and market shares.
• You will find original analyses, with business outlooks and developments.
• Discover qualitative analyses (including market dynamics, drivers, opportunities, and restraints), Porter’s Five Forces Analysis, PEST Analysis and recent developments.
This report includes data analysis and invaluable insight into how COVID-19 will affect the industry and your company. Four COVID-19 recovery patterns and their impact, namely, “V”, “L”, “W” and “U” are discussed in this report.
Segments Covered in the Report
Type
• RNA Antisense Technologies
• RNA Interference (RNAi) Technologies
Application
• Genetic Disorders
– Spinal Muscular Atrophy (SMA)
– Cancer
– Acute Hepatic Porphyria (AHP)
– Duchenne Muscular Dystrophy (DMD)
– Others
• Autoimmune Disorders
– Ophthalmology
– Oncology
– Diabetes
– Rheumatoid Arthritis (RA)
– Others
End-user
• Research Institutes
• Hospitals & Clinics
In addition to the revenue predictions for the overall world market and segments, you will also find revenue forecasts for five regional and 20 leading national markets:
North America
• U.S.
• Canada
Europe
• Germany
• UK
• France
• Italy
• Spain
• Rest of Europe
Asia Pacific
• Japan
• China
• India
• Australia
• South Korea
• Rest of Asia Pacific
Latin America
• Brazil
• Mexico
• Rest of Latin America
MEA
• GCC
• South Africa
• Rest of MEA
The report also includes profiles and for some of the leading companies in the RNA Therapeutics Market, 2022 to 2032, with a focus on this segment of these companies’ operations.
Leading companies and the potential for market growth
• Alnylam Pharmaceuticals, Inc.
• Arbutus Biopharma
• Arrowhead Pharmaceuticals, Inc.
• Benitec Biopharma
• Biogen
• Genzyme (Sanofi)
• Gradalis, Inc.
• Ionis Pharmaceuticals, Inc.
• Orna Therapeutics
• Sarepta Therapeutics, Inc.
• Silence Therapeutics
Overall world revenue for the RNA Therapeutics Market, 2022 to 2032 in terms of value the market will surpass US$6,992.1 million in 2022, our work calculates. We predict strong revenue growth through to 2032. Our work identifies which organizations hold the greatest potential. Discover their capabilities, progress, and commercial prospects, helping you stay ahead.
How will the RNA Therapeutics Market, 2022 to 2032 report help you?
In summary, our 210+ page report provides you with the following knowledge:
• Revenue forecasts to 2032 for RNA Therapeutics Market, 2022 to 2032 Market, with forecasts for type, application, and end-user each forecast at a global and regional level – discover the industry’s prospects, finding the most lucrative places for investments and revenues.
• Revenue forecasts to 2032 for five regional and 20 key national markets – See forecasts for the RNA Therapeutics Market, 2022 to 2032 market in North America, Europe, Asia-Pacific, Latin America, and MEA. Also forecasted is the market in the US, Canada, Mexico, Brazil, Germany, France, UK, Italy, China, India, Japan, and Australia among other prominent economies.
• Prospects for established firms and those seeking to enter the market – including company profiles for 11 of the major companies involved in the RNA Therapeutics Market, 2022 to 2032.
Find quantitative and qualitative analyses with independent predictions. Receive information that only our report contains, staying informed with invaluable business intelligence.
Information found nowhere else
With our new report, you are less likely to fall behind in knowledge or miss out on opportunities. See how our work could benefit your research, analyses, and decisions. Visiongain’s study is for everybody needing commercial analyses for the RNA Therapeutics Market, 2022 to 2032, market-leading companies. You will find data, trends and predictions.
ページTOPに戻る
Table of Contents
Table of Contents
1. Report Overview
1.1 Objectives of the Study
1.2 Introduction to RNA Therapeutics Market
1.3 What This Report Delivers
1.4 Why You Should Read This Report
1.5 Key Questions Answered By This Analytical Report Include:
1.6 Who is This Report For?
1.7 Methodology
1.7.1 Market Definitions
1.7.2 Market Evaluation & Forecasting Methodology
1.7.3 Data Validation
1.8 Frequently Asked Questions (FAQs)
1.9 Associated Visiongain Reports
1.10 About Visiongain
2 Executive Summary
3 Market Overview
3.1 Key Findings
3.2 Market Dynamics
3.2.1 Market Driving Factors
3.2.2 Market Restraining Factors
3.2.3 Market Opportunities
3.3 Market Trends
3.3.1 Safer Alternative to DNA Therapy
3.3.2 New Therapeutic Avenues Gaining Momentum
3.3.3 Versatility of RNA Molecules
3.3.4 RNA Therapeutics Pipeline Analysis
3.4 COVID-19 Impact Analysis
3.5 Porter’s Five Forces Analysis
3.5.1 Supplier Power
3.5.2 Buyer Power
3.5.3 Competitive Rivalry
3.5.4 Threat from Substitutes
3.5.5 Threat of New Entrants
3.6 RNA Therapies Sales Forecast by Drugs, 2022-2025
4 RNA Therapeutics Market Analysis by Technology
4.1 Key Findings
4.2 Type Segment Growth Prospects
4.3 RNA Therapeutics Market Size Estimation and Forecast by Type
4.4 RNA Antisense Technologies
4.4.1 Market Forecast by Region, 2022-2032 (US$ Mn)
4.4.2 Market Share by Region, 2022 & 2032 (%)
4.5 RNA Interference (RNAi) Technologies
4.5.1 Market Forecast by Region, 2022-2032 (US$ Mn)
4.5.2 Market Share by Region, 2022 & 2032 (%)
5 RNA Therapeutics Market Analysis by Application
5.1 Key Findings
5.2 Application Segment Growth Prospects
5.3 RNA Therapeutics Market Size Estimation and Forecast by Application
5.4 Genetic Disorders
5.4.1 Market Forecast by Region, 2022-2032 (US$ Mn)
5.4.2 Market Share by Region, 2022 & 2032 (%)
5.4.3 Market Forecast by Genetic Disorders, 2022-2032 (US$ Mn)
5.5 Autoimmune Disorders
5.5.1 Market Forecast by Region, 2022-2032 (US$ Mn)
5.5.2 Market Share by Region, 2022 & 2032 (%)
5.5.3 Market Forecast by Autoimmune Disorders, 2022-2032 (US$ Mn)
6 RNA Therapeutics Market Analysis by End-user
6.1 Key Findings
6.2 End-user Segment Growth Prospects
6.3 RNA Therapeutics Market Size Estimation and Forecast by End-user
6.4 Research Institutes
6.4.1 Market Forecast by Region, 2022-2032 (US$ Mn)
6.4.2 Market Share by Region, 2022 & 2032 (%)
6.5 Hospitals & Clinics
6.5.1 Market Forecast by Region, 2022-2032 (US$ Mn)
6.5.2 Market Share by Region, 2022 & 2032 (%)
7 RNA Therapeutics Market Analysis by Region
7.1 Key Findings
7.2 Regional Market Size Estimation and Forecast
7.3 COVID-19 Impact Analysis: Recovery Scenarios (V, U, W, L)
8 North America RNA Therapeutics Market Analysis
8.1 Key Findings
8.2 North America RNA Therapeutics Market Attractiveness Index
8.3 Market Size by Country, 2022, 2027 & 2032 (US$ Mn)
8.4 Market Size Estimation and Forecast by Country, 2022-2032 (US$ Mn)
8.5 Market Size Estimation and Forecast by Type, 2022-2032 (US$ Mn)
8.6 Market Size Estimation and Forecast by Application, 2022-2032 (US$ Mn)
8.7 Market Size Estimation and Forecast by End-user, 2022-2032 (US$ Mn)
8.8 U.S.
8.9 Canada
9 Europe RNA Therapeutics Market Analysis
9.1 Key Findings
9.2 Europe RNA Therapeutics Market Attractiveness Index
9.3 Market Size by Country, 2022, 2027 & 2032 (US$ Mn)
9.4 Market Size Estimation and Forecast by Country, 2022-2032 (US$ Mn)
9.5 Market Size Estimation and Forecast by Type, 2022-2032 (US$ Mn)
9.6 Market Size Estimation and Forecast by Application, 2022-2032 (US$ Mn)
9.7 Market Size Estimation and Forecast by End-user, 2022-2032 (US$ Mn)
9.8 Germany
9.9 UK
9.10 France
9.11 Italy
9.12 Spain
9.13 Rest of Europe
10 Asia Pacific RNA Therapeutics Market Analysis
10.1 Key Findings
10.2 Asia Pacific RNA Therapeutics Market Attractiveness Index
10.3 Market Size by Country, 2022, 2027 & 2032 (US$ Mn)
10.4 Market Size Estimation and Forecast by Country, 2022-2032 (US$ Mn)
10.5 Market Size Estimation and Forecast by Type, 2022-2032 (US$ Mn)
10.6 Market Size Estimation and Forecast by Application, 2022-2032 (US$ Mn)
10.7 Market Size Estimation and Forecast by End-user, 2022-2032 (US$ Mn)
10.8 Japan
10.9 China
10.10 India
10.11 Australia
10.12 South Korea
10.13 Rest of Asia Pacific
11 Latin America RNA Therapeutics Market Analysis
11.1 Key Findings
11.2 Latin America RNA Therapeutics Market Attractiveness Index
11.3 Market Size by Country, 2022, 2027 & 2032 (US$ Mn)
11.4 Market Size Estimation and Forecast by Country, 2022-2032 (US$ Mn)
11.5 Market Size Estimation and Forecast by Type, 2022-2032 (US$ Mn)
11.6 Market Size Estimation and Forecast by Application, 2022-2032 (US$ Mn)
11.7 Market Size Estimation and Forecast by End-user, 2022-2032 (US$ Mn)
11.8 Brazil
11.9 Mexico
11.10 Rest of Latin America
12 MEA RNA Therapeutics Market Analysis
12.1 Key Findings
12.2 MEA RNA Therapeutics Market Attractiveness Index
12.3 Market Size by Country, 2022, 2027 & 2032 (US$ Mn)
12.4 Market Size Estimation and Forecast by Country, 2022-2032 (US$ Mn)
12.5 Market Size Estimation and Forecast by Type, 2022-2032 (US$ Mn)
12.6 Market Size Estimation and Forecast by Application, 2022-2032 (US$ Mn)
12.7 Market Size Estimation and Forecast by End-user, 2022-2032 (US$ Mn)
12.8 GCC
12.9 South Africa
12.10 Rest of MEA
13 Company Profiles
13.1 Key Business Strategies
13.2 Alnylam Pharmaceuticals, Inc.
13.2.1 Company Snapshot
13.2.2 Company Overview
13.2.3 Financial Analysis
13.2.4 Product Benchmarking
13.2.5 Strategic Outlook
13.3 Arbutus Biopharma
13.3.1 Company Snapshot
13.3.2 Company Overview
13.3.3 Financial Analysis
13.3.4 Product Benchmarking
13.3.5 Strategic Outlook
13.4 Arrowhead Pharmaceuticals, Inc.
13.4.1 Company Snapshot
13.4.2 Company Overview
13.4.3 Financial Analysis
13.4.4 Product Benchmarking
13.4.5 Strategic Outlook
13.5 Benitec Biopharma
13.5.1 Company Snapshot
13.5.2 Company Overview
13.5.3 Financial Analysis
13.5.4 Product Benchmarking
13.6 Biogen
13.6.1 Company Snapshot
13.6.2 Company Overview
13.6.3 Financial Analysis
13.6.4 Product Benchmarking
13.6.5 Strategic Outlook
13.7 Genzyme (Sanofi)
13.7.1 Company Snapshot
13.7.2 Company Overview
13.7.3 Financial Analysis
13.7.4 Product Benchmarking
13.7.5 Strategic Outlook
13.8 Gradalis, Inc.
13.8.1 Company Snapshot
13.8.2 Company Overview
13.8.3 Product Benchmarking
13.9 Ionis Pharmaceuticals, Inc.
13.9.1 Company Snapshot
13.9.2 Company Overview
13.9.3 Financial Analysis
13.9.4 Product Benchmarking
13.9.5 Strategic Outlook
13.10 Orna Therapeutics
13.10.1 Company Snapshot
13.10.2 Company Overview
13.10.3 Product Benchmarking
13.10.4 Strategic Outlook
13.11 Sarepta Therapeutics, Inc.
13.11.1 Company Snapshot
13.11.2 Company Overview
13.11.3 Financial Analysis
13.11.4 Product Benchmarking
13.11.5 Strategic Outlook
13.12 Silence Therapeutics
13.12.1 Company Snapshot
13.12.2 Company Overview
13.12.3 Financial Analysis
13.12.4 Product Benchmarking
14 Conclusion and Recommendations
14.1 Concluding Remarks from Visiongain
14.2 Recommendations for Market Players
List of Tables
Table 1 RNA Therapeutics Market Snapshot, 2022 & 2032 (US$ million, CAGR %)
Table 2 Status of RNA Therapies
Table 3 RNA Therapeutics Pipeline Analysis
Table 4 RNA Therapeutics Market Forecast by Region, 2022-2032 (US$ mn, AGR%, CAGR%): "V" Shaped Recovery
Table 5 RNA Therapeutics Market Forecast by Region, 2022-2032 (US$ mn, AGR%, CAGR%): "U" Shaped Recovery
Table 6 RNA Therapeutics Market Forecast by Region, 2022-2032 (US$ mn, AGR%, CAGR%): "W" Shaped Recovery
Table 7 RNA Therapeutics Market Forecast by Region, 2022-2032 (US$ mn, AGR%, CAGR%): "L" Shaped Recovery
Table 8 RNA Therapies Sales Forecast, 2022-2025 (US$ mn, AGR%)
Table 9 Spinraza Market Shares by Region, 2019-2021
Table 10 RNA Therapeutics Market Forecast by Technology, 2022-2032 (US$ mn, AGR%, CAGR%)
Table 11 RNA Antisense Technologies Segment Market Forecast by Region, 2022-2032 (US$ mn, AGR%, CAGR%)
Table 12 RNA Interference (RNAi) Technologies Segment Market Forecast by Region, 2022-2032 (US$ mn, AGR%, CAGR%)
Table 13 RNA Therapeutics Market Forecast by Application, 2022-2032 (US$ mn, AGR%, CAGR%)
Table 14 Genetic Disorders Segment Market Forecast by Region, 2022-2032 (US$ mn, AGR%, CAGR%)
Table 15 RNA Therapeutics Market Forecast by Genetic Disorders, 2022-2032 (US$ mn, AGR%, CAGR%)
Table 16 Autoimmune Disorders Segment Market Forecast by Region, 2022-2032 (US$ mn, AGR%, CAGR%)
Table 17 RNA Therapeutics Market Forecast by Autoimmune Disorders, 2022-2032 (US$ mn, AGR%, CAGR%)
Table 18 RNA Therapeutics Market Forecast by End-user, 2022-2032 (US$ mn, AGR%, CAGR%)
Table 19 Research Institutes Segment Market Forecast by Region, 2022-2032 (US$ mn, AGR%, CAGR%)
Table 20 Hospitals & Clinics Segment Market Forecast by Region, 2022-2032 (US$ mn, AGR%, CAGR%)
Table 21 RNA Therapeutics Market Forecast by Region, 2022-2032 (US$ mn, AGR%, CAGR%)
Table 22 RNA Therapeutics Market Forecast by Region, 2022-2032 (US$ mn, AGR%, CAGR%): "V" Shaped Recovery
Table 23 RNA Therapeutics Market Forecast by Region, 2022-2032 (US$ mn, AGR%, CAGR%): "U" Shaped Recovery
Table 24 RNA Therapeutics Market Forecast by Region, 2022-2032 (US$ mn, AGR%, CAGR%): "W" Shaped Recovery
Table 25 RNA Therapeutics Market Forecast by Region, 2022-2032 (US$ mn, AGR%, CAGR%): "L" Shaped Recovery
Table 26 North America RNA Therapeutics Market Forecast by Country, 2022-2032 (US$ mn, AGR%, CAGR%)
Table 27 North America RNA Therapeutics Market Forecast by Type, 2022-2032 (US$ mn, AGR%, CAGR%)
Table 28 North America RNA Therapeutics Market Forecast by Application, 2022-2032 (US$ mn, AGR%, CAGR%)
Table 29 North America RNA Therapeutics Market Forecast by End-user, 2022-2032 (US$ mn, AGR%, CAGR%)
Table 30 U.S. RNA Therapeutics Market Forecast, 2022-2032 (US$ mn, AGR%, CAGR%)
Table 31 Canada RNA Therapeutics Market Forecast, 2022-2032 (US$ mn, AGR%, CAGR%)
Table 32 Europe RNA Therapeutics Market Forecast by Country, 2022-2032 (US$ mn, AGR%, CAGR%)
Table 33 Europe RNA Therapeutics Market Forecast by Type, 2022-2032 (US$ mn, AGR%, CAGR%)
Table 34 Europe RNA Therapeutics Market Forecast by Application, 2022-2032 (US$ mn, AGR%, CAGR%)
Table 35 Europe RNA Therapeutics Market Forecast by End-user, 2022-2032 (US$ mn, AGR%, CAGR%)
Table 36 Germany RNA Therapeutics Market Forecast, 2022-2032 (US$ mn, AGR%, CAGR%)
Table 37 UK RNA Therapeutics Market Forecast, 2022-2032 (US$ mn, AGR%, CAGR%)
Table 38 France RNA Therapeutics Market Forecast, 2022-2032 (US$ mn, AGR%, CAGR%)
Table 39 Italy RNA Therapeutics Market Forecast, 2022-2032 (US$ mn, AGR%, CAGR%)
Table 40 Spain RNA Therapeutics Market Forecast, 2022-2032 (US$ mn, AGR%, CAGR%)
Table 41 Rest of Europe RNA Therapeutics Market Forecast, 2022-2032 (US$ mn, AGR%, CAGR%)
Table 42 Asia Pacific RNA Therapeutics Market Forecast by Country, 2022-2032 (US$ mn, AGR%, CAGR%)
Table 43 Asia Pacific RNA Therapeutics Market Forecast by Type, 2022-2032 (US$ mn, AGR%, CAGR%)
Table 44 Asia Pacific RNA Therapeutics Market Forecast by Application, 2022-2032 (US$ mn, AGR%, CAGR%)
Table 45 Asia Pacific RNA Therapeutics Market Forecast by End-user, 2022-2032 (US$ mn, AGR%, CAGR%)
Table 46 Japan RNA Therapeutics Market Forecast, 2022-2032 (US$ mn, AGR%, CAGR%)
Table 47 China RNA Therapeutics Market Forecast, 2022-2032 (US$ mn, AGR%, CAGR%)
Table 48 India RNA Therapeutics Market Forecast, 2022-2032 (US$ mn, AGR%, CAGR%)
Table 49 Australia RNA Therapeutics Market Forecast, 2022-2032 (US$ mn, AGR%, CAGR%)
Table 50 South Korea RNA Therapeutics Market Forecast, 2022-2032 (US$ mn, AGR%, CAGR%)
Table 51 Rest of Asia Pacific RNA Therapeutics Market Forecast, 2022-2032 (US$ mn, AGR%, CAGR%)
Table 52 Latin America RNA Therapeutics Market Forecast by Country, 2022-2032 (US$ mn, AGR%, CAGR%)
Table 53 Latin America RNA Therapeutics Market Forecast by Type, 2022-2032 (US$ mn, AGR%, CAGR%)
Table 54 Latin America RNA Therapeutics Market Forecast by Application, 2022-2032 (US$ mn, AGR%, CAGR%)
Table 55 Latin America RNA Therapeutics Market Forecast by End-user, 2022-2032 (US$ mn, AGR%, CAGR%)
Table 56 Brazil RNA Therapeutics Market Forecast, 2022-2032 (US$ mn, AGR%, CAGR%)
Table 57 Mexico RNA Therapeutics Market Forecast, 2022-2032 (US$ mn, AGR%, CAGR%)
Table 58 Rest of Latin America RNA Therapeutics Market Forecast, 2022-2032 (US$ mn, AGR%, CAGR%)
Table 59 MEA RNA Therapeutics Market Forecast by Country, 2022-2032 (US$ mn, AGR%, CAGR%)
Table 60 MEA RNA Therapeutics Market Forecast by Type, 2022-2032 (US$ mn, AGR%, CAGR%)
Table 61 MEA RNA Therapeutics Market Forecast by Application, 2022-2032 (US$ mn, AGR%, CAGR%)
Table 62 MEA RNA Therapeutics Market Forecast by End-user, 2022-2032 (US$ mn, AGR%, CAGR%)
Table 63 GCC RNA Therapeutics Market Forecast, 2022-2032 (US$ mn, AGR%, CAGR%)
Table 64 South Africa RNA Therapeutics Market Forecast, 2022-2032 (US$ mn, AGR%, CAGR%)
Table 65 Rest of MEA RNA Therapeutics Market Forecast, 2022-2032 (US$ mn, AGR%, CAGR%)
Table 66 Key Business Strategies
Table 67 Alnylam Pharmaceuticals, Inc.: Key Details, (CEO, HQ, Revenue, Founded, No. of Employees, Company Type, Website, Business Segment)
Table 68 Alnylam Pharmaceuticals, Inc.: Product Benchmarking
Table 69 Alnylam Pharmaceuticals, Inc.: Strategic Outlook
Table 70 Arbutus Biopharma: Key Details, (CEO, HQ, Revenue, Founded, No. of Employees, Company Type, Website, Business Segment)
Table 71 Arbutus Biopharma: Product Benchmarking
Table 72 Arbutus Biopharma: Strategic Outlook
Table 73 Arrowhead Pharmaceuticals, Inc.: Key Details, (CEO, HQ, Revenue, Founded, No. of Employees, Company Type, Website, Business Segment)
Table 74 Arrowhead Pharmaceuticals, Inc.: Product Benchmarking
Table 75 Arrowhead Pharmaceuticals, Inc.: Strategic Outlook
Table 76 Benitec Biopharma: Key Details, (CEO, HQ, Revenue, Founded, No. of Employees, Company Type, Website, Business Segment)
Table 77 Benitec Biopharma: Product Benchmarking
Table 78 Biogen: Key Details, (CEO, HQ, Revenue, Founded, No. of Employees, Company Type, Website, Business Segment)
Table 79 Biogen: Product Benchmarking
Table 80 Biogen: Strategic Outlook
Table 81 Genzyme (Sanofi): Key Details, (CEO, HQ, Revenue, Founded, No. of Employees, Company Type, Website, Business Segment)
Table 82 Genzyme (Sanofi): Product Benchmarking
Table 83 Genzyme (Sanofi): Strategic Outlook
Table 84 Gradalis, Inc.: Key Details, (CEO, HQ, Revenue, Founded, No. of Employees, Company Type, Website, Business Segment)
Table 85 Gradalis, Inc.: Product Benchmarking
Table 86 Ionis Pharmaceuticals, Inc.: Key Details, (CEO, HQ, Revenue, Founded, No. of Employees, Company Type, Website, Business Segment)
Table 87 Ionis Pharmaceuticals, Inc.: Product Benchmarking
Table 88 Ionis Pharmaceuticals, Inc.: Strategic Outlook
Table 89 Orna Therapeutics: Key Details, (CEO, HQ, Revenue, Founded, No. of Employees, Company Type, Website, Business Segment)
Table 90 Orna Therapeutics: Product Benchmarking
Table 91 Orna Therapeutics: Strategic Outlook
Table 92 Sarepta Therapeutics, Inc.: Key Details, (CEO, HQ, Revenue, Founded, No. of Employees, Company Type, Website, Business Segment)
Table 93 Sarepta Therapeutics, Inc.: Product Benchmarking
Table 94 Sarepta Therapeutics, Inc.: Strategic Outlook
Table 95 Silence Therapeutics: Key Details, (CEO, HQ, Revenue, Founded, No. of Employees, Company Type, Website, Business Segment)
Table 96 Silence Therapeutics: Product Benchmarking
List of Figures
Figure 1 RNA Therapeutics Market Segmentation
Figure 2 RNA Therapeutics Market by Type: Market Attractiveness Index
Figure 3 RNA Therapeutics Market by Application: Market Attractiveness Index
Figure 4 RNA Therapeutics Market by End-user: Market Attractiveness Index
Figure 5 RNA Therapeutics Market Attractiveness Index by Region
Figure 6 RNA Therapeutics Market: Market Dynamics
Figure 7 Alliance, Acquisition, and Financing in Gene, Cell, & RNA Therapy
Figure 8 RNA Therapy Pipeline: Most Common Modalities
Figure 9 RNA Therapy Clinical Trials Pipeline
Figure 10 COVID Impact Analysis: RNA Therapeutics Market Recovery Scenarios
Figure 11 RNA Therapeutics Market by Region, 2022-2032 (US$ Mn, AGR %): “V” Shaped Recovery
Figure 12 RNA Therapeutics Market by Region, 2022-2032 (US$ Mn, AGR %): “U” Shaped Recovery
Figure 13 RNA Therapeutics Market by Region, 2022-2032 (US$ Mn, AGR %): “W” Shaped Recovery
Figure 14 RNA Therapeutics Market by Region, 2022-2032 (US$ Mn, AGR %): “L” Shaped Recovery
Figure 15 RNA Therapeutics Market: Porter’s Five Forces Analysis
Figure 16 RNA Therapeutics Market Attractiveness Index by Technology
Figure 17 RNA Therapeutics Market Forecast by Type, 2022-2032 (US$ million)
Figure 18 RNA Therapeutics Market Share Forecast by Type, 2022, 2027, 2032 (%)
Figure 19 RNA Antisense Technologies Market Forecast by Region, 2022-2032 (US$ million)
Figure 20 RNA Antisense Technologies Market Share Forecast by Region, 2022 & 2032 (%)
Figure 21 RNA Interference (RNAi) Technologies Market Forecast by Region, 2022-2032 (US$ million)
Figure 22 RNA Interference (RNAi) Technologies Market Share Forecast by Region, 2022 & 2032 (%)
Figure 23 RNA Therapeutics Market Attractiveness Index by Type
Figure 24 RNA Therapeutics Market Forecast by Application, 2022-2032 (US$ million)
Figure 25 RNA Therapeutics Market Share Forecast by Application, 2022, 2027, 2032 (%)
Figure 26 Genetic Disorders Market Forecast by Region, 2022-2032 (US$ million)
Figure 27 Genetic Disorders Market Share Forecast by Region, 2022 & 2032 (%)
Figure 28 RNA Therapeutics Market Forecast by Genetic Disorders, 2022-2032 (US$ million)
Figure 29 Autoimmune Disorders Market Forecast by Region, 2022-2032 (US$ million)
Figure 30 Autoimmune Disorders Market Share Forecast by Region, 2022 & 2032 (%)
Figure 31 RNA Therapeutics Market Forecast by Autoimmune Disorders, 2022-2032 (US$ million)
Figure 32 RNA Therapeutics Market Attractiveness Index by End-user
Figure 33 RNA Therapeutics Market Forecast by End-user, 2022-2032 (US$ million)
Figure 34 RNA Therapeutics Market Share Forecast by End-user, 2022, 2027, 2032 (%)
Figure 35 Research Institutes Market Forecast by Region, 2022-2032 (US$ million)
Figure 36 Research Institutes Market Share Forecast by Region, 2022 & 2032 (%)
Figure 37 Hospitals & Clinics Market Forecast by Region, 2022-2032 (US$ million)
Figure 38 Hospitals & Clinics Market Share Forecast by Region, 2022 & 2032 (%)
Figure 39 RNA Therapeutics Market Forecast by Region 2022 & 2032 (Revenue, CAGR%)
Figure 40 RNA Therapeutics Market Share Forecast by Region 2022, 2027, 2032(%)
Figure 41 RNA Therapeutics Market by Region, 2022-2032 (US$ Mn)
Figure 42 RNA Therapeutics Market by Region, 2022-2032 (US$ Mn, AGR %): “V” Shaped Recovery
Figure 43 RNA Therapeutics Market by Region, 2022-2032 (US$ Mn, AGR %): “U” Shaped Recovery
Figure 44 RNA Therapeutics Market by Region, 2022-2032 (US$ Mn, AGR %): “W” Shaped Recovery
Figure 45 RNA Therapeutics Market by Region, 2022-2032 (US$ Mn, AGR %): “L” Shaped Recovery
Figure 46 North America RNA Therapeutics Market Attractiveness Index
Figure 47 North America RNA Therapeutics Market by Region, 2022, 2027 & 2032 (US$ million)
Figure 48 North America RNA Therapeutics Market Forecast by Country, 2022-2032 (US$ million)
Figure 49 North America RNA Therapeutics Market Share Forecast by Country, 2022 & 2032 (%)
Figure 50 North America RNA Therapeutics Market Forecast by Type, 2022-2032 (US$ million)
Figure 51 North America RNA Therapeutics Market Share Forecast by Type, 2022 & 2032 (%)
Figure 52 North America RNA Therapeutics Market Forecast by Application, 2022-2032 (US$ million)
Figure 53 North America RNA Therapeutics Market Share Forecast by Application, 2022 & 2032 (%)
Figure 54 North America RNA Therapeutics Market Forecast by End-user, 2022-2032 (US$ million)
Figure 55 North America RNA Therapeutics Market Share Forecast by End-user, 2022 & 2032 (%)
Figure 56 U.S. RNA Therapeutics Market Forecast, 2022-2032 (US$ million)
Figure 57 Canada RNA Therapeutics Market Forecast, 2022-2032 (US$ million)
Figure 58 Europe RNA Therapeutics Market Attractiveness Index
Figure 59 Europe RNA Therapeutics Market by Region, 2022, 2027 & 2032 (US$ million)
Figure 60 Europe RNA Therapeutics Market Forecast by Country, 2022-2032 (US$ million)
Figure 61 Europe RNA Therapeutics Market Share Forecast by Country, 2022 & 2032 (%)
Figure 62 Europe RNA Therapeutics Market Forecast by Type, 2022-2032 (US$ million)
Figure 63 Europe RNA Therapeutics Market Share Forecast by Type, 2022 & 2032 (%)
Figure 64 Europe RNA Therapeutics Market Forecast by Application, 2022-2032 (US$ million)
Figure 65 Europe RNA Therapeutics Market Share Forecast by Application, 2022 & 2032 (%)
Figure 66 Europe RNA Therapeutics Market Forecast by End-user, 2022-2032 (US$ million)
Figure 67 Europe RNA Therapeutics Market Share Forecast by End-user, 2022 & 2032 (%)
Figure 68 Germany RNA Therapeutics Market Forecast, 2022-2032 (US$ million)
Figure 69 UK RNA Therapeutics Market Forecast, 2022-2032 (US$ million)
Figure 70 France RNA Therapeutics Market Forecast, 2022-2032 (US$ million)
Figure 71 Italy RNA Therapeutics Market Forecast, 2022-2032 (US$ million)
Figure 72 Spain RNA Therapeutics Market Forecast, 2022-2032 (US$ million)
Figure 73 Rest of Europe RNA Therapeutics Market Forecast, 2022-2032 (US$ million)
Figure 74 Asia Pacific RNA Therapeutics Market Attractiveness Index
Figure 75 Asia Pacific RNA Therapeutics Market by Region, 2022, 2027 & 2032 (US$ million)
Figure 76 Asia Pacific RNA Therapeutics Market Forecast by Country, 2022-2032 (US$ million)
Figure 77 Asia Pacific RNA Therapeutics Market Share Forecast by Country, 2022 & 2032 (%)
Figure 78 Asia Pacific RNA Therapeutics Market Forecast by Type, 2022-2032 (US$ million)
Figure 79 Asia Pacific RNA Therapeutics Market Share Forecast by Type, 2022 & 2032 (%)
Figure 80 Asia Pacific RNA Therapeutics Market Forecast by Application, 2022-2032 (US$ million)
Figure 81 Asia Pacific RNA Therapeutics Market Share Forecast by Application, 2022 & 2032 (%)
Figure 82 Asia Pacific RNA Therapeutics Market Forecast by End-user, 2022-2032 (US$ million)
Figure 83 Asia Pacific RNA Therapeutics Market Share Forecast by End-user, 2022 & 2032 (%)
Figure 84 Japan RNA Therapeutics Market Forecast, 2022-2032 (US$ million)
Figure 85 China RNA Therapeutics Market Forecast, 2022-2032 (US$ million)
Figure 86 India RNA Therapeutics Market Forecast, 2022-2032 (US$ million)
Figure 87 Australia RNA Therapeutics Market Forecast, 2022-2032 (US$ million)
Figure 88 South Korea RNA Therapeutics Market Forecast, 2022-2032 (US$ million)
Figure 89 Rest of Asia Pacific RNA Therapeutics Market Forecast, 2022-2032 (US$ million)
Figure 90 Latin America RNA Therapeutics Market Attractiveness Index
Figure 91 Latin America RNA Therapeutics Market by Region, 2022, 2027 & 2032 (US$ million)
Figure 92 Latin America RNA Therapeutics Market Forecast by Country, 2022-2032 (US$ million)
Figure 93 Latin America RNA Therapeutics Market Share Forecast by Country, 2022 & 2032 (%)
Figure 94 Latin America RNA Therapeutics Market Forecast by Type, 2022-2032 (US$ million)
Figure 95 Latin America RNA Therapeutics Market Share Forecast by Type, 2022 & 2032 (%)
Figure 96 Latin America RNA Therapeutics Market Forecast by Application, 2022-2032 (US$ million)
Figure 97 Latin America RNA Therapeutics Market Share Forecast by Application, 2022 & 2032 (%)
Figure 98 Latin America RNA Therapeutics Market Forecast by End-user, 2022-2032 (US$ million)
Figure 99 Latin America RNA Therapeutics Market Share Forecast by End-user, 2022 & 2032 (%)
Figure 100 Brazil RNA Therapeutics Market Forecast, 2022-2032 (US$ million)
Figure 101 Mexico RNA Therapeutics Market Forecast, 2022-2032 (US$ million)
Figure 102 Rest of Latin America RNA Therapeutics Market Forecast, 2022-2032 (US$ million)
Figure 103 MEA RNA Therapeutics Market Attractiveness Index
Figure 104 MEA RNA Therapeutics Market by Region, 2022, 2027 & 2032 (US$ million)
Figure 105 MEA RNA Therapeutics Market Forecast by Country, 2022-2032 (US$ million)
Figure 106 MEA RNA Therapeutics Market Share Forecast by Country, 2022 & 2032 (%)
Figure 107 MEA RNA Therapeutics Market Forecast by Type, 2022-2032 (US$ million)
Figure 108 MEA RNA Therapeutics Market Share Forecast by Type, 2022 & 2032 (%)
Figure 109 MEA RNA Therapeutics Market Forecast by Application, 2022-2032 (US$ million)
Figure 110 MEA RNA Therapeutics Market Share Forecast by Application, 2022 & 2032 (%)
Figure 111 MEA RNA Therapeutics Market Forecast by End-user, 2022-2032 (US$ million)
Figure 112 MEA RNA Therapeutics Market Share Forecast by End-user, 2022 & 2032 (%)
Figure 113 GCC RNA Therapeutics Market Forecast, 2022-2032 (US$ million)
Figure 114 South Africa RNA Therapeutics Market Forecast, 2022-2032 (US$ million)
Figure 115 Rest of MEA RNA Therapeutics Market Forecast, 2022-2032 (US$ million)
Figure 116 Alnylam Pharmaceuticals, Inc.: Net Revenue, 2017-2021 (US$ million, AGR%)
Figure 117 Alnylam Pharmaceuticals, Inc.: Product Revenue Shares (%), 2021
Figure 118 Alnylam Pharmaceuticals, Inc.: Business Operations Shares (%), 2021
Figure 119 Alnylam Pharmaceuticals, Inc.: Gross Profit, 2017-2021 (US$ million, AGR%)
Figure 120 Alnylam Pharmaceuticals, Inc.: R&D, 2017-2021 (US$ million, AGR%)
Figure 121 Arbutus Biopharma: Net Revenue, 2017-2021 (US$ million, AGR%)
Figure 122 Arbutus Biopharma: Gross Profit, 2017-2021 (US$ million, AGR%)
Figure 123 Arbutus Biopharma: R&D, 2017-2021 (US$ million, AGR%)
Figure 124 Arrowhead Pharmaceuticals, Inc.: Net Revenue, 2017-2021 (US$ million, AGR%)
Figure 125 Arrowhead Pharmaceuticals, Inc.: Gross Profit, 2017-2021 (US$ million, AGR%)
Figure 126 Arrowhead Pharmaceuticals, Inc.: R&D, 2017-2021 (US$ million, AGR%)
Figure 127 Benitec Biopharma: Net Revenue, 2017-2021 (US$ million, AGR%)
Figure 128 Benitec Biopharma: Gross Profit, 2017-2021 (US$ million, AGR%)
Figure 129 Benitec Biopharma: R&D, 2017-2021 (US$ million, AGR%)
Figure 130 Biogen: Net Revenue, 2017-2021 (US$ million, AGR%)
Figure 131 Biogen: Regional Market Shares (%), 2021
Figure 132 Biogen: Gross Profit, 2017-2021 (US$ million, AGR%)
Figure 133 Biogen: R&D, 2017-2021 (US$ million, AGR%)
Figure 134 Genzyme (Sanofi): Net Revenue, 2017-2021 (US$ million, AGR%)
Figure 135 Genzyme (Sanofi): Regional Market Shares (%), 2021
Figure 136 Genzyme (Sanofi): Gross Profit, 2017-2021 (US$ million, AGR%)
Figure 137 Genzyme (Sanofi): R&D, 2017-2021 (US$ million, AGR%)
Figure 138 Ionis Pharmaceuticals, Inc.: Net Revenue, 2017-2021 (US$ million, AGR%)
Figure 139 Ionis Pharmaceuticals, Inc.: Gross Profit, 2017-2021 (US$ million, AGR%)
Figure 140 Ionis Pharmaceuticals, Inc.: R&D, 2017-2021 (US$ million, AGR%)
Figure 141 Sarepta Therapeutics, Inc.: Net Revenue, 2017-2021 (US$ million, AGR%)
Figure 142 Sarepta Therapeutics, Inc.: Gross Profit, 2017-2021 (US$ million, AGR%)
Figure 143 Sarepta Therapeutics, Inc.: R&D, 2017-2021 (US$ million, AGR%)
Figure 144 Silence Therapeutics: Net Revenue, 2020-2021 (US$ million)
Figure 145 Silence Therapeutics: Gross Profit, 2020-2021 (US$ million)
Figure 146 Silence Therapeutics: R&D, 2020-2021 (US$ million)
ページTOPに戻る
よくあるご質問
Visiongain社はどのような調査会社ですか?
英国の調査会社ヴィジョンゲイン社(Visiongain)は、通信とエネルギーのほか、自動車や化学・医薬品、金属など、広範な市場を対象に調査を行っています。自動車市場については、市場全般に関する調査のほ... もっと見る
調査レポートの納品までの日数はどの程度ですか?
在庫のあるものは速納となりますが、平均的には 3-4日と見て下さい。
但し、一部の調査レポートでは、発注を受けた段階で内容更新をして納品をする場合もあります。
発注をする前のお問合せをお願いします。
注文の手続きはどのようになっていますか?
1)お客様からの御問い合わせをいただきます。
2)見積書やサンプルの提示をいたします。
3)お客様指定、もしくは弊社の発注書をメール添付にて発送してください。
4)データリソース社からレポート発行元の調査会社へ納品手配します。
5) 調査会社からお客様へ納品されます。最近は、pdfにてのメール納品が大半です。
お支払方法の方法はどのようになっていますか?
納品と同時にデータリソース社よりお客様へ請求書(必要に応じて納品書も)を発送いたします。
お客様よりデータリソース社へ(通常は円払い)の御振り込みをお願いします。
請求書は、納品日の日付で発行しますので、翌月最終営業日までの当社指定口座への振込みをお願いします。振込み手数料は御社負担にてお願いします。
お客様の御支払い条件が60日以上の場合は御相談ください。
尚、初めてのお取引先や個人の場合、前払いをお願いすることもあります。ご了承のほど、お願いします。
データリソース社はどのような会社ですか?
当社は、世界各国の主要調査会社・レポート出版社と提携し、世界各国の市場調査レポートや技術動向レポートなどを日本国内の企業・公官庁及び教育研究機関に提供しております。
世界各国の「市場・技術・法規制などの」実情を調査・収集される時には、データリソース社にご相談ください。
お客様の御要望にあったデータや情報を抽出する為のレポート紹介や調査のアドバイスも致します。
|
|


