CAR-T療法市場レポート:2022-2032
CAR-T Therapy Market Report 2022-2032
レポート詳細
CAR-T療法市場レポート 2022-2032 :本レポートは、新たな収益の柱を目指すリーディングカンパニーが、業界とその背景にあるダイナミクスをより深く理解する上で、非常に有益なものとな... もっと見る
※上記価格は部署ライセンス(Departmental licence)価格です。
その他の価格についてはデータリソースまでお問合せください。
日本語のページは自動翻訳を利用し作成しています。
実際のレポートは英文のみでご納品いたします。
サマリー
レポート詳細
CAR-T療法市場レポート 2022-2032:本レポートは、新たな収益の柱を目指すリーディングカンパニーが、業界とその背景にあるダイナミクスをより深く理解する上で、非常に有益なものとなるでしょう。また、異業種への進出や新地域での既存事業の拡大を目指す企業にとっても有用なレポートです。
ベンチャーキャピタルや政府機関からの資金調達の増加、世界的ながん罹患率の上昇が市場成長を牽引しています。
CAR-T療法市場を推進する主な要因としては、ベンチャーキャピタルや政府機関からの資金調達の増加、世界的ながんに対する負担の増加などが挙げられます。WHOが発表したデータによると、がんは世界的に主要な死因であり、2020年には約1,000万人の死亡を引き起こしています。
米国癌協会(American Cancer Society, Inc.)は、現在の人口高齢化と人口増加の予測に基づき、2040年までに癌の負担は世界で推定2940万件に増加すると予測しています。世界最大の人口を擁する中国は、がんの新規患者数および死亡者数の割合が最も高く、次いで新規患者数では北アメリカ、死亡者数では第4位となっています。世界各国では、タバコやアルコールの消費、不健康な食事、運動不足、大気汚染などが増加しており、今後、がんの負担がさらに増加する可能性があります。過去5年間で、世界中のベンチャーキャピタル(VC)から約120億米ドルが投資され、さらに22億米ドルが様々な研究機関とバイオファーマ企業との戦略的パートナーシップにより調達されています。
CAR-T療法における保険償還の課題と副作用について
CAR-T療法の保険償還は、世界中の医療従事者、保険会社、国・地方公共団体にとって課題となっています。CAR-T細胞は市場で最も高価な薬剤の1つであり、患者1人当たりの価格は約45万〜50万ドルです。また、CAR-T細胞を使用する患者さんは進行性の疾患が多く、健康状態が急速に悪化するため、支払者の承認に遅れが生じると、CAR-T細胞の使用資格に影響を与える可能性があります。他のがん治療と同様に、CAR-T療法にも深刻な副作用があります。最も一般的な副作用は、サイトカイン放出症候群(CRS)と神経系への影響です。
マーケットリサーチレポートを購入する前に、どのような質問をすべきでしょうか?
- CAR-T療法市場はどのように進化しているのか?
- CAR-T療法市場の推進要因と抑制要因は何か?
- 各CAR-T療法サブマーケットセグメントは予測期間中にどのように成長し、これらのサブマーケットが2032年に占める収益はどの程度になるのか?
- 2022年から2032年にかけて、各CAR-T療法サブマーケットの市場シェアはどのように推移するのでしょうか?
- 2022年から2032年にかけて、市場全体の主なドライバーは何でしょうか?
- CAR-T療法の主要市場はマクロ経済のダイナミクスに概ね追随するのか、それとも個々の国内市場が他を凌駕するのか?
- 2032年までに各国市場のシェアはどのように変化し、どの地域が2032年の市場をリードするのでしょうか?
- 主要プレイヤーは誰か、また予測期間中の見通しは?
- これらの主要企業のCAR-T療法プロジェクトはどのようなものですか?
- 2022年から2032年の間に、業界はどのように進化していくのでしょうか?現在および今後10年間に実施されるCAR-T療法プロジェクトにはどのような意味があるのか?
- CAR-T療法市場をさらに拡大するために、製品の商業化の必要性は高まっているのか?
- CAR-T療法市場の方向性と、市場の最前線に立つためにはどうすればよいのでしょうか?
- 新製品やサービスラインに対する最適な投資オプションは何か?
- 企業を新たな成長軌道に乗せ、C-suiteに移行させるための重要な展望とは?
このことが、現在、そして今後10年間のCAR-T療法市場にどのような影響を与えるかを知る必要があります。- 251ページにわたる本レポートでは、99の表と149のグラフを独占的に提供します。
- このレポートでは、業界における主要な収益性の高い分野に焦点を当て、今すぐターゲットにできるようにしています。
- 世界、地域、国別の売上高と成長率を詳細に分析しています。
- 競合他社が成功した主なトレンド、変化、収益予測をハイライトしています。
本レポートは、CAR-T療法市場が今後10年間にどのように発展し、COVID-19の景気後退と回復の変動にどのように対応するかを教えてくれるものです。この市場は、過去10年間のどの時点よりも今が重要なのです。
2032年までの予測やその他の分析により、商業的な展望が見えてくる
2032年までの収益予測に加え、直近の実績、成長率、市場シェアもご覧いただけます。
- ビジネスの展望や展開など、独自の分析もご覧いただけます。
- 定性的分析(市場ダイナミクス、ドライバー、機会、阻害要因、課題など)、コスト構造、CAR-T療法の価格上昇の影響、最近の動向などをご覧いただけます。
本レポートでは、COVID-19が業界と貴社にどのような影響を与えるかについて、データ分析と貴重な洞察を掲載しています。本レポートでは、COVID-19の4つの回収パターンとその影響、すなわち「V」、「L」、「W」、「U」について論じています。
報告書の対象セグメント
適応症
- びまん性大細胞型B細胞リンパ腫(DLBCL)
- 急性リンパ芽球性白血病(ALL)
- 濾胞性リンパ腫(Follicular Lymphoma
- 多発性骨髄腫(MM)
- その他
タイプ
- Abecma
- Yescarta
- Kymriah
- Tecartus
- その他
標的抗原
- CD19/CD22
- BCMA (B-cell maturation antigen)
- その他
患者
- 小児
- 成人
- 高齢者
エンドユーザー
- 病院
- 専門クリニック
- その他のエンドユーザー
世界市場全体とセグメントの収益予測に加え、5つの地域と10の主要国市場の収益予測も掲載しています。
北米
- 米国
- カナダ
欧州
- ドイツ
- 英国
- フランス
- スペイン
- イタリア
- その他の欧州
アジア太平洋
- 中国
- 日本
- インド
- オーストラリア
- 韓国
- その他のアジア太平洋地域
ラテンアメリカ
MEA
CAR-T療法市場の主要企業のプロファイルと2022年から2032年まで、これらの企業のこのセグメントに焦点を当てた内容も含まれています。
主要企業と市場成長の可能性
・ AbbVie Inc.
・ Amgen Inc.
・ BioNTech SE
・ bluebird bio, Inc.
・ Bristol-Myers Squibb Company
・ Caribou Biosciences Inc.
・ Gilead Sciences Inc.
・ GSK plc
・ Johnson & Johnson Private Limited
・ Novartis AG
CAR-T療法市場の世界全体の収益、2022年から2032年までの金額ベースで、市場は2022年に28億米ドルを突破すると弊社は算出しています。また、2032年までの間に売上高が大きく伸びると予測しています。本調査では、最も大きな可能性を秘めた組織を特定しました。彼らの能力、進歩、商業的展望を知ることで、一歩先を行くことができます。
CAR-T療法市場、2022年から2032年までのレポートはどのように役立つのでしょうか?
250ページを超えるレポートでは、要約すると以下のような知識を得ることができます。
- CAR-T 療法市場の2032年までの収益予測、適応症、タイプ、標的抗原、患者、エンドユーザーの各予測を世界および地域レベルで掲載 - 投資と収益に最も有利な場所を見つけ、業界の展望を発見してください。
- 5つの地域と12の主要国市場の2032年までの収益予測 - CAR-T 療法市場、北米、ヨーロッパ、アジア太平洋、ラテンアメリカ、MEAの2022年から2032年までの市場予測をご覧ください。また、米国、カナダ、ドイツ、フランス、英国、イタリア、オランダ、中国、インド、日本、韓国、オーストラリアなどの主要経済圏の市場も予測されています。
- 既存企業および市場参入を目指す企業の展望 - CAR-T 療法市場に関わる主要企業10社の企業プロフィールを含む、2022年から2032年までの展望。
定量的・定性的な分析と独自の予測をご覧いただけます。私たちのレポートだけが持つ情報を入手し、貴重なビジネスインテリジェンスを得ることができます。
他にはない情報
私たちの新しいレポートがあれば、知識の遅れを取り戻し、チャンスを逃す可能性が低くなります。私たちの研究が貴社の研究、分析、意思決定にどのように役立つかをご覧ください。Visiongainの研究は、CAR-T療法市場、2022年から2032年、市場をリードする企業のための商業分析を必要とするすべての人のためのものです。データ、トレンド、予測をご覧いただけます。
ページTOPに戻る
目次
目次
1.レポートの概要
1.1 研究の目的
1.2 CAR-T療法市場の紹介
1.3 本レポートが提供するもの
1.4 本レポートを読むべき理由
1.5 本分析レポートが回答する重要な質問
1.6 本レポートは誰のためのものなのか?
1.7 方法論
1.7.1 市場の定義
1.7.2 市場評価・予測手法
1.7.3 データの検証
1.7.3.1 一次調査
1.7.3.2 セカンダリーリサーチ
1.8 よくある質問(FAQ)
1.9 関連するVisiongainのレポート
1.10 Visiongainについて
2 エグゼクティブサマリー
3 市場の概要
3.1 主要な調査結果
3.2 マーケットダイナミクス
3.2.1 市場の推進要因
3.2.1.1 世界的ながん罹患率の増加によるCAR T細胞への需要喚起
3.2.1.2 ベンチャーキャピタルや政府機関からの資金調達の増加
3.2.1.3 中国における臨床研究インフラの拡大
3.2.2 市場阻害要因
3.2.2.1 複雑な製造とサプライチェーン
3.2.2.2 CAR-T細胞に対する償還の課題
3.2.2.3 CAR-T細胞の副作用
3.2.3 市場機会
3.2.3.1 CAR-T細胞製造におけるAIの利用拡大
3.2.3.2 制御可能なCAR-T細胞のエンジニアリング
3.3 COVID-19 インパクト分析
3.4 ポーターのファイブフォース分析
3.4.1 供給者のバーゲニングパワー
3.4.2 バイヤーのバーゲニングパワー
3.4.3 新規参入者の脅威
3.4.4 代替品の脅威
3.4.5 競合他社の競争力
3.5 PEST分析
3.5.1 政治的要因
3.5.2 経済的要因
3.5.3 社会的要因
3.5.4 技術的要因
4 CAR-T療法市場分析:適応症別
4.1 主要な調査結果
4.2 適応症別セグメント市場魅力度指数
4.3 適応症別Car-T療法市場規模推定・予測
4.4 びまん性大細胞型B細胞リンパ腫(DLBCL)
4.4.1 地域別市場規模、2022-2032年(10億米ドル)
4.4.2 地域別市場シェア、2022年&2032年(%)
4.5 急性リンパ芽球性白血病(ALL)
4.5.1 地域別市場規模、2022年~2032年 (10億米ドル)
4.5.2 地域別市場シェア、2022年&2032年(%)
4.6 濾胞性リンパ腫
4.6.1 地域別市場規模、2022年~2032年 (10億米ドル)
4.6.2 地域別市場シェア、2022年&2032年(%)
4.7 多発性骨髄腫(MM)
4.7.1 地域別市場規模、2022年~2032年 (10億米ドル)
4.7.2 地域別市場シェア、2022年&2032年(%)
4.8 その他
4.8.1 地域別市場規模、2022年〜2032年 (10億米ドル)
4.8.2 地域別市場シェア、2022年&2032年(%)
5 CAR-T療法市場分析:タイプ別
5.1 主な調査結果
5.2 タイプ別セグメント市場魅力度指数
5.3 カーTセラピーのタイプ別市場規模推定・予測
5.4 アベックマ
5.4.1 Abecmaの市場規模、2022年〜2032年(10億米ドル)
5.5 イースカルタ
5.5.1 イースカルタの市場規模、2022年〜2032年(10億米ドル)
5.6 キムリア
5.6.1 Kymriahの市場規模、2022-2032年 (10億米ドル)
5.7 テカルトス
5.7.1 テカルタスの市場規模、2022-2032年 (10億米ドル)
5.8 その他
5.8.1 その他市場規模、2022-2032 (bn米ドル)
6 CAR-T療法市場分析:標的抗原別
6.1 主要な調査結果
6.2 標的抗原セグメント市場魅力度指数
6.3 カーT療法の標的抗原別市場規模の推定と予測
6.4 CD19/CD22
6.4.1 地域別市場規模、2022年~2032年(10億米ドル)
6.4.2 地域別市場シェア、2022年&2032年(%)
6.5 BCMA(B細胞成熟抗原)
6.5.1 地域別市場規模、2022年~2032年 (10億米ドル)
6.5.2 地域別市場シェア、2022年&2032年(%)
6.6 その他
6.6.1 地域別市場規模、2022年~2032年 (10億米ドル)
6.6.2 地域別市場シェア、2022年&2032年(%)
7 CAR-T療法市場分析:患者別
7.1 主要な調査結果
7.2 患者セグメント市場魅力度指数
7.3 Car-T療法の患者別市場規模の推定と予測
7.4 小児
7.4.1 地域別市場規模、2022年~2032年(10億米ドル)
7.4.2 地域別市場シェア、2022年&2032年(%)
7.5 成人
7.5.1 地域別市場規模、2022年~2032年 (10億米ドル)
7.5.2 地域別市場シェア、2022年&2032年(%)
7.6 高齢者
7.6.1 地域別市場規模、2022年~2032年 (10億米ドル)
7.6.2 地域別市場シェア、2022年&2032年(%)
8 CAR-T療法市場分析:エンドユーザー別
8.1 主な調査結果
8.2 エンドユーザーセグメント市場魅力度指数
8.3 Car-T療法のエンドユーザー別市場規模推定・予測
8.4 病院
8.4.1 地域別市場規模、2022年〜2032年(10億米ドル)
8.4.2 地域別市場シェア、2022年&2032年(%)
8.5 スペシャルティクリニック
8.5.1 地域別市場規模、2022年~2032年 (10億米ドル)
8.5.2 地域別市場シェア、2022年&2032年(%)
8.6 その他のエンドユーザー
8.6.1 地域別市場規模、2022年~2032年 (10億米ドル)
8.6.2 地域別市場シェア、2022年&2032年(%)
9 CAR-T療法市場分析:地域別市場
9.1 主要な調査結果
9.2 地域別市場規模の推定と予測
10 北米のCAR-T療法市場分析
10.1 主な調査結果
10.2 北米にのCAR-T療法市場魅力度指数
10.3 北米のCAR-T療法国別市場 2022年、2027年&2032年 (10億米ドル)
10.4 北米のCAR-T療法の国別市場規模予測・予想
10.5 北米のCAR-T療法の適応症別市場規模予測・予想
10.6 北米のCAR-T療法の市場規模予測・ターゲット抗原別予測
10.7 北米のCAR-T療法の市場規模予測・患者別予測
10.8 北米のCAR-T療法の市場規模予測・エンドユーザー別予測
10.9 アメリカのCAR-T療法の市場分析
10.10 カナダのCAR-T療法の市場分析
11 欧州のCAR-T療法市場分析
11.1 主な調査結果
11.2 欧州のCAR-T療法市場の魅力度指数
11.3 欧州のCAR-T療法国別市場 2022年、2027年&2032年(10億米ドル)
11.4 欧州のCAR-T療法の国別市場規模予測・予想
11.5 欧州のCAR-T療法の適応症別市場規模予測・予測
11.6 欧州のCAR-T療法の市場規模予測・予測:標的抗原別
11.7 欧州のCar-T療法の市場規模予測・患者別予測
11.8 欧州のCAR-T療法の市場規模予測・エンドユーザー別予測
11.9 ドイツのCAR-T療法の市場分析
11.10 イギリスのCAR-T療法の市場分析
11.11 フランスのCAR-T療法の市場分析
11.12 イタリアのCAR-T療法の市場分析
11.13 スペインCAR-T療法市場の分析
11.14 オランダのCAR-T療法の市場分析
11.15 その他の欧州のCAR-T療法市場の分析
12 アジア太平洋地域のCAR-T療法市場分析
12.1 主な調査結果
12.2 アジア太平洋地域のCAR-T療法市場の魅力度指数
12.3 アジア太平洋地域のCAR-T療法国別市場:2022年、2027年&2032年(10億米ドル)
12.4 アジア太平洋地域のCAR-T療法の国別市場規模予測・予想
12.5 アジア太平洋地域のCAR-T療法の適応症別市場規模予測・予想
12.6 アジア太平洋地域のCAR-T療法の標的抗原別市場規模予測・予想
12.7 アジア太平洋地域のCAR-T療法の市場規模予測・患者別予測
12.8 アジア太平洋地域のCAR-T療法の市場規模予測・エンドユーザー別予測
12.9 日本にのCAR-T療法市場分析
12.10 中国のCAR-T療法市場分析
12.11 インドのCAR-T療法市場分析
12.12 オーストラリアのCAR-T療法市場分析
12.13 韓国のCAR-T療法市場分析
12.14 その他のアジア太平洋地域のCAR-T療法市場分析
13 中南米のCAR-T療法市場分析
13.1 主な調査結果
13.2 中南米のCAR-T療法の適応症別市場規模予測・予想
13.3 中南米のCAR-T療法の標的抗原別市場規模予測・予想
13.4 中南米のCAR-T療法の市場規模予測:患者別
13.5 中南米のCAR-T療法の市場規模予測・エンドユーザー別予測
13.6 ブラジルCAR-T療法の市場分析
13.7 メキシコのCAR-T療法市場分析
13.8 その他のラテンアメリカのCAR-T療法の市場分析
14 MEAのCAR-T療法市場分析
14.1 主要な調査結果
14.2 MEAのCAR-T療法の適応症別市場規模予測・予想
14.3 MEAのCAR-T療法の標的抗原別市場規模予測・予想
14.4 MEAのCAR-T療法の患者別市場規模予測・予想
14.5 MEAのCAR-T療法の市場規模予測・エンドユーザー別予測
14.6 GCCのCAR-T療法の市場分析
14.7 その他の中東・アフリカ地域のCAR-T療法市場分析
15 主要企業のプロフィール
15.1 競合状況、2021年
15.2 戦略的な展望
15.3 ノバルティスAG
15.3.1 企業スナップショット
15.3.2 会社概要
15.3.3 財務分析
15.3.3.1 純収益、2017-2021年
15.3.3.2 R&D、2017-2021年
15.3.3.3 地域別市場シェア、2021年
15.3.4 製品ベンチマーク
15.3.5 戦略的な展望
15.4 ギリアド・サイエンシズ社
15.4.1 企業スナップショット
15.4.2 会社概要
15.4.3 財務分析
15.4.3.1 純収益、2017-2021年
15.4.3.2 R&D、2017年-2021年
15.4.3.3 地域別市場シェア、2021年
15.4.4 製品ベンチマーク
15.4.5 戦略的な展望
15.5 ブリストル・マイヤーズ スクイブ社
15.5.1 企業スナップショット
15.5.2 会社概要
15.5.3 財務分析
15.5.3.1 純収益、2017-2021年
15.5.3.2 R&D、2017年-2021年
15.5.3.3 地域別市場シェア、2021年
15.5.4 製品ベンチマーク
15.5.5 戦略的な展望
15.6 ジョンソン・エンド・ジョンソン プライベート リミテッド
15.6.1 企業スナップショット
15.6.2 会社概要
15.6.3 財務分析
15.6.3.1 純収益、2017-2021年
15.6.3.2 R&D、2017年-2021年
15.6.3.3 地域別市場シェア、2021年
15.6.4 製品ベンチマーク
15.6.5 戦略的な展望
15.7 ブルーバードバイオ
15.7.1 企業スナップショット
15.7.2 会社概要
15.7.3 財務分析
15.7.3.1 純収益、2017-2021年
15.7.3.2 R&D、2017年-2021年
15.7.4 製品ベンチマーク
15.7.5 戦略的な展望
15.8 GSK plc
15.8.1 企業スナップショット
15.8.2 会社概要
15.8.3 財務分析
15.8.3.1 純収益、2017-2021年
15.8.3.2 R&D、2017年-2021年
15.8.3.3 地域別市場シェア、2021年
15.8.4 製品ベンチマーク
15.8.5 戦略的展望
15.9 カリブー・バイオサイエンス社
15.9.1 企業スナップショット
15.9.2 会社概要
15.9.3 財務分析
15.9.3.1 純収益、2019-2021年
15.9.3.2 R&D、2019年-2021年
15.9.3.3 地域別市場シェア、2021年
15.9.4 製品ベンチマーク
15.9.5 戦略的な展望
15.10 アムジェン社
15.10.1 企業スナップショット
15.10.2 会社概要
15.10.3 財務分析
15.10.3.1 純収益、2017-2021年
15.10.3.2 R&D、2017年-2021年
15.10.3.3 地域別市場シェア、2021年
15.10.4 製品ベンチマーク
15.10.5 戦略的な展望
15.11 アッヴィー社
15.11.1 企業スナップショット
15.11.2 会社概要
15.11.3 財務分析
15.11.3.1 純収益、2017-2021年
15.11.3.2 R&D、2017年-2021年
15.11.3.3 地域別市場シェア、2021年
15.11.4 製品ベンチマーク
15.11.5 戦略的な展望
15.12 バイオテックSE
15.12.1 企業スナップショット
15.12.2 会社概要
15.12.3 財務分析
15.12.3.1 純収益、2017-2021年
15.12.3.2 R&D、2017年-2021年
15.12.4 製品ベンチマーク
15.12.5 戦略的展望
16 結論と提言
16.1 ヴィジョンゲインからの結論
16.2 市場関係者への提言
表の一覧
Table 1 CAR-T Therapy Market Snapshot, 2022 & 2032 (US$ billion, CAGR %)
Table 2 Car-T Therapy Market by Region, 2022-2032 (US$ bn, AGR (%), CAGR(%)): “V” Shaped Recovery Scenario
Table 3 Car-T Therapy Market by Region, 2022-2032 (US$ bn, AGR (%), CAGR(%)): “U” Shaped Recovery Scenario
Table 4 Car-T Therapy Market by Region, 2022-2032 (US$ bn, AGR (%), CAGR(%)): “W” Shaped Recovery Scenario
Table 5 Car-T Therapy Market by Region, 2022-2032 (US$ bn, AGR (%), CAGR(%)): “L” Shaped Recovery Scenario
Table 6 Car-T Therapy Market Forecast By Indication, 2022-2032 (US$ Bn, AGR%, CAGR%)
Table 7 DLBCL Market Forecast by Region, 2022-2032 (US$ bn, AGR%, CAGR%)
Table 8 ALL Market Forecast by Region, 2022-2032 (US$ bn, AGR%, CAGR%)
Table 9 Follicular Lymphoma Market Forecast by Region, 2022-2032 (US$ bn, AGR%, CAGR%)
Table 10 Multiple Myeloma (MM) Market Forecast by Region, 2022-2032 (US$ bn, AGR%, CAGR%)
Table 11 Others Market Forecast by Region, 2022-2032 (US$ bn, AGR%, CAGR%)
Table 12 Car-T Therapy Market Forecast By Type, 2022-2032 (US$ bn, AGR%, CAGR%)
Table 13 Abecma Market Forecast, 2022-2032 (US$ bn, AGR%, CAGR%)
Table 14 Yescarta Market Forecast, 2022-2032 (US$ bn, AGR%, CAGR%)
Table 15 Kymriah Market Forecast, 2022-2032 (US$ bn, AGR%, CAGR%)
Table 16 Tecartus Market Forecast, 2022-2032 (US$ bn, AGR%, CAGR%)
Table 17 Others Market Forecast, 2022-2032 (US$ bn, AGR%, CAGR%)
Table 18 Car-T Therapy Market Forecast By Target Antigens, 2022-2032 (US$ bn, AGR%, CAGR%)
Table 19 CD19/CD22 Market Forecast by Region, 2022-2032 (US$ bn, AGR%, CAGR%)
Table 20 BCMA Market Forecast by Region, 2022-2032 (US$ bn, AGR%, CAGR%)
Table 21 Others Market Forecast by Region, 2022-2032 (US$ bn, AGR%, CAGR%)
Table 22 Car-T Therapy Market Forecast By Patient, 2022-2032 (US$ bn, AGR%, CAGR%)
Table 23 Children Market Forecast by Region, 2022-2032 (US$ bn, AGR%, CAGR%)
Table 24 Adults Market Forecast by Region, 2022-2032 (US$ bn, AGR%, CAGR%)
Table 25 Seniors Market Forecast by Region, 2022-2032 (US$ bn, AGR%, CAGR%)
Table 26 Car-T Therapy Market Forecast By End-users, 2022-2032 (US$ bn, AGR%, CAGR%)
Table 27 Hospitals Market Forecast by Region, 2022-2032 (US$ bn, AGR%, CAGR%)
Table 28 Specialty Clinics Market Forecast by Region, 2022-2032 (US$ bn, AGR%, CAGR%)
Table 29 Other End-user Market Forecast by Region, 2022-2032 (US$ bn, AGR%, CAGR%)
Table 30 Car-T Therapy Market by Region, 2022-2032 (US$ bn, AGR (%), CAGR(%))
Table 31 North America Car-T Therapy Market Forecast by Country, 2022-2032 (US$ bn, AGR%, CAGR%)
Table 32 North America Car-T Therapy Market Forecast By Indication, 2022-2032 (US$ bn, AGR%, CAGR%)
Table 33 North America Car-T Therapy Market Forecast by Target Antigens, 2022-2032 (US$ bn, AGR%, CAGR%)
Table 34 North America Car-T Therapy Market Forecast by Patients, 2022-2032 (US$ bn, AGR%, CAGR%)
Table 35 North America Car-T Therapy Market Forecast by End Users, 2022-2032 (US$ bn, AGR%, CAGR%)
Table 36 U.S. Car-T Therapy Market Forecast, 2022-2032 (US$ bn, AGR%, CAGR%)
Table 37 Canada Car-T Therapy Market Forecast, 2022-2032 (US$ bn, AGR%, CAGR%)
Table 38 Europe Car-T Therapy Market Forecast by Country, 2022-2032 (US$ bn, AGR%, CAGR%)
Table 39 Europe Car-T Therapy Market Forecast By Indication, 2022-2032 (US$ bn, AGR%, CAGR%)
Table 40 Europe Car-T Therapy Market Forecast by Target Antigens, 2022-2032 (US$ bn, AGR%, CAGR%)
Table 41 Europe Car-T Therapy Market Forecast by Patients, 2022-2032 (US$ bn, AGR%, CAGR%)
Table 42 Europe Car-T Therapy Market Forecast by End-users, 2022-2032 (US$ bn, AGR%, CAGR%)
Table 43 Germany Car-T Therapy Market Forecast, 2022-2032 (US$ bn, AGR%, CAGR%)
Table 44 UK Car-T Therapy Market Forecast, 2022-2032 (US$ bn, AGR%, CAGR%)
Table 45 France Car-T Therapy Market Forecast, 2022-2032 (US$ bn, AGR%, CAGR%)
Table 46 Italy Car-T Therapy Market Forecast, 2022-2032 (US$ bn, AGR%, CAGR%)
Table 47 Spain Car-T Therapy Market Forecast, 2022-2032 (US$ bn, AGR%, CAGR%)
Table 48 Netherlands Car-T Therapy Market Forecast, 2022-2032 (US$ bn, AGR%, CAGR%)
Table 49 Rest of Europe Car-T Therapy Market Forecast, 2022-2032 (US$ bn, AGR%, CAGR%)
Table 50 Asia Pacific Car-T Therapy Market Forecast by Country, 2022-2032 (US$ bn, AGR%, CAGR%)
Table 51 Asia Pacific Car-T Therapy Market Forecast By Indication, 2022-2032 (US$ bn, AGR%, CAGR%)
Table 52 Asia Pacific Car-T Therapy Market Forecast by Target Antigens, 2022-2032 (US$ bn, AGR%, CAGR%)
Table 53 Asia Pacific Car-T Therapy Market Forecast by Patients, 2022-2032 (US$ bn, AGR%, CAGR%)
Table 54 Asia Pacific Car-T Therapy Market Forecast by End-users, 2022-2032 (US$ bn, AGR%, CAGR%)
Table 55 Japan Car-T Therapy Market Forecast, 2022-2032 (US$ bn, AGR%, CAGR%)
Table 56 China Car-T Therapy Market Forecast, 2022-2032 (US$ bn, AGR%, CAGR%)
Table 57 India Car-T Therapy Market Forecast, 2022-2032 (US$ bn, AGR%, CAGR%)
Table 58 Australia Car-T Therapy Market Forecast, 2022-2032 (US$ bn, AGR%, CAGR%)
Table 59 South Korea Car-T Therapy Market Forecast, 2022-2032 (US$ bn, AGR%, CAGR%)
Table 60 Rest of Asia Pacific Car-T Therapy Market Forecast, 2022-2032 (US$ bn, AGR%, CAGR%)
Table 61 Latin America Car-T Therapy Market Forecast By Indication, 2022-2032 (US$ bn, AGR%, CAGR%)
Table 62 Latin America Car-T Therapy Market Forecast by Target Antigens, 2022-2032 (US$ bn, AGR%, CAGR%)
Table 63 Latin America Car-T Therapy Market Forecast by Patients, 2022-2032 (US$ bn, AGR%, CAGR%)
Table 64 Latin America Car-T Therapy Market Forecast by End-users, 2022-2032 (US$ bn, AGR%, CAGR%)
Table 65 MEA Car-T Therapy Market Forecast By Indication, 2022-2032 (US$ bn, AGR%, CAGR%)
Table 66 MEA Car-T Therapy Market Forecast by Target Antigens, 2022-2032 (US$ bn, AGR%, CAGR%)
Table 67 MEA Car-T Therapy Market Forecast by Patient, 2022-2032 (US$ bn, AGR%, CAGR%)
Table 68 MEA Car-T Therapy Market Forecast by End-users, 2022-2032 (US$ bn, AGR%, CAGR%)
Table 69 Strategic Outlook
Table 70 Novartis AG: Key Details, (CEO, HQ, Revenue, Founded, No. of Employees, Company Type, Website, Business Segment)
Table 71 Novartis AG: Product Benchmarking
Table 72 Novartis AG: Strategic Outlook
Table 73 Gilead Sciences, Inc.: Key Details, (CEO, HQ, Revenue, Founded, No. of Employees, Company Type, Website, Business Segment)
Table 74 Gilead Science, Inc.: Product Benchmarking
Table 75 Gilead Science, Inc.: Strategic Outlook
Table 76 Bristol-Myers Squibb Company: Key Details, (CEO, HQ, Revenue, Founded, No. of Employees, Company Type, Website, Business Segment)
Table 77 Bristol-Myers Squibb Company: Product Benchmarking
Table 78 Bristol-Myers Squibb Company: Strategic Outlook
Table 79 Johnson & Johnson Private Limited: Key Details, (CEO, HQ, Revenue, Founded, No. of Employees, Company Type, Website, Business Segment)
Table 80 Johnson & Johnson Private Limited: Product Benchmarking
Table 81 Johnson & Johnson Private Limited: Strategic Outlook
Table 82 bluebird bio, Inc.: Key Details, (CEO, HQ, Revenue, Founded, No. of Employees, Company Type, Website, Business Segment)
Table 83 bluebird bio, Inc.: Product Benchmarking
Table 84 bluebird bio, Inc.: Strategic Outlook
Table 85 GSK plc: Key Details, (CEO, HQ, Revenue, Founded, No. of Employees, Company Type, Website, Business Segment)
Table 86 GSK plc: Product Benchmarking
Table 87 GSK plc: Strategic Outlook
Table 88 Caribou Biosciences Inc: Key Details, (CEO, HQ, Revenue, Founded, No. of Employees, Company Type, Website, Business Segment)
Table 89 Caribou Biosciences Inc: Product Benchmarking
Table 90 Caribou Biosciences Inc: Strategic Outlook
Table 91 Amgen Inc.: Key Details, (CEO, HQ, Revenue, Founded, No. of Employees, Company Type, Website, Business Segment)
Table 92 Amgen Inc.: Product Benchmarking
Table 93 Amgen Inc.: Strategic Outlook
Table 94 AbbVie Inc.: Key Details, (CEO, HQ, Revenue, Founded, No. of Employees, Company Type, Website, Business Segment)
Table 95 AbbVie Inc.: Product Benchmarking
Table 96 AbbVie Inc.: Strategic Outlook
Table 97 BioNTech SE: Key Details, (CEO, HQ, Revenue, Founded, No. of Employees, Company Type, Website, Business Segment)
Table 98 BioNTech SE: Product Benchmarking
Table 99 BioNTech SE: Strategic Outlook
図の一覧
Figure 1 CAR-T Therapy Market Segmentation
Figure 2 CAR-T Therapy Market by Region: Market Attractiveness Index
Figure 3 CAR-T Therapy Market By Indication: Market Attractiveness Index
Figure 4 CAR-T Therapy Market: Market Dynamics
Figure 5 COVID Impact Analysis: Car-T Therapy Market Recovery Scenarios
Figure 6 Car-T Therapy Market by Region, 2022-2032 (US$ bn, AGR %): “V” Shaped Recovery
Figure 7 Car-T Therapy Market by Region, 2022-2032 (US$ bn, AGR %): “U” Shaped Recovery
Figure 8 Car-T Therapy Market by Region, 2022-2032 (US$ bn, AGR %): “W” Shaped Recovery
Figure 9 Car-T Therapy Market by Region, 2022-2032 (US$ bn, AGR %): “L” Shaped Recovery
Figure 10 CAR-T Therapy Market: Porter’s Five Forces Analysis
Figure 11 Bargaining Power of Suppliers
Figure 12 Bargaining Power of Buyers
Figure 13 Threat of New Entrants
Figure 14 Threat of Substitutes
Figure 15 Competitive Rivalry
Figure 16 CART Therapy Market: PEST Analysis
Figure 17 Car-T Therapy Market Forecast By Indication 2022, 2027, 2032 (Revenue, CAGR%)
Figure 18 Car-T Therapy Market Forecast By Indication, 2022-2032 (US$ billion)
Figure 19 Car-T Therapy Market Share Forecast By Indication, 2022, 2027, 2032 (%)
Figure 20 DLBCL Market Forecast by Region, 2022-2032 (US$ billion)
Figure 21 DLBCL Market Share Forecast by Region, 2022 & 2032 (%)
Figure 22 ALL Market Forecast by Region, 2022-2032 (US$ billion)
Figure 23 ALL Market Share Forecast by Region, 2022 & 2032 (%)
Figure 24 Follicular Lymphoma Market Forecast by Region, 2022-2032 (US$ billion)
Figure 25 Follicular Lymphoma Market Share Forecast by Region, 2022 & 2032 (%)
Figure 26 Multiple Myeloma (MM) Market Forecast by Region, 2022-2032 (US$ billion)
Figure 27 Multiple Myeloma (MM) Market Share Forecast by Region, 2022 & 2032 (%)
Figure 28 Others Market Forecast by Region, 2022-2032 (US$ billion)
Figure 29 Others Market Share Forecast by Region, 2022 & 2032 (%)
Figure 30 Car-T Therapy Market Attractiveness Index by Type
Figure 31 Car-T Therapy Market Forecast By Type, 2022-2032 (US$ billion)
Figure 32 Car-T Therapy Market Share Forecast By Type, 2022, 2027, 2032 (%)
Figure 33 Abecma Market Forecast, 2022-2032 (US$ billion)
Figure 34 Yescarta Market Forecast, 2022-2032 (US$ billion)
Figure 35 Kymriah Market Forecast, 2022-2032 (US$ billion)
Figure 36 Tecartus Market Forecast, 2022-2032 (US$ billion)
Figure 37 Others Market Forecast, 2022-2032 (US$ billion)
Figure 38 Car-T Therapy Market Attractiveness Index by Target Antigens
Figure 39 Car-T Therapy Market Forecast By Target Antigens, 2022-2032 (US$ billion)
Figure 40 Car-T Therapy Market Share Forecast By Target Antigens, 2022, 2027, 2032 (%)
Figure 41 CD19/CD22 Market Forecast by Region, 2022-2032 (US$ billion)
Figure 42 CD19/CD22 Market Share Forecast by Region, 2022 & 2032 (%)
Figure 43 BCMA Market Forecast by Region, 2022-2032 (US$ billion)
Figure 44 BCMA Market Share Forecast by Region, 2022 & 2032 (%)
Figure 45 Others Market Forecast by Region, 2022-2032 (US$ billion)
Figure 46 Others Market Share Forecast by Region, 2022 & 2032 (%)
Figure 47 Car-T Therapy Market Attractiveness Index by Patient
Figure 48 Car-T Therapy Market Forecast By Patient, 2022-2032 (US$ billion)
Figure 49 Car-T Therapy Market Share Forecast By Patient, 2022, 2027, 2032 (%)
Figure 50 Children Market Forecast by Region, 2022-2032 (US$ billion)
Figure 51 Children Market Share Forecast by Region, 2022 & 2032 (%)
Figure 52 Adults Market Forecast by Region, 2022-2032 (US$ billion)
Figure 53 Adults Market Share Forecast by Region, 2022 & 2032 (%)
Figure 54 Seniors Market Forecast by Region, 2022-2032 (US$ billion)
Figure 55 Seniors Market Share Forecast by Region, 2022 & 2032 (%)
Figure 56 Car-T Therapy Market Attractiveness Index by End-users
Figure 57 Car-T Therapy Market Forecast By End-users, 2022-2032 (US$ billion)
Figure 58 Car-T Therapy Market Share Forecast By End-users, 2022, 2027, 2032 (%)
Figure 59 Hospitals Market Forecast by Region, 2022-2032 (US$ billion)
Figure 60 Hospitals Market Share Forecast by Region, 2022 & 2032 (%)
Figure 61 Specialty Clinics Market Forecast by Region, 2022-2032 (US$ billion)
Figure 62 Specialty Clinics Market Share Forecast by Region, 2022 & 2032 (%)
Figure 63 Other End-user Market Forecast by Region, 2022-2032 (US$ billion)
Figure 64 Other End-user Market Share Forecast by Region, 2022 & 2032 (%)
Figure 65 Car-T Therapy Market Forecast by Region 2022 - 2032 (Revenue, CAGR%)
Figure 66 Car-T Therapy Market Share Forecast by Region 2022, 2027, 2032(%)
Figure 67 Car-T Therapy Market by Region, 2022-2032 (US$ bn, AGR (%), CAGR (%))
Figure 68 North America Car-T Therapy Market Attractiveness Index
Figure 69 North America Car-T Therapy Market by Region, 2022, 2027 & 2032 (US$ billion)
Figure 70 North America Car-T Therapy Market Forecast by Country, 2022-2032 (US$ billion)
Figure 71 North America Car-T Therapy Market Share Forecast by Country, 2022 & 2032 (%)
Figure 72 North America Car-T Therapy Market Forecast By Indication, 2022-2032 (US$ billion)
Figure 73 North America Car-T Therapy Market Share Forecast By Indication, 2022 & 2032 (%)
Figure 74 North America Car-T Therapy Market Forecast by Target Antigens, 2022-2032 (US$ million)
Figure 75 North America Car-T Therapy Market Share Forecast by Target Antigens, 2022 & 2032 (%)
Figure 76 North America Car-T Therapy Market Forecast by Patients, 2022-2032 (US$ billion)
Figure 77 North America Car-T Therapy Market Share Forecast by Patients, 2022 & 2032 (%)
Figure 78 North America Car-T Therapy Market Forecast by End Users, 2022-2032 (US$ billion)
Figure 79 North America Car-T Therapy Market Share Forecast by End Users, 2022 & 2032 (%)
Figure 80 U.S. Car-T Therapy Market Forecast, 2022-2032 (US$ billion, AGR %)
Figure 81 Canada Car-T Therapy Market Forecast, 2022-2032 (US$ billion, AGR %)
Figure 82 Europe Car-T Therapy Market Attractiveness Index
Figure 83 Europe Car-T Therapy Market by Country, 2022, 2027 & 2032 (US$ billion)
Figure 84 Europe Car-T Therapy Market Forecast by Country, 2022-2032 (US$ billion)
Figure 85 Europe Car-T Therapy Market Share Forecast by Country, 2022 & 2032 (%)
Figure 86 Europe Car-T Therapy Market Forecast By Indication, 2022-2032 (US$ billion)
Figure 87 Europe Car-T Therapy Market Share Forecast By Indication, 2022 & 2032 (%)
Figure 88 Europe Car-T Therapy Market Forecast by Target Antigens, 2022-2032 (US$ billion)
Figure 89 Europe Car-T Therapy Market Share Forecast by Target Antigens, 2022 & 2032 (%)
Figure 90 Europe Car-T Therapy Market Forecast by Patients, 2022-2032 (US$ billion)
Figure 91 Europe Car-T Therapy Market Share Forecast by Patients, 2022 & 2032 (%)
Figure 92 Europe Car-T Therapy Market Forecast by End-users, 2022-2032 (US$ billion)
Figure 93 Europe Car-T Therapy Market Share Forecast by End-users, 2022 & 2032 (%)
Figure 94 Germany Car-T Therapy Market Forecast, 2022-2032 (US$ billion, AGR %)
Figure 95 UK Car-T Therapy Market Forecast, 2022-2032 (US$ billion, AGR %)
Figure 96 France Car-T Therapy Market Forecast, 2022-2032 (US$ billion, AGR %)
Figure 97 Italy Car-T Therapy Market Forecast, 2022-2032 (US$ billion, AGR %)
Figure 98 Spain Car-T Therapy Market Forecast, 2022-2032 (US$ billion, AGR %)
Figure 99 Netherlands Car-T Therapy Market Forecast, 2022-2032 (US$ billion, AGR %)
Figure 100 Rest of Europe Car-T Therapy Market Forecast, 2022-2032 (US$ billion, AGR %)
Figure 101 Asia Pacific Car-T Therapy Market Attractiveness Index
Figure 102 Asia Pacific Car-T Therapy Market by Country, 2022, 2027 & 2032 (US$ billion)
Figure 103 Asia Pacific Car-T Therapy Market Forecast by Country, 2022-2032 (US$ billion)
Figure 104 Asia Pacific Car-T Therapy Market Share Forecast by Country, 2022 & 2032 (%)
Figure 105 Asia Pacific Car-T Therapy Market Forecast By Indication, 2022-2032 (US$ billion)
Figure 106 Asia Pacific Car-T Therapy Market Share Forecast By Indication, 2022 & 2032 (%)
Figure 107 Asia Pacific Car-T Therapy Market Forecast by Target Antigens, 2022-2032 (US$ billion)
Figure 108 Asia Pacific Car-T Therapy Market Share Forecast by Target Antigens, 2022 & 2032 (%)
Figure 109 Asia Pacific Car-T Therapy Market Forecast by Patients, 2022-2032 (US$ billion)
Figure 110 Asia Pacific Car-T Therapy Market Share Forecast by Patients, 2022 & 2032 (%)
Figure 111 Asia Pacific Car-T Therapy Market Forecast by End-users, 2022-2032 (US$ billion)
Figure 112 Asia Pacific Car-T Therapy Market Share Forecast by End-users, 2022 & 2032 (%)
Figure 113 Japan Car-T Therapy Market Forecast, 2022-2032 (US$ billion, AGR %)
Figure 114 China Car-T Therapy Market Forecast, 2022-2032 (US$ billion, AGR %)
Figure 115 India Car-T Therapy Market Forecast, 2022-2032 (US$ billion, AGR %)
Figure 116 Australia Car-T Therapy Market Forecast, 2022-2032 (US$ billion, AGR %)
Figure 117 South Korea Car-T Therapy Market Forecast, 2022-2032 (US$ billion, AGR %)
Figure 118 Rest of Asia Pacific Car-T Therapy Market Forecast, 2022-2032 (US$ billion, AGR %)
Figure 119 Latin America Car-T Therapy Market Forecast By Indication, 2022-2032 (US$ billion)
Figure 120 Latin America Car-T Therapy Market Share Forecast By Indication, 2022 & 2032 (%)
Figure 121 Latin America Car-T Therapy Market Forecast by Target Antigens, 2022-2032 (US$ billion)
Figure 122 Latin America Car-T Therapy Market Share Forecast by Target Antigens, 2022 & 2032 (%)
Figure 123 Latin America Car-T Therapy Market Forecast by Patients, 2022-2032 (US$ billion)
Figure 124 Latin America Car-T Therapy Market Share Forecast by Patients, 2022 & 2032 (%)
Figure 125 Latin America Car-T Therapy Market Forecast by End-users, 2022-2032 (US$ billion)
Figure 126 Latin America Car-T Therapy Market Share Forecast by End-users, 2022 & 2032 (%)
Figure 127 MEA Car-T Therapy Market Forecast By Indication, 2022-2032 (US$ billion)
Figure 128 MEA Car-T Therapy Market Share Forecast By Indication, 2022 & 2032 (%)
Figure 129 MEA Car-T Therapy Market Forecast by Target Antigens, 2022-2032 (US$ billion)
Figure 130 MEA Car-T Therapy Market Share Forecast by Target Antigens, 2022 & 2032 (%)
Figure 131 MEA Car-T Therapy Market Forecast by Patient, 2022-2032 (US$ billion)
Figure 132 MEA Car-T Therapy Market Share Forecast by Patient, 2022 & 2032 (%)
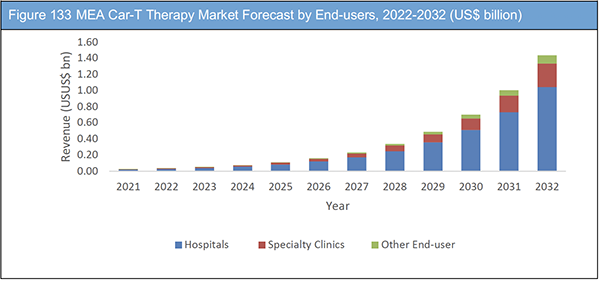
Figure 133 MEA Car-T Therapy Market Forecast by End-users, 2022-2032 (US$ billion)
Figure 134 MEA Car-T Therapy Market Share Forecast by End-users, 2022 & 2032 (%)
Figure 135 Car-T Therapy Market: Company Share/Ranking, 2021
Figure 136 Novartis AG: Net Revenue, 2017-2021 (US$ million, AGR%)
Figure 137 Novartis AG: R&D, 2017-2021 (US$ million, AGR%)
Figure 138 Novartis AG: Regional Market Shares, 2021
Figure 139 Gilead Science, Inc.: Net Revenue, 2017-2021 (US$ million, AGR%)
Figure 140 Gilead Science, Inc.: R&D, 2017-2021 (US$ million, AGR%)
Figure 141 Gilead Science, Inc.: Regional Market Shares, 2021
Figure 142 Bristol-Myers Squibb Company: Net Revenue, 2017-2021 (US$ million, AGR%)
Figure 143 Bristol-Myers Squibb Company: R&D, 2017-2021 (US$ million, AGR%)
Figure 144 Bristol-Myers Squibb Company: Regional Market Shares, 2021
Figure 145 Johnson & Johnson Private Limited: Net Revenue, 2017-2021 (US$ million, AGR%)
Figure 146 Johnson & Johnson Private Limited: R&D, 2017-2021 (US$ million, AGR%)
Figure 147 Johnson & Johnson Private Limited: Regional Market Shares, 2021
Figure 148 bluebird bio, Inc.: Net Revenue, 2017-2021 (US$ million, AGR%)
Figure 149 bluebird bio, Inc.: R&D, 2017-2021 (US$ million, AGR%)
Figure 150 GSK plc: Net Revenue, 2017-2021 (US$ million, AGR%)
Figure 151 GSK plc: R&D, 2017-2021 (US$ million, AGR%)
Figure 152 GSK plc: Regional Market Shares, 2021
Figure 153 Caribou Biosciences Inc: Net Revenue, 2019-2021 (US$ million, AGR%)
Figure 154 Caribou Biosciences Inc: R&D, 2019-2021 (US$ million, AGR%)
Figure 155 Caribou Biosciences Inc: Regional Market Shares, 2021
Figure 156 Amgen Inc.: Net Revenue, 2017-2021 (US$ million, AGR%)
Figure 157 Amgen Inc.: R&D, 2017-2021 (US$ million, AGR%)
Figure 158 Amgen Inc.: Regional Market Shares, 2021
Figure 159 AbbVie Inc.: Net Revenue, 2017-2021 (US$ million, AGR%)
Figure 160 AbbVie Inc.: R&D, 2017-2021 (US$ million, AGR%)
Figure 161 AbbVie Inc.: Regional Market Shares, 2021
Figure 162 BioNTech SE: Net Revenue, 2017-2021 (US$ million, AGR%)
Figure 163 BioNTech SE: R&D, 2017-2021 (US$ million, AGR%)
ページTOPに戻る
Summary
この調査レポートは世界のCAR-T療法市場を調査し、適応症別、タイプ別、標的抗原別、患者別、エンドユーザー別、地域別に2022年から2032年までの予測結果を掲載しています。また関連企業情報を提供しています。
主な掲載内容(目次より抜粋)
-
レポート概要
-
エグゼクティブサマリー
-
市場概要
-
CAR-T療法市場分析:適応症別
-
CAR-T療法市場分析:タイプ別
-
CAR-T療法市場分析:標的抗原別
-
CAR-T療法市場分析:患者別
-
CAR-T療法市場分析:エンドユーザー別
-
CAR-T療法市場分析:地域別
-
北米のCAR-T療法市場分析
-
欧州のCAR-T療法市場分析
-
アジア太平洋地域のCAR-T療法市場分析
-
ラテンアメリカのCAR-T療法市場分析
-
MEAのCAR-T療法市場分析
-
主要企業のプロフィール
Report Details
The CAR-T Therapy Market Report 2022-2032: This report will prove invaluable to leading firms striving for new revenue pockets if they wish to better understand the industry and its underlying dynamics. It will be useful for companies that would like to expand into different industries or to expand their existing operations in a new region.
Factors Such As Increase in Funding From Venture Capitalist And Government Institutes And Increase In Global Burden of Cancer Benefits Are Driving the Market Growth
Some of the major forces propelling the CAR-T Therapy market include increase in funding from venture capitalist and government institutes and increase in global burden of cancer benefits. As per the data published by the WHO, cancer is a leading cause of death globally and caused almost 10 million deaths in 2020.
Based on current and projected population aging and growth, the American Cancer Society, Inc., predicts that the burden of cancer will increase to an estimated 29.4 million cases globally by 2040. China, with the largest population size worldwide has the highest global proportion of cancer new cases and deaths followed by Northern America in terms of new cases and fourth by cancer deaths. Increase in consumption of tobacco & alcohol, unhealthy diet, physical inactivity, and air pollution in various countries across the globe might further increase the cancer burden in future. In the past five years around US$12 billion have been invested by venture capital (VC) firms around the globe, an additional of US$2.2 billion of funding is raised through strategic partnerships between various institutes and biopharma companies.
Reimbursement Challenges and Side-effects of CAR-T Therapy
Reimbursement of CAR-T cell therapies has been a challenge to the healthcare providers, insurers and national & regional government agencies worldwide. CAR-T cell is amongst the most expensive drugs on the market with a price tag of around US$450,000 to US$500,000 per patient. Moreover, patient opting for CAR-T cell often have aggressive deceases resulting in rapid deterioration of health and thus any delays in payer approval can affect patient eligibility for CAR-T cell. Like every other cancer treatment, CAR-T cell therapy also poses severe side effects. Some of the most common occurring side effects are the cytokine release syndrome (CRS) and neurological effects.
What Questions Should You Ask before Buying a Market Research Report?
• How is the CAR-T Therapy market evolving?
• What is driving and restraining the CAR-T Therapy market?
• How will each CAR-T Therapy submarket segment grow over the forecast period and how much revenue will these submarkets account for in 2032?
• How will the market shares for each CAR-T Therapy submarket develop from 2022 to 2032?
• What will be the main driver for the overall market from 2022 to 2032?
• Will leading CAR-T Therapy markets broadly follow the macroeconomic dynamics, or will individual national markets outperform others?
• How will the market shares of the national markets change by 2032 and which geographical region will lead the market in 2032?
• Who are the leading players and what are their prospects over the forecast period?
• What are the CAR-T Therapy projects for these leading companies?
• How will the industry evolve during the period between 2022 and 2032? What are the implications of CAR-T Therapy projects taking place now and over the next 10 years?
• Is there a greater need for product commercialisation to further scale the CAR-T Therapy market?
• Where is the CAR-T Therapy market heading and how can you ensure you are at the forefront of the market?
• What are the best investment options for new product and service lines?
• What are the key prospects for moving companies into a new growth path and C-suite?
You need to discover how this will impact the CAR-T Therapy market today, and over the next 10 years:
• Our 251-page report provides 99 tables and 149 charts/graphs exclusively to you.
• The report highlights key lucrative areas in the industry so you can target them – NOW.
• It contains in-depth analysis of global, regional and national sales and growth.
• It highlights for you the key successful trends, changes and revenue projections made by your competitors.
This report tells you TODAY how the CAR-T Therapy market will develop in the next 10 years, and in line with the variations in COVID-19 economic recession and bounce. This market is more critical now than at any point over the last 10 years.
Forecasts to 2032 and other analyses reveal commercial prospects
• In addition to revenue forecasting to 2032, our new study provides you with recent results, growth rates, and market shares.
• You will find original analyses, with business outlooks and developments.
• Discover qualitative analyses (including market dynamics, drivers, opportunities, restraints and challenges), cost structure, impact of rising CAR-T Therapy prices and recent developments.
This report includes data analysis and invaluable insight into how COVID-19 will affect the industry and your company. Four COVID-19 recovery patterns and their impact, namely, “V”, “L”, “W” and “U” are discussed in this report.
Segments Covered in the Report
Indication
• Diffuse Large B-Cell Lymphoma (DLBCL)
• Acute Lymphoblastic Leukemia (ALL)
• Follicular Lymphoma
• Multiple Myeloma (MM)
• Others
Type
• Abecma
• Yescarta
• Kymriah
• Tecartus
• Other
Target Antigens
• CD19/CD22
• BCMA (B-cell maturation antigen)
• Others
Patient
• Children
• Adults
• Seniors
End User
• Hospitals
• Specialty Clinics
• Other End User
In addition to the revenue predictions for the overall world market and segments, you will also find revenue forecasts for five regional and 10 leading national markets:
North America
• U.S.
• Canada
Europe
• Germany
• UK
• France
• Spain
• Italy
• Rest of Europe
Asia Pacific
• China
• Japan
• India
• Australia
• South Korea
• Rest of Asia Pacific
Latin America
MEA
The report also includes profiles and for some of the leading companies in the CAR-T Therapy Market, 2022 to 2032, with a focus on this segment of these companies’ operations.
Leading companies and the potential for market growth
• AbbVie Inc.
• Amgen Inc.
• BioNTech SE
• bluebird bio, Inc.
• Bristol-Myers Squibb Company
• Caribou Biosciences Inc.
• Gilead Sciences Inc.
• GSK plc
• Johnson & Johnson Private Limited
• Novartis AG
Overall world revenue for CAR-T Therapy Market, 2022 to 2032 in terms of value the market will surpass US$2.8 billion in 2022, our work calculates. We predict strong revenue growth through to 2032. Our work identifies which organizations hold the greatest potential. Discover their capabilities, progress, and commercial prospects, helping you stay ahead.
How will the CAR-T Therapy Market, 2022 to 2032 report help you?
In summary, our 250+ page report provides you with the following knowledge:
• Revenue forecasts to 2032 for CAR-T Therapy Market, 2022 to 2032 Market, with forecasts for indication, type, target antigens, patient, and end-users, each forecast at a global and regional level – discover the industry’s prospects, finding the most lucrative places for investments and revenues.
• Revenue forecasts to 2032 for five regional and 12 key national markets – See forecasts for the CAR-T Therapy Market, 2022 to 2032 market in North America, Europe, Asia-Pacific, Latin America, and MEA. Also forecasted is the market in the US, Canada, Germany, France, UK, Italy, Netherlands, China, India, Japan, South Korea, and Australia among other prominent economies.
• Prospects for established firms and those seeking to enter the market – including company profiles for 10 of the major companies involved in the CAR-T Therapy Market, 2022 to 2032.
Find quantitative and qualitative analyses with independent predictions. Receive information that only our report contains, staying informed with invaluable business intelligence.
Information found nowhere else
With our new report, you are less likely to fall behind in knowledge or miss out on opportunities. See how our work could benefit your research, analyses, and decisions. Visiongain’s study is for everybody needing commercial analyses for the CAR-T Therapy Market, 2022 to 2032, market-leading companies. You will find data, trends and predictions.
ページTOPに戻る
Table of Contents
Table of Contents
1. Report Overview
1.1 Objectives of the Study
1.2 Introduction to CAR-T Therapy Market
1.3 What This Report Delivers
1.4 Why You Should Read This Report
1.5 Key Questions Answered by This Analytical Report
1.6 Who is This Report for?
1.7 Methodology
1.7.1 Market Definitions
1.7.2 Market Evaluation & Forecasting Methodology
1.7.3 Data Validation
1.7.3.1 Primary Research
1.7.3.2 Secondary Research
1.8 Frequently Asked Questions (FAQs)
1.9 Associated Visiongain Reports
1.10 About Visiongain
2 Executive Summary
3 Market Overview
3.1 Key Findings
3.2 Market Dynamics
3.2.1 Market Driving Factors
3.2.1.1 Increasing Global Burden of Cancer Boosting Demand for CAR T Cell
3.2.1.2 Increase in Funding from Venture Capitalist and Government Institutes
3.2.1.3 Expanding Clinical Research Infrastructure in China
3.2.2 Market Restraining Factors
3.2.2.1 Complex Manufacturing and Supply Chain
3.2.2.2 Reimbursement Challenges for CAR-T cell
3.2.2.3 Side Effects of CAR-T cell Therapy
3.2.3 Market Opportunities
3.2.3.1 Growing Use of AI in CAR-T Cell Manufacturing
3.2.3.2 Engineering Controllable CAR-T Cells
3.3 COVID-19 Impact Analysis
3.4 Porter’s Five Forces Analysis
3.4.1 Bargaining Power of Suppliers
3.4.2 Bargaining Power of Buyers
3.4.3 Threat of New Entrants
3.4.4 Threat of Substitutes
3.4.5 Competitive Rivalry
3.5 PEST Analysis
3.5.1 Political
3.5.2 Economic
3.5.3 Social
3.5.4 Technological
4 Car-T Therapy Market Analysis By Indication
4.1 Key Findings
4.2 Indication Segment: Market Attractiveness Index
4.3 Car-T Therapy Market Size Estimation and Forecast by Indication
4.4 Diffuse Large B-Cell Lymphoma (DLBCL)
4.4.1 Market Size by Region, 2022-2032 (US$ bn)
4.4.2 Market Share by Region, 2022 & 2032 (%)
4.5 Acute Lymphoblastic Leukaemia (ALL)
4.5.1 Market Size by Region, 2022-2032 (US$ bn)
4.5.2 Market Share by Region, 2022 & 2032 (%)
4.6 Follicular Lymphoma
4.6.1 Market Size by Region, 2022-2032 (US$ bn)
4.6.2 Market Share by Region, 2022 & 2032 (%)
4.7 Multiple Myeloma (MM)
4.7.1 Market Size by Region, 2022-2032 (US$ bn)
4.7.2 Market Share by Region, 2022 & 2032 (%)
4.8 Others
4.8.1 Market Size by Region, 2022-2032 (US$ bn)
4.8.2 Market Share by Region, 2022 & 2032 (%)
5 Car-T Therapy Market Analysis By Type
5.1 Key Findings
5.2 Type Segment: Market Attractiveness Index
5.3 Car-T Therapy Market Size Estimation and Forecast By Type
5.4 Abecma
5.4.1 Abecma Market Size, 2022-2032 (US$ bn)
5.5 Yescarta
5.5.1 Yescarta Market Size, 2022-2032 (US$ bn)
5.6 Kymriah
5.6.1 Kymriah Market Size, 2022-2032 (US$ bn)
5.7 Tecartus
5.7.1 Tecartus Market Size, 2022-2032 (US$ bn)
5.8 Others
5.8.1 Others Market Size, 2022-2032 (US$ bn)
6 Car-T Therapy Market Analysis By Target Antigens
6.1 Key Findings
6.2 Target Antigens Segment: Market Attractiveness Index
6.3 Car-T Therapy Market Size Estimation and Forecast By Target Antigens
6.4 CD19/CD22
6.4.1 Market Size by Region, 2022-2032 (US$ bn)
6.4.2 Market Share by Region, 2022 & 2032 (%)
6.5 BCMA (B-cell maturation antigen)
6.5.1 Market Size by Region, 2022-2032 (US$ bn)
6.5.2 Market Share by Region, 2022 & 2032 (%)
6.6 Others
6.6.1 Market Size by Region, 2022-2032 (US$ bn)
6.6.2 Market Share by Region, 2022 & 2032 (%)
7 Car-T Therapy Market Analysis By Patient
7.1 Key Findings
7.2 Patient Segment: Market Attractiveness Index
7.3 Car-T Therapy Market Size Estimation and Forecast By Patient
7.4 Children
7.4.1 Market Size by Region, 2022-2032 (US$ bn)
7.4.2 Market Share by Region, 2022 & 2032 (%)
7.5 Adults
7.5.1 Market Size by Region, 2022-2032 (US$ bn)
7.5.2 Market Share by Region, 2022 & 2032 (%)
7.6 Seniors
7.6.1 Market Size by Region, 2022-2032 (US$ bn)
7.6.2 Market Share by Region, 2022 & 2032 (%)
8 Car-T Therapy Market Analysis By End-users
8.1 Key Findings
8.2 End User Segment: Market Attractiveness Index
8.3 Car-T Therapy Market Size Estimation and Forecast By End-users
8.4 Hospitals
8.4.1 Market Size by Region, 2022-2032 (US$ bn)
8.4.2 Market Share by Region, 2022 & 2032 (%)
8.5 Specialty Clinics
8.5.1 Market Size by Region, 2022-2032 (US$ bn)
8.5.2 Market Share by Region, 2022 & 2032 (%)
8.6 Other End-user
8.6.1 Market Size by Region, 2022-2032 (US$ bn)
8.6.2 Market Share by Region, 2022 & 2032 (%)
9 Car-T Therapy Market Analysis by Region
9.1 Key Findings
9.2 Regional Market Size Estimation and Forecast
10 North America Car-T Therapy Market Analysis
10.1 Key Findings
10.2 North America Car-T Therapy Market Attractiveness Index
10.3 North America Car-T Therapy Market by Country, 2022, 2027 & 2032 (US$ bn)
10.4 North America Car-T Therapy Market Size Estimation and Forecast by Country
10.5 North America Car-T Therapy Market Size Estimation and Forecast by Indication
10.6 North America Car-T Therapy Market Size Estimation and Forecast by Target Antigens
10.7 North America Car-T Therapy Market Size Estimation and Forecast by Patients
10.8 North America Car-T Therapy Market Size Estimation and Forecast by End Users
10.9 U.S. Car-T Therapy Market Analysis
10.10 Canada Car-T Therapy Market Analysis
11 Europe Car-T Therapy Market Analysis
11.1 Key Findings
11.2 Europe Car-T Therapy Market Attractiveness Index
11.3 Europe Car-T Therapy Market by Country, 2022, 2027 & 2032 (US$ bn)
11.4 Europe Car-T Therapy Market Size Estimation and Forecast by Country
11.5 Europe Car-T Therapy Market Size Estimation and Forecast By Indication
11.6 Europe Car-T Therapy Market Size Estimation and Forecast by Target Antigens
11.7 Europe Car-T Therapy Market Size Estimation and Forecast by Patients
11.8 Europe Car-T Therapy Market Size Estimation and Forecast by End-users
11.9 Germany Car-T Therapy Market Analysis
11.10 UK Car-T Therapy Market Analysis
11.11 France Car-T Therapy Market Analysis
11.12 Italy Car-T Therapy Market Analysis
11.13 Spain Car-T Therapy Market Analysis
11.14 Netherlands Car-T Therapy Market Analysis
11.15 Rest of Europe Car-T Therapy Market Analysis
12 Asia Pacific Car-T Therapy Market Analysis
12.1 Key Findings
12.2 Asia Pacific Car-T Therapy Market Attractiveness Index
12.3 Asia Pacific Car-T Therapy Market by Country, 2022, 2027 & 2032 (US$ bn)
12.4 Asia Pacific Car-T Therapy Market Size Estimation and Forecast by Country
12.5 Asia Pacific Car-T Therapy Market Size Estimation and Forecast By Indication
12.6 Asia Pacific Car-T Therapy Market Size Estimation and Forecast by Target Antigens
12.7 Asia Pacific Car-T Therapy Market Size Estimation and Forecast by Patients
12.8 Asia Pacific Car-T Therapy Market Size Estimation and Forecast by End-users
12.9 Japan Car-T Therapy Market Analysis
12.10 China Car-T Therapy Market Analysis
12.11 India Car-T Therapy Market Analysis
12.12 Australia Car-T Therapy Market Analysis
12.13 South Korea Car-T Therapy Market Analysis
12.14 Rest of Asia Pacific Car-T Therapy Market Analysis
13 Latin America Car-T Therapy Market Analysis
13.1 Key Findings
13.2 Latin America Car-T Therapy Market Size Estimation and Forecast By Indication
13.3 Latin America Car-T Therapy Market Size Estimation and Forecast by Target Antigens
13.4 Latin America Car-T Therapy Market Size Estimation and Forecast by Patients
13.5 Latin America Car-T Therapy Market Size Estimation and Forecast by End-users
13.6 Brazil Car-T Therapy Market Analysis
13.7 Mexico Car-T Therapy Market Analysis
13.8 Rest of Latin America Car-T Therapy Market Analysis
14 MEA Car-T Therapy Market Analysis
14.1 Key Findings
14.2 MEA Car-T Therapy Market Size Estimation and Forecast By Indication
14.3 MEA Car-T Therapy Market Size Estimation and Forecast by Target Antigens
14.4 MEA Car-T Therapy Market Size Estimation and Forecast by Patient
14.5 MEA Car-T Therapy Market Size Estimation and Forecast by End-users
14.6 GCC Car-T Therapy Market Analysis
14.7 Rest of Middle East and Africa Car-T Therapy Market Analysis
15 Company Profiles
15.1 Competitive Landscape, 2021
15.2 Strategic Outlook
15.3 Novartis AG
15.3.1 Company Snapshot
15.3.2 Company Overview
15.3.3 Financial Analysis
15.3.3.1 Net Revenue, 2017-2021
15.3.3.2 R&D, 2017-2021
15.3.3.3 Regional Market Shares, 2021
15.3.4 Product Benchmarking
15.3.5 Strategic Outlook
15.4 Gilead Sciences, Inc.
15.4.1 Company Snapshot
15.4.2 Company Overview
15.4.3 Financial Analysis
15.4.3.1 Net Revenue, 2017-2021
15.4.3.2 R&D, 2017-2021
15.4.3.3 Regional Market Shares, 2021
15.4.4 Product Benchmarking
15.4.5 Strategic Outlook
15.5 Bristol-Myers Squibb Company
15.5.1 Company Snapshot
15.5.2 Company Overview
15.5.3 Financial Analysis
15.5.3.1 Net Revenue, 2017-2021
15.5.3.2 R&D, 2017-2021
15.5.3.3 Regional Market Shares, 2021
15.5.4 Product Benchmarking
15.5.5 Strategic Outlook
15.6 Johnson & Johnson Private Limited
15.6.1 Company Snapshot
15.6.2 Company Overview
15.6.3 Financial Analysis
15.6.3.1 Net Revenue, 2017-2021
15.6.3.2 R&D, 2017-2021
15.6.3.3 Regional Market Shares, 2021
15.6.4 Product Benchmarking
15.6.5 Strategic Outlook
15.7 bluebird bio, Inc.
15.7.1 Company Snapshot
15.7.2 Company Overview
15.7.3 Financial Analysis
15.7.3.1 Net Revenue, 2017-2021
15.7.3.2 R&D, 2017-2021
15.7.4 Product Benchmarking
15.7.5 Strategic Outlook
15.8 GSK plc
15.8.1 Company Snapshot
15.8.2 Company Overview
15.8.3 Financial Analysis
15.8.3.1 Net Revenue, 2017-2021
15.8.3.2 R&D, 2017-2021
15.8.3.3 Regional Market Shares, 2021
15.8.4 Product Benchmarking
15.8.5 Strategic Outlook
15.9 Caribou Biosciences Inc
15.9.1 Company Snapshot
15.9.2 Company Overview
15.9.3 Financial Analysis
15.9.3.1 Net Revenue, 2019-2021
15.9.3.2 R&D, 2019-2021
15.9.3.3 Regional Market Shares, 2021
15.9.4 Product Benchmarking
15.9.5 Strategic Outlook
15.10 Amgen Inc.
15.10.1 Company Snapshot
15.10.2 Company Overview
15.10.3 Financial Analysis
15.10.3.1 Net Revenue, 2017-2021
15.10.3.2 R&D, 2017-2021
15.10.3.3 Regional Market Shares, 2021
15.10.4 Product Benchmarking
15.10.5 Strategic Outlook
15.11 AbbVie Inc.
15.11.1 Company Snapshot
15.11.2 Company Overview
15.11.3 Financial Analysis
15.11.3.1 Net Revenue, 2017-2021
15.11.3.2 R&D, 2017-2021
15.11.3.3 Regional Market Shares, 2021
15.11.4 Product Benchmarking
15.11.5 Strategic Outlook
15.12 BioNTech SE
15.12.1 Company Snapshot
15.12.2 Company Overview
15.12.3 Financial Analysis
15.12.3.1 Net Revenue, 2017-2021
15.12.3.2 R&D, 2017-2021
15.12.4 Product Benchmarking
15.12.5 Strategic Outlook
16 Conclusion and Recommendations
16.1 Concluding Remarks from Visiongain
16.2 Recommendations for Market Players
List of Tables
Table 1 CAR-T Therapy Market Snapshot, 2022 & 2032 (US$ billion, CAGR %)
Table 2 Car-T Therapy Market by Region, 2022-2032 (US$ bn, AGR (%), CAGR(%)): “V” Shaped Recovery Scenario
Table 3 Car-T Therapy Market by Region, 2022-2032 (US$ bn, AGR (%), CAGR(%)): “U” Shaped Recovery Scenario
Table 4 Car-T Therapy Market by Region, 2022-2032 (US$ bn, AGR (%), CAGR(%)): “W” Shaped Recovery Scenario
Table 5 Car-T Therapy Market by Region, 2022-2032 (US$ bn, AGR (%), CAGR(%)): “L” Shaped Recovery Scenario
Table 6 Car-T Therapy Market Forecast By Indication, 2022-2032 (US$ Bn, AGR%, CAGR%)
Table 7 DLBCL Market Forecast by Region, 2022-2032 (US$ bn, AGR%, CAGR%)
Table 8 ALL Market Forecast by Region, 2022-2032 (US$ bn, AGR%, CAGR%)
Table 9 Follicular Lymphoma Market Forecast by Region, 2022-2032 (US$ bn, AGR%, CAGR%)
Table 10 Multiple Myeloma (MM) Market Forecast by Region, 2022-2032 (US$ bn, AGR%, CAGR%)
Table 11 Others Market Forecast by Region, 2022-2032 (US$ bn, AGR%, CAGR%)
Table 12 Car-T Therapy Market Forecast By Type, 2022-2032 (US$ bn, AGR%, CAGR%)
Table 13 Abecma Market Forecast, 2022-2032 (US$ bn, AGR%, CAGR%)
Table 14 Yescarta Market Forecast, 2022-2032 (US$ bn, AGR%, CAGR%)
Table 15 Kymriah Market Forecast, 2022-2032 (US$ bn, AGR%, CAGR%)
Table 16 Tecartus Market Forecast, 2022-2032 (US$ bn, AGR%, CAGR%)
Table 17 Others Market Forecast, 2022-2032 (US$ bn, AGR%, CAGR%)
Table 18 Car-T Therapy Market Forecast By Target Antigens, 2022-2032 (US$ bn, AGR%, CAGR%)
Table 19 CD19/CD22 Market Forecast by Region, 2022-2032 (US$ bn, AGR%, CAGR%)
Table 20 BCMA Market Forecast by Region, 2022-2032 (US$ bn, AGR%, CAGR%)
Table 21 Others Market Forecast by Region, 2022-2032 (US$ bn, AGR%, CAGR%)
Table 22 Car-T Therapy Market Forecast By Patient, 2022-2032 (US$ bn, AGR%, CAGR%)
Table 23 Children Market Forecast by Region, 2022-2032 (US$ bn, AGR%, CAGR%)
Table 24 Adults Market Forecast by Region, 2022-2032 (US$ bn, AGR%, CAGR%)
Table 25 Seniors Market Forecast by Region, 2022-2032 (US$ bn, AGR%, CAGR%)
Table 26 Car-T Therapy Market Forecast By End-users, 2022-2032 (US$ bn, AGR%, CAGR%)
Table 27 Hospitals Market Forecast by Region, 2022-2032 (US$ bn, AGR%, CAGR%)
Table 28 Specialty Clinics Market Forecast by Region, 2022-2032 (US$ bn, AGR%, CAGR%)
Table 29 Other End-user Market Forecast by Region, 2022-2032 (US$ bn, AGR%, CAGR%)
Table 30 Car-T Therapy Market by Region, 2022-2032 (US$ bn, AGR (%), CAGR(%))
Table 31 North America Car-T Therapy Market Forecast by Country, 2022-2032 (US$ bn, AGR%, CAGR%)
Table 32 North America Car-T Therapy Market Forecast By Indication, 2022-2032 (US$ bn, AGR%, CAGR%)
Table 33 North America Car-T Therapy Market Forecast by Target Antigens, 2022-2032 (US$ bn, AGR%, CAGR%)
Table 34 North America Car-T Therapy Market Forecast by Patients, 2022-2032 (US$ bn, AGR%, CAGR%)
Table 35 North America Car-T Therapy Market Forecast by End Users, 2022-2032 (US$ bn, AGR%, CAGR%)
Table 36 U.S. Car-T Therapy Market Forecast, 2022-2032 (US$ bn, AGR%, CAGR%)
Table 37 Canada Car-T Therapy Market Forecast, 2022-2032 (US$ bn, AGR%, CAGR%)
Table 38 Europe Car-T Therapy Market Forecast by Country, 2022-2032 (US$ bn, AGR%, CAGR%)
Table 39 Europe Car-T Therapy Market Forecast By Indication, 2022-2032 (US$ bn, AGR%, CAGR%)
Table 40 Europe Car-T Therapy Market Forecast by Target Antigens, 2022-2032 (US$ bn, AGR%, CAGR%)
Table 41 Europe Car-T Therapy Market Forecast by Patients, 2022-2032 (US$ bn, AGR%, CAGR%)
Table 42 Europe Car-T Therapy Market Forecast by End-users, 2022-2032 (US$ bn, AGR%, CAGR%)
Table 43 Germany Car-T Therapy Market Forecast, 2022-2032 (US$ bn, AGR%, CAGR%)
Table 44 UK Car-T Therapy Market Forecast, 2022-2032 (US$ bn, AGR%, CAGR%)
Table 45 France Car-T Therapy Market Forecast, 2022-2032 (US$ bn, AGR%, CAGR%)
Table 46 Italy Car-T Therapy Market Forecast, 2022-2032 (US$ bn, AGR%, CAGR%)
Table 47 Spain Car-T Therapy Market Forecast, 2022-2032 (US$ bn, AGR%, CAGR%)
Table 48 Netherlands Car-T Therapy Market Forecast, 2022-2032 (US$ bn, AGR%, CAGR%)
Table 49 Rest of Europe Car-T Therapy Market Forecast, 2022-2032 (US$ bn, AGR%, CAGR%)
Table 50 Asia Pacific Car-T Therapy Market Forecast by Country, 2022-2032 (US$ bn, AGR%, CAGR%)
Table 51 Asia Pacific Car-T Therapy Market Forecast By Indication, 2022-2032 (US$ bn, AGR%, CAGR%)
Table 52 Asia Pacific Car-T Therapy Market Forecast by Target Antigens, 2022-2032 (US$ bn, AGR%, CAGR%)
Table 53 Asia Pacific Car-T Therapy Market Forecast by Patients, 2022-2032 (US$ bn, AGR%, CAGR%)
Table 54 Asia Pacific Car-T Therapy Market Forecast by End-users, 2022-2032 (US$ bn, AGR%, CAGR%)
Table 55 Japan Car-T Therapy Market Forecast, 2022-2032 (US$ bn, AGR%, CAGR%)
Table 56 China Car-T Therapy Market Forecast, 2022-2032 (US$ bn, AGR%, CAGR%)
Table 57 India Car-T Therapy Market Forecast, 2022-2032 (US$ bn, AGR%, CAGR%)
Table 58 Australia Car-T Therapy Market Forecast, 2022-2032 (US$ bn, AGR%, CAGR%)
Table 59 South Korea Car-T Therapy Market Forecast, 2022-2032 (US$ bn, AGR%, CAGR%)
Table 60 Rest of Asia Pacific Car-T Therapy Market Forecast, 2022-2032 (US$ bn, AGR%, CAGR%)
Table 61 Latin America Car-T Therapy Market Forecast By Indication, 2022-2032 (US$ bn, AGR%, CAGR%)
Table 62 Latin America Car-T Therapy Market Forecast by Target Antigens, 2022-2032 (US$ bn, AGR%, CAGR%)
Table 63 Latin America Car-T Therapy Market Forecast by Patients, 2022-2032 (US$ bn, AGR%, CAGR%)
Table 64 Latin America Car-T Therapy Market Forecast by End-users, 2022-2032 (US$ bn, AGR%, CAGR%)
Table 65 MEA Car-T Therapy Market Forecast By Indication, 2022-2032 (US$ bn, AGR%, CAGR%)
Table 66 MEA Car-T Therapy Market Forecast by Target Antigens, 2022-2032 (US$ bn, AGR%, CAGR%)
Table 67 MEA Car-T Therapy Market Forecast by Patient, 2022-2032 (US$ bn, AGR%, CAGR%)
Table 68 MEA Car-T Therapy Market Forecast by End-users, 2022-2032 (US$ bn, AGR%, CAGR%)
Table 69 Strategic Outlook
Table 70 Novartis AG: Key Details, (CEO, HQ, Revenue, Founded, No. of Employees, Company Type, Website, Business Segment)
Table 71 Novartis AG: Product Benchmarking
Table 72 Novartis AG: Strategic Outlook
Table 73 Gilead Sciences, Inc.: Key Details, (CEO, HQ, Revenue, Founded, No. of Employees, Company Type, Website, Business Segment)
Table 74 Gilead Science, Inc.: Product Benchmarking
Table 75 Gilead Science, Inc.: Strategic Outlook
Table 76 Bristol-Myers Squibb Company: Key Details, (CEO, HQ, Revenue, Founded, No. of Employees, Company Type, Website, Business Segment)
Table 77 Bristol-Myers Squibb Company: Product Benchmarking
Table 78 Bristol-Myers Squibb Company: Strategic Outlook
Table 79 Johnson & Johnson Private Limited: Key Details, (CEO, HQ, Revenue, Founded, No. of Employees, Company Type, Website, Business Segment)
Table 80 Johnson & Johnson Private Limited: Product Benchmarking
Table 81 Johnson & Johnson Private Limited: Strategic Outlook
Table 82 bluebird bio, Inc.: Key Details, (CEO, HQ, Revenue, Founded, No. of Employees, Company Type, Website, Business Segment)
Table 83 bluebird bio, Inc.: Product Benchmarking
Table 84 bluebird bio, Inc.: Strategic Outlook
Table 85 GSK plc: Key Details, (CEO, HQ, Revenue, Founded, No. of Employees, Company Type, Website, Business Segment)
Table 86 GSK plc: Product Benchmarking
Table 87 GSK plc: Strategic Outlook
Table 88 Caribou Biosciences Inc: Key Details, (CEO, HQ, Revenue, Founded, No. of Employees, Company Type, Website, Business Segment)
Table 89 Caribou Biosciences Inc: Product Benchmarking
Table 90 Caribou Biosciences Inc: Strategic Outlook
Table 91 Amgen Inc.: Key Details, (CEO, HQ, Revenue, Founded, No. of Employees, Company Type, Website, Business Segment)
Table 92 Amgen Inc.: Product Benchmarking
Table 93 Amgen Inc.: Strategic Outlook
Table 94 AbbVie Inc.: Key Details, (CEO, HQ, Revenue, Founded, No. of Employees, Company Type, Website, Business Segment)
Table 95 AbbVie Inc.: Product Benchmarking
Table 96 AbbVie Inc.: Strategic Outlook
Table 97 BioNTech SE: Key Details, (CEO, HQ, Revenue, Founded, No. of Employees, Company Type, Website, Business Segment)
Table 98 BioNTech SE: Product Benchmarking
Table 99 BioNTech SE: Strategic Outlook
List of Figures
Figure 1 CAR-T Therapy Market Segmentation
Figure 2 CAR-T Therapy Market by Region: Market Attractiveness Index
Figure 3 CAR-T Therapy Market By Indication: Market Attractiveness Index
Figure 4 CAR-T Therapy Market: Market Dynamics
Figure 5 COVID Impact Analysis: Car-T Therapy Market Recovery Scenarios
Figure 6 Car-T Therapy Market by Region, 2022-2032 (US$ bn, AGR %): “V” Shaped Recovery
Figure 7 Car-T Therapy Market by Region, 2022-2032 (US$ bn, AGR %): “U” Shaped Recovery
Figure 8 Car-T Therapy Market by Region, 2022-2032 (US$ bn, AGR %): “W” Shaped Recovery
Figure 9 Car-T Therapy Market by Region, 2022-2032 (US$ bn, AGR %): “L” Shaped Recovery
Figure 10 CAR-T Therapy Market: Porter’s Five Forces Analysis
Figure 11 Bargaining Power of Suppliers
Figure 12 Bargaining Power of Buyers
Figure 13 Threat of New Entrants
Figure 14 Threat of Substitutes
Figure 15 Competitive Rivalry
Figure 16 CART Therapy Market: PEST Analysis
Figure 17 Car-T Therapy Market Forecast By Indication 2022, 2027, 2032 (Revenue, CAGR%)
Figure 18 Car-T Therapy Market Forecast By Indication, 2022-2032 (US$ billion)
Figure 19 Car-T Therapy Market Share Forecast By Indication, 2022, 2027, 2032 (%)
Figure 20 DLBCL Market Forecast by Region, 2022-2032 (US$ billion)
Figure 21 DLBCL Market Share Forecast by Region, 2022 & 2032 (%)
Figure 22 ALL Market Forecast by Region, 2022-2032 (US$ billion)
Figure 23 ALL Market Share Forecast by Region, 2022 & 2032 (%)
Figure 24 Follicular Lymphoma Market Forecast by Region, 2022-2032 (US$ billion)
Figure 25 Follicular Lymphoma Market Share Forecast by Region, 2022 & 2032 (%)
Figure 26 Multiple Myeloma (MM) Market Forecast by Region, 2022-2032 (US$ billion)
Figure 27 Multiple Myeloma (MM) Market Share Forecast by Region, 2022 & 2032 (%)
Figure 28 Others Market Forecast by Region, 2022-2032 (US$ billion)
Figure 29 Others Market Share Forecast by Region, 2022 & 2032 (%)
Figure 30 Car-T Therapy Market Attractiveness Index by Type
Figure 31 Car-T Therapy Market Forecast By Type, 2022-2032 (US$ billion)
Figure 32 Car-T Therapy Market Share Forecast By Type, 2022, 2027, 2032 (%)
Figure 33 Abecma Market Forecast, 2022-2032 (US$ billion)
Figure 34 Yescarta Market Forecast, 2022-2032 (US$ billion)
Figure 35 Kymriah Market Forecast, 2022-2032 (US$ billion)
Figure 36 Tecartus Market Forecast, 2022-2032 (US$ billion)
Figure 37 Others Market Forecast, 2022-2032 (US$ billion)
Figure 38 Car-T Therapy Market Attractiveness Index by Target Antigens
Figure 39 Car-T Therapy Market Forecast By Target Antigens, 2022-2032 (US$ billion)
Figure 40 Car-T Therapy Market Share Forecast By Target Antigens, 2022, 2027, 2032 (%)
Figure 41 CD19/CD22 Market Forecast by Region, 2022-2032 (US$ billion)
Figure 42 CD19/CD22 Market Share Forecast by Region, 2022 & 2032 (%)
Figure 43 BCMA Market Forecast by Region, 2022-2032 (US$ billion)
Figure 44 BCMA Market Share Forecast by Region, 2022 & 2032 (%)
Figure 45 Others Market Forecast by Region, 2022-2032 (US$ billion)
Figure 46 Others Market Share Forecast by Region, 2022 & 2032 (%)
Figure 47 Car-T Therapy Market Attractiveness Index by Patient
Figure 48 Car-T Therapy Market Forecast By Patient, 2022-2032 (US$ billion)
Figure 49 Car-T Therapy Market Share Forecast By Patient, 2022, 2027, 2032 (%)
Figure 50 Children Market Forecast by Region, 2022-2032 (US$ billion)
Figure 51 Children Market Share Forecast by Region, 2022 & 2032 (%)
Figure 52 Adults Market Forecast by Region, 2022-2032 (US$ billion)
Figure 53 Adults Market Share Forecast by Region, 2022 & 2032 (%)
Figure 54 Seniors Market Forecast by Region, 2022-2032 (US$ billion)
Figure 55 Seniors Market Share Forecast by Region, 2022 & 2032 (%)
Figure 56 Car-T Therapy Market Attractiveness Index by End-users
Figure 57 Car-T Therapy Market Forecast By End-users, 2022-2032 (US$ billion)
Figure 58 Car-T Therapy Market Share Forecast By End-users, 2022, 2027, 2032 (%)
Figure 59 Hospitals Market Forecast by Region, 2022-2032 (US$ billion)
Figure 60 Hospitals Market Share Forecast by Region, 2022 & 2032 (%)
Figure 61 Specialty Clinics Market Forecast by Region, 2022-2032 (US$ billion)
Figure 62 Specialty Clinics Market Share Forecast by Region, 2022 & 2032 (%)
Figure 63 Other End-user Market Forecast by Region, 2022-2032 (US$ billion)
Figure 64 Other End-user Market Share Forecast by Region, 2022 & 2032 (%)
Figure 65 Car-T Therapy Market Forecast by Region 2022 - 2032 (Revenue, CAGR%)
Figure 66 Car-T Therapy Market Share Forecast by Region 2022, 2027, 2032(%)
Figure 67 Car-T Therapy Market by Region, 2022-2032 (US$ bn, AGR (%), CAGR (%))
Figure 68 North America Car-T Therapy Market Attractiveness Index
Figure 69 North America Car-T Therapy Market by Region, 2022, 2027 & 2032 (US$ billion)
Figure 70 North America Car-T Therapy Market Forecast by Country, 2022-2032 (US$ billion)
Figure 71 North America Car-T Therapy Market Share Forecast by Country, 2022 & 2032 (%)
Figure 72 North America Car-T Therapy Market Forecast By Indication, 2022-2032 (US$ billion)
Figure 73 North America Car-T Therapy Market Share Forecast By Indication, 2022 & 2032 (%)
Figure 74 North America Car-T Therapy Market Forecast by Target Antigens, 2022-2032 (US$ million)
Figure 75 North America Car-T Therapy Market Share Forecast by Target Antigens, 2022 & 2032 (%)
Figure 76 North America Car-T Therapy Market Forecast by Patients, 2022-2032 (US$ billion)
Figure 77 North America Car-T Therapy Market Share Forecast by Patients, 2022 & 2032 (%)
Figure 78 North America Car-T Therapy Market Forecast by End Users, 2022-2032 (US$ billion)
Figure 79 North America Car-T Therapy Market Share Forecast by End Users, 2022 & 2032 (%)
Figure 80 U.S. Car-T Therapy Market Forecast, 2022-2032 (US$ billion, AGR %)
Figure 81 Canada Car-T Therapy Market Forecast, 2022-2032 (US$ billion, AGR %)
Figure 82 Europe Car-T Therapy Market Attractiveness Index
Figure 83 Europe Car-T Therapy Market by Country, 2022, 2027 & 2032 (US$ billion)
Figure 84 Europe Car-T Therapy Market Forecast by Country, 2022-2032 (US$ billion)
Figure 85 Europe Car-T Therapy Market Share Forecast by Country, 2022 & 2032 (%)
Figure 86 Europe Car-T Therapy Market Forecast By Indication, 2022-2032 (US$ billion)
Figure 87 Europe Car-T Therapy Market Share Forecast By Indication, 2022 & 2032 (%)
Figure 88 Europe Car-T Therapy Market Forecast by Target Antigens, 2022-2032 (US$ billion)
Figure 89 Europe Car-T Therapy Market Share Forecast by Target Antigens, 2022 & 2032 (%)
Figure 90 Europe Car-T Therapy Market Forecast by Patients, 2022-2032 (US$ billion)
Figure 91 Europe Car-T Therapy Market Share Forecast by Patients, 2022 & 2032 (%)
Figure 92 Europe Car-T Therapy Market Forecast by End-users, 2022-2032 (US$ billion)
Figure 93 Europe Car-T Therapy Market Share Forecast by End-users, 2022 & 2032 (%)
Figure 94 Germany Car-T Therapy Market Forecast, 2022-2032 (US$ billion, AGR %)
Figure 95 UK Car-T Therapy Market Forecast, 2022-2032 (US$ billion, AGR %)
Figure 96 France Car-T Therapy Market Forecast, 2022-2032 (US$ billion, AGR %)
Figure 97 Italy Car-T Therapy Market Forecast, 2022-2032 (US$ billion, AGR %)
Figure 98 Spain Car-T Therapy Market Forecast, 2022-2032 (US$ billion, AGR %)
Figure 99 Netherlands Car-T Therapy Market Forecast, 2022-2032 (US$ billion, AGR %)
Figure 100 Rest of Europe Car-T Therapy Market Forecast, 2022-2032 (US$ billion, AGR %)
Figure 101 Asia Pacific Car-T Therapy Market Attractiveness Index
Figure 102 Asia Pacific Car-T Therapy Market by Country, 2022, 2027 & 2032 (US$ billion)
Figure 103 Asia Pacific Car-T Therapy Market Forecast by Country, 2022-2032 (US$ billion)
Figure 104 Asia Pacific Car-T Therapy Market Share Forecast by Country, 2022 & 2032 (%)
Figure 105 Asia Pacific Car-T Therapy Market Forecast By Indication, 2022-2032 (US$ billion)
Figure 106 Asia Pacific Car-T Therapy Market Share Forecast By Indication, 2022 & 2032 (%)
Figure 107 Asia Pacific Car-T Therapy Market Forecast by Target Antigens, 2022-2032 (US$ billion)
Figure 108 Asia Pacific Car-T Therapy Market Share Forecast by Target Antigens, 2022 & 2032 (%)
Figure 109 Asia Pacific Car-T Therapy Market Forecast by Patients, 2022-2032 (US$ billion)
Figure 110 Asia Pacific Car-T Therapy Market Share Forecast by Patients, 2022 & 2032 (%)
Figure 111 Asia Pacific Car-T Therapy Market Forecast by End-users, 2022-2032 (US$ billion)
Figure 112 Asia Pacific Car-T Therapy Market Share Forecast by End-users, 2022 & 2032 (%)
Figure 113 Japan Car-T Therapy Market Forecast, 2022-2032 (US$ billion, AGR %)
Figure 114 China Car-T Therapy Market Forecast, 2022-2032 (US$ billion, AGR %)
Figure 115 India Car-T Therapy Market Forecast, 2022-2032 (US$ billion, AGR %)
Figure 116 Australia Car-T Therapy Market Forecast, 2022-2032 (US$ billion, AGR %)
Figure 117 South Korea Car-T Therapy Market Forecast, 2022-2032 (US$ billion, AGR %)
Figure 118 Rest of Asia Pacific Car-T Therapy Market Forecast, 2022-2032 (US$ billion, AGR %)
Figure 119 Latin America Car-T Therapy Market Forecast By Indication, 2022-2032 (US$ billion)
Figure 120 Latin America Car-T Therapy Market Share Forecast By Indication, 2022 & 2032 (%)
Figure 121 Latin America Car-T Therapy Market Forecast by Target Antigens, 2022-2032 (US$ billion)
Figure 122 Latin America Car-T Therapy Market Share Forecast by Target Antigens, 2022 & 2032 (%)
Figure 123 Latin America Car-T Therapy Market Forecast by Patients, 2022-2032 (US$ billion)
Figure 124 Latin America Car-T Therapy Market Share Forecast by Patients, 2022 & 2032 (%)
Figure 125 Latin America Car-T Therapy Market Forecast by End-users, 2022-2032 (US$ billion)
Figure 126 Latin America Car-T Therapy Market Share Forecast by End-users, 2022 & 2032 (%)
Figure 127 MEA Car-T Therapy Market Forecast By Indication, 2022-2032 (US$ billion)
Figure 128 MEA Car-T Therapy Market Share Forecast By Indication, 2022 & 2032 (%)
Figure 129 MEA Car-T Therapy Market Forecast by Target Antigens, 2022-2032 (US$ billion)
Figure 130 MEA Car-T Therapy Market Share Forecast by Target Antigens, 2022 & 2032 (%)
Figure 131 MEA Car-T Therapy Market Forecast by Patient, 2022-2032 (US$ billion)
Figure 132 MEA Car-T Therapy Market Share Forecast by Patient, 2022 & 2032 (%)
Figure 133 MEA Car-T Therapy Market Forecast by End-users, 2022-2032 (US$ billion)
Figure 134 MEA Car-T Therapy Market Share Forecast by End-users, 2022 & 2032 (%)
Figure 135 Car-T Therapy Market: Company Share/Ranking, 2021
Figure 136 Novartis AG: Net Revenue, 2017-2021 (US$ million, AGR%)
Figure 137 Novartis AG: R&D, 2017-2021 (US$ million, AGR%)
Figure 138 Novartis AG: Regional Market Shares, 2021
Figure 139 Gilead Science, Inc.: Net Revenue, 2017-2021 (US$ million, AGR%)
Figure 140 Gilead Science, Inc.: R&D, 2017-2021 (US$ million, AGR%)
Figure 141 Gilead Science, Inc.: Regional Market Shares, 2021
Figure 142 Bristol-Myers Squibb Company: Net Revenue, 2017-2021 (US$ million, AGR%)
Figure 143 Bristol-Myers Squibb Company: R&D, 2017-2021 (US$ million, AGR%)
Figure 144 Bristol-Myers Squibb Company: Regional Market Shares, 2021
Figure 145 Johnson & Johnson Private Limited: Net Revenue, 2017-2021 (US$ million, AGR%)
Figure 146 Johnson & Johnson Private Limited: R&D, 2017-2021 (US$ million, AGR%)
Figure 147 Johnson & Johnson Private Limited: Regional Market Shares, 2021
Figure 148 bluebird bio, Inc.: Net Revenue, 2017-2021 (US$ million, AGR%)
Figure 149 bluebird bio, Inc.: R&D, 2017-2021 (US$ million, AGR%)
Figure 150 GSK plc: Net Revenue, 2017-2021 (US$ million, AGR%)
Figure 151 GSK plc: R&D, 2017-2021 (US$ million, AGR%)
Figure 152 GSK plc: Regional Market Shares, 2021
Figure 153 Caribou Biosciences Inc: Net Revenue, 2019-2021 (US$ million, AGR%)
Figure 154 Caribou Biosciences Inc: R&D, 2019-2021 (US$ million, AGR%)
Figure 155 Caribou Biosciences Inc: Regional Market Shares, 2021
Figure 156 Amgen Inc.: Net Revenue, 2017-2021 (US$ million, AGR%)
Figure 157 Amgen Inc.: R&D, 2017-2021 (US$ million, AGR%)
Figure 158 Amgen Inc.: Regional Market Shares, 2021
Figure 159 AbbVie Inc.: Net Revenue, 2017-2021 (US$ million, AGR%)
Figure 160 AbbVie Inc.: R&D, 2017-2021 (US$ million, AGR%)
Figure 161 AbbVie Inc.: Regional Market Shares, 2021
Figure 162 BioNTech SE: Net Revenue, 2017-2021 (US$ million, AGR%)
Figure 163 BioNTech SE: R&D, 2017-2021 (US$ million, AGR%)
ページTOPに戻る
本レポートと同分野(中枢神経系作用薬)の最新刊レポート
Visiongain社のヘルスケアと医薬・化学品分野での最新刊レポート
本レポートと同じKEY WORD()の最新刊レポート
- 本レポートと同じKEY WORDの最新刊レポートはありません。
よくあるご質問
Visiongain社はどのような調査会社ですか?
英国の調査会社ヴィジョンゲイン社(Visiongain)は、通信とエネルギーのほか、自動車や化学・医薬品、金属など、広範な市場を対象に調査を行っています。自動車市場については、市場全般に関する調査のほ... もっと見る
調査レポートの納品までの日数はどの程度ですか?
在庫のあるものは速納となりますが、平均的には 3-4日と見て下さい。
但し、一部の調査レポートでは、発注を受けた段階で内容更新をして納品をする場合もあります。
発注をする前のお問合せをお願いします。
注文の手続きはどのようになっていますか?
1)お客様からの御問い合わせをいただきます。
2)見積書やサンプルの提示をいたします。
3)お客様指定、もしくは弊社の発注書をメール添付にて発送してください。
4)データリソース社からレポート発行元の調査会社へ納品手配します。
5) 調査会社からお客様へ納品されます。最近は、pdfにてのメール納品が大半です。
お支払方法の方法はどのようになっていますか?
納品と同時にデータリソース社よりお客様へ請求書(必要に応じて納品書も)を発送いたします。
お客様よりデータリソース社へ(通常は円払い)の御振り込みをお願いします。
請求書は、納品日の日付で発行しますので、翌月最終営業日までの当社指定口座への振込みをお願いします。振込み手数料は御社負担にてお願いします。
お客様の御支払い条件が60日以上の場合は御相談ください。
尚、初めてのお取引先や個人の場合、前払いをお願いすることもあります。ご了承のほど、お願いします。
データリソース社はどのような会社ですか?
当社は、世界各国の主要調査会社・レポート出版社と提携し、世界各国の市場調査レポートや技術動向レポートなどを日本国内の企業・公官庁及び教育研究機関に提供しております。
世界各国の「市場・技術・法規制などの」実情を調査・収集される時には、データリソース社にご相談ください。
お客様の御要望にあったデータや情報を抽出する為のレポート紹介や調査のアドバイスも致します。
|
|

