てんかん治療薬市場レポート:2024-2034
Epilepsy Therapeutics Market Report 2024-2034
レポート詳細
てんかん治療薬市場レポート 2024-2034年 :この調査レポートは、業界とその基礎となる原動力をより良く理解することを望む、新たな収益ポケットを目指す大手企業にとって貴重なものと... もっと見る
※上記価格は部署ライセンス(Departmental licence)価格です。
その他の価格についてはデータリソースまでお問合せください。
日本語のページは自動翻訳を利用し作成しています。
実際のレポートは英文のみでご納品いたします。
サマリー
レポート詳細
てんかん治療薬市場レポート 2024-2034年:この調査レポートは、業界とその基礎となる原動力をより良く理解することを望む、新たな収益ポケットを目指す大手企業にとって貴重なものとなるでしょう。異業種への進出や、新たな地域での既存事業の拡大を目指す企業にとっても有用です。
てんかん治療市場の成長を牽引する医療の進歩
日進月歩の医療進歩の中で、てんかん治療における取り組みやイノベーションは、患者ケアのパラダイムを再構築する上で極めて重要な役割を果たしている。世界的には、政府の支援による取り組みや最先端の薬剤・治療法の開発により、てんかん治療市場はかつてない成長を遂げている。2022年2月、NYU Langone Healthが米国国立衛生研究所(NIH)から800万ドルの助成金を獲得したことは、特筆すべき出来事であった。この資金は、発作時の脳活動に関する前例のないデータを取得するよう設計された革新的な埋め込み型モニタリング装置の開発に充てられる。NYUランゴンの総合てんかんセンターのダニエル・フリードマン博士が率いるこのプロジェクトは、時代遅れの技術の限界に対処するもので、何千もの測定接点を持つ超薄型装置を構築する機会を提供するものである。このNIHのUG3/UH3資金による取り組みでは、ニューヨーク大学神経科学センター、デューク大学、ユタ大学、ブラックロック・ニューロテックなどの機関との共同研究が行われる。
デューク大学のジョナサン・ヴィヴェンティ博士が設計したこのインプラントは、柔軟な液晶ポリマー熱可塑性素材と、数百から数千の電極を接続する回路網を利用し、広範囲な脳領域から微小信号を高密度にサンプリングする。術中テストに成功したこの装置は、最大30日間の埋め込みが可能で、臨床使用の準備が整っている。NIHのBrain Research through Advancing Innovative Neurotechnologies (BRAIN) Initiativeの一環として、この共同研究はNYU Langone Healthをてんかん治療における変革的進歩の最前線に位置づけるものである。FDA承認のモニタリング用インプラントを用いた臨床試験は2023年に開始される見込みで、レーザーアブレーション、高精度手術、てんかん治療成績の全体的改善における画期的な進歩を促進することにより、てんかん治療市場の成長に貢献する。
社会経済的格差と技術的課題
2022年8月に発表された報告書「抗てんかん薬の世界的な入手可能性と価格に関する調査」でも強調されているように、世界的な懸念は抗てんかん薬の入手しやすさであり、多くの人が複数の治療選択肢を手に入れたり、購入したりすることの難しさに直面している:治療へのアクセスに関するILAEタスクフォース報告書』でも強調されている。薬物療法に関連した課題だけでなく、人口統計学的な要因も個人のQOLやケア経験の差に大きく寄与している。米国および北米で実施された研究では、発作抑制率やてんかん寛解率に人種的・民族的な格差があることが明らかになっている。さらに、特定のマイノリティ集団においては、診断の遅れやてんかん手術の利用率の低下がみられる。
さらに、NIHが2022年12月に発表した論文で強調されているように、社会経済的・人種的格差の影響は、てんかん突然死(SUDEP)の発生率にも及んでいる。社会経済的に不利な状況に直面している人は、SUDEPの発症率が高く、SUDEPの発症率が全体的に低下している時期であっても、その傾向は続いている。薬代や一次医療・専門医療へのアクセスなど、特定されたケアの障壁には、医療部門にとどまらない包括的な解決策が必要である。これらの問題に対処するには、医療介入だけでなく、より広範な政治的、経済的、制度的な変革が必要である。遠隔医療サービスのような有望な戦略も出てきているが、持続可能な解決策には、個人、地域社会、医療機関、政府・非政府組織を巻き込んだ協調的な取り組みが必要である。このことは、てんかん医療における課題が複雑かつ多面的であることを強調している。
市場調査レポートを購入する前にすべき質問とは?
-
てんかん治療薬市場はどのように発展しているのか?
-
何がてんかん治療薬市場を牽引し、阻害しているのか?
-
てんかん治療薬の各サブマーケットは予測期間中にどのように成長し、2034年にはどれくらいの売上高を占めるようになるのか。
-
2024年から2034年にかけて、てんかん治療薬の各サブマーケットの市場シェアはどのように推移するのか?
-
2024年から2034年にかけて、市場全体を牽引する主な要因は何か?
-
主要なてんかん治療薬市場はマクロ経済のダイナミクスに広く追随するのか、それとも個々の国市場が他を凌駕するのか。
-
2034年までに各国市場のシェアはどのように変化し、どの地域が2034年の市場をリードするのか。
-
主要プレーヤーと予測期間中の見通しは?
-
これらの主要企業のてんかん治療薬プロジェクトとは?
-
2024年から2034年の間に、業界はどのように発展していくのか?てんかん治療薬プロジェクトは現在、そして今後10年間でどのような意味を持つのか?
-
てんかん治療薬をさらに発展させるために、製品化の必要性は高まっているのでしょうか?
-
てんかん治療薬市場はどこに向かっているのか、また、どのようにすれば市場の最前線に立てるのか。
-
新商品や新サービスに最適な投資方法とは?
-
企業を新たな成長軌道に乗せ、C-suiteに移行させるための重要な展望とは?
このことがてんかん治療薬市場に現在、そして今後10年間でどのような影響を与えるかを知る必要があります:
-
215ページに及ぶ本レポートは、91の表、119のグラフを提供する。
-
について本レポートでは、業界の主要な有利分野を取り上げている。今すぐ
-
世界、地域、国の売上高と成長に関する詳細な分析が含まれている。
-
競合他社が成功した主なトレンド、変化、収益予測をハイライトします。
本レポートは、てんかん治療薬市場が今後10年間にどのように発展するか、またCOVID-19の景気後退と好転の変動に合わせてどのように発展するかをお伝えします。この市場は、過去10年間のどの時点よりも今が重要です。
2034年までの予測やその他の分析から、商業的な展望が明らかになる
-
2034年までの収益予測に加え、最近の実績、成長率、市場シェアも提供している。
-
ビジネスの展望や展開など、独自の分析が掲載されている。
-
定性的分析(市場ダイナミクス、促進要因、機会、阻害要因、課題など)、コスト構造、てんかん治療薬価格上昇の影響、最近の動向をご覧いただけます。
本レポートは、てんかん治療薬市場が今後10年間にどのように発展するか、またCOVID-19の景気後退と好転の変動に合わせてどのように発展するかをお伝えします。この市場は、過去10年間のどの時点よりも今が重要です。
レポート対象セグメント
医薬品クラス
流通チャネル
世界市場全体と各分野の売上予測に加え、5つの地域と25の主要国市場の売上予測も掲載しています:
北米
欧州
-
ドイツ
-
英国
-
フランス
-
スペイン
-
イタリア
-
スウェーデン
-
スイス
-
その他の欧州
アジア太平洋
-
中国
-
日本
-
インド
-
オーストラリア
-
韓国
-
シンガポール
-
台湾
-
その他のアジア太平洋
ラテンアメリカ
-
ブラジル
-
メキシコ
-
アルゼンチン
-
その他のラテンアメリカ
MEA
本レポートには、てんかん治療薬市場における主要企業の2024年から2034年までのプロファイルも含まれており、これらの企業の事業のこのセグメントに焦点を当てています。
報告書に掲載されている主要企業
-
Eisai, Inc.
-
GlaxoSmithKline (GSK)
-
GW Pharma
-
Merk KGaA
-
Neurocrine Biosciences, Inc.
-
Novartis AG
-
Ovid Therapeutics
-
Pfizer Inc
-
Praxis Precision Medicines
-
Sanofi
-
UCB S.A.
てんかん治療薬市場全体の世界売上高、2024年~2034年、金額ベースでは2024年に98億米ドルを突破、との計算。2034年まで売上は力強く成長すると予測している。当研究所では、最も大きな可能性を秘めた組織を特定しています。各組織の能力、進捗状況、商業的展望を把握することで、常に一歩先を行くことができます。
てんかん治療薬市場、2024-2034年レポートはどのようにお役に立つでしょうか?
要約すると、210ページを超えるこのレポートは、以下の知識を提供する:
-
てんかん治療薬市場の2024年から2034年までの収益予測、薬剤クラス別予測、流通チャネル別予測を世界・地域レベルで掲載 - 業界の将来性を発見し、投資と収益に最も有利な場所を見つけます。
-
5つの地域と25の主要国市場の2034年までの収益予測 - 北米、欧州、アジア太平洋地域、中南米、MEAのてんかん治療薬市場の2024年から2034年までの予測をご覧ください。また、米国、カナダ、ドイツ、英国、フランス、スペイン、イタリア、スウェーデン、スイス、中国、インド、日本、オーストラリア、韓国、シンガポール、台湾、ブラジル、メキシコ、アルゼンチン、GCC、南アフリカなどの主要経済圏の市場も予測しています。
-
既存企業および市場参入を目指す企業の展望 - てんかん治療薬市場に関与する主要企業10社の企業プロファイルを含む、2024年から2034年までの展望。
独自の予測による定量的・定性的分析をご覧ください。私たちのレポートだけに含まれる情報を入手し、貴重なビジネスインテリジェンスで情報を得ることができます。
他にはない情報
私たちの新しいレポートがあれば、知識に遅れをとったり、チャンスを逃したりする可能性が低くなります。弊社の調査レポートが貴社の調査、分析、意思決定にどのように役立つかをご覧ください。Visiongainの調査は、てんかん治療薬市場、2024年から2034年、市場をリードする企業の商業分析を必要とするすべての人のためのものです。データ、トレンド、予測をご覧いただけます。
ページTOPに戻る
目次
目次
1 レポート概要
1.1 研究の目的
1.2 てんかん治療薬市場の紹介
1.3 本レポートの内容
1.4 本レポートを読むべき理由
1.5 本分析レポートが回答する主な質問
1.6 本レポートの対象者
1.7 方法論
1.7.1 市場の定義
1.7.2 市場評価・予測手法
1.7.3 データの検証
1.7.3.1 一次調査
1.7.3.2 セカンダリーリサーチ
1.8 よくある質問(FAQ)
1.9 Visiongainの関連レポート
1.10 Visiongainについて
2 エグゼクティブ・サマリー
3 市場概要
3.1 主要な調査結果
3.2 市場ダイナミクス
3.2.1 市場牽引要因
3.2.1.1 革新的な遺伝子治療アプローチによる脳腫瘍関連てんかんの変革
3.2.1.2 小児てんかん治療の稀な形態における新たな可能性の発見
3.2.1.3 進歩、グローバル投資、医療の進歩がてんかん治療市場の成長を牽引
3.2.1.4 てんかん有病率の急増
3.2.2 市場抑制要因
3.2.2.1 発作認知の課題
3.2.2.2 社会経済格差と技術的課題
3.2.2.3 特許切れ
3.2.3 市場機会
3.2.3.1 薬剤耐性症例に対する革新的な抗てんかん療法
3.2.3.2 局所てんかん治療を変革する抑制性ニューロン
3.3 COVID-19インパクト分析
3.4 ポーターのファイブフォース分析
3.4.1 サプライヤーの交渉力
3.4.2 買い手の交渉力
3.4.3 競争相手のライバル関係
3.4.4 代替品による脅威
3.4.5 新規参入企業の脅威
3.5 PEST分析
4 てんかん治療薬市場分析:医薬品クラス別
4.1 主要調査結果
4.2 薬剤クラス別セグメント 市場魅力度指標
4.3 薬剤クラス別てんかん治療薬市場規模の推定と予測
4.4 第一世代医薬品
4.4.1 2024〜2034年の地域別市場規模(US$ Million)
4.4.2 地域別市場シェア、2024年・2034年(%)
4.5 第二世代医薬品
4.5.1 2024〜2034年の地域別市場規模(US$ Million)
4.5.2 地域別市場シェア、2024年・2034年(%)
4.6 第三世代医薬品
4.6.1 2024〜2034年の地域別市場規模(US$ Million)
4.6.2 地域別市場シェア、2024年・2034年(%)
5 てんかん治療薬市場分析:流通チャネル別
5.1 主要調査結果
5.2 流通チャネルセグメント 市場魅力度指数
5.3 てんかん治療薬の流通チャネル別市場規模推定と予測
5.4 病院薬局
5.4.1 2024〜2034年の地域別市場規模(US$ Million)
5.4.2 地域別市場シェア、2024年・2034年 (%)
5.5 小売薬局
5.5.1 2024〜2034年の地域別市場規模(US$ Million)
5.5.2 地域別市場シェア、2024年・2034年(%)
5.6 オンライン薬局
5.6.1 2024年~2034年の地域別市場規模(US$ Million)
5.6.2 地域別市場シェア、2024年・2034年 (%)
6 てんかん治療薬市場分析:地域別
6.1 主要な調査結果
6.2 地域別市場規模の推定と予測
7 北米のてんかん治療薬市場分析
7.1 主要な調査結果
7.2 北米のてんかん治療薬市場魅力度指数
7.3 北米のてんかん治療薬国別市場、2024年、2029年、2034年(US$ Million)
7.4 北米のてんかん治療薬市場推定と予測:国別
7.5 北米のてんかん治療薬市場規模推定と予測:薬効クラス別
7.6 北米のてんかん治療薬市場規模推定と予測:流通チャネル別
7.7 アメリカのてんかん治療薬市場分析
7.8 カナダのてんかん治療薬市場分析
8 欧州のてんかん治療薬市場分析
8.1 主要な調査結果
8.2 欧州のてんかん治療薬市場魅力度指数
8.3 欧州のてんかん治療薬国別市場、2024年、2029年、2034年(US$ Million)
8.4 欧州のてんかん治療薬市場規模推定と予測:国別
8.5 欧州のてんかん治療薬市場規模推定と予測:薬効クラス別
8.6 欧州のてんかん治療薬市場規模推定と予測:流通チャネル別
8.7 ドイツのてんかん治療薬市場分析
8.8 フランスのてんかん治療薬市場分析
8.9 イギリスのてんかん治療薬市場分析
8.10 イタリアのてんかん治療薬市場分析
8.11 スペインのてんかん治療薬市場分析
8.12 スウェーデンのてんかん治療薬市場分析
8.13 スイスのてんかん治療薬市場分析
8.14 その他の欧州のてんかん治療薬市場分析
9 アジア太平洋地域のてんかん治療薬市場分析
9.1 主要な調査結果
9.2 アジア太平洋地域のてんかん治療薬市場魅力度指数
9.3 アジア太平洋地域のてんかん治療薬国別市場、2024年、2029年、2034年(US$ Million)
9.4 アジア太平洋地域のてんかん治療薬市場規模推定と予測:国別
9.5 アジア太平洋地域のてんかん治療薬市場規模推定と予測:薬効クラス別
9.6 アジア太平洋地域のてんかん治療薬市場規模推定と予測:流通チャネル別
9.7 日本のてんかん治療薬市場分析
9.8 中国のてんかん治療薬市場分析
9.9 インドのてんかん治療薬市場分析
9.10 オーストラリアのてんかん治療薬市場分析
9.11 韓国のてんかん治療薬市場分析
9.12 シンガポールのてんかん治療薬市場分析
9.13 台湾のてんかん治療薬市場分析
9.14 その他のアジア太平洋地域のてんかん治療薬市場分析
10 ラテンアメリカのてんかん治療薬市場分析
10.1 主要な調査結果
10.2 ラテンアメリカのてんかん治療薬市場魅力度指数
10.3 ラテンアメリカのてんかん治療薬国別市場、2024年、2029年、2034年(US$ Million)
10.4 ラテンアメリカのてんかん治療薬市場規模推定と予測:国別
10.5 ラテンアメリカのてんかん治療薬市場規模推定と予測:薬効クラス別
10.6 ラテンアメリカのてんかん治療薬市場規模推定と予測:流通クラス別
10.7 ブラジルのてんかん治療薬市場分析
10.8 メキシコのてんかん治療薬市場分析
10.9 アルゼンチンのてんかん治療薬市場分析
10.10 その他のラテンアメリカのてんかん治療薬市場分析
11 MEAのてんかん治療薬市場分析
11.1 主要な調査結果
11.2 MEAのてんかん治療薬市場魅力度指数
11.3 MEAのてんかん治療薬国別市場、2024年、2029年、2034年(US$ Million)
11.4 MEAのてんかん治療薬市場規模推定と予測:国別
11.5 MEAのてんかん治療薬市場規模推定と予測:薬効クラス別
11.6 MEAのてんかん治療薬市場規模推定と予測:用途別
11.7 GCCのてんかん治療薬市場分析
11.8 南アフリカのてんかん治療薬市場分析
11.9 その他のMEAのてんかん治療薬市場分析
12 企業のプロフィール
12.1 競争環境、2022年
12.2 戦略的展望
12.1 Eisai, Inc.
12.1.1 会社概要
12.1.2 会社概要
12.1.3 財務分析
12.1.3.1 純収入、2017-2022年
12.1.3.2 地域市場シェア、2022年
12.1.4 製品ベンチマーク
12.1.5 戦略的展望
12.2 GlaxoSmithKline (GSK)
12.2.1 会社概要
12.2.2 会社概要
12.2.3 財務分析
12.2.3.1 純収入、2017-2022年
12.2.3.2 R&D、2017年~2022年
12.2.3.3 地域市場シェア、2022年
12.2.4 GW Pharma
12.2.5 戦略的展望
12.3 GWファーマ
12.3.1 会社概要
12.3.2 会社概要
12.3.3 製品ベンチマーク
12.3.4 戦略的展望
12.4 Pfizer Inc
12.4.1 会社概要
12.4.2 会社概要
12.4.3 財務分析
12.4.3.1 純収入、2017-2022年
12.4.3.2 R&D、2017-2022年
12.4.3.3 地域市場シェア、2022年
12.4.4 製品ベンチマーク
12.4.5 戦略的展望
12.5 Sanofi
12.5.1 会社概要
12.5.2 会社概要
12.5.3 財務分析
12.5.3.1 純収入、2017-2022年
12.5.3.2 R&D、2017-2022年
12.5.3.3 地域市場シェア、2022年
12.5.4 製品ベンチマーク
12.5.5 戦略的展望
12.6 UCB S.A.
12.6.1 会社概要
12.6.2 会社概要
12.6.3 財務分析
12.6.3.1 純収入、2017-2022年
12.6.3.2 R&D、2017年〜2022年
12.6.3.3 地域市場シェア、2022年
12.6.4 製品ベンチマーク
12.6.5 戦略的展望
12.7 Novartis AG
12.7.1 会社概要
12.7.2 会社概要
12.7.3 財務分析
12.7.3.1 純収入、2017-2022年
12.7.3.2 R&D、2017-2022年
12.7.3.3 地域市場シェア、2022年
12.7.4 製品ベンチマーク
12.7.5 戦略的展望
12.8 Merck KGaA
12.8.1 会社概要
12.8.2 会社概要
12.8.3 財務分析
12.8.3.1 純収入、2017-2022年
12.8.3.2 売上高、2017-2022年
12.8.3.3 地域市場シェア、2022年
12.8.4 製品ベンチマーク
12.8.5 戦略的展望
12.9 Ovid Therapeutics
12.9.1 会社概要
12.9.2 会社概要
12.9.3 製品ベンチマーク
12.9.4 戦略的展望
12.10 Praxis Precision Medicines
12.10.1 会社概要
12.10.2 会社概要
12.10.3 製品ベンチマーク
12.10.4 戦略的展望
12.11 Neurocrine Biosciences, Inc.
12.11.1 会社概要
12.11.2 会社概要
12.11.3 財務分析
12.11.3.1 純収入、2017-2022年
12.11.3.2 売上高、2017-2022年
12.11.4 製品ベンチマーク
12.11.5 戦略的展望
12.12 Neurelis, Inc.
12.12.1 会社概要
12.12.2 会社概要
12.12.3 製品ベンチマーク
12.12.4 戦略的展望
13 結論と提言
13.1 Visiongainからの結びの言葉
13.2 市場プレイヤーへの提言
ページTOPに戻る
図表リスト
表の一覧
Table 1 Epilepsy Therapeutics Market Snapshot, 2024 & 2034 (US$ million, CAGR %)
Table 2 Epilepsy Therapeutics Market Forecast by Region 2024-2034 (US$ Million, AGR%, CAGR%): "V" Shaped Recovery
Table 3 Epilepsy Therapeutics Market Forecast by Region 2024-2034 (US$ Million, AGR%, CAGR%): "U" Shaped Recovery
Table 4 Epilepsy Therapeutics Market Forecast by Region 2024-2034 (US$ Million, AGR%, CAGR%): "W" Shaped Recovery
Table 5 Epilepsy Therapeutics Market Forecast by Region 2024-2034 (US$ Million, AGR%, CAGR%): "L" Shaped Recovery
Table 6 Epilepsy Therapeutics Market Forecast by Drug Class, 2024-2034 (US$ Million, AGR%, CAGR%)
Table 7 First Generation Drugs Segment Market Forecast by Region, 2024-2034 (US$ Million, AGR%, CAGR%)
Table 8 Second Generation Drugs Segment Market Forecast by Region, 2024-2034 (US$ Million, AGR%, CAGR%)
Table 9 Third Generation Drugs Segment Market Forecast by Region, 2024-2034 (US$ Million, AGR%, CAGR%)
Table 10 Epilepsy Therapeutics Market Forecast by Distribution Channel, 2024-2034 (US$ Million, AGR%, CAGR%)
Table 11 Hospital Pharmacy Segment Market Forecast by Region, 2024-2034 (US$ Million, AGR%, CAGR%)
Table 12 Retail Pharmacy Segment Market Forecast by Region, 2024-2034 (US$ Million, AGR%, CAGR%)
Table 13 Online Pharmacy Segment Market Forecast by Region, 2024-2034 (US$ Million, AGR%, CAGR%)
Table 14 Epilepsy Therapeutics Market Forecast by Region, 2024-2034 (US$ Million, AGR%, CAGR%)
Table 15 North America Epilepsy Therapeutics Market Forecast by Country, 2024-2034 (US$ Million, AGR%, CAGR%)
Table 16 North America Epilepsy Therapeutics Market Forecast by Drug Class, 2024-2034 (US$ Million, AGR%, CAGR%)
Table 17 North America Epilepsy Therapeutics Market Forecast by Distribution Channel, 2024-2034 (US$ Million, AGR%, CAGR%)
Table 18 U.S. Epilepsy Therapeutics Market Forecast, 2024-2034 (US$ Million, AGR%, CAGR%)
Table 19 Canada Epilepsy Therapeutics Market Forecast, 2024-2034 (US$ Million, AGR%, CAGR%)
Table 20 Europe Epilepsy Therapeutics Market Forecast by Country, 2024-2034 (US$ Million, AGR%, CAGR %)
Table 21 Europe Epilepsy Therapeutics Market Forecast by Drug Class, 2024-2034 (US$ Million, AGR%, CAGR%)
Table 22 North America Epilepsy Therapeutics Market Forecast by Distribution Channel, 2024-2034 (US$ Million, AGR%, CAGR%)
Table 23 Germany Epilepsy Therapeutics Market Forecast, 2024-2034 (US$ Million, AGR%, CAGR%)
Table 24 France Epilepsy Therapeutics Market Forecast, 2024-2034 (US$ Million, AGR%, CAGR%)
Table 25 UK Epilepsy Therapeutics Market Forecast, 2024-2034 (US$ Million, AGR%, CAGR%)
Table 26 Italy Epilepsy Therapeutics Market Forecast, 2024-2034 (US$ Million, AGR%, CAGR%)
Table 27 Spain Epilepsy Therapeutics Market Forecast, 2024-2034 (US$ Million, AGR%, CAGR%)
Table 28 Sweden Epilepsy Therapeutics Market Forecast, 2024-2034 (US$ Million, AGR%, CAGR%)
Table 29 Switzerland Epilepsy Therapeutics Market Forecast, 2024-2034 (US$ Million, AGR%, CAGR%)
Table 30 Rest of Europe Epilepsy Therapeutics Market Forecast, 2024-2034 (US$ Million, AGR%, CAGR%)
Table 31 Asia Pacific Epilepsy Therapeutics Market Forecast by Country, 2024-2034 (US$ Million, AGR%, CAGR%)
Table 32 Asia Pacific Epilepsy Therapeutics Market Forecast by Drug Class, 2024-2034 (US$ Million, AGR%, CAGR%)
Table 33 Asia Pacific Epilepsy Therapeutics Market Forecast by Distribution Channel, 2024-2034 (US$ Million, AGR%, CAGR%)
Table 34 Japan Epilepsy Therapeutics Market Forecast, 2024-2034 (US$ Million, AGR%, CAGR%)
Table 35 China Epilepsy Therapeutics Market Forecast, 2024-2034 (US$ Million, AGR%, CAGR%)
Table 36 India Epilepsy Therapeutics Market Forecast, 2024-2034 (US$ Million, AGR%, CAGR%)
Table 37 Australia Epilepsy Therapeutics Market Forecast, 2024-2034 (US$ Million, AGR%, CAGR%)
Table 38 South Korea Epilepsy Therapeutics Market Forecast, 2024-2034 (US$ Million, AGR%, CAGR%)
Table 39 Singapore Epilepsy Therapeutics Market Forecast, 2024-2034 (US$ Million, AGR%, CAGR%)
Table 40 Taiwan Epilepsy Therapeutics Market Forecast, 2024-2034 (US$ Million, AGR%, CAGR%)
Table 41 Rest of Asia Pacific Epilepsy Therapeutics Market Forecast, 2024-2034 (US$ Million, AGR%, CAGR%)
Table 42 Latin America Epilepsy Therapeutics Market Forecast by Country, 2024-2034 (US$ Million, AGR%, CAGR%)
Table 43 Latin America Epilepsy Therapeutics Market Forecast by Drug Class, 2024-2034 (US$ Million, AGR%, CAGR%)
Table 44 Latin America Epilepsy Therapeutics Market Forecast by Distribution Channel, 2024-2034 (US$ Million, AGR%, CAGR%)
Table 45 Brazil Epilepsy Therapeutics Market Forecast, 2024-2034 (US$ Million, AGR%, CAGR%)
Table 46 Mexico Epilepsy Therapeutics Market Forecast, 2024-2034 (US$ Million, AGR%, CAGR%)
Table 47 Argentina Epilepsy Therapeutics Market Forecast, 2024-2034 (US$ Million, AGR%, CAGR%)
Table 48 Rest of Latin America Epilepsy Therapeutics Market Forecast, 2024-2034 (US$ Million, AGR%, CAGR%)
Table 49 MEA Epilepsy Therapeutics Market Forecast by Country, 2024-2034 (US$ Million, AGR%, CAGR%)
Table 50 MEA Epilepsy Therapeutics Market Forecast by Drug Class, 2024-2034 (US$ Million, AGR%, CAGR%)
Table 51 MEA Epilepsy Therapeutics Market Forecast by Distribution Channel, 2024-2034 (US$ Million, AGR%, CAGR%)
Table 52 GCC Epilepsy Therapeutics Market Forecast, 2024-2034 (US$ Million, AGR%, CAGR%)
Table 53 South Africa Epilepsy Therapeutics Market Forecast, 2024-2034 (US$ Million, AGR%, CAGR%)
Table 54 Rest of MEA Epilepsy Therapeutics Market Forecast, 2024-2034 (US$ Million, AGR%, CAGR%)
Table 55 Strategic Outlook
Table 56 Eisai, Inc. : Key Details, (CEO, HQ, Revenue, Founded, No. of Employees, Company Type, Website, Business Segment)
Table 57 Eisai, Inc.: Product Benchmarking
Table 58 Eisai, Inc.: Strategic Outlook
Table 59 GlaxoSmithKline (GSK): Key Details, (CEO, HQ, Revenue, Founded, No. of Employees, Company Type, Website, Business Segment)
Table 60 GlaxoSmithKline (GSK): Product Benchmarking
Table 61 GlaxoSmithKline (GSK): Strategic Outlook
Table 62 GW Pharma: Key Details, (CEO, HQ, Revenue, Founded, No. of Employees, Company Type, Website, Business Segment)
Table 63 GW Pharma : Product Benchmarking
Table 64 GW Pharma : Strategic Outlook
Table 65 Pfizer Inc: Key Details, (CEO, HQ, Revenue, Founded, No. of Employees, Company Type, Website, Business Segment)
Table 66 Pfizer Inc : Product Benchmarking
Table 67 Pfizer Inc: Strategic Outlook
Table 68 Sanofi: Key Details, (CEO, HQ, Revenue, Founded, No. of Employees, Company Type, Website, Business Segment)
Table 69 Sanofi: Product Benchmarking
Table 70 Sanofi: Strategic Outlook
Table 71 UCB S.A.: Key Details, (CEO, HQ, Revenue, Founded, No. of Employees, Company Type, Website, Business Segment)
Table 72 UCB S.A.: Product Benchmarking
Table 73 UCB S.A.: Strategic Outlook
Table 74 Novartis AG: Key Details, (CEO, HQ, Revenue, Founded, No. of Employees, Company Type, Website, Business Segment)
Table 75 Novartis AG: Product Benchmarking
Table 76 Novartis AG: Strategic Outlook
Table 77 Merck KGaA: Key Details, (CEO, HQ, Revenue, Founded, No. of Employees, Company Type, Website, Business Segment)
Table 78 Merck KGaA: Product Benchmarking
Table 79 Merck KGaA: Strategic Outlook
Table 80 Ovid Therapeutics : Key Details, (CEO, HQ, Revenue, Founded, No. of Employees, Company Type, Website, Business Segment)
Table 81 Ovid Therapeutics : Product Benchmarking
Table 82 Ovid Therapeutics: Strategic Outlook
Table 83 Praxis Precision Medicines: Key Details, (CEO, HQ, Revenue, Founded, No. of Employees, Company Type, Website, Business Segment)
Table 84 Praxis Precision Medicines: Product Benchmarking
Table 85 Praxis Precision Medicines: Strategic Outlook
Table 86 Neurocrine Biosciences, Inc.: Key Details, (CEO, HQ, Revenue, Founded, No. of Employees, Company Type, Website, Business Segment)
Table 87 Neurocrine Biosciences, Inc.: Product Benchmarking
Table 88 Neurocrine Biosciences, Inc.: Strategic Outlook
Table 89 Neurelis, Inc.: Key Details, (CEO, HQ, Revenue, Founded, No. of Employees, Company Type, Website, Business Segment)
Table 90 Neurelis, Inc.: Product Benchmarking
Table 91 Neurelis, Inc.: Strategic Outlook
図の一覧
Figure 1 Epilepsy Therapeutics Market Segmentation
Figure 2 Epilepsy Therapeutics Market by Drug Class: Market Attractiveness Index
Figure 3 Epilepsy Therapeutics Market by Distribution Channel: Market Attractiveness Index
Figure 4 Epilepsy Therapeutics Market Attractiveness Index by Region
Figure 5 Epilepsy Therapeutics Market: Market Dynamics
Figure 6 Epilepsy Therapeutics Market by Region, 2024-2034 (US$ Million, AGR %): “V” Shaped Recovery
Figure 7 Epilepsy Therapeutics Market by Region, 2024-2034 (US$ Million, AGR %): “U” Shaped Recovery
Figure 8 Epilepsy Therapeutics Market by Region, 2024-2034 (US$ Million, AGR %): “W” Shaped Recovery
Figure 9 Epilepsy Therapeutics Market by Region, 2024-2034 (US$ Million, AGR %): “L” Shaped Recovery
Figure 10 Epilepsy Therapeutics Market: Porter’s Five Forces Analysis
Figure 11 Epilepsy Therapeutics Market: PEST Analysis
Figure 12 Epilepsy Therapeutics Market by Drug Class: Market Attractiveness Index
Figure 13 Epilepsy Therapeutics Market Forecast by Drug Class, 2024-2034 (US$ Million, AGR %)
Figure 14 Epilepsy Therapeutics Market Share Forecast by Drug Class, 2024, 2029, 2034 (%)
Figure 15 First Generation Drugs Segment Market Forecast by Region, 2024-2034 (US$ Million, AGR %)
Figure 16 First Generation Drugs Segment Market Share Forecast by Region, 2024 & 2034 (%)
Figure 17 Second Generation Drugs Segment Market Forecast by Region, 2024-2034 (US$ Million, AGR %)
Figure 18 Second Generation Drugs Segment Market Share Forecast by Region, 2024 & 2034 (%)
Figure 19 Third Generation Drugs Segment Market Forecast by Region, 2024-2034 (US$ Million, AGR %)
Figure 20 Third Generation Drugs Segment Market Share Forecast by Region, 2024 & 2034 (%)
Figure 21 Epilepsy Therapeutics Market by Distribution Channel: Market Attractiveness Index
Figure 22 Epilepsy Therapeutics Market Forecast by Distribution Channel, 2024-2034 (US$ Million, AGR %)
Figure 23 Epilepsy Therapeutics Market Share Forecast by Distribution Channel, 2024, 2029, 2034 (%)
Figure 24 Hospital Pharmacy Segment Market Forecast by Region, 2024-2034 (US$ Million, AGR %)
Figure 25 Hospital Pharmacy Segment Market Share Forecast by Region, 2024 & 2034 (%)
Figure 26 Retail Pharmacy Segment Market Forecast by Region, 2024-2034 (US$ Million, AGR %)
Figure 27 Retail Pharmacy Segment Market Share Forecast by Region, 2024 & 2034 (%)
Figure 28 Online Pharmacy Segment Market Forecast by Region, 2024-2034 (US$ Million, AGR %)
Figure 29 Online Pharmacy Segment Market Share Forecast by Region, 2024 & 2034 (%)
Figure 30 Epilepsy Therapeutics Market Forecast by Region 2024 and 2034 (Revenue, CAGR%)
Figure 31 Epilepsy Therapeutics Market Share Forecast by Region 2024, 2029, 2034 (%)
Figure 32 Epilepsy Therapeutics Market by Region, 2024-2034 (US$ Million, AGR %)
Figure 33 North America Epilepsy Therapeutics Market Attractiveness Index
Figure 34 North America Epilepsy Therapeutics Market by Region, 2024, 2029 & 2034 (US$ Million)
Figure 35 North America Epilepsy Therapeutics Market Forecast by Country, 2024-2034 (US$ Million, AGR %)
Figure 36 North America Epilepsy Therapeutics Market Share Forecast by Country, 2024 & 2034 (%)
Figure 37 North America Epilepsy Therapeutics Market Forecast by Drug Class, 2024-2034 (US$ Million, AGR %)
Figure 38 North America Epilepsy Therapeutics Market Share Forecast by Drug Class, 2024 & 2034 (%)
Figure 39 North America Epilepsy Therapeutics Market Forecast by Distribution Channel, 2024-2034 (US$ Million, AGR %)
Figure 40 North America Epilepsy Therapeutics Market Share Forecast by Distribution Channel, 2024 & 2034 (%)
Figure 41 U.S. Epilepsy Therapeutics Market Forecast, 2024-2034 (US$ Million, AGR %)
Figure 42 Canada Epilepsy Therapeutics Market Forecast, 2024-2034 (US$ Million, AGR %)
Figure 43 Europe Epilepsy Therapeutics Market Attractiveness Index
Figure 44 Europe Epilepsy Therapeutics Market by Region, 2024, 2029 & 2034 (US$ Million)
Figure 45 Europe Epilepsy Therapeutics Market Forecast by Country, 2024-2034 (US$ Million, AGR %)
Figure 46 Europe Epilepsy Therapeutics Market Share Forecast by Country, 2024 & 2034 (%)
Figure 47 Europe Epilepsy Therapeutics Market Forecast by Drug Class, 2024-2034 (US$ Million, AGR %)
Figure 48 Europe Epilepsy Therapeutics Market Share Forecast by Drug Class, 2024 & 2034 (%)
Figure 49 Europe Epilepsy Therapeutics Market Forecast by Distribution Channel, 2024-2034 (US$ Million, AGR %)
Figure 50 Europe Epilepsy Therapeutics Market Share Forecast by Distribution Channel, 2024 & 2034 (%)
Figure 51 Germany Epilepsy Therapeutics Market Forecast, 2024-2034 (US$ Million, AGR %)
Figure 52 France Epilepsy Therapeutics Market Forecast, 2024-2034 (US$ Million, AGR %)
Figure 53 UK Epilepsy Therapeutics Market Forecast, 2024-2034 (US$ Million, AGR %)
Figure 54 Italy Epilepsy Therapeutics Market Forecast, 2024-2034 (US$ Million, AGR %)
Figure 55 Spain Epilepsy Therapeutics Market Forecast, 2024-2034 (US$ Million, AGR %)
Figure 56 Sweden Epilepsy Therapeutics Market Forecast, 2024-2034 (US$ Million, AGR %)
Figure 57 Switzerland Epilepsy Therapeutics Market Forecast, 2024-2034 (US$ Million, AGR %)
Figure 58 Rest of Europe Epilepsy Therapeutics Market Forecast, 2024-2034 (US$ Million, AGR %)
Figure 59 Asia Pacific Epilepsy Therapeutics Market Attractiveness Index
Figure 60 Asia Pacific Epilepsy Therapeutics Market by Region, 2024, 2029 & 2034 (US$ Million)
Figure 61 Asia Pacific Epilepsy Therapeutics Market Forecast by Country, 2024-2034 (US$ Million, AGR %)
Figure 62 Asia Pacific Epilepsy Therapeutics Market Share Forecast by Country, 2024 & 2034 (%)
Figure 63 Asia Pacific Epilepsy Therapeutics Market Forecast by Drug Class, 2024-2034 (US$ Million, AGR %)
Figure 64 Asia Pacific Epilepsy Therapeutics Market Share Forecast by Drug Class, 2024 & 2034 (%)
Figure 65 Asia Pacific Epilepsy Therapeutics Market Forecast by Distribution Channel, 2024-2034 (US$ Million, AGR %)
Figure 66 Asia Pacific Epilepsy Therapeutics Market Share Forecast by Distribution Channel, 2024 & 2034 (%)
Figure 67 Japan Epilepsy Therapeutics Market Forecast, 2024-2034 (US$ Million, AGR %)
Figure 68 China Epilepsy Therapeutics Market Forecast, 2024-2034 (US$ Million, AGR %)
Figure 69 India Epilepsy Therapeutics Market Forecast, 2024-2034 (US$ Million, AGR %)
Figure 70 Australia Epilepsy Therapeutics Market Forecast, 2024-2034 (US$ Million, AGR %)
Figure 71 South Korea Epilepsy Therapeutics Market Forecast, 2024-2034 (US$ Million, AGR %)
Figure 72 Singapore Epilepsy Therapeutics Market Forecast, 2024-2034 (US$ Million, AGR %)
Figure 73 Taiwan Epilepsy Therapeutics Market Forecast, 2024-2034 (US$ Million, AGR %)
Figure 74 Rest of Asia Pacific Epilepsy Therapeutics Market Forecast, 2024-2034 (US$ Million, AGR %)
Figure 75 Latin America Epilepsy Therapeutics Market Attractiveness Index
Figure 76 Latin America Epilepsy Therapeutics Market by Region, 2024, 2029 & 2034 (US$ Million)
Figure 77 Latin America Epilepsy Therapeutics Market Forecast by Country, 2024-2034 (US$ Million, AGR %)
Figure 78 Latin America Epilepsy Therapeutics Market Share Forecast by Country, 2024 & 2034 (%)
Figure 79 Latin America Epilepsy Therapeutics Market Forecast by Drug Class, 2024-2034 (US$ Million, AGR %)
Figure 80 Latin America Epilepsy Therapeutics Market Share Forecast by Drug Class, 2024 & 2034 (%)
Figure 81 Latin America Epilepsy Therapeutics Market Forecast by Distribution Channel, 2024-2034 (US$ Million, AGR %)
Figure 82 Latin America Epilepsy Therapeutics Market Share Forecast by Distribution Channel, 2024 & 2034 (%)
Figure 83 Brazil Epilepsy Therapeutics Market Forecast, 2024-2034 (US$ Million, AGR %)
Figure 84 Mexico Epilepsy Therapeutics Market Forecast, 2024-2034 (US$ Million, AGR %)
Figure 85 Argentina Epilepsy Therapeutics Market Forecast, 2024-2034 (US$ Million, AGR %)
Figure 86 Rest of Latin America Epilepsy Therapeutics Market Forecast, 2024-2034 (US$ Million, AGR %)
Figure 87 MEA Epilepsy Therapeutics Market Attractiveness Index
Figure 88 MEA Epilepsy Therapeutics Market by Region, 2024, 2029 & 2034 (US$ Million)
Figure 89 MEA Epilepsy Therapeutics Market Forecast by Country, 2024-2034 (US$ Million, AGR %)
Figure 90 MEA Epilepsy Therapeutics Market Share Forecast by Country, 2024 & 2034 (%)
Figure 91 MEA Epilepsy Therapeutics Market Forecast by Drug Class, 2024-2034 (US$ Million, AGR %)
Figure 92 MEA Epilepsy Therapeutics Market Share Forecast by Drug Class, 2024 & 2034 (%)
Figure 93 MEA Epilepsy Therapeutics Market Forecast by Distribution Channel, 2024-2034 (US$ Million, AGR %)
Figure 94 MEA Epilepsy Therapeutics Market Share Forecast by Distribution Channel, 2024 & 2034 (%)
Figure 95 GCC Epilepsy Therapeutics Market Forecast, 2024-2034 (US$ Million, AGR %)
Figure 96 South Africa Epilepsy Therapeutics Market Forecast, 2024-2034 (US$ Million, AGR %)
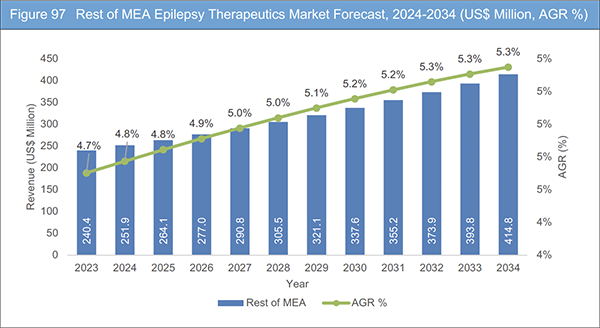
Figure 97 Rest of MEA Epilepsy Therapeutics Market Forecast, 2024-2034 (US$ Million, AGR %)
Figure 98 Eisai, Inc.: Net Revenue, 2017-2022 (US$ Million, AGR%)
Figure 99 Eisai, Inc.: Regional Market Shares, 2022
Figure 100 GlaxoSmithKline (GSK): Net Revenue, 2017-2022 (US$ Million, AGR%)
Figure 101 GlaxoSmithKline (GSK): R&D, 2017-2022 (US$ Million, AGR%)
Figure 102 GlaxoSmithKline (GSK): Regional Market Shares, 2022
Figure 103 Pfizer Inc: Net Revenue, 2017-2022 (US$ Million, AGR%)
Figure 104 Pfizer Inc: R&D, 2017-2022 (US$ Million, AGR%)
Figure 105 Pfizer Inc: Regional Market Shares, 2022
Figure 106 Sanofi: Net Revenue, 2017-2022 (US$ Million, AGR%)
Figure 107 Sanofi: R&D, 2017-2022 (US$ Million, AGR%)
Figure 108 Sanofi: Regional Market Shares, 2022
Figure 109 UCB S.A.: Net Revenue, 2017-2022 (US$ Million, AGR%)
Figure 110 UCB S.A.: R&D, 2017-2022 (US$ Million, AGR%)
Figure 111 UCB S.A.: Regional Market Shares, 2022
Figure 112 Novartis AG: Net Revenue, 2017-2022 (US$ Million, AGR%)
Figure 113 Novartis AG: R&D, 2017-2022 (US$ Million, AGR%)
Figure 114 Novartis AG: Regional Market Shares, 2022
Figure 115 Merck KGaA: Net Revenue, 2017-2022 (US$ Million, AGR%)
Figure 116 Merck KGaA: R&D, 2017-2022 (US$ Million, AGR%)
Figure 117 Merck KGaA: Regional Market Shares, 2022
Figure 118 Neurocrine Biosciences Inc.: Net Revenue, 2017-2022 (US$ Million, AGR%)
Figure 119 Neurocrine Biosciences Inc.: R&D, 2017-2022 (US$ Million, AGR%)
ページTOPに戻る
Summary
Report Details
The Epilepsy Therapeutics Market Report 2024-2034: This report will prove invaluable to leading firms striving for new revenue pockets if they wish to better understand the industry and its underlying dynamics. It will be useful for companies that would like to expand into different industries or to expand their existing operations in a new region.
Medical Advances Driving Epilepsy Treatment Market Growth
In the ever-evolving field of medical progress, initiatives and innovations in epilepsy treatment are playing a pivotal role in reshaping patient care paradigms. Globally, government-backed endeavors and cutting-edge developments in drugs and treatments are fostering an environment of unprecedented growth in the epilepsy treatment market. A notable initiative occurred when NYU Langone Health secured an $8 million grant from the National Institutes of Health (NIH) in February 2022. The funds are earmarked to develop an innovative implantable monitoring device designed to capture unprecedented data on brain activity during seizures. Led by Dr. Daniel Friedman at NYU Langone’s Comprehensive Epilepsy Center, the project addresses the limitations of outdated technology, presenting an opportunity to build an ultrathin device with thousands of measurement contacts. This NIH UG3/UH3-funded initiative involves collaboration with institutions such as New York University’s Center for Neural Science, Duke University, the University of Utah, and Blackrock Neurotech.
Designed by Dr. Jonathan Viventi from Duke University, the implant utilizes flexible liquid crystal polymer thermoplastic material and a network of circuits connecting hundreds to thousands of electrodes for high-density sampling of microsignals from extensive brain areas. Successfully tested intraoperatively, the device is poised for clinical use with the capacity for implantation for up to 30 days. As part of the NIH’s Brain Research through Advancing Innovative Neurotechnologies (BRAIN) Initiative, this collaborative effort places NYU Langone Health at the forefront of transformative advancements in epilepsy care. Clinical trials employing an FDA-approved monitoring implant are expected to commence in 2023, contributing to the growth of the epilepsy treatment market by fostering groundbreaking advancements in laser ablation, high-precision surgeries, and overall improvements in epilepsy treatment outcomes.
Socioeconomic Disparities and Technological Challenges
A global concern is the accessibility of anti-seizure medication, with many individuals facing difficulties in affording or obtaining multiple medication options, as emphasized in the August 2022 report, ‘Survey on the worldwide availability and affordability of anti-seizure medications: Report of the ILAE Task Force on Access to Treatment.’ Beyond medication-related challenges, demographic factors contribute significantly to differences in the quality of life and care experiences of individuals. Studies conducted in the United States and North America reveal disparities in seizure control rates and epilepsy remission along racial and ethnic lines. Additionally, there are delays in diagnosis and reduced utilization of epilepsy surgery in specific minority populations.
Furthermore, as highlighted in an article published in December 2022 by NIH, the impact of socioeconomic and racial divides extends to rates of sudden unexpected death in epilepsy (SUDEP). Individuals facing high socioeconomic disadvantage exhibit higher rates of SUDEP, persisting even during periods of decreasing overall SUDEP rates. The identified barriers to care, including medication affordability and access to primary and specialist care, demand comprehensive solutions that extend beyond the healthcare sector. Addressing these issues necessitates not only healthcare interventions but also broader political, economic, and systemic changes. While promising strategies like telehealth services are emerging, sustainable solutions will require coordinated efforts involving individuals, communities, healthcare institutions, and governmental and non-governmental organizations. This underscores the complex and multifaceted nature of the challenges in epilepsy care.
What Questions Should You Ask before Buying a Market Research Report?
-
How is the epilepsy therapeutics market evolving?
-
What is driving and restraining the epilepsy therapeutics market?
-
How will each epilepsy therapeutics submarket segment grow over the forecast period and how much revenue will these submarkets account for in 2034?
-
How will the market shares for each epilepsy therapeutics submarket develop from 2024 to 2034?
-
What will be the main driver for the overall market from 2024 to 2034?
-
Will leading epilepsy therapeutics markets broadly follow the macroeconomic dynamics, or will individual national markets outperform others?
-
How will the market shares of the national markets change by 2034 and which geographical region will lead the market in 2034?
-
Who are the leading players and what are their prospects over the forecast period?
-
What are the epilepsy therapeutics projects for these leading companies?
-
How will the industry evolve during the period between 2024 and 2034? What are the implications of epilepsy therapeutics projects taking place now and over the next 10 years?
-
Is there a greater need for product commercialisation to further the epilepsy therapeutics?
-
Where is the epilepsy therapeutics market heading and how can you ensure you are at the forefront of the market?
-
What are the best investment options for new product and service lines?
-
What are the key prospects for moving companies into a new growth path and C-suite?
You need to discover how this will impact the Epilepsy Therapeutics Market today, and over the next 10 years:
-
Our 215-page report provides 91 tables, 119 charts /graphs exclusively to you.
-
The report highlights key lucrative areas in the industry so you can target them – NOW.
-
It contains in-depth analysis of global, regional and national sales and growth.
-
It highlights for you the key successful trends, changes and revenue projections made by your competitors.
This report tells you TODAY how the Epilepsy Therapeutics Market will develop in the next 10 years, and in line with the variations in COVID-19 economic recession and bounce. This market is more critical now than at any point over the last 10 years.
Forecasts to 2034 and other analyses reveal commercial prospects
-
In addition to revenue forecasting to 2034, our new study provides you with recent results, growth rates, and market shares.
-
You will find original analyses, with business outlooks and developments.
-
Discover qualitative analyses (including market dynamics, drivers, opportunities, restraints and challenges), cost structure, impact of rising epilepsy therapeutics prices and recent developments.
This report includes data analysis and invaluable insight into how COVID-19 will affect the industry and your company. Four COVID-19 recovery patterns and their impact, namely, “V”, “L”, “W” and “U” are discussed in this report.
Segments Covered in the Report
Drug Class
-
First Generation Drugs
-
Second Generation Drugs
-
Third Generation Drugs
Distribution Channel
-
Hospital Pharmacy
-
Retail Pharmacy
-
Online Pharmacy
In addition to the revenue predictions for the overall world market and segments, you will also find revenue forecasts for five regional and 25 leading national markets:
North America
Europe
-
Germany
-
UK
-
France
-
Spain
-
Italy
-
Sweden
-
Switzerland
-
Rest of Europe
Asia Pacific
-
China
-
Japan
-
India
-
Australia
-
South Korea
-
Singapore
-
Taiwan
-
Rest of Asia Pacific
Latin America
-
Brazil
-
Mexico
-
Argentina
-
Rest of Latin America
MEA
-
GCC
-
South Africa
-
Rest of MEA
The report also includes profiles and for some of the leading companies in the Epilepsy Therapeutics Market, 2024 to 2034, with a focus on this segment of these companies’ operations.
Leading companies profiled in the report
-
Eisai, Inc.
-
GlaxoSmithKline (GSK)
-
GW Pharma
-
Merk KGaA
-
Neurocrine Biosciences, Inc.
-
Novartis AG
-
Ovid Therapeutics
-
Pfizer Inc
-
Praxis Precision Medicines
-
Sanofi
-
UCB S.A.
Overall world revenue for Epilepsy Therapeutics Market, 2024 to 2034 in terms of value the market will surpass US$9,800 million in 2024, our work calculates. We predict strong revenue growth through to 2034. Our work identifies which organizations hold the greatest potential. Discover their capabilities, progress, and commercial prospects, helping you stay ahead.
How will the Epilepsy Therapeutics Market, 2024 to 2034 report help you?
In summary, our 210+ page report provides you with the following knowledge:
-
Revenue forecasts to 2034 for Epilepsy Therapeutics Market, 2024 to 2034, with forecasts for drug class and distribution channel each forecast at a global and regional level – discover the industry’s prospects, finding the most lucrative places for investments and revenues.
-
Revenue forecasts to 2034 for five regional and 25 key national markets – See forecasts for the Epilepsy Therapeutics Market, 2024 to 2034 market in North America, Europe, Asia-Pacific, Latin America, and MEA. Also forecasted is the market in the US, Canada, Germany, UK, France, Spain, Italy, Sweden, Switzerland, China, India, Japan, Australia, South Korea, Singapore, Taiwan, Brazil, Mexico, Argentina, GCC, South Africa, and among other prominent economies.
-
Prospects for established firms and those seeking to enter the market – including company profiles for 10 of the major companies involved in the Epilepsy Therapeutics Market, 2024 to 2034.
Find quantitative and qualitative analyses with independent predictions. Receive information that only our report contains, staying informed with invaluable business intelligence.
Information found nowhere else
With our new report, you are less likely to fall behind in knowledge or miss out on opportunities. See how our work could benefit your research, analyses, and decisions. Visiongain’s study is for everybody needing commercial analyses for the Epilepsy Therapeutics Market, 2024 to 2034, market-leading companies. You will find data, trends and predictions.
ページTOPに戻る
Table of Contents
Table of Contents
1 Report Overview
1.1 Objectives of the Study
1.2 Introduction to Epilepsy Therapeutics Market
1.3 What This Report Delivers
1.4 Why You Should Read This Report
1.5 Key Questions Answered by This Analytical Report
1.6 Who is This Report for?
1.7 Methodology
1.7.1 Market Definitions
1.7.2 Market Evaluation & Forecasting Methodology
1.7.3 Data Validation
1.7.3.1 Primary Research
1.7.3.2 Secondary Research
1.8 Frequently Asked Questions (FAQs)
1.9 Associated Visiongain Reports
1.10 About Visiongain
2 Executive Summary
3 Market Overview
3.1 Key Findings
3.2 Market Dynamics
3.2.1 Market Driving Factors
3.2.1.1 Transforming Brain Tumour-Related Epilepsy through Innovative Gene Therapy Approaches
3.2.1.2 Uncovering Novel Possibilities in a Rare Form of Childhood Epilepsy Treatment
3.2.1.3 Advancements, Global Investments, and Medical Advances Drive Epilepsy Treatment Market Growth
3.2.1.4 Surge in Epilepsy Prevalence
3.2.2 Market Restraining Factors
3.2.2.1 Seizure Recognition Challenges
3.2.2.2 Socioeconomic Disparities and Technological Challenges
3.2.2.3 Patent Expiry
3.2.3 Market Opportunities
3.2.3.1 Innovating Antiepileptic Therapies for Drug-Resistant Cases
3.2.3.2 Inhibitory Neurons Transform Focal Epilepsy Treatment
3.3 COVID-19 Impact Analysis
3.4 Porter’s Five Forces Analysis
3.4.1 Bargaining Power of Suppliers
3.4.2 Bargaining Power of Buyers
3.4.3 Competitive Rivalry
3.4.4 Threat from Substitutes
3.4.5 Threat of New Entrants
3.5 PEST Analysis
4 Epilepsy Therapeutics Market Analysis by Drug Class
4.1 Key Findings
4.2 Drug Class Segment: Market Attractiveness Index
4.3 Epilepsy Therapeutics Market Size Estimation and Forecast by Drug Class
4.4 First Generation Drugs
4.4.1 Market Size by Region, 2024-2034 (US$ Million)
4.4.2 Market Share by Region, 2024 & 2034 (%)
4.5 Second Generation Drugs
4.5.1 Market Size by Region, 2024-2034 (US$ Million)
4.5.2 Market Share by Region, 2024 & 2034 (%)
4.6 Third Generation Drugs
4.6.1 Market Size by Region, 2024-2034 (US$ Million)
4.6.2 Market Share by Region, 2024 & 2034 (%)
5 Epilepsy Therapeutics Market Analysis by Distribution Channel
5.1 Key Findings
5.2 Distribution Channel Segment: Market Attractiveness Index
5.3 Epilepsy Therapeutics Market Size Estimation and Forecast by Distribution Channel
5.4 Hospital Pharmacy
5.4.1 Market Size by Region, 2024-2034 (US$ Million)
5.4.2 Market Share by Region, 2024 & 2034 (%)
5.5 Retail Pharmacy
5.5.1 Market Size by Region, 2024-2034 (US$ Million)
5.5.2 Market Share by Region, 2024 & 2034 (%)
5.6 Online Pharmacy
5.6.1 Market Size by Region, 2024-2034 (US$ Million)
5.6.2 Market Share by Region, 2024 & 2034 (%)
6 Epilepsy Therapeutics Market Analysis by Region
6.1 Key Findings
6.2 Regional Market Size Estimation and Forecast
7 North America Epilepsy Therapeutics Market Analysis
7.1 Key Findings
7.2 North America Epilepsy Therapeutics Market Attractiveness Index
7.3 North America Epilepsy Therapeutics Market by Country, 2024, 2029 & 2034 (US$ Million)
7.4 North America Epilepsy Therapeutics Market Size Estimation and Forecast by Country
7.5 North America Epilepsy Therapeutics Market Size Estimation and Forecast by Drug Class
7.6 North America Epilepsy Therapeutics Market Size Estimation and Forecast by Distribution Channel
7.7 U.S. Epilepsy Therapeutics Market Analysis
7.8 Canada Epilepsy Therapeutics Market Analysis
8 Europe Epilepsy Therapeutics Market Analysis
8.1 Key Findings
8.2 Europe Epilepsy Therapeutics Market Attractiveness Index
8.3 Europe Epilepsy Therapeutics Market by Country, 2024, 2029 & 2034 (US$ Million)
8.4 Europe Epilepsy Therapeutics Market Size Estimation and Forecast by Country
8.5 Europe Epilepsy Therapeutics Market Size Estimation and Forecast by Drug Class
8.6 Europe Epilepsy Therapeutics Market Size Estimation and Forecast by Distribution Channel
8.7 Germany Epilepsy Therapeutics Market Analysis
8.8 France Epilepsy Therapeutics Market Analysis
8.9 UK Epilepsy Therapeutics Market Analysis
8.10 Italy Epilepsy Therapeutics Market Analysis
8.11 Spain Epilepsy Therapeutics Market Analysis
8.12 Sweden Epilepsy Therapeutics Market Analysis
8.13 Switzerland Epilepsy Therapeutics Market Analysis
8.14 Rest of Europe Epilepsy Therapeutics Market Analysis
9 Asia Pacific Epilepsy Therapeutics Market Analysis
9.1 Key Findings
9.2 Asia Pacific Epilepsy Therapeutics Market Attractiveness Index
9.3 Asia Pacific Epilepsy Therapeutics Market by Country, 2024, 2029 & 2034 (US$ Million)
9.4 Asia Pacific Epilepsy Therapeutics Market Size Estimation and Forecast by Country
9.5 Asia Pacific Epilepsy Therapeutics Market Size Estimation and Forecast by Drug Class
9.6 Asia Pacific Epilepsy Therapeutics Market Size Estimation and Forecast by Distribution Channel
9.7 Japan Epilepsy Therapeutics Market Analysis
9.8 China Epilepsy Therapeutics Market Analysis
9.9 India Epilepsy Therapeutics Market Analysis
9.10 Australia Epilepsy Therapeutics Market Analysis
9.11 South Korea Epilepsy Therapeutics Market Analysis
9.12 Singapore Epilepsy Therapeutics Market Analysis
9.13 Taiwan Epilepsy Therapeutics Market Analysis
9.14 Rest of Asia Pacific Epilepsy Therapeutics Market Analysis
10 Latin America Epilepsy Therapeutics Market Analysis
10.1 Key Findings
10.2 Latin America Epilepsy Therapeutics Market Attractiveness Index
10.3 Latin America Epilepsy Therapeutics Market by Country, 2024, 2029 & 2034 (US$ Million)
10.4 Latin America Epilepsy Therapeutics Market Size Estimation and Forecast by Country
10.5 Latin America Epilepsy Therapeutics Market Size Estimation and Forecast by Drug Class
10.6 Latin America Epilepsy Therapeutics Market Size Estimation and Forecast by Distribution Class
10.7 Brazil Epilepsy Therapeutics Market Analysis
10.8 Mexico Epilepsy Therapeutics Market Analysis
10.9 Argentina Epilepsy Therapeutics Market Analysis
10.10 Rest of Latin America Epilepsy Therapeutics Market Analysis
11 MEA Epilepsy Therapeutics Market Analysis
11.1 Key Findings
11.2 MEA Epilepsy Therapeutics Market Attractiveness Index
11.3 MEA Epilepsy Therapeutics Market by Country, 2024, 2029 & 2034 (US$ Million)
11.4 MEA Epilepsy Therapeutics Market Size Estimation and Forecast by Country
11.5 MEA Epilepsy Therapeutics Market Size Estimation and Forecast by Drug Class
11.6 MEA Epilepsy Therapeutics Market Size Estimation and Forecast by Application
11.7 GCC Epilepsy Therapeutics Market Analysis
11.8 South Africa Epilepsy Therapeutics Market Analysis
11.9 Rest of MEA Epilepsy Therapeutics Market Analysis
12 Company Profiles
12.1 Competitive Landscape, 2022
12.2 Strategic Outlook
12.1 Eisai, Inc.
12.1.1 Company Snapshot
12.1.2 Company Overview
12.1.3 Financial Analysis
12.1.3.1 Net Revenue, 2017-2022
12.1.3.2 Regional Market Shares, 2022
12.1.4 Product Benchmarking
12.1.5 Strategic Outlook
12.2 GlaxoSmithKline (GSK)
12.2.1 Company Snapshot
12.2.2 Company Overview
12.2.3 Financial Analysis
12.2.3.1 Net Revenue, 2017-2022
12.2.3.2 R&D, 2017-2022
12.2.3.3 Regional Market Shares, 2022
12.2.4 Product Benchmarking
12.2.5 Strategic Outlook
12.3 GW Pharma
12.3.1 Company Snapshot
12.3.2 Company Overview
12.3.3 Product Benchmarking
12.3.4 Strategic Outlook
12.4 Pfizer Inc
12.4.1 Company Snapshot
12.4.2 Company Overview
12.4.3 Financial Analysis
12.4.3.1 Net Revenue, 2017-2022
12.4.3.2 R&D, 2017-2022
12.4.3.3 Regional Market Shares, 2022
12.4.4 Product Benchmarking
12.4.5 Strategic Outlook
12.5 Sanofi
12.5.1 Company Snapshot
12.5.2 Company Overview
12.5.3 Financial Analysis
12.5.3.1 Net Revenue, 2017-2022
12.5.3.2 R&D, 2017-2022
12.5.3.3 Regional Market Shares, 2022
12.5.4 Product Benchmarking
12.5.5 Strategic Outlook
12.6 UCB S.A.
12.6.1 Company Snapshot
12.6.2 Company Overview
12.6.3 Financial Analysis
12.6.3.1 Net Revenue, 2017-2022
12.6.3.2 R&D, 2017-2022
12.6.3.3 Regional Market Shares, 2022
12.6.4 Product Benchmarking
12.6.5 Strategic Outlook
12.7 Novartis AG
12.7.1 Company Snapshot
12.7.2 Company Overview
12.7.3 Financial Analysis
12.7.3.1 Net Revenue, 2017-2022
12.7.3.2 R&D, 2017-2022
12.7.3.3 Regional Market Shares, 2022
12.7.4 Product Benchmarking
12.7.5 Strategic Outlook
12.8 Merck KGaA
12.8.1 Company Snapshot
12.8.2 Company Overview
12.8.3 Financial Analysis
12.8.3.1 Net Revenue, 2017-2022
12.8.3.2 R&D, 2017-2022
12.8.3.3 Regional Market Shares, 2022
12.8.4 Product Benchmarking
12.8.5 Strategic Outlook
12.9 Ovid Therapeutics
12.9.1 Company Snapshot
12.9.2 Company Overview
12.9.3 Product Benchmarking
12.9.4 Strategic Outlook
12.10 Praxis Precision Medicines
12.10.1 Company Snapshot
12.10.2 Company Overview
12.10.3 Product Benchmarking
12.10.4 Strategic Outlook
12.11 Neurocrine Biosciences, Inc.
12.11.1 Company Snapshot
12.11.2 Company Overview
12.11.3 Financial Analysis
12.11.3.1 Net Revenue, 2017-2022
12.11.3.2 R&D, 2017-2022
12.11.4 Product Benchmarking
12.11.5 Strategic Outlook
12.12 Neurelis, Inc.
12.12.1 Company Snapshot
12.12.2 Company Overview
12.12.3 Product Benchmarking
12.12.4 Strategic Outlook
13 Conclusion and Recommendations
13.1 Concluding Remarks from Visiongain
13.2 Recommendations for Market Players
ページTOPに戻る
List of Tables/Graphs
List of Tables
Table 1 Epilepsy Therapeutics Market Snapshot, 2024 & 2034 (US$ million, CAGR %)
Table 2 Epilepsy Therapeutics Market Forecast by Region 2024-2034 (US$ Million, AGR%, CAGR%): "V" Shaped Recovery
Table 3 Epilepsy Therapeutics Market Forecast by Region 2024-2034 (US$ Million, AGR%, CAGR%): "U" Shaped Recovery
Table 4 Epilepsy Therapeutics Market Forecast by Region 2024-2034 (US$ Million, AGR%, CAGR%): "W" Shaped Recovery
Table 5 Epilepsy Therapeutics Market Forecast by Region 2024-2034 (US$ Million, AGR%, CAGR%): "L" Shaped Recovery
Table 6 Epilepsy Therapeutics Market Forecast by Drug Class, 2024-2034 (US$ Million, AGR%, CAGR%)
Table 7 First Generation Drugs Segment Market Forecast by Region, 2024-2034 (US$ Million, AGR%, CAGR%)
Table 8 Second Generation Drugs Segment Market Forecast by Region, 2024-2034 (US$ Million, AGR%, CAGR%)
Table 9 Third Generation Drugs Segment Market Forecast by Region, 2024-2034 (US$ Million, AGR%, CAGR%)
Table 10 Epilepsy Therapeutics Market Forecast by Distribution Channel, 2024-2034 (US$ Million, AGR%, CAGR%)
Table 11 Hospital Pharmacy Segment Market Forecast by Region, 2024-2034 (US$ Million, AGR%, CAGR%)
Table 12 Retail Pharmacy Segment Market Forecast by Region, 2024-2034 (US$ Million, AGR%, CAGR%)
Table 13 Online Pharmacy Segment Market Forecast by Region, 2024-2034 (US$ Million, AGR%, CAGR%)
Table 14 Epilepsy Therapeutics Market Forecast by Region, 2024-2034 (US$ Million, AGR%, CAGR%)
Table 15 North America Epilepsy Therapeutics Market Forecast by Country, 2024-2034 (US$ Million, AGR%, CAGR%)
Table 16 North America Epilepsy Therapeutics Market Forecast by Drug Class, 2024-2034 (US$ Million, AGR%, CAGR%)
Table 17 North America Epilepsy Therapeutics Market Forecast by Distribution Channel, 2024-2034 (US$ Million, AGR%, CAGR%)
Table 18 U.S. Epilepsy Therapeutics Market Forecast, 2024-2034 (US$ Million, AGR%, CAGR%)
Table 19 Canada Epilepsy Therapeutics Market Forecast, 2024-2034 (US$ Million, AGR%, CAGR%)
Table 20 Europe Epilepsy Therapeutics Market Forecast by Country, 2024-2034 (US$ Million, AGR%, CAGR %)
Table 21 Europe Epilepsy Therapeutics Market Forecast by Drug Class, 2024-2034 (US$ Million, AGR%, CAGR%)
Table 22 North America Epilepsy Therapeutics Market Forecast by Distribution Channel, 2024-2034 (US$ Million, AGR%, CAGR%)
Table 23 Germany Epilepsy Therapeutics Market Forecast, 2024-2034 (US$ Million, AGR%, CAGR%)
Table 24 France Epilepsy Therapeutics Market Forecast, 2024-2034 (US$ Million, AGR%, CAGR%)
Table 25 UK Epilepsy Therapeutics Market Forecast, 2024-2034 (US$ Million, AGR%, CAGR%)
Table 26 Italy Epilepsy Therapeutics Market Forecast, 2024-2034 (US$ Million, AGR%, CAGR%)
Table 27 Spain Epilepsy Therapeutics Market Forecast, 2024-2034 (US$ Million, AGR%, CAGR%)
Table 28 Sweden Epilepsy Therapeutics Market Forecast, 2024-2034 (US$ Million, AGR%, CAGR%)
Table 29 Switzerland Epilepsy Therapeutics Market Forecast, 2024-2034 (US$ Million, AGR%, CAGR%)
Table 30 Rest of Europe Epilepsy Therapeutics Market Forecast, 2024-2034 (US$ Million, AGR%, CAGR%)
Table 31 Asia Pacific Epilepsy Therapeutics Market Forecast by Country, 2024-2034 (US$ Million, AGR%, CAGR%)
Table 32 Asia Pacific Epilepsy Therapeutics Market Forecast by Drug Class, 2024-2034 (US$ Million, AGR%, CAGR%)
Table 33 Asia Pacific Epilepsy Therapeutics Market Forecast by Distribution Channel, 2024-2034 (US$ Million, AGR%, CAGR%)
Table 34 Japan Epilepsy Therapeutics Market Forecast, 2024-2034 (US$ Million, AGR%, CAGR%)
Table 35 China Epilepsy Therapeutics Market Forecast, 2024-2034 (US$ Million, AGR%, CAGR%)
Table 36 India Epilepsy Therapeutics Market Forecast, 2024-2034 (US$ Million, AGR%, CAGR%)
Table 37 Australia Epilepsy Therapeutics Market Forecast, 2024-2034 (US$ Million, AGR%, CAGR%)
Table 38 South Korea Epilepsy Therapeutics Market Forecast, 2024-2034 (US$ Million, AGR%, CAGR%)
Table 39 Singapore Epilepsy Therapeutics Market Forecast, 2024-2034 (US$ Million, AGR%, CAGR%)
Table 40 Taiwan Epilepsy Therapeutics Market Forecast, 2024-2034 (US$ Million, AGR%, CAGR%)
Table 41 Rest of Asia Pacific Epilepsy Therapeutics Market Forecast, 2024-2034 (US$ Million, AGR%, CAGR%)
Table 42 Latin America Epilepsy Therapeutics Market Forecast by Country, 2024-2034 (US$ Million, AGR%, CAGR%)
Table 43 Latin America Epilepsy Therapeutics Market Forecast by Drug Class, 2024-2034 (US$ Million, AGR%, CAGR%)
Table 44 Latin America Epilepsy Therapeutics Market Forecast by Distribution Channel, 2024-2034 (US$ Million, AGR%, CAGR%)
Table 45 Brazil Epilepsy Therapeutics Market Forecast, 2024-2034 (US$ Million, AGR%, CAGR%)
Table 46 Mexico Epilepsy Therapeutics Market Forecast, 2024-2034 (US$ Million, AGR%, CAGR%)
Table 47 Argentina Epilepsy Therapeutics Market Forecast, 2024-2034 (US$ Million, AGR%, CAGR%)
Table 48 Rest of Latin America Epilepsy Therapeutics Market Forecast, 2024-2034 (US$ Million, AGR%, CAGR%)
Table 49 MEA Epilepsy Therapeutics Market Forecast by Country, 2024-2034 (US$ Million, AGR%, CAGR%)
Table 50 MEA Epilepsy Therapeutics Market Forecast by Drug Class, 2024-2034 (US$ Million, AGR%, CAGR%)
Table 51 MEA Epilepsy Therapeutics Market Forecast by Distribution Channel, 2024-2034 (US$ Million, AGR%, CAGR%)
Table 52 GCC Epilepsy Therapeutics Market Forecast, 2024-2034 (US$ Million, AGR%, CAGR%)
Table 53 South Africa Epilepsy Therapeutics Market Forecast, 2024-2034 (US$ Million, AGR%, CAGR%)
Table 54 Rest of MEA Epilepsy Therapeutics Market Forecast, 2024-2034 (US$ Million, AGR%, CAGR%)
Table 55 Strategic Outlook
Table 56 Eisai, Inc. : Key Details, (CEO, HQ, Revenue, Founded, No. of Employees, Company Type, Website, Business Segment)
Table 57 Eisai, Inc.: Product Benchmarking
Table 58 Eisai, Inc.: Strategic Outlook
Table 59 GlaxoSmithKline (GSK): Key Details, (CEO, HQ, Revenue, Founded, No. of Employees, Company Type, Website, Business Segment)
Table 60 GlaxoSmithKline (GSK): Product Benchmarking
Table 61 GlaxoSmithKline (GSK): Strategic Outlook
Table 62 GW Pharma: Key Details, (CEO, HQ, Revenue, Founded, No. of Employees, Company Type, Website, Business Segment)
Table 63 GW Pharma : Product Benchmarking
Table 64 GW Pharma : Strategic Outlook
Table 65 Pfizer Inc: Key Details, (CEO, HQ, Revenue, Founded, No. of Employees, Company Type, Website, Business Segment)
Table 66 Pfizer Inc : Product Benchmarking
Table 67 Pfizer Inc: Strategic Outlook
Table 68 Sanofi: Key Details, (CEO, HQ, Revenue, Founded, No. of Employees, Company Type, Website, Business Segment)
Table 69 Sanofi: Product Benchmarking
Table 70 Sanofi: Strategic Outlook
Table 71 UCB S.A.: Key Details, (CEO, HQ, Revenue, Founded, No. of Employees, Company Type, Website, Business Segment)
Table 72 UCB S.A.: Product Benchmarking
Table 73 UCB S.A.: Strategic Outlook
Table 74 Novartis AG: Key Details, (CEO, HQ, Revenue, Founded, No. of Employees, Company Type, Website, Business Segment)
Table 75 Novartis AG: Product Benchmarking
Table 76 Novartis AG: Strategic Outlook
Table 77 Merck KGaA: Key Details, (CEO, HQ, Revenue, Founded, No. of Employees, Company Type, Website, Business Segment)
Table 78 Merck KGaA: Product Benchmarking
Table 79 Merck KGaA: Strategic Outlook
Table 80 Ovid Therapeutics : Key Details, (CEO, HQ, Revenue, Founded, No. of Employees, Company Type, Website, Business Segment)
Table 81 Ovid Therapeutics : Product Benchmarking
Table 82 Ovid Therapeutics: Strategic Outlook
Table 83 Praxis Precision Medicines: Key Details, (CEO, HQ, Revenue, Founded, No. of Employees, Company Type, Website, Business Segment)
Table 84 Praxis Precision Medicines: Product Benchmarking
Table 85 Praxis Precision Medicines: Strategic Outlook
Table 86 Neurocrine Biosciences, Inc.: Key Details, (CEO, HQ, Revenue, Founded, No. of Employees, Company Type, Website, Business Segment)
Table 87 Neurocrine Biosciences, Inc.: Product Benchmarking
Table 88 Neurocrine Biosciences, Inc.: Strategic Outlook
Table 89 Neurelis, Inc.: Key Details, (CEO, HQ, Revenue, Founded, No. of Employees, Company Type, Website, Business Segment)
Table 90 Neurelis, Inc.: Product Benchmarking
Table 91 Neurelis, Inc.: Strategic Outlook
List of Figures
Figure 1 Epilepsy Therapeutics Market Segmentation
Figure 2 Epilepsy Therapeutics Market by Drug Class: Market Attractiveness Index
Figure 3 Epilepsy Therapeutics Market by Distribution Channel: Market Attractiveness Index
Figure 4 Epilepsy Therapeutics Market Attractiveness Index by Region
Figure 5 Epilepsy Therapeutics Market: Market Dynamics
Figure 6 Epilepsy Therapeutics Market by Region, 2024-2034 (US$ Million, AGR %): “V” Shaped Recovery
Figure 7 Epilepsy Therapeutics Market by Region, 2024-2034 (US$ Million, AGR %): “U” Shaped Recovery
Figure 8 Epilepsy Therapeutics Market by Region, 2024-2034 (US$ Million, AGR %): “W” Shaped Recovery
Figure 9 Epilepsy Therapeutics Market by Region, 2024-2034 (US$ Million, AGR %): “L” Shaped Recovery
Figure 10 Epilepsy Therapeutics Market: Porter’s Five Forces Analysis
Figure 11 Epilepsy Therapeutics Market: PEST Analysis
Figure 12 Epilepsy Therapeutics Market by Drug Class: Market Attractiveness Index
Figure 13 Epilepsy Therapeutics Market Forecast by Drug Class, 2024-2034 (US$ Million, AGR %)
Figure 14 Epilepsy Therapeutics Market Share Forecast by Drug Class, 2024, 2029, 2034 (%)
Figure 15 First Generation Drugs Segment Market Forecast by Region, 2024-2034 (US$ Million, AGR %)
Figure 16 First Generation Drugs Segment Market Share Forecast by Region, 2024 & 2034 (%)
Figure 17 Second Generation Drugs Segment Market Forecast by Region, 2024-2034 (US$ Million, AGR %)
Figure 18 Second Generation Drugs Segment Market Share Forecast by Region, 2024 & 2034 (%)
Figure 19 Third Generation Drugs Segment Market Forecast by Region, 2024-2034 (US$ Million, AGR %)
Figure 20 Third Generation Drugs Segment Market Share Forecast by Region, 2024 & 2034 (%)
Figure 21 Epilepsy Therapeutics Market by Distribution Channel: Market Attractiveness Index
Figure 22 Epilepsy Therapeutics Market Forecast by Distribution Channel, 2024-2034 (US$ Million, AGR %)
Figure 23 Epilepsy Therapeutics Market Share Forecast by Distribution Channel, 2024, 2029, 2034 (%)
Figure 24 Hospital Pharmacy Segment Market Forecast by Region, 2024-2034 (US$ Million, AGR %)
Figure 25 Hospital Pharmacy Segment Market Share Forecast by Region, 2024 & 2034 (%)
Figure 26 Retail Pharmacy Segment Market Forecast by Region, 2024-2034 (US$ Million, AGR %)
Figure 27 Retail Pharmacy Segment Market Share Forecast by Region, 2024 & 2034 (%)
Figure 28 Online Pharmacy Segment Market Forecast by Region, 2024-2034 (US$ Million, AGR %)
Figure 29 Online Pharmacy Segment Market Share Forecast by Region, 2024 & 2034 (%)
Figure 30 Epilepsy Therapeutics Market Forecast by Region 2024 and 2034 (Revenue, CAGR%)
Figure 31 Epilepsy Therapeutics Market Share Forecast by Region 2024, 2029, 2034 (%)
Figure 32 Epilepsy Therapeutics Market by Region, 2024-2034 (US$ Million, AGR %)
Figure 33 North America Epilepsy Therapeutics Market Attractiveness Index
Figure 34 North America Epilepsy Therapeutics Market by Region, 2024, 2029 & 2034 (US$ Million)
Figure 35 North America Epilepsy Therapeutics Market Forecast by Country, 2024-2034 (US$ Million, AGR %)
Figure 36 North America Epilepsy Therapeutics Market Share Forecast by Country, 2024 & 2034 (%)
Figure 37 North America Epilepsy Therapeutics Market Forecast by Drug Class, 2024-2034 (US$ Million, AGR %)
Figure 38 North America Epilepsy Therapeutics Market Share Forecast by Drug Class, 2024 & 2034 (%)
Figure 39 North America Epilepsy Therapeutics Market Forecast by Distribution Channel, 2024-2034 (US$ Million, AGR %)
Figure 40 North America Epilepsy Therapeutics Market Share Forecast by Distribution Channel, 2024 & 2034 (%)
Figure 41 U.S. Epilepsy Therapeutics Market Forecast, 2024-2034 (US$ Million, AGR %)
Figure 42 Canada Epilepsy Therapeutics Market Forecast, 2024-2034 (US$ Million, AGR %)
Figure 43 Europe Epilepsy Therapeutics Market Attractiveness Index
Figure 44 Europe Epilepsy Therapeutics Market by Region, 2024, 2029 & 2034 (US$ Million)
Figure 45 Europe Epilepsy Therapeutics Market Forecast by Country, 2024-2034 (US$ Million, AGR %)
Figure 46 Europe Epilepsy Therapeutics Market Share Forecast by Country, 2024 & 2034 (%)
Figure 47 Europe Epilepsy Therapeutics Market Forecast by Drug Class, 2024-2034 (US$ Million, AGR %)
Figure 48 Europe Epilepsy Therapeutics Market Share Forecast by Drug Class, 2024 & 2034 (%)
Figure 49 Europe Epilepsy Therapeutics Market Forecast by Distribution Channel, 2024-2034 (US$ Million, AGR %)
Figure 50 Europe Epilepsy Therapeutics Market Share Forecast by Distribution Channel, 2024 & 2034 (%)
Figure 51 Germany Epilepsy Therapeutics Market Forecast, 2024-2034 (US$ Million, AGR %)
Figure 52 France Epilepsy Therapeutics Market Forecast, 2024-2034 (US$ Million, AGR %)
Figure 53 UK Epilepsy Therapeutics Market Forecast, 2024-2034 (US$ Million, AGR %)
Figure 54 Italy Epilepsy Therapeutics Market Forecast, 2024-2034 (US$ Million, AGR %)
Figure 55 Spain Epilepsy Therapeutics Market Forecast, 2024-2034 (US$ Million, AGR %)
Figure 56 Sweden Epilepsy Therapeutics Market Forecast, 2024-2034 (US$ Million, AGR %)
Figure 57 Switzerland Epilepsy Therapeutics Market Forecast, 2024-2034 (US$ Million, AGR %)
Figure 58 Rest of Europe Epilepsy Therapeutics Market Forecast, 2024-2034 (US$ Million, AGR %)
Figure 59 Asia Pacific Epilepsy Therapeutics Market Attractiveness Index
Figure 60 Asia Pacific Epilepsy Therapeutics Market by Region, 2024, 2029 & 2034 (US$ Million)
Figure 61 Asia Pacific Epilepsy Therapeutics Market Forecast by Country, 2024-2034 (US$ Million, AGR %)
Figure 62 Asia Pacific Epilepsy Therapeutics Market Share Forecast by Country, 2024 & 2034 (%)
Figure 63 Asia Pacific Epilepsy Therapeutics Market Forecast by Drug Class, 2024-2034 (US$ Million, AGR %)
Figure 64 Asia Pacific Epilepsy Therapeutics Market Share Forecast by Drug Class, 2024 & 2034 (%)
Figure 65 Asia Pacific Epilepsy Therapeutics Market Forecast by Distribution Channel, 2024-2034 (US$ Million, AGR %)
Figure 66 Asia Pacific Epilepsy Therapeutics Market Share Forecast by Distribution Channel, 2024 & 2034 (%)
Figure 67 Japan Epilepsy Therapeutics Market Forecast, 2024-2034 (US$ Million, AGR %)
Figure 68 China Epilepsy Therapeutics Market Forecast, 2024-2034 (US$ Million, AGR %)
Figure 69 India Epilepsy Therapeutics Market Forecast, 2024-2034 (US$ Million, AGR %)
Figure 70 Australia Epilepsy Therapeutics Market Forecast, 2024-2034 (US$ Million, AGR %)
Figure 71 South Korea Epilepsy Therapeutics Market Forecast, 2024-2034 (US$ Million, AGR %)
Figure 72 Singapore Epilepsy Therapeutics Market Forecast, 2024-2034 (US$ Million, AGR %)
Figure 73 Taiwan Epilepsy Therapeutics Market Forecast, 2024-2034 (US$ Million, AGR %)
Figure 74 Rest of Asia Pacific Epilepsy Therapeutics Market Forecast, 2024-2034 (US$ Million, AGR %)
Figure 75 Latin America Epilepsy Therapeutics Market Attractiveness Index
Figure 76 Latin America Epilepsy Therapeutics Market by Region, 2024, 2029 & 2034 (US$ Million)
Figure 77 Latin America Epilepsy Therapeutics Market Forecast by Country, 2024-2034 (US$ Million, AGR %)
Figure 78 Latin America Epilepsy Therapeutics Market Share Forecast by Country, 2024 & 2034 (%)
Figure 79 Latin America Epilepsy Therapeutics Market Forecast by Drug Class, 2024-2034 (US$ Million, AGR %)
Figure 80 Latin America Epilepsy Therapeutics Market Share Forecast by Drug Class, 2024 & 2034 (%)
Figure 81 Latin America Epilepsy Therapeutics Market Forecast by Distribution Channel, 2024-2034 (US$ Million, AGR %)
Figure 82 Latin America Epilepsy Therapeutics Market Share Forecast by Distribution Channel, 2024 & 2034 (%)
Figure 83 Brazil Epilepsy Therapeutics Market Forecast, 2024-2034 (US$ Million, AGR %)
Figure 84 Mexico Epilepsy Therapeutics Market Forecast, 2024-2034 (US$ Million, AGR %)
Figure 85 Argentina Epilepsy Therapeutics Market Forecast, 2024-2034 (US$ Million, AGR %)
Figure 86 Rest of Latin America Epilepsy Therapeutics Market Forecast, 2024-2034 (US$ Million, AGR %)
Figure 87 MEA Epilepsy Therapeutics Market Attractiveness Index
Figure 88 MEA Epilepsy Therapeutics Market by Region, 2024, 2029 & 2034 (US$ Million)
Figure 89 MEA Epilepsy Therapeutics Market Forecast by Country, 2024-2034 (US$ Million, AGR %)
Figure 90 MEA Epilepsy Therapeutics Market Share Forecast by Country, 2024 & 2034 (%)
Figure 91 MEA Epilepsy Therapeutics Market Forecast by Drug Class, 2024-2034 (US$ Million, AGR %)
Figure 92 MEA Epilepsy Therapeutics Market Share Forecast by Drug Class, 2024 & 2034 (%)
Figure 93 MEA Epilepsy Therapeutics Market Forecast by Distribution Channel, 2024-2034 (US$ Million, AGR %)
Figure 94 MEA Epilepsy Therapeutics Market Share Forecast by Distribution Channel, 2024 & 2034 (%)
Figure 95 GCC Epilepsy Therapeutics Market Forecast, 2024-2034 (US$ Million, AGR %)
Figure 96 South Africa Epilepsy Therapeutics Market Forecast, 2024-2034 (US$ Million, AGR %)
Figure 97 Rest of MEA Epilepsy Therapeutics Market Forecast, 2024-2034 (US$ Million, AGR %)
Figure 98 Eisai, Inc.: Net Revenue, 2017-2022 (US$ Million, AGR%)
Figure 99 Eisai, Inc.: Regional Market Shares, 2022
Figure 100 GlaxoSmithKline (GSK): Net Revenue, 2017-2022 (US$ Million, AGR%)
Figure 101 GlaxoSmithKline (GSK): R&D, 2017-2022 (US$ Million, AGR%)
Figure 102 GlaxoSmithKline (GSK): Regional Market Shares, 2022
Figure 103 Pfizer Inc: Net Revenue, 2017-2022 (US$ Million, AGR%)
Figure 104 Pfizer Inc: R&D, 2017-2022 (US$ Million, AGR%)
Figure 105 Pfizer Inc: Regional Market Shares, 2022
Figure 106 Sanofi: Net Revenue, 2017-2022 (US$ Million, AGR%)
Figure 107 Sanofi: R&D, 2017-2022 (US$ Million, AGR%)
Figure 108 Sanofi: Regional Market Shares, 2022
Figure 109 UCB S.A.: Net Revenue, 2017-2022 (US$ Million, AGR%)
Figure 110 UCB S.A.: R&D, 2017-2022 (US$ Million, AGR%)
Figure 111 UCB S.A.: Regional Market Shares, 2022
Figure 112 Novartis AG: Net Revenue, 2017-2022 (US$ Million, AGR%)
Figure 113 Novartis AG: R&D, 2017-2022 (US$ Million, AGR%)
Figure 114 Novartis AG: Regional Market Shares, 2022
Figure 115 Merck KGaA: Net Revenue, 2017-2022 (US$ Million, AGR%)
Figure 116 Merck KGaA: R&D, 2017-2022 (US$ Million, AGR%)
Figure 117 Merck KGaA: Regional Market Shares, 2022
Figure 118 Neurocrine Biosciences Inc.: Net Revenue, 2017-2022 (US$ Million, AGR%)
Figure 119 Neurocrine Biosciences Inc.: R&D, 2017-2022 (US$ Million, AGR%)
ページTOPに戻る
本レポートと同分野(中枢神経系作用薬)の最新刊レポート
Visiongain社のヘルスケアと医薬・化学品分野での最新刊レポート
本レポートと同じKEY WORD()の最新刊レポート
- 本レポートと同じKEY WORDの最新刊レポートはありません。
よくあるご質問
Visiongain社はどのような調査会社ですか?
英国の調査会社ヴィジョンゲイン社(Visiongain)は、通信とエネルギーのほか、自動車や化学・医薬品、金属など、広範な市場を対象に調査を行っています。自動車市場については、市場全般に関する調査のほ... もっと見る
調査レポートの納品までの日数はどの程度ですか?
在庫のあるものは速納となりますが、平均的には 3-4日と見て下さい。
但し、一部の調査レポートでは、発注を受けた段階で内容更新をして納品をする場合もあります。
発注をする前のお問合せをお願いします。
注文の手続きはどのようになっていますか?
1)お客様からの御問い合わせをいただきます。
2)見積書やサンプルの提示をいたします。
3)お客様指定、もしくは弊社の発注書をメール添付にて発送してください。
4)データリソース社からレポート発行元の調査会社へ納品手配します。
5) 調査会社からお客様へ納品されます。最近は、pdfにてのメール納品が大半です。
お支払方法の方法はどのようになっていますか?
納品と同時にデータリソース社よりお客様へ請求書(必要に応じて納品書も)を発送いたします。
お客様よりデータリソース社へ(通常は円払い)の御振り込みをお願いします。
請求書は、納品日の日付で発行しますので、翌月最終営業日までの当社指定口座への振込みをお願いします。振込み手数料は御社負担にてお願いします。
お客様の御支払い条件が60日以上の場合は御相談ください。
尚、初めてのお取引先や個人の場合、前払いをお願いすることもあります。ご了承のほど、お願いします。
データリソース社はどのような会社ですか?
当社は、世界各国の主要調査会社・レポート出版社と提携し、世界各国の市場調査レポートや技術動向レポートなどを日本国内の企業・公官庁及び教育研究機関に提供しております。
世界各国の「市場・技術・法規制などの」実情を調査・収集される時には、データリソース社にご相談ください。
お客様の御要望にあったデータや情報を抽出する為のレポート紹介や調査のアドバイスも致します。
|
|

