嫌気性消化(AD)市場レポート:2022-2032
Anaerobic Digestion (AD) Market Report 2022-2032
レポート詳細
嫌気性消化(AD)市場レポート 2022-2032 :本レポートは、新たな収益の柱を目指すリーディングカンパニーが、業界とその背景にあるダイナミクスをより深く理解する上で、非常に有益なも... もっと見る
※上記価格は部署ライセンス(Departmental licence)価格です。
その他の価格についてはデータリソースまでお問合せください。
日本語のページは自動翻訳を利用し作成しています。
実際のレポートは英文のみでご納品いたします。

|

|
サマリー
レポート詳細
嫌気性消化(AD)市場レポート 2022-2032:本レポートは、新たな収益の柱を目指すリーディングカンパニーが、業界とその背景にあるダイナミクスをより深く理解する上で、非常に有益なものとなるでしょう。また、異業種への進出や新地域での既存事業の拡大を目指す企業にとっても有用なレポートです。
嫌気性消化槽の運転と維持管理はよりシンプルに
消化器は、さまざまな温度条件下で機能するように設計されています。好中性および好熱性植物は、それぞれ86~100℃および122~140℃の温度で最もよく生育します。また、嫌気性微生物の種類によって、生育できる温度帯が異なります。好熱性嫌気性消化(AD)は、より高いレベルの病原菌の死滅が望まれる場合に頻繁に使用されます。「クラスAバイオソリッド」は、このような温度で製造することが可能です。クラスAバイオソリッドは、下水汚泥を脱水・加熱したもので、米国環境保護庁(EPA)の基準を満たし、陸上で制限なく利用できるものと定義されています。クラスAバイオソリッドは、堆肥や肥料として家庭菜園に販売したり、農場や菜園で合法的に肥料として使用することができる。好熱性消化器は、より早く原料を処理することができますが、コストが高くなり、運転も難しくなります。
固定価格買取制度、フィードインプレミアム、グリーン認証が嫌気性消化法発展の原動力に
バイオガスを精製して燃料として使用するためには、バイオガスの処理またはスクラビング(擦過処理)が必要である。バイオガスの微量成分として、原料に含まれる硫酸塩から発生する有害化学物質である硫化水素が排出される。米国環境保護庁や英ウェールズ環境庁などの国家環境執行機関は、ガス中の硫化水素のレベルに厳しい制限を設けており、ガス中の硫化水素レベルが高い場合、バイオガスを地域の許容レベルまで処理するには、ガススクラビングおよび洗浄装置(アミンガス処理など)が必要となる。一方、塩化第一鉄FeCl2を消化槽に添加することで、水素の発生を防ぐことができます。
マーケットリサーチレポートを購入する前に、どのような質問をすべきでしょうか?
- 嫌気性消化(AD)市場はどのように進化しているのか?
- 嫌気性消化(AD)市場の推進要因と抑制要因は何か?
- 嫌気性消化(AD)サブマーケットの各セグメントは予測期間中にどのように成長し、2032年にこれらのサブマーケットが占める収益はどの程度になるのでしょうか?
- 2022年から2032年にかけて、嫌気性消化(AD)サブマーケットごとの市場シェアはどのように推移するのでしょうか?
- 2022年から2032年にかけて、市場全体の主なドライバーは何でしょうか?
- 嫌気性消化(AD)の主要市場はマクロ経済のダイナミクスに概ね追随するのか、それとも個々の国内市場が他を凌駕するのか?
- 2032年までに各国市場のシェアはどのように変化し、どの地域が2032年に市場をリードするのか?
- 主要プレイヤーは誰か、また予測期間中の見通しは?
- これらのリーディング企業の嫌気性消化(AD)プロジェクトは?
- 2020年から2032年にかけて、業界はどのように進化するのか?現在および今後10年間に行われる嫌気性消化(AD)プロジェクトにはどのような意味があるのでしょうか?
- 嫌気性消化(AD)市場をさらに拡大するために、製品の商業化の必要性は高いか?
- 嫌気性消化(AD)市場はどこへ向かい、どのようにして市場の最前線にいることを確実にできるのか?
- 新製品やサービスラインに対する最適な投資オプションは何か?
- 企業を新たな成長軌道に乗せ、C-suiteに移行させるための重要な展望は何か?
これが嫌気性消化(AD)市場に現在、そして今後10年間、どのような影響を与えるかを知る必要があります。
- 261ページにわたる本レポートでは、131の表と154のグラフを独占的に提供します。
- このレポートでは、業界における主要な収益性の高い分野をハイライトしているため、今すぐターゲットを絞ることができます。
- 世界、地域、国別の売上高と成長率を詳細に分析しています。
- 競合他社が成功した主なトレンド、変化、収益予測をハイライトしています。
このレポートは、嫌気性消化(AD)市場が今後10年間で、COVID-19景気後退とバウンスの変化に沿って発展する方法を今日あなたに教えてくれます。この市場は、過去10年間のどの時点よりも今が重要なのです。
レポートでは、COVID-19のバリエーションや経済データなど、お客様の市場に特化した独自の情報をお届けしています。
2032年までの予測やその他の分析により、商業的な展望が見えてくる
- 2032年までの収益予測に加え、直近の実績、成長率、市場シェアもご覧いただけます。
- ビジネスの展望や展開など、独自の分析もご覧いただけます。
- 定性的分析(市場力学、促進要因、機会、阻害要因、課題など)、コスト構造、嫌気性消化(AD)価格上昇の影響、最近の開発状況をご覧いただけます。
本レポートでは、COVID-19が業界と貴社にどのような影響を与えるかについて、データ分析と貴重な洞察を掲載しています。本レポートでは、COVID-19の4つの回収パターンとその影響、すなわち「V」、「L」、「W」、「U」について論じています。
報告書の対象セグメント
支出別市場セグメント
- CAPEX
- OPEX
消化器タイプ別市場セグメント
- スタンドアローン型消化器
- 農場内消化器
- 共消化システム
原料別市場セグメント
- 農作物残渣
- 食品・飲料産業廃棄物
- 家庭からの有機性廃棄物
- フードサービス廃棄物
- 廃水固形物(汚泥)
エンドユース別市場セグメント
- 熱と電気を生産する(CHP)
- ボイラーや炉の燃料として消化槽を加熱する
- 電気を生産する
- 機械的動力の生成
- 圧縮して自動車用燃料に
- その他の最終用途
世界市場全体およびセグメントの収益予測に加え、4地域および20の主要国市場の収益予測も掲載しています。
北米
- アメリカ
- カナダ
- メキシコ
欧州
- ドイツ
- オランダ
- イギリス
- フランス
- その他の地域
アジア太平洋
- 中国
- 日本
- インド
- オーストラリア
- その他のアジア太平洋地域
中東・アフリカ
- トルコ
- サウジアラビア
- 南アフリカ共和国
- イスラエル
- その他の中東・アフリカ
南米
- ブラジル
- コロンビア
-その他の南米地域
嫌気性消化(AD)市場の主要企業のプロファイルと2022年から2032年まで、これらの企業の事業のこのセグメントに焦点を当てたものも含まれています。
主要企業と市場成長の可能性
・ 2G Energy GmbH
・ Anaergia Inc.
・ CGG
・ Covanta Energy Corporation
・ Harvest Power, Inc.
・ Host Holding B.V.
・ Organic Waste Systems (OWS), Inc.
・ PlanET Biogas Global
・ Schaumann BioEnergy GmbH
・ Siemens AG
・ Streisal GmbH
・ Waterleau Group NV
・ WELTEC BIOPOWER GmbH
嫌気性消化(AD)市場の世界全体の収益、金額ベースで2022年から2032年まで、市場は2022年に187億1600万米ドルを超えると、我々の仕事は計算しています。2032年まで力強い収益成長が予測される。本調査では、最も大きな可能性を秘めた企業を特定しています。彼らの能力、進歩、商業的展望を発見することで、一歩先を行くことができます。
嫌気性消化(AD)市場、2022年から2032年までのレポートは、どのようにあなたのお役に立ちますか?
253ページにわたる本レポートは、要約すると以下のような知識を提供します。
- 嫌気性消化(AD)市場の2032年までの収益予測、消化器タイプ、支出、原料、最終用途、企業規模を世界と地域レベルでそれぞれ予測 - 業界の展望を見出し、投資と収益に最も有利な場所を見つけることができます。
- 4つの地域と20の主要国市場の2032年までの収益予測 - 北米、欧州、アジア太平洋、LAMEAの嫌気性消化(AD)市場、2022年から2032年の市場予測をご覧いただけます。また、米国、カナダ、メキシコ、ブラジル、ドイツ、フランス、英国、中国、インド、日本、オーストラリアなど、著名な経済圏の市場も予測しています。
- 既存企業や市場参入を目指す企業の展望 - 嫌気性消化(AD)市場に関わる主要企業15社の企業プロファイルを含む、2022年から2032年までの予測。
定量的・定性的な分析と独自の予測をご覧いただけます。私たちのレポートだけが持つ情報を入手し、貴重なビジネスインテリジェンスを得ることができます。
他にはない情報
私たちの新しいレポートがあれば、知識の遅れを取り戻し、チャンスを逃す可能性が低くなります。私たちの研究が貴社の調査、分析、意思決定にどのように役立つかをご覧ください。Visiongainの研究は、嫌気性消化(AD)市場、2022年から2032年、市場をリードする企業のための商業分析を必要とするすべての人のためのものです。データ、トレンド、予測を見つけることができます。
ページTOPに戻る
目次
目次
1.レポートの概要
1.1 研究の目的
1.2 嫌気性消化市場の紹介
1.3 本レポートが提供するもの
1.4 本レポートを読むべき理由
1.5 本分析レポートが回答する主な質問には以下が含まれる。
1.6 本レポートは誰のためのものなのか?
1.7 方法論
1.7.1 市場の定義
1.7.2 市場評価・予測手法
1.7.3 データの検証
1.8 よくある質問と回答(FAQ)
1.9 関連するVisiongainレポート
1.10 Visiongainについて
2 エグゼクティブサマリー
3 プレミアムインサイト
3.1 地域別スナップショット。嫌気性消化の世界市場
3.2 消化器タイプ別セグメント市場魅力度指数
3.3 フィードストックセグメント3 フィードストックセグメント:市場魅力度指数
3.4 エンドユーザセグメント市場魅力度指標
4 グローバル市場のダイナミクス
4.1 世界市場の最新動向
4.2 市場の推進要因
4.2.1 低い建設費と少ない設置面積
4.2.2 操作が簡単
4.2.3 消化器からの低排出ガス
4.2.4 温室効果ガス排出の最小化
4.2.5 廃棄物からの代替エネルギー生成
4.2.6 埋立地からの有機物転換
4.3 市場の抑制要因
4.3.1 低い認知度
4.3.2 厳しい規制がない国もある
4.4 世界市場における機会
4.4.1 再生可能エネルギー資源の需要増加
4.4.2 現在使用されている様々な嫌気性消化器技術
4.4.3 農産物原料からのバイオガスの可能性
4.5 世界市場における課題
4.5.1 有機性固体廃棄物の管理
4.5.2 収集システムは、ADに使用される廃棄物の特性に大きな影響を与える
4.5.3 消化の前に、ほとんどの原料は前処理を必要とする
4.6 SWOT分析
4.7 ポーターのファイブフォースモデル
4.7.1 サプライヤーの交渉力 - 低い
4.7.2 バイヤーの交渉力 - 中程度
4.7.3 代替品の脅威 - 中程度
4.7.4 新規参入の脅威 - 中程度
4.7.5 既存競合企業間の競争力 - 高
4.8 COVID-19影響度分析
4.8.1 COVID-19のV字回復シナリオ分析
4.8.2 COVID-19のW字回復シナリオ分析
4.8.3 COVID-19のU字回復シナリオ分析
4.8.4 COVID-19のL字回復シナリオ分析
5 世界の嫌気性消化市場分析:支出タイプ別
5.1 主な調査結果
5.2 支出タイプ別成長展望
5.3 嫌気性消化の世界市場 支出タイプ別シェア(2022年&2032年)
5.4 支出タイプ別世界市場規模推計・予測
5.4.1 CAPEX
5.4.2 OPEX
6 世界の嫌気性消化市場分析:消化器タイプ別
6.1 主な調査結果
6.2 消化器タイプ別成長展望
6.3 嫌気性消化の世界市場 消化槽タイプ別シェア(2022年&2032年)
6.3.1 嫌気性消化の世界市場(消化槽タイプ別)
7 世界の嫌気性消化市場分析:原料別
7.1 主要な調査結果
7.2 フィードストックセグメントの成長展望
7.3 嫌気性消化の世界市場、原料別シェア(2022年&2032年)
7.3.1 世界の原料別市場規模の推定と予測
8 世界の嫌気性消化市場分析:エンドユース別
8.1 主な調査結果
8.2 エンドユーズセグメントの成長展望
8.3 嫌気性消化の世界市場規模、エンドユーザー別シェア(2022年&2032年)
8.3.1 最終用途別世界市場規模の推定と予測
9 世界の嫌気性消化市場分析:地域別
9.1 主な調査結果
9.2 地域別市場規模の推定と予測
10 北米の嫌気性消化市場分析
10.1 多様な有機物を原料とするバイオベース製品と再生可能エネルギーへの需要の高まり
10.2 バイオガスは農業イノベーションを促進するクリーンな代替エネルギー
10.3 北米嫌気性消化市場の魅力度指数
10.4 北米の嫌気性消化の国別市場、2022年、2027年、2032年(百万米ドル)
10.5 北米の嫌気性消化の市場予測:バイオガス発生量別
10.6 北米の嫌気性消化の市場規模予測・予測:支出タイプ別
10.7 北米の嫌気性消化の市場規模予測・予想:消化器タイプ別
10.8 北米の嫌気性消化の市場規模予測・原料別予測
10.9 北米嫌気性消化のエンドユーザー別市場規模予測・予想
10.10 北米嫌気性消化の国別市場規模予測・予測
10.11 米国の市場分析
10.11.1 米国には約2200のバイオガス生産設備がある
10.11.2 米国のバイオガス事業は巨大な成長ポテンシャルを秘めている
10.12 カナダの市場分析
10.12.1 カナダでは61の嫌気性消化またはバイオガスプラントが稼動中
10.12.2 カナダで稼働中のバイオガスプラントの数は約50%増加した
10.13 メキシコの市場分析
11 欧州の嫌気性消化市場分析
11.1 EU加盟国は、持続可能なエネルギー源の割合についてそれぞれ別の目標を持ち、その目標を達成するための戦略も異なる
11.2 欧州の嫌気性消化産業の規模は、緩やかに成長すると予想される
11.3 欧州では予測期間中、嫌気性消化技術の利点がその利用を促進する
11.4 欧州嫌気性消化市場の魅力度指数
11.5 欧州の嫌気性消化の国別市場、2022年、2027年、2032年 (百万米ドル)
11.6 ヨーロッパの嫌気性消化の市場予測:バイオガス発生量別
11.7 欧州嫌気性消化の支出タイプ別市場規模予測・予測
11.8 欧州嫌気性消化の市場規模予測・予測:消化器タイプ別
11.9 欧州嫌気性消化の原料別市場規模予測・予測
11.10 欧州嫌気性消化のエンドユーザー別市場規模予測・予測
11.11 ヨーロッパの嫌気性消化の国別市場規模予測・予測
11.12 ドイツの市場分析
11.12.1 ドイツ、バイオガスプラント9,527基で再生可能エネルギー発電の世界トップクラスに
11.13 フランスの市場分析
11.13.1 フランス。2つの新しいバイオガスプラント
11.14 イギリスの市場分析
11.15 オランダの市場分析
11.15.1 オランダは、大規模なバイオガスからバイオメタンへの変換プロジェクトを実施した世界でも数少ない国の一つである。
11.15.2 現在、オランダにはバイオガスとバイオメタンに関する重要な支援手段がある
11.15.3 オランダのバイオガス政策は非常に一貫している
11.16 残りのヨーロッパ市場分析
11.16.1 熱、電力、輸送のための持続可能な燃料としてのバイオガス
11.16.2 再生可能エネルギーに関するEU政策
12 アジア太平洋地域の嫌気性消化市場分析
12.1 嫌気性消化法バイオガスはアジア全域に分布している
12.2 アジア太平洋地域の嫌気性消化市場の魅力度指数
12.3 アジア太平洋地域の嫌気性消化の国別市場、2022年、2027年、2032年 (US$ mn)
12.4 アジア太平洋地域の嫌気性消化の市場予測:バイオガス発生量別
12.5 アジア太平洋地域の嫌気性消化の支出タイプ別市場規模の推定と予測
12.6 アジア太平洋地域の嫌気性消化の市場規模予測・予想:消化器タイプ別
12.7 アジア太平洋地域の嫌気性消化の市場規模予測・原料別予測
12.8 アジア太平洋地域の嫌気性消化市場のエンドユーザー別市場規模予測・予測
12.9 アジア太平洋地域の嫌気性消化の国別市場規模予測・予測
12.10 中国市場の分析
12.10.1 中央政府のバイオガスプラントへの投資補助金は、地域の経済成長度によって決定される
12.11 インド市場の分析
12.11.1 国家バイオガス・糞尿管理プログラム(NBMMP: National Biogas and Manure Management Programme)
12.12 日本市場の分析
12.12.1 日本は2050年までに温室効果ガス排出をゼロにする脱炭素型カーボンニュートラルを目指している
12.12.2 過去5年間、日本では再生可能エネルギー源の発電量シェアが着実に増加
12.13 オーストラリア市場分析
12.13.1 オーストラリア政府は、オーストラリア初のバイオメタンガス化プロジェクトを立ち上げた
12.14 その他のアジア太平洋地域の市場分析
12.14.1 ネパールのバイオガス支援プログラム
13 中東・アフリカの嫌気性消化の市場分析
13.1 中東・アフリカ地域の市場展望
13.1.1 中東では、バイオガス発電の未開発の膨大なポテンシャルがある
13.1.2 中東では、太陽光、風力、バイオ燃料など再生可能エネルギーのポテンシャルが高い
13.1.3 中東はバイオマスエネルギー開発の好位置にある
13.1.4 アフリカ市場概要
13.2 中東・アフリカの嫌気性消化市場の魅力度指数
13.3 中東・アフリカ嫌気性消化の国別市場、2022年、2027年、2032年 (US$ mn)
13.4 中東・アフリカの嫌気性消化の市場予測:バイオガス発生量別
13.5 中東・アフリカの嫌気性消化の支出タイプ別市場規模予測・予測
13.6 中東・アフリカの嫌気性消化の市場規模予測・予想:消化器タイプ別
13.7 中東・アフリカの嫌気性消化の市場規模推定・予測:原料別
13.8 中東・アフリカの嫌気性消化市場のエンドユーザー別市場規模予測・予想
13.9 中東・アフリカの嫌気性消化の国別市場規模予測・予想
13.10 トルコの市場分析
13.10.1 過去10年間、トルコのエネルギーミックスは驚異的な多様化を遂げた
13.11 サウジアラビアの市場分析
13.11.1 サウジアラビアは2030年までに再生可能エネルギーの50%を創出する
13.12 南アフリカの市場分析
13.12.1 主に有機廃棄物から生成されるエネルギーの利用に重点を置いた廃棄物-エネルギープロジェクト 南アフリカ
13.13 イスラエルの市場分析
13.13.1 バイオ燃料は消費者の生活向上と環境保全のために進化してきた
13.14 その他のMEA市場の分析
13.14.1 バイオガスと消化器は、さまざまな最終用途に利用される
14 南米の嫌気性消化市場分析
14.1.1 世界で最もダイナミックな再生可能エネルギー市場は南米にある
14.2 南米の嫌気性消化市場の魅力度指数
14.3 南米の嫌気性消化の国別市場、2022年、2027年&2032年 (US$ mn)
14.4 南米の嫌気性消化の市場予測:バイオガス発生量別
14.5 南米の嫌気性消化の市場規模予測・予測:支出タイプ別
14.6 南米の嫌気性消化の市場規模予測・予想:消化器タイプ別
14.7 南米の嫌気性消化の市場規模予測・原料別予測
14.8 南米の嫌気性消化市場のエンドユーザー別市場規模予測・予測
14.9 南米の嫌気性消化の国別市場規模予測・予想
14.10 ブラジルの市場分析
14.10.1 ブラジルのサトウキビバイオリファイナリーからのビナスは嫌気性消化のためにテストされた
14.10.2 ブラジルは、炭化水素、再生可能エネルギー、原子力をベースとした電力資源を有し、非常に多様な電力マトリックスを持つ。
14.10.3 ブラジルは2020年に400以上のバイオガスプラントが稼動し、前年比40%増となった
14.11 コロンビアの市場分析
14.11.1 コロンビアはエネルギー源としてのバイオマスの利用を最大化するためにいくつかの戦略を採用している
14.11.2 コロンビアでは、複数の機関が国のエネルギー政策に責任を負っている
14.12 その他の南米地域の市場分析
14.12.1 コスタリカは国内電力需要全体を満たすために再生可能エネルギー源を利用することで知られている
15 主要企業のプロフィール
15.1 2G Energy GmbH
15.1.1 会社概要
15.1.2 会社概要
15.1.3 財務分析
15.1.4 製品ベンチマーク
15.2 ハーベスト・パワー社
15.2.1 会社概要
15.2.2 会社概要
15.2.3 製品ベンチマーク
15.3 ホスト・ホールディング・ビー・ヴィ
15.3.1 企業スナップショット
15.3.2 会社概要
15.3.3 ベンチマーキング
15.3.4 戦略的な展望
15.4 コバンタ・エナジー・コーポレーション
15.4.1 企業スナップショット
15.4.2 会社概要
15.4.3 製品ベンチマーク
15.4.4 戦略的展望
15.5 ウォータールー
15.5.1 企業スナップショット
15.5.2 会社概要
15.5.3 製品ベンチマーク
15.5.4 戦略的展望
15.6 ウェルテックバイオパワー
15.6.1 企業スナップショット
15.6.2 会社概要
15.6.3 製品ベンチマーク
15.6.4 戦略的展望
15.7 オーガニック・ウェイスト・システムズ(OWS), Inc.
15.7.1 企業スナップショット
15.7.2 会社概要
15.7.3 製品ベンチマーク
15.7.4 戦略的展望
15.8 アナエルギア社
15.8.1 企業スナップショット
15.8.2 会社概要
15.8.3 財務分析
15.8.4 製品ベンチマーク
15.8.5 戦略的展望
15.9 CGG
15.9.1 企業スナップショット
15.9.2 会社概要
15.9.3 財務分析
15.9.4 製品ベンチマーク
15.9.5 戦略的展望
15.10 プラネットバイオガス・グローバル
15.10.1 企業スナップショット
15.10.2 会社概要
15.10.3 製品ベンチマーク
15.11 シーメンスAG
15.11.1 企業スナップショット
15.11.2 会社概要
15.11.3 財務分析
15.11.4 ベンチマーキング
15.11.5 戦略的な展望
15.12 シャウマンバイオエナジー社
15.12.1 企業スナップショット
15.12.2 会社概要
15.12.3 製品ベンチマーク
15.13 ストレイザル社
15.13.1 企業スナップショット
15.13.2 会社概要
15.13.3 ベンチマーキング
16 結論と提言
16.1 ビジョンゲイン社からの結論
16.1.1 アジアの国内バイオガスプロジェクトのスケールアップと市場開拓に向けた新たな取り組みが始まっている
16.1.2 近年、嫌気性消化技術は急速に進歩している
16.1.3 イギリスとEUは、世界中で多くの嫌気性消化プロジェクトに資金を提供している
16.1.4 数多くの廃棄物バイオガスプラントが既に稼動している
16.1.5 嫌気性消化は、多くの代謝プロセスを含む複雑な還元プロセスである
16.1.6 嫌気性消化システムの成功は、適切な原料の信頼性の高い高品質な供給にかかっている
表の一覧
Table 1 Global Anaerobic Digestion Market Snapshot, 2022 & 2032 (US$ million, CAGR %)
Table 2 Global Anaerobic Digestion (AD) Market Forecast, 2022-2032 (USD Mn, AGR (%), CAGR (%)) (V-Shaped Recovery Scenario)
Table 3 Global Anaerobic Digestion (AD) Market by Region, 2022-2032 (USD Mn, AGR (%), CAGR (%)) (V-Shaped Recovery Scenario)
Table 4 Global Anaerobic Digestion (AD) Market Forecast, 2022-2032 (USD Mn, AGR (%), CAGR (%)) (W-Shaped Recovery Scenario)
Table 5 Global Anaerobic Digestion (AD) Market by Region, 2022-2032 (USD Mn, AGR (%), CAGR (%)) (W-Shaped Recovery Scenario)
Table 6 Global Anaerobic Digestion (AD) Market Forecast, 2022-2032 (USD Mn, AGR (%), CAGR (%)) (U-Shaped Recovery Scenario)
Table 7 Global Anaerobic Digestion (AD) Market by Region, 2022-2032 (USD Mn, AGR (%), CAGR (%)) (U-Shaped Recovery Scenario)
Table 8 Global Anaerobic Digestion (AD) Market Forecast, 2022-2032 (USD Mn, AGR (%), CAGR (%)) (L-Shaped Recovery Scenario)
Table 9 Global Anaerobic Digestion (AD) Market by Region, 2022-2032 (USD Mn, AGR (%), CAGR (%)) (L-Shaped Recovery Scenario)
Table 10 Global Anaerobic Digestion Market Forecast by Spending, 2022-2032 (USD Mn, AGR (%), CAGR (%), Cumulative)
Table 11 Global Anaerobic Digestion Market Forecast by Spending Type, 2022-2032 (USD Mn, AGR (%), CAGR (%), Cumulative)
Table 12 Global Anaerobic Digestion Market by Digester Type, 2022-2032 (m3/day, AGR (%), CAGR (%), Cumulative)
Table 13 Global Anaerobic Digestion Market by Feedstock, 2022-2032 (m3/day, AGR (%), CAGR (%), Cumulative)
Table 14 Global Anaerobic Digestion Market by End-Use, 2022-2032 (m3/day, AGR (%), CAGR (%), Cumulative)
Table 15 Global Anaerobic Digestion Market by Region, 2022-2032 (USD Million, AGR (%), CAGR (%), Cumulative)
Table 16 North America Anaerobic Digestion Market Forecast by Biogas Generation, 2022-2032 (m3/day, AGR (%), CAGR (%), Cumulative)
Table 17 North America Anaerobic Digestion Market Forecast by Spending, 2022-2032 (USD Mn, AGR (%), CAGR (%), Cumulative)
Table 18 North America Anaerobic Digestion Market Forecast by Spending Type, 2022-2032 (USD Mn, AGR (%), CAGR (%), Cumulative)
Table 19 North America Anaerobic Digestion Market by Digester Type, 2022-2032 (m3/day, AGR (%), CAGR (%), Cumulative)
Table 20 North America Anaerobic Digestion Market by Feedstock, 2022-2032 (m3/day, AGR (%), CAGR (%), Cumulative)
Table 21 North America Anaerobic Digestion Market by End-Use, 2022-2032 (m3/day, AGR (%), CAGR (%), Cumulative)
Table 22 North America Anaerobic Digestion Market by Country, 2022-2032 (m3/day, AGR (%), CAGR (%), Cumulative)
Table 23 US Anaerobic Digestion (AD) Market by Value, 2022-2032 (USD Mn, AGR (%), CAGR (%))
Table 24 US Anaerobic Digestion (AD) Market by Value, 2022-2032 (m3/day, AGR (%), CAGR (%))
Table 25 Canada Anaerobic Digestion (AD) Market by Value, 2022-2032 (USD Mn, AGR (%), CAGR (%))
Table 26 Canada Anaerobic Digestion (AD) Market by Value, 2022-2032 (m3/day, AGR (%), CAGR (%))
Table 27 Mexico Anaerobic Digestion (AD) Market by Value, 2022-2032 (USD Mn, AGR (%), CAGR (%))
Table 28 Mexico Anaerobic Digestion (AD) Market by Value, 2022-2032 (m3/day, AGR (%), CAGR (%))
Table 29 Europe Anaerobic Digestion (AD) Market by Region, 2022-2032 (USD Million, AGR (%), CAGR (%), Cumulative)
Table 30 Europe Anaerobic Digestion (AD) Market Forecast by Biogas Generation, 2022-2032 (m3/day, AGR (%), CAGR (%), Cumulative)
Table 31 Europe Anaerobic Digestion (AD) Market Forecast by Spending, 2022-2032 (USD Mn, AGR (%), CAGR (%), Cumulative)
Table 32 Europe Anaerobic Digestion (AD) Market Forecast by Spending Type, 2022-2032 (USD Mn, AGR (%), CAGR (%), Cumulative)
Table 33 Europe Anaerobic Digestion (AD) Market by Digester Type, 2022-2032 (m3/day, AGR (%), CAGR (%), Cumulative)
Table 34 Europe Anaerobic Digestion (AD) Market by Feedstock, 2022-2032 (m3/day, AGR (%), CAGR (%), Cumulative)
Table 35 Europe Anaerobic Digestion (AD) Market by End-Use, 2022-2032 (m3/day, AGR (%), CAGR (%), Cumulative)
Table 36 Europe Anaerobic Digestion (AD) Market by Country, 2022-2032 (m3/day, AGR (%), CAGR (%), Cumulative)
Table 37 Germany Anaerobic Digestion (AD) Market by Value, 2022-2032 (USD Mn, AGR (%), CAGR (%))
Table 38 Germany Anaerobic Digestion (AD) Market by Value, 2022-2032 (m3/day, AGR (%), CAGR (%))
Table 39 France Anaerobic Digestion (AD) Market by Value, 2022-2032 (USD Mn, AGR (%), CAGR (%))
Table 40 France Anaerobic Digestion (AD) Market by Value, 2022-2032 (m3/day, AGR (%), CAGR (%))
Table 41 UK Anaerobic Digestion (AD) Market by Value, 2022-2032 (USD Mn, AGR (%), CAGR (%))
Table 42 UK Anaerobic Digestion (AD) Market by Value, 2022-2032 (m3/day, AGR (%), CAGR (%))
Table 43 Netherlands Anaerobic Digestion (AD) Market by Value, 2022-2032 (USD Mn, AGR (%), CAGR (%))
Table 44 Netherlands Anaerobic Digestion (AD) Market by Value, 2022-2032 (m3/day, AGR (%), CAGR (%))
Table 45 Rest of Europe Anaerobic Digestion (AD) Market by Value, 2022-2032 (USD Mn, AGR (%), CAGR (%))
Table 46 Rest of Europe Anaerobic Digestion (AD) Market by Value, 2022-2032 (m3/day, AGR (%), CAGR (%))
Table 47 Asia-Pacific Anaerobic Digestion (AD) Market by Region, 2022-2032 (USD Million, AGR (%), CAGR (%), Cumulative)
Table 48 Asia-Pacific Anaerobic Digestion (AD) Market Forecast by Biogas Generation, 2022-2032 (m3/day, AGR (%), CAGR (%), Cumulative)
Table 49 Asia-Pacific Anaerobic Digestion (AD) Market Forecast by Spending, 2022-2032 (USD Mn, AGR (%), CAGR (%), Cumulative)
Table 50 Asia-Pacific Anaerobic Digestion (AD) Market Forecast by Spending Type, 2022-2032 (USD Mn, AGR (%), CAGR (%), Cumulative)
Table 51 Asia-Pacific Anaerobic Digestion (AD) Market by Digester Type, 2022-2032 (m3/day, AGR (%), CAGR (%), Cumulative)
Table 52 Asia-Pacific Anaerobic Digestion (AD) Market by Feedstock, 2022-2032 (m3/day, AGR (%), CAGR (%), Cumulative)
Table 53 Asia-Pacific Anaerobic Digestion (AD) Market by End-Use, 2022-2032 (m3/day, AGR (%), CAGR (%), Cumulative)
Table 54 Asia-Pacific Anaerobic Digestion (AD) Market by Country, 2022-2032 (m3/day, AGR (%), CAGR (%), Cumulative)
Table 55 China Anaerobic Digestion (AD) Market by Value, 2022-2032 (USD Mn, AGR (%), CAGR (%))
Table 56 China Anaerobic Digestion (AD) Market by Value, 2022-2032 (m3/day, AGR (%), CAGR (%))
Table 57 India Anaerobic Digestion (AD) Market by Value, 2022-2032 (USD Mn, AGR (%), CAGR (%))
Table 58 India Anaerobic Digestion (AD) Market by Value, 2022-2032 (m3/day, AGR (%), CAGR (%))
Table 59 Japan Anaerobic Digestion (AD) Market by Value, 2022-2032 (USD Mn, AGR (%), CAGR (%))
Table 60 Japan Anaerobic Digestion (AD) Market by Value, 2022-2032 (m3/day, AGR (%), CAGR (%))
Table 61 Australia Anaerobic Digestion (AD) Market by Value, 2022-2032 (USD Mn, AGR (%), CAGR (%))
Table 62 Australia Anaerobic Digestion (AD) Market by Value, 2022-2032 (m3/day, AGR (%), CAGR (%))
Table 63 Rest of Asia-Pacific Anaerobic Digestion (AD) Market by Value, 2022-2032 (USD Mn, AGR (%), CAGR (%))
Table 64 Rest of Asia-Pacific Anaerobic Digestion (AD) Market by Value, 2022-2032 (m3/day, AGR (%), CAGR (%))
Table 65 Middle East & Africa Anaerobic Digestion (AD) Market by Region, 2022-2032 (USD Million, AGR (%), CAGR (%), Cumulative)
Table 66 Middle East & Africa Anaerobic Digestion (AD) Market Forecast by Biogas Generation, 2022-2032 (m3/day, AGR (%), CAGR (%), Cumulative)
Table 67 Middle East & Africa Anaerobic Digestion (AD) Market Forecast by Spending, 2022-2032 (USD Mn, AGR (%), CAGR (%), Cumulative)
Table 68 Middle East & Africa Anaerobic Digestion (AD) Market Forecast by Spending Type, 2022-2032 (USD Mn, AGR (%), CAGR (%), Cumulative)
Table 69 Middle East & Africa Anaerobic Digestion (AD) Market by Digester Type, 2022-2032 (m3/day, AGR (%), CAGR (%), Cumulative)
Table 70 Middle East & Africa Anaerobic Digestion (AD) Market by Feedstock, 2022-2032 (m3/day, AGR (%), CAGR (%), Cumulative)
Table 71 Middle East & Africa Anaerobic Digestion (AD) Market by End-Use, 2022-2032 (m3/day, AGR (%), CAGR (%), Cumulative)
Table 72 Middle East & Africa Anaerobic Digestion (AD) Market by Country, 2022-2032 (m3/day, AGR (%), CAGR (%), Cumulative)
Table 73 Turkey Anaerobic Digestion (AD) Market by Value, 2022-2032 (USD Mn, AGR (%), CAGR (%))
Table 74 Turkey Anaerobic Digestion (AD) Market by Value, 2022-2032 (m3/day, AGR (%), CAGR (%))
Table 75 Saudi Arabia Anaerobic Digestion (AD) Market by Value, 2022-2032 (USD Mn, AGR (%), CAGR (%))
Table 76 Saudi Arabia Anaerobic Digestion (AD) Market by Value, 2022-2032 (m3/day, AGR (%), CAGR (%))
Table 77 South Africa Anaerobic Digestion (AD) Market by Value, 2022-2032 (USD Mn, AGR (%), CAGR (%))
Table 78 South Africa Anaerobic Digestion (AD) Market by Value, 2022-2032 (m3/day, AGR (%), CAGR (%))
Table 79 Israel Anaerobic Digestion (AD) Market by Value, 2022-2032 (USD Mn, AGR (%), CAGR (%))
Table 80 Israel Anaerobic Digestion (AD) Market by Value, 2022-2032 (m3/day, AGR (%), CAGR (%))
Table 81 Rest of MEA Anaerobic Digestion (AD) Market by Value, 2022-2032 (USD Mn, AGR (%), CAGR (%))
Table 82 Rest of MEA Anaerobic Digestion (AD) Market by Value, 2022-2032 (m3/day, AGR (%), CAGR (%))
Table 83 South America Anaerobic Digestion (AD) Market Forecast by Biogas Generation, 2022-2032 (m3/day, AGR (%), CAGR (%), Cumulative)
Table 84 South America Anaerobic Digestion (AD) Market Forecast by Spending, 2022-2032 (USD Mn, AGR (%), CAGR (%), Cumulative)
Table 85 South America Anaerobic Digestion (AD) Market Forecast by Spending Type, 2022-2032 (USD Mn, AGR (%), CAGR (%), Cumulative)
Table 86 South America Anaerobic Digestion (AD) Market by Digester Type, 2022-2032 (m3/day, AGR (%), CAGR (%), Cumulative)
Table 87 South America Anaerobic Digestion (AD) Market by Feedstock, 2022-2032 (m3/day, AGR (%), CAGR (%), Cumulative)
Table 88 South America Anaerobic Digestion (AD) Market by End-Use, 2022-2032 (m3/day, AGR (%), CAGR (%), Cumulative)
Table 89 South America Anaerobic Digestion (AD) Market by Country, 2022-2032 (m3/day, AGR (%), CAGR (%), Cumulative)
Table 90 Brazil Anaerobic Digestion (AD) Market by Value, 2022-2032 (USD Mn, AGR (%), CAGR (%))
Table 91 Brazil Anaerobic Digestion (AD) Market by Value, 2022-2032 (m3/day, AGR (%), CAGR (%))
Table 92 Colombia Anaerobic Digestion (AD) Market by Value, 2022-2032 (USD Mn, AGR (%), CAGR (%))
Table 93 Colombia Anaerobic Digestion (AD) Market by Value, 2022-2032 (m3/day, AGR (%), CAGR (%))
Table 94 Rest of South America Anaerobic Digestion (AD) Market by Value, 2022-2032 (USD Mn, AGR (%), CAGR (%))
Table 95 Rest of South America Anaerobic Digestion (AD) Market by Value, 2022-2032 (m3/day, AGR (%), CAGR (%))
Table 96 2G Energie: Key Details, (CEO, HQ, Revenue, Founded, No. of Employees, Company Type, Website, Business Segment)
Table 97 2G Energy : Product Benchmarking
Table 98 Harvest Power, Inc: Key Details, (CEO, HQ, Revenue, Founded, No. of Employees, Company Type, Website, Business Segment)
Table 99 Harvest Power, Inc: Product Benchmarking
Table 100 Host Holding : Key Details, (CEO, HQ, Revenue, Founded, No. of Employees, Company Type, Website, Business Segment)
Table 101 Host Holding: Product Benchmarking
Table 102 Host Holding: Strategic Outlook
Table 103 Covanta: Key Details, (CEO, HQ, Revenue, Founded, No. of Employees, Company Type, Website, Business Segment)
Table 104 Covanta: Product Benchmarking
Table 105 Covanta: Strategic Outlook
Table 106 Waterleau NV: Key Details, (CEO, HQ, Revenue, Founded, No. of Employees, Company Type, Website, Business Segment)
Table 107 Waterleau NV: Product Benchmarking
Table 108 Waterleau NV: Strategic Outlook
Table 109 WELTEC: Key Details, (CEO, HQ, Revenue, Founded, No. of Employees, Company Type, Website, Business Segment)
Table 110 WELTEC: Product Benchmarking
Table 111 WELTEC: Strategic Outlook
Table 112 OWS: Key Details, (CEO, HQ, Revenue, Founded, No. of Employees, Company Type, Website, Business Segment)
Table 113 OWS: Product Benchmarking
Table 114 OWS: Strategic Outlook
Table 115 Anaergia: Key Details, (CEO, HQ, Revenue, Founded, No. of Employees, Company Type, Website, Business Segment)
Table 116 Anaergia: Product Benchmarking
Table 117 Anaergia: Strategic Outlook
Table 118 CGG: Key Details, (CEO, HQ, Revenue, Founded, No. of Employees, Company Type, Website, Business Segment)
Table 119 CGG: Product Benchmarking
Table 120 CGG: Strategic Outlook
Table 121 PlanET: Key Details, (CEO, HQ, Revenue, Founded, No. of Employees, Company Type, Website, Business Segment)
Table 122 PlanET: Product Benchmarking
Table 123 Siemens AG: Key Details, (CEO, HQ, Revenue, Founded, No. of Employees, Company Type, Website, Business Segment)
Table 124 Siemens AG: Product Benchmarking
Table 125 Siemens AG: Strategic Outlook
Table 126 Schaumann BioEnergy: Key Details, (CEO, HQ, Revenue, Founded, No. of Employees, Company Type, Website, Business Segment)
Table 127 Schaumann BioEnergy: Product Benchmarking
Table 128 Streisal: Key Details, (CEO, HQ, Revenue, Founded, No. of Employees, Company Type, Website, Business Segment)
Table 129 Streisal: Product Benchmarking
図の一覧
Figure 1 Global Anaerobic Digestion Market Segmentation
Figure 2 Global Anaerobic Digestion Market Forecast by Region: Market Attractiveness Index
Figure 3 Global Anaerobic Digestion Market by Digester Type: Market Attractiveness Index
Figure 4 Global Anaerobic Digestion Market by Feedstock: Market Attractiveness Index
Figure 5 Global Anaerobic Digestion Market by End-users: Market Attractiveness Index
Figure 6 Global Anaerobic Digestion (AD) Market Forecast, 2022-2032 (USD Mn, AGR (%)) (V-Shaped Recovery Scenario)
Figure 7 Global Anaerobic Digestion (AD) Market Forecast by Region, 2022-2032 (USD Mn, AGR (%)) (V-Shaped Recovery Scenario)
Figure 8 Global Anaerobic Digestion (AD) Market Forecast, 2022-2032 (USD Mn, AGR (%)) (W-Shaped Recovery Scenario)
Figure 9 Global Anaerobic Digestion (AD) Market Forecast by Region, 2022-2032 (USD Mn, AGR (%)) (W-Shaped Recovery Scenario)
Figure 10 Global Anaerobic Digestion (AD) Market Forecast, 2022-2032 (USD Mn, AGR (%)) (U-Shaped Recovery Scenario)
Figure 11 Global Anaerobic Digestion (AD) Market Forecast by Region, 2022-2032 (USD Mn, AGR (%)) (U-Shaped Recovery Scenario)
Figure 12 Global Anaerobic Digestion (AD) Market Forecast by Region, 2022-2032 (USD Mn, AGR (%)) (L-Shaped Recovery Scenario)
Figure 13 Global Anaerobic Digestion (AD) Market Forecast by Region, 2022-2032 (USD Mn, AGR (%)) (L-Shaped Recovery Scenario)
Figure 1 Global Anaerobic Digestion Market Forecast by Spending 2022, 2027, 2032 (Revenue, CAGR%)
Figure 2 Global Anaerobic Digestion Market Share Forecast by Spending Type, 2022, 2032 (%)
Figure 3 Global Anaerobic Digestion Market Forecast by Spending, 2022-2032 (USD Mn, AGR (%), Cumulative)
Figure 4 Global Anaerobic Digestion Market Forecast by Spending Type, 2022-2032 (USD Mn, AGR (%), Cumulative)
Figure 5 Global Anaerobic Digestion Market Forecast by Digester Type 2022, 2027, 2032 (Revenue, CAGR%)
Figure 6 Global Anaerobic Digestion Market Share Forecast by Digester Type, 2022, 2032 (%)
Figure 7 Global Anaerobic Digestion Market by Digester Type, 2022-2032 (m3/day,AGR (%), Cumulative)
Figure 8 Global Anaerobic Digestion Market Forecast by Feedstock 2022, 2027, 2032 (Revenue, CAGR%)
Figure 9 Global Anaerobic Digestion Market Share Forecast by Feedstock, 2022, 2032 (%)
Figure 10 Global Anaerobic Digestion Market by Feedstock, 2022-2032 (m3/day, AGR (%), Cumulative)
Figure 11 Global Anaerobic Digestion Market Forecast by End-Use 2022, 2027, 2032 (Revenue, CAGR%)
Figure 12 Global Anaerobic Digestion Market Share Forecast by End-Use, 2022, 2032 (%)
Figure 13 Global Anaerobic Digestion Market by End-Use, 2022-2032 (m3/day, AGR (%), Cumulative)
Figure 14 Global Anaerobic Digestion Market Forecast by Region 2022, 2027, 2032 (Revenue, CAGR%)
Figure 15 Global Anaerobic Digestion Market Share Forecast by Region 2022, 2027, 2032(%)
Figure 16 Global Anaerobic Digestion Market by Region, 2022-2032 (USD Million, AGR (%), Cumulative)
Figure 17 North America Anaerobic Digestion Market Attractiveness Index
Figure 18 North America Anaerobic Digestion Market by Region, 2022, 2027 & 2032 (US$ million)
Figure 19 North America Anaerobic Digestion Market Forecast by Biogas Generation, 2022-2032 (m3/day, AGR (%), Cumulative)
Figure 20 North America Anaerobic Digestion Market Forecast by Spending, 2022-2032 (USD Mn, AGR (%), Cumulative)
Figure 21 North America Anaerobic Digestion Market Forecast by Spending Type, 2022-2032 (USD Mn, AGR (%), Cumulative)
Figure 22 North America Anaerobic Digestion Market Share Forecast by Spending Type, 2022 & 2032 (%)
Figure 23 North America Anaerobic Digestion Market by Digester Type, 2022-2032 (m3/day, AGR (%), Cumulative)
Figure 24 North America Anaerobic Digestion Market Share Forecast by Digester Type, 2022 & 2032 (%)
Figure 25 North America Anaerobic Digestion Market by Feedstock, 2022-2032 (m3/day, AGR (%), Cumulative
Figure 26 North America Anaerobic Digestion Market Share Forecast by Feedstock, 2022 & 2032 (%)
Figure 27 North America Anaerobic Digestion Market by End-Use, 2022-2032 (m3/day, AGR (%), Cumulative)
Figure 28 North America Anaerobic Digestion Market Share Forecast by End-users, 2022 & 2032 (%)
Figure 29 North America Anaerobic Digestion Market by Country, 2022-2032 (m3/day, AGR (%), Cumulative)
Figure 30 North America Anaerobic Digestion Market Share Forecast by Country, 2022 & 2032 (%)
Figure 31 US Anaerobic Digestion (AD) Market by Value, 2022-2032 (USD Mn, AGR (%))
Figure 32 US Anaerobic Digestion (AD) Market by Value, 2022-2032 (m3/day, AGR (%))
Figure 33 Canada Anaerobic Digestion (AD) Market by Value, 2022-2032 (USD Mn, AGR (%))
Figure 34 Canada Anaerobic Digestion (AD) Market by Value, 2022-2032 (m3/day, AGR (%))
Figure 35 Mexico Anaerobic Digestion (AD) Market by Value, 2022-2032 (USD Mn, AGR (%))
Figure 36 Mexico Anaerobic Digestion (AD) Market by Value, 2022-2032 (m3/day, AGR (%))
Figure 37 Europe Anaerobic Digestion (AD) Market by Region, 2022-2032 (USD Million, AGR (%)), Cumulative)
Figure 38 Europe Anaerobic Digestion Market Attractiveness Index
Figure 39 Europe Anaerobic Digestion Market by Region, 2022, 2027 & 2032 (US$ million)
Figure 40 Europe Anaerobic Digestion (AD) Market Forecast by Biogas Generation, 2022-2032 (m3/day, AGR (%)), Cumulative)
Figure 41 Europe Anaerobic Digestion (AD) Market Forecast by Spending, 2022-2032 (USD Mn, AGR (%)), Cumulative)
Figure 42 Europe Anaerobic Digestion (AD) Market Forecast by Spending Type, 2022-2032 (USD Mn, AGR (%)), Cumulative)
Figure 43 Europe Anaerobic Digestion Market Share Forecast by Spending Type, 2022 & 2032 (%)
Figure 44 Europe Anaerobic Digestion (AD) Market by Digester Type, 2022-2032 (m3/day, AGR (%)), Cumulative)
Figure 45 Europe Anaerobic Digestion Market Share Forecast by Digester Type, 2022 & 2032 (%)
Figure 46 Europe Anaerobic Digestion (AD) Market by Feedstock, 2022-2032 (m3/day, AGR (%)), Cumulative)
Figure 47 Europe Anaerobic Digestion Market Share Forecast by Feedstock, 2022 & 2032 (%)
Figure 48 Europe Anaerobic Digestion (AD) Market by End-Use, 2022-2032 (m3/day, AGR (%)), Cumulative)
Figure 49 Europe Anaerobic Digestion Market Share Forecast by End-users, 2022 & 2032 (%)
Figure 50 Europe Anaerobic Digestion (AD) Market by Country, 2022-2032 (m3/day, AGR (%)), Cumulative)
Figure 51 Europe Anaerobic Digestion Market Share Forecast by Country, 2022 & 2032 (%)
Figure 52 Germany Anaerobic Digestion (AD) Market by Value, 2022-2032 (USD Mn, AGR (%))
Figure 53 Germany Anaerobic Digestion (AD) Market by Value, 2022-2032 (m3/day, AGR (%))
Figure 54 France Anaerobic Digestion (AD) Market by Value, 2022-2032 (USD Mn, AGR (%))
Figure 55 France Anaerobic Digestion (AD) Market by Value, 2022-2032 (m3/day, AGR (%))
Figure 56 UK Anaerobic Digestion (AD) Market by Value, 2022-2032 (USD Mn, AGR (%))
Figure 57 UK Anaerobic Digestion (AD) Market by Value, 2022-2032 (m3/day, AGR (%))
Figure 58 Netherlands Anaerobic Digestion (AD) Market by Value, 2022-2032 (USD Mn, AGR (%))
Figure 59 Netherlands Anaerobic Digestion (AD) Market by Value, 2022-2032 (m3/day, AGR (%))
Figure 60 Rest of Europe Anaerobic Digestion (AD) Market by Value, 2022-2032 (USD Mn, AGR (%))
Figure 61 Rest of Europe Anaerobic Digestion (AD) Market by Value, 2022-2032 (m3/day, AGR (%))
Figure 62 Asia-Pacific Anaerobic Digestion (AD) Market by Region, 2022-2032 (USD Million, AGR (%)), Cumulative)
Figure 63 Asia-Pacific Anaerobic Digestion Market Attractiveness Index
Figure 64 Asia-Pacific Anaerobic Digestion Market by Region, 2022, 2027 & 2032 (US$ million)
Figure 65 Asia-Pacific Anaerobic Digestion (AD) Market Forecast by Biogas Generation, 2022-2032 (m3/day, AGR (%), Cumulative)
Figure 66 Asia-Pacific Anaerobic Digestion (AD) Market Forecast by Spending, 2022-2032 (USD Mn, AGR (%),Cumulative)
Figure 67 Asia-Pacific Anaerobic Digestion (AD) Market Forecast by Spending Type, 2022-2032 (USD Mn, AGR (%), Cumulative)
Figure 68 Asia-Pacific Anaerobic Digestion Market Share Forecast by Spending Type, 2022 & 2032 (%)
Figure 69 Asia-Pacific Anaerobic Digestion (AD) Market by Digester Type, 2022-2032 (m3/day, AGR (%), Cumulative)
Figure 70 Asia-Pacific Anaerobic Digestion Market Share Forecast by Digester Type, 2022 & 2032 (%)
Figure 71 Asia-Pacific Anaerobic Digestion (AD) Market by Feedstock, 2022-2032 (m3/day, AGR (%), Cumulative)
Figure 72 Asia-Pacific Anaerobic Digestion Market Share Forecast by Feedstock, 2022 & 2032 (%)
Figure 73 Asia-Pacific Anaerobic Digestion (AD) Market by End-Use, 2022-2032 (m3/day, AGR (%), Cumulative)
Figure 74 Asia-Pacific Anaerobic Digestion Market Share Forecast by End-users, 2022 & 2032 (%)
Figure 75 Asia-Pacific Anaerobic Digestion (AD) Market by Country, 2022-2032 (m3/day, AGR (%), Cumulative)
Figure 76 Asia-Pacific Anaerobic Digestion Market Share Forecast by Country, 2022 & 2032 (%)
Figure 77 China Anaerobic Digestion (AD) Market by Value, 2022-2032 (USD Mn, AGR (%))
Figure 78 China Anaerobic Digestion (AD) Market by Value, 2022-2032 (m3/day, AGR (%))
Figure 79 India Anaerobic Digestion (AD) Market by Value, 2022-2032 (USD Mn, AGR (%))
Figure 80 India Anaerobic Digestion (AD) Market by Value, 2022-2032 (m3/day, AGR (%))
Figure 81 Japan Anaerobic Digestion (AD) Market by Value, 2022-2032 (USD Mn, AGR (%))
Figure 82 Japan Anaerobic Digestion (AD) Market by Value, 2022-2032 (m3/day, AGR (%))
Figure 83 Australia Anaerobic Digestion (AD) Market by Value, 2022-2032 (USD Mn, AGR (%))
Figure 84 Australia Anaerobic Digestion (AD) Market by Value, 2022-2032 (m3/day, AGR (%))
Figure 85 Rest of Asia-Pacific Anaerobic Digestion (AD) Market by Value, 2022-2032 (USD Mn, AGR (%))
Figure 86 Rest of Asia-Pacific Anaerobic Digestion (AD) Market by Value, 2022-2032 (m3/day, AGR (%))
Figure 87 Middle East & Africa Anaerobic Digestion (AD) Market by Region, 2022-2032 (USD Million, AGR (%), Cumulative)
Figure 88 Middle East & Africa Anaerobic Digestion Market Attractiveness Index
Figure 89 Middle East & Africa Anaerobic Digestion Market by Region, 2022, 2027 & 2032 (US$ million)
Figure 90 Middle East & Africa Anaerobic Digestion (AD) Market Forecast by Biogas Generation, 2022-2032 (m3/day, AGR (%), Cumulative)
Figure 91 Middle East & Africa Anaerobic Digestion (AD) Market Forecast by Spending, 2022-2032 (USD Mn, AGR (%), Cumulative)
Figure 92 Middle East & Africa Anaerobic Digestion (AD) Market Forecast by Spending Type, 2022-2032 (USD Mn, AGR (%), Cumulative)
Figure 93 Middle East & Africa Anaerobic Digestion Market Share Forecast by Spending Type, 2022 & 2032 (%)
Figure 94 Middle East & Africa Anaerobic Digestion (AD) Market by Digester Type, 2022-2032 (m3/day, AGR (%), Cumulative)
Figure 95 Middle East & Africa Anaerobic Digestion Market Share Forecast by Digester Type, 2022 & 2032 (%)
Figure 96 Middle East & Africa Anaerobic Digestion (AD) Market by Feedstock, 2022-2032 (m3/day, AGR (%), Cumulative)
Figure 97 Middle East & Africa Anaerobic Digestion Market Share Forecast by Feedstock, 2022 & 2032 (%)
Figure 98 Middle East & Africa Anaerobic Digestion (AD) Market by End-Use, 2022-2032 (m3/day, AGR (%), Cumulative)
Figure 99 Middle East & Africa Anaerobic Digestion Market Share Forecast by End-users, 2022 & 2032 (%)
Figure 100 Middle East & Africa Anaerobic Digestion (AD) Market by Country, 2022-2032 (m3/day, AGR (%), Cumulative)
Figure 101 Middle East & Africa Anaerobic Digestion Market Share Forecast by Country, 2022 & 2032 (%)
Figure 102 Turkey Anaerobic Digestion (AD) Market by Value, 2022-2032 (USD Mn, AGR (%))
Figure 103 Turkey Anaerobic Digestion (AD) Market by Value, 2022-2032 (m3/day, AGR (%))
Figure 104 Saudi Arabia Anaerobic Digestion (AD) Market by Value, 2022-2032 (USD Mn, AGR (%))
Figure 105 Saudi Arabia Anaerobic Digestion (AD) Market by Value, 2022-2032 (m3/day, AGR (%))
Figure 106 South Africa Anaerobic Digestion (AD) Market by Value, 2022-2032 (USD Mn, AGR (%))
Figure 107 South Africa Anaerobic Digestion (AD) Market by Value, 2022-2032 (m3/day, AGR (%))
Figure 108 Israel Anaerobic Digestion (AD) Market by Value, 2022-2032 (USD Mn, AGR (%))
Figure 109 Israel Anaerobic Digestion (AD) Market by Value, 2022-2032 (m3/day, AGR (%))
Figure 110 Rest of MEA Anaerobic Digestion (AD) Market by Value, 2022-2032 (USD Mn, AGR (%))
Figure 111 Rest of MEA Anaerobic Digestion (AD) Market by Value, 2022-2032 (m3/day, AGR (%))
Figure 112 South America Anaerobic Digestion Market Attractiveness Index
Figure 113 South America Anaerobic Digestion Market by Region, 2022, 2027 & 2032 (US$ million)
Figure 114 South America Anaerobic Digestion (AD) Market Forecast by Biogas Generation, 2022-2032 (m3/day, AGR (%), Cumulative)
Figure 115 South America Anaerobic Digestion (AD) Market Forecast by Spending, 2022-2032 (USD Mn, AGR (%), Cumulative)
Figure 116 South America Anaerobic Digestion (AD) Market Forecast by Spending Type, 2022-2032 (USD Mn, AGR (%), Cumulative)
Figure 117 South America Anaerobic Digestion Market Share Forecast by Spending Type, 2022 & 2032 (%)
Figure 118 South America Anaerobic Digestion (AD) Market by Digester Type, 2022-2032 (m3/day, AGR (%), Cumulative)
Figure 119 South America Anaerobic Digestion Market Share Forecast by Digester Type, 2022 & 2032 (%)
Figure 120 South America Anaerobic Digestion (AD) Market by Feedstock, 2022-2032 (m3/day, AGR (%), Cumulative)
Figure 121 South America Anaerobic Digestion Market Share Forecast by Feedstock, 2022 & 2032 (%)
Figure 122 South America Anaerobic Digestion (AD) Market by End-Use, 2022-2032 (m3/day, AGR (%), Cumulative)
Figure 123 South America Anaerobic Digestion Market Share Forecast by End-users, 2022 & 2032 (%)
Figure 124 South America Anaerobic Digestion (AD) Market by Country, 2022-2032 (m3/day, AGR (%), Cumulative)
Figure 125 South America Anaerobic Digestion Market Share Forecast by Country, 2022 & 2032 (%)
Figure 126 Brazil Anaerobic Digestion (AD) Market by Value, 2022-2032 (USD Mn, AGR (%))
Figure 127 Brazil Anaerobic Digestion (AD) Market by Value, 2022-2032 (m3/day, AGR (%))
Figure 128 Colombia Anaerobic Digestion (AD) Market by Value, 2022-2032 (USD Mn, AGR (%))
Figure 129 Colombia Anaerobic Digestion (AD) Market by Value, 2022-2032 (m3/day, AGR (%))
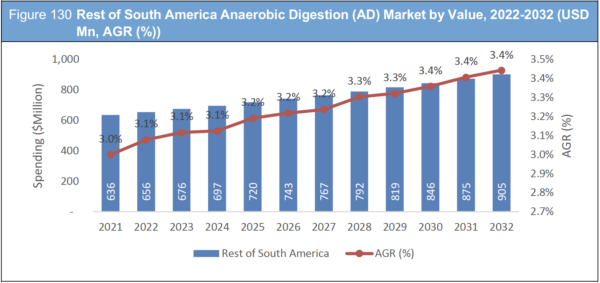
Figure 130 Rest of South America Anaerobic Digestion (AD) Market by Value, 2022-2032 (USD Mn, AGR (%))
Figure 131 Rest of South America Anaerobic Digestion (AD) Market by Value, 2022-2032 (m3/day, AGR (%))
Figure 132 2G Energy : Net Revenue, 2017-2021 (US$ million, AGR%)
Figure 133 2G Energy : Gross Profit, 2017-2021 (US$ million, AGR%)
Figure 134 2G Energy : Net Profit 2017-2021 (US$ million, AGR%)
Figure 135 2G Energy : EBITDA, 2017-2021 (US$ million, AGR%)
Figure 136 Anaergia: Net Revenue, 2017-2021 (US$ million, AGR%)
Figure 137 Anaergia: Gross Profit, 2017-2021 (US$ million, AGR%)
Figure 138 Anaergia: Net Profit 2017-2021 (US$ million, AGR%)
Figure 139 Anaergia: EBITDA, 2017-2021 (US$ million, AGR%)
Figure 140 CGG: Net Revenue, 2017-2021 (US$ million, AGR%)
Figure 141 CGG: Gross Profit, 2017-2021 (US$ million, AGR%)
Figure 142 CGG: Net Profit 2017-2021 (US$ million, AGR%)
Figure 143 CGG: EBITDA, 2017-2021 (US$ million, AGR%)
Figure 144 Siemens AG: Net Revenue, 2017-2021 (US$ million, AGR%)
Figure 145 Siemens AG: Gross Profit, 2017-2021 (US$ million, AGR%)
Figure 146 Siemens AG: Net Profit 2017-2021 (US$ million, AGR%)
Figure 147 Siemens AG: EBITDA, 2017-2021 (US$ million, AGR%)
ページTOPに戻る
Summary
この調査レポートは世界の嫌気性消化(AD)市場を調査し、支出別、消化器タイプ別、原料別、エンドユース別、地域別に2022年から2032年までの予測結果を掲載しています。また関連企業情報を提供しています。
主な掲載内容(目次より抜粋)
-
レポート概要
-
エグゼクティブサマリー
-
プレミアムインサイト
-
世界市場のダイナミックス
-
世界の嫌気性消化市場分析:支出タイプ別
-
世界の嫌気性消化市場分析:消化器タイプ別
-
世界の嫌気性消化市場分析:原料別
-
世界の嫌気性消化市場分析:エンドユース別
-
世界の嫌気性消化市場分析:地域別
-
北米の嫌気性消化市場分析
-
欧州の嫌気性消化市場分析
-
アジア太平洋地域の嫌気性消化市場分析
-
中東・アフリカの嫌気性消化市場分析
-
南米の嫌気性消化市場分析
-
主要企業のプロフィール
Report Details
The Anaerobic Digestion (AD) Market Report 2022-2032: This report will prove invaluable to leading firms striving for new revenue pockets if they wish to better understand the industry and its underlying dynamics. It will be useful for companies that would like to expand into different industries or to expand their existing operations in a new region.
Anaerobic Digesters Are Simpler to Run and Maintain
Digesters are designed to function under a range of temperature conditions. Mesophilic and thermophilic plants typically grow best in temperatures between 86 and 100 °F and 122 and 140 °F, respectively. Different populations of anaerobic microorganisms thrive in different temperature ranges. Thermophilic anaerobic digestion (AD) is frequently used when a higher level of pathogen killing is desired. “Class A Biosolids” are capable of being produced at these temperatures. Class a Biosolids are defined as dewatered and heated sewage sludge that satisfies US EPA standards for land application without limits. Class A Biosolids can thus be sold as compost or fertiliser to home gardeners and used legally as fertiliser in farms and vegetable gardens. Thermophillic digesters process feedstock more quickly, but they can cost more and be more difficult to operate.
Feed-In Tariffs, Feed-In Premiums, and Green Certifications Have All Been Evident Drivers of Anaerobic Digestion’s Development
To refine biogas for use as a fuel, it may need to be treated or ‘scrubbed.’ As a trace component of the biogas, hydrogen sulphide, a hazardous chemical generated from sulphates in the feedstock, is emitted. National environmental enforcement agencies, such as the United States Environmental Protection Agency or the English and Welsh Environment Agency, set strict limits on hydrogen sulphide levels in gases, and if the levels of hydrogen sulphide in the gas are high, gas scrubbing and cleaning equipment (such as amine gas treating) will be required to process the biogas to regionally acceptable levels. The addition of ferrous chloride FeCl2 to the digestion tanks, on the other hand, prevents hydrogen production.
What Questions Should You Ask before Buying a Market Research Report?
• How is the anaerobic digestion (AD) market evolving?
• What is driving and restraining the anaerobic digestion (AD) market?
• How will each anaerobic digestion (AD) submarket segment grow over the forecast period and how much revenue will these submarkets account for in 2032?
• How will the market shares for each anaerobic digestion (AD) submarket develop from 2022 to 2032?
• What will be the main driver for the overall market from 2022 to 2032?
• Will leading anaerobic digestion (AD) markets broadly follow the macroeconomic dynamics, or will individual national markets outperform others?
• How will the market shares of the national markets change by 2032 and which geographical region will lead the market in 2032?
• Who are the leading players and what are their prospects over the forecast period?
• What are the anaerobic digestion (AD) projects for these leading companies?
• How will the industry evolve during the period between 2020 and 2032? What are the implications of anaerobic digestion (AD) projects taking place now and over the next 10 years?
• Is there a greater need for product commercialisation to further scale the anaerobic digestion (AD) market?
• Where is the anaerobic digestion (AD) market heading and how can you ensure you are at the forefront of the market?
• What are the best investment options for new product and service lines?
• What are the key prospects for moving companies into a new growth path and C-suite?
You need to discover how this will impact the anaerobic digestion (AD) market today, and over the next 10 years:
• Our 261-page report provides 131 tables and 154 charts/graphs exclusively to you.
• The report highlights key lucrative areas in the industry so you can target them – NOW.
• It contains in-depth analysis of global, regional and national sales and growth.
• It highlights for you the key successful trends, changes and revenue projections made by your competitors.
This report tells you TODAY how the anaerobic digestion (AD) market will develop in the next 10 years, and in line with the variations in COVID-19 economic recession and bounce. This market is more critical now than at any point over the last 10 years.
The report delivers exclusive COVID-19 variations and economic data specific to your market.
Forecasts to 2032 and other analyses reveal commercial prospects
• In addition to revenue forecasting to 2032, our new study provides you with recent results, growth rates, and market shares.
• You will find original analyses, with business outlooks and developments.
• Discover qualitative analyses (including market dynamics, drivers, opportunities, restraints and challenges), cost structure, impact of rising anaerobic digestion (AD) prices and recent developments.
This report includes data analysis and invaluable insight into how COVID-19 will affect the industry and your company. Four COVID-19 recovery patterns and their impact, namely, “V”, “L”, “W” and “U” are discussed in this report.
Segments Covered in the Report
Market Segment by Spending
• CAPEX
• OPEX
Market Segment by Digester Type
• Stand-Alone Digesters
• On-Farm Digesters
• Co-Digestion System
Market Segment by Feedstock
• Agricultural Residues
• Food & Beverage Industry Waste
• Residential Organic Wastes
• Food Service Waste
• Wastewater solids (sludge)
Market Segment by End-Use
• Produce Heat and Electricity (CHP)
• Fuel Boilers and Furnaces to Heat Digesters
• Produce Electricity
• Produce Mechanical Power
• Compressed to Vehicle Fuels
• Other End-Use
In addition to the revenue predictions for the overall world market and segments, you will also find revenue forecasts for four regional and 20 leading national markets:
North America
• U.S.
• Canada
• Mexico
Europe
• Germany
• The Netherlands
• United Kingdom
• France
• Rest of Europe
Asia Pacific
• China
• Japan
• India
• Australia
• Rest of Asia Pacific
Middle East & Africa
• Turkey
• Saudi Arabia
• South Africa
• Israel
• Rest of Middle East & Africa
South America
• Brazil
• Colombia
• Rest of South America
The report also includes profiles and for some of the leading companies in the Anaerobic Digestion (AD) Market, 2022 to 2032, with a focus on this segment of these companies’ operations.
Leading companies and the potential for market growth
• 2G Energy GmbH
• Anaergia Inc.
• CGG
• Covanta Energy Corporation
• Harvest Power, Inc.
• Host Holding B.V.
• Organic Waste Systems (OWS), Inc.
• PlanET Biogas Global
• Schaumann BioEnergy GmbH
• Siemens AG
• Streisal GmbH
• Waterleau Group NV
• WELTEC BIOPOWER GmbH
Overall world revenue for Anaerobic Digestion (AD) Market, 2022 to 2032 in terms of value the market will surpass US$18,716 million in 2022, our work calculates. We predict strong revenue growth through to 2032. Our work identifies which organizations hold the greatest potential. Discover their capabilities, progress, and commercial prospects, helping you stay ahead.
How will the Anaerobic Digestion (AD) Market, 2022 to 2032 report help you?
In summary, our 253-page report provides you with the following knowledge:
• Revenue forecasts to 2032 for Anaerobic Digestion (AD) Market, 2022 to 2032 Market, with forecasts for, digester type, spending, feedstock, end-use and company size, each forecast at a global and regional level – discover the industry’s prospects, finding the most lucrative places for investments and revenues.
• Revenue forecasts to 2032 for four regional and 20 key national markets – See forecasts for the Anaerobic Digestion (AD) Market, 2022 to 2032 market in North America, Europe, Asia-Pacific and LAMEA. Also forecasted is the market in the US, Canada, Mexico, Brazil, Germany, France, UK, China, India, Japan, and Australia among other prominent economies.
• Prospects for established firms and those seeking to enter the market – including company profiles for 15 of the major companies involved in the Anaerobic Digestion (AD) Market, 2022 to 2032.
Find quantitative and qualitative analyses with independent predictions. Receive information that only our report contains, staying informed with invaluable business intelligence.
Information found nowhere else
With our new report, you are less likely to fall behind in knowledge or miss out on opportunities. See how our work could benefit your research, analyses, and decisions. Visiongain’s study is for everybody needing commercial analyses for the Anaerobic Digestion (AD) Market, 2022 to 2032, market-leading companies. You will find data, trends and predictions.
ページTOPに戻る
Table of Contents
Table of Contents
1. Report Overview
1.1 Objectives of the Study
1.2 Introduction to Anaerobic Digestion Market
1.3 What this Report Delivers
1.4 Why you Should Read this Report
1.5 Key Questions Answered by this Analytical Report Include:
1.6 Who is this Report for?
1.7 Methodology
1.7.1 Market Definitions
1.7.2 Market Evaluation & Forecasting Methodology
1.7.3 Data Validation
1.8 Frequently Asked Questions (FAQs)
1.9 Associated Visiongain Reports
1.10 About Visiongain
2 Executive Summary
3 Premium Insights
3.1 Geographical Snapshot: Global Anaerobic Digestion Market
3.2 Digester Type Segment: Market Attractiveness Index
3.3 Feedstock Segment: Market Attractiveness Index
3.4 End-users Segment: Market Attractiveness Index
4 Global Market Dynamics
4.1 Current Trends in the Global Market
4.2 Market Driving Factors
4.2.1 Low Construction Cost and Requires Less Space
4.2.2 Easy to operate
4.2.3 Low Emission from Digester
4.2.4 Minimization of Greenhouse Emission
4.2.5 Alternate Energy Generation from Waste
4.2.6 Organic Diversion from Landfills
4.3 Market Restraining Factors
4.3.1 Low Awareness
4.3.2 No Strict Regulations in Some Countries
4.4 Opportunities in the Global Market
4.4.1 Increasing Demand For Renewable Energy Resources
4.4.2 Various Anaerobic Digester Technology Now in Use
4.4.3 Biogas Potential from Agricultural Feedstock
4.5 Challenges in the Global Market
4.5.1 Organic Solid Waste Management
4.5.2 The Collecting System Has a Big Impact on the Characteristics of the Waste Materials Used For AD
4.5.3 Prior To Digestion, Most Feedstocks Require Pre-Treatment
4.6 SWOT Analysis
4.7 Porter’s Five Forces Model
4.7.1 Bargaining Power of Supplier - Low
4.7.2 Bargaining Power of Buyer - Moderate
4.7.3 Threat of Substitute Products - Moderate
4.7.4 Threat of New Entry - Moderate
4.7.5 Rivalry Among Existing Competitors - High
4.8 COVID-19 Impact Analysis
4.8.1 COVID-19 V-Shaped Recovery Scenario Analysis
4.8.2 COVID-19 W-Shaped Recovery Scenario Analysis
4.8.3 COVID-19 U-Shaped Recovery Scenario Analysis
4.8.4 COVID-19 L-Shaped Recovery Scenario Analysis
5 Global Anaerobic Digestion Market Analysis by Spending Type
5.1 Key Findings
5.2 Spending Type Segment Growth Prospects
5.3 Global Anaerobic Digestion Market Share by Spending Type, 2022 & 2032
5.4 Global Market Size Estimation and Forecast Spending Type
5.4.1 CAPEX
5.4.2 OPEX
6 Global Anaerobic Digestion Market Analysis by Digester Type
6.1 Key Findings
6.2 Digester Type Segment Growth Prospects
6.3 Global Anaerobic Digestion Market Share by Digester Type, 2022 & 2032
6.3.1 Global Anaerobic Digestion Market by Digester Type
7 Global Anaerobic Digestion Market Analysis by Feedstock
7.1 Key Findings
7.2 Feedstock Segment Growth Prospects
7.3 Global Anaerobic Digestion Market Share by Feedstock, 2022 & 2032
7.3.1 Global Market Size Estimation and Forecast by Feedstock
8 Global Anaerobic Digestion Market Analysis by End-Use
8.1 Key Findings
8.2 End-Use Segment Growth Prospects
8.3 Global Anaerobic Digestion Market Share by End-Use, 2022 & 2032
8.3.1 Global Market Size Estimation and Forecast by End-Use
9 Global Anaerobic Digestion Market Analysis by Region
9.1 Key Findings
9.2 Regional Market Size Estimation and Forecast
10 North America Anaerobic Digestion Market Analysis
10.1 Growing Demand for Bio-Based Products and Renewable Energy from a Variety of Organic Feedstock
10.2 Biogas is a Clean-Tech Alternative that Fosters Ongoing Agricultural Innovation
10.3 North America Anaerobic Digestion Market Attractiveness Index
10.4 North America Anaerobic Digestion Market by Country, 2022, 2027 & 2032 (US$ mn)
10.5 North America Anaerobic Digestion Market Forecast by Biogas Generation
10.6 North America Anaerobic Digestion Market Size Estimation and Forecast by Spending Type
10.7 North America Anaerobic Digestion Market Size Estimation and Forecast by Digester Type
10.8 North America Anaerobic Digestion Market Size Estimation and Forecast by Feedstock
10.9 North America Anaerobic Digestion Market Size Estimation and Forecast by End-users
10.10 North America Anaerobic Digestion Market Size Estimation and Forecast by Country
10.11 U.S. Market Analysis
10.11.1 There Are Around 2200 Biogas Production Facilities in the United States
10.11.2 The U.S. Biogas Business Has Enormous Potential for Growth
10.12 Canada Market Analysis
10.12.1 Canada Now Operates 61 Anaerobic Digestion or Biogas Plants
10.12.2 The Number of Operating Biogas Plants in Canada Has Increased by About 50%
10.13 Mexico Market Analysis
11 Europe Anaerobic Digestion Market Analysis
11.1 Each EU Member State Has a Separate Goal for the Proportion of Sustainable Energy Sources, as Well as a Different Strategy for Achieving that Goal
11.2 It is Expected that the Size of Europe's Anaerobic Digestion Industry Would Grow Moderately
11.3 The Benefits of AD Technology Will Encourage its Use During the Forecast Period in the Region of Europe
11.4 Europe Anaerobic Digestion Market Attractiveness Index
11.5 Europe Anaerobic Digestion Market by Country, 2022, 2027 & 2032 (US$ mn)
11.6 Europe Anaerobic Digestion Market Forecast by Biogas Generation
11.7 Europe Anaerobic Digestion Market Size Estimation and Forecast by Spending Type
11.8 Europe Anaerobic Digestion Market Size Estimation and Forecast by Digester Type
11.9 Europe Anaerobic Digestion Market Size Estimation and Forecast by Feedstock
11.10 Europe Anaerobic Digestion Market Size Estimation and Forecast by End-users
11.11 Europe Anaerobic Digestion Market Size Estimation and Forecast by Country
11.12 Germany Market Analysis
11.12.1 Germany is Now the World Leader in Renewable Energy Generation, with 9,527 Biogas Plants
11.13 France Market Analysis
11.13.1 France: Two New Biogas Plants
11.14 UK Market Analysis
11.15 The Netherlands Market Analysis
11.15.1 The Netherlands Is One of Just a Few Countries in the World that Have Implemented Large-Scale Biogas-to-Biomethane Conversion Projects
11.15.2 Currently, the Netherlands Has a Critical Biogas and Biomethane Support Instrument
11.15.3 The Netherlands Has a Very Consistent Biogas Policy
11.16 Rest of Europe Market Analysis
11.16.1 Biogas as a Sustainable Fuel for Heat, Power and Transport
11.16.2 EU Policies on Renewable Energy
12 Asia-Pacific Anaerobic Digestion Market Analysis
12.1 Anaerobic Digestion Biogas is Being Distributed Throughout Asia
12.2 Asia-Pacific Anaerobic Digestion Market Attractiveness Index
12.3 Asia-Pacific Anaerobic Digestion Market by Country, 2022, 2027 & 2032 (US$ mn)
12.4 Asia-Pacific Anaerobic Digestion Market Forecast by Biogas Generation
12.5 Asia-Pacific Anaerobic Digestion Market Size Estimation and Forecast by Spending Type
12.6 Asia-Pacific Anaerobic Digestion Market Size Estimation and Forecast by Digester Type
12.7 Asia-Pacific Anaerobic Digestion Market Size Estimation and Forecast by Feedstock
12.8 Asia-Pacific Anaerobic Digestion Market Size Estimation and Forecast by End-users
12.9 Asia-Pacific Anaerobic Digestion Market Size Estimation and Forecast by Country
12.10 China Market Analysis
12.10.1 The Central Government's Investment Subsidies for Biogas Plants Are Determined by the Level of Regional Economic Growth
12.11 India Market Analysis
12.11.1 The National Biogas and Manure Management Programme (NBMMP)
12.12 Japan Market Analysis
12.12.1 Japan Aspires to Be a Decarbonized, Carbon-Neutral Company that Reduces Greenhouse Gas Emissions to Zero by 2050
12.12.2 Renewable Energy Sources Have Steadily Increased their Share of Electricity Generation in Japan During the Last Five Years
12.13 Australia Market Analysis
12.13.1 The Government of Australia Has Launched a 'The First' Biomethane-To-Gas Project in Australia
12.14 Rest of Asia-Pacific Market Analysis
12.14.1 Biogas Support Programme in Nepal
13 Middle East & Africa Anaerobic Digestion Market Analysis
13.1 Middle East and Africa Market Outlook
13.1.1 In the Middle East, there is a Vast Untapped Potential for Biogas Generation
13.1.2 The Middle East Has a Vast Potential for Renewable Energy in the form of the Yet Mostly Undeveloped Solar, Wind and Biofuel Sectors
13.1.3 The Middle East is Well Placed for the Development of Biomass Energy
13.1.4 Africa Market Overview
13.2 Middle East & Africa Anaerobic Digestion Market Attractiveness Index
13.3 Middle East & Africa Anaerobic Digestion Market by Country, 2022, 2027 & 2032 (US$ mn)
13.4 Middle East & Africa Anaerobic Digestion Market Forecast by Biogas Generation
13.5 Middle East & Africa Anaerobic Digestion Market Size Estimation and Forecast by Spending Type
13.6 Middle East & Africa Anaerobic Digestion Market Size Estimation and Forecast by Digester Type
13.7 Middle East & Africa Anaerobic Digestion Market Size Estimation and Forecast by Feedstock
13.8 Middle East & Africa Anaerobic Digestion Market Size Estimation and Forecast by End-users
13.9 Middle East & Africa Anaerobic Digestion Market Size Estimation and Forecast by Country
13.10 Turkey Market Analysis
13.10.1 In the Past Decade Turkey's Energy Mix Has Undergone Tremendous Diversification
13.11 Saudi Arabia Market Analysis
13.11.1 Saudi Arabia Will Create 50% of Renewable Energy By 2030
13.12 South Africa Market Analysis
13.12.1 Waste-To-Energy Project South Africa with a Focus on the Use of Energy Produced from Organically Waste, Mainly
13.13 Israel Market Analysis
13.13.1 Biofuels Have Evolved to Improve Consumer Lives and to Generate Environmental Benefits
13.14 Rest of MEA Market Analysis
13.14.1 For Biogas and Digesters, there Are Various End Uses
14 South America Anaerobic Digestion Market Analysis
14.1.1 The World's Most Dynamic Renewable Energy Markets Are Located in South America
14.2 South America Anaerobic Digestion Market Attractiveness Index
14.3 South America Anaerobic Digestion Market by Country, 2022, 2027 & 2032 (US$ mn)
14.4 South America Anaerobic Digestion Market Forecast by Biogas Generation
14.5 South America Anaerobic Digestion Market Size Estimation and Forecast by Spending Type
14.6 South America Anaerobic Digestion Market Size Estimation and Forecast by Digester Type
14.7 South America Anaerobic Digestion Market Size Estimation and Forecast by Feedstock
14.8 South America Anaerobic Digestion Market Size Estimation and Forecast by End-users
14.9 South America Anaerobic Digestion Market Size Estimation and Forecast by Country
14.10 Brazil Market Analysis
14.10.1 Vinasse from Brazilian Sugarcane Biorefineries Was Tested For Anaerobic Digestion
14.10.2 Brazil Has a Very Varied Power Matrix Because it Has Hydrocarbon, Renewable and Nuclear Energy-Based Power Resources
14.10.3 Brazil Began Operating In 2020 with Over 400 Biogas Plants, Up 40 Percent Year on Average
14.11 Colombia Market Analysis
14.11.1 Colombia Has Adopted Several Strategies to Maximize the Use of Biomass as a Source of Energy
14.11.2 In Colombia, Multiple Entities Are Responsible for National Energy Policies
14.12 Rest of South America Market Analysis
14.12.1 Costa Rica is Known for Using Renewable Sources of Energy to Meet Overall Domestic Electricity Demand
15 Company Profiles
15.1 2G Energy GmbH
15.1.1 Company Snapshot
15.1.2 Company Overview
15.1.3 Financial Analysis
15.1.4 Product Benchmarking
15.2 Harvest Power, Inc
15.2.1 Company Snapshot
15.2.2 Company Overview
15.2.3 Product Benchmarking
15.3 Host Holding B.V.
15.3.1 Company Snapshot
15.3.2 Company Overview
15.3.3 Product Benchmarking
15.3.4 Strategic Outlook
15.4 Covanta Energy Corporation
15.4.1 Company Snapshot
15.4.2 Company Overview
15.4.3 Product Benchmarking
15.4.4 Strategic Outlook
15.5 Waterleau
15.5.1 Company Snapshot
15.5.2 Company Overview
15.5.3 Product Benchmarking
15.5.4 Strategic Outlook
15.6 WELTEC BIOPOWER GmbH
15.6.1 Company Snapshot
15.6.2 Company Overview
15.6.3 Product Benchmarking
15.6.4 Strategic Outlook
15.7 Organic Waste Systems (OWS), Inc
15.7.1 Company Snapshot
15.7.2 Company Overview
15.7.3 Product Benchmarking
15.7.4 Strategic Outlook
15.8 Anaergia Inc
15.8.1 Company Snapshot
15.8.2 Company Overview
15.8.3 Financial Analysis
15.8.4 Product Benchmarking
15.8.5 Strategic Outlook
15.9 CGG
15.9.1 Company Snapshot
15.9.2 Company Overview
15.9.3 Financial Analysis
15.9.4 Product Benchmarking
15.9.5 Strategic Outlook
15.10 PlanET Biogas Global
15.10.1 Company Snapshot
15.10.2 Company Overview
15.10.3 Product Benchmarking
15.11 Siemens AG
15.11.1 Company Snapshot
15.11.2 Company Overview
15.11.3 Financial Analysis
15.11.4 Product Benchmarking
15.11.5 Strategic Outlook
15.12 Schaumann BioEnergy GmbH
15.12.1 Company Snapshot
15.12.2 Company Overview
15.12.3 Product Benchmarking
15.13 Streisal GmbH
15.13.1 Company Snapshot
15.13.2 Company Overview
15.13.3 Product Benchmarking
16 Conclusion and Recommendations
16.1 Concluding Remarks from Visiongain
16.1.1 Renewed Efforts Have Been Undertaken for the Scaling-Up and Market Development of Domestic Level Biogas Projects in Asia
16.1.2 Anaerobic Digestion Technology Has Advanced Rapidly in Recent Years
16.1.3 The United Kingdom and the European Union Have Both Funded Numerous AD Projects Around the World
16.1.4 Numerous Waste-To-Biogas Plants Are Already Up and Running
16.1.5 Anaerobic Digestion is a Complex Reduction Process Involving a Number of Metabolic Processes
16.1.6 Any Successful Anaerobic Digestion System Depends on Reliable High Quality Supplies of Appropriate Feedstock
List of Tables
Table 1 Global Anaerobic Digestion Market Snapshot, 2022 & 2032 (US$ million, CAGR %)
Table 2 Global Anaerobic Digestion (AD) Market Forecast, 2022-2032 (USD Mn, AGR (%), CAGR (%)) (V-Shaped Recovery Scenario)
Table 3 Global Anaerobic Digestion (AD) Market by Region, 2022-2032 (USD Mn, AGR (%), CAGR (%)) (V-Shaped Recovery Scenario)
Table 4 Global Anaerobic Digestion (AD) Market Forecast, 2022-2032 (USD Mn, AGR (%), CAGR (%)) (W-Shaped Recovery Scenario)
Table 5 Global Anaerobic Digestion (AD) Market by Region, 2022-2032 (USD Mn, AGR (%), CAGR (%)) (W-Shaped Recovery Scenario)
Table 6 Global Anaerobic Digestion (AD) Market Forecast, 2022-2032 (USD Mn, AGR (%), CAGR (%)) (U-Shaped Recovery Scenario)
Table 7 Global Anaerobic Digestion (AD) Market by Region, 2022-2032 (USD Mn, AGR (%), CAGR (%)) (U-Shaped Recovery Scenario)
Table 8 Global Anaerobic Digestion (AD) Market Forecast, 2022-2032 (USD Mn, AGR (%), CAGR (%)) (L-Shaped Recovery Scenario)
Table 9 Global Anaerobic Digestion (AD) Market by Region, 2022-2032 (USD Mn, AGR (%), CAGR (%)) (L-Shaped Recovery Scenario)
Table 10 Global Anaerobic Digestion Market Forecast by Spending, 2022-2032 (USD Mn, AGR (%), CAGR (%), Cumulative)
Table 11 Global Anaerobic Digestion Market Forecast by Spending Type, 2022-2032 (USD Mn, AGR (%), CAGR (%), Cumulative)
Table 12 Global Anaerobic Digestion Market by Digester Type, 2022-2032 (m3/day, AGR (%), CAGR (%), Cumulative)
Table 13 Global Anaerobic Digestion Market by Feedstock, 2022-2032 (m3/day, AGR (%), CAGR (%), Cumulative)
Table 14 Global Anaerobic Digestion Market by End-Use, 2022-2032 (m3/day, AGR (%), CAGR (%), Cumulative)
Table 15 Global Anaerobic Digestion Market by Region, 2022-2032 (USD Million, AGR (%), CAGR (%), Cumulative)
Table 16 North America Anaerobic Digestion Market Forecast by Biogas Generation, 2022-2032 (m3/day, AGR (%), CAGR (%), Cumulative)
Table 17 North America Anaerobic Digestion Market Forecast by Spending, 2022-2032 (USD Mn, AGR (%), CAGR (%), Cumulative)
Table 18 North America Anaerobic Digestion Market Forecast by Spending Type, 2022-2032 (USD Mn, AGR (%), CAGR (%), Cumulative)
Table 19 North America Anaerobic Digestion Market by Digester Type, 2022-2032 (m3/day, AGR (%), CAGR (%), Cumulative)
Table 20 North America Anaerobic Digestion Market by Feedstock, 2022-2032 (m3/day, AGR (%), CAGR (%), Cumulative)
Table 21 North America Anaerobic Digestion Market by End-Use, 2022-2032 (m3/day, AGR (%), CAGR (%), Cumulative)
Table 22 North America Anaerobic Digestion Market by Country, 2022-2032 (m3/day, AGR (%), CAGR (%), Cumulative)
Table 23 US Anaerobic Digestion (AD) Market by Value, 2022-2032 (USD Mn, AGR (%), CAGR (%))
Table 24 US Anaerobic Digestion (AD) Market by Value, 2022-2032 (m3/day, AGR (%), CAGR (%))
Table 25 Canada Anaerobic Digestion (AD) Market by Value, 2022-2032 (USD Mn, AGR (%), CAGR (%))
Table 26 Canada Anaerobic Digestion (AD) Market by Value, 2022-2032 (m3/day, AGR (%), CAGR (%))
Table 27 Mexico Anaerobic Digestion (AD) Market by Value, 2022-2032 (USD Mn, AGR (%), CAGR (%))
Table 28 Mexico Anaerobic Digestion (AD) Market by Value, 2022-2032 (m3/day, AGR (%), CAGR (%))
Table 29 Europe Anaerobic Digestion (AD) Market by Region, 2022-2032 (USD Million, AGR (%), CAGR (%), Cumulative)
Table 30 Europe Anaerobic Digestion (AD) Market Forecast by Biogas Generation, 2022-2032 (m3/day, AGR (%), CAGR (%), Cumulative)
Table 31 Europe Anaerobic Digestion (AD) Market Forecast by Spending, 2022-2032 (USD Mn, AGR (%), CAGR (%), Cumulative)
Table 32 Europe Anaerobic Digestion (AD) Market Forecast by Spending Type, 2022-2032 (USD Mn, AGR (%), CAGR (%), Cumulative)
Table 33 Europe Anaerobic Digestion (AD) Market by Digester Type, 2022-2032 (m3/day, AGR (%), CAGR (%), Cumulative)
Table 34 Europe Anaerobic Digestion (AD) Market by Feedstock, 2022-2032 (m3/day, AGR (%), CAGR (%), Cumulative)
Table 35 Europe Anaerobic Digestion (AD) Market by End-Use, 2022-2032 (m3/day, AGR (%), CAGR (%), Cumulative)
Table 36 Europe Anaerobic Digestion (AD) Market by Country, 2022-2032 (m3/day, AGR (%), CAGR (%), Cumulative)
Table 37 Germany Anaerobic Digestion (AD) Market by Value, 2022-2032 (USD Mn, AGR (%), CAGR (%))
Table 38 Germany Anaerobic Digestion (AD) Market by Value, 2022-2032 (m3/day, AGR (%), CAGR (%))
Table 39 France Anaerobic Digestion (AD) Market by Value, 2022-2032 (USD Mn, AGR (%), CAGR (%))
Table 40 France Anaerobic Digestion (AD) Market by Value, 2022-2032 (m3/day, AGR (%), CAGR (%))
Table 41 UK Anaerobic Digestion (AD) Market by Value, 2022-2032 (USD Mn, AGR (%), CAGR (%))
Table 42 UK Anaerobic Digestion (AD) Market by Value, 2022-2032 (m3/day, AGR (%), CAGR (%))
Table 43 Netherlands Anaerobic Digestion (AD) Market by Value, 2022-2032 (USD Mn, AGR (%), CAGR (%))
Table 44 Netherlands Anaerobic Digestion (AD) Market by Value, 2022-2032 (m3/day, AGR (%), CAGR (%))
Table 45 Rest of Europe Anaerobic Digestion (AD) Market by Value, 2022-2032 (USD Mn, AGR (%), CAGR (%))
Table 46 Rest of Europe Anaerobic Digestion (AD) Market by Value, 2022-2032 (m3/day, AGR (%), CAGR (%))
Table 47 Asia-Pacific Anaerobic Digestion (AD) Market by Region, 2022-2032 (USD Million, AGR (%), CAGR (%), Cumulative)
Table 48 Asia-Pacific Anaerobic Digestion (AD) Market Forecast by Biogas Generation, 2022-2032 (m3/day, AGR (%), CAGR (%), Cumulative)
Table 49 Asia-Pacific Anaerobic Digestion (AD) Market Forecast by Spending, 2022-2032 (USD Mn, AGR (%), CAGR (%), Cumulative)
Table 50 Asia-Pacific Anaerobic Digestion (AD) Market Forecast by Spending Type, 2022-2032 (USD Mn, AGR (%), CAGR (%), Cumulative)
Table 51 Asia-Pacific Anaerobic Digestion (AD) Market by Digester Type, 2022-2032 (m3/day, AGR (%), CAGR (%), Cumulative)
Table 52 Asia-Pacific Anaerobic Digestion (AD) Market by Feedstock, 2022-2032 (m3/day, AGR (%), CAGR (%), Cumulative)
Table 53 Asia-Pacific Anaerobic Digestion (AD) Market by End-Use, 2022-2032 (m3/day, AGR (%), CAGR (%), Cumulative)
Table 54 Asia-Pacific Anaerobic Digestion (AD) Market by Country, 2022-2032 (m3/day, AGR (%), CAGR (%), Cumulative)
Table 55 China Anaerobic Digestion (AD) Market by Value, 2022-2032 (USD Mn, AGR (%), CAGR (%))
Table 56 China Anaerobic Digestion (AD) Market by Value, 2022-2032 (m3/day, AGR (%), CAGR (%))
Table 57 India Anaerobic Digestion (AD) Market by Value, 2022-2032 (USD Mn, AGR (%), CAGR (%))
Table 58 India Anaerobic Digestion (AD) Market by Value, 2022-2032 (m3/day, AGR (%), CAGR (%))
Table 59 Japan Anaerobic Digestion (AD) Market by Value, 2022-2032 (USD Mn, AGR (%), CAGR (%))
Table 60 Japan Anaerobic Digestion (AD) Market by Value, 2022-2032 (m3/day, AGR (%), CAGR (%))
Table 61 Australia Anaerobic Digestion (AD) Market by Value, 2022-2032 (USD Mn, AGR (%), CAGR (%))
Table 62 Australia Anaerobic Digestion (AD) Market by Value, 2022-2032 (m3/day, AGR (%), CAGR (%))
Table 63 Rest of Asia-Pacific Anaerobic Digestion (AD) Market by Value, 2022-2032 (USD Mn, AGR (%), CAGR (%))
Table 64 Rest of Asia-Pacific Anaerobic Digestion (AD) Market by Value, 2022-2032 (m3/day, AGR (%), CAGR (%))
Table 65 Middle East & Africa Anaerobic Digestion (AD) Market by Region, 2022-2032 (USD Million, AGR (%), CAGR (%), Cumulative)
Table 66 Middle East & Africa Anaerobic Digestion (AD) Market Forecast by Biogas Generation, 2022-2032 (m3/day, AGR (%), CAGR (%), Cumulative)
Table 67 Middle East & Africa Anaerobic Digestion (AD) Market Forecast by Spending, 2022-2032 (USD Mn, AGR (%), CAGR (%), Cumulative)
Table 68 Middle East & Africa Anaerobic Digestion (AD) Market Forecast by Spending Type, 2022-2032 (USD Mn, AGR (%), CAGR (%), Cumulative)
Table 69 Middle East & Africa Anaerobic Digestion (AD) Market by Digester Type, 2022-2032 (m3/day, AGR (%), CAGR (%), Cumulative)
Table 70 Middle East & Africa Anaerobic Digestion (AD) Market by Feedstock, 2022-2032 (m3/day, AGR (%), CAGR (%), Cumulative)
Table 71 Middle East & Africa Anaerobic Digestion (AD) Market by End-Use, 2022-2032 (m3/day, AGR (%), CAGR (%), Cumulative)
Table 72 Middle East & Africa Anaerobic Digestion (AD) Market by Country, 2022-2032 (m3/day, AGR (%), CAGR (%), Cumulative)
Table 73 Turkey Anaerobic Digestion (AD) Market by Value, 2022-2032 (USD Mn, AGR (%), CAGR (%))
Table 74 Turkey Anaerobic Digestion (AD) Market by Value, 2022-2032 (m3/day, AGR (%), CAGR (%))
Table 75 Saudi Arabia Anaerobic Digestion (AD) Market by Value, 2022-2032 (USD Mn, AGR (%), CAGR (%))
Table 76 Saudi Arabia Anaerobic Digestion (AD) Market by Value, 2022-2032 (m3/day, AGR (%), CAGR (%))
Table 77 South Africa Anaerobic Digestion (AD) Market by Value, 2022-2032 (USD Mn, AGR (%), CAGR (%))
Table 78 South Africa Anaerobic Digestion (AD) Market by Value, 2022-2032 (m3/day, AGR (%), CAGR (%))
Table 79 Israel Anaerobic Digestion (AD) Market by Value, 2022-2032 (USD Mn, AGR (%), CAGR (%))
Table 80 Israel Anaerobic Digestion (AD) Market by Value, 2022-2032 (m3/day, AGR (%), CAGR (%))
Table 81 Rest of MEA Anaerobic Digestion (AD) Market by Value, 2022-2032 (USD Mn, AGR (%), CAGR (%))
Table 82 Rest of MEA Anaerobic Digestion (AD) Market by Value, 2022-2032 (m3/day, AGR (%), CAGR (%))
Table 83 South America Anaerobic Digestion (AD) Market Forecast by Biogas Generation, 2022-2032 (m3/day, AGR (%), CAGR (%), Cumulative)
Table 84 South America Anaerobic Digestion (AD) Market Forecast by Spending, 2022-2032 (USD Mn, AGR (%), CAGR (%), Cumulative)
Table 85 South America Anaerobic Digestion (AD) Market Forecast by Spending Type, 2022-2032 (USD Mn, AGR (%), CAGR (%), Cumulative)
Table 86 South America Anaerobic Digestion (AD) Market by Digester Type, 2022-2032 (m3/day, AGR (%), CAGR (%), Cumulative)
Table 87 South America Anaerobic Digestion (AD) Market by Feedstock, 2022-2032 (m3/day, AGR (%), CAGR (%), Cumulative)
Table 88 South America Anaerobic Digestion (AD) Market by End-Use, 2022-2032 (m3/day, AGR (%), CAGR (%), Cumulative)
Table 89 South America Anaerobic Digestion (AD) Market by Country, 2022-2032 (m3/day, AGR (%), CAGR (%), Cumulative)
Table 90 Brazil Anaerobic Digestion (AD) Market by Value, 2022-2032 (USD Mn, AGR (%), CAGR (%))
Table 91 Brazil Anaerobic Digestion (AD) Market by Value, 2022-2032 (m3/day, AGR (%), CAGR (%))
Table 92 Colombia Anaerobic Digestion (AD) Market by Value, 2022-2032 (USD Mn, AGR (%), CAGR (%))
Table 93 Colombia Anaerobic Digestion (AD) Market by Value, 2022-2032 (m3/day, AGR (%), CAGR (%))
Table 94 Rest of South America Anaerobic Digestion (AD) Market by Value, 2022-2032 (USD Mn, AGR (%), CAGR (%))
Table 95 Rest of South America Anaerobic Digestion (AD) Market by Value, 2022-2032 (m3/day, AGR (%), CAGR (%))
Table 96 2G Energie: Key Details, (CEO, HQ, Revenue, Founded, No. of Employees, Company Type, Website, Business Segment)
Table 97 2G Energy : Product Benchmarking
Table 98 Harvest Power, Inc: Key Details, (CEO, HQ, Revenue, Founded, No. of Employees, Company Type, Website, Business Segment)
Table 99 Harvest Power, Inc: Product Benchmarking
Table 100 Host Holding : Key Details, (CEO, HQ, Revenue, Founded, No. of Employees, Company Type, Website, Business Segment)
Table 101 Host Holding: Product Benchmarking
Table 102 Host Holding: Strategic Outlook
Table 103 Covanta: Key Details, (CEO, HQ, Revenue, Founded, No. of Employees, Company Type, Website, Business Segment)
Table 104 Covanta: Product Benchmarking
Table 105 Covanta: Strategic Outlook
Table 106 Waterleau NV: Key Details, (CEO, HQ, Revenue, Founded, No. of Employees, Company Type, Website, Business Segment)
Table 107 Waterleau NV: Product Benchmarking
Table 108 Waterleau NV: Strategic Outlook
Table 109 WELTEC: Key Details, (CEO, HQ, Revenue, Founded, No. of Employees, Company Type, Website, Business Segment)
Table 110 WELTEC: Product Benchmarking
Table 111 WELTEC: Strategic Outlook
Table 112 OWS: Key Details, (CEO, HQ, Revenue, Founded, No. of Employees, Company Type, Website, Business Segment)
Table 113 OWS: Product Benchmarking
Table 114 OWS: Strategic Outlook
Table 115 Anaergia: Key Details, (CEO, HQ, Revenue, Founded, No. of Employees, Company Type, Website, Business Segment)
Table 116 Anaergia: Product Benchmarking
Table 117 Anaergia: Strategic Outlook
Table 118 CGG: Key Details, (CEO, HQ, Revenue, Founded, No. of Employees, Company Type, Website, Business Segment)
Table 119 CGG: Product Benchmarking
Table 120 CGG: Strategic Outlook
Table 121 PlanET: Key Details, (CEO, HQ, Revenue, Founded, No. of Employees, Company Type, Website, Business Segment)
Table 122 PlanET: Product Benchmarking
Table 123 Siemens AG: Key Details, (CEO, HQ, Revenue, Founded, No. of Employees, Company Type, Website, Business Segment)
Table 124 Siemens AG: Product Benchmarking
Table 125 Siemens AG: Strategic Outlook
Table 126 Schaumann BioEnergy: Key Details, (CEO, HQ, Revenue, Founded, No. of Employees, Company Type, Website, Business Segment)
Table 127 Schaumann BioEnergy: Product Benchmarking
Table 128 Streisal: Key Details, (CEO, HQ, Revenue, Founded, No. of Employees, Company Type, Website, Business Segment)
Table 129 Streisal: Product Benchmarking
List of Figures
Figure 1 Global Anaerobic Digestion Market Segmentation
Figure 2 Global Anaerobic Digestion Market Forecast by Region: Market Attractiveness Index
Figure 3 Global Anaerobic Digestion Market by Digester Type: Market Attractiveness Index
Figure 4 Global Anaerobic Digestion Market by Feedstock: Market Attractiveness Index
Figure 5 Global Anaerobic Digestion Market by End-users: Market Attractiveness Index
Figure 6 Global Anaerobic Digestion (AD) Market Forecast, 2022-2032 (USD Mn, AGR (%)) (V-Shaped Recovery Scenario)
Figure 7 Global Anaerobic Digestion (AD) Market Forecast by Region, 2022-2032 (USD Mn, AGR (%)) (V-Shaped Recovery Scenario)
Figure 8 Global Anaerobic Digestion (AD) Market Forecast, 2022-2032 (USD Mn, AGR (%)) (W-Shaped Recovery Scenario)
Figure 9 Global Anaerobic Digestion (AD) Market Forecast by Region, 2022-2032 (USD Mn, AGR (%)) (W-Shaped Recovery Scenario)
Figure 10 Global Anaerobic Digestion (AD) Market Forecast, 2022-2032 (USD Mn, AGR (%)) (U-Shaped Recovery Scenario)
Figure 11 Global Anaerobic Digestion (AD) Market Forecast by Region, 2022-2032 (USD Mn, AGR (%)) (U-Shaped Recovery Scenario)
Figure 12 Global Anaerobic Digestion (AD) Market Forecast by Region, 2022-2032 (USD Mn, AGR (%)) (L-Shaped Recovery Scenario)
Figure 13 Global Anaerobic Digestion (AD) Market Forecast by Region, 2022-2032 (USD Mn, AGR (%)) (L-Shaped Recovery Scenario)
Figure 1 Global Anaerobic Digestion Market Forecast by Spending 2022, 2027, 2032 (Revenue, CAGR%)
Figure 2 Global Anaerobic Digestion Market Share Forecast by Spending Type, 2022, 2032 (%)
Figure 3 Global Anaerobic Digestion Market Forecast by Spending, 2022-2032 (USD Mn, AGR (%), Cumulative)
Figure 4 Global Anaerobic Digestion Market Forecast by Spending Type, 2022-2032 (USD Mn, AGR (%), Cumulative)
Figure 5 Global Anaerobic Digestion Market Forecast by Digester Type 2022, 2027, 2032 (Revenue, CAGR%)
Figure 6 Global Anaerobic Digestion Market Share Forecast by Digester Type, 2022, 2032 (%)
Figure 7 Global Anaerobic Digestion Market by Digester Type, 2022-2032 (m3/day,AGR (%), Cumulative)
Figure 8 Global Anaerobic Digestion Market Forecast by Feedstock 2022, 2027, 2032 (Revenue, CAGR%)
Figure 9 Global Anaerobic Digestion Market Share Forecast by Feedstock, 2022, 2032 (%)
Figure 10 Global Anaerobic Digestion Market by Feedstock, 2022-2032 (m3/day, AGR (%), Cumulative)
Figure 11 Global Anaerobic Digestion Market Forecast by End-Use 2022, 2027, 2032 (Revenue, CAGR%)
Figure 12 Global Anaerobic Digestion Market Share Forecast by End-Use, 2022, 2032 (%)
Figure 13 Global Anaerobic Digestion Market by End-Use, 2022-2032 (m3/day, AGR (%), Cumulative)
Figure 14 Global Anaerobic Digestion Market Forecast by Region 2022, 2027, 2032 (Revenue, CAGR%)
Figure 15 Global Anaerobic Digestion Market Share Forecast by Region 2022, 2027, 2032(%)
Figure 16 Global Anaerobic Digestion Market by Region, 2022-2032 (USD Million, AGR (%), Cumulative)
Figure 17 North America Anaerobic Digestion Market Attractiveness Index
Figure 18 North America Anaerobic Digestion Market by Region, 2022, 2027 & 2032 (US$ million)
Figure 19 North America Anaerobic Digestion Market Forecast by Biogas Generation, 2022-2032 (m3/day, AGR (%), Cumulative)
Figure 20 North America Anaerobic Digestion Market Forecast by Spending, 2022-2032 (USD Mn, AGR (%), Cumulative)
Figure 21 North America Anaerobic Digestion Market Forecast by Spending Type, 2022-2032 (USD Mn, AGR (%), Cumulative)
Figure 22 North America Anaerobic Digestion Market Share Forecast by Spending Type, 2022 & 2032 (%)
Figure 23 North America Anaerobic Digestion Market by Digester Type, 2022-2032 (m3/day, AGR (%), Cumulative)
Figure 24 North America Anaerobic Digestion Market Share Forecast by Digester Type, 2022 & 2032 (%)
Figure 25 North America Anaerobic Digestion Market by Feedstock, 2022-2032 (m3/day, AGR (%), Cumulative
Figure 26 North America Anaerobic Digestion Market Share Forecast by Feedstock, 2022 & 2032 (%)
Figure 27 North America Anaerobic Digestion Market by End-Use, 2022-2032 (m3/day, AGR (%), Cumulative)
Figure 28 North America Anaerobic Digestion Market Share Forecast by End-users, 2022 & 2032 (%)
Figure 29 North America Anaerobic Digestion Market by Country, 2022-2032 (m3/day, AGR (%), Cumulative)
Figure 30 North America Anaerobic Digestion Market Share Forecast by Country, 2022 & 2032 (%)
Figure 31 US Anaerobic Digestion (AD) Market by Value, 2022-2032 (USD Mn, AGR (%))
Figure 32 US Anaerobic Digestion (AD) Market by Value, 2022-2032 (m3/day, AGR (%))
Figure 33 Canada Anaerobic Digestion (AD) Market by Value, 2022-2032 (USD Mn, AGR (%))
Figure 34 Canada Anaerobic Digestion (AD) Market by Value, 2022-2032 (m3/day, AGR (%))
Figure 35 Mexico Anaerobic Digestion (AD) Market by Value, 2022-2032 (USD Mn, AGR (%))
Figure 36 Mexico Anaerobic Digestion (AD) Market by Value, 2022-2032 (m3/day, AGR (%))
Figure 37 Europe Anaerobic Digestion (AD) Market by Region, 2022-2032 (USD Million, AGR (%)), Cumulative)
Figure 38 Europe Anaerobic Digestion Market Attractiveness Index
Figure 39 Europe Anaerobic Digestion Market by Region, 2022, 2027 & 2032 (US$ million)
Figure 40 Europe Anaerobic Digestion (AD) Market Forecast by Biogas Generation, 2022-2032 (m3/day, AGR (%)), Cumulative)
Figure 41 Europe Anaerobic Digestion (AD) Market Forecast by Spending, 2022-2032 (USD Mn, AGR (%)), Cumulative)
Figure 42 Europe Anaerobic Digestion (AD) Market Forecast by Spending Type, 2022-2032 (USD Mn, AGR (%)), Cumulative)
Figure 43 Europe Anaerobic Digestion Market Share Forecast by Spending Type, 2022 & 2032 (%)
Figure 44 Europe Anaerobic Digestion (AD) Market by Digester Type, 2022-2032 (m3/day, AGR (%)), Cumulative)
Figure 45 Europe Anaerobic Digestion Market Share Forecast by Digester Type, 2022 & 2032 (%)
Figure 46 Europe Anaerobic Digestion (AD) Market by Feedstock, 2022-2032 (m3/day, AGR (%)), Cumulative)
Figure 47 Europe Anaerobic Digestion Market Share Forecast by Feedstock, 2022 & 2032 (%)
Figure 48 Europe Anaerobic Digestion (AD) Market by End-Use, 2022-2032 (m3/day, AGR (%)), Cumulative)
Figure 49 Europe Anaerobic Digestion Market Share Forecast by End-users, 2022 & 2032 (%)
Figure 50 Europe Anaerobic Digestion (AD) Market by Country, 2022-2032 (m3/day, AGR (%)), Cumulative)
Figure 51 Europe Anaerobic Digestion Market Share Forecast by Country, 2022 & 2032 (%)
Figure 52 Germany Anaerobic Digestion (AD) Market by Value, 2022-2032 (USD Mn, AGR (%))
Figure 53 Germany Anaerobic Digestion (AD) Market by Value, 2022-2032 (m3/day, AGR (%))
Figure 54 France Anaerobic Digestion (AD) Market by Value, 2022-2032 (USD Mn, AGR (%))
Figure 55 France Anaerobic Digestion (AD) Market by Value, 2022-2032 (m3/day, AGR (%))
Figure 56 UK Anaerobic Digestion (AD) Market by Value, 2022-2032 (USD Mn, AGR (%))
Figure 57 UK Anaerobic Digestion (AD) Market by Value, 2022-2032 (m3/day, AGR (%))
Figure 58 Netherlands Anaerobic Digestion (AD) Market by Value, 2022-2032 (USD Mn, AGR (%))
Figure 59 Netherlands Anaerobic Digestion (AD) Market by Value, 2022-2032 (m3/day, AGR (%))
Figure 60 Rest of Europe Anaerobic Digestion (AD) Market by Value, 2022-2032 (USD Mn, AGR (%))
Figure 61 Rest of Europe Anaerobic Digestion (AD) Market by Value, 2022-2032 (m3/day, AGR (%))
Figure 62 Asia-Pacific Anaerobic Digestion (AD) Market by Region, 2022-2032 (USD Million, AGR (%)), Cumulative)
Figure 63 Asia-Pacific Anaerobic Digestion Market Attractiveness Index
Figure 64 Asia-Pacific Anaerobic Digestion Market by Region, 2022, 2027 & 2032 (US$ million)
Figure 65 Asia-Pacific Anaerobic Digestion (AD) Market Forecast by Biogas Generation, 2022-2032 (m3/day, AGR (%), Cumulative)
Figure 66 Asia-Pacific Anaerobic Digestion (AD) Market Forecast by Spending, 2022-2032 (USD Mn, AGR (%),Cumulative)
Figure 67 Asia-Pacific Anaerobic Digestion (AD) Market Forecast by Spending Type, 2022-2032 (USD Mn, AGR (%), Cumulative)
Figure 68 Asia-Pacific Anaerobic Digestion Market Share Forecast by Spending Type, 2022 & 2032 (%)
Figure 69 Asia-Pacific Anaerobic Digestion (AD) Market by Digester Type, 2022-2032 (m3/day, AGR (%), Cumulative)
Figure 70 Asia-Pacific Anaerobic Digestion Market Share Forecast by Digester Type, 2022 & 2032 (%)
Figure 71 Asia-Pacific Anaerobic Digestion (AD) Market by Feedstock, 2022-2032 (m3/day, AGR (%), Cumulative)
Figure 72 Asia-Pacific Anaerobic Digestion Market Share Forecast by Feedstock, 2022 & 2032 (%)
Figure 73 Asia-Pacific Anaerobic Digestion (AD) Market by End-Use, 2022-2032 (m3/day, AGR (%), Cumulative)
Figure 74 Asia-Pacific Anaerobic Digestion Market Share Forecast by End-users, 2022 & 2032 (%)
Figure 75 Asia-Pacific Anaerobic Digestion (AD) Market by Country, 2022-2032 (m3/day, AGR (%), Cumulative)
Figure 76 Asia-Pacific Anaerobic Digestion Market Share Forecast by Country, 2022 & 2032 (%)
Figure 77 China Anaerobic Digestion (AD) Market by Value, 2022-2032 (USD Mn, AGR (%))
Figure 78 China Anaerobic Digestion (AD) Market by Value, 2022-2032 (m3/day, AGR (%))
Figure 79 India Anaerobic Digestion (AD) Market by Value, 2022-2032 (USD Mn, AGR (%))
Figure 80 India Anaerobic Digestion (AD) Market by Value, 2022-2032 (m3/day, AGR (%))
Figure 81 Japan Anaerobic Digestion (AD) Market by Value, 2022-2032 (USD Mn, AGR (%))
Figure 82 Japan Anaerobic Digestion (AD) Market by Value, 2022-2032 (m3/day, AGR (%))
Figure 83 Australia Anaerobic Digestion (AD) Market by Value, 2022-2032 (USD Mn, AGR (%))
Figure 84 Australia Anaerobic Digestion (AD) Market by Value, 2022-2032 (m3/day, AGR (%))
Figure 85 Rest of Asia-Pacific Anaerobic Digestion (AD) Market by Value, 2022-2032 (USD Mn, AGR (%))
Figure 86 Rest of Asia-Pacific Anaerobic Digestion (AD) Market by Value, 2022-2032 (m3/day, AGR (%))
Figure 87 Middle East & Africa Anaerobic Digestion (AD) Market by Region, 2022-2032 (USD Million, AGR (%), Cumulative)
Figure 88 Middle East & Africa Anaerobic Digestion Market Attractiveness Index
Figure 89 Middle East & Africa Anaerobic Digestion Market by Region, 2022, 2027 & 2032 (US$ million)
Figure 90 Middle East & Africa Anaerobic Digestion (AD) Market Forecast by Biogas Generation, 2022-2032 (m3/day, AGR (%), Cumulative)
Figure 91 Middle East & Africa Anaerobic Digestion (AD) Market Forecast by Spending, 2022-2032 (USD Mn, AGR (%), Cumulative)
Figure 92 Middle East & Africa Anaerobic Digestion (AD) Market Forecast by Spending Type, 2022-2032 (USD Mn, AGR (%), Cumulative)
Figure 93 Middle East & Africa Anaerobic Digestion Market Share Forecast by Spending Type, 2022 & 2032 (%)
Figure 94 Middle East & Africa Anaerobic Digestion (AD) Market by Digester Type, 2022-2032 (m3/day, AGR (%), Cumulative)
Figure 95 Middle East & Africa Anaerobic Digestion Market Share Forecast by Digester Type, 2022 & 2032 (%)
Figure 96 Middle East & Africa Anaerobic Digestion (AD) Market by Feedstock, 2022-2032 (m3/day, AGR (%), Cumulative)
Figure 97 Middle East & Africa Anaerobic Digestion Market Share Forecast by Feedstock, 2022 & 2032 (%)
Figure 98 Middle East & Africa Anaerobic Digestion (AD) Market by End-Use, 2022-2032 (m3/day, AGR (%), Cumulative)
Figure 99 Middle East & Africa Anaerobic Digestion Market Share Forecast by End-users, 2022 & 2032 (%)
Figure 100 Middle East & Africa Anaerobic Digestion (AD) Market by Country, 2022-2032 (m3/day, AGR (%), Cumulative)
Figure 101 Middle East & Africa Anaerobic Digestion Market Share Forecast by Country, 2022 & 2032 (%)
Figure 102 Turkey Anaerobic Digestion (AD) Market by Value, 2022-2032 (USD Mn, AGR (%))
Figure 103 Turkey Anaerobic Digestion (AD) Market by Value, 2022-2032 (m3/day, AGR (%))
Figure 104 Saudi Arabia Anaerobic Digestion (AD) Market by Value, 2022-2032 (USD Mn, AGR (%))
Figure 105 Saudi Arabia Anaerobic Digestion (AD) Market by Value, 2022-2032 (m3/day, AGR (%))
Figure 106 South Africa Anaerobic Digestion (AD) Market by Value, 2022-2032 (USD Mn, AGR (%))
Figure 107 South Africa Anaerobic Digestion (AD) Market by Value, 2022-2032 (m3/day, AGR (%))
Figure 108 Israel Anaerobic Digestion (AD) Market by Value, 2022-2032 (USD Mn, AGR (%))
Figure 109 Israel Anaerobic Digestion (AD) Market by Value, 2022-2032 (m3/day, AGR (%))
Figure 110 Rest of MEA Anaerobic Digestion (AD) Market by Value, 2022-2032 (USD Mn, AGR (%))
Figure 111 Rest of MEA Anaerobic Digestion (AD) Market by Value, 2022-2032 (m3/day, AGR (%))
Figure 112 South America Anaerobic Digestion Market Attractiveness Index
Figure 113 South America Anaerobic Digestion Market by Region, 2022, 2027 & 2032 (US$ million)
Figure 114 South America Anaerobic Digestion (AD) Market Forecast by Biogas Generation, 2022-2032 (m3/day, AGR (%), Cumulative)
Figure 115 South America Anaerobic Digestion (AD) Market Forecast by Spending, 2022-2032 (USD Mn, AGR (%), Cumulative)
Figure 116 South America Anaerobic Digestion (AD) Market Forecast by Spending Type, 2022-2032 (USD Mn, AGR (%), Cumulative)
Figure 117 South America Anaerobic Digestion Market Share Forecast by Spending Type, 2022 & 2032 (%)
Figure 118 South America Anaerobic Digestion (AD) Market by Digester Type, 2022-2032 (m3/day, AGR (%), Cumulative)
Figure 119 South America Anaerobic Digestion Market Share Forecast by Digester Type, 2022 & 2032 (%)
Figure 120 South America Anaerobic Digestion (AD) Market by Feedstock, 2022-2032 (m3/day, AGR (%), Cumulative)
Figure 121 South America Anaerobic Digestion Market Share Forecast by Feedstock, 2022 & 2032 (%)
Figure 122 South America Anaerobic Digestion (AD) Market by End-Use, 2022-2032 (m3/day, AGR (%), Cumulative)
Figure 123 South America Anaerobic Digestion Market Share Forecast by End-users, 2022 & 2032 (%)
Figure 124 South America Anaerobic Digestion (AD) Market by Country, 2022-2032 (m3/day, AGR (%), Cumulative)
Figure 125 South America Anaerobic Digestion Market Share Forecast by Country, 2022 & 2032 (%)
Figure 126 Brazil Anaerobic Digestion (AD) Market by Value, 2022-2032 (USD Mn, AGR (%))
Figure 127 Brazil Anaerobic Digestion (AD) Market by Value, 2022-2032 (m3/day, AGR (%))
Figure 128 Colombia Anaerobic Digestion (AD) Market by Value, 2022-2032 (USD Mn, AGR (%))
Figure 129 Colombia Anaerobic Digestion (AD) Market by Value, 2022-2032 (m3/day, AGR (%))
Figure 130 Rest of South America Anaerobic Digestion (AD) Market by Value, 2022-2032 (USD Mn, AGR (%))
Figure 131 Rest of South America Anaerobic Digestion (AD) Market by Value, 2022-2032 (m3/day, AGR (%))
Figure 132 2G Energy : Net Revenue, 2017-2021 (US$ million, AGR%)
Figure 133 2G Energy : Gross Profit, 2017-2021 (US$ million, AGR%)
Figure 134 2G Energy : Net Profit 2017-2021 (US$ million, AGR%)
Figure 135 2G Energy : EBITDA, 2017-2021 (US$ million, AGR%)
Figure 136 Anaergia: Net Revenue, 2017-2021 (US$ million, AGR%)
Figure 137 Anaergia: Gross Profit, 2017-2021 (US$ million, AGR%)
Figure 138 Anaergia: Net Profit 2017-2021 (US$ million, AGR%)
Figure 139 Anaergia: EBITDA, 2017-2021 (US$ million, AGR%)
Figure 140 CGG: Net Revenue, 2017-2021 (US$ million, AGR%)
Figure 141 CGG: Gross Profit, 2017-2021 (US$ million, AGR%)
Figure 142 CGG: Net Profit 2017-2021 (US$ million, AGR%)
Figure 143 CGG: EBITDA, 2017-2021 (US$ million, AGR%)
Figure 144 Siemens AG: Net Revenue, 2017-2021 (US$ million, AGR%)
Figure 145 Siemens AG: Gross Profit, 2017-2021 (US$ million, AGR%)
Figure 146 Siemens AG: Net Profit 2017-2021 (US$ million, AGR%)
Figure 147 Siemens AG: EBITDA, 2017-2021 (US$ million, AGR%)
ページTOPに戻る
本レポートと同じKEY WORD(ad)の最新刊レポート
- 本レポートと同じKEY WORDの最新刊レポートはありません。
よくあるご質問
Visiongain社はどのような調査会社ですか?
英国の調査会社ヴィジョンゲイン社(Visiongain)は、通信とエネルギーのほか、自動車や化学・医薬品、金属など、広範な市場を対象に調査を行っています。自動車市場については、市場全般に関する調査のほ... もっと見る
調査レポートの納品までの日数はどの程度ですか?
在庫のあるものは速納となりますが、平均的には 3-4日と見て下さい。
但し、一部の調査レポートでは、発注を受けた段階で内容更新をして納品をする場合もあります。
発注をする前のお問合せをお願いします。
注文の手続きはどのようになっていますか?
1)お客様からの御問い合わせをいただきます。
2)見積書やサンプルの提示をいたします。
3)お客様指定、もしくは弊社の発注書をメール添付にて発送してください。
4)データリソース社からレポート発行元の調査会社へ納品手配します。
5) 調査会社からお客様へ納品されます。最近は、pdfにてのメール納品が大半です。
お支払方法の方法はどのようになっていますか?
納品と同時にデータリソース社よりお客様へ請求書(必要に応じて納品書も)を発送いたします。
お客様よりデータリソース社へ(通常は円払い)の御振り込みをお願いします。
請求書は、納品日の日付で発行しますので、翌月最終営業日までの当社指定口座への振込みをお願いします。振込み手数料は御社負担にてお願いします。
お客様の御支払い条件が60日以上の場合は御相談ください。
尚、初めてのお取引先や個人の場合、前払いをお願いすることもあります。ご了承のほど、お願いします。
データリソース社はどのような会社ですか?
当社は、世界各国の主要調査会社・レポート出版社と提携し、世界各国の市場調査レポートや技術動向レポートなどを日本国内の企業・公官庁及び教育研究機関に提供しております。
世界各国の「市場・技術・法規制などの」実情を調査・収集される時には、データリソース社にご相談ください。
お客様の御要望にあったデータや情報を抽出する為のレポート紹介や調査のアドバイスも致します。
|
|


