医薬品開発業務受託機関(CROs)市場レポート:2022-2032
Contract Research Organisations (CROs) Market Report 2022-2032
レポート詳細
医薬品開発業務受託機関 ( CROs )市場レポート 2022-2032 :本レポートは、新たな収益の柱を目指すリーディングカンパニーが、業界とその背景にあるダイナミクスをより深く理解する... もっと見る
※上記価格は部署ライセンス(Departmental licence)価格です。
その他の価格についてはデータリソースまでお問合せください。
日本語のページは自動翻訳を利用し作成しています。
実際のレポートは英文のみでご納品いたします。

|
サマリー
レポート詳細
医薬品開発業務受託機関(CROs)市場レポート 2022-2032:本レポートは、新たな収益の柱を目指すリーディングカンパニーが、業界とその背景にあるダイナミクスをより深く理解する上で、非常に有益なものとなるでしょう。また、異業種への進出や新地域での既存事業の拡大を目指す企業にとっても有用なレポートです。
特許切れと後発医薬品の需要増がCROs全体の成長を牽引すると予測
ジェネリック医薬品の需要を後押ししている主な要因の一つは、増加する医療費の抑制圧力です。特許切れによって、より安価なジェネリック医薬品の参入が可能になった。ジェネリック医薬品製造会社は、製造の80%以上をCDMOに委託しているため、特許切れは市場の活況を示すポジティブな兆候と言えます。2021年に特許が切れた有名な薬には、Roche社のLucentis、Galen社のAdasuve、Mylan社のPerformist、Lundbeck社のNorthera、Emergent BioSolutions社のNarcanなどがある。
サプライチェーンの混乱は市場の妨げになる可能性が高い
製薬業界は、特定の場所で発生する自然災害によるサプライチェーンの混乱の影響を受けやすい。例えば、2年前のCOVID-19のパンデミックや最近のサル痘の発生など、混乱はより頻繁になってきているため、高い在庫水準だけではサプライチェーンのショックから身を守るには不十分であると言えます。サプライチェーンの中断を管理するには予見的な計画が必要であり、大手 CROs のいくつかは既に不足の予見と解決に非常に熟練している。しかし、小規模の CROs は、サプライチェーンの途絶に直面する可能性が高い。
大規模な CROs は、将来的な財政的制約に備え、大量の在庫を保有する財 務能力を有している。一方、中小の CROs はサプライチェーンを管理し、欠品を防 ぐために必要なインフラやリソースに乏しい。スポンサー管理、人材不足、市場統合などの困難はあるが、研究開発委託の需要は今後も CROs ビジネスを支えます。
マーケットリサーチレポートを購入する前に、どのような質問をすべきでしょうか?
- 医薬品開発業務受託機関(CROs)市場はどのように進化しているのか?
- 医薬品開発業務受託機関(CROs)市場の推進要因と阻害要因は何か?
- 各医薬品開発業務受託機関(CROs)サブマーケット区分は予測期間中にどのように成長し、これらのサブマーケットが2032年に占める収益はどの程度になるのでしょうか?
- 2022年から2032年にかけて、各医薬品開発業務受託機関(CROs)サブマーケットの市場シェアはどのように推移するのでしょうか?
- 2022年から2032年にかけて、市場全体の主なドライバーは何でしょうか?
- 主要な医薬品開発業務受託機関(CROs)市場はマクロ経済のダイナミクスに概ね追随するのか、それとも個々の国内市場が他を凌駕するのか?
- 2032年までに各国市場のシェアはどのように変化し、どの地域が2032年の市場をリードするのでしょうか?
- 主要プレイヤーは誰か、また予測期間中の展望は?
- これらのリーディングカンパニーに対する医薬品開発業務受託機関(CROs)のプロジェクトはどのようなものか?
- 2020年から2032年の間に、業界はどのように進化するのか?現在および今後 10 年間に実施される 医薬品開発業務受託機関(CROs)プロジェクトはどのような意味を持つのか?
- 医薬品開発業務受託機関(CROs)市場をさらに拡大するために、製品の商業化の必要性は高まっているか?
- 医薬品開発業務受託機関(CROs)市場の方向性と、市場の最前線に立つためにはどうすればよいか?
- 新製品やサービスラインに対する最適な投資オプションは何か?
- 企業を新たな成長軌道に乗せ、C-suiteに移行させるための重要な展望とは?
このことが、現在、そして今後10年間の医薬品開発業務受託機関(CROs)市場にどのような影響を与えるかを知る必要があります。
- 本レポートは305ページにわたり、116の表と180のグラフを掲載しています。
- このレポートでは、業界における主要な収益性の高い分野をハイライトしているため、今すぐターゲットを絞ることができます。
- 世界、地域、国別の売上高と成長率を詳細に分析しています。
- 競合他社が成功した主なトレンド、変化、収益予測をハイライトしています。
本レポートは、今後10年間に医薬品開発業務受託機関(CROs)市場がどのように発展するか、またCOVID-19の景気後退と回復の変動に合わせて、今日のあなたにお伝えします。この市場は、過去10年間のどの時点よりも今が重要であると思っています。
レポートでは、COVID-19のバリエーションや経済データなど、お客様の市場に特化した独自の情報をお届けしています。
2032年までの予測やその他の分析により、商業的な展望が見えてくる
- 2032年までの収益予測に加え、直近の実績、成長率、市場シェアもご覧いただけます。
- ビジネスの展望や展開など、独自の分析もご覧いただけます。
- 定性的分析(市場力学、促進要因、機会、阻害要因、課題など)、コスト構造、医薬品開発業務受託機関(CROs)価格上昇の影響、最近の動向などをご覧いただけます。
本レポートでは、COVID-19が業界と貴社にどのような影響を与えるかについて、データ分析と貴重な洞察を掲載しています。本レポートでは、COVID-19の4つの回収パターンとその影響、すなわち「V」、「L」、「W」、「U」について論じています。
報告書の対象セグメント
サービス別展望
- 前臨床
- 臨床試験
- フェーズI
- フェーズII
- フェーズIII
- フェーズIV
- ラボラトリーサービス
- コンサルティングサービス
- データマネジメントサービス
企業規模別展望
- 大手製薬会社・バイオテクノロジー会社
- 中規模製薬会社、バイオテクノロジー会社
- 小規模製薬会社・バイオテクノロジー会社
薬剤タイプ別展望
- 低分子化合物
- 高分子化合物
治療領域別展望
- オンコロジー
- 中枢神経系
- 循環器領域
- 感染症領域
- 代謝性疾患
- その他
世界市場全体およびセグメントの収益予測に加え、4地域および20の主要国市場の収益予測も掲載しています。
北アメリカ
- 米国
- カナダ
欧州
- ドイツ
- 英国
- フランス
- イタリア
- スペイン
- その他の欧州地域
アジア太平洋
- 中国
- 日本
- インド
- オーストラリア
- 韓国
- その他のアジア太平洋地域
ラテンアメリカ
- ブラジル
- メヒオ
- その他のラテンアメリカ地域
MEA
- GCC
- 南アフリカ
-その他のMEA地域
本レポートでは、医薬品開発業務受託機関(CROs)市場の2022年から2032年にかけての主要企業のプロファイルと、これらの企業のこのセグメントを中心とした情報を掲載しています。
主要企業と市場成長の可能性
・ Charles River Laboratories
・ Clinipace
・ CMIC HOLDING Co., LTD.
・ EPS Corporation
・ ICON plc
・ IQVIA HOLDINGS INC.
・ Labcorp Drug Development
・ MedPace
・ Parexel
・ PPD (Thermofisher Scientific Inc.)
・ Syneos Health
・ Worldwide Clinical Trials
・ Wuxi AppTec
医薬品開発業務受託機関(CROs)市場の世界全体の収益、金額ベースで2022年から2032年まで、市場は2022年に620億米ドルを超えると、我々の仕事は計算しています。2032年まで力強い収益成長が予測される。
私たちの仕事は、どの組織が最大の可能性を秘めているかを特定することです。その能力、進歩、商業的展望を発見し、一歩先を行くためのお手伝いをします。
医薬品開発業務受託機関(CROs)市場、2022年から2032年までのレポートはどのように役立つのでしょうか?
300ページを超えるレポートでは、要約すると以下のような知識を得ることができます。
- 受託研究機関(CROs)市場の2032年までの収益予測、サービス、企業規模、薬剤タイプ、治療分野の各予測を世界および地域レベルで掲載 - 投資と収益に最も有利な場所を見つけ、業界の展望を発見することができます。
- 4地域と13主要国市場の2032年までの収益予測 - 北米、欧州、アジア太平洋、中南米、MEAの医薬品開発業務受託機関(CROs)市場、2022年から2032年までの市場予測をご覧いただけます。また、米国、カナダ、メキシコ、ブラジル、ドイツ、フランス、イギリス、イタリア、中国、インド、日本、オーストラリアなど、主要経済圏の市場も予測しています。
- 既存企業および市場参入を目指す企業の展望 - 医薬品開発業務受託機関(CROs)市場に関わる主要企業13社の企業プロファイルを含む、2022年から2032年までの展望。
定量的・定性的な分析と独自の予測をご覧いただけます。私たちのレポートだけが持つ情報を入手し、貴重なビジネスインテリジェンスを得ることができます。
他にはない情報
私たちの新しいレポートがあれば、知識の遅れを取り戻し、チャンスを逃す可能性が低くなります。私たちの研究が貴社の研究、分析、意思決定にどのように役立つかをご覧ください。Visiongainの研究は、医薬品開発業務受託機関(CROs)市場の2022年から2032年、市場をリードする企業のための商業分析を必要とするすべての人のためのものです。データ、トレンド、予測を見つけることができます。
ページTOPに戻る
目次
目次
1.レポートの概要
1.1 調査の目的
1.2 医薬品開発業務受託機関(CROs)市場の紹介
1.3 本レポートの特徴
1.4 本レポートを読むべき理由
1.5 本分析報告書が回答する主な質問には以下が含まれる
1.6 本レポートは誰のためのものなのか
1.7 方法論
1.7.1 市場の定義
1.7.2 市場評価・予測手法
1.7.3 データの検証
1.7.3.1 一次調査
1.7.3.2 セカンダリーリサーチ
1.8 よくある質問(FAQ)
1.9 関連するVisiongainのレポート
1.10 Visiongainについて
2 エグゼクティブサマリー
3 市場の概要
3.1 主要な調査結果
3.2 マーケットダイナミクス
3.2.1 市場の推進要因
3.2.1.1 世界的な臨床試験需要の高まり
3.2.1.2 世界的な疾病負担の増大がCROs市場の成長を促進する
3.2.1.3 製薬会社やバイオテクノロジー企業による研究開発投資の増加がCROs市場の成長を後押し
3.2.1.4 特許切れとジェネリック医薬品の需要増加がCROsの成長を牽引
3.2.2 市場阻害要因
3.2.2.1 知的財産権の問題はCROs産業の成長を阻害する可能性がある
3.2.2.2 COVID-19後の熟練労働者不足がCRO業界の妨げとなる
3.2.3 市場機会
3.2.3.1 人工知能の応用により、臨床試験の迅速化、安全性、費用の大幅な削減が期待される
3.2.3.2 生物学的治療に対する需要の高まりは、CROsに有利な成長見通しを提供する。
3.2.3.3 核医学分野の成長
3.3 COVID-19影響度分析
3.4 ポーターのファイブフォース分析
3.4.1.1 競争相手との競合:高い
3.4.1.2 新規参入の脅威。低~中
3.4.1.3 代替品の脅威。低~中
3.4.1.4 買い手のバーゲニングパワー中位から高位
3.4.1.5 供給者の交渉力:中〜高中位から高位
3.5 PEST分析
3.6 パンデミックの中、製薬業界はどのように適応してきたか?
3.7 なぜ CROs は M&A を行うのか?
3.8 M&A の件数と公開市場バリュエーション
4 世界の医薬品開発業務受託機関(CROs)市場分析:サービス別
4.1 主な調査結果
4.2 サービス分野での成長展望
4.3 世界のサービス別医薬品開発業務受託機関(CROs)市場規模予測・予測
4.4 前臨床
4.4.1 地域別市場予測、2022年〜2032年 (US$ Mn)
4.4.2 地域別市場シェア、2022年&2032年(%)
4.5 臨床試験
4.5.1 地域別市場予測、2022年~2032年(US$ Mn)
4.5.2 地域別市場シェア、2022年&2032年(%)
4.6 ラボラトリーサービス
4.6.1 地域別市場予測、2022年~2032年 (US$ Mn)
4.6.2 地域別市場シェア、2022年&2032年(%)
4.7 コンサルティングサービス
4.7.1 地域別市場予測、2022年~2032年(US$ Mn)
4.7.2 地域別市場シェア、2022年&2032年(%)
4.8 データマネジメントサービス
4.8.1 地域別市場予測、2022年~2032年(US$ Mn)
4.8.2 地域別市場シェア、2022年&2032年(%)
5 世界の医薬品開発業務受託機関(CROs)市場分析:企業規模別
5.1 主な調査結果
5.2 企業規模別セグメント成長展望
5.3 企業規模別医薬品開発業務受託機関(CROs)世界市場規模推定・予測
5.4 大手製薬会社・バイオテクノロジー会社
5.4.1 地域別市場予測、2022-2032年 (US$ Mn)
5.4.2 地域別市場シェア、2022年&2032年(%)
5.5 中堅製薬会社・バイオテクノロジー会社
5.5.1 地域別市場予測、2022年~2032年(US$ Mn)
5.5.2 地域別市場シェア、2022年&2032年(%)
5.6 中堅製薬会社・バイオテクノロジー会社
5.6.1 地域別市場予測、2022年~2032年 (US$ Mn)
5.6.2 地域別市場シェア、2022年&2032年(%)
6 世界の医薬品開発業務受託機関(CROs)市場分析:薬剤タイプ別
6.1 主な調査結果
6.2 薬剤タイプ別成長展望
6.3 世界の医薬品開発業務受託機関(CROs)市場規模予測・予測:薬剤タイプ別
6.4 低分子化合物
6.4.1 地域別市場予測、2022-2032年 (US$ Mn)
6.4.2 地域別市場シェア、2022年&2032年(%)
6.5 大型分子
6.5.1 地域別市場予測、2022年〜2032年(US$ Mn)
6.5.2 地域別市場シェア、2022年&2032年(%)
7 世界の医薬品開発業務受託機関(CROs)の市場分析:治療領域別
7.1 主要な調査結果
7.2 治療分野別成長展望
7.3 世界の医薬品開発業務受託機関(CROs)の治療領域別市場規模の推定と予測
7.4 オンコロジー
7.4.1 地域別市場予測、2022-2032年 (US$ Mn)
7.4.2 地域別市場シェア、2022年&2032年(%)
7.5 CNS
7.5.1 地域別市場予測、2022年~2032年 (US$ Mn)
7.5.2 地域別市場シェア、2022年&2032年(%)
7.6 循環器領域
7.6.1 地域別市場予測、2022年〜2032年 (US$ Mn)
7.6.2 地域別市場シェア、2022年&2032年(%)
7.7 感染症
7.7.1 地域別市場予測、2022年~2032年 (US$ Mn)
7.7.2 地域別市場シェア、2022年&2032年(%)
7.8 メタボリック
7.8.1 地域別市場予測、2022年~2032年 (US$ Mn)
7.8.2 地域別市場シェア、2022年&2032年(%) 8.2 地域別市場シェア、2022年&2032年(%) 9 その他
7.9 その他
7.9.1 地域別市場予測、2022年〜2032年 (US$ Mn)
7.9.2 地域別市場シェア、2022年&2032年(%)
8 世界の医薬品開発業務受託機関(CROs)市場分析:地域別
8.1 主な調査結果
8.2 地域別市場規模の推定と予測
8.3 COVID-19の影響度分析。回復シナリオ(V, U, W, L)
9 北米の医薬品開発業務受託機関(CROs)市場分析
9.1 主な調査結果
9.2 北米医薬品開発業務受託機関(CROs)市場魅力度指数
9.3 国別市場規模、2022年、2027年&2032年 (US$Mn)(単位:百万円)
9.4 国別市場規模予測・予測、2022年~2032年(US$ Mn)
9.5 サービス別市場規模推計・予測、2022年~2032年(US$ Mn)
9.5.1 臨床フェーズ別市場規模予測、2022年~2032年(US$ Mn)
9.6 企業規模別市場規模予測・予測、2022年~2032年(US$ Mn)
9.7 薬剤タイプ別市場規模推定・予測、2022年~2032年 (US$ Mn)
9.8 治療領域別市場規模推定・予測、2022年~2032年 (US$ Mn)
9.9 米国CROs市場の分析
9.10 カナダCROs市場の分析
10 欧州の医薬品開発業務受託機関(CROs)市場分析
10.1 主な調査結果
10.2 欧州医薬品開発業務受託機関(CROs)市場魅力度指数
10.3 国別市場規模、2022年、2027年&2032年 (US$Mn)(単位:百万円)
10.4 国別市場規模推計・予測、2022年~2032年(US$ Mn)
10.5 サービス別市場規模推計・予測、2022年~2032年(US$ Mn)
10.5.1 臨床フェーズ別市場規模予測、2022年~2032年(US$ Mn)
10.6 企業規模別市場規模予測・予測、2022年~2032年(US$ Mn)
10.7 薬剤タイプ別市場規模推定・予測、2022年~2032年 (US$ Mn)
10.8 治療分野別市場規模推定・予測、2022年~2032年 (US$ Mn)
10.9 ドイツCROs市場の分析
10.10 英国CROs市場の分析
10.11 フランスCROs市場の分析
10.12 イタリア CROs 市場の分析
10.13 スペイン CROs の市場分析
10.14 その他の欧州CROs市場の分析
11 アジア太平洋地域の医薬品開発業務受託機関(CROs)市場分析
11.1 主要な調査結果
11.2 アジア太平洋地域の医薬品開発業務受託機関(CROs)市場の魅力度指数
11.3 国別市場規模、2022年、2027年&2032年 (US$Mn)予測
11.4 国別市場規模推計・予測、2022年~2032年(US$ Mn)
11.5 サービス別市場規模推計・予測、2022年~2032年(US$ Mn)
11.5.1 臨床フェーズ別市場規模予測、2022年~2032年(US$ Mn)
11.6 企業規模別市場規模予測・予測、2022年~2032年(US$ Mn)
11.7 薬剤タイプ別市場規模推定・予測、2022年~2032年 (US$ Mn)
11.8 治療領域別市場規模推定・予測、2022年~2032年 (US$ Mn)
11.9 日本CROs市場の分析
11.10 中国 CROs 市場の分析
11.11 インド CROs市場の分析
11.12 オーストラリア CROs の市場分析
11.13 韓国 CROs 市場の分析
11.14 その他のアジア太平洋地域CROsの市場分析
12 ラテンアメリカの医薬品開発業務受託機関(CROs)市場分析
12.1 主な調査結果
12.2 ラテンアメリカの医薬品開発業務受託機関(CROs)市場の魅力度指数
12.3 国別市場規模、2022年、2027年&2032年 (US$Mn)予測
12.4 国別市場規模予測・予測、2022年~2032年(US$ Mn)
12.5 サービス別市場規模推計・予測、2022年~2032年(US$ Mn)
12.5.1 臨床フェーズ別市場規模予測、2022年~2032年(US$ Mn)
12.6 企業規模別市場規模予測・予測、2022年~2032年(US$ Mn)
12.7 薬剤タイプ別市場規模推定・予測、2022年~2032年 (US$ Mn)
12.8 治療分野別市場規模推定・予測、2022年~2032年 (US$ Mn)
12.9 ブラジルCROs市場の分析
12.10 メキシコCROs市場の分析
12.11 ラテンアメリカのその他
13 MEAの医薬品開発業務受託機関(CROs)市場分析
13.1 主要な調査結果
13.2 MEA医薬品開発業務受託機関(CROs)市場の魅力度指数
13.3 国別市場規模、2022年、2027年&2032年 (US$Mn)予測
13.4 国別市場規模予測・予測、2022年~2032年(US$ Mn)
13.5 サービス別市場規模推計・予測、2022年~2032年(US$ Mn)
13.5.1 臨床フェーズ別市場規模予測、2022年~2032年(US$ Mn)
13.6 企業規模別市場規模予測・予測、2022年~2032年 (US$ Mn)
13.7 薬剤タイプ別市場規模推定・予測、2022年~2032年 (US$ Mn)
13.8 治療分野別市場規模推定・予測、2022年~2032年 (US$ Mn)
13.9 GCCのCROsの市場分析
13.10 南アフリカのCROs市場分析
13.11 その他のMEA CROs市場の分析
14 主要企業のプロフィール
14.1 競合他社の状況、2021年
14.2 チャールズ・リバー・ラボラトリーズ
14.2.1 企業スナップショット
14.2.2 会社概要
14.2.3 財務分析
14.2.3.1 純収益、2016-2021年
14.2.3.2 地域別市場シェア、2021年
14.2.3.3 売上総利益、2016年~2021年
14.2.4 製品ベンチマーク
14.2.5 戦略的な展望
14.3 クリニペース
14.3.1 企業スナップショット
14.3.2 会社概要
14.3.3 ベンチマーキング
14.4 シミックホールディングス
14.4.1 企業スナップショット
14.4.2 会社概要
14.4.3 財務分析
14.4.3.1 純収益、2016-2021年
14.4.4 製品ベンチマーク
14.4.5 戦略的な展望
14.5 株式会社イーピーエス
14.5.1 企業スナップショット
14.5.2 会社概要
14.5.3 財務分析
14.5.3.1 純収益、2016-2021年
14.5.4 製品ベンチマーク
14.6 アイコン・ピーエルシー
14.6.1 企業スナップショット
14.6.2 会社概要
14.6.3 財務分析
14.6.3.1 純収益、2016-2021年
14.6.3.2 売上総利益、2016年-2021年
14.6.4 製品ベンチマーク
14.6.5 戦略的な展望
14.7 イクヴィア・ホールディングス
14.7.1 企業スナップショット
14.7.2 会社概要
14.7.3 財務分析
14.7.3.1 純収益、2016-2021年
14.7.3.2 地域別市場シェア、2021年
14.7.3.3 売上総利益、2016年-2021年
14.7.4 製品ベンチマーク
14.7.5 戦略的な展望
14.8 Labcorpの医薬品開発
14.8.1 企業スナップショット
14.8.2 会社概要
14.8.3 財務分析
14.8.3.1 純収益、2016-2021年
14.8.3.2 地域別市場シェア、2021年
14.8.3.3 売上総利益、2016年-2021年
14.8.4 製品ベンチマーク
14.8.5 戦略的展望
14.9 メドペース
14.9.1 企業スナップショット
14.9.2 会社概要
14.9.3 財務分析
14.9.3.1 純収益、2016-2021年
14.9.3.2 売上総利益、2016年-2021年
14.9.4 製品ベンチマーク
14.10 パレクセル
14.10.1 企業スナップショット
14.10.2 会社概要
14.10.3 製品ベンチマーク
14.10.4 戦略的な展望
14.11 PPD(サーモフィッシャーサイエンティフィック)
14.11.1 企業スナップショット
14.11.2 会社概要
14.11.3 財務分析
14.11.3.1 純収益、2016-2021年
14.11.3.2 地域別市場シェア、2021年
14.11.3.3 売上総利益、2016年-2021年
14.11.3.4 R&D、2016-2021年
14.11.4 製品ベンチマーク
14.11.5 戦略的な展望
14.12 シネオス・ヘルス
14.12.1 企業スナップショット
14.12.2 会社概要
14.12.3 財務分析
14.12.3.1 純収益、2016-2021年
14.12.3.2 地域別市場シェア、2021年
14.12.3.3 売上総利益、2016年-2021年
14.12.4 製品ベンチマーク
14.12.5 戦略的な展望
14.13 世界の臨床試験
14.13.1 企業スナップショット
14.13.2 会社概要
14.13.3 製品ベンチマーク
14.13.4 戦略的展望
14.14 無錫 AppTec
14.14.1 企業スナップショット
14.14.2 会社概要
14.14.3 財務分析
14.14.3.1 純収益、2016-2021年
14.14.3.2 地域別市場シェア、2021年
14.14.3.3 売上総利益、2016年〜2020年
14.14.4 製品ベンチマーク
14.14.5 戦略的展望
15 結論と提言
15.1 ヴィジョンゲインからの結論
15.2 市場関係者への提言
表の一覧
Table 1 Global Contract Research Organizations (CROs) Market Snapshot, 2022 & 2032 (US$ million, CAGR %)
Table 2 Global Contract Research Organizations (CRO) Market Forecast by Region, 2022-2032 (US$ mn, AGR%, CAGR%): "V" Shaped Recovery
Table 3 Global Contract Research Organizations (CRO) Market Forecast by Region, 2022-2032 (US$ mn, AGR%, CAGR%): "U" Shaped Recovery
Table 4 Global Contract Research Organizations (CRO) Market Forecast by Region, 2022-2032 (US$ mn, AGR%, CAGR%): "W" Shaped Recovery
Table 5 Global Contract Research Organizations (CRO) Market Forecast by Region, 2022-2032 (US$ mn, AGR%, CAGR%): "L" Shaped Recovery
Table 6 Global Contract Research Organizations (CRO) Market Forecast by Service, 2022-2032 (US$ mn, AGR%, CAGR%)
Table 7 Preclinical Segment Market Forecast by Region, 2022-2032 (US$ mn, AGR%, CAGR%)
Table 8 Preclinical Segment Market Forecast by Region, 2022-2032 (US$ mn, AGR%, CAGR%)
Table 9 Laboratory Services Segment Market Forecast by Region, 2022-2032 (US$ mn, AGR%, CAGR%)
Table 10 Consulting Services Segment Market Forecast by Region, 2022-2032 (US$ mn, AGR%, CAGR%)
Table 11 Data Management Services Segment Market Forecast by Region, 2022-2032 (US$ mn, AGR%, CAGR%)
Table 12 Global Contract Research Organizations (CRO) Market Forecast by Company Size, 2022-2032 (US$ mn, AGR%, CAGR%)
Table 13 Large Pharma & Biotech Companies Segment Market Forecast by Region, 2022-2032 (US$ mn, AGR%, CAGR%)
Table 14 Mid-sized Pharma & Biotech Companies Segment Market Forecast by Region, 2022-2032 (US$ mn, AGR%, CAGR%)
Table 15 Small Pharma & Biotech Companies Segment Market Forecast by Region, 2022-2032 (US$ mn, AGR%, CAGR%)
Table 16 Global Contract Research Organizations (CRO) Market Forecast by Drug Type, 2022-2032 (US$ mn, AGR%, CAGR%)
Table 17 Small Molecules Segment Market Forecast by Region, 2022-2032 (US$ mn, AGR%, CAGR%)
Table 18 Large Molecules Segment Market Forecast by Region, 2022-2032 (US$ mn, AGR%, CAGR%)
Table 19 Global Contract Research Organizations (CRO) Market Forecast by Therapeutic Area, 2022-2032 (US$ mn, AGR%, CAGR%)
Table 20 Oncology Segment Market Forecast by Region, 2022-2032 (US$ mn, AGR%, CAGR%)
Table 21 CNS Segment Market Forecast by Region, 2022-2032 (US$ mn, AGR%, CAGR%)
Table 22 Cardiology Segment Market Forecast by Region, 2022-2032 (US$ mn, AGR%, CAGR%)
Table 23 Infectious Segment Market Forecast by Region, 2022-2032 (US$ mn, AGR%, CAGR%)
Table 24 Metabolic Segment Market Forecast by Region, 2022-2032 (US$ mn, AGR%, CAGR%)
Table 25 Others Segment Market Forecast by Region, 2022-2032 (US$ mn, AGR%, CAGR%)
Table 26 Global Contract Research Organizations (CRO) Market Forecast by Region, 2022-2032 (US$ mn, AGR%, CAGR%)
Table 27 Global Contract Research Organizations (CRO) Market Forecast by Region, 2022-2032 (US$ mn, AGR%, CAGR%): "V" Shaped Recovery
Table 28 Global Contract Research Organizations (CRO) Market Forecast by Region, 2022-2032 (US$ mn, AGR%, CAGR%): "U" Shaped Recovery
Table 29 Global Contract Research Organizations (CRO) Market Forecast by Region, 2022-2032 (US$ mn, AGR%, CAGR%): "W" Shaped Recovery
Table 30 Global Contract Research Organizations (CRO) Market Forecast by Region, 2022-2032 (US$ mn, AGR%, CAGR%): "L" Shaped Recovery
Table 31 North America Contract Research Organizations (CRO) Market Forecast by Country, 2022-2032 (US$ mn, AGR%, CAGR%)
Table 32 North America Contract Research Organizations (CRO) Market Forecast by Service, 2022-2032 (US$ mn, AGR%, CAGR%)
Table 33 North America Contract Research Organizations (CRO) Market Forecast by Clinical Phase, 2022-2032 (US$ mn, AGR%, CAGR%)
Table 34 North America Contract Research Organizations (CRO) Market Forecast by Company Size, 2022-2032 (US$ mn, AGR%, CAGR%)
Table 35 North America Contract Research Organizations (CRO) Market Forecast by Drug Type, 2022-2032 (US$ mn, AGR%, CAGR%)
Table 36 North America Contract Research Organizations (CRO) Market Forecast by Therapeutic Area, 2022-2032 (US$ mn, AGR%, CAGR%)
Table 37 U.S. Contract Research Organizations (CRO) Market Forecast, 2022-2032 (US$ mn, AGR%, CAGR%)
Table 38 Canada Contract Research Organizations (CRO) Market Forecast, 2022-2032 (US$ mn, AGR%, CAGR%)
Table 39 Europe Contract Research Organizations (CRO) Market Forecast by Country, 2022-2032 (US$ mn, AGR%, CAGR%)
Table 40 Europe Contract Research Organizations (CRO) Market Forecast by Service, 2022-2032 (US$ mn, AGR%, CAGR%)
Table 41 Europe Contract Research Organizations (CRO) Market Forecast by Clinical Phase, 2022-2032 (US$ mn, AGR%, CAGR%)
Table 42 Europe Contract Research Organizations (CRO) Market Forecast by Company Size, 2022-2032 (US$ mn, AGR%, CAGR%)
Table 43 Europe Contract Research Organizations (CRO) Market Forecast by Drug Type, 2022-2032 (US$ mn, AGR%, CAGR%)
Table 44 Europe Contract Research Organizations (CRO) Market Forecast by Therapeutic Area, 2022-2032 (US$ mn, AGR%, CAGR%)
Table 45 Germany Contract Research Organizations (CRO) Market Forecast, 2022-2032 (US$ mn, AGR%, CAGR%)
Table 46 UK Contract Research Organizations (CRO) Market Forecast, 2022-2032 (US$ mn, AGR%, CAGR%)
Table 47 France Contract Research Organizations (CRO) Market Forecast, 2022-2032 (US$ mn, AGR%, CAGR%)
Table 48 Italy Contract Research Organizations (CRO) Market Forecast, 2022-2032 (US$ mn, AGR%, CAGR%)
Table 49 Spain Contract Research Organizations (CRO) Market Forecast, 2022-2032 (US$ mn, AGR%, CAGR%)
Table 50 Rest of Europe Contract Research Organizations (CRO) Market Forecast, 2022-2032 (US$ mn, AGR%, CAGR%)
Table 51 Asia Pacific Contract Research Organizations (CRO) Market Forecast by Country, 2022-2032 (US$ mn, AGR%, CAGR%)
Table 52 Asia Pacific Contract Research Organizations (CRO) Market Forecast by Service, 2022-2032 (US$ mn, AGR%, CAGR%)
Table 53 Asia Pacific Contract Research Organizations (CRO) Market Forecast by Clinical Phase, 2022-2032 (US$ mn, AGR%, CAGR%)
Table 54 Asia Pacific Contract Research Organizations (CRO) Market Forecast by Company Size, 2022-2032 (US$ mn, AGR%, CAGR%)
Table 55 Asia Pacific Contract Research Organizations (CRO) Market Forecast by Drug Type, 2022-2032 (US$ mn, AGR%, CAGR%)
Table 56 Asia Pacific Contract Research Organizations (CRO) Market Forecast by Therapeutic Area, 2022-2032 (US$ mn, AGR%, CAGR%)
Table 57 Japan Contract Research Organizations (CRO) Market Forecast, 2022-2032 (US$ mn, AGR%, CAGR%)
Table 58 China Contract Research Organizations (CRO) Market Forecast, 2022-2032 (US$ mn, AGR%, CAGR%)
Table 59 India Contract Research Organizations (CRO) Market Forecast, 2022-2032 (US$ mn, AGR%, CAGR%)
Table 60 Australia Contract Research Organizations (CRO) Market Forecast, 2022-2032 (US$ mn, AGR%, CAGR%)
Table 61 South Korea Contract Research Organizations (CRO) Market Forecast, 2022-2032 (US$ mn, AGR%, CAGR%)
Table 62 Rest of Asia Pacific Contract Research Organizations (CRO) Market Forecast, 2022-2032 (US$ mn, AGR%, CAGR%)
Table 63 Latin America Contract Research Organizations (CRO) Market Forecast by Country, 2022-2032 (US$ mn, AGR%, CAGR%)
Table 64 Latin America Contract Research Organizations (CRO) Market Forecast by Service, 2022-2032 (US$ mn, AGR%, CAGR%)
Table 65 Latin America Contract Research Organizations (CRO) Market Forecast by Clinical Phase, 2022-2032 (US$ mn, AGR%, CAGR%)
Table 66 Latin America Contract Research Organizations (CRO) Market Forecast by Company Size, 2022-2032 (US$ mn, AGR%, CAGR%)
Table 67 Latin America Contract Research Organizations (CRO) Market Forecast by Drug Type, 2022-2032 (US$ mn, AGR%, CAGR%)
Table 68 Latin America Contract Research Organizations (CRO) Market Forecast by Therapeutic Area, 2022-2032 (US$ mn, AGR%, CAGR%)
Table 69 Brazil Contract Research Organizations (CRO) Market Forecast, 2022-2032 (US$ mn, AGR%, CAGR%)
Table 70 Mexico Contract Research Organizations (CRO) Market Forecast, 2022-2032 (US$ mn, AGR%, CAGR%)
Table 71 Rest of Latin America Contract Research Organizations (CRO) Market Forecast, 2022-2032 (US$ mn, AGR%, CAGR%)
Table 72 MEA Contract Research Organizations (CRO) Market Forecast by Country, 2022-2032 (US$ mn, AGR%, CAGR%)
Table 73 MEA Contract Research Organizations (CRO) Market Forecast by Service, 2022-2032 (US$ mn, AGR%, CAGR%)
Table 74 MEA Contract Research Organizations (CRO) Market Forecast by Clinical Phase, 2022-2032 (US$ mn, AGR%, CAGR%)
Table 75 MEA Contract Research Organizations (CRO) Market Forecast by Company Size, 2022-2032 (US$ mn, AGR%, CAGR%)
Table 76 MEA Contract Research Organizations (CRO) Market Forecast by Drug Type, 2022-2032 (US$ mn, AGR%, CAGR%)
Table 77 MEA Contract Research Organizations (CRO) Market Forecast by Therapeutic Area, 2022-2032 (US$ mn, AGR%, CAGR%)
Table 78 GCC Contract Research Organizations (CRO) Market Forecast, 2022-2032 (US$ mn, AGR%, CAGR%)
Table 79 South Africa Contract Research Organizations (CRO) Market Forecast, 2022-2032 (US$ mn, AGR%, CAGR%)
Table 80 Rest of MEA Contract Research Organizations (CRO) Market Forecast, 2022-2032 (US$ mn, AGR%, CAGR%)
Table 81 Charles River Laboratories: Key Details, (CEO, HQ, Revenue, Founded, No. of Employees, Company Type, Website, Business Segment)
Table 82 Charles River Laboratories: Product Benchmarking
Table 83 Charles River Laboratories: Strategic Outlook
Table 84 Clinipace: Key Details, (CEO, HQ, Revenue, Founded, No. of Employees, Company Type, Website, Business Segment)
Table 85 Clinipace: Product Benchmarking
Table 86 CMIC HOLDING Co., LTD.: Key Details, (CEO, HQ, Revenue, Founded, No. of Employees, Company Type, Website, Business Segment)
Table 87 CMIC HOLDING Co., LTD.: Product Benchmarking
Table 88 CMIC HOLDING Co., LTD.: Strategic Outlook
Table 89 EPS Corporation: Key Details, (CEO, HQ, Revenue, Founded, No. of Employees, Company Type, Website, Business Segment)
Table 90 EPS Corporation: Product Benchmarking
Table 91 ICON plc: Key Details, (CEO, HQ, Revenue, Founded, No. of Employees, Company Type, Website, Business Segment)
Table 92 ICON plc: Product Benchmarking
Table 93 ICON plc: Strategic Outlook
Table 94 IQVIA HOLDINGS INC.: Key Details, (CEO, HQ, Revenue, Founded, No. of Employees, Company Type, Website, Business Segment)
Table 95 IQVIA HOLDINGS INC.: Product Benchmarking
Table 96 IQVIA HOLDINGS INC.: Strategic Outlook
Table 97 Labcorp Drug Development: Key Details, (CEO, HQ, Revenue, Founded, No. of Employees, Company Type, Website, Business Segment)
Table 98 Labcorp Drug Development: Product Benchmarking
Table 99 Labcorp Drug Development: Strategic Outlook
Table 100 MedPace: Key Details, (CEO, HQ, Revenue, Founded, No. of Employees, Company Type, Website, Business Segment)
Table 101 MedPace: Product Benchmarking
Table 102 Parexel: Key Details, (CEO, HQ, Revenue, Founded, No. of Employees, Company Type, Website, Business Segment)
Table 103 Parexel: Product Benchmarking
Table 104 Parexel: Strategic Outlook
Table 105 PPD: Key Details, (CEO, HQ, Revenue, Founded, No. of Employees, Company Type, Website, Business Segment)
Table 106 PPD: Product Benchmarking
Table 107 PPD: Strategic Outlook
Table 108 Syneos Health: Key Details, (CEO, HQ, Revenue, Founded, No. of Employees, Company Type, Website, Business Segment)
Table 109 Syneos Health: Product Benchmarking
Table 110 Syneos Health: Strategic Outlook
Table 111 Worldwide Clinical Trials: Key Details, (CEO, HQ, Revenue, Founded, No. of Employees, Company Type, Website, Business Segment)
Table 112 Worldwide Clinical Trials: Product Benchmarking
Table 113 Worldwide Clinical Trials: Strategic Outlook
Table 114 Wuxi AppTec: Key Details, (CEO, HQ, Revenue, Founded, No. of Employees, Company Type, Website, Business Segment)
Table 115 Wuxi AppTec: Product Benchmarking
Table 116 Wuxi AppTec: Strategic Outlook
図の一覧
Figure 1 Global Contract Research Organizations (CROs) Market Segmentation
Figure 2 Global Contract Research Organizations (CROs) Market by Services: Market Attractiveness Index
Figure 3 Global Contract Research Organizations (CROs) Market by Company Size: Market Attractiveness Index
Figure 4 Global Contract Research Organizations (CROs) Market by Drug Type: Market Attractiveness Index
Figure 5 Global Contract Research Organizations (CROs) Market by Therapeutic Area: Market Attractiveness Index
Figure 6 Global Contract Research Organizations (CROs) Market Attractiveness Index by Region
Figure 7 Global Contract Research Organizations (CROs) Market: Market Dynamics
Figure 8 Global Contract Research Organizations (CROs) Market by Region, 2022-2032 (US$ Mn, AGR (%), CAGR (%)): “V” Shaped Recovery
Figure 9 Global Contract Research Organizations (CROs) Market by Region, 2022-2032 (US$ Mn, AGR (%), CAGR (%)): “U” Shaped Recovery
Figure 10 Global Contract Research Organizations (CROs) Market by Region, 2022-2032 (US$ Mn, AGR (%), CAGR (%)): “W” Shaped Recovery
Figure 11 Global Contract Research Organizations (CROs) Market by Region, 2022-2032 (US$ Mn, AGR (%), CAGR (%)): “L” Shaped Recovery
Figure 12 Porter’s Five Forces Analysis
Figure 13 PEST Analysis
Figure 14 Deal Volume, 2017-2021
Figure 15 Global Contract Research Organizations (CROs) Market Attractiveness Index by Services
Figure 16 Global Contract Research Organizations (CROs) Market Forecast by Services, 2022-2032 (US$ million)
Figure 17 Global Contract Research Organizations (CROs) Market Share Forecast by Services, 2022, 2027, 2032 (%)
Figure 18 Preclinical Market Forecast by Region, 2022-2032 (US$ million)
Figure 19 Preclinical Market Share Forecast by Region, 2022 & 2032 (%)
Figure 20 Clinical Market Forecast by Region, 2022-2032 (US$ million)
Figure 21 Clinical Market Share Forecast by Region, 2022 & 2032 (%)
Figure 22 Laboratory Services Market Forecast by Region, 2022-2032 (US$ million)
Figure 23 Laboratory Services Market Share Forecast by Region, 2022 & 2032 (%)
Figure 24 Consulting Services Market Forecast by Region, 2022-2032 (US$ million)
Figure 25 Consulting Services Market Share Forecast by Region, 2022 & 2032 (%)
Figure 26 Data Management Services Market Forecast by Region, 2022-2032 (US$ million)
Figure 27 Data Management Services Market Share Forecast by Region, 2022 & 2032 (%)
Figure 28 Global Contract Research Organizations (CROs) Market Attractiveness Index by Company Size
Figure 29 Global Contract Research Organizations (CROs) Market Forecast by Company Size, 2022-2032 (US$ million)
Figure 30 Global Contract Research Organizations (CROs) Market Share Forecast by Company Size, 2022, 2027, 2032 (%)
Figure 31 Large Pharma & Biotech Companies Market Forecast by Region, 2022-2032 (US$ million)
Figure 32 Large Pharma & Biotech Companies Market Share Forecast by Region, 2022 & 2032 (%)
Figure 33 Mid-sized Pharma & Biotech Companies Market Forecast by Region, 2022-2032 (US$ million)
Figure 34 Mid-sized Pharma & Biotech Companies Market Share Forecast by Region, 2022 & 2032 (%)
Figure 35 Small Pharma & Biotech Companies Market Forecast by Region, 2022-2032 (US$ million)
Figure 36 Small Pharma & Biotech Companies Market Share Forecast by Region, 2022 & 2032 (%)
Figure 37 Global Contract Research Organizations (CROs) Market Attractiveness Index by Drug Type
Figure 38 Global Contract Research Organizations (CROs) Market Forecast by Drug Type, 2022-2032 (US$ million)
Figure 39 Global Contract Research Organizations (CROs) Market Share Forecast by Drug Type, 2022, 2027, 2032 (%)
Figure 40 Small Molecules Market Forecast by Region, 2022-2032 (US$ million)
Figure 41 Small Molecules Market Share Forecast by Region, 2022 & 2032 (%)
Figure 42 Large Molecules Market Forecast by Region, 2022-2032 (US$ million)
Figure 43 Large Molecules Market Share Forecast by Region, 2022 & 2032 (%)
Figure 44 Global Contract Research Organizations (CROs) Market Attractiveness Index by Therapeutic Area
Figure 45 Global Contract Research Organizations (CROs) Market Forecast by Therapeutic Area, 2022-2032 (US$ million)
Figure 46 Global Contract Research Organizations (CROs) Market Share Forecast by Therapeutic Area, 2022, 2027, 2032 (%)
Figure 47 Oncology Market Forecast by Region, 2022-2032 (US$ million)
Figure 48 Oncology Market Share Forecast by Region, 2022 & 2032 (%)
Figure 49 CNS Market Forecast by Region, 2022-2032 (US$ million)
Figure 50 CNS Market Share Forecast by Region, 2022 & 2032 (%)
Figure 51 Cardiology Market Forecast by Region, 2022-2032 (US$ million)
Figure 52 Cardiology Market Share Forecast by Region, 2022 & 2032 (%)
Figure 53 Infectious Market Forecast by Region, 2022-2032 (US$ million)
Figure 54 Infectious Market Share Forecast by Region, 2022 & 2032 (%)
Figure 55 Metabolic Market Forecast by Region, 2022-2032 (US$ million)
Figure 56 Metabolic Market Share Forecast by Region, 2022 & 2032 (%)
Figure 57 Others Market Forecast by Region, 2022-2032 (US$ million)
Figure 58 Others Market Share Forecast by Region, 2022 & 2032 (%)
Figure 59 Global Contract Research Organizations (CROs) Market Forecast by Region 2022, 2027, 2032 (Revenue, CAGR %)
Figure 60 Global Contract Research Organizations (CROs) Market Share Forecast by Region 2022, 2027, 2032(%)
Figure 61 Global Contract Research Organizations (CROs) Market by Region, 2022-2032 (US$ Mn, AGR (%), CAGR (%))
Figure 62 Global Contract Research Organizations (CROs) Market by Region, 2022-2032 (US$ Mn, AGR (%), CAGR (%)): “V” Shaped Recovery
Figure 63 Global Contract Research Organizations (CROs) Market by Region, 2022-2032 (US$ Mn, AGR (%), CAGR (%)): “U” Shaped Recovery
Figure 64 Global Contract Research Organizations (CROs) Market by Region, 2022-2032 (US$ Mn, AGR (%), CAGR (%)): “W” Shaped Recovery
Figure 65 Global Contract Research Organizations (CROs) Market by Region, 2022-2032 (US$ Mn, AGR (%), CAGR (%)): “L” Shaped Recovery
Figure 66 North America Contract Research Organizations (CROs) Market Attractiveness Index
Figure 67 North America Contract Research Organizations (CROs) Market by Region, 2022, 2027 & 2032 (US$ million)
Figure 68 North America Contract Research Organizations (CROs) Market Forecast by Country, 2022-2032 (US$ million)
Figure 69 North America Contract Research Organizations (CROs) Market Share Forecast by Country, 2022 & 2032 (%)
Figure 70 North America Contract Research Organizations (CROs) Market Forecast by Services, 2022-2032 (US$ million)
Figure 71 North America Contract Research Organizations (CROs) Market Share Forecast by Services, 2022 & 2032 (%)
Figure 72 North America Contract Research Organizations (CROs) Market Forecast by Company Size, 2022-2032 (US$ million)
Figure 73 North America Contract Research Organizations (CROs) Market Share Forecast by Clinical Phase, 2022 & 2032 (%)
Figure 74 North America Contract Research Organizations (CROs) Market Forecast by Company Size, 2022-2032 (US$ million)
Figure 75 North America Contract Research Organizations (CROs) Market Share Forecast by Company Size, 2022 & 2032 (%)
Figure 76 North America Contract Research Organizations (CROs) Market Forecast by Drug Type, 2022-2032 (US$ million)
Figure 77 North America Contract Research Organizations (CROs) Market Share Forecast by Drug Type, 2022 & 2032 (%)
Figure 78 North America Contract Research Organizations (CROs) Market Forecast by Therapeutic Area, 2022-2032 (US$ million)
Figure 79 North America Contract Research Organizations (CROs) Market Share Forecast by Therapeutic Area, 2022 & 2032 (%)
Figure 80 U.S. Contract Research Organizations (CROs) Market Forecast, 2022-2032 (US$ million)
Figure 81 Canada Contract Research Organizations (CROs) Market Forecast, 2022-2032 (US$ million)
Figure 82 Europe Contract Research Organizations (CROs) Market Attractiveness Index
Figure 83 Europe Contract Research Organizations (CROs) Market by Region, 2022, 2027 & 2032 (US$ million)
Figure 84 Europe Contract Research Organizations (CROs) Market Forecast by Country, 2022-2032 (US$ million)
Figure 85 Europe Contract Research Organizations (CROs) Market Share Forecast by Country, 2022 & 2032 (%)
Figure 86 Europe Contract Research Organizations (CROs) Market Forecast by Services, 2022-2032 (US$ million)
Figure 87 Europe Contract Research Organizations (CROs) Market Share Forecast by Services, 2022 & 2032 (%)
Figure 88 Europe Contract Research Organizations (CROs) Market Forecast by Company Size, 2022-2032 (US$ million)
Figure 89 Europe Contract Research Organizations (CROs) Market Share Forecast by Clinical Phase, 2022 & 2032 (%)
Figure 90 Europe Contract Research Organizations (CROs) Market Forecast by Company Size, 2022-2032 (US$ million)
Figure 91 Europe Contract Research Organizations (CROs) Market Share Forecast by Company Size, 2022 & 2032 (%)
Figure 92 Europe Contract Research Organizations (CROs) Market Forecast by Drug Type, 2022-2032 (US$ million)
Figure 93 Europe Contract Research Organizations (CROs) Market Share Forecast by Drug Type, 2022 & 2032 (%)
Figure 94 Europe Contract Research Organizations (CROs) Market Forecast by Therapeutic Area, 2022-2032 (US$ million)
Figure 95 Europe Contract Research Organizations (CROs) Market Share Forecast by Therapeutic Area, 2022 & 2032 (%)
Figure 96 Germany Contract Research Organizations (CROs) Market Forecast, 2022-2032 (US$ million)
Figure 97 UK Contract Research Organizations (CROs) Market Forecast, 2022-2032 (US$ million)
Figure 98 France Contract Research Organizations (CROs) Market Forecast, 2022-2032 (US$ million)
Figure 99 Italy Contract Research Organizations (CROs) Market Forecast, 2022-2032 (US$ million)
Figure 100 Spain Contract Research Organizations (CROs) Market Forecast, 2022-2032 (US$ million)
Figure 101 Rest of Europe Contract Research Organizations (CROs) Market Forecast, 2022-2032 (US$ million)
Figure 102 Asia Pacific Contract Research Organizations (CROs) Market Attractiveness Index
Figure 103 Asia Pacific Contract Research Organizations (CROs) Market by Region, 2022, 2027 & 2032 (US$ million)
Figure 104 Asia Pacific Contract Research Organizations (CROs) Market Forecast by Country, 2022-2032 (US$ million)
Figure 105 Asia Pacific Contract Research Organizations (CROs) Market Share Forecast by Country, 2022 & 2032 (%)
Figure 106 Asia Pacific Contract Research Organizations (CROs) Market Forecast by Services, 2022-2032 (US$ million)
Figure 107 Asia Pacific Contract Research Organizations (CROs) Market Share Forecast by Services, 2022 & 2032 (%)
Figure 108 Asia Pacific Contract Research Organizations (CROs) Market Forecast by Clinical Phase, 2022-2032 (US$ million)
Figure 109 Asia Pacific Contract Research Organizations (CROs) Market Share Forecast by Clinical Phase, 2022 & 2032 (%)
Figure 110 Asia Pacific Contract Research Organizations (CROs) Market Forecast by Company Size, 2022-2032 (US$ million)
Figure 111 Asia Pacific Contract Research Organizations (CROs) Market Share Forecast by Company Size, 2022 & 2032 (%)
Figure 112 Asia Pacific Contract Research Organizations (CROs) Market Forecast by Drug Type, 2022-2032 (US$ million)
Figure 113 Asia Pacific Contract Research Organizations (CROs) Market Share Forecast by Drug Type, 2022 & 2032 (%)
Figure 114 Asia Pacific Contract Research Organizations (CROs) Market Forecast by Therapeutic Area, 2022-2032 (US$ million)
Figure 115 Asia Pacific Contract Research Organizations (CROs) Market Share Forecast by Therapeutic Area, 2022 & 2032 (%)
Figure 116 Japan Contract Research Organizations (CROs) Market Forecast, 2022-2032 (US$ million)
Figure 117 China Contract Research Organizations (CROs) Market Forecast, 2022-2032 (US$ million)
Figure 118 India Contract Research Organizations (CROs) Market Forecast, 2022-2032 (US$ million)
Figure 119 Australia Contract Research Organizations (CROs) Market Forecast, 2022-2032 (US$ million)
Figure 120 South Korea Contract Research Organizations (CROs) Market Forecast, 2022-2032 (US$ million)
Figure 121 Rest of Asia Pacific Contract Research Organizations (CROs) Market Forecast, 2022-2032 (US$ million)
Figure 122 Latin America Contract Research Organizations (CROs) Market Attractiveness Index
Figure 123 Latin America Contract Research Organizations (CROs) Market by Region, 2022, 2027 & 2032 (US$ million)
Figure 124 Latin America Contract Research Organizations (CROs) Market Forecast by Country, 2022-2032 (US$ million)
Figure 125 Latin America Contract Research Organizations (CROs) Market Share Forecast by Country, 2022 & 2032 (%)
Figure 126 Latin America Contract Research Organizations (CROs) Market Forecast by Services, 2022-2032 (US$ million)
Figure 127 Latin America Contract Research Organizations (CROs) Market Share Forecast by Services, 2022 & 2032 (%)
Figure 128 Latin America Contract Research Organizations (CROs) Market Forecast by Company Size, 2022-2032 (US$ million)
Figure 129 Latin America Contract Research Organizations (CROs) Market Share Forecast by Clinical Phase, 2022 & 2032 (%)
Figure 130 Latin America Contract Research Organizations (CROs) Market Forecast by Company Size, 2022-2032 (US$ million)
Figure 131 Latin America Contract Research Organizations (CROs) Market Share Forecast by Company Size, 2022 & 2032 (%)
Figure 132 Latin America Contract Research Organizations (CROs) Market Forecast by Drug Type, 2022-2032 (US$ million)
Figure 133 Latin America Contract Research Organizations (CROs) Market Share Forecast by Drug Type, 2022 & 2032 (%)
Figure 134 Latin America Contract Research Organizations (CROs) Market Forecast by Therapeutic Area, 2022-2032 (US$ million)
Figure 135 Latin America Contract Research Organizations (CROs) Market Share Forecast by Therapeutic Area, 2022 & 2032 (%)
Figure 136 Brazil Contract Research Organizations (CROs) Market Forecast, 2022-2032 (US$ million)
Figure 137 Mexico Contract Research Organizations (CROs) Market Forecast, 2022-2032 (US$ million)
Figure 138 Rest of Latin America Contract Research Organizations (CROs) Market Forecast, 2022-2032 (US$ million)
Figure 139 MEA Contract Research Organizations (CROs) Market Attractiveness Index
Figure 140 MEA Contract Research Organizations (CROs) Market by Region, 2022, 2027 & 2032 (US$ million)
Figure 141 MEA Contract Research Organizations (CROs) Market Forecast by Country, 2022-2032 (US$ million)
Figure 142 MEA Contract Research Organizations (CROs) Market Share Forecast by Country, 2022 & 2032 (%)
Figure 143 MEA Contract Research Organizations (CROs) Market Forecast by Services, 2022-2032 (US$ million)
Figure 144 MEA Contract Research Organizations (CROs) Market Share Forecast by Services, 2022 & 2032 (%)
Figure 145 MEA Contract Research Organizations (CROs) Market Forecast by Company Size, 2022-2032 (US$ million)
Figure 146 MEA Contract Research Organizations (CROs) Market Share Forecast by Clinical Phase, 2022 & 2032 (%)
Figure 147 MEA Contract Research Organizations (CROs) Market Forecast by Company Size, 2022-2032 (US$ million)
Figure 148 MEA Contract Research Organizations (CROs) Market Share Forecast by Company Size, 2022 & 2032 (%)
Figure 149 MEA Contract Research Organizations (CROs) Market Forecast by Drug Type, 2022-2032 (US$ million)
Figure 150 MEA Contract Research Organizations (CROs) Market Share Forecast by Drug Type, 2022 & 2032 (%)
Figure 151 MEA Contract Research Organizations (CROs) Market Forecast by Therapeutic Area, 2022-2032 (US$ million)
Figure 152 MEA Contract Research Organizations (CROs) Market Share Forecast by Therapeutic Area, 2022 & 2032 (%)
Figure 153 GCC Contract Research Organizations (CROs) Market Forecast, 2022-2032 (US$ million)
Figure 154 South Africa Contract Research Organizations (CROs) Market Forecast, 2022-2032 (US$ million)
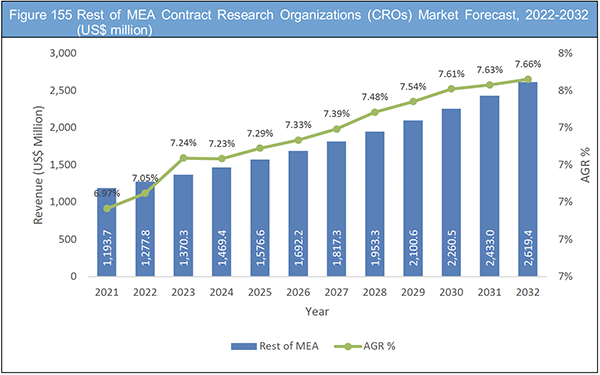
Figure 155 Rest of MEA Contract Research Organizations (CROs) Market Forecast, 2022-2032 (US$ million)
Figure 156 Global Contract Research Organizations (CROs) Market: Company Share/Ranking, 2021
Figure 157 Charles River Laboratories: Net Revenue, 2016-2021 (US$ million, AGR %)
Figure 158 Charles River Laboratories: Regional Market Shares (%), 2021
Figure 159 Charles River Laboratories: Gross Profit, 2016-2021 (US$ million, AGR %)
Figure 160 CMIC HOLDING Co., LTD.: Net Revenue, 2016-2021 (US$ million, AGR %)
Figure 161 EPS Corporation: Net Revenue, 2016-2021 (US$ million, AGR %)
Figure 162 ICON plc: Net Revenue, 2016-2021 (US$ million, AGR %)
Figure 163 ICON plc: Gross Profit, 2016-2021 (US$ million, AGR %)
Figure 164 IQVIA HOLDINGS INC.: Net Revenue, 2016-2021 (US$ million, AGR %)
Figure 165 IQVIA HOLDINGS INC.: Regional Market Shares (%), 2021
Figure 166 IQVIA HOLDINGS INC.: Gross Profit, 2016-2021 (US$ million, AGR %)
Figure 167 Labcorp Drug Development: Net Revenue, 2016-2021 (US$ million, AGR %)
Figure 168 Labcorp Drug Development: Regional Market Shares (%), 2021
Figure 169 Labcorp Drug Development: Gross Profit, 2016-2021 (US$ million, AGR %)
Figure 170 MedPace: Net Revenue, 2016-2021 (US$ million, AGR %)
Figure 171 MedPace: Gross Profit, 2016-2021 (US$ million, AGR %)
Figure 172 PPD: Net Revenue, 2016-2021 (US$ million, AGR %)
Figure 173 PPD: Regional Market Shares (%), 2021
Figure 174 PPD: Gross Profit, 2016-2021 (US$ million, AGR %)
Figure 175 PPD: R&D, 2016-2021 (US$ million, AGR %)
Figure 176 Syneos Health: Net Revenue, 2016-2021 (US$ million, AGR %)
Figure 177 Syneos Health: Regional Market Shares (%), 2021
Figure 178 Syneos Health: Gross Profit, 2016-2021 (US$ million, AGR %)
Figure 179 Wuxi AppTec: Net Revenue, 2016-2021 (US$ million, AGR %)
Figure 180 Wuxi AppTec: Regional Market Shares (%), 2021
Figure 181 Wuxi AppTec: Gross Profit, 2016-2020 (US$ million, AGR %)
ページTOPに戻る
Summary
この調査レポートは世界の医薬品開発業務受託機関(CROs)市場を調査し、サービス別、企業規模別、薬剤タイプ別、治療領域別、地域別に2022年から2032年までの予測結果を掲載しています。また関連企業情報を提供しています。
主な掲載内容(目次より抜粋)
-
レポート概要
-
エグゼクティブサマリー
-
市場概要
-
世界の医薬品開発業務受託機関(CROs)市場分析:サービス別
-
世界のCROs市場分析:企業規模別
-
世界のCROs市場分析:薬剤タイプ別
-
世界のCROs市場分析:治療領域別
-
世界のCROs市場分析:地域別
-
北米の医薬品開発業務受託機関(CROs)市場分析
-
欧州のCROs市場分析
-
アジア太平洋地域のCROs市場分析
-
ラテンアメリカのCROs市場分析
-
MEAのCROs市場分析
-
主要企業のプロフィール
Report Details
The Contract Research Organizations (CROs) Market Report 2022-2032: This report will prove invaluable to leading firms striving for new revenue pockets if they wish to better understand the industry and its underlying dynamics. It will be useful for companies that would like to expand into different industries or to expand their existing operations in a new region.
Patent Expiry and Increasing Demand for Generic Drugs Projected to Drive Overall CROs Growth
One of the main factors fuelling the demand for generics is the pressure to lower the rising healthcare expenses. The market entry of various less expensive generic substitutes was made possible by patent expiration. Since generic manufacturing firms contract with CDMOs for over 80% of their manufacturing, patent expiration is a positive indication of a booming market. Some of the well-known medications whose patents ran out in 2021 include Lucentis from Roche, Adasuve from Galen, Performist from Mylan, Northera from Lundbeck, and Narcan from Emergent BioSolutions.
Supply Chain Disruptions Likely to Hamper Market
The pharmaceutical sector is susceptible to supply chain disruptions caused by natural disasters in a particular location. High inventory levels alone are insufficient to protect against supply chain shocks since disruptions are becoming more frequent, for instance, the COVID-19 pandemic two years ago and the recent monkeypox outbreak. Anticipatory planning is necessary for managing supply chain interruptions, and several of the large CROs are already highly proficient at foreseeing and resolving shortages. Smaller CROs, however, are more likely to face supply chain disruptions.
The larger CROs have the financial capacity to keep large inventory in case of future financial constraints. The smaller CROs lack the infrastructure and resources necessary to manage supply chains and prevent shortages. Despite difficulties including managing sponsors, workforce scarcity, and market consolidation, the demand for outsourced R&D services will continue to support the CRO business.
What Questions Should You Ask before Buying a Market Research Report?
• How is the Contract Research Organizations (CROs) market evolving?
• What is driving and restraining the Contract Research Organizations (CROs) market?
• How will each Contract Research Organizations (CROs) submarket segment grow over the forecast period and how much revenue will these submarkets account for in 2032?
• How will the market shares for each Contract Research Organizations (CROs) submarket develop from 2022 to 2032?
• What will be the main driver for the overall market from 2022 to 2032?
• Will leading Contract Research Organizations (CROs) markets broadly follow the macroeconomic dynamics, or will individual national markets outperform others?
• How will the market shares of the national markets change by 2032 and which geographical region will lead the market in 2032?
• Who are the leading players and what are their prospects over the forecast period?
• What are the Contract Research Organizations (CROs) projects for these leading companies?
• How will the industry evolve during the period between 2020 and 2032? What are the implications of Contract Research Organizations (CROs) projects taking place now and over the next 10 years?
• Is there a greater need for product commercialisation to further scale the Contract Research Organizations (CROs) market?
• Where is the Contract Research Organizations (CROs) market heading and how can you ensure you are at the forefront of the market?
• What are the best investment options for new product and service lines?
• What are the key prospects for moving companies into a new growth path and C-suite?
You need to discover how this will impact the Contract Research Organizations (CROs) market today, and over the next 10 years:
• Our 305-page report provides 116 tables and 180 charts/graphs exclusively to you.
• The report highlights key lucrative areas in the industry so you can target them – NOW.
• It contains in-depth analysis of global, regional and national sales and growth.
• It highlights for you the key successful trends, changes and revenue projections made by your competitors.
This report tells you TODAY how the Contract Research Organizations (CROs) market will develop in the next 10 years, and in line with the variations in COVID-19 economic recession and bounce. This market is more critical now than at any point over the last 10 years.
The report delivers exclusive COVID-19 variations and economic data specific to your market.
To access the data contained in this document, please email contactus@visiongain.com
Forecasts to 2032 and other analyses reveal commercial prospects
• In addition to revenue forecasting to 2032, our new study provides you with recent results, growth rates, and market shares.
• You will find original analyses, with business outlooks and developments.
• Discover qualitative analyses (including market dynamics, drivers, opportunities, restraints and challenges), cost structure, impact of rising Contract Research Organizations (CROs) prices and recent developments.
This report includes data analysis and invaluable insight into how COVID-19 will affect the industry and your company. Four COVID-19 recovery patterns and their impact, namely, “V”, “L”, “W” and “U” are discussed in this report.
Segments Covered in the Report
Services Outlook
• Preclinical
• Clinical
– Phase I
– Phase II
– Phase III
– Phase IV
• Laboratory Services
• Consulting Services
• Data Management Services
Company Size Outlook
• Large Pharma & Biotech Companies
• Mid-sized Pharma & Biotech Companies
• Small Pharma & Biotech Companies
Drug Type Outlook
• Small Molecules
• Large Molecules
Therapeutic Area Outlook
• Oncology
• CNS
• Cardiology
• Infectious
• Metabolic
• Others
In addition to the revenue predictions for the overall world market and segments, you will also find revenue forecasts for four regional and 20 leading national markets:
North America
• U.S.
• Canada
Europe
• Germany
• UK
• France
• Italy
• Spain
• Rest of Europe
Asia Pacific
• China
• Japan
• India
• Australia
• South Korea
• Rest of Asia Pacific
Latin America
• Brazil
• Mexio
• Rest of Latin America
MEA
• GCC
• South Africa
• Rest of MEA
The report also includes profiles and for some of the leading companies in the Contract Research Organizations (CROs) Market, 2022 to 2032, with a focus on this segment of these companies’ operations.
Leading companies and the potential for market growth
• Charles River Laboratories
• Clinipace
• CMIC HOLDING Co., LTD.
• EPS Corporation
• ICON plc
• IQVIA HOLDINGS INC.
• Labcorp Drug Development
• MedPace
• Parexel
• PPD (Thermofisher Scientific Inc.)
• Syneos Health
• Worldwide Clinical Trials
• Wuxi AppTec
Overall world revenue for Contract Research Organizations (CROs) Market, 2022 to 2032 in terms of value the market will surpass US$62 billion in 2022, our work calculates. We predict strong revenue growth through to 2032.
Our work identifies which organizations hold the greatest potential. Discover their capabilities, progress, and commercial prospects, helping you stay ahead.
How will the Contract Research Organizations (CROs) Market, 2022 to 2032 report help you?
In summary, our 300+ page report provides you with the following knowledge:
• Revenue forecasts to 2032 for Contract Research Organizations (CROs) Market, 2022 to 2032 Market, with forecasts for services, company size, drug type, and therapeutic area each forecast at a global and regional level – discover the industry’s prospects, finding the most lucrative places for investments and revenues.
• Revenue forecasts to 2032 for four regional and 13 key national markets – See forecasts for the Contract Research Organizations (CROs) Market, 2022 to 2032 market in North America, Europe, Asia-Pacific, Latin America, and MEA. Also forecasted is the market in the US, Canada, Mexico, Brazil, Germany, France, UK, Italy, China, India, Japan, and Australia among other prominent economies.
• Prospects for established firms and those seeking to enter the market – including company profiles for 13 of the major companies involved in the Contract Research Organizations (CROs) Market, 2022 to 2032.
Find quantitative and qualitative analyses with independent predictions. Receive information that only our report contains, staying informed with invaluable business intelligence.
Information found nowhere else
With our new report, you are less likely to fall behind in knowledge or miss out on opportunities. See how our work could benefit your research, analyses, and decisions. Visiongain’s study is for everybody needing commercial analyses for the Contract Research Organizations (CROs) Market, 2022 to 2032, market-leading companies. You will find data, trends and predictions.
ページTOPに戻る
Table of Contents
Table of Contents
1. Report Overview
1.1 Objectives of the Study
1.2 Introduction to Contract Research Organizations (CROs) Market
1.3 What This Report Delivers
1.4 Why You Should Read This Report
1.5 Key Questions Answered By This Analytical Report Include:
1.6 Who is This Report For?
1.7 Methodology
1.7.1 Market Definitions
1.7.2 Market Evaluation & Forecasting Methodology
1.7.3 Data Validation
1.7.3.1 Primary Research
1.7.3.2 Secondary Research
1.8 Frequently Asked Questions (FAQs)
1.9 Associated Visiongain Reports
1.10 About Visiongain
2 Executive Summary
3 Market Overview
3.1 Key Findings
3.2 Market Dynamics
3.2.1 Market Driving Factors
3.2.1.1 Rising Demand for Clinical Trials Globally
3.2.1.2 Growing Disease Burden Globally to Fuel CROs Market Growth
3.2.1.3 Rising R&D Investments by Pharmaceutical and Biotech Companies to Boost CROs Market Growth
3.2.1.4 Patent Expiry and Increasing Demand for Generic Drugs Projected to Drive Overall CROs Growth
3.2.2 Market Restraining Factors
3.2.2.1 Intellectual Property Issues May Hamper CROs Industry Growth
3.2.2.2 Shortage of Skilled Labour Post COVID-19 Hampering CRO Industry
3.2.3 Market Opportunities
3.2.3.1 Applications of Artificial Intelligence Could Lead to Faster, Safer and Significantly Less Expensive Clinical Trials
3.2.3.2 Increasing Demand for Biological Therapies to Offer Lucrative Growth Prospects for CROs
3.2.3.3 Growth in Nuclear Medicine Sector
3.3 COVID-19 Impact Analysis
3.4 Porter’s Five Forces Analysis
3.4.1.1 Competitive Rivalry: High
3.4.1.2 Threat of New Entrants: Low to Medium
3.4.1.3 Threat of Substitutes: Low to Medium
3.4.1.4 Bargaining Power of Buyers: Medium to High
3.4.1.5 Bargaining Power of Suppliers: Medium to High
3.5 PEST Analysis
3.6 How has the Pharmaceutical Industry Adapted Amidst the Pandemic?
3.7 Why are CROs Adopting Mergers & Acquisitions?
3.8 Mergers & Acquisitions Volume and Public Market Valuations
4 Global Contract Research Organizations (CROs) Market Analysis by Services
4.1 Key Findings
4.2 Services Segment Growth Prospects
4.3 Global Contract Research Organizations (CROs) Market Size Estimation and Forecast by Services
4.4 Preclinical
4.4.1 Market Forecast by Region, 2022-2032 (US$ Mn)
4.4.2 Market Share by Region, 2022 & 2032 (%)
4.5 Clinical
4.5.1 Market Forecast by Region, 2022-2032 (US$ Mn)
4.5.2 Market Share by Region, 2022 & 2032 (%)
4.6 Laboratory Services
4.6.1 Market Forecast by Region, 2022-2032 (US$ Mn)
4.6.2 Market Share by Region, 2022 & 2032 (%)
4.7 Consulting Services
4.7.1 Market Forecast by Region, 2022-2032 (US$ Mn)
4.7.2 Market Share by Region, 2022 & 2032 (%)
4.8 Data Management Services
4.8.1 Market Forecast by Region, 2022-2032 (US$ Mn)
4.8.2 Market Share by Region, 2022 & 2032 (%)
5 Global Contract Research Organizations (CROs) Market Analysis by Company Size
5.1 Key Findings
5.2 Company Size Segment Growth Prospects
5.3 Global Contract Research Organizations (CROs) Market Size Estimation and Forecast by Company Size
5.4 Large Pharma & Biotech Companies
5.4.1 Market Forecast by Region, 2022-2032 (US$ Mn)
5.4.2 Market Share by Region, 2022 & 2032 (%)
5.5 Mid-sized Pharma & Biotech Companies
5.5.1 Market Forecast by Region, 2022-2032 (US$ Mn)
5.5.2 Market Share by Region, 2022 & 2032 (%)
5.6 Small Pharma & Biotech Companies
5.6.1 Market Forecast by Region, 2022-2032 (US$ Mn)
5.6.2 Market Share by Region, 2022 & 2032 (%)
6 Global Contract Research Organizations (CROs) Market Analysis by Drug Type
6.1 Key Findings
6.2 Drug Type Segment Growth Prospects
6.3 Global Contract Research Organizations (CROs) Market Size Estimation and Forecast by Drug Type
6.4 Small Molecules
6.4.1 Market Forecast by Region, 2022-2032 (US$ Mn)
6.4.2 Market Share by Region, 2022 & 2032 (%)
6.5 Large Molecules
6.5.1 Market Forecast by Region, 2022-2032 (US$ Mn)
6.5.2 Market Share by Region, 2022 & 2032 (%)
7 Global Contract Research Organizations (CROs) Market Analysis by Therapeutic Area
7.1 Key Findings
7.2 Therapeutic Area Segment Growth Prospects
7.3 Global Contract Research Organizations (CROs) Market Size Estimation and Forecast by Therapeutic Area
7.4 Oncology
7.4.1 Market Forecast by Region, 2022-2032 (US$ Mn)
7.4.2 Market Share by Region, 2022 & 2032 (%)
7.5 CNS
7.5.1 Market Forecast by Region, 2022-2032 (US$ Mn)
7.5.2 Market Share by Region, 2022 & 2032 (%)
7.6 Cardiology
7.6.1 Market Forecast by Region, 2022-2032 (US$ Mn)
7.6.2 Market Share by Region, 2022 & 2032 (%)
7.7 Infectious
7.7.1 Market Forecast by Region, 2022-2032 (US$ Mn)
7.7.2 Market Share by Region, 2022 & 2032 (%)
7.8 Metabolic
7.8.1 Market Forecast by Region, 2022-2032 (US$ Mn)
7.8.2 Market Share by Region, 2022 & 2032 (%)
7.9 Others
7.9.1 Market Forecast by Region, 2022-2032 (US$ Mn)
7.9.2 Market Share by Region, 2022 & 2032 (%)
8 Global Contract Research Organizations (CROs) Market Analysis by Region
8.1 Key Findings
8.2 Regional Market Size Estimation and Forecast
8.3 COVID-19 Impact Analysis: Recovery Scenarios (V, U, W, L)
9 North America Contract Research Organizations (CROs) Market Analysis
9.1 Key Findings
9.2 North America Contract Research Organizations (CROs) Market Attractiveness Index
9.3 Market Size by Country, 2022, 2027 & 2032 (US$ Mn)
9.4 Market Size Estimation and Forecast by Country, 2022-2032 (US$ Mn)
9.5 Market Size Estimation and Forecast by Services, 2022-2032 (US$ Mn)
9.5.1 Market Forecast by Clinical Phase, 2022-2032 (US$ Mn)
9.6 Market Size Estimation and Forecast by Company Size, 2022-2032 (US$ Mn)
9.7 Market Size Estimation and Forecast by Drug Type, 2022-2032 (US$ Mn)
9.8 Market Size Estimation and Forecast by Therapeutic Area, 2022-2032 (US$ Mn)
9.9 U.S. CROs Market Analysis
9.10 Canada CROs Market Analysis
10 Europe Contract Research Organizations (CROs) Market Analysis
10.1 Key Findings
10.2 Europe Contract Research Organizations (CROs) Market Attractiveness Index
10.3 Market Size by Country, 2022, 2027 & 2032 (US$ Mn)
10.4 Market Size Estimation and Forecast by Country, 2022-2032 (US$ Mn)
10.5 Market Size Estimation and Forecast by Services, 2022-2032 (US$ Mn)
10.5.1 Market Forecast by Clinical Phase, 2022-2032 (US$ Mn)
10.6 Market Size Estimation and Forecast by Company Size, 2022-2032 (US$ Mn)
10.7 Market Size Estimation and Forecast by Drug Type, 2022-2032 (US$ Mn)
10.8 Market Size Estimation and Forecast by Therapeutic Area, 2022-2032 (US$ Mn)
10.9 Germany CROs Market Analysis
10.10 UK CROs Market Analysis
10.11 France CROs Market Analysis
10.12 Italy CROs Market Analysis
10.13 Spain CROs Market Analysis
10.14 Rest of Europe CROs Market Analysis
11 Asia Pacific Contract Research Organizations (CROs) Market Analysis
11.1 Key Findings
11.2 Asia Pacific Contract Research Organizations (CROs) Market Attractiveness Index
11.3 Market Size by Country, 2022, 2027 & 2032 (US$ Mn)
11.4 Market Size Estimation and Forecast by Country, 2022-2032 (US$ Mn)
11.5 Market Size Estimation and Forecast by Services, 2022-2032 (US$ Mn)
11.5.1 Market Forecast by Clinical Phase, 2022-2032 (US$ Mn)
11.6 Market Size Estimation and Forecast by Company Size, 2022-2032 (US$ Mn)
11.7 Market Size Estimation and Forecast by Drug Type, 2022-2032 (US$ Mn)
11.8 Market Size Estimation and Forecast by Therapeutic Area, 2022-2032 (US$ Mn)
11.9 Japan CROs Market Analysis
11.10 China CROs Market Analysis
11.11 India CROs Market Analysis
11.12 Australia CROs Market Analysis
11.13 South Korea CROs Market Analysis
11.14 Rest of Asia Pacific CROs Market Analysis
12 Latin America Contract Research Organizations (CROs) Market Analysis
12.1 Key Findings
12.2 Latin America Contract Research Organizations (CROs) Market Attractiveness Index
12.3 Market Size by Country, 2022, 2027 & 2032 (US$ Mn)
12.4 Market Size Estimation and Forecast by Country, 2022-2032 (US$ Mn)
12.5 Market Size Estimation and Forecast by Services, 2022-2032 (US$ Mn)
12.5.1 Market Forecast by Clinical Phase, 2022-2032 (US$ Mn)
12.6 Market Size Estimation and Forecast by Company Size, 2022-2032 (US$ Mn)
12.7 Market Size Estimation and Forecast by Drug Type, 2022-2032 (US$ Mn)
12.8 Market Size Estimation and Forecast by Therapeutic Area, 2022-2032 (US$ Mn)
12.9 Brazil CROs Market Analysis
12.10 Mexico CROs Market Analysis
12.11 Rest of Latin America
13 MEA Contract Research Organizations (CROs) Market Analysis
13.1 Key Findings
13.2 MEA Contract Research Organizations (CROs) Market Attractiveness Index
13.3 Market Size by Country, 2022, 2027 & 2032 (US$ Mn)
13.4 Market Size Estimation and Forecast by Country, 2022-2032 (US$ Mn)
13.5 Market Size Estimation and Forecast by Services, 2022-2032 (US$ Mn)
13.5.1 Market Forecast by Clinical Phase, 2022-2032 (US$ Mn)
13.6 Market Size Estimation and Forecast by Company Size, 2022-2032 (US$ Mn)
13.7 Market Size Estimation and Forecast by Drug Type, 2022-2032 (US$ Mn)
13.8 Market Size Estimation and Forecast by Therapeutic Area, 2022-2032 (US$ Mn)
13.9 GCC CROs Market Analysis
13.10 South Africa CROs Market Analysis
13.11 Rest of MEA CROs Market Analysis
14 Company Profiles
14.1 Competitive Landscape, 2021
14.2 Charles River Laboratories
14.2.1 Company Snapshot
14.2.2 Company Overview
14.2.3 Financial Analysis
14.2.3.1 Net Revenue, 2016-2021
14.2.3.2 Regional Market Shares, 2021
14.2.3.3 Gross Profit, 2016-2021
14.2.4 Product Benchmarking
14.2.5 Strategic Outlook
14.3 Clinipace
14.3.1 Company Snapshot
14.3.2 Company Overview
14.3.3 Product Benchmarking
14.4 CMIC HOLDING Co., LTD.
14.4.1 Company Snapshot
14.4.2 Company Overview
14.4.3 Financial Analysis
14.4.3.1 Net Revenue, 2016-2021
14.4.4 Product Benchmarking
14.4.5 Strategic Outlook
14.5 EPS Corporation
14.5.1 Company Snapshot
14.5.2 Company Overview
14.5.3 Financial Analysis
14.5.3.1 Net Revenue, 2016-2021
14.5.4 Product Benchmarking
14.6 ICON plc
14.6.1 Company Snapshot
14.6.2 Company Overview
14.6.3 Financial Analysis
14.6.3.1 Net Revenue, 2016-2021
14.6.3.2 Gross Profit, 2016-2021
14.6.4 Product Benchmarking
14.6.5 Strategic Outlook
14.7 IQVIA HOLDINGS INC.
14.7.1 Company Snapshot
14.7.2 Company Overview
14.7.3 Financial Analysis
14.7.3.1 Net Revenue, 2016-2021
14.7.3.2 Regional Market Shares, 2021
14.7.3.3 Gross Profit, 2016-2021
14.7.4 Product Benchmarking
14.7.5 Strategic Outlook
14.8 Labcorp Drug Development
14.8.1 Company Snapshot
14.8.2 Company Overview
14.8.3 Financial Analysis
14.8.3.1 Net Revenue, 2016-2021
14.8.3.2 Regional Market Shares, 2021
14.8.3.3 Gross Profit, 2016-2021
14.8.4 Product Benchmarking
14.8.5 Strategic Outlook
14.9 MedPace
14.9.1 Company Snapshot
14.9.2 Company Overview
14.9.3 Financial Analysis
14.9.3.1 Net Revenue, 2016-2021
14.9.3.2 Gross Profit, 2016-2021
14.9.4 Product Benchmarking
14.10 Parexel
14.10.1 Company Snapshot
14.10.2 Company Overview
14.10.3 Product Benchmarking
14.10.4 Strategic Outlook
14.11 PPD (ThermoFisher Scientific Inc.)
14.11.1 Company Snapshot
14.11.2 Company Overview
14.11.3 Financial Analysis
14.11.3.1 Net Revenue, 2016-2021
14.11.3.2 Regional Market Shares, 2021
14.11.3.3 Gross Profit, 2016-2021
14.11.3.4 R&D, 2016-2021
14.11.4 Product Benchmarking
14.11.5 Strategic Outlook
14.12 Syneos Health
14.12.1 Company Snapshot
14.12.2 Company Overview
14.12.3 Financial Analysis
14.12.3.1 Net Revenue, 2016-2021
14.12.3.2 Regional Market Shares, 2021
14.12.3.3 Gross Profit, 2016-2021
14.12.4 Product Benchmarking
14.12.5 Strategic Outlook
14.13 Worldwide Clinical Trials
14.13.1 Company Snapshot
14.13.2 Company Overview
14.13.3 Product Benchmarking
14.13.4 Strategic Outlook
14.14 Wuxi AppTec
14.14.1 Company Snapshot
14.14.2 Company Overview
14.14.3 Financial Analysis
14.14.3.1 Net Revenue, 2016-2021
14.14.3.2 Regional Market Shares, 2021
14.14.3.3 Gross Profit, 2016-2020
14.14.4 Product Benchmarking
14.14.5 Strategic Outlook
15 Conclusion and Recommendations
15.1 Concluding Remarks from Visiongain
15.2 Recommendations for Market Players
List of Tables
Table 1 Global Contract Research Organizations (CROs) Market Snapshot, 2022 & 2032 (US$ million, CAGR %)
Table 2 Global Contract Research Organizations (CRO) Market Forecast by Region, 2022-2032 (US$ mn, AGR%, CAGR%): "V" Shaped Recovery
Table 3 Global Contract Research Organizations (CRO) Market Forecast by Region, 2022-2032 (US$ mn, AGR%, CAGR%): "U" Shaped Recovery
Table 4 Global Contract Research Organizations (CRO) Market Forecast by Region, 2022-2032 (US$ mn, AGR%, CAGR%): "W" Shaped Recovery
Table 5 Global Contract Research Organizations (CRO) Market Forecast by Region, 2022-2032 (US$ mn, AGR%, CAGR%): "L" Shaped Recovery
Table 6 Global Contract Research Organizations (CRO) Market Forecast by Service, 2022-2032 (US$ mn, AGR%, CAGR%)
Table 7 Preclinical Segment Market Forecast by Region, 2022-2032 (US$ mn, AGR%, CAGR%)
Table 8 Preclinical Segment Market Forecast by Region, 2022-2032 (US$ mn, AGR%, CAGR%)
Table 9 Laboratory Services Segment Market Forecast by Region, 2022-2032 (US$ mn, AGR%, CAGR%)
Table 10 Consulting Services Segment Market Forecast by Region, 2022-2032 (US$ mn, AGR%, CAGR%)
Table 11 Data Management Services Segment Market Forecast by Region, 2022-2032 (US$ mn, AGR%, CAGR%)
Table 12 Global Contract Research Organizations (CRO) Market Forecast by Company Size, 2022-2032 (US$ mn, AGR%, CAGR%)
Table 13 Large Pharma & Biotech Companies Segment Market Forecast by Region, 2022-2032 (US$ mn, AGR%, CAGR%)
Table 14 Mid-sized Pharma & Biotech Companies Segment Market Forecast by Region, 2022-2032 (US$ mn, AGR%, CAGR%)
Table 15 Small Pharma & Biotech Companies Segment Market Forecast by Region, 2022-2032 (US$ mn, AGR%, CAGR%)
Table 16 Global Contract Research Organizations (CRO) Market Forecast by Drug Type, 2022-2032 (US$ mn, AGR%, CAGR%)
Table 17 Small Molecules Segment Market Forecast by Region, 2022-2032 (US$ mn, AGR%, CAGR%)
Table 18 Large Molecules Segment Market Forecast by Region, 2022-2032 (US$ mn, AGR%, CAGR%)
Table 19 Global Contract Research Organizations (CRO) Market Forecast by Therapeutic Area, 2022-2032 (US$ mn, AGR%, CAGR%)
Table 20 Oncology Segment Market Forecast by Region, 2022-2032 (US$ mn, AGR%, CAGR%)
Table 21 CNS Segment Market Forecast by Region, 2022-2032 (US$ mn, AGR%, CAGR%)
Table 22 Cardiology Segment Market Forecast by Region, 2022-2032 (US$ mn, AGR%, CAGR%)
Table 23 Infectious Segment Market Forecast by Region, 2022-2032 (US$ mn, AGR%, CAGR%)
Table 24 Metabolic Segment Market Forecast by Region, 2022-2032 (US$ mn, AGR%, CAGR%)
Table 25 Others Segment Market Forecast by Region, 2022-2032 (US$ mn, AGR%, CAGR%)
Table 26 Global Contract Research Organizations (CRO) Market Forecast by Region, 2022-2032 (US$ mn, AGR%, CAGR%)
Table 27 Global Contract Research Organizations (CRO) Market Forecast by Region, 2022-2032 (US$ mn, AGR%, CAGR%): "V" Shaped Recovery
Table 28 Global Contract Research Organizations (CRO) Market Forecast by Region, 2022-2032 (US$ mn, AGR%, CAGR%): "U" Shaped Recovery
Table 29 Global Contract Research Organizations (CRO) Market Forecast by Region, 2022-2032 (US$ mn, AGR%, CAGR%): "W" Shaped Recovery
Table 30 Global Contract Research Organizations (CRO) Market Forecast by Region, 2022-2032 (US$ mn, AGR%, CAGR%): "L" Shaped Recovery
Table 31 North America Contract Research Organizations (CRO) Market Forecast by Country, 2022-2032 (US$ mn, AGR%, CAGR%)
Table 32 North America Contract Research Organizations (CRO) Market Forecast by Service, 2022-2032 (US$ mn, AGR%, CAGR%)
Table 33 North America Contract Research Organizations (CRO) Market Forecast by Clinical Phase, 2022-2032 (US$ mn, AGR%, CAGR%)
Table 34 North America Contract Research Organizations (CRO) Market Forecast by Company Size, 2022-2032 (US$ mn, AGR%, CAGR%)
Table 35 North America Contract Research Organizations (CRO) Market Forecast by Drug Type, 2022-2032 (US$ mn, AGR%, CAGR%)
Table 36 North America Contract Research Organizations (CRO) Market Forecast by Therapeutic Area, 2022-2032 (US$ mn, AGR%, CAGR%)
Table 37 U.S. Contract Research Organizations (CRO) Market Forecast, 2022-2032 (US$ mn, AGR%, CAGR%)
Table 38 Canada Contract Research Organizations (CRO) Market Forecast, 2022-2032 (US$ mn, AGR%, CAGR%)
Table 39 Europe Contract Research Organizations (CRO) Market Forecast by Country, 2022-2032 (US$ mn, AGR%, CAGR%)
Table 40 Europe Contract Research Organizations (CRO) Market Forecast by Service, 2022-2032 (US$ mn, AGR%, CAGR%)
Table 41 Europe Contract Research Organizations (CRO) Market Forecast by Clinical Phase, 2022-2032 (US$ mn, AGR%, CAGR%)
Table 42 Europe Contract Research Organizations (CRO) Market Forecast by Company Size, 2022-2032 (US$ mn, AGR%, CAGR%)
Table 43 Europe Contract Research Organizations (CRO) Market Forecast by Drug Type, 2022-2032 (US$ mn, AGR%, CAGR%)
Table 44 Europe Contract Research Organizations (CRO) Market Forecast by Therapeutic Area, 2022-2032 (US$ mn, AGR%, CAGR%)
Table 45 Germany Contract Research Organizations (CRO) Market Forecast, 2022-2032 (US$ mn, AGR%, CAGR%)
Table 46 UK Contract Research Organizations (CRO) Market Forecast, 2022-2032 (US$ mn, AGR%, CAGR%)
Table 47 France Contract Research Organizations (CRO) Market Forecast, 2022-2032 (US$ mn, AGR%, CAGR%)
Table 48 Italy Contract Research Organizations (CRO) Market Forecast, 2022-2032 (US$ mn, AGR%, CAGR%)
Table 49 Spain Contract Research Organizations (CRO) Market Forecast, 2022-2032 (US$ mn, AGR%, CAGR%)
Table 50 Rest of Europe Contract Research Organizations (CRO) Market Forecast, 2022-2032 (US$ mn, AGR%, CAGR%)
Table 51 Asia Pacific Contract Research Organizations (CRO) Market Forecast by Country, 2022-2032 (US$ mn, AGR%, CAGR%)
Table 52 Asia Pacific Contract Research Organizations (CRO) Market Forecast by Service, 2022-2032 (US$ mn, AGR%, CAGR%)
Table 53 Asia Pacific Contract Research Organizations (CRO) Market Forecast by Clinical Phase, 2022-2032 (US$ mn, AGR%, CAGR%)
Table 54 Asia Pacific Contract Research Organizations (CRO) Market Forecast by Company Size, 2022-2032 (US$ mn, AGR%, CAGR%)
Table 55 Asia Pacific Contract Research Organizations (CRO) Market Forecast by Drug Type, 2022-2032 (US$ mn, AGR%, CAGR%)
Table 56 Asia Pacific Contract Research Organizations (CRO) Market Forecast by Therapeutic Area, 2022-2032 (US$ mn, AGR%, CAGR%)
Table 57 Japan Contract Research Organizations (CRO) Market Forecast, 2022-2032 (US$ mn, AGR%, CAGR%)
Table 58 China Contract Research Organizations (CRO) Market Forecast, 2022-2032 (US$ mn, AGR%, CAGR%)
Table 59 India Contract Research Organizations (CRO) Market Forecast, 2022-2032 (US$ mn, AGR%, CAGR%)
Table 60 Australia Contract Research Organizations (CRO) Market Forecast, 2022-2032 (US$ mn, AGR%, CAGR%)
Table 61 South Korea Contract Research Organizations (CRO) Market Forecast, 2022-2032 (US$ mn, AGR%, CAGR%)
Table 62 Rest of Asia Pacific Contract Research Organizations (CRO) Market Forecast, 2022-2032 (US$ mn, AGR%, CAGR%)
Table 63 Latin America Contract Research Organizations (CRO) Market Forecast by Country, 2022-2032 (US$ mn, AGR%, CAGR%)
Table 64 Latin America Contract Research Organizations (CRO) Market Forecast by Service, 2022-2032 (US$ mn, AGR%, CAGR%)
Table 65 Latin America Contract Research Organizations (CRO) Market Forecast by Clinical Phase, 2022-2032 (US$ mn, AGR%, CAGR%)
Table 66 Latin America Contract Research Organizations (CRO) Market Forecast by Company Size, 2022-2032 (US$ mn, AGR%, CAGR%)
Table 67 Latin America Contract Research Organizations (CRO) Market Forecast by Drug Type, 2022-2032 (US$ mn, AGR%, CAGR%)
Table 68 Latin America Contract Research Organizations (CRO) Market Forecast by Therapeutic Area, 2022-2032 (US$ mn, AGR%, CAGR%)
Table 69 Brazil Contract Research Organizations (CRO) Market Forecast, 2022-2032 (US$ mn, AGR%, CAGR%)
Table 70 Mexico Contract Research Organizations (CRO) Market Forecast, 2022-2032 (US$ mn, AGR%, CAGR%)
Table 71 Rest of Latin America Contract Research Organizations (CRO) Market Forecast, 2022-2032 (US$ mn, AGR%, CAGR%)
Table 72 MEA Contract Research Organizations (CRO) Market Forecast by Country, 2022-2032 (US$ mn, AGR%, CAGR%)
Table 73 MEA Contract Research Organizations (CRO) Market Forecast by Service, 2022-2032 (US$ mn, AGR%, CAGR%)
Table 74 MEA Contract Research Organizations (CRO) Market Forecast by Clinical Phase, 2022-2032 (US$ mn, AGR%, CAGR%)
Table 75 MEA Contract Research Organizations (CRO) Market Forecast by Company Size, 2022-2032 (US$ mn, AGR%, CAGR%)
Table 76 MEA Contract Research Organizations (CRO) Market Forecast by Drug Type, 2022-2032 (US$ mn, AGR%, CAGR%)
Table 77 MEA Contract Research Organizations (CRO) Market Forecast by Therapeutic Area, 2022-2032 (US$ mn, AGR%, CAGR%)
Table 78 GCC Contract Research Organizations (CRO) Market Forecast, 2022-2032 (US$ mn, AGR%, CAGR%)
Table 79 South Africa Contract Research Organizations (CRO) Market Forecast, 2022-2032 (US$ mn, AGR%, CAGR%)
Table 80 Rest of MEA Contract Research Organizations (CRO) Market Forecast, 2022-2032 (US$ mn, AGR%, CAGR%)
Table 81 Charles River Laboratories: Key Details, (CEO, HQ, Revenue, Founded, No. of Employees, Company Type, Website, Business Segment)
Table 82 Charles River Laboratories: Product Benchmarking
Table 83 Charles River Laboratories: Strategic Outlook
Table 84 Clinipace: Key Details, (CEO, HQ, Revenue, Founded, No. of Employees, Company Type, Website, Business Segment)
Table 85 Clinipace: Product Benchmarking
Table 86 CMIC HOLDING Co., LTD.: Key Details, (CEO, HQ, Revenue, Founded, No. of Employees, Company Type, Website, Business Segment)
Table 87 CMIC HOLDING Co., LTD.: Product Benchmarking
Table 88 CMIC HOLDING Co., LTD.: Strategic Outlook
Table 89 EPS Corporation: Key Details, (CEO, HQ, Revenue, Founded, No. of Employees, Company Type, Website, Business Segment)
Table 90 EPS Corporation: Product Benchmarking
Table 91 ICON plc: Key Details, (CEO, HQ, Revenue, Founded, No. of Employees, Company Type, Website, Business Segment)
Table 92 ICON plc: Product Benchmarking
Table 93 ICON plc: Strategic Outlook
Table 94 IQVIA HOLDINGS INC.: Key Details, (CEO, HQ, Revenue, Founded, No. of Employees, Company Type, Website, Business Segment)
Table 95 IQVIA HOLDINGS INC.: Product Benchmarking
Table 96 IQVIA HOLDINGS INC.: Strategic Outlook
Table 97 Labcorp Drug Development: Key Details, (CEO, HQ, Revenue, Founded, No. of Employees, Company Type, Website, Business Segment)
Table 98 Labcorp Drug Development: Product Benchmarking
Table 99 Labcorp Drug Development: Strategic Outlook
Table 100 MedPace: Key Details, (CEO, HQ, Revenue, Founded, No. of Employees, Company Type, Website, Business Segment)
Table 101 MedPace: Product Benchmarking
Table 102 Parexel: Key Details, (CEO, HQ, Revenue, Founded, No. of Employees, Company Type, Website, Business Segment)
Table 103 Parexel: Product Benchmarking
Table 104 Parexel: Strategic Outlook
Table 105 PPD: Key Details, (CEO, HQ, Revenue, Founded, No. of Employees, Company Type, Website, Business Segment)
Table 106 PPD: Product Benchmarking
Table 107 PPD: Strategic Outlook
Table 108 Syneos Health: Key Details, (CEO, HQ, Revenue, Founded, No. of Employees, Company Type, Website, Business Segment)
Table 109 Syneos Health: Product Benchmarking
Table 110 Syneos Health: Strategic Outlook
Table 111 Worldwide Clinical Trials: Key Details, (CEO, HQ, Revenue, Founded, No. of Employees, Company Type, Website, Business Segment)
Table 112 Worldwide Clinical Trials: Product Benchmarking
Table 113 Worldwide Clinical Trials: Strategic Outlook
Table 114 Wuxi AppTec: Key Details, (CEO, HQ, Revenue, Founded, No. of Employees, Company Type, Website, Business Segment)
Table 115 Wuxi AppTec: Product Benchmarking
Table 116 Wuxi AppTec: Strategic Outlook
List of Figures
Figure 1 Global Contract Research Organizations (CROs) Market Segmentation
Figure 2 Global Contract Research Organizations (CROs) Market by Services: Market Attractiveness Index
Figure 3 Global Contract Research Organizations (CROs) Market by Company Size: Market Attractiveness Index
Figure 4 Global Contract Research Organizations (CROs) Market by Drug Type: Market Attractiveness Index
Figure 5 Global Contract Research Organizations (CROs) Market by Therapeutic Area: Market Attractiveness Index
Figure 6 Global Contract Research Organizations (CROs) Market Attractiveness Index by Region
Figure 7 Global Contract Research Organizations (CROs) Market: Market Dynamics
Figure 8 Global Contract Research Organizations (CROs) Market by Region, 2022-2032 (US$ Mn, AGR (%), CAGR (%)): “V” Shaped Recovery
Figure 9 Global Contract Research Organizations (CROs) Market by Region, 2022-2032 (US$ Mn, AGR (%), CAGR (%)): “U” Shaped Recovery
Figure 10 Global Contract Research Organizations (CROs) Market by Region, 2022-2032 (US$ Mn, AGR (%), CAGR (%)): “W” Shaped Recovery
Figure 11 Global Contract Research Organizations (CROs) Market by Region, 2022-2032 (US$ Mn, AGR (%), CAGR (%)): “L” Shaped Recovery
Figure 12 Porter’s Five Forces Analysis
Figure 13 PEST Analysis
Figure 14 Deal Volume, 2017-2021
Figure 15 Global Contract Research Organizations (CROs) Market Attractiveness Index by Services
Figure 16 Global Contract Research Organizations (CROs) Market Forecast by Services, 2022-2032 (US$ million)
Figure 17 Global Contract Research Organizations (CROs) Market Share Forecast by Services, 2022, 2027, 2032 (%)
Figure 18 Preclinical Market Forecast by Region, 2022-2032 (US$ million)
Figure 19 Preclinical Market Share Forecast by Region, 2022 & 2032 (%)
Figure 20 Clinical Market Forecast by Region, 2022-2032 (US$ million)
Figure 21 Clinical Market Share Forecast by Region, 2022 & 2032 (%)
Figure 22 Laboratory Services Market Forecast by Region, 2022-2032 (US$ million)
Figure 23 Laboratory Services Market Share Forecast by Region, 2022 & 2032 (%)
Figure 24 Consulting Services Market Forecast by Region, 2022-2032 (US$ million)
Figure 25 Consulting Services Market Share Forecast by Region, 2022 & 2032 (%)
Figure 26 Data Management Services Market Forecast by Region, 2022-2032 (US$ million)
Figure 27 Data Management Services Market Share Forecast by Region, 2022 & 2032 (%)
Figure 28 Global Contract Research Organizations (CROs) Market Attractiveness Index by Company Size
Figure 29 Global Contract Research Organizations (CROs) Market Forecast by Company Size, 2022-2032 (US$ million)
Figure 30 Global Contract Research Organizations (CROs) Market Share Forecast by Company Size, 2022, 2027, 2032 (%)
Figure 31 Large Pharma & Biotech Companies Market Forecast by Region, 2022-2032 (US$ million)
Figure 32 Large Pharma & Biotech Companies Market Share Forecast by Region, 2022 & 2032 (%)
Figure 33 Mid-sized Pharma & Biotech Companies Market Forecast by Region, 2022-2032 (US$ million)
Figure 34 Mid-sized Pharma & Biotech Companies Market Share Forecast by Region, 2022 & 2032 (%)
Figure 35 Small Pharma & Biotech Companies Market Forecast by Region, 2022-2032 (US$ million)
Figure 36 Small Pharma & Biotech Companies Market Share Forecast by Region, 2022 & 2032 (%)
Figure 37 Global Contract Research Organizations (CROs) Market Attractiveness Index by Drug Type
Figure 38 Global Contract Research Organizations (CROs) Market Forecast by Drug Type, 2022-2032 (US$ million)
Figure 39 Global Contract Research Organizations (CROs) Market Share Forecast by Drug Type, 2022, 2027, 2032 (%)
Figure 40 Small Molecules Market Forecast by Region, 2022-2032 (US$ million)
Figure 41 Small Molecules Market Share Forecast by Region, 2022 & 2032 (%)
Figure 42 Large Molecules Market Forecast by Region, 2022-2032 (US$ million)
Figure 43 Large Molecules Market Share Forecast by Region, 2022 & 2032 (%)
Figure 44 Global Contract Research Organizations (CROs) Market Attractiveness Index by Therapeutic Area
Figure 45 Global Contract Research Organizations (CROs) Market Forecast by Therapeutic Area, 2022-2032 (US$ million)
Figure 46 Global Contract Research Organizations (CROs) Market Share Forecast by Therapeutic Area, 2022, 2027, 2032 (%)
Figure 47 Oncology Market Forecast by Region, 2022-2032 (US$ million)
Figure 48 Oncology Market Share Forecast by Region, 2022 & 2032 (%)
Figure 49 CNS Market Forecast by Region, 2022-2032 (US$ million)
Figure 50 CNS Market Share Forecast by Region, 2022 & 2032 (%)
Figure 51 Cardiology Market Forecast by Region, 2022-2032 (US$ million)
Figure 52 Cardiology Market Share Forecast by Region, 2022 & 2032 (%)
Figure 53 Infectious Market Forecast by Region, 2022-2032 (US$ million)
Figure 54 Infectious Market Share Forecast by Region, 2022 & 2032 (%)
Figure 55 Metabolic Market Forecast by Region, 2022-2032 (US$ million)
Figure 56 Metabolic Market Share Forecast by Region, 2022 & 2032 (%)
Figure 57 Others Market Forecast by Region, 2022-2032 (US$ million)
Figure 58 Others Market Share Forecast by Region, 2022 & 2032 (%)
Figure 59 Global Contract Research Organizations (CROs) Market Forecast by Region 2022, 2027, 2032 (Revenue, CAGR %)
Figure 60 Global Contract Research Organizations (CROs) Market Share Forecast by Region 2022, 2027, 2032(%)
Figure 61 Global Contract Research Organizations (CROs) Market by Region, 2022-2032 (US$ Mn, AGR (%), CAGR (%))
Figure 62 Global Contract Research Organizations (CROs) Market by Region, 2022-2032 (US$ Mn, AGR (%), CAGR (%)): “V” Shaped Recovery
Figure 63 Global Contract Research Organizations (CROs) Market by Region, 2022-2032 (US$ Mn, AGR (%), CAGR (%)): “U” Shaped Recovery
Figure 64 Global Contract Research Organizations (CROs) Market by Region, 2022-2032 (US$ Mn, AGR (%), CAGR (%)): “W” Shaped Recovery
Figure 65 Global Contract Research Organizations (CROs) Market by Region, 2022-2032 (US$ Mn, AGR (%), CAGR (%)): “L” Shaped Recovery
Figure 66 North America Contract Research Organizations (CROs) Market Attractiveness Index
Figure 67 North America Contract Research Organizations (CROs) Market by Region, 2022, 2027 & 2032 (US$ million)
Figure 68 North America Contract Research Organizations (CROs) Market Forecast by Country, 2022-2032 (US$ million)
Figure 69 North America Contract Research Organizations (CROs) Market Share Forecast by Country, 2022 & 2032 (%)
Figure 70 North America Contract Research Organizations (CROs) Market Forecast by Services, 2022-2032 (US$ million)
Figure 71 North America Contract Research Organizations (CROs) Market Share Forecast by Services, 2022 & 2032 (%)
Figure 72 North America Contract Research Organizations (CROs) Market Forecast by Company Size, 2022-2032 (US$ million)
Figure 73 North America Contract Research Organizations (CROs) Market Share Forecast by Clinical Phase, 2022 & 2032 (%)
Figure 74 North America Contract Research Organizations (CROs) Market Forecast by Company Size, 2022-2032 (US$ million)
Figure 75 North America Contract Research Organizations (CROs) Market Share Forecast by Company Size, 2022 & 2032 (%)
Figure 76 North America Contract Research Organizations (CROs) Market Forecast by Drug Type, 2022-2032 (US$ million)
Figure 77 North America Contract Research Organizations (CROs) Market Share Forecast by Drug Type, 2022 & 2032 (%)
Figure 78 North America Contract Research Organizations (CROs) Market Forecast by Therapeutic Area, 2022-2032 (US$ million)
Figure 79 North America Contract Research Organizations (CROs) Market Share Forecast by Therapeutic Area, 2022 & 2032 (%)
Figure 80 U.S. Contract Research Organizations (CROs) Market Forecast, 2022-2032 (US$ million)
Figure 81 Canada Contract Research Organizations (CROs) Market Forecast, 2022-2032 (US$ million)
Figure 82 Europe Contract Research Organizations (CROs) Market Attractiveness Index
Figure 83 Europe Contract Research Organizations (CROs) Market by Region, 2022, 2027 & 2032 (US$ million)
Figure 84 Europe Contract Research Organizations (CROs) Market Forecast by Country, 2022-2032 (US$ million)
Figure 85 Europe Contract Research Organizations (CROs) Market Share Forecast by Country, 2022 & 2032 (%)
Figure 86 Europe Contract Research Organizations (CROs) Market Forecast by Services, 2022-2032 (US$ million)
Figure 87 Europe Contract Research Organizations (CROs) Market Share Forecast by Services, 2022 & 2032 (%)
Figure 88 Europe Contract Research Organizations (CROs) Market Forecast by Company Size, 2022-2032 (US$ million)
Figure 89 Europe Contract Research Organizations (CROs) Market Share Forecast by Clinical Phase, 2022 & 2032 (%)
Figure 90 Europe Contract Research Organizations (CROs) Market Forecast by Company Size, 2022-2032 (US$ million)
Figure 91 Europe Contract Research Organizations (CROs) Market Share Forecast by Company Size, 2022 & 2032 (%)
Figure 92 Europe Contract Research Organizations (CROs) Market Forecast by Drug Type, 2022-2032 (US$ million)
Figure 93 Europe Contract Research Organizations (CROs) Market Share Forecast by Drug Type, 2022 & 2032 (%)
Figure 94 Europe Contract Research Organizations (CROs) Market Forecast by Therapeutic Area, 2022-2032 (US$ million)
Figure 95 Europe Contract Research Organizations (CROs) Market Share Forecast by Therapeutic Area, 2022 & 2032 (%)
Figure 96 Germany Contract Research Organizations (CROs) Market Forecast, 2022-2032 (US$ million)
Figure 97 UK Contract Research Organizations (CROs) Market Forecast, 2022-2032 (US$ million)
Figure 98 France Contract Research Organizations (CROs) Market Forecast, 2022-2032 (US$ million)
Figure 99 Italy Contract Research Organizations (CROs) Market Forecast, 2022-2032 (US$ million)
Figure 100 Spain Contract Research Organizations (CROs) Market Forecast, 2022-2032 (US$ million)
Figure 101 Rest of Europe Contract Research Organizations (CROs) Market Forecast, 2022-2032 (US$ million)
Figure 102 Asia Pacific Contract Research Organizations (CROs) Market Attractiveness Index
Figure 103 Asia Pacific Contract Research Organizations (CROs) Market by Region, 2022, 2027 & 2032 (US$ million)
Figure 104 Asia Pacific Contract Research Organizations (CROs) Market Forecast by Country, 2022-2032 (US$ million)
Figure 105 Asia Pacific Contract Research Organizations (CROs) Market Share Forecast by Country, 2022 & 2032 (%)
Figure 106 Asia Pacific Contract Research Organizations (CROs) Market Forecast by Services, 2022-2032 (US$ million)
Figure 107 Asia Pacific Contract Research Organizations (CROs) Market Share Forecast by Services, 2022 & 2032 (%)
Figure 108 Asia Pacific Contract Research Organizations (CROs) Market Forecast by Clinical Phase, 2022-2032 (US$ million)
Figure 109 Asia Pacific Contract Research Organizations (CROs) Market Share Forecast by Clinical Phase, 2022 & 2032 (%)
Figure 110 Asia Pacific Contract Research Organizations (CROs) Market Forecast by Company Size, 2022-2032 (US$ million)
Figure 111 Asia Pacific Contract Research Organizations (CROs) Market Share Forecast by Company Size, 2022 & 2032 (%)
Figure 112 Asia Pacific Contract Research Organizations (CROs) Market Forecast by Drug Type, 2022-2032 (US$ million)
Figure 113 Asia Pacific Contract Research Organizations (CROs) Market Share Forecast by Drug Type, 2022 & 2032 (%)
Figure 114 Asia Pacific Contract Research Organizations (CROs) Market Forecast by Therapeutic Area, 2022-2032 (US$ million)
Figure 115 Asia Pacific Contract Research Organizations (CROs) Market Share Forecast by Therapeutic Area, 2022 & 2032 (%)
Figure 116 Japan Contract Research Organizations (CROs) Market Forecast, 2022-2032 (US$ million)
Figure 117 China Contract Research Organizations (CROs) Market Forecast, 2022-2032 (US$ million)
Figure 118 India Contract Research Organizations (CROs) Market Forecast, 2022-2032 (US$ million)
Figure 119 Australia Contract Research Organizations (CROs) Market Forecast, 2022-2032 (US$ million)
Figure 120 South Korea Contract Research Organizations (CROs) Market Forecast, 2022-2032 (US$ million)
Figure 121 Rest of Asia Pacific Contract Research Organizations (CROs) Market Forecast, 2022-2032 (US$ million)
Figure 122 Latin America Contract Research Organizations (CROs) Market Attractiveness Index
Figure 123 Latin America Contract Research Organizations (CROs) Market by Region, 2022, 2027 & 2032 (US$ million)
Figure 124 Latin America Contract Research Organizations (CROs) Market Forecast by Country, 2022-2032 (US$ million)
Figure 125 Latin America Contract Research Organizations (CROs) Market Share Forecast by Country, 2022 & 2032 (%)
Figure 126 Latin America Contract Research Organizations (CROs) Market Forecast by Services, 2022-2032 (US$ million)
Figure 127 Latin America Contract Research Organizations (CROs) Market Share Forecast by Services, 2022 & 2032 (%)
Figure 128 Latin America Contract Research Organizations (CROs) Market Forecast by Company Size, 2022-2032 (US$ million)
Figure 129 Latin America Contract Research Organizations (CROs) Market Share Forecast by Clinical Phase, 2022 & 2032 (%)
Figure 130 Latin America Contract Research Organizations (CROs) Market Forecast by Company Size, 2022-2032 (US$ million)
Figure 131 Latin America Contract Research Organizations (CROs) Market Share Forecast by Company Size, 2022 & 2032 (%)
Figure 132 Latin America Contract Research Organizations (CROs) Market Forecast by Drug Type, 2022-2032 (US$ million)
Figure 133 Latin America Contract Research Organizations (CROs) Market Share Forecast by Drug Type, 2022 & 2032 (%)
Figure 134 Latin America Contract Research Organizations (CROs) Market Forecast by Therapeutic Area, 2022-2032 (US$ million)
Figure 135 Latin America Contract Research Organizations (CROs) Market Share Forecast by Therapeutic Area, 2022 & 2032 (%)
Figure 136 Brazil Contract Research Organizations (CROs) Market Forecast, 2022-2032 (US$ million)
Figure 137 Mexico Contract Research Organizations (CROs) Market Forecast, 2022-2032 (US$ million)
Figure 138 Rest of Latin America Contract Research Organizations (CROs) Market Forecast, 2022-2032 (US$ million)
Figure 139 MEA Contract Research Organizations (CROs) Market Attractiveness Index
Figure 140 MEA Contract Research Organizations (CROs) Market by Region, 2022, 2027 & 2032 (US$ million)
Figure 141 MEA Contract Research Organizations (CROs) Market Forecast by Country, 2022-2032 (US$ million)
Figure 142 MEA Contract Research Organizations (CROs) Market Share Forecast by Country, 2022 & 2032 (%)
Figure 143 MEA Contract Research Organizations (CROs) Market Forecast by Services, 2022-2032 (US$ million)
Figure 144 MEA Contract Research Organizations (CROs) Market Share Forecast by Services, 2022 & 2032 (%)
Figure 145 MEA Contract Research Organizations (CROs) Market Forecast by Company Size, 2022-2032 (US$ million)
Figure 146 MEA Contract Research Organizations (CROs) Market Share Forecast by Clinical Phase, 2022 & 2032 (%)
Figure 147 MEA Contract Research Organizations (CROs) Market Forecast by Company Size, 2022-2032 (US$ million)
Figure 148 MEA Contract Research Organizations (CROs) Market Share Forecast by Company Size, 2022 & 2032 (%)
Figure 149 MEA Contract Research Organizations (CROs) Market Forecast by Drug Type, 2022-2032 (US$ million)
Figure 150 MEA Contract Research Organizations (CROs) Market Share Forecast by Drug Type, 2022 & 2032 (%)
Figure 151 MEA Contract Research Organizations (CROs) Market Forecast by Therapeutic Area, 2022-2032 (US$ million)
Figure 152 MEA Contract Research Organizations (CROs) Market Share Forecast by Therapeutic Area, 2022 & 2032 (%)
Figure 153 GCC Contract Research Organizations (CROs) Market Forecast, 2022-2032 (US$ million)
Figure 154 South Africa Contract Research Organizations (CROs) Market Forecast, 2022-2032 (US$ million)
Figure 155 Rest of MEA Contract Research Organizations (CROs) Market Forecast, 2022-2032 (US$ million)
Figure 156 Global Contract Research Organizations (CROs) Market: Company Share/Ranking, 2021
Figure 157 Charles River Laboratories: Net Revenue, 2016-2021 (US$ million, AGR %)
Figure 158 Charles River Laboratories: Regional Market Shares (%), 2021
Figure 159 Charles River Laboratories: Gross Profit, 2016-2021 (US$ million, AGR %)
Figure 160 CMIC HOLDING Co., LTD.: Net Revenue, 2016-2021 (US$ million, AGR %)
Figure 161 EPS Corporation: Net Revenue, 2016-2021 (US$ million, AGR %)
Figure 162 ICON plc: Net Revenue, 2016-2021 (US$ million, AGR %)
Figure 163 ICON plc: Gross Profit, 2016-2021 (US$ million, AGR %)
Figure 164 IQVIA HOLDINGS INC.: Net Revenue, 2016-2021 (US$ million, AGR %)
Figure 165 IQVIA HOLDINGS INC.: Regional Market Shares (%), 2021
Figure 166 IQVIA HOLDINGS INC.: Gross Profit, 2016-2021 (US$ million, AGR %)
Figure 167 Labcorp Drug Development: Net Revenue, 2016-2021 (US$ million, AGR %)
Figure 168 Labcorp Drug Development: Regional Market Shares (%), 2021
Figure 169 Labcorp Drug Development: Gross Profit, 2016-2021 (US$ million, AGR %)
Figure 170 MedPace: Net Revenue, 2016-2021 (US$ million, AGR %)
Figure 171 MedPace: Gross Profit, 2016-2021 (US$ million, AGR %)
Figure 172 PPD: Net Revenue, 2016-2021 (US$ million, AGR %)
Figure 173 PPD: Regional Market Shares (%), 2021
Figure 174 PPD: Gross Profit, 2016-2021 (US$ million, AGR %)
Figure 175 PPD: R&D, 2016-2021 (US$ million, AGR %)
Figure 176 Syneos Health: Net Revenue, 2016-2021 (US$ million, AGR %)
Figure 177 Syneos Health: Regional Market Shares (%), 2021
Figure 178 Syneos Health: Gross Profit, 2016-2021 (US$ million, AGR %)
Figure 179 Wuxi AppTec: Net Revenue, 2016-2021 (US$ million, AGR %)
Figure 180 Wuxi AppTec: Regional Market Shares (%), 2021
Figure 181 Wuxi AppTec: Gross Profit, 2016-2020 (US$ million, AGR %)
ページTOPに戻る
-
Saudi Arabia Contract Manufacturing Organizations Market, By Type (Active Pharmaceutical Ingredients (API) Manufacturing, Finished Dosage Formulation (FDF) Development & Manufacturing, Secondary Packaging), By End User (Big Pharmaceuticals, Small and Mid-Size Pharmaceuticals, Generic Pharmaceutical Companies, Others), By Region, Competition Forecast & Opportunities, 2027
-
エピジェネティクス市場:製品別(キット、試薬、酵素、機器)、用途別(腫瘍、非腫瘍)、エンドユーザー別(学術・研究機関、製薬・バイオテクノロジー企業、研究受託機関)。世界の機会分析および産業予測、2020-2030年
-
グライコミックス市場(製品タイプ。製品タイプ:酵素、器具、キット、試薬、アプリケーション。診断、創薬・開発、腫瘍、免疫、その他、エンドユーザー。世界の産業分析、規模、シェア、成長、傾向、予測、2021年~2031年
-
コンパニオン診断の世界市場は、製品・サービス別(キット・試薬、アッセイ、ソフトウェア、サービス)、技術別(PCR、NGS、In-Situ Hybridization、免疫組織化学、その他)、適応疾患別(腫瘍学、神経学、循環器学、感染症、その他)、エンドユーザー別(製薬・バイオテクノロジー企業、研究所、受託研究機関、その他)、アプリケーション別(体外診断、創薬、その他)、地域別で構成されています。その他)、エンドユーザー別(製薬・バイオテクノロジー企業、研究所、受託研究機関、その他)、アプリケーション別(体外診断、創薬、その他)、地域別、競争予測・機会、2026年
よくあるご質問
Visiongain社はどのような調査会社ですか?
英国の調査会社ヴィジョンゲイン社(Visiongain)は、通信とエネルギーのほか、自動車や化学・医薬品、金属など、広範な市場を対象に調査を行っています。自動車市場については、市場全般に関する調査のほ... もっと見る
調査レポートの納品までの日数はどの程度ですか?
在庫のあるものは速納となりますが、平均的には 3-4日と見て下さい。
但し、一部の調査レポートでは、発注を受けた段階で内容更新をして納品をする場合もあります。
発注をする前のお問合せをお願いします。
注文の手続きはどのようになっていますか?
1)お客様からの御問い合わせをいただきます。
2)見積書やサンプルの提示をいたします。
3)お客様指定、もしくは弊社の発注書をメール添付にて発送してください。
4)データリソース社からレポート発行元の調査会社へ納品手配します。
5) 調査会社からお客様へ納品されます。最近は、pdfにてのメール納品が大半です。
お支払方法の方法はどのようになっていますか?
納品と同時にデータリソース社よりお客様へ請求書(必要に応じて納品書も)を発送いたします。
お客様よりデータリソース社へ(通常は円払い)の御振り込みをお願いします。
請求書は、納品日の日付で発行しますので、翌月最終営業日までの当社指定口座への振込みをお願いします。振込み手数料は御社負担にてお願いします。
お客様の御支払い条件が60日以上の場合は御相談ください。
尚、初めてのお取引先や個人の場合、前払いをお願いすることもあります。ご了承のほど、お願いします。
データリソース社はどのような会社ですか?
当社は、世界各国の主要調査会社・レポート出版社と提携し、世界各国の市場調査レポートや技術動向レポートなどを日本国内の企業・公官庁及び教育研究機関に提供しております。
世界各国の「市場・技術・法規制などの」実情を調査・収集される時には、データリソース社にご相談ください。
お客様の御要望にあったデータや情報を抽出する為のレポート紹介や調査のアドバイスも致します。
|
|


