細胞治療技術市場レポート:2024-2034
Cell Therapy Technologies Market Report 2024-2034
レポート詳細
細胞治療技術市場レポート 2024-2034年 :本レポートは、業界とその根底にあるダイナミクスをよりよく理解したいと望むなら、新たな収益ポケットを目指す大手企業にとって貴重なものと... もっと見る
※上記価格は部署ライセンス(Departmental licence)価格です。
その他の価格についてはデータリソースまでお問合せください。
日本語のページは自動翻訳を利用し作成しています。
実際のレポートは英文のみでご納品いたします。
サマリー
レポート詳細
細胞治療技術市場レポート 2024-2034年:本レポートは、業界とその根底にあるダイナミクスをよりよく理解したいと望むなら、新たな収益ポケットを目指す大手企業にとって貴重なものとなるでしょう。異業種への進出や新規地域での既存事業の拡大を目指す企業にも有用です。
製造プロセスへのオートメーションとロボティクスの統合が業界の成長を牽引
製造部門におけるオートメーションとロボティクスの融合は、細胞治療技術の採用を推進している。この融合は、効率性、拡張性、再現性を高めると同時に、汚染リスクを軽減する。クローズドシステム・バイオプロセシング・テクノロジーの活用の高まりは、無菌性と安全性を強化することによって、製造上の課題にさらに取り組むものであり、そのすべてが最小限の人的介入で行われる。
とはいえ、莫大な開発費、複雑な製造工程、規制の複雑さ、制限された償還政策などの障害が、業界拡大の潜在的な障害となっている。これらの障害を克服するために、品質管理とプロセスの最適化を目的とした最先端の分析ツールに対する需要が高まっている。
革新的なアッセイ、イメージング技術、データ解析の統合は、細胞産物のリアルタイムのモニタリングと特性評価を容易にし、それによって高い有効性と安全性を保証する。さらに、先駆的なバイオマテリアルとスキャフォールドに焦点を当てることで、細胞導入と生着が促進され、細胞治療技術の魅力が増している。規制の進展、業界関係者間の協力、研究機関などが技術革新を促進し、細胞治療技術の実験室環境から臨床応用への移行を加速させている。
市場調査レポートを購入する前にすべき質問とは?
-
細胞治療技術市場はどのように進化しているのか?
-
細胞治療技術市場の牽引役と阻害要因は何か?
-
細胞治療技術の各サブマーケットセグメントは予測期間中にどのように成長し、2034年にはどれくらいの収益を占めるようになるのだろうか?
-
2024年から2034年にかけて、細胞治療技術の各サブマーケットの市場シェアはどのように推移するのか?
-
2024年から2034年にかけて、市場全体を牽引する主な要因は何か?
-
主要な細胞治療技術市場はマクロ経済の動きに大枠で追随するのか、それとも個々の国の市場が他を凌駕するのか。
-
2034年までに各国市場のシェアはどのように変化し、どの地域が2034年の市場をリードするのか。
-
主要プレーヤーは誰か、また予測期間中の見通しは?
-
これらの大手企業の細胞治療技術プロジェクトとは?
-
2024年から2034年の間に、業界はどのように進化するのか?その影響は?
現在、そして今後10年間に行われる細胞治療技術のプロジェクトは?
-
細胞治療技術市場をさらに拡大するために、製品化の必要性は高まっているのか?
-
細胞治療技術市場はどこに向かっているのか、そしてどのようにすれば市場の最前線に立てるのか。
-
新商品や新サービスに最適な投資方法とは?
-
企業を新たな成長軌道に乗せ、C-suiteに移行させるための重要な展望とは?
このことが、現在、そして今後10年間の細胞治療技術市場にどのような影響を与えるかを見極める必要がある:
-
305ページに及ぶレポートには、109の表と173の図表が掲載されている。
-
本レポートでは、業界における主要な有利分野を取り上げているため、今すぐターゲットを絞ることができる。
-
世界、地域、国の売上高と成長に関する詳細な分析が含まれている。
-
競合他社が成功した主なトレンド、変化、収益予測をハイライトします。
本レポートは、細胞治療技術市場が今後10年間にどのように発展していくのか、またCOVID-19の景気後退と好転の変動に合わせてどのように発展していくのかをTODAYでお伝えするものである。この市場は、過去10年間のどの時点よりも今が重要である。
2034年までの予測やその他の分析から、商業的な展望が明らかになる
-
2034年までの収益予測に加え、最近の実績、成長率、市場シェアも提供している。
-
ビジネスの展望や展開など、独自の分析が掲載されている。
-
定性的分析(市場ダイナミクス、促進要因、機会、阻害要因など)、ポーターのファイブフォース分析、PEST分析、最近の動向をご覧いただけます。
本レポートには、COVID-19が業界と貴社にどのような影響を与えるかについてのデータ分析と貴重な洞察が含まれている。本レポートでは、COVID-19の4つの回復パターンとその影響、すなわち「V」、「L」、「W」、「U」について論じている。
レポート対象セグメント
製品
-
血清、培地、試薬
-
細胞工学製品
-
細胞培養容器
-
設備
-
システムとソフトウェア
-
その他
セル・タイプ
プロセス
-
Cell プロセスing
-
細胞の保存、流通、取り扱い
-
プロセス Monitoring and Quality Control
エンドユーザー
-
バイオ医薬品・バイオテクノロジー企業
-
CRO、研究所、細胞バンク
世界市場全体と各分野の収益予測に加え、5つの地域と22の主要国市場の収益予測も掲載している:
北米
欧州
-
ドイツ
-
英国
-
フランス
-
イタリア
-
スペイン
-
その他の欧州
アジア太平洋
-
日本
-
中国
-
インド
-
オーストラリア
-
韓国
-
その他のアジア太平洋
ラテンアメリカ
MEA
本レポートには、2024年から2034年までの細胞治療技術市場における主要企業のプロファイルも含まれている。
報告書に掲載されている主要企業
-
Avantor, Inc.
-
Bio-Techne Corporation
-
Bristol-Myers Squibb Company
-
Corning Incorporated
-
Danaher Corporation
-
FUJIFILM Diosynth Biotechnologies
-
GE Healthcare
-
Gilead Sciences, Inc.
-
Lonza
-
Merck KGaA
-
Novartis AG
-
Sartorius AG
-
Terumo BCT
-
Thermo Fisher Scientific Inc.
2024年から2034年までの細胞治療技術市場全体の世界売上高(金額ベース)は、2024年に70億4,000万米ドルを突破する。2034年まで力強い収益成長を予測。当調査では、最も大きな可能性を秘めた企業を特定しています。彼らの能力、進歩、商業的展望を発見し、一歩先を行くお手伝いをします。
細胞治療技術市場、2024-2034年レポートはどのように役立つのか?
まとめると、300ページを超えるこのレポートは、以下のような知識を提供する:
-
細胞治療技術市場の2024年から2034年までの収益予測、製品、細胞タイプ、プロセス、エンドユーザー別の予測を世界・地域レベルで掲載 - 業界の将来性を発見し、投資と収益に最も有利な場所を見つけることができます。
-
5つの地域と22の主要国市場の2034年までの収益予測 - 北米、ヨーロッパ、アジア太平洋、ラテンアメリカ、MEAの細胞治療技術市場の2024年から2034年までの予測をご覧ください。また、米国、カナダ、メキシコ、ブラジル、ドイツ、フランス、英国、イタリア、中国、インド、日本、オーストラリアなどの主要国の市場も予測しています。
-
2024年から2034年までの細胞治療技術市場に関わる主要企業13社の企業プロファイルを含む。
独自の予測による定量的・定性的分析をご覧ください。私たちのレポートだけに含まれる情報を入手し、貴重なビジネスインテリジェンスで情報を得ることができます。
他にはない情報
私たちの新しいレポートがあれば、知識に遅れをとったり、チャンスを逃したりする可能性が低くなります。弊社の調査レポートが貴社の調査、分析、意思決定にどのように役立つかをご覧ください。Visiongainの調査は、細胞治療技術市場2024年から2034年、市場をリードする企業の商業分析を必要とするすべての人のためのものです。データ、トレンド、予測をご覧いただけます。
ページTOPに戻る
目次
目次
1 レポート概要
1.1 研究の目的
1.2 細胞治療技術市場の紹介
1.3 本レポートの内容
1.4 本レポートを読むべき理由
1.5 本分析レポートが回答する主な質問は以下の通り:
1.6 本レポートの対象者
1.7 方法論
1.7.1 市場の定義
1.7.2 市場評価・予測手法
1.7.3 データの検証
1.7.3.1 一次調査
1.7.3.2 セカンダリーリサーチ
1.8 よくある質問(FAQ)
1.9 Visiongainの関連レポート
1.10 Visiongainについて
2 エグゼクティブ・サマリー
3 市場概要
3.1 主要な調査結果
3.2 市場ダイナミクス
3.2.1 市場促進要因
3.2.1.1 細胞生物学の進歩
3.2.1.2 細胞ベースの研究に対する政府投資の増加
3.2.1.3 技術的進歩
3.2.1.4 細胞治療生産施設のGMP認証の増加
3.2.2 市場抑制要因
3.2.2.1 製造に関連する課題が業界の成長を抑制する可能性が高い
3.2.2.2 低い成功率
3.2.2.3 業界の成長を妨げると予測される物流の課題
3.2.3 市場機会
3.2.3.1 個別化医療への注目の高まり
3.2.3.2 ESCに代わるiPS細胞の出現
3.2.3.3 デジタルヘルス技術の統合
3.2.3.4 治療応用の拡大
3.3 COVID-19インパクト分析
3.4 ポーターのファイブフォース分析
3.4.1 供給者パワー
3.4.2 バイヤーパワー
3.4.3 競争力
3.4.4 代替品の脅威
3.4.5 新規参入企業の脅威
3.5 PEST分析
4 細胞治療技術市場分析:製品別
4.1 主要な調査結果
4.2 製品セグメント 市場魅力度指数
4.3 細胞治療技術の製品別市場規模推定と予測
4.4 血清、培地、試薬
4.4.1 2024-2034年の地域別市場予測(US$ Million, AGR %)
4.4.2 地域別市場シェア、2024年・2034年 (%)
4.5 細胞工学製品
4.5.1 2024年~2034年の地域別市場展望(US$ Million, AGR %)
4.5.2 地域別市場シェア、2024年・2034年(%)
4.6 細胞培養容器
4.6.1 2024~2034年の地域別市場展望(US$ Million, AGR %)
4.6.2 地域別市場シェア、2024年・2034年 (%)
4.7 設備
4.7.1 2024~2034年の地域別市場展望(US$ Million, AGR %)
4.7.2 地域別市場シェア、2024年・2034年 (%)
4.8 システムとソフトウェア
4.8.1 2024~2034年の地域別市場展望(US$ Million, AGR %)
4.8.2 地域別市場シェア、2024年・2034年 (%)
4.9 その他
4.9.1 2024年~2034年の地域別市場展望(US$ Million, AGR %)
4.9.2 地域別市場シェア、2024年・2034年 (%)
5 細胞治療技術市場分析:細胞タイプ別
5.1 主要な調査結果
5.2 細胞タイプ別セグメント 市場魅力度指数
5.3 細胞治療技術の細胞タイプ別市場規模推定と予測
5.4 T細胞
5.4.1 2024〜2034年の地域別市場予測(US$ Million, AGR %)
5.4.2 地域別市場シェア、2024年・2034年 (%)
5.5 幹細胞
5.5.1 2024~2034年の地域別市場予測(US$ Million, AGR %)
5.5.2 地域別市場シェア、2024年・2034年 (%)
5.6 その他の細胞
5.6.1 2024~2034年の地域別市場展望(US$ Million, AGR %)
5.6.2 地域別市場シェア、2024年・2034年 (%)
6 細胞治療技術市場分析:プロセス別
6.1 主要調査結果
6.2 プロセスセグメント 市場魅力度指数
6.3 細胞治療技術のプロセス別市場規模推定と予測
6.4 細胞加工
6.4.1 2024〜2034年の地域別市場予測(US$ Million, AGR %)
6.4.2 地域別市場シェア、2024年・2034年 (%)
6.5 細胞の保存、流通、取り扱い
6.5.1 2024~2034年の地域別市場予測(US$ Million, AGR %)
6.5.2 地域別市場シェア、2024年・2034年 (%)
6.6 プロセスモニタリングと品質管理
6.6.1 2024~2034年の地域別市場予測(US$ Million, AGR %)
6.6.2 地域別市場シェア、2024年・2034年 (%)
7 細胞治療技術市場分析:エンドユーザー別
7.1 主要調査結果
7.2 エンドユーザーセグメント: 市場魅力度指数
7.3 細胞治療技術のエンドユーザー別市場規模推定と予測
7.4 バイオ医薬品・バイオテクノロジー企業
7.4.1 2024〜2034年の地域別市場予測(US$ Million, AGR %)
7.4.2 地域別市場シェア、2024年・2034年 (%)
7.5 CRO、研究機関、細胞バンク
7.5.1 2024年~2034年の地域別市場予測(US$ Million, AGR %)
7.5.2 地域別市場シェア、2024年・2034年 (%)
8 細胞治療技術市場分析:地域別
8.1 主要な調査結果
8.2 地域別市場規模の推定と予測
9 北米の細胞治療技術の市場分析
9.1 主要な調査結果
9.2 北米の細胞治療技術市場魅力度指数
9.3 北米の細胞治療技術国別市場、2024年、2029年、2034年(US$ Million)
9.4 北米の細胞治療技術市場規模推定と予測:国別
9.5 北米の細胞治療技術市場規模推定と予測:製品別
9.6 北米の細胞治療技術市場規模推定と予測:細胞タイプ別
9.7 北米の細胞治療技術市場規模推定と予測:プロセス別
9.8 北米の細胞治療技術市場規模推定と予測:エンドユーザー別
9.9 米国の細胞治療技術市場分析
9.10 カナダの細胞治療技術市場分析
10 欧州の細胞治療技術市場分析
10.1 主要な調査結果
10.2 欧州細胞治療技術市場魅力度指数
10.3 欧州の細胞治療技術国別市場、2024年、2029年、2034年(US$ Million)
10.4 欧州の細胞治療技術市場規模推定と予測:国別
10.5 欧州の細胞治療技術市場規模推定と予測:製品別
10.6 欧州の細胞治療技術市場規模推定と予測:細胞タイプ別
10.7 欧州の細胞治療技術市場規模推定と予測:プロセス別
10.8 欧州の細胞治療技術市場規模推定と予測:エンドユーザー別
10.9 ドイツの細胞治療技術市場分析
10.10 イギリスの細胞治療技術市場分析
10.11 フランスの細胞治療技術市場分析
10.12 イタリアの細胞治療技術市場分析
10.13 スペインの細胞治療技術市場分析
10.14 ロシアの細胞治療技術市場分析
10.15 その他の欧州の細胞治療技術市場分析
11 アジア太平洋地域の細胞治療技術市場分析
11.1 主要な調査結果
11.2 アジア太平洋地域の細胞治療技術市場魅力度指数
11.3 アジア太平洋地域の細胞治療技術の国別市場、2024年、2029年、2034年(US$ Million)
11.4 アジア太平洋地域の細胞治療技術市場規模推定と予測:国別
11.5 アジア太平洋地域の細胞治療技術市場規模推定と予測:製品別
11.6 アジア太平洋地域の細胞治療技術市場規模推定と予測:細胞タイプ別
11.7 アジア太平洋地域の細胞治療技術市場規模推定と予測:プロセス別
11.8 アジア太平洋地域の細胞治療技術市場規模推定と予測:エンドユーザー別
11.9 日本の細胞治療技術市場分析
11.10 中国の細胞治療技術市場分析
11.11 インドの細胞治療技術市場分析
11.12 オーストラリアの細胞治療技術市場分析
11.13 韓国の細胞治療技術市場分析
11.14 東南アジアの細胞治療技術市場分析
11.15 その他のアジア太平洋地域の細胞治療技術市場分析
12 ラテンアメリカの細胞治療技術市場分析
12.1 主要な調査結果
12.2 ラテンアメリカの細胞治療技術市場魅力度指数
12.3 ラテンアメリカの細胞治療技術国別市場、2024年、2029年、2034年(US$ Million)
12.4 ラテンアメリカの細胞治療技術市場規模推定と予測:国別
12.5 ラテンアメリカの細胞治療技術市場規模推定と予測:製品別
12.6 ラテンアメリカの細胞治療技術市場規模推定と予測:細胞タイプ別
12.7 ラテンアメリカの細胞治療技術市場規模推定と予測:プロセス別
12.8 ラテンアメリカの細胞治療技術市場規模推定と予測:エンドユーザー別
12.9 ブラジルの細胞治療技術市場分析
12.10 メキシコの細胞治療技術市場分析
12.11 その他のラテンアメリカの細胞治療技術市場分析
13 MEAの細胞治療技術市場分析
13.1 主要な調査結果
13.2 MEA細胞治療技術市場魅力度指数
13.3 MEA細胞治療技術国別市場、2024年、2029年、2034年(US$ Million)
13.4 MEA細胞治療技術市場規模推定と予測:国別
13.5 MEA細胞治療技術市場規模推定と予測:製品別
13.6 MEA細胞治療技術市場規模推定と予測:細胞タイプ別
13.7 MEA細胞治療技術市場規模推定と予測:プロセス別
13.8 MEA細胞治療技術市場規模推定と予測:エンドユーザー別
13.9 GCCの細胞治療技術市場分析
13.10 南アフリカの細胞治療技術市場分析
13.11 その他のMEAの細胞治療技術市場分析
14 主要企業のプロファイル
14.1 Thermo Fisher Scientific Inc.
14.1.1 会社概要
14.1.2 会社概要
14.1.3 財務分析
14.1.3.1 純収入、2018-2023年
14.1.3.2 地域市場シェア、2022年
14.1.3.3 R&D、2018-2023年
14.1.4 製品ベンチマーク
14.1.5 戦略的展望
14.2 Novartis AG
14.2.1 会社概要
14.2.2 会社概要
14.2.3 財務分析
14.2.3.1 純収入、2018-2023年
14.2.3.2 地域市場シェア、2022年
14.2.3.3 R&D、2018-2023年
14.2.4 製品ベンチマーク
14.2.5 戦略的展望
14.3 Gilead Sciences, Inc.
14.3.1 会社概要
14.3.2 会社概要
14.3.3 財務分析
14.3.3.1 純収入、2018-2023年
14.3.3.2 R&D、2018-2023年
14.3.4 製品ベンチマーク
14.3.5 戦略的展望
14.4 Merck KGaA
14.4.1 会社概要
14.4.2 会社概要
14.4.3 財務分析
14.4.3.1 純収入、2018年~2023年
14.4.3.2 地域市場シェア、2023年
14.4.3.3 R&D、2018年〜2023年
14.4.4 製品ベンチマーク
14.4.5 戦略的展望
14.5 Danaher Corporation
14.5.1 会社概要
14.5.2 会社概要
14.5.3 財務分析
14.5.3.1 純収入、2018年~2023年
14.5.3.2 地域市場シェア、2023年
14.5.3.3 R&D、2018年〜2023年
14.5.4 製品ベンチマーク
14.5.5 戦略的展望
14.6 Bristol-Myers Squibb Company
14.6.1 会社概要
14.6.2 会社概要
14.6.3 財務分析
14.6.3.1 純収入、2018年~2023年
14.6.3.2 地域市場シェア、2023年
14.6.3.3 R&D、2018年〜2023年
14.6.4 製品ベンチマーク
14.6.5 戦略的展望
14.7 Sartorius AG
14.7.1 会社概要
14.7.2 会社概要
14.7.3 財務分析
14.7.3.1 純収入、2018-2023年
14.7.3.2 地域市場シェア、2023年
14.7.3.3 R&D、2018年〜2023年
14.7.4 製品ベンチマーク
14.7.5 戦略的展望
14.8 FUJIFILM Diosynth Biotechnologies
14.8.1 会社概要
14.8.2 会社概要
14.8.3 製品ベンチマーク
14.8.4 戦略的展望
14.9 Lonza
14.9.1 会社概要
14.9.2 会社概要
14.9.3 財務分析
14.9.3.1 純収入、2018年〜2023年
14.9.3.2 地域市場シェア、2023年
14.9.3.3 R&D、2018年〜2022年
14.9.4 製品ベンチマーク
14.9.5 戦略的展望
14.10 GE Healthcare
14.10.1 会社概要
14.10.2 会社概要
14.10.3 財務分析
14.10.3.1 純収入、2018年~2023年
14.10.3.2 地域市場シェア、2022年
14.10.3.3 R&D、2018年〜2023年
14.10.4 製品ベンチマーク
14.11 Terumo BCT
14.11.1 会社概要
14.11.2 会社概要
14.11.3 財務分析
14.11.3.1 純収入、2018-2023年
14.11.3.2 地域市場シェア、2022年
14.11.4 製品ベンチマーク
14.11.5 戦略的展望
14.12 Avantor, Inc.
14.12.1 会社概要
14.12.2 会社概要
14.12.3 財務分析
14.12.3.1 純収入、2018-2023年
14.12.3.2 地域市場シェア、2023年
14.12.4 製品ベンチマーク
14.12.5 戦略的展望
14.13 Bio-Techne Corporation
14.13.1 会社概要
14.13.2 会社概要
14.13.3 財務分析
14.13.3.1 純収入(2018年~2023年
14.13.3.2 R&D、2018年~2023年
14.13.4 製品ベンチマーク
14.13.5 戦略的展望
14.14 Corning Incorporated
14.14.1 会社概要
14.14.2 会社概要
14.14.3 財務分析
14.14.3.1 純収入、2018年~2023年
14.14.3.2 地域市場シェア、2023年
14.14.3.3 R&D、2018年〜2023年
14.14.4 製品ベンチマーク
14.14.5 戦略的展望
15 結論と提言
15.1 Visiongainからの結びの言葉
15.2 市場プレイヤーへの提言
ページTOPに戻る
図表リスト
表の一覧
表1 細胞治療技術市場のスナップショット、2024年〜2034年(百万米ドル、CAGR)
表2 細胞治療技術の地域別市場予測、2024~2034年(百万米ドル、AGR%、CAGR%):「V字型回復
表3 細胞治療技術の地域別市場予測、2024-2034年(百万米ドル、AGR%、CAGR%):「U字型回復
表4 細胞治療技術の地域別市場予測、2024-2034年(百万米ドル、AGR%、CAGR%):「W字型回復
表5 細胞治療技術の地域別市場予測、2024-2034年(百万米ドル、AGR%、CAGR%):「L字型回復
表6 細胞治療技術の製品別市場予測、2024-2034年(百万米ドル、AGR%、CAGR)
表7 血清、培地、試薬セグメントの地域別市場予測:2024-2034年(百万米ドル、AGR%、CAGR)
表8 細胞工学製品セグメントの地域別市場予測、2024-2034年(百万米ドル、AGR%、CAGR)
表9 細胞培養容器セグメントの地域別市場展望、2024-2034年(百万米ドル、AGR%、CAGR)
表10 装置セグメントの地域別市場予測、2024-2034年(百万米ドル、AGR%、CAGR)
表11 システム・ソフトウェアセグメントの地域別市場展望、2024-2034年(百万米ドル、AGR%、CAGR)
表12 その他セグメントの地域別市場展望、2024-2034年(百万米ドル、AGR%、CAGR)
表13 細胞治療技術の細胞タイプ別市場予測、2024-2034年(百万米ドル、AGR%、CAGR)
表14 T細胞セグメントの地域別市場予測、2024-2034年(百万米ドル、AGR%、CAGR)
表15 幹細胞セグメントの地域別市場予測、2024-2034年(百万米ドル、AGR%、CAGR)
表16 その他の細胞セグメントの地域別市場展望、2024-2034年(百万米ドル、AGR%、CAGR)
表17 細胞治療技術のプロセス別市場予測、2024-2034年(百万米ドル、AGR%、CAGR)
表18 循環器セグメントの地域別市場予測、2024-2034年(百万米ドル、AGR%、CAGR)
表19 細胞の保存、流通、取り扱いセグメントの地域別市場予測、2024-2034年(百万米ドル、AGR%、CAGR)
表20 プロセスモニタリングと品質管理セグメントの地域別市場予測、2024-2034年(百万米ドル、AGR%、CAGR)
表21 細胞治療技術のエンドユーザー別市場予測、2024-2034年(百万米ドル、AGR%、CAGR)
表22 バイオ医薬品・バイオテクノロジー企業セグメント地域別市場予測、2024-2034年(百万米ドル、AGR%、CAGR)
表23 CRO、研究所、細胞バンクの地域別市場予測、2024-2034年(百万米ドル、AGR%、CAGR)
表24 細胞治療技術の地域別市場予測、2024-2034年(百万米ドル、AGR%、CAGR)
表25 北米の細胞治療技術の国別市場予測、2024-2034年(百万米ドル、AGR%、CAGR)
表26 北米の細胞治療技術の製品別市場予測、2024-2034年(百万米ドル、AGR%、CAGR)
表27 北米の細胞治療技術の市場予測:細胞タイプ別、2024-2034年(百万米ドル、AGR%、CAGR)
表28 北米の細胞治療技術の市場予測:プロセス別、2024-2034年(百万米ドル、AGR%、CAGR)
表29 北米の細胞治療技術市場の予測:エンドユーザー別、2024-2034年(百万米ドル、AGR%、CAGR)
表30 米国の細胞治療技術の市場予測、2024-2034年(百万米ドル、AGR%、CAGR)
表31 カナダの細胞治療技術の市場予測、2024-2034年(百万米ドル、AGR%、CAGR)
表32 欧州の細胞治療技術の国別市場予測、2024-2034年(百万米ドル、AGR%、CAGR)
表33 欧州の細胞治療技術の製品別市場予測、2024-2034年(百万米ドル、AGR%、CAGR)
表34 欧州の細胞治療技術の市場予測:細胞タイプ別、2024-2034年(百万米ドル、AGR%、CAGR)
表35 欧州の細胞治療技術の市場予測:プロセス別、2024-2034年(百万米ドル、AGR%、CAGR)
表36 欧州の細胞治療技術の市場予測:エンドユーザー別、2024-2034年(百万米ドル、AGR%、CAGR)
表37 ドイツの細胞治療技術の市場予測、2024-2034年(百万米ドル、AGR%、CAGR)
表38 イギリスの細胞治療技術の市場予測、2024~2034年(百万米ドル、AGR%、CAGR)
表39 フランスの細胞治療技術の市場予測、2024~2034年(百万米ドル、AGR%、CAGR)
表40 イタリアの細胞治療技術の市場予測、2024-2034年(百万米ドル、AGR%、CAGR)
表41 スペインの細胞治療技術の市場予測、2024~2034年(百万米ドル、AGR%、CAGR)
表42 ロシア細胞治療技術の市場予測、2024~2034年(百万米ドル、AGR%、CAGR)
表43 その他のヨーロッパの細胞治療技術の市場予測、2024-2034年(百万米ドル、AGR%、CAGR)
表44 アジア太平洋地域の細胞治療技術の国別市場予測、2024-2034年(百万米ドル、AGR%、CAGR)
表45 アジア太平洋地域の細胞治療技術の製品別市場予測、2024-2034年(百万米ドル、AGR%、CAGR)
表46 アジア太平洋地域の細胞治療技術の市場予測:細胞タイプ別、2024-2034年(百万米ドル、AGR%、CAGR)
表47 アジア太平洋地域の細胞治療技術のプロセス別市場予測、2024-2034年(百万米ドル、AGR%、CAGR)
表48 アジア太平洋地域の細胞治療技術の市場予測:エンドユーザー別、2024-2034年(百万米ドル、AGR%、CAGR)
表49 日本の細胞治療技術の市場予測、2024-2034年(百万米ドル、AGR%、CAGR)
表50 中国の細胞治療技術の市場予測、2024-2034年(百万米ドル、AGR%、CAGR)
表51 インド細胞治療技術の市場予測、2024-2034年(百万米ドル、AGR%、CAGR)
表52 オーストラリアの細胞治療技術の市場予測、2024~2034年(百万米ドル、AGR%、CAGR)
表53 韓国の細胞治療技術の市場予測、2024~2034年(百万米ドル、AGR%、CAGR)
表54 東南アジアの細胞治療技術の市場予測、2024~2034年(百万米ドル、AGR%、CAGR)
表55 その他のアジア太平洋地域の細胞治療技術の市場予測、2024-2034年(百万米ドル、AGR%、CAGR)
表56 ラテンアメリカの細胞治療技術の国別市場予測、2024-2034年(百万米ドル、AGR%、CAGR)
表57 ラテンアメリカの細胞治療技術の製品別市場予測、2024-2034年(百万米ドル、AGR%、CAGR)
表58 ラテンアメリカの細胞治療技術市場予測:細胞タイプ別、2024-2034年(百万米ドル、AGR%、CAGR)
表59 ラテンアメリカの細胞治療技術市場予測:プロセス別、2024-2034年(百万米ドル、AGR%、CAGR)
表60 ラテンアメリカの細胞治療技術の市場予測:エンドユーザー別、2024-2034年(百万米ドル、AGR%、CAGR)
表61 ブラジル細胞治療技術の市場予測、2024-2034年(百万米ドル、AGR%、CAGR)
表62 メキシコの細胞治療技術の市場予測、2024~2034年(百万米ドル、AGR%、CAGR)
表63 ラテンアメリカ以外の細胞治療技術の市場予測、2024-2034年(百万米ドル、AGR%、CAGR)
表64 MEA細胞治療技術の国別市場予測、2024-2034年(百万米ドル、AGR%、CAGR)
表65 MEAの細胞治療技術の製品別市場予測、2024-2034年(百万米ドル、AGR%、CAGR)
表66 MEAの細胞治療技術の市場予測:細胞タイプ別、2024-2034年(百万米ドル、AGR%、CAGR)
表67 MEA細胞治療技術のプロセス別市場予測:2024-2034年(百万米ドル、AGR%、CAGR)
表68 MEA細胞治療技術のエンドユーザー別市場予測:2024-2034年(百万米ドル、AGR%、CAGR)
表69 GCCの細胞治療技術市場予測、2024-2034年(百万米ドル、AGR%、CAGR)
表70 南アフリカの細胞治療技術の市場予測、2024~2034年(百万米ドル、AGR%、CAGR)
表71 その他のMEAの細胞治療技術の市場予測、2024-2034年(百万米ドル、AGR%、CAGR)
表 72 サーモフィッシャーサイエンティフィック社主な詳細(CEO, 本社, 売上高, 設立, 従業員数, 企業タイプ, ウェブサイト, 事業セグメント)
表73 Thermo Fisher Scientific Inc:製品ベンチマーク
表74 Thermo Fisher Scientific Inc:戦略的展望
表75 ノバルティスAG: 主要詳細(CEO、本社、売上高、設立、従業員数、企業タイプ、ウェブサイト、事業セグメント)
表76 ノバルティスAG:製品ベンチマーク
表77 ノバルティスAG:戦略的展望
表78 ギリアド・サイエンシズInc:主な詳細(CEO, 本社, 売上高, 設立, 従業員数, 企業タイプ, ウェブサイト, 事業セグメント)
表79 ギリアド・サイエンシズInc:製品ベンチマーク
表80 ギリアド・サイエンシズInc:戦略的展望
表81 Merck KGaA: 主要詳細(CEO、本社、売上高、設立、従業員数、企業タイプ、ウェブサイト、事業セグメント)
表82 Merck KGaA: 製品ベンチマーク
表83 メルクKGaA:戦略的展望
表84 ダナハーコーポレーション主な詳細(CEO、本社、売上高、設立、従業員数、会社タイプ、ウェブサイト、事業セグメント)
表 85 ダナハーコーポレーション製品ベンチマーク
表 86 ダナハーコーポレーション戦略的展望
表87 ブリストル・マイヤーズ スクイブ社:戦略的展望主な詳細(CEO、本社、売上高、設立、従業員数、企業タイプ、ウェブサイト、事業セグメント)
表 88 ブリストル・マイヤーズ スクイブ社製品ベンチマーク
表89 ブリストル・マイヤーズ スクイブ カンパニー:製品ベンチマーク戦略的展望
表90 ザルトリウスAG:主要詳細(CEO、本社、売上高、設立、従業員数、企業タイプ、ウェブサイト、事業セグメント)
表91 ザルトリウスAG: 製品ベンチマーク
表92 ザルトリウスAG:戦略的展望
表93 富士フイルムジオシンスバイオテクノロジーズ:主な詳細(CEO, 本社, 売上高, 設立, 従業員数, 企業タイプ, ウェブサイト, 事業セグメント)
表94 富士フイルムジオシンスバイオテクノロジーズ:製品ベンチマーク
表95 富士フイルムジオシンスバイオテクノロジーズ:戦略的展望
表96 ロンザ主な詳細(CEO, 本社, 売上高, 設立, 従業員数, 企業タイプ, ウェブサイト, 事業セグメント)
表 97 ロンザ製品ベンチマーク
表98 ロンザ戦略的展望
表99 GEヘルスケア主な詳細(CEO, 本社, 売上高, 設立, 従業員数, 企業タイプ, ウェブサイト, 事業セグメント)
表100 GEヘルスケア製品ベンチマーク
表101 テルモBCT:主な詳細(CEO, 本社, 売上高, 設立, 従業員数, 企業タイプ, ウェブサイト, 事業セグメント)
表102 テルモBCT:製品ベンチマーク
表103 テルモBCT:戦略的展望
表104 Avantor, Inc:主な詳細(CEO, 本社, 売上高, 設立, 従業員数, 企業タイプ, ウェブサイト, 事業セグメント)
表105 Avantor, Inc:製品ベンチマーク
表106 Avantor, Inc:戦略的展望
表 107 バイオテクネ・コーポレーション主な詳細(CEO, 本社, 売上高, 設立, 従業員数, 企業タイプ, ウェブサイト, 事業セグメント)
表 108 バイオテクネ・コーポレーション製品ベンチマーク
表 109 バイオテクネコーポレーション戦略的展望
表110 コーニング・インコーポレイテッド主な詳細(CEO, 本社, 売上高, 設立, 従業員数, 企業タイプ, ウェブサイト, 事業セグメント)
表 111 コーニング製品ベンチマーク
表112 コーニング戦略的展望
 
図表一覧
図1 細胞治療技術市場のセグメンテーション
図2 細胞治療技術の製品別市場:市場魅力度指数
図3 細胞治療技術市場:細胞タイプ別:市場魅力度指数
図4 細胞治療技術のプロセス別市場:市場魅力度指数市場魅力度指数
図5 細胞治療技術市場:エンドユーザー別市場魅力度指数
図6 細胞治療技術市場:地域別市場魅力度指数
図7 細胞治療技術市場市場ダイナミクス
図8 細胞治療技術の地域別市場(2024年~2034年、百万米ドル、AGR %):「V字型回復
図9 2024~2034年の地域別細胞治療技術市場(百万米ドル、AGR %):「U字型回復
図10 細胞治療技術の地域別市場:2024年~2034年(百万米ドル、AGR %):「W字型回復
図11 細胞治療技術の地域別市場:2024年~2034年(百万米ドル、AGR %):「L字型回復
図 12 細胞治療技術市場:ポーターのファイブフォース分析
図 12 細胞治療技術市場:ポーターのファイブフォース分析PEST分析
図14 細胞治療技術市場の製品別魅力度指数
図15 細胞治療技術市場の製品別予測(2024~2034年、百万米ドル、AGR)
図16 細胞治療技術の製品別市場シェア予測(2024年、2029年、2034年)
図17 血清、培地、試薬セグメントの地域別市場予測、2024~2034年 (百万米ドル、AGR %)
図18 血清、培地、試薬セグメントの地域別市場シェア予測、2024年&2034年(%)
図 19 細胞工学製品セグメントの地域別市場予測、2024~2034 年 (百万米ドル、AGR)
図 20 細胞工学製品セグメント地域別市場シェア予測、2024 & 2034 (%)
図21 細胞培養容器セグメントの地域別市場予測、2024~2034年 (百万米ドル、AGR %)
図22 細胞培養容器セグメント地域別市場シェア予測、2024年~2034年(%)
図23 装置セグメントの地域別市場展望、2024~2034年 (百万米ドル, AGR %)
図24 装置セグメントの地域別市場シェア予測、2024年~2034年(%)
図25 地域別システム・ソフトウェアセグメント市場予測、2024~2034年 (百万米ドル、AGR %)
図 26 2024-2034 地域別システム・ソフトウェアセグメント市場シェア予測 (%)
図27 その他セグメントの地域別市場展望、2024~2034年 (百万米ドル、AGR %)
図28 その他セグメントの地域別市場シェア予測、2024年~2034年(%)
図 29 細胞治療技術の製品別市場魅力度指数
図30 細胞治療技術の市場予測(細胞タイプ別)、2024~2034年(百万米ドル、AGR
図31 細胞治療技術の細胞タイプ別市場予測(2024年、2029年、2034年)(%)
図32 T細胞セグメントの地域別市場予測、2024~2034年 (百万米ドル, AGR %)
図33 T細胞セグメントの地域別市場シェア予測、2024年&2034年(%)
図34 幹細胞セグメントの地域別市場予測、2024~2034年(百万米ドル、AGR)
図35 幹細胞セグメントの地域別市場シェア予測、2024年~2034年(%)
図36 その他の細胞セグメントの地域別市場展望、2024~2034年 (百万米ドル, AGR %)
図37 その他の細胞セグメントの地域別市場シェア予測、2024年&2034年(%)
図 38 細胞治療技術のプロセス別市場魅力度指数
図 39 細胞治療技術のプロセス別市場予測(2024~2034 年) (百万米ドル, AGR
図40 2024年、2029年、2034年の細胞治療技術のプロセス別市場シェア予測(%)
図41 細胞加工セグメントの地域別市場予測、2024~2034年(百万米ドル、AGR)
図42 細胞加工技術の地域別市場シェア予測、2024年~2034年(%)
図43 細胞保存、流通、ハンドリングセグメントの地域別市場予測、2024~2034年 (百万米ドル、AGR %)
図 44 2024-2034 年における細胞保存、流通、ハンドリング分野の地域別市場シェア予測 (%)
図45 プロセスモニタリングと品質管理セグメントの地域別市場予測、2024~2034年 (百万米ドル、AGR %)
図46 プロセスモニタリングと品質管理セグメントの地域別市場シェア予測、2024年~2034年 (%)
図47 細胞治療技術のエンドユーザー別市場魅力度指数
図 48 細胞治療技術のエンドユーザー別市場予測(2024~2034 年) (百万米ドル, AGR
図 49 エンドユーザー別細胞治療技術市場シェア予測(2024, 2029, 2034年)
図 50 バイオ医薬品・バイオテクノロジー企業セグメント地域別市場予測、2024~2034 年 (百万米ドル、AGR)
図 51 バイオ医薬品・バイオテクノロジー企業セグメント地域別市場シェア予測、2024 年~2034 年(%)
図 52 CRO、研究機関、細胞バンクの地域別市場予測、2024~2034 年 (百万米ドル、AGR)
図 53 CRO、研究機関、細胞バンクの地域別市場シェア予測、2024 年~2034 年 (%)
図54 細胞治療技術の地域別市場予測(2024年、2029年、2034年)(売上高、CAGR
図55 2024年、2029年、2034年の細胞治療技術地域別市場シェア予測(%)
図56 2024年~2034年の細胞治療技術の地域別市場予測(US$ Mn)
図57 北米の細胞治療技術市場魅力度指数
図 58 北米の細胞治療技術市場(地域別)、2024 年、2029 年、2034 年 (百万米ドル
図59 北米細胞治療技術市場の国別予測(2024~2034年)(百万米ドル
図60 北米の細胞治療技術市場国別シェア予測、2024年&2034年(%)
図61 北米における細胞治療技術の製品別市場予測、2024年~2034年(百万米ドル、AGR)
図62 北米の細胞治療技術市場:製品別シェア予測、2024年&2034年(%)
図63 北米の細胞治療技術市場:細胞タイプ別予測(2024-2034) (百万米ドル, AGR %)
図64 北米の細胞治療技術市場:細胞タイプ別シェア予測、2024年&2034年(%)
図65 北米の細胞治療技術のプロセス別市場予測、2024~2034年 (百万米ドル、AGR)
図66 北米の細胞治療技術のプロセス別市場予測、2024年&2034年(%)
図67 北米の細胞治療技術市場:エンドユーザー別予測(2024年~2034年、100万米ドル、AGR)
図 68 北米の細胞治療技術市場エンドユーザー別シェア予測、2024年&2034年(%)
図69 米国細胞治療技術市場予測、2024~2034年(百万米ドル、AGR)
図 70 カナダの細胞治療技術市場予測、2024~2034 年 (百万米ドル、AGR)
図71 欧州の細胞治療技術市場魅力度指数
図 72 欧州の細胞治療技術市場(地域別):2024年、2029年、2034年(百万米ドル
図73 欧州の細胞治療技術市場:国別予測(2024~2034年)(百万米ドル
図74 欧州の細胞治療技術市場国別シェア予測、2024年&2034年(%)
図75 欧州の細胞治療技術の製品別市場予測、2024~2034年(百万米ドル、AGR)
図76 欧州の細胞治療技術市場:製品別シェア予測、2024年~2034年(%)
図77 欧州の細胞治療技術市場:細胞タイプ別予測(2024~2034年、百万米ドル、AGR)
図78 欧州の細胞治療技術市場:細胞タイプ別シェア予測、2024年~2034年(%)
図79 欧州の細胞治療技術のプロセス別市場予測、2024~2034年 (百万米ドル、AGR %)
図80 欧州の細胞治療技術市場シェア(プロセス別):2024年~2034年予測(%)
図81 欧州の細胞治療技術市場:エンドユーザー別予測(2024~2034年、百万米ドル、AGR)
図82 欧州の細胞治療技術市場:エンドユーザー別シェア予測、2024年~2034年(%)
図83 ドイツの細胞治療技術市場予測、2024~2034年 (百万米ドル、AGR %)
図84 イギリスの細胞治療技術市場予測、2024~2034年 (百万米ドル, AGR %)
図 85 フランスの細胞治療技術の市場展望、2024-2034 (百万米ドル、AGR %)
図86 イタリアの細胞治療技術の市場展望、2024~2034年 (百万米ドル、AGR %)
図 87 スペインの細胞治療技術の市場展望、2024~2034年 (百万米ドル、AGR %)
図 88 ロシアの細胞治療技術市場予測、2024~2034年 (百万米ドル、AGR %)
図 89 その他のヨーロッパの細胞治療技術市場予測、2024~2034年 (百万米ドル、AGR %)
図90 アジア太平洋地域の細胞治療技術市場魅力度指数
図91 アジア太平洋地域の細胞治療技術市場(地域別):2024年、2029年、2034年(百万米ドル
図92 アジア太平洋地域の細胞治療技術の国別市場予測(2024~2034年)(百万米ドル
図93 アジア太平洋地域の細胞治療技術市場国別シェア予測、2024年&2034年(%)
図94 アジア太平洋地域の細胞治療技術の製品別市場予測、2024年~2034年(百万米ドル、AGR)
図95 アジア太平洋地域の細胞治療技術の製品別市場予測、2024年&2034年(%)
図96 アジア太平洋地域の細胞治療技術市場:細胞タイプ別予測(2024~2034年、百万米ドル、AGR)
図97 アジア太平洋地域の細胞治療技術市場:細胞タイプ別シェア予測、2024年~2034年(%)
図98 アジア太平洋地域の細胞治療技術のプロセス別市場予測、2024~2034年 (百万米ドル、AGR)
図99 アジア太平洋地域の細胞治療技術のプロセス別市場予測、2024年~2034年(%)
図100 アジア太平洋地域の細胞治療技術のエンドユーザー別市場予測:2024年~2034年(百万米ドル、AGR)
図101 アジア太平洋地域の細胞治療技術市場:エンドユーザー別シェア予測、2024年~2034年(%)
図102 日本の細胞治療技術の市場予測、2024年~2034年 (百万米ドル、AGR %)
図103 中国細胞治療技術の市場展望、2024~2034年 (百万米ドル, AGR %)
図104 インド細胞治療技術の市場展望、2024~2034年 (百万米ドル, AGR %)
図105 オーストラリアの細胞治療技術の市場展望、2024~2034年 (百万米ドル、AGR %)
図106 韓国の細胞治療技術の市場展望、2024~2034年 (百万米ドル, AGR %)
図 107 東南アジアの細胞治療技術の市場展望、2024~2034年 (百万米ドル、AGR %)
図108 その他のアジア太平洋地域の細胞治療技術市場予測、2024-2034年 (百万米ドル、AGR %)
図109 ラテンアメリカの細胞治療技術市場魅力度指数
図110 ラテンアメリカの細胞治療技術市場(地域別):2024年、2029年&2034年(百万米ドル
図111 中南米の細胞治療技術市場:国別予測(2024~2034年)(百万米ドル
図112 中南米の細胞治療技術市場国別シェア予測、2024年&2034年(%)
図113 ラテンアメリカの細胞治療技術市場製品別予測、2024~2034年 (百万米ドル, AGR %)
図114 ラテンアメリカの細胞治療技術市場製品別シェア予測、2024年~2034年 (%)
図115 中南米の細胞治療技術市場:細胞タイプ別予測(2024~2034年、百万米ドル、AGR)
図116 中南米の細胞治療技術市場:細胞タイプ別シェア予測、2024年~2034年(%)
図117 中南米の細胞治療技術市場:プロセス別予測(2024~2034年、百万米ドル、AGR)
図118 中南米の細胞治療技術市場:プロセス別シェア予測、2024年~2034年(%)
図119 中南米の細胞治療技術市場:エンドユーザー別予測(2024~2034年、100万米ドル、AGR)
図120 ラテンアメリカの細胞治療技術のエンドユーザー別市場予測、2024年~2034年 (%)
図121 ブラジル細胞治療技術市場予測、2024~2034年 (百万米ドル, AGR %)
図122 メキシコの細胞治療技術市場予測、2024~2034年 (百万米ドル、AGR %)
図123 その他のラテンアメリカの細胞治療技術市場予測、2024-2034年 (百万米ドル、AGR %)
図124 MEA細胞治療技術市場の魅力指数
図125 MEA細胞治療技術の地域別市場(2024年、2029年&2034年)(百万米ドル
図126 MEA細胞治療技術の国別市場予測(2024~2034年)(百万米ドル
図127 MEA細胞治療技術の国別市場シェア予測、2024年&2034年(%)
図128 MEA細胞治療技術の製品別市場予測、2024年~2034年 (百万米ドル, AGR %)
図129 MEA細胞治療技術の製品別市場シェア予測、2024年~2034年(%)
図130 MEA細胞治療技術の細胞タイプ別市場予測、2024~2034年 (百万米ドル, AGR %)
図131 MEAの細胞治療技術市場:細胞タイプ別シェア予測、2024年~2034年(%)
図132 MEA細胞治療技術のプロセス別市場予測、2024年~2034年 (百万米ドル, AGR %)
図133 MEA細胞治療技術のプロセス別市場予測、2024年~2034年(%)
図134 MEA細胞治療技術のエンドユーザー別市場予測(2024-2034) (百万米ドル, AGR %)
図135 MEA細胞治療技術のエンドユーザー別市場予測、2024年~2034年 (%)
図136 GCCの細胞治療技術市場予測、2024~2034年 (百万米ドル, AGR %)
図 137 南アフリカの細胞治療技術市場予測、2024~2034年 (百万米ドル, AGR %)
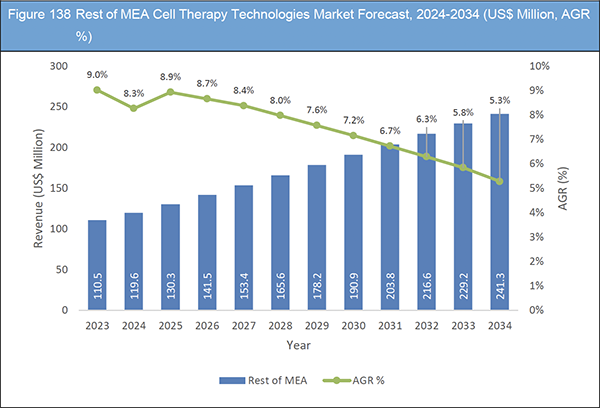
図138 その他のMEA細胞治療技術市場の予測、2024-2034年 (百万米ドル, AGR %)
図 139 サーモフィッシャーサイエンティフィック(Thermo Fisher Scientific Inc:純収入, 2018-2023 (百万米ドル, AGR%)
図 140 Thermo Fisher Scientific Inc:地域別市場シェア(%), 2022
図 141 サーモフィッシャーサイエンティフィック社:R&D、2018年-2023年(百万米ドル、AGR)
図142 ノバルティスAG:純収入、2018-2023年(百万米ドル、AGR)
図143 ノバルティスAG:地域別市場シェア(%)、2022年
図144 ノバルティスAG:R&D、2018-2023年(百万米ドル、AGR)
図 145 ギリアド・サイエンシズInc:純収入、2018年~2023年(百万米ドル、AGR)
図 146 ギリアド・サイエンシズInc:R&D、2018年-2023年(百万米ドル、AGR)
図147 メルクKGaA:純収入、2018-2023年(百万米ドル、AGR)
図148 メルクKGaA:地域別市場シェア(%)、2023年
図149 メルクKGaA:R&D、2018年-2023年(百万米ドル、AGR)
図 150 Danaher Corporation:純収入、2018年~2023年(百万米ドル、AGR)
図 151 Danaher Corporation:地域別市場シェア(%), 2023
図 152 Danaher Corporation:R&D、2018年~2023年(百万米ドル、AGR)
図 153 ブリストル・マイヤーズ スクイブ社:純収入、2018年~2023年(百万米ドル、AGR)
図 154 ブリストル・マイヤーズ スクイブ社:地域別市場シェア(%), 2023
図 155 ブリストル・マイヤーズ スクイブ社:R&D、2018年~2023年(百万米ドル、AGR)
図156 ザルトリウスAG:純収入、2018年~2023年(百万米ドル、AGR)
図157 ザルトリウスAG:地域別市場シェア(%)、2023年
図158 ザルトリウスAG:R&D、2018-2023年(百万米ドル、AGR)
図 159 ロンザ:純収入、2018年~2023年(百万米ドル、AGR)
図 160 ロンザ:地域別市場シェア(%), 2023
図 161 ロンザ:R&D、2018年~2022年(百万米ドル、AGR)
図 162 GEヘルスケア純収入、2018年~2023年(百万米ドル、AGR)
図 163 GEヘルスケア:地域別市場シェア(%), 2022
図164 GEヘルスケアR&D、2018年~2023年(百万米ドル、AGR)
図 165 テルモBCT:純収入、2018年~2023年(百万米ドル、AGR)
図 166 テルモ BCT:地域別市場シェア(%)、2022 年
図 167 Avantor, Inc:純収入、2018年~2023年(百万米ドル、AGR)
図 168 Avantor, Inc:地域別市場シェア(%), 2023
図 169 Bio-Techne Corporation:純収入, 2018-2023 (百万米ドル, AGR%)
図170 Bio-Techne Corporation:R&D, 2018-2023 (百万米ドル, AGR%)
図 171 コーニング・インコーポレイテッド:純収入、2018~2023 年(百万米ドル、AGR)
図 172 コーニング・インコーポレイテッド:地域別市場シェア(%), 2023
図 173 コーニング・インコーポレイテッド:R&D, 2018-2023 (百万米ドル, AGR%)
ページTOPに戻る
Summary
Report Details
The Cell Therapy Technologies Market Report 2024-2034: This report will prove invaluable to leading firms striving for new revenue pockets if they wish to better understand the industry and its underlying dynamics. It will be useful for companies that would like to expand into different industries or to expand their existing operations in a new region.
Integration of Automation and Robotics into Manufacturing Processes Driving Industry Growth
The integration of automation & robotics within manufacturing sector is propelling the adoption of cell therapy technology. This fusion enhances efficiency, scalability, and reproducibility, while simultaneously mitigating contamination risks. The heightened utilization of closed system bioprocessing technologies further tackles manufacturing challenges by bolstering sterility and safety, all with minimal human intervention.
Nevertheless, obstacles such as steep development costs, intricate manufacturing processes, regulatory complexities, and restricted reimbursement policies pose potential hindrances to industry expansion. To surmount these barriers, there’s an escalating demand for cutting-edge analytical tools geared toward quality control and process optimization.
The integration of innovative assays, imaging techniques, and data analytics facilitates real-time monitoring and characterization of cellular products, thereby ensuring heightened efficacy and safety. Additionally, the focus on pioneering biomaterials and scaffolds enhances cell delivery and engraftment, thereby augmenting the allure of cell therapy technologies. Regulatory advancements & collaborations between industry stakeholders & research bodies are fostering innovation and accelerating the transition of cell therapy technologies from laboratory settings to clinical application.
What Questions Should You Ask before Buying a Market Research Report?
-
How is the cell therapy technologies market evolving?
-
What is driving and restraining the cell therapy technologies market?
-
How will each cell therapy technologies submarket segment grow over the forecast period and how much revenue will these submarkets account for in 2034?
-
How will the market shares for each cell therapy technologies submarket develop from 2024 to 2034?
-
What will be the main driver for the overall market from 2024 to 2034?
-
Will leading cell therapy technologies markets broadly follow the macroeconomic dynamics, or will individual national markets outperform others?
-
How will the market shares of the national markets change by 2034 and which geographical region will lead the market in 2034?
-
Who are the leading players and what are their prospects over the forecast period?
-
What are the cell therapy technologies projects for these leading companies?
-
How will the industry evolve during the period between 2024 and 2034? What are the implications of
cell therapy technologies projects taking place now and over the next 10 years?
-
Is there a greater need for product commercialisation to further scale the cell therapy technologies market?
-
Where is the cell therapy technologies market heading and how can you ensure you are at the forefront of the market?
-
What are the best investment options for new product and service lines?
-
What are the key prospects for moving companies into a new growth path and C-suite?
You need to discover how this will impact the cell therapy technologies market today, and over the next 10 years:
-
Our 305-page report provides 109 tables and 173 charts/graphs exclusively to you.
-
The report highlights key lucrative areas in the industry so you can target them – NOW.
-
It contains in-depth analysis of global, regional and national sales and growth.
-
It highlights for you the key successful trends, changes and revenue projections made by your competitors.
This report tells you TODAY how the cell therapy technologies market will develop in the next 10 years, and in line with the variations in COVID-19 economic recession and bounce. This market is more critical now than at any point over the last 10 years.
Forecasts to 2034 and other analyses reveal commercial prospects
-
In addition to revenue forecasting to 2034, our new study provides you with recent results, growth rates, and market shares.
-
You will find original analyses, with business outlooks and developments.
-
Discover qualitative analyses (including market dynamics, drivers, opportunities, and restraints), Porter’s Five Forces Analysis, PEST Analysis and recent developments.
This report includes data analysis and invaluable insight into how COVID-19 will affect the industry and your company. Four COVID-19 recovery patterns and their impact, namely, “V”, “L”, “W” and “U” are discussed in this report.
Segments Covered in the Report
Product
-
Sera, Media, Reagent
-
Cell Engineering Product
-
Cell Culture Vessels
-
Equipment
-
Systems and Software
-
Others
Cell Type
-
T-Cells
-
Stem Cells
-
Other Cells
Process
-
Cell Processing
-
Cell Preservation, Distribution, and Handling
-
Process Monitoring and Quality Control
End-users
-
Biopharmaceutical & Biotechnology Companies
-
CROs, Research Institutes and Cell Banks
In addition to the revenue predictions for the overall world market and segments, you will also find revenue forecasts for five regional and 22 leading national markets:
North America
Europe
-
Germany
-
UK
-
France
-
Italy
-
Spain
-
Rest of Europe
Asia Pacific
-
Japan
-
China
-
India
-
Australia
-
South Korea
-
Rest of Asia Pacific
Latin America
-
Brazil
-
Mexico
-
Rest of Latin America
MEA
-
GCC
-
South Africa
-
Rest of MEA
The report also includes profiles and for some of the leading companies in the Cell Therapy Technologies Market, 2024 to 2034, with a focus on this segment of these companies’ operations.
Leading companies profiled in the report
-
Avantor, Inc.
-
Bio-Techne Corporation
-
Bristol-Myers Squibb Company
-
Corning Incorporated
-
Danaher Corporation
-
FUJIFILM Diosynth Biotechnologies
-
GE Healthcare
-
Gilead Sciences, Inc.
-
Lonza
-
Merck KGaA
-
Novartis AG
-
Sartorius AG
-
Terumo BCT
-
Thermo Fisher Scientific Inc.
Overall world revenue for Cell Therapy Technologies Market, 2024 to 2034 in terms of value the market will surpass US$7,040 million in 2024, our work calculates. We predict strong revenue growth through to 2034. Our work identifies which organizations hold the greatest potential. Discover their capabilities, progress, and commercial prospects, helping you stay ahead.
How will the Cell Therapy Technologies Market, 2024 to 2034 report help you?
In summary, our 300+ page report provides you with the following knowledge:
-
Revenue forecasts to 2034 for Cell Therapy Technologies Market 2024 to 2034, with forecasts for product, cell type, process, and end-users, each forecast at a global and regional level – discover the industry’s prospects, finding the most lucrative places for investments and revenues.
-
Revenue forecasts to 2034 for five regional and 22 key national markets – See forecasts for the Cell Therapy Technologies Market, 2024 to 2034 market in North America, Europe, Asia-Pacific, Latin America, and MEA. Also forecasted is the market in the US, Canada, Mexico, Brazil, Germany, France, UK, Italy, China, India, Japan, and Australia among other prominent economies.
-
Prospects for established firms and those seeking to enter the market – including company profiles for 13 of the major companies involved in the Cell Therapy Technologies Market, 2024 to 2034.
Find quantitative and qualitative analyses with independent predictions. Receive information that only our report contains, staying informed with invaluable business intelligence.
Information found nowhere else
With our new report, you are less likely to fall behind in knowledge or miss out on opportunities. See how our work could benefit your research, analyses, and decisions. Visiongain’s study is for everybody needing commercial analyses for the Cell Therapy Technologies Market 2024 to 2034, market-leading companies. You will find data, trends and predictions.
ページTOPに戻る
Table of Contents
Table of Contents
1 Report Overview
1.1 Objectives of the Study
1.2 Introduction to Cell Therapy Technologies Market
1.3 What This Report Delivers
1.4 Why You Should Read This Report
1.5 Key Questions Answered by This Analytical Report Include:
1.6 Who is This Report For?
1.7 Methodology
1.7.1 Market Definitions
1.7.2 Market Evaluation & Forecasting Methodology
1.7.3 Data Validation
1.7.3.1 Primary Research
1.7.3.2 Secondary Research
1.8 Frequently Asked Questions (FAQs)
1.9 Associated Visiongain Reports
1.10 About Visiongain
2 Executive Summary
3 Market Overview
3.1 Key Findings
3.2 Market Dynamics
3.2.1 Market Driving Factors
3.2.1.1 Advancements in Cellular Biology
3.2.1.2 Increasing Government Investments in Cell-based Research
3.2.1.3 Technological Advancements
3.2.1.4 Increasing GMP Certifications for Cell Therapy Production Facilities
3.2.2 Market Restraining Factors
3.2.2.1 Challenges Associated with Manufacturing Likely to Restrain Industry Growth
3.2.2.2 Low Success Rate
3.2.2.3 Logistical Challenges Projected to Hamper Industry Growth
3.2.3 Market Opportunities
3.2.3.1 Increased Focus on Personalized Medicine
3.2.3.2 Emergence of iPSCs as Alternatives to ESCs
3.2.3.3 Integration of Digital Health Technologies
3.2.3.4 Expanded Therapeutic Applications
3.3 COVID-19 Impact Analysis
3.4 Porter’s Five Forces Analysis
3.4.1 Supplier Power
3.4.2 Buyer Power
3.4.3 Competitive Rivalry
3.4.4 Threat of Substitutes
3.4.5 Threat of New Entrants
3.5 PEST Analysis
4 Cell Therapy Technologies Market Analysis by Product
4.1 Key Findings
4.2 Product Segment: Market Attractiveness Index
4.3 Cell Therapy Technologies Market Size Estimation and Forecast by Product
4.4 Sera, Media, Reagent
4.4.1 Market Forecast by Region, 2024-2034 (US$ Million, AGR %)
4.4.2 Market Share by Region, 2024 & 2034 (%)
4.5 Cell Engineering Product
4.5.1 Market Forecast by Region, 2024-2034 (US$ Million, AGR %)
4.5.2 Market Share by Region, 2024 & 2034 (%)
4.6 Cell Culture Vessels
4.6.1 Market Forecast by Region, 2024-2034 (US$ Million, AGR %)
4.6.2 Market Share by Region, 2024 & 2034 (%)
4.7 Equipment
4.7.1 Market Forecast by Region, 2024-2034 (US$ Million, AGR %)
4.7.2 Market Share by Region, 2024 & 2034 (%)
4.8 Systems and Software
4.8.1 Market Forecast by Region, 2024-2034 (US$ Million, AGR %)
4.8.2 Market Share by Region, 2024 & 2034 (%)
4.9 Others
4.9.1 Market Forecast by Region, 2024-2034 (US$ Million, AGR %)
4.9.2 Market Share by Region, 2024 & 2034 (%)
5 Cell Therapy Technologies Market Analysis by Cell Type
5.1 Key Findings
5.2 Cell Type Segment: Market Attractiveness Index
5.3 Cell Therapy Technologies Market Size Estimation and Forecast by Cell Type
5.4 T-Cells
5.4.1 Market Forecast by Region, 2024-2034 (US$ Million, AGR %)
5.4.2 Market Share by Region, 2024 & 2034 (%)
5.5 Stem Cells
5.5.1 Market Forecast by Region, 2024-2034 (US$ Million, AGR %)
5.5.2 Market Share by Region, 2024 & 2034 (%)
5.6 Other Cells
5.6.1 Market Forecast by Region, 2024-2034 (US$ Million, AGR %)
5.6.2 Market Share by Region, 2024 & 2034 (%)
6 Cell Therapy Technologies Market Analysis by Process
6.1 Key Findings
6.2 Process Segment: Market Attractiveness Index
6.3 Cell Therapy Technologies Market Size Estimation and Forecast by Process
6.4 Cell Processing
6.4.1 Market Forecast by Region, 2024-2034 (US$ Million, AGR %)
6.4.2 Market Share by Region, 2024 & 2034 (%)
6.5 Cell Preservation, Distribution, and Handling
6.5.1 Market Forecast by Region, 2024-2034 (US$ Million, AGR %)
6.5.2 Market Share by Region, 2024 & 2034 (%)
6.6 Process Monitoring and Quality Control
6.6.1 Market Forecast by Region, 2024-2034 (US$ Million, AGR %)
6.6.2 Market Share by Region, 2024 & 2034 (%)
7 Cell Therapy Technologies Market Analysis by End-users
7.1 Key Findings
7.2 End-users Segment: Market Attractiveness Index
7.3 Cell Therapy Technologies Market Size Estimation and Forecast by End-users
7.4 Biopharmaceutical & Biotechnology Companies
7.4.1 Market Forecast by Region, 2024-2034 (US$ Million, AGR %)
7.4.2 Market Share by Region, 2024 & 2034 (%)
7.5 CROs, Research Institutes and Cell Banks
7.5.1 Market Forecast by Region, 2024-2034 (US$ Million, AGR %)
7.5.2 Market Share by Region, 2024 & 2034 (%)
8 Cell Therapy Technologies Market Analysis by Region
8.1 Key Findings
8.2 Regional Market Size Estimation and Forecast
9 North America Cell Therapy Technologies Market Analysis
9.1 Key Findings
9.2 North America Cell Therapy Technologies Market Attractiveness Index
9.3 North America Cell Therapy Technologies Market by Country, 2024, 2029 & 2034 (US$ Million)
9.4 North America Cell Therapy Technologies Market Size Estimation and Forecast by Country
9.5 North America Cell Therapy Technologies Market Size Estimation and Forecast by Product
9.6 North America Cell Therapy Technologies Market Size Estimation and Forecast by Cell Type
9.7 North America Cell Therapy Technologies Market Size Estimation and Forecast by Process
9.8 North America Cell Therapy Technologies Market Size Estimation and Forecast by End-users
9.9 U.S. Cell Therapy Technologies Market Analysis
9.10 Canada Cell Therapy Technologies Market Analysis
10 Europe Cell Therapy Technologies Market Analysis
10.1 Key Findings
10.2 Europe Cell Therapy Technologies Market Attractiveness Index
10.3 Europe Cell Therapy Technologies Market by Country, 2024, 2029 & 2034 (US$ Million)
10.4 Europe Cell Therapy Technologies Market Size Estimation and Forecast by Country
10.5 Europe Cell Therapy Technologies Market Size Estimation and Forecast by Product
10.6 Europe Cell Therapy Technologies Market Size Estimation and Forecast by Cell Type
10.7 Europe Cell Therapy Technologies Market Size Estimation and Forecast by Process
10.8 Europe Cell Therapy Technologies Market Size Estimation and Forecast by End-users
10.9 Germany Cell Therapy Technologies Market Analysis
10.10 UK Cell Therapy Technologies Market Analysis
10.11 France Cell Therapy Technologies Market Analysis
10.12 Italy Cell Therapy Technologies Market Analysis
10.13 Spain Cell Therapy Technologies Market Analysis
10.14 Russia Cell Therapy Technologies Market Analysis
10.15 Rest of Europe Cell Therapy Technologies Market Analysis
11 Asia Pacific Cell Therapy Technologies Market Analysis
11.1 Key Findings
11.2 Asia Pacific Cell Therapy Technologies Market Attractiveness Index
11.3 Asia Pacific Cell Therapy Technologies Market by Country, 2024, 2029 & 2034 (US$ Million)
11.4 Asia Pacific Cell Therapy Technologies Market Size Estimation and Forecast by Country
11.5 Asia Pacific Cell Therapy Technologies Market Size Estimation and Forecast by Product
11.6 Asia Pacific Cell Therapy Technologies Market Size Estimation and Forecast by Cell Type
11.7 Asia Pacific Cell Therapy Technologies Market Size Estimation and Forecast by Process
11.8 Asia Pacific Cell Therapy Technologies Market Size Estimation and Forecast by End-users
11.9 Japan Cell Therapy Technologies Market Analysis
11.10 China Cell Therapy Technologies Market Analysis
11.11 India Cell Therapy Technologies Market Analysis
11.12 Australia Cell Therapy Technologies Market Analysis
11.13 South Korea Cell Therapy Technologies Market Analysis
11.14 South-East Asia Cell Therapy Technologies Market Analysis
11.15 Rest of Asia Pacific Cell Therapy Technologies Market Analysis
12 Latin America Cell Therapy Technologies Market Analysis
12.1 Key Findings
12.2 Latin America Cell Therapy Technologies Market Attractiveness Index
12.3 Latin America Cell Therapy Technologies Market by Country, 2024, 2029 & 2034 (US$ Million)
12.4 Latin America Cell Therapy Technologies Market Size Estimation and Forecast by Country
12.5 Latin America Cell Therapy Technologies Market Size Estimation and Forecast by Product
12.6 Latin America Cell Therapy Technologies Market Size Estimation and Forecast by Cell Type
12.7 Latin America Cell Therapy Technologies Market Size Estimation and Forecast by Process
12.8 Latin America Cell Therapy Technologies Market Size Estimation and Forecast by End-users
12.9 Brazil Cell Therapy Technologies Market Analysis
12.10 Mexico Cell Therapy Technologies Market Analysis
12.11 Rest of Latin America Cell Therapy Technologies Market Analysis
13 MEA Cell Therapy Technologies Market Analysis
13.1 Key Findings
13.2 MEA Cell Therapy Technologies Market Attractiveness Index
13.3 MEA Cell Therapy Technologies Market by Country, 2024, 2029 & 2034 (US$ Million)
13.4 MEA Cell Therapy Technologies Market Size Estimation and Forecast by Country
13.5 MEA Cell Therapy Technologies Market Size Estimation and Forecast by Product
13.6 MEA Cell Therapy Technologies Market Size Estimation and Forecast by Cell Type
13.7 MEA Cell Therapy Technologies Market Size Estimation and Forecast by Process
13.8 MEA Cell Therapy Technologies Market Size Estimation and Forecast by End-users
13.9 GCC Cell Therapy Technologies Market Analysis
13.10 South Africa Cell Therapy Technologies Market Analysis
13.11 Rest of MEA Cell Therapy Technologies Market Analysis
14 Company Profiles
14.1 Thermo Fisher Scientific Inc.
14.1.1 Company Snapshot
14.1.2 Company Overview
14.1.3 Financial Analysis
14.1.3.1 Net Revenue, 2018-2023
14.1.3.2 Regional Market Shares, 2022
14.1.3.3 R&D, 2018-2023
14.1.4 Product Benchmarking
14.1.5 Strategic Outlook
14.2 Novartis AG
14.2.1 Company Snapshot
14.2.2 Company Overview
14.2.3 Financial Analysis
14.2.3.1 Net Revenue, 2018-2023
14.2.3.2 Regional Market Shares, 2022
14.2.3.3 R&D, 2018-2023
14.2.4 Product Benchmarking
14.2.5 Strategic Outlook
14.3 Gilead Sciences, Inc.
14.3.1 Company Snapshot
14.3.2 Company Overview
14.3.3 Financial Analysis
14.3.3.1 Net Revenue, 2018-2023
14.3.3.2 R&D, 2018-2023
14.3.4 Product Benchmarking
14.3.5 Strategic Outlook
14.4 Merck KGaA
14.4.1 Company Snapshot
14.4.2 Company Overview
14.4.3 Financial Analysis
14.4.3.1 Net Revenue, 2018-2023
14.4.3.2 Regional Market Shares, 2023
14.4.3.3 R&D, 2018-2023
14.4.4 Product Benchmarking
14.4.5 Strategic Outlook
14.5 Danaher Corporation
14.5.1 Company Snapshot
14.5.2 Company Overview
14.5.3 Financial Analysis
14.5.3.1 Net Revenue, 2018-2023
14.5.3.2 Regional Market Shares, 2023
14.5.3.3 R&D, 2018-2023
14.5.4 Product Benchmarking
14.5.5 Strategic Outlook
14.6 Bristol-Myers Squibb Company
14.6.1 Company Snapshot
14.6.2 Company Overview
14.6.3 Financial Analysis
14.6.3.1 Net Revenue, 2018-2023
14.6.3.2 Regional Market Shares, 2023
14.6.3.3 R&D, 2018-2023
14.6.4 Product Benchmarking
14.6.5 Strategic Outlook
14.7 Sartorius AG
14.7.1 Company Snapshot
14.7.2 Company Overview
14.7.3 Financial Analysis
14.7.3.1 Net Revenue, 2018-2023
14.7.3.2 Regional Market Shares, 2023
14.7.3.3 R&D, 2018-2023
14.7.4 Product Benchmarking
14.7.5 Strategic Outlook
14.8 FUJIFILM Diosynth Biotechnologies
14.8.1 Company Snapshot
14.8.2 Company Overview
14.8.3 Product Benchmarking
14.8.4 Strategic Outlook
14.9 Lonza
14.9.1 Company Snapshot
14.9.2 Company Overview
14.9.3 Financial Analysis
14.9.3.1 Net Revenue, 2018-2023
14.9.3.2 Regional Market Shares, 2023
14.9.3.3 R&D, 2018-2022
14.9.4 Product Benchmarking
14.9.5 Strategic Outlook
14.10 GE Healthcare
14.10.1 Company Snapshot
14.10.2 Company Overview
14.10.3 Financial Analysis
14.10.3.1 Net Revenue, 2018-2023
14.10.3.2 Regional Market Shares, 2022
14.10.3.3 R&D, 2018-2023
14.10.4 Product Benchmarking
14.11 Terumo BCT
14.11.1 Company Snapshot
14.11.2 Company Overview
14.11.3 Financial Analysis
14.11.3.1 Net Revenue, 2018-2023
14.11.3.2 Regional Market Shares, 2022
14.11.4 Product Benchmarking
14.11.5 Strategic Outlook
14.12 Avantor, Inc.
14.12.1 Company Snapshot
14.12.2 Company Overview
14.12.3 Financial Analysis
14.12.3.1 Net Revenue, 2018-2023
14.12.3.2 Regional Market Shares, 2023
14.12.4 Product Benchmarking
14.12.5 Strategic Outlook
14.13 Bio-Techne Corporation
14.13.1 Company Snapshot
14.13.2 Company Overview
14.13.3 Financial Analysis
14.13.3.1 Net Revenue, 2018-2023
14.13.3.2 R&D, 2018-2023
14.13.4 Product Benchmarking
14.13.5 Strategic Outlook
14.14 Corning Incorporated
14.14.1 Company Snapshot
14.14.2 Company Overview
14.14.3 Financial Analysis
14.14.3.1 Net Revenue, 2018-2023
14.14.3.2 Regional Market Shares, 2023
14.14.3.3 R&D, 2018-2023
14.14.4 Product Benchmarking
14.14.5 Strategic Outlook
15 Conclusion and Recommendations
15.1 Concluding Remarks from Visiongain
15.2 Recommendations for Market Players
ページTOPに戻る
List of Tables/Graphs
List of Tables
Table 1 Cell Therapy Technologies Market Snapshot, 2024 & 2034 (US$ million, CAGR %)
Table 2 Cell Therapy Technologies Market Forecast by Region, 2024-2034 (US$ Million, AGR%, CAGR%): "V" Shaped Recovery
Table 3 Cell Therapy Technologies Market Forecast by Region, 2024-2034 (US$ Million, AGR%, CAGR%): "U" Shaped Recovery
Table 4 Cell Therapy Technologies Market Forecast by Region, 2024-2034 (US$ Million, AGR%, CAGR%): "W" Shaped Recovery
Table 5 Cell Therapy Technologies Market Forecast by Region, 2024-2034 (US$ Million, AGR%, CAGR%): "L" Shaped Recovery
Table 6 Cell Therapy Technologies Market Forecast by Product, 2024-2034 (US$ Million, AGR%, CAGR%)
Table 7 Sera, Media, Reagents Segment Market Forecast by Region, 2024-2034 (US$ Million, AGR%, CAGR%)
Table 8 Cell Engineering Products Segment Market Forecast by Region, 2024-2034 (US$ Million, AGR%, CAGR%)
Table 9 Cell Culture Vessels Segment Market Forecast by Region, 2024-2034 (US$ Million, AGR%, CAGR%)
Table 10 Equipment Segment Market Forecast by Region, 2024-2034 (US$ Million, AGR%, CAGR%)
Table 11 Systems and Software Segment Market Forecast by Region, 2024-2034 (US$ Million, AGR%, CAGR%)
Table 12 Others Segment Market Forecast by Region, 2024-2034 (US$ Million, AGR%, CAGR%)
Table 13 Cell Therapy Technologies Market Forecast by Cell Type, 2024-2034 (US$ Million, AGR%, CAGR%)
Table 14 T-Cells Segment Market Forecast by Region, 2024-2034 (US$ Million, AGR%, CAGR%)
Table 15 Stem Cells Segment Market Forecast by Region, 2024-2034 (US$ Million, AGR%, CAGR%)
Table 16 Other Cells Segment Market Forecast by Region, 2024-2034 (US$ Million, AGR%, CAGR%)
Table 17 Cell Therapy Technologies Market Forecast by Process, 2024-2034 (US$ Million, AGR%, CAGR%)
Table 18 Cardiovascular Segment Market Forecast by Region, 2024-2034 (US$ Million, AGR%, CAGR%)
Table 19 Cell Preservation, Distribution, and Handling Segment Market Forecast by Region, 2024-2034 (US$ Million, AGR%, CAGR%)
Table 20 Process Monitoring and Quality Control Segment Market Forecast by Region, 2024-2034 (US$ Million, AGR%, CAGR%)
Table 21 Cell Therapy Technologies Market Forecast by End-users, 2024-2034 (US$ Million, AGR%, CAGR%)
Table 22 Biopharmaceutical & Biotechnology Companies Segment Market Forecast by Region, 2024-2034 (US$ Million, AGR%, CAGR%)
Table 23 CROs, Research Institutes and Cell Banks Segment Market Forecast by Region, 2024-2034 (US$ Million, AGR%, CAGR%)
Table 24 Cell Therapy Technologies Market Forecast by Region, 2024-2034 (US$ Million, AGR%, CAGR%)
Table 25 North America Cell Therapy Technologies Market Forecast by Country, 2024-2034 (US$ Million, AGR%, CAGR%)
Table 26 North America Cell Therapy Technologies Market Forecast by Product, 2024-2034 (US$ Million, AGR%, CAGR%)
Table 27 North America Cell Therapy Technologies Market Forecast by Cell Type, 2024-2034 (US$ Million, AGR%, CAGR%)
Table 28 North America Cell Therapy Technologies Market Forecast by Process, 2024-2034 (US$ Million, AGR%, CAGR%)
Table 29 North America Cell Therapy Technologies Market Forecast by End-users, 2024-2034 (US$ Million, AGR%, CAGR%)
Table 30 U.S. Cell Therapy Technologies Market Forecast, 2024-2034 (US$ Million, AGR%, CAGR%)
Table 31 Canada Cell Therapy Technologies Market Forecast, 2024-2034 (US$ Million, AGR%, CAGR%)
Table 32 Europe Cell Therapy Technologies Market Forecast by Country, 2024-2034 (US$ Million, AGR%, CAGR%)
Table 33 Europe Cell Therapy Technologies Market Forecast by Product, 2024-2034 (US$ Million, AGR%, CAGR%)
Table 34 Europe Cell Therapy Technologies Market Forecast by Cell Type, 2024-2034 (US$ Million, AGR%, CAGR%)
Table 35 Europe Cell Therapy Technologies Market Forecast by Process, 2024-2034 (US$ Million, AGR%, CAGR%)
Table 36 Europe Cell Therapy Technologies Market Forecast by End-users, 2024-2034 (US$ Million, AGR%, CAGR%)
Table 37 Germany Cell Therapy Technologies Market Forecast, 2024-2034 (US$ Million, AGR%, CAGR%)
Table 38 UK Cell Therapy Technologies Market Forecast, 2024-2034 (US$ Million, AGR%, CAGR%)
Table 39 France Cell Therapy Technologies Market Forecast, 2024-2034 (US$ Million, AGR%, CAGR%)
Table 40 Italy Cell Therapy Technologies Market Forecast, 2024-2034 (US$ Million, AGR%, CAGR%)
Table 41 Spain Cell Therapy Technologies Market Forecast, 2024-2034 (US$ Million, AGR%, CAGR%)
Table 42 Russia Cell Therapy Technologies Market Forecast, 2024-2034 (US$ Million, AGR%, CAGR%)
Table 43 Rest of Europe Cell Therapy Technologies Market Forecast, 2024-2034 (US$ Million, AGR%, CAGR%)
Table 44 Asia Pacific Cell Therapy Technologies Market Forecast by Country, 2024-2034 (US$ Million, AGR%, CAGR%)
Table 45 Asia Pacific Cell Therapy Technologies Market Forecast by Product, 2024-2034 (US$ Million, AGR%, CAGR%)
Table 46 Asia Pacific Cell Therapy Technologies Market Forecast by Cell Type, 2024-2034 (US$ Million, AGR%, CAGR%)
Table 47 Asia Pacific Cell Therapy Technologies Market Forecast by Process, 2024-2034 (US$ Million, AGR%, CAGR%)
Table 48 Asia Pacific Cell Therapy Technologies Market Forecast by End-users, 2024-2034 (US$ Million, AGR%, CAGR%)
Table 49 Japan Cell Therapy Technologies Market Forecast, 2024-2034 (US$ Million, AGR%, CAGR%)
Table 50 China Cell Therapy Technologies Market Forecast, 2024-2034 (US$ Million, AGR%, CAGR%)
Table 51 India Cell Therapy Technologies Market Forecast, 2024-2034 (US$ Million, AGR%, CAGR%)
Table 52 Australia Cell Therapy Technologies Market Forecast, 2024-2034 (US$ Million, AGR%, CAGR%)
Table 53 South Korea Cell Therapy Technologies Market Forecast, 2024-2034 (US$ Million, AGR%, CAGR%)
Table 54 South-East Asia Cell Therapy Technologies Market Forecast, 2024-2034 (US$ Million, AGR%, CAGR%)
Table 55 Rest of Asia Pacific Cell Therapy Technologies Market Forecast, 2024-2034 (US$ Million, AGR%, CAGR%)
Table 56 Latin America Cell Therapy Technologies Market Forecast by Country, 2024-2034 (US$ Million, AGR%, CAGR%)
Table 57 Latin America Cell Therapy Technologies Market Forecast by Product, 2024-2034 (US$ Million, AGR%, CAGR%)
Table 58 Latin America Cell Therapy Technologies Market Forecast by Cell Type, 2024-2034 (US$ Million, AGR%, CAGR%)
Table 59 Latin America Cell Therapy Technologies Market Forecast by Process, 2024-2034 (US$ Million, AGR%, CAGR%)
Table 60 Latin America Cell Therapy Technologies Market Forecast by End-users, 2024-2034 (US$ Million, AGR%, CAGR%)
Table 61 Brazil Cell Therapy Technologies Market Forecast, 2024-2034 (US$ Million, AGR%, CAGR%)
Table 62 Mexico Cell Therapy Technologies Market Forecast, 2024-2034 (US$ Million, AGR%, CAGR%)
Table 63 Rest of Latin America Cell Therapy Technologies Market Forecast, 2024-2034 (US$ Million, AGR%, CAGR%)
Table 64 MEA Cell Therapy Technologies Market Forecast by Country, 2024-2034 (US$ Million, AGR%, CAGR%)
Table 65 MEA Cell Therapy Technologies Market Forecast by Product, 2024-2034 (US$ Million, AGR%, CAGR%)
Table 66 MEA Cell Therapy Technologies Market Forecast by Cell Type, 2024-2034 (US$ Million, AGR%, CAGR%)
Table 67 MEA Cell Therapy Technologies Market Forecast by Process, 2024-2034 (US$ Million, AGR%, CAGR%)
Table 68 MEA Cell Therapy Technologies Market Forecast by End-users, 2024-2034 (US$ Million, AGR%, CAGR%)
Table 69 GCC Cell Therapy Technologies Market Forecast, 2024-2034 (US$ Million, AGR%, CAGR%)
Table 70 South Africa Cell Therapy Technologies Market Forecast, 2024-2034 (US$ Million, AGR%, CAGR%)
Table 71 Rest of MEA Cell Therapy Technologies Market Forecast, 2024-2034 (US$ Million, AGR%, CAGR%)
Table 72 Thermo Fisher Scientific Inc.: Key Details, (CEO, HQ, Revenue, Founded, No. of Employees, Company Type, Website, Business Segment)
Table 73 Thermo Fisher Scientific Inc.: Product Benchmarking
Table 74 Thermo Fisher Scientific Inc.: Strategic Outlook
Table 75 Novartis AG: Key Details, (CEO, HQ, Revenue, Founded, No. of Employees, Company Type, Website, Business Segment)
Table 76 Novartis AG: Product Benchmarking
Table 77 Novartis AG: Strategic Outlook
Table 78 Gilead Sciences, Inc.: Key Details, (CEO, HQ, Revenue, Founded, No. of Employees, Company Type, Website, Business Segment)
Table 79 Gilead Sciences, Inc.: Product Benchmarking
Table 80 Gilead Sciences, Inc.: Strategic Outlook
Table 81 Merck KGaA: Key Details, (CEO, HQ, Revenue, Founded, No. of Employees, Company Type, Website, Business Segment)
Table 82 Merck KGaA: Product Benchmarking
Table 83 Merck KGaA: Strategic Outlook
Table 84 Danaher Corporation: Key Details, (CEO, HQ, Revenue, Founded, No. of Employees, Company Type, Website, Business Segment)
Table 85 Danaher Corporation: Product Benchmarking
Table 86 Danaher Corporation: Strategic Outlook
Table 87 Bristol-Myers Squibb Company: Key Details, (CEO, HQ, Revenue, Founded, No. of Employees, Company Type, Website, Business Segment)
Table 88 Bristol-Myers Squibb Company: Product Benchmarking
Table 89 Bristol-Myers Squibb Company: Strategic Outlook
Table 90 Sartorius AG: Key Details, (CEO, HQ, Revenue, Founded, No. of Employees, Company Type, Website, Business Segment)
Table 91 Sartorius AG: Product Benchmarking
Table 92 Sartorius AG: Strategic Outlook
Table 93 FUJIFILM Diosynth Biotechnologies: Key Details, (CEO, HQ, Revenue, Founded, No. of Employees, Company Type, Website, Business Segment)
Table 94 FUJIFILM Diosynth Biotechnologies: Product Benchmarking
Table 95 FUJIFILM Diosynth Biotechnologies: Strategic Outlook
Table 96 Lonza: Key Details, (CEO, HQ, Revenue, Founded, No. of Employees, Company Type, Website, Business Segment)
Table 97 Lonza: Product Benchmarking
Table 98 Lonza: Strategic Outlook
Table 99 GE Healthcare: Key Details, (CEO, HQ, Revenue, Founded, No. of Employees, Company Type, Website, Business Segment)
Table 100 GE Healthcare: Product Benchmarking
Table 101 Terumo BCT: Key Details, (CEO, HQ, Revenue, Founded, No. of Employees, Company Type, Website, Business Segment)
Table 102 Terumo BCT: Product Benchmarking
Table 103 Terumo BCT: Strategic Outlook
Table 104 Avantor, Inc.: Key Details, (CEO, HQ, Revenue, Founded, No. of Employees, Company Type, Website, Business Segment)
Table 105 Avantor, Inc.: Product Benchmarking
Table 106 Avantor, Inc.: Strategic Outlook
Table 107 Bio-Techne Corporation: Key Details, (CEO, HQ, Revenue, Founded, No. of Employees, Company Type, Website, Business Segment)
Table 108 Bio-Techne Corporation: Product Benchmarking
Table 109 Bio-Techne Corporation: Strategic Outlook
Table 110 Corning Incorporated: Key Details, (CEO, HQ, Revenue, Founded, No. of Employees, Company Type, Website, Business Segment)
Table 111 Corning Incorporated: Product Benchmarking
Table 112 Corning Incorporated: Strategic Outlook
List of Figures
Figure 1 Cell Therapy Technologies Market Segmentation
Figure 2 Cell Therapy Technologies Market by Product: Market Attractiveness Index
Figure 3 Cell Therapy Technologies Market by Cell Type: Market Attractiveness Index
Figure 4 Cell Therapy Technologies Market by Process: Market Attractiveness Index
Figure 5 Cell Therapy Technologies Market by End-users: Market Attractiveness Index
Figure 6 Cell Therapy Technologies Market Attractiveness Index by Region
Figure 7 Cell Therapy Technologies Market: Market Dynamics
Figure 8 Cell Therapy Technologies Market by Region, 2024-2034 (US$ Million, AGR %): “V” Shaped Recovery
Figure 9 Cell Therapy Technologies Market by Region, 2024-2034 (US$ Million, AGR %): “U” Shaped Recovery
Figure 10 Cell Therapy Technologies Market by Region, 2024-2034 (US$ Million, AGR %): “W” Shaped Recovery
Figure 11 Cell Therapy Technologies Market by Region, 2024-2034 (US$ Million, AGR %): “L” Shaped Recovery
Figure 12 Cell Therapy Technologies Market: Porter’s Five Forces Analysis
Figure 13 Cell Therapy Technologies Market: PEST Analysis
Figure 14 Cell Therapy Technologies Market Attractiveness Index by Product
Figure 15 Cell Therapy Technologies Market Forecast by Product, 2024-2034 (US$ Million, AGR %)
Figure 16 Cell Therapy Technologies Market Share Forecast by Product, 2024, 2029, 2034 (%)
Figure 17 Sera, Media, Reagent Segment Market Forecast by Region, 2024-2034 (US$ Million, AGR %)
Figure 18 Sera, Media, Reagent Segment Market Share Forecast by Region, 2024 & 2034 (%)
Figure 19 Cell Engineering Product Segment Market Forecast by Region, 2024-2034 (US$ Million, AGR %)
Figure 20 Cell Engineering Product Segment Market Share Forecast by Region, 2024 & 2034 (%)
Figure 21 Cell Culture Vessels Segment Market Forecast by Region, 2024-2034 (US$ Million, AGR %)
Figure 22 Cell Culture Vessels Segment Market Share Forecast by Region, 2024 & 2034 (%)
Figure 23 Equipment Segment Market Forecast by Region, 2024-2034 (US$ Million, AGR %)
Figure 24 Equipment Segment Market Share Forecast by Region, 2024 & 2034 (%)
Figure 25 Systems and Software Segment Market Forecast by Region, 2024-2034 (US$ Million, AGR %)
Figure 26 Systems and Software Segment Market Share Forecast by Region, 2024 & 2034 (%)
Figure 27 Others Segment Market Forecast by Region, 2024-2034 (US$ Million, AGR %)
Figure 28 Others Segment Market Share Forecast by Region, 2024 & 2034 (%)
Figure 29 Cell Therapy Technologies Market Attractiveness Index by Product
Figure 30 Cell Therapy Technologies Market Forecast by Cell Type, 2024-2034 (US$ Million, AGR %)
Figure 31 Cell Therapy Technologies Market Share Forecast by Cell Type, 2024, 2029, 2034 (%)
Figure 32 T-Cells Segment Market Forecast by Region, 2024-2034 (US$ Million, AGR %)
Figure 33 T-Cells Segment Market Share Forecast by Region, 2024 & 2034 (%)
Figure 34 Stem Cells Segment Market Forecast by Region, 2024-2034 (US$ Million, AGR %)
Figure 35 Stem Cells Segment Market Share Forecast by Region, 2024 & 2034 (%)
Figure 36 Other Cells Segment Market Forecast by Region, 2024-2034 (US$ Million, AGR %)
Figure 37 Other Cells Segment Market Share Forecast by Region, 2024 & 2034 (%)
Figure 38 Cell Therapy Technologies Market Attractiveness Index by Process
Figure 39 Cell Therapy Technologies Market Forecast by Process, 2024-2034 (US$ Million, AGR %)
Figure 40 Cell Therapy Technologies Market Share Forecast by Process, 2024, 2029, 2034 (%)
Figure 41 Cell Processing Segment Market Forecast by Region, 2024-2034 (US$ Million, AGR %)
Figure 42 Cell Processing Segment Market Share Forecast by Region, 2024 & 2034 (%)
Figure 43 Cell Preservation, Distribution, and Handling Segment Market Forecast by Region, 2024-2034 (US$ Million, AGR %)
Figure 44 Cell Preservation, Distribution, and Handling Segment Market Share Forecast by Region, 2024 & 2034 (%)
Figure 45 Process Monitoring and Quality Control Segment Market Forecast by Region, 2024-2034 (US$ Million, AGR %)
Figure 46 Process Monitoring and Quality Control Segment Market Share Forecast by Region, 2024 & 2034 (%)
Figure 47 Cell Therapy Technologies Market Attractiveness Index by End-users
Figure 48 Cell Therapy Technologies Market Forecast by End-users, 2024-2034 (US$ Million, AGR %)
Figure 49 Cell Therapy Technologies Market Share Forecast by End-users, 2024, 2029, 2034 (%)
Figure 50 Biopharmaceutical & Biotechnology Companies Segment Market Forecast by Region, 2024-2034 (US$ Million, AGR %)
Figure 51 Biopharmaceutical & Biotechnology Companies Segment Market Share Forecast by Region, 2024 & 2034 (%)
Figure 52 CROs, Research Institutes and Cell Banks Segment Market Forecast by Region, 2024-2034 (US$ Million, AGR %)
Figure 53 CROs, Research Institutes and Cell Banks Segment Market Share Forecast by Region, 2024 & 2034 (%)
Figure 54 Cell Therapy Technologies Market Forecast by Region 2024, 2029, 2034 (Revenue, CAGR%)
Figure 55 Cell Therapy Technologies Market Share Forecast by Region 2024, 2029, 2034 (%)
Figure 56 Cell Therapy Technologies Market by Region, 2024-2034 (US$ Mn)
Figure 57 North America Cell Therapy Technologies Market Attractiveness Index
Figure 58 North America Cell Therapy Technologies Market by Region, 2024, 2029 & 2034 (US$ Million)
Figure 59 North America Cell Therapy Technologies Market Forecast by Country, 2024-2034 (US$ million)
Figure 60 North America Cell Therapy Technologies Market Share Forecast by Country, 2024 & 2034 (%)
Figure 61 North America Cell Therapy Technologies Market Forecast by Product, 2024-2034 (US$ Million, AGR %)
Figure 62 North America Cell Therapy Technologies Market Share Forecast by Product, 2024 & 2034 (%)
Figure 63 North America Cell Therapy Technologies Market Forecast by Cell Type, 2024-2034 (US$ Million, AGR %)
Figure 64 North America Cell Therapy Technologies Market Share Forecast by Cell Type, 2024 & 2034 (%)
Figure 65 North America Cell Therapy Technologies Market Forecast by Process, 2024-2034 (US$ Million, AGR %)
Figure 66 North America Cell Therapy Technologies Market Share Forecast by Process, 2024 & 2034 (%)
Figure 67 North America Cell Therapy Technologies Market Forecast by End-users, 2024-2034 (US$ Million, AGR %)
Figure 68 North America Cell Therapy Technologies Market Share Forecast by End-users, 2024 & 2034 (%)
Figure 69 U.S. Cell Therapy Technologies Market Forecast, 2024-2034 (US$ Million, AGR %)
Figure 70 Canada Cell Therapy Technologies Market Forecast, 2024-2034 (US$ Million, AGR %)
Figure 71 Europe Cell Therapy Technologies Market Attractiveness Index
Figure 72 Europe Cell Therapy Technologies Market by Region, 2024, 2029 & 2034 (US$ Million)
Figure 73 Europe Cell Therapy Technologies Market Forecast by Country, 2024-2034 (US$ million)
Figure 74 Europe Cell Therapy Technologies Market Share Forecast by Country, 2024 & 2034 (%)
Figure 75 Europe Cell Therapy Technologies Market Forecast by Product, 2024-2034 (US$ Million, AGR %)
Figure 76 Europe Cell Therapy Technologies Market Share Forecast by Product, 2024 & 2034 (%)
Figure 77 Europe Cell Therapy Technologies Market Forecast by Cell Type, 2024-2034 (US$ Million, AGR %)
Figure 78 Europe Cell Therapy Technologies Market Share Forecast by Cell Type, 2024 & 2034 (%)
Figure 79 Europe Cell Therapy Technologies Market Forecast by Process, 2024-2034 (US$ Million, AGR %)
Figure 80 Europe Cell Therapy Technologies Market Share Forecast by Process, 2024 & 2034 (%)
Figure 81 Europe Cell Therapy Technologies Market Forecast by End-users, 2024-2034 (US$ Million, AGR %)
Figure 82 Europe Cell Therapy Technologies Market Share Forecast by End-users, 2024 & 2034 (%)
Figure 83 Germany Cell Therapy Technologies Market Forecast, 2024-2034 (US$ Million, AGR %)
Figure 84 UK Cell Therapy Technologies Market Forecast, 2024-2034 (US$ Million, AGR %)
Figure 85 France Cell Therapy Technologies Market Forecast, 2024-2034 (US$ Million, AGR %)
Figure 86 Italy Cell Therapy Technologies Market Forecast, 2024-2034 (US$ Million, AGR %)
Figure 87 Spain Cell Therapy Technologies Market Forecast, 2024-2034 (US$ Million, AGR %)
Figure 88 Russia Cell Therapy Technologies Market Forecast, 2024-2034 (US$ Million, AGR %)
Figure 89 Rest of Europe Cell Therapy Technologies Market Forecast, 2024-2034 (US$ Million, AGR %)
Figure 90 Asia Pacific Cell Therapy Technologies Market Attractiveness Index
Figure 91 Asia Pacific Cell Therapy Technologies Market by Region, 2024, 2029 & 2034 (US$ Million)
Figure 92 Asia Pacific Cell Therapy Technologies Market Forecast by Country, 2024-2034 (US$ million)
Figure 93 Asia Pacific Cell Therapy Technologies Market Share Forecast by Country, 2024 & 2034 (%)
Figure 94 Asia Pacific Cell Therapy Technologies Market Forecast by Product, 2024-2034 (US$ Million, AGR %)
Figure 95 Asia Pacific Cell Therapy Technologies Market Share Forecast by Product, 2024 & 2034 (%)
Figure 96 Asia Pacific Cell Therapy Technologies Market Forecast by Cell Type, 2024-2034 (US$ Million, AGR %)
Figure 97 Asia Pacific Cell Therapy Technologies Market Share Forecast by Cell Type, 2024 & 2034 (%)
Figure 98 Asia Pacific Cell Therapy Technologies Market Forecast by Process, 2024-2034 (US$ Million, AGR %)
Figure 99 Asia Pacific Cell Therapy Technologies Market Share Forecast by Process, 2024 & 2034 (%)
Figure 100 Asia Pacific Cell Therapy Technologies Market Forecast by End-users, 2024-2034 (US$ Million, AGR %)
Figure 101 Asia Pacific Cell Therapy Technologies Market Share Forecast by End-users, 2024 & 2034 (%)
Figure 102 Japan Cell Therapy Technologies Market Forecast, 2024-2034 (US$ Million, AGR %)
Figure 103 China Cell Therapy Technologies Market Forecast, 2024-2034 (US$ Million, AGR %)
Figure 104 India Cell Therapy Technologies Market Forecast, 2024-2034 (US$ Million, AGR %)
Figure 105 Australia Cell Therapy Technologies Market Forecast, 2024-2034 (US$ Million, AGR %)
Figure 106 South Korea Cell Therapy Technologies Market Forecast, 2024-2034 (US$ Million, AGR %)
Figure 107 South-East Asia Cell Therapy Technologies Market Forecast, 2024-2034 (US$ Million, AGR %)
Figure 108 Rest of Asia Pacific Cell Therapy Technologies Market Forecast, 2024-2034 (US$ Million, AGR %)
Figure 109 Latin America Cell Therapy Technologies Market Attractiveness Index
Figure 110 Latin America Cell Therapy Technologies Market by Region, 2024, 2029 & 2034 (US$ Million)
Figure 111 Latin America Cell Therapy Technologies Market Forecast by Country, 2024-2034 (US$ million)
Figure 112 Latin America Cell Therapy Technologies Market Share Forecast by Country, 2024 & 2034 (%)
Figure 113 Latin America Cell Therapy Technologies Market Forecast by Product, 2024-2034 (US$ Million, AGR %)
Figure 114 Latin America Cell Therapy Technologies Market Share Forecast by Product, 2024 & 2034 (%)
Figure 115 Latin America Cell Therapy Technologies Market Forecast by Cell Type, 2024-2034 (US$ Million, AGR %)
Figure 116 Latin America Cell Therapy Technologies Market Share Forecast by Cell Type, 2024 & 2034 (%)
Figure 117 Latin America Cell Therapy Technologies Market Forecast by Process, 2024-2034 (US$ Million, AGR %)
Figure 118 Latin America Cell Therapy Technologies Market Share Forecast by Process, 2024 & 2034 (%)
Figure 119 Latin America Cell Therapy Technologies Market Forecast by End-users, 2024-2034 (US$ Million, AGR %)
Figure 120 Latin America Cell Therapy Technologies Market Share Forecast by End-users, 2024 & 2034 (%)
Figure 121 Brazil Cell Therapy Technologies Market Forecast, 2024-2034 (US$ Million, AGR %)
Figure 122 Mexico Cell Therapy Technologies Market Forecast, 2024-2034 (US$ Million, AGR %)
Figure 123 Rest of Latin America Cell Therapy Technologies Market Forecast, 2024-2034 (US$ Million, AGR %)
Figure 124 MEA Cell Therapy Technologies Market Attractiveness Index
Figure 125 MEA Cell Therapy Technologies Market by Region, 2024, 2029 & 2034 (US$ Million)
Figure 126 MEA Cell Therapy Technologies Market Forecast by Country, 2024-2034 (US$ million)
Figure 127 MEA Cell Therapy Technologies Market Share Forecast by Country, 2024 & 2034 (%)
Figure 128 MEA Cell Therapy Technologies Market Forecast by Product, 2024-2034 (US$ Million, AGR %)
Figure 129 MEA Cell Therapy Technologies Market Share Forecast by Product, 2024 & 2034 (%)
Figure 130 MEA Cell Therapy Technologies Market Forecast by Cell Type, 2024-2034 (US$ Million, AGR %)
Figure 131 MEA Cell Therapy Technologies Market Share Forecast by Cell Type, 2024 & 2034 (%)
Figure 132 MEA Cell Therapy Technologies Market Forecast by Process, 2024-2034 (US$ Million, AGR %)
Figure 133 MEA Cell Therapy Technologies Market Share Forecast by Process, 2024 & 2034 (%)
Figure 134 MEA Cell Therapy Technologies Market Forecast by End-users, 2024-2034 (US$ Million, AGR %)
Figure 135 MEA Cell Therapy Technologies Market Share Forecast by End-users, 2024 & 2034 (%)
Figure 136 GCC Cell Therapy Technologies Market Forecast, 2024-2034 (US$ Million, AGR %)
Figure 137 South Africa Cell Therapy Technologies Market Forecast, 2024-2034 (US$ Million, AGR %)
Figure 138 Rest of MEA Cell Therapy Technologies Market Forecast, 2024-2034 (US$ Million, AGR %)
Figure 139 Thermo Fisher Scientific Inc.: Net Revenue, 2018-2023 (US$ Million, AGR%)
Figure 140 Thermo Fisher Scientific Inc.: Regional Market Shares (%), 2022
Figure 141 Thermo Fisher Scientific Inc.: R&D, 2018-2023 (US$ Million, AGR%)
Figure 142 Novartis AG: Net Revenue, 2018-2023 (US$ Million, AGR%)
Figure 143 Novartis AG: Regional Market Shares (%), 2022
Figure 144 Novartis AG: R&D, 2018-2023 (US$ Million, AGR%)
Figure 145 Gilead Sciences, Inc.: Net Revenue, 2018-2023 (US$ Million, AGR%)
Figure 146 Gilead Sciences, Inc.: R&D, 2018-2023 (US$ Million, AGR%)
Figure 147 Merck KGaA: Net Revenue, 2018-2023 (US$ Million, AGR%)
Figure 148 Merck KGaA: Regional Market Shares (%), 2023
Figure 149 Merck KGaA: R&D, 2018-2023 (US$ Million, AGR%)
Figure 150 Danaher Corporation: Net Revenue, 2018-2023 (US$ Million, AGR%)
Figure 151 Danaher Corporation: Regional Market Shares (%), 2023
Figure 152 Danaher Corporation: R&D, 2018-2023 (US$ Million, AGR%)
Figure 153 Bristol-Myers Squibb Company: Net Revenue, 2018-2023 (US$ Million, AGR%)
Figure 154 Bristol-Myers Squibb Company: Regional Market Shares (%), 2023
Figure 155 Bristol-Myers Squibb Company: R&D, 2018-2023 (US$ Million, AGR%)
Figure 156 Sartorius AG: Net Revenue, 2018-2023 (US$ Million, AGR%)
Figure 157 Sartorius AG: Regional Market Shares (%), 2023
Figure 158 Sartorius AG: R&D, 2018-2023 (US$ Million, AGR%)
Figure 159 Lonza: Net Revenue, 2018-2023 (US$ Million, AGR%)
Figure 160 Lonza: Regional Market Shares (%), 2023
Figure 161 Lonza: R&D, 2018-2022 (US$ Million, AGR%)
Figure 162 GE Healthcare: Net Revenue, 2018-2023 (US$ Million, AGR%)
Figure 163 GE Healthcare: Regional Market Shares (%), 2022
Figure 164 GE Healthcare: R&D, 2018-2023 (US$ Million, AGR%)
Figure 165 Terumo BCT: Net Revenue, 2018-2023 (US$ Million, AGR%)
Figure 166 Terumo BCT: Regional Market Shares (%), 2022
Figure 167 Avantor, Inc.: Net Revenue, 2018-2023 (US$ Million, AGR%)
Figure 168 Avantor, Inc.: Regional Market Shares (%), 2023
Figure 169 Bio-Techne Corporation: Net Revenue, 2018-2023 (US$ Million, AGR%)
Figure 170 Bio-Techne Corporation: R&D, 2018-2023 (US$ Million, AGR%)
Figure 171 Corning Incorporated: Net Revenue, 2018-2023 (US$ Million, AGR%)
Figure 172 Corning Incorporated: Regional Market Shares (%), 2023
Figure 173 Corning Incorporated: R&D, 2018-2023 (US$ Million, AGR%)
ページTOPに戻る
本レポートと同分野(医療/ヘルスケア)の最新刊レポート
Visiongain社のヘルスケアと医薬・化学品分野での最新刊レポート
本レポートと同じKEY WORD(cell therapy)の最新刊レポート
よくあるご質問
Visiongain社はどのような調査会社ですか?
英国の調査会社ヴィジョンゲイン社(Visiongain)は、通信とエネルギーのほか、自動車や化学・医薬品、金属など、広範な市場を対象に調査を行っています。自動車市場については、市場全般に関する調査のほ... もっと見る
調査レポートの納品までの日数はどの程度ですか?
在庫のあるものは速納となりますが、平均的には 3-4日と見て下さい。
但し、一部の調査レポートでは、発注を受けた段階で内容更新をして納品をする場合もあります。
発注をする前のお問合せをお願いします。
注文の手続きはどのようになっていますか?
1)お客様からの御問い合わせをいただきます。
2)見積書やサンプルの提示をいたします。
3)お客様指定、もしくは弊社の発注書をメール添付にて発送してください。
4)データリソース社からレポート発行元の調査会社へ納品手配します。
5) 調査会社からお客様へ納品されます。最近は、pdfにてのメール納品が大半です。
お支払方法の方法はどのようになっていますか?
納品と同時にデータリソース社よりお客様へ請求書(必要に応じて納品書も)を発送いたします。
お客様よりデータリソース社へ(通常は円払い)の御振り込みをお願いします。
請求書は、納品日の日付で発行しますので、翌月最終営業日までの当社指定口座への振込みをお願いします。振込み手数料は御社負担にてお願いします。
お客様の御支払い条件が60日以上の場合は御相談ください。
尚、初めてのお取引先や個人の場合、前払いをお願いすることもあります。ご了承のほど、お願いします。
データリソース社はどのような会社ですか?
当社は、世界各国の主要調査会社・レポート出版社と提携し、世界各国の市場調査レポートや技術動向レポートなどを日本国内の企業・公官庁及び教育研究機関に提供しております。
世界各国の「市場・技術・法規制などの」実情を調査・収集される時には、データリソース社にご相談ください。
お客様の御要望にあったデータや情報を抽出する為のレポート紹介や調査のアドバイスも致します。
|
|

