オフショア支援船市場レポート:2024-2034
Offshore Support Vessel Market Report 2024-2034
レポート詳細
オフショア支援船市場レポート 2024-2034年 :本レポートは、業界とその基礎となる原動力をより良く理解したい場合、新たな収益ポケットを目指す大手企業にとって貴重なものとなるでし... もっと見る
※上記価格は部署ライセンス(Departmental licence)価格です。
その他の価格についてはデータリソースまでお問合せください。
日本語のページは自動翻訳を利用し作成しています。
実際のレポートは英文のみでご納品いたします。
サマリー
レポート詳細
オフショア支援船市場レポート 2024-2034年:本レポートは、業界とその基礎となる原動力をより良く理解したい場合、新たな収益ポケットを目指す大手企業にとって貴重なものとなるでしょう。異業種への進出や新規地域での既存事業の拡大を目指す企業にも有用です。
オフショア支援船(OSV)市場は、様々な要因が重なり大幅な成長の見込み
オフショア支援船(OSV)市場は、オフショア探査・生産活動の増加、エネルギー資源に対する需要の高まり、オフショア技術の進歩など、様々な要因の組み合わせにより、大幅な成長を遂げようとしている。特に中東、東南アジア、中南米のような地域におけるオフショア石油・ガス産業の拡大などの主な要因は、OSVの世界的な需要を促進している。さらに、地震調査から建設支援やメンテナンスに至るまで、さまざまなオフショア作業に対応するOSVの汎用性と多機能性が、市場の成長をさらに促進している。
このような成長軌道の中で、OSV市場は業界プレーヤーに有利な機会を提供している。新興市場への地理的拡大は大きな成長の可能性を秘めており、アフリカや南米などの地域では未開発の海洋埋蔵量がOSV展開の新たな道を示している。さらに、ダイナミック・ポジショニング・システムや遠隔操作車両などの先進技術の採用は、作業効率と安全性を高め、最新のOSVフリートの需要を促進している。さらに、地域企業との戦略的提携や新技術への投資により、企業は市場での存在感を強め、新たな機会を活用することができる。
しかし、OSV市場に課題がないわけではない。原油価格の変動とオフショア・プロジェクトの周期的な性質は、市場の安定性にリスクをもたらし、船舶の稼働率と収益性に影響を与える。さらに、環境規制や安全基準を含む厳しい規制の枠組みやコンプライアンス要件は、オペレーションに複雑さをもたらし、OSVオペレーターのオペレーションコストを増加させる。さらに、OSV船隊の老朽化、船舶の近代化・改造の必要性は、進化する業界の需要に応え、競争力を維持する上での課題となっている。
オフショア支援船就航のための莫大な資金がOSV市場を妨げる
オフショア支援船(OSV)市場は、これらの船の進水に必要な多額の資本という形で大きな障害に直面している。OSVの建造、艤装、配備にはかなりの財源が必要であり、この分野で事業を展開する企業に課題を突きつけている。石油・ガス探査、洋上風力発電、海洋調査など、さまざまなオフショア事業に不可欠なOSVの建造と試運転に必要な先行投資は、気の遠くなるようなものだ。加えて、乗組員の給与、メンテナンス費用、燃料費、規制遵守を含む継続的な運用経費が、さらに財政負担の一因となっている。この高い資本要件は、潜在的な投資家や市場参入者にとって抑止力として機能し、OSV市場の成長と拡大を制限する。さらに、世界的な経済情勢の変動やエネルギー部門の不確実性は、こうした財務上の課題を悪化させ、企業が新しいOSVプロジェクトへの投資を正当化することをさらに困難にしている。その結果、莫大な資本要件の問題に対処することは、OSV市場の潜在能力を最大限に引き出し、将来の持続可能な成長を促進する上で極めて重要である。
市場調査レポートを購入する前にすべき質問とは?
-
オフショア支援船市場はどのように進化しているのか?
-
オフショア支援船市場の推進要因と阻害要因は何か?
-
オフショア支援船の各サブマーケットセグメントは予測期間中にどのように成長し、2034年にはどれくらいの収益を占めるようになるのか?
-
2024年から2034年にかけて、オフショア支援船の各サブマーケットの市場シェアはどのように推移するのか?
-
2024年から2034年にかけて、市場全体を牽引する主な要因は何か?
-
主要なオフショア支援船市場は、マクロ経済の動きに幅広く追随するのか、それとも個々の国の市場が他を凌駕するのか。
-
2034年までに各国市場のシェアはどのように変化し、どの地域が2034年の市場をリードするのか。
-
主要プレーヤーと予測期間中の見通しは?
-
これらの大手企業のオフショア支援船プロジェクトとは?
-
2024年から2034年の間に、業界はどのように発展していくのか?現在、そして今後10年間に実施されるオフショア支援船プロジェクトにはどのような影響があるのか?
-
オフショア支援船市場をさらに拡大するために、製品化の必要性は高いのか?
-
オフショア支援船市場はどこに向かい、どのようにすれば市場の最前線に立てるのか?
-
新商品や新サービスに最適な投資方法とは?
-
企業を新たな成長軌道に乗せ、C-suiteに移行させるための重要な展望とは?
このことが、現在、そして今後10年間のオフショア支援船市場にどのような影響を与えるかを見極める必要がある:
-
408ページに及ぶレポートには、128の表と191の図表が掲載されている。
-
本レポートでは、業界における主要な有利分野を取り上げているため、今すぐターゲットを絞ることができる。
-
世界、地域、国の売上高と成長に関する詳細な分析が含まれている。
-
競合他社が成功した主なトレンド、変化、収益予測をハイライトします。
本レポートは、オフショア支援船市場が今後10年間にどのように発展していくのか、またCOVID-19の景気後退と好転の変動に合わせてどのように発展していくのかをTODAYでお伝えするものです。この市場は、過去10年間のどの時点よりも今が重要である。
2034年までの予測やその他の分析から、商業的な展望が明らかになる
-
2034年までの収益予測に加え、最近の実績、成長率、市場シェアも提供している。
-
ビジネスの展望や展開など、独自の分析が掲載されている。
-
定性的分析(市場ダイナミクス、促進要因、機会、阻害要因、課題を含む)、コスト構造、オフショア支援船価格上昇の影響、最近の動向をご覧いただけます。
本レポートには、COVID-19が業界と貴社にどのような影響を与えるかについてのデータ分析と貴重な洞察が含まれている。本レポートでは、COVID-19の4つの回復パターンとその影響、すなわち「V」、「L」、「W」、「U」について論じている。
レポート対象セグメント
用途別市場セグメント
素材別市場セグメント
船舶サイズ別市場セグメント
エンドユーズ別市場セグメント
-
石油・ガス
-
洋上風力
-
洋上パトロール
-
調査と測量
-
その他のエンドユーズ別
タイプ別市場セグメント
-
アンカーハンドリングタグ補給船
-
プラットフォーム支援船
-
多目的支援船
-
待機船と救助船
-
乗組員船舶
-
その他のタイプ
世界市場全体とセグメント別の収益予測に加え、4つの地域と20の主要国市場の収益予測も掲載しています:
北米
欧州
-
ノルウェー
-
英国
-
フランス
-
デンマーク
-
ロシア
-
その他の欧州
アジア太平洋
-
中国
-
インド
-
インドネシア
-
マレーシア
-
オーストラリア
-
その他のアジア太平洋
ラテンアメリカ
中東・アフリカ
また、2024年から2034年までのオフショア支援船市場における主要企業のプロファイルも掲載している。
報告書に掲載されている主要企業
-
A.P. Møller – Mærsk A/S
-
Bourbon
-
DOF Group ASA
-
Edison Chouest Offshore
-
Grupo CBO
-
Harvey Gulf International Marine
-
Havila Shipping ASA
-
Kawasaki Kisen Kaisha Ltd
-
MMA Offshore Ltd
-
Østensjø Rederi
-
Seacor Marine Holdings Inc
-
Siem Offshore
-
Solstad Offshore ASA
-
Tidewater Inc.
-
Vroon
2024年から2034年までのオフショア支援船市場全体の世界売上高(金額ベース)は、2024年に244億米ドルを突破する。2034年まで力強い収益成長を予測。当調査では、最も大きな可能性を秘めた企業を特定しています。彼らの能力、進歩、商業的展望を発見し、あなたが一歩先を行くのを支援します。
2024年から2034年までのオフショア支援船市場」レポートはどのようにお役に立ちますか?
要約すると、400ページを超えるこのレポートは、以下の知識を提供する:
-
オフショア支援船市場の2024年から2034年までの収益予測 用途、素材、船舶サイズ、最終用途、タイプ別に世界と地域レベルで予測 - 業界の将来性を発見し、投資と収益に最も有利な場所を見つけることができます。
-
4つの地域と20の主要国市場の2034年までの収益予測 - 北米、欧州、アジア太平洋、中南米、中東・アフリカのオフショア支援船市場2024年から2034年までの市場予測をご覧ください。また、米国、カナダ、ブラジル、ドイツ、フランス、英国、イタリア、中国、インド、日本、オーストラリアなどの著名経済圏の市場も予測しています。
-
2024年から2034年までのオフショア支援船市場に関与する主要企業15社の企業プロファイルを含む。
独自の予測による定量的・定性的分析をご覧ください。私たちのレポートだけに含まれる情報を入手し、貴重なビジネスインテリジェンスで情報を得ることができます。
他にはない情報
私たちの新しいレポートがあれば、知識に遅れをとったり、チャンスを逃したりする可能性が低くなります。弊社のレポートが貴社の調査、分析、意思決定にどのように役立つかをご覧ください。Visiongainの調査は、オフショア支援船市場、2024年から2034年、市場をリードする企業の商業分析を必要とするすべての人のためのものです。データ、トレンド、予測をご覧いただけます。
ページTOPに戻る
目次
1 レポート概要
1.1 調査の目的
1.2 オフショア支援船市場の紹介
1.3 本レポートの内容
1.4 本レポートを読むべき理由
1.5 本分析レポートが回答する主な質問
1.6 本レポートは誰のためのものか?
1.7 調査方法
1.7.1 市場の定義
1.7.2 市場評価・予測手法
1.7.3 データ検証
1.7.3.1 一次調査
1.7.3.2 セカンダリーリサーチ
1.8 よくある質問(FAQ)
1.9 Visiongainの関連レポート
1.10 Visiongainについて
2 エグゼクティブ・サマリー
3 市場概要
3.1 主要な調査結果
3.2 市場ダイナミクス
3.2.1 市場牽引要因
3.2.1.1 OSV市場を牽引する洋上風力・石油ガスプロジェクト投資の増加
3.2.1.2 超深海探査活動の増加がOSV市場を牽引
3.2.1.3 OSV市場を強化する、より持続可能なエネルギーインフラ設置への対策の高まり
3.2.2 市場の抑制要因
3.2.2.1 オフショア支援船就航のための莫大な資金がOSV市場の妨げに
3.2.2.2 オフショア支援船の需給ギャップがOSV市場を妨げる
3.2.2.3 オフショア活動に対する厳しい規制がOSV市場を妨げる
3.2.3 市場機会
3.2.3.1 OSV市場にとってのオフショア廃止措置の機会
3.2.3.2 他の業界ステークホルダーとのコラボレーションとパートナーシップの機会
3.2.3.3 船舶運航におけるデジタル技術と自動化の採用
3.3 ポーターのファイブフォース分析
3.3.1 サプライヤーの交渉力(中程度)
3.3.2 買い手の交渉力(高)
3.3.3 競争力(中~高)
3.3.4 代替品による脅威(低)
3.3.5 新規参入の脅威(高)
3.4 COVID-19の影響分析
3.4.1 "V字型回復"
3.4.2 "U字型回復"
3.4.3 "W字型回復"
3.4.4 "L字型回復"
3.5 PEST分析
4 オフショア支援船市場分析:用途別
4.1 主要な調査結果
4.2 アプリケーションセグメント 市場魅力度指数
4.3 用途別オフショア支援船市場規模の推定と予測
4.4 深海セグメント
4.4.1 2024〜2034年の地域別市場規模(US$ Billion)
4.4.2 地域別市場シェア、2024年・2034年(%)
4.5 浅海セグメント
4.5.1 2024〜2034年の地域別市場規模(US$ Billion)
4.5.2 地域別市場シェア、2024年・2034年(%)
5 オフショア支援船市場分析:素材別
5.1 主要調査結果
5.2 素材セグメント 市場魅力度指数
5.3 海洋支援船の素材別市場規模推定と予測
5.4 鋼材セグメント
5.4.1 2024〜2034年の地域別市場規模(US$ Billion)
5.4.2 地域別市場シェア、2024年・2034年(%)
5.5 アルミニウムセグメント
5.5.1 2024〜2034年の地域別市場規模(US$ Billion)
5.5.2 地域別市場シェア、2024年・2034年(%)
5.6 複合材料セグメント
5.6.1 2024〜2034年の地域別市場規模(US$ Billion)
5.6.2 地域別市場シェア、2024年・2034年(%)
6 オフショア支援船市場分析:船舶サイズ別
6.1 主要な調査結果
6.2 船舶サイズセグメント 市場魅力度指数
6.3 船舶規模別オフショア支援船市場規模の推定と予測
6.4 小型船セグメント
6.4.1 2024〜2034年の地域別市場規模(US$ Billion)
6.4.2 地域別市場シェア、2024年・2034年(%)
6.5 中型船セグメント
6.5.1 2024~2034年の地域別市場規模(US$ Billion)
6.5.2 地域別市場シェア、2024年・2034年(%)
6.6 大型船舶
6.6.1 2024~2034年の地域別市場規模(US$ Billion)
6.6.2 地域別市場シェア、2024年・2034年(%)
6.7 超大型船セグメント
6.7.1 2024~2034年の地域別市場規模(US$ Billion)
6.7.2 地域別市場シェア、2024年・2034年(%)
7 オフショア支援船市場分析:エンドユーズ別
7.1 主要調査結果
7.2 エンドユーズ別セグメント 市場魅力度指数
7.3 オフショア支援船のエンドユーズ別市場規模推定と予測
7.4 石油・ガス
7.4.1 2024〜2034年の地域別市場規模(US$ Billion)
7.4.2 地域別市場シェア、2024年・2034年(%)
7.5 洋上風力セグメント
7.5.1 2024年~2034年の地域別市場規模(US$ Billion)
7.5.2 地域別市場シェア、2024年・2034年(%)
7.6 洋上パトロールセグメント
7.6.1 2024~2034年の地域別市場規模(US$ Billion)
7.6.2 地域別市場シェア、2024年・2034年(%)
7.7 調査・測量セグメント
7.7.1 2024〜2034年の地域別市場規模(US$ Billion)
7.7.2 地域別市場シェア、2024年・2034年(%)
7.8 その他の最終用途
7.8.1 2024〜2034年の地域別市場規模(US$ Billion)
7.8.2 地域別市場シェア、2024年・2034年(%)
8 オフショア支援船市場分析:タイプ別
8.1 主要な調査結果
8.2 タイプ別セグメント 市場魅力度指数
8.3 オフショア支援船のタイプ別市場規模推定と予測
8.4 アンカーハンドリングタグ補給船
8.4.1 2024~2034年の地域別市場規模(US$ Million)
8.4.2 地域別市場シェア、2024年・2034年 (%)
8.5 プラットフォーム支援船
8.5.1 2024~2034年の地域別市場規模(US$ Million)
8.5.2 地域別市場シェア、2024年・2034年 (%)
8.6 多目的支援船セグメント
8.6.1 2024~2034年の地域別市場規模(US$ Million)
8.6.2 地域別市場シェア、2024年・2034年 (%)
8.7 スタンバイ・救助船セグメント
8.7.1 2024~2034年の地域別市場規模(US$ Million)
8.7.2 地域別市場シェア、2024年・2034年 (%)
8.8 乗組員船セグメント
8.8.1 2024~2034年の地域別市場規模(US$ Million)
8.8.2 地域別市場シェア、2024年・2034年 (%)
8.9 その他のタイプ
8.9.1 2024年~2034年の地域別市場規模(US$ Million)
8.9.2 地域別市場シェア、2024年・2034年 (%)
9 オフショア支援船市場分析:地域別
9.1 主要な調査結果
9.2 地域別市場規模の推定と予測
10 北米のオフショア支援船市場分析
10.1 主要な調査結果
10.2 北米のオフショア支援船市場魅力度指数
10.3 北米のオフショア支援船国別市場:2024年、2029年、2034年(US$ Billion)
10.4 北米のオフショア支援船市場規模推定と予測
10.5 北米のオフショア支援船市場規模推定と予測:国別
10.6 北米のオフショア支援船市場規模推定と予測:用途別
10.7 北米のオフショア支援船市場規模推定と予測:素材別
10.8 北米のオフショア支援船市場規模推定と予測:船舶サイズ別
10.9 北米のオフショア支援船市場規模推定と予測:エンドユーズ別別
10.10 北米のオフショア支援船市場規模推定と予測:タイプ別
10.11 米国のオフショア支援船市場分析
10.12 カナダのオフショア支援船市場分析
11 欧州のオフショア支援船市場分析
11.1 主要な調査結果
11.2 欧州オフショア支援船市場魅力度指数
11.3 欧州のオフショア支援船国別市場、2024年、2029年、2034年(US$ Billion)
11.4 欧州のオフショア支援船市場規模推定と予測
11.5 欧州のオフショア支援船市場規模推定と予測:国別
11.6 欧州のオフショア支援船市場規模推定と予測:用途別
11.7 欧州のオフショア支援船市場規模推定と予測:素材別
11.8 欧州のオフショア支援船市場規模推定と予測:船舶サイズ別
11.9 欧州のオフショア支援船市場規模推定と予測:エンドユーズ別別
11.10 欧州のオフショア支援船市場規模推定と予測:タイプ別
11.11 ノルウェーのオフショア支援船市場分析
11.12 イギリスのオフショア支援船市場分析
11.13 フランスのオフショア支援船市場分析
11.14 デンマークのオフショア支援船市場分析
11.15 ロシアのオフショア支援船市場分析
11.16 その他の欧州のオフショア支援船市場分析
12 アジア太平洋地域のオフショア支援船市場分析
12.1 主要な調査結果
12.2 アジア太平洋地域のオフショア支援船市場魅力度指数
12.3 アジア太平洋地域のオフショア支援船国別市場、2024年、2029年、2034年(US$ Billion)
12.4 アジア太平洋地域のオフショア支援船市場規模の推定と予測
12.5 アジア太平洋地域のオフショア支援船市場規模推定と予測:国別
12.6 アジア太平洋地域のオフショア支援船市場規模推定と予測:用途別
12.7 アジア太平洋地域のオフショア支援船市場規模推定と予測:素材別
12.8 アジア太平洋地域のオフショア支援船市場規模推定と予測:船舶サイズ別
12.9 アジア太平洋地域のオフショア支援船市場規模推定と予測:エンドユーズ別別
12.10 アジア太平洋地域のオフショア支援船市場規模推定と予測:タイプ別
12.11 中国のオフショア支援船市場分析
12.12 インドのオフショア支援船市場分析
12.13 インドネシアのオフショア支援船市場分析
12.14 マレーシアのオフショア支援船市場分析
12.15 オーストラリアのオフショア支援船市場分析
12.16 その他のアジア太平洋地域のオフショア支援船市場分析
13 中東・アフリカのオフショア支援船市場分析
13.1 主要な調査結果
13.2 中東・アフリカのオフショア支援船市場魅力度指数
13.3 中東・アフリカのオフショア支援船国別市場、2024年、2029年、2034年(US$ Billion)
13.4 中東・アフリカのオフショア支援船市場規模推定と予測
13.5 中東・アフリカのオフショア支援船市場規模推定と予測:国別
13.6 中東・アフリカのオフショア支援船市場規模推定と予測:用途別
13.7 中東・アフリカのオフショア支援船市場規模推定と予測:素材別
13.8 中東・アフリカのオフショア支援船市場規模推定と予測:船舶サイズ別
13.9 中東・アフリカのオフショア支援船市場規模推定と予測:エンドユーズ別
13.10 中東・アフリカのオフショア支援船市場規模推定と予測:タイプ別
13.11 GCCのオフショア支援船市場分析
13.12 南アフリカのオフショア支援船市場分析
13.13 その他の中東・アフリカ地域のオフショア支援船市場分析
14 ラテンアメリカのオフショア支援船市場分析
14.1 主要な調査結果
14.2 ラテンアメリカのオフショア支援船市場魅力度指数
14.3 ラテンアメリカのオフショア支援船国別市場、2024年、2029年、2034年(US$ Billion)
14.4 ラテンアメリカのオフショア支援船市場規模推定と予測
14.5 ラテンアメリカのオフショア支援船市場規模推定と予測:国別
14.6 ラテンアメリカのオフショア支援船市場規模推定と予測:用途別
14.7 ラテンアメリカのオフショア支援船市場規模推定と予測:素材別
14.8 ラテンアメリカのオフショア支援船市場規模推定と予測:船舶サイズ別
14.9 ラテンアメリカのオフショア支援船市場規模推定と予測:エンドユーズ別
14.10 ラテンアメリカのオフショア支援船市場規模推定と予測:タイプ別
14.11 ブラジルのオフショア支援船市場分析
14.12 メキシコのオフショア支援船市場分析
14.13 その他のラテンアメリカのオフショア支援船市場分析
15 会社概要
15.1 競争環境、2023年
15.2 戦略的展望
15.3 DOF Group ASA
15.3.1 会社概要
15.3.2 会社概要
15.3.3 財務分析
15.3.3.1 純収入、2018-2022年
15.3.3.2 事業セグメント収益シェア、2022年(%)
15.3.4 製品ベンチマーク
15.3.5 戦略的展望
15.4 Solstad Offshore ASA
15.4.1 会社概要
15.4.2 会社概要
15.4.3 財務分析
15.4.3.1 純収入、2018年~2022年
15.4.3.2 地域別収益シェア、2022年(%)
15.4.3.3 事業セグメント別売上シェア、2022年(%)
15.4.4 製品ベンチマーク
15.4.5 戦略的展望
15.5 Tidewater Inc.
15.5.1 会社概要
15.5.2 会社概要
15.5.3 財務分析
15.5.3.1 純収入、2018-2022年
15.5.3.2 地域別収益シェア、2022年(%)
15.5.4 製品ベンチマーク
15.5.5 戦略的展望
15.6 A.P. Møller – Mærsk A/S
15.6.1 会社概要
15.6.2 会社概要
15.6.3 財務分析
15.6.3.1 純収入、2018-2022年
15.6.3.2 地域別収益シェア、2022年(%)
15.6.3.3 事業セグメント別売上シェア、2022年(%)
15.6.4 製品ベンチマーク
15.6.5 戦略的展望
15.7 Siem Offshore
15.7.1 会社概要
15.7.2 会社概要
15.7.3 財務分析
15.7.3.1 純収入、2018-2022年
15.7.3.2 事業セグメント収益シェア、2022年(%)
15.7.4 製品ベンチマーク
15.7.5 戦略的展望
15.8 Bourbon
15.8.1 会社概要
15.8.2 会社概要
15.8.3 製品ベンチマーク
15.9 Vroon
15.9.1 会社概要
15.9.2 会社概要
15.9.3 製品ベンチマーク
15.9.4 戦略的展望
15.10 Seacor Marine Holdings Inc
15.10.1 会社概要
15.10.2 会社概要
15.10.3 財務分析
15.10.3.1 純収入、2018年~2022年
15.10.3.2 地域別収益シェア、2022年(%)
15.10.4 製品ベンチマーク
15.10.5 戦略的展望
15.11 Østensjø Rederi
15.11.1 会社概要
15.11.2 会社概要
15.11.3 製品ベンチマーク
15.11.4 戦略的展望
15.12 Havila Shipping ASA
15.12.1 会社概要
15.12.2 会社概要
15.12.3 財務分析
15.12.3.1 純収入、2018年~2022年
15.12.3.2 地域別収入シェア、2022年(%)
15.12.3.3 事業セグメント別売上シェア、2022年(%)
15.12.4 製品ベンチマーク
15.13 Kawasaki Kisen Kaisha Ltd
15.13.1 会社概要
15.13.2 会社概要
15.13.3 財務分析
15.13.3.1 純売上高、2018年~2022年
15.13.3.2 事業セグメント別売上高シェア、2022年(%)
15.13.4 製品ベンチマーク
15.14 MMA Offshore Ltd
15.14.1 会社概要
15.14.2 会社概要
15.14.3 財務分析
15.14.3.1 純収入、2018年〜2022年
15.14.3.2 地域別収入シェア、2022年(%)
15.14.3.3 事業セグメント別売上シェア、2022年(%)
15.14.4 製品ベンチマーク
15.14.5 戦略的展望
15.15 Grupo CBO
15.15.1 会社概要
15.15.2 会社概要
15.15.3 製品ベンチマーク
15.16 Harvey Gulf International Marine
15.16.1 会社概要
15.16.2 会社概要
15.16.3 製品ベンチマーク
15.16.4 戦略的展望
15.17 Edison Chouest Offshore
15.17.1 会社概要
15.17.2 会社概要
15.17.3 製品ベンチマーク
15.17.4 戦略的展望
16 結論と提言
16.1 Visiongainからの結びの言葉
16.2 市場プレイヤーへの提言
ページTOPに戻る
プレスリリース
表の一覧
Table 1 Offshore Support Vessel Market Snapshot, 2024 & 2034 (US$ Billion, CAGR %)
Table 2 Global Offshore Support Vessel Market by Region, 2024-2034 (US$ Bn, AGR (%), CAGR (%)) (V-Shaped Recovery Scenario)
Table 3 Global Offshore Support Vessel Market by Region, 2024-2034 (US$ Bn, AGR (%), CAGR (%)) (U-Shaped Recovery Scenario)
Table 4 Global Offshore Support Vessel Market by Region, 2024-2034 (US$ Bn, AGR (%), CAGR (%)) (W-Shaped Recovery Scenario)
Table 5 Global Offshore Support Vessel Market by Region, 2024-2034 (US$ Bn, AGR (%), CAGR (%)) (L-Shaped Recovery Scenario)
Table 6 Global Offshore Support Vessel Market by Application, 2024-2034 (US$ Bn, AGR (%), CAGR (%))
Table 7 Deepwater Market by Region, 2024-2034 (US$ Bn, AGR (%), CAGR (%))
Table 8 Shallow Water Market by Region, 2024-2034 (US$ Bn, AGR (%), CAGR (%))
Table 9 Global Offshore Support Vessel Market by Material, 2024-2034 (US$ Bn, AGR (%), CAGR (%))
Table 10 Steel Market by Region, 2024-2034 (US$ Bn, AGR (%), CAGR (%))
Table 11 Aluminium Market by Region, 2024-2034 (US$ Bn, AGR (%), CAGR (%))
Table 12 Composite Materials Market by Region, 2024-2034 (US$ Bn, AGR (%), CAGR (%))
Table 13 Global Offshore Support Vessel Market by Vessel Size, 2024-2034 (US$ Bn, AGR (%), CAGR (%))
Table 14 Small Vessels Market by Region, 2024-2034 (US$ Bn, AGR (%), CAGR (%))
Table 15 Medium Vessels Market by Region, 2024-2034 (US$ Bn, AGR (%), CAGR (%))
Table 16 Large Vessels Market by Region, 2024-2034 (US$ Bn, AGR (%), CAGR (%))
Table 17 Very Large Vessels Market by Region, 2024-2034 (US$ Bn, AGR (%), CAGR (%))
Table 18 Global Offshore Support Vessel Market by End-Use, 2024-2034 (US$ Bn, AGR (%), CAGR (%))
Table 19 Oil and Gas Market by Region, 2024-2034 (US$ Bn, AGR (%), CAGR (%))
Table 20 Offshore Wind Market by Region, 2024-2034 (US$ Bn, AGR (%), CAGR (%))
Table 21 Offshore Patrolling Market by Region, 2024-2034 (US$ Bn, AGR (%), CAGR (%))
Table 22 Research and Surveying Market by Region, 2024-2034 (US$ Bn, AGR (%), CAGR (%))
Table 23 Other End-Uses Market by Region, 2024-2034 (US$ Bn, AGR (%), CAGR (%))
Table 24 Global Offshore Support Vessel Market by Type, 2024-2034 (US$ Bn, AGR (%), CAGR (%))
Table 25 Anchor-handling Tug Supply Vessels Market by Region, 2024-2034 (US$ Bn, AGR (%), CAGR (%))
Table 26 Platform Support Vessels Market by Region, 2024-2034 (US$ Bn, AGR (%), CAGR (%))
Table 27 Multipurpose Support Vessels Market by Region, 2024-2034 (US$ Bn, AGR (%), CAGR (%))
Table 28 Standby and Rescue Vessels Market by Region, 2024-2034 (US$ Bn, AGR (%), CAGR (%))
Table 29 Crew Vessels Market by Region, 2024-2034 (US$ Bn, AGR (%), CAGR (%))
Table 30 Other Types Market by Region, 2024-2034 (US$ Bn, AGR (%), CAGR (%))
Table 31 Global Offshore Support Vessel Market by Region, 2024-2034 (US$ Bn, AGR (%), CAGR (%))
Table 32 North America Offshore Support Vessel Market by Value, 2024-2034 (US$ Bn, AGR (%), CAGR (%))
Table 33 North America Offshore Support Vessel Market by Country, 2024-2034 (US$ Bn, AGR (%), CAGR (%))
Table 34 North America Offshore Support Vessel Market by Application, 2024-2034 (US$ Bn, AGR (%), CAGR (%))
Table 35 North America Offshore Support Vessel Market by Material, 2024-2034 (US$ Bn, AGR (%), CAGR (%))
Table 36 North America Offshore Support Vessel Market by Vessel Size, 2024-2034 (US$ Bn, AGR (%), CAGR (%))
Table 37 North America Offshore Support Vessel Market by End-Use, 2024-2034 (US$ Bn, AGR (%), CAGR (%))
Table 38 North America Offshore Support Vessel Market by Type, 2024-2034 (US$ Bn, AGR (%), CAGR (%))
Table 39 US Offshore Support Vessel Market by Value, 2024-2034 (US$ Bn, AGR (%), CAGR (%))
Table 40 Canada Offshore Support Vessel Market by Value, 2024-2034 (US$ Bn, AGR (%), CAGR (%))
Table 41 Europe Offshore Support Vessel Market by Value, 2024-2034 (US$ Bn, AGR (%), CAGR (%))
Table 42 Europe Offshore Support Vessel Market by Country, 2024-2034 (US$ Bn, AGR (%), CAGR (%))
Table 43 Europe Offshore Support Vessel Market by Application, 2024-2034 (US$ Bn, AGR (%), CAGR (%))
Table 44 Europe Offshore Support Vessel Market by Material, 2024-2034 (US$ Bn, AGR (%), CAGR (%))
Table 45 Europe Offshore Support Vessel Market by Vessel Size, 2024-2034 (US$ Bn, AGR (%), CAGR (%))
Table 46 Europe Offshore Support Vessel Market by End-Use, 2024-2034 (US$ Bn, AGR (%), CAGR (%))
Table 47 Europe Offshore Support Vessel Market by Type, 2024-2034 (US$ Bn, AGR (%), CAGR (%))
Table 48 Norway Offshore Support Vessel Market by Value, 2024-2034 (US$ Bn, AGR (%), CAGR (%))
Table 49 UK Offshore Support Vessel Market by Value, 2024-2034 (US$ Bn, AGR (%), CAGR (%))
Table 50 France Offshore Support Vessel Market by Value, 2024-2034 (US$ Bn, AGR (%), CAGR (%))
Table 51 Denmark Offshore Support Vessel Market by Value, 2024-2034 (US$ Bn, AGR (%), CAGR (%))
Table 52 Russia Offshore Support Vessel Market by Value, 2024-2034 (US$ Bn, AGR (%), CAGR (%))
Table 53 Rest of Europe Offshore Support Vessel Market by Value, 2024-2034 (US$ Bn, AGR (%), CAGR (%))
Table 54 Asia-Pacific Offshore Support Vessel Market by Value, 2024-2034 (US$ Bn, AGR (%), CAGR (%))
Table 55 Asia-Pacific Offshore Support Vessel Market by Country, 2024-2034 (US$ Bn, AGR (%), CAGR (%))
Table 56 Asia-Pacific Offshore Support Vessel Market by Application, 2024-2034 (US$ Bn, AGR (%), CAGR (%))
Table 57 Asia-Pacific Offshore Support Vessel Market by Material, 2024-2034 (US$ Bn, AGR (%), CAGR (%))
Table 58 Asia-Pacific Offshore Support Vessel Market by Vessel Size, 2024-2034 (US$ Bn, AGR (%), CAGR (%))
Table 59 Asia-Pacific Offshore Support Vessel Market by End-Use, 2024-2034 (US$ Bn, AGR (%), CAGR (%))
Table 60 Asia-Pacific Offshore Support Vessel Market by Type, 2024-2034 (US$ Bn, AGR (%), CAGR (%))
Table 61 China Offshore Support Vessel Market by Value, 2024-2034 (US$ Bn, AGR (%), CAGR (%))
Table 62 India Offshore Support Vessel Market by Value, 2024-2034 (US$ Bn, AGR (%), CAGR (%))
Table 63 Indonesia Offshore Support Vessel Market by Value, 2024-2034 (US$ Bn, AGR (%), CAGR (%))
Table 64 Malaysia Offshore Support Vessel Market by Value, 2024-2034 (US$ Bn, AGR (%), CAGR (%))
Table 65 Australia Offshore Support Vessel Market by Value, 2024-2034 (US$ Bn, AGR (%), CAGR (%))
Table 66 Rest of Asia-Pacific Offshore Support Vessel Market by Value, 2024-2034 (US$ Bn, AGR (%), CAGR (%))
Table 67 Middle East & Africa Offshore Support Vessel Market by Value, 2024-2034 (US$ Bn, AGR (%), CAGR (%))
Table 68 Middle East & Africa Offshore Support Vessel Market by Country, 2024-2034 (US$ Bn, AGR (%), CAGR (%))
Table 69 Middle East & Africa Offshore Support Vessel Market by Application, 2024-2034 (US$ Bn, AGR (%), CAGR (%))
Table 70 Middle East & Africa Offshore Support Vessel Market by Material, 2024-2034 (US$ Bn, AGR (%), CAGR (%))
Table 71 Middle East & Africa Offshore Support Vessel Market by Vessel Size, 2024-2034 (US$ Bn, AGR (%), CAGR (%))
Table 72 Middle East & Africa Offshore Support Vessel Market by End-Use, 2024-2034 (US$ Bn, AGR (%), CAGR (%))
Table 73 Middle East & Africa Offshore Support Vessel Market by Type, 2024-2034 (US$ Bn, AGR (%), CAGR (%))
Table 74 GCC Offshore Support Vessel Market by Value, 2024-2034 (US$ Bn, AGR (%), CAGR (%))
Table 75 South Africa Offshore Support Vessel Market by Value, 2024-2034 (US$ Bn, AGR (%), CAGR (%))
Table 76 Rest of Middle East & Africa Offshore Support Vessel Market by Value, 2024-2034 (US$ Bn, AGR (%), CAGR (%))
Table 77 Latin America Offshore Support Vessel Market by Value, 2024-2034 (US$ Bn, AGR (%), CAGR (%))
Table 78 Latin America Offshore Support Vessel Market by Country, 2024-2034 (US$ Bn, AGR (%), CAGR (%))
Table 79 Latin America Offshore Support Vessel Market by Application, 2024-2034 (US$ Bn, AGR (%), CAGR (%))
Table 80 Latin America Offshore Support Vessel Market by Material, 2024-2034 (US$ Bn, AGR (%), CAGR (%))
Table 81 Latin America Offshore Support Vessel Market by Vessel Size, 2024-2034 (US$ Bn, AGR (%), CAGR (%))
Table 82 Latin America Offshore Support Vessel Market by End-Use, 2024-2034 (US$ Bn, AGR (%), CAGR (%))
Table 83 Latin America Offshore Support Vessel Market by Type, 2024-2034 (US$ Bn, AGR (%), CAGR (%))
Table 84 Brazil Offshore Support Vessel Market by Value, 2024-2034 (US$ Bn, AGR (%), CAGR (%))
Table 85 Mexico Offshore Support Vessel Market by Value, 2024-2034 (US$ Bn, AGR (%), CAGR (%))
Table 86 Rest of Latin America Offshore Support Vessel Market by Value, 2024-2034 (US$ Bn, AGR (%), CAGR (%))
Table 87 Strategic Outlook - Contract
Table 88 DOF Group ASA: Key Details, (CEO, HQ, Revenue, Founded, No. of Employees, Company Type, Website, Business Segment)
Table 89 DOF Group ASA: Product Benchmarking
Table 90 DOF Group ASA: Strategic Outlook
Table 91 Solstad Offshore ASA: Key Details, (CEO, HQ, Revenue, Founded, No. of Employees, Company Type, Website, Business Segment)
Table 92 Solstad Offshore ASA: Product Benchmarking
Table 93 Solstad Offshore ASA: Strategic Outlook
Table 94 Tidewater Inc.: Key Details, (CEO, HQ, Revenue, Founded, No. of Employees, Company Type, Website, Business Segment)
Table 95 Tidewater Inc.: Product Benchmarking
Table 96 Tidewater Inc.: Strategic Outlook
Table 97 A.P. Møller – Mærsk A/S: Key Details, (CEO, HQ, Revenue, Founded, No. of Employees, Company Type, Website, Business Segment)
Table 98 A.P. Møller – Mærsk A/S: Product Benchmarking
Table 99 A.P. Møller – Mærsk A/S: Strategic Outlook
Table 100 Siem Offshore: Key Details, (CEO, HQ, Revenue, Founded, No. of Employees, Company Type, Website, Business Segment)
Table 101 Siem Offshore: Product Benchmarking
Table 102 Siem Offshore: Strategic Outlook
Table 103 Bourbon: Key Details, (CEO, HQ, Revenue, Founded, No. of Employees, Company Type, Website, Business Segment)
Table 104 Bourbon: Product Benchmarking
Table 105 Vroon: Key Details, (CEO, HQ, Revenue, Founded, No. of Employees, Company Type, Website, Business Segment)
Table 106 Vroon: Product Benchmarking
Table 107 Vroon: Strategic Outlook
Table 108 Seacor Marine Holdings Inc: Key Details, (CEO, HQ, Revenue, Founded, No. of Employees, Company Type, Website, Business Segment)
Table 109 Seacor Marine Holdings Inc: Product Benchmarking
Table 110 Seacor Marine Holdings Inc: Strategic Outlook
Table 111 Østensjø Rederi: Key Details, (CEO, HQ, Revenue, Founded, No. of Employees, Company Type, Website, Business Segment)
Table 112 Østensjø Rederi: Product Benchmarking
Table 113 Østensjø Rederi: Strategic Outlook
Table 114 Havila Shipping ASA: Key Details, (CEO, HQ, Revenue, Founded, No. of Employees, Company Type, Website, Business Segment)
Table 115 Havila Shipping ASA: Product Benchmarking
Table 116 Kawasaki Kisen Kaisha Ltd: Key Details, (CEO, HQ, Revenue, Founded, No. of Employees, Company Type, Website, Business Segment)
Table 117 Kawasaki Kisen Kaisha Ltd: Product Benchmarking
Table 118 MMA Offshore Ltd: Key Details, (CEO, HQ, Revenue, Founded, No. of Employees, Company Type, Website, Business Segment)
Table 119 MMA Offshore Ltd: Product Benchmarking
Table 120 MMA Offshore Ltd: Strategic Outlook
Table 121 Grupo CBO: Key Details, (CEO, HQ, Revenue, Founded, No. of Employees, Company Type, Website, Business Segment)
Table 122 Grupo CBO: Product Benchmarking
Table 123 Harvey Gulf International Marine: Key Details, (CEO, HQ, Revenue, Founded, No. of Employees, Company Type, Website, Business Segment)
Table 124 Harvey Gulf International Marine: Product Benchmarking
Table 125 Harvey Gulf International Marine: Strategic Outlook
Table 126 Edison Chouest Offshore: Key Details, (CEO, HQ, Revenue, Founded, No. of Employees, Company Type, Website, Business Segment)
Table 127 Edison Chouest Offshore: Product Benchmarking
Table 128 Edison Chouest Offshore: Strategic Outlook
図の一覧
Figure 1 Offshore Support Vessel Market Segmentation
Figure 2 Offshore Support Vessel Market by Application: Market Attractiveness Index
Figure 3 Offshore Support Vessel Market by Material: Market Attractiveness Index
Figure 4 Offshore Support Vessel Market by Vessel Size: Market Attractiveness Index
Figure 5 Offshore Support Vessel Market by End-Use: Market Attractiveness Index
Figure 6 Offshore Support Vessel Market by Type: Market Attractiveness Index
Figure 7 Offshore Support Vessel Market Attractiveness Index by Region
Figure 8 Offshore Support Vessel Market: Market Dynamics
Figure 9 Offshore Support Vessel Market: Porter’s Five Forces Analysis
Figure 10 Global Offshore Support Vessel Market Share Forecast by COVID, 2024-2034 (%)
Figure 11 Global Offshore Support Vessel Market by Region, 2024-2034 (US$ Bn, AGR (%)) (V-Shaped Recovery Scenario)
Figure 12 Global Offshore Support Vessel Market by Region, 2024-2034 (US$ Bn, AGR (%)) (U-Shaped Recovery Scenario)
Figure 13 Global Offshore Support Vessel Market by Region, 2024-2034 (US$ Bn, AGR (%)) (W-Shaped Recovery Scenario)
Figure 14 Global Offshore Support Vessel Market by Region, 2024-2034 (US$ Bn, AGR (%)) (L-Shaped Recovery Scenario)
Figure 15 Offshore Support Vessel Market: PEST Analysis
Figure 16 Offshore Support Vessel Market by Application: Market Attractiveness Index
Figure 17 Global Offshore Support Vessel Market by Application, 2024-2034 (US$ Bn, AGR (%))
Figure 18 Offshore Support Vessel Market Share Forecast by Application, 2024, 2029, 2034 (%)
Figure 19 Deepwater Market by Region, 2024-2034 (US$ Bn, AGR (%))
Figure 20 Deepwater Market Share Forecast by Region, 2024 & 2034 (%)
Figure 21 Shallow Water Market by Region, 2024-2034 (US$ Bn, AGR (%))
Figure 22 Shallow Water Market Share Forecast by Region, 2024 & 2034 (%)
Figure 23 Offshore Support Vessel Market by Material: Market Attractiveness Index
Figure 24 Global Offshore Support Vessel Market by Material, 2024-2034 (US$ Bn, AGR (%))
Figure 25 Offshore Support Vessel Market Share Forecast by Material, 2024, 2029, 2034 (%)
Figure 26 Steel Market by Region, 2024-2034 (US$ Bn, AGR (%))
Figure 27 Steel Market Share Forecast by Region, 2024 & 2034 (%)
Figure 28 Aluminium Market by Region, 2024-2034 (US$ Bn, AGR (%))
Figure 29 Aluminium Market Share Forecast by Region, 2024 & 2034 (%)
Figure 30 Composite Materials Market by Region, 2024-2034 (US$ Bn, AGR (%))
Figure 31 Composite Materials Market Share Forecast by Region, 2024 & 2034 (%)
Figure 32 Offshore Support Vessel Market by Vessel Size: Market Attractiveness Index
Figure 33 Global Offshore Support Vessel Market by Vessel Size, 2024-2034 (US$ Bn, AGR (%))
Figure 34 Offshore Support Vessel Market Share Forecast by Vessel Size, 2024, 2029, 2034 (%)
Figure 35 Small Vessels Market by Region, 2024-2034 (US$ Bn, AGR (%))
Figure 36 Small Vessels Market Share Forecast by Region, 2024 & 2034 (%)
Figure 37 Medium Vessels Market by Region, 2024-2034 (US$ Bn, AGR (%))
Figure 38 Medium Vessels Market Share Forecast by Region, 2024 & 2034 (%)
Figure 39 Large Vessels Market by Region, 2024-2034 (US$ Bn, AGR (%))
Figure 40 Large Vessels Market Share Forecast by Region, 2024 & 2034 (%)
Figure 41 Very Large Vessels Market by Region, 2024-2034 (US$ Bn, AGR (%))
Figure 42 Very Large Vessels Market Share Forecast by Region, 2024 & 2034 (%)
Figure 43 Offshore Support Vessel Market by End-Use: Market Attractiveness Index
Figure 44 Global Offshore Support Vessel Market by End-Use, 2024-2034 (US$ Bn, AGR (%))
Figure 45 Offshore Support Vessel Market Share Forecast by End-Use, 2024, 2029, 2034 (%)
Figure 46 Oil and Gas Market by Region, 2024-2034 (US$ Bn, AGR (%))
Figure 47 Oil and Gas Market Share Forecast by Region, 2024 & 2034 (%)
Figure 48 Offshore Wind Market by Region, 2024-2034 (US$ Bn, AGR (%))
Figure 49 Offshore Wind Market Share Forecast by Region, 2024 & 2034 (%)
Figure 50 Offshore Patrolling Market by Region, 2024-2034 (US$ Bn, AGR (%))
Figure 51 Offshore Patrolling Market Share Forecast by Region, 2024 & 2034 (%)
Figure 52 Research and Surveying Market by Region, 2024-2034 (US$ Bn, AGR (%))
Figure 53 Research and Surveying Market Share Forecast by Region, 2024 & 2034 (%)
Figure 54 Other End-Uses Market by Region, 2024-2034 (US$ Bn, AGR (%))
Figure 55 Other End-Uses Market Share Forecast by Region, 2024 & 2034 (%)
Figure 56 Offshore Support Vessel Market by Type: Market Attractiveness Index
Figure 57 Global Offshore Support Vessel Market by Type, 2024-2034 (US$ Bn, AGR (%))
Figure 58 Offshore Support Vessel Market Share Forecast by Type, 2024, 2029, 2034 (%)
Figure 59 Anchor-handling Tug Supply Vessels Market by Region, 2024-2034 (US$ Bn, AGR (%))
Figure 60 Anchor-handling Tug Supply Vessels Market Share Forecast by Region, 2024 & 2034 (%)
Figure 61 Platform Support Vessels Market by Region, 2024-2034 (US$ Bn, AGR (%))
Figure 62 Platform Support Vessels Market Share Forecast by Region, 2024 & 2034 (%)
Figure 63 Multipurpose Support Vessels Market by Region, 2024-2034 (US$ Bn, AGR (%))
Figure 64 Multipurpose Support Vessels Market Share Forecast by Region, 2024 & 2034 (%)
Figure 65 Standby and Rescue Vessels Market by Region, 2024-2034 (US$ Bn, AGR (%))
Figure 66 Standby and Rescue Vessels Market Share Forecast by Region, 2024 & 2034 (%)
Figure 67 Crew Vessels Market by Region, 2024-2034 (US$ Bn, AGR (%))
Figure 68 Crew Vessels Market Share Forecast by Region, 2024 & 2034 (%)
Figure 69 Other Types Market by Region, 2024-2034 (US$ Bn, AGR (%))
Figure 70 Other Types Market Share Forecast by Region, 2024 & 2034 (%)
Figure 71 Offshore Support Vessel Market Forecast by Region 2024 and 2034 (Revenue, CAGR%)
Figure 72 Offshore Support Vessel Market Share Forecast by Region 2024, 2029, 2034 (%)
Figure 73 Global Offshore Support Vessel Market by Region, 2024-2034 (US$ Bn, AGR (%))
Figure 74 North America Offshore Support Vessel Market Attractiveness Index
Figure 75 North America Offshore Support Vessel Market by Region, 2024, 2029 & 2034 (US$ Billion)
Figure 76 North America Offshore Support Vessel Market by Value, 2024-2034 (US$ Bn, AGR (%))
Figure 77 North America Offshore Support Vessel Market by Country, 2024-2034 (US$ Bn, AGR (%))
Figure 78 North America Offshore Support Vessel Market Share Forecast by Country, 2024 & 2034 (%)
Figure 79 North America Offshore Support Vessel Market by Application, 2024-2034 (US$ Bn, AGR (%))
Figure 80 North America Offshore Support Vessel Market Share Forecast Application, 2024 & 2034 (%)
Figure 81 North America Offshore Support Vessel Market by Material, 2024-2034 (US$ Bn, AGR (%))
Figure 82 North America Offshore Support Vessel Market Share Forecast by Material, 2024 & 2034 (%)
Figure 83 North America Offshore Support Vessel Market by Vessel Size, 2024-2034 (US$ Bn, AGR (%))
Figure 84 North America Offshore Support Vessel Market Share Forecast by Vessel Size, 2024 & 2034 (%)
Figure 85 North America Offshore Support Vessel Market by End-Use, 2024-2034 (US$ Bn, AGR (%))
Figure 86 North America Offshore Support Vessel Market Share Forecast by End-Use, 2024 & 2034 (%)
Figure 87 North America Offshore Support Vessel Market by Type, 2024-2034 (US$ Bn, AGR (%))
Figure 88 North America Offshore Support Vessel Market Share Forecast by Type, 2024 & 2034 (%)
Figure 89 US Offshore Support Vessel Market by Value, 2024-2034 (US$ Bn, AGR (%))
Figure 90 Canada Offshore Support Vessel Market by Value, 2024-2034 (US$ Bn, AGR (%))
Figure 91 Europe Offshore Support Vessel Market Attractiveness Index
Figure 92 Europe Offshore Support Vessel Market by Region, 2024, 2029 & 2034 (US$ Billion)
Figure 93 Europe Offshore Support Vessel Market by Value, 2024-2034 (US$ Bn, AGR (%))
Figure 94 Europe Offshore Support Vessel Market by Country, 2024-2034 (US$ Bn, AGR (%))
Figure 95 Europe Offshore Support Vessel Market Share Forecast by Country, 2024 & 2034 (%)
Figure 96 Europe Offshore Support Vessel Market by Application, 2024-2034 (US$ Bn, AGR (%))
Figure 97 Europe Offshore Support Vessel Market Share Forecast Application, 2024 & 2034 (%)
Figure 98 Europe Offshore Support Vessel Market by Material, 2024-2034 (US$ Bn, AGR (%))
Figure 99 Europe Offshore Support Vessel Market Share Forecast by Material, 2024 & 2034 (%)
Figure 100 Europe Offshore Support Vessel Market by Vessel Size, 2024-2034 (US$ Bn, AGR (%))
Figure 101 Europe Offshore Support Vessel Market Share Forecast by Vessel Size, 2024 & 2034 (%)
Figure 102 Europe Offshore Support Vessel Market by End-Use, 2024-2034 (US$ Bn, AGR (%))
Figure 103 Europe Offshore Support Vessel Market Share Forecast by End-Use, 2024 & 2034 (%)
Figure 104 Europe Offshore Support Vessel Market by Type, 2024-2034 (US$ Bn, AGR (%))
Figure 105 Europe Offshore Support Vessel Market Share Forecast by Type, 2024 & 2034 (%)
Figure 106 Norway Offshore Support Vessel Market by Value, 2024-2034 (US$ Bn, AGR (%))
Figure 107 UK Offshore Support Vessel Market by Value, 2024-2034 (US$ Bn, AGR (%))
Figure 108 France Offshore Support Vessel Market by Value, 2024-2034 (US$ Bn, AGR (%))
Figure 109 Denmark Offshore Support Vessel Market by Value, 2024-2034 (US$ Bn, AGR (%))
Figure 110 Russia Offshore Support Vessel Market by Value, 2024-2034 (US$ Bn, AGR (%))
Figure 111 Rest of Europe Offshore Support Vessel Market by Value, 2024-2034 (US$ Bn, AGR (%))
Figure 112 Asia-Pacific Offshore Support Vessel Market Attractiveness Index
Figure 113 Asia-Pacific Offshore Support Vessel Market by Region, 2024, 2029 & 2034 (US$ Billion)
Figure 114 Asia-Pacific Offshore Support Vessel Market by Value, 2024-2034 (US$ Bn, AGR (%))
Figure 115 Asia-Pacific Offshore Support Vessel Market by Country, 2024-2034 (US$ Bn, AGR (%))
Figure 116 Asia-Pacific Offshore Support Vessel Market Share Forecast by Country, 2024 & 2034 (%)
Figure 117 Asia-Pacific Offshore Support Vessel Market by Application, 2024-2034 (US$ Bn, AGR (%))
Figure 118 Asia-Pacific Offshore Support Vessel Market Share Forecast Application, 2024 & 2034 (%)
Figure 119 Asia-Pacific Offshore Support Vessel Market by Material, 2024-2034 (US$ Bn, AGR (%))
Figure 120 Asia-Pacific Offshore Support Vessel Market Share Forecast by Material, 2024 & 2034 (%)
Figure 121 Asia-Pacific Offshore Support Vessel Market by Vessel Size, 2024-2034 (US$ Bn, AGR (%))
Figure 122 Asia-Pacific Offshore Support Vessel Market Share Forecast by Vessel Size, 2024 & 2034 (%)
Figure 123 Asia-Pacific Offshore Support Vessel Market by End-Use, 2024-2034 (US$ Bn, AGR (%))
Figure 124 Asia-Pacific Offshore Support Vessel Market Share Forecast by End-Use, 2024 & 2034 (%)
Figure 125 Asia-Pacific Offshore Support Vessel Market by Type, 2024-2034 (US$ Bn, AGR (%))
Figure 126 Asia-Pacific Offshore Support Vessel Market Share Forecast by Type, 2024 & 2034 (%)
Figure 127 China Offshore Support Vessel Market by Value, 2024-2034 (US$ Bn, AGR (%))
Figure 128 India Offshore Support Vessel Market by Value, 2024-2034 (US$ Bn, AGR (%))
Figure 129 Indonesia Offshore Support Vessel Market by Value, 2024-2034 (US$ Bn, AGR (%))
Figure 130 Malaysia Offshore Support Vessel Market by Value, 2024-2034 (US$ Bn, AGR (%))
Figure 131 Australia Offshore Support Vessel Market by Value, 2024-2034 (US$ Bn, AGR (%))
Figure 132 Rest of Asia-Pacific Offshore Support Vessel Market by Value, 2024-2034 (US$ Bn, AGR (%))
Figure 133 Middle East and Africa Offshore Support Vessel Market Attractiveness Index
Figure 134 Middle East and Africa Offshore Support Vessel Market by Region, 2024, 2029 & 2034 (US$ Billion)
Figure 135 Middle East & Africa Offshore Support Vessel Market by Value, 2024-2034 (US$ Bn, AGR (%))
Figure 136 Middle East & Africa Offshore Support Vessel Market by Country, 2024-2034 (US$ Bn, AGR (%))
Figure 137 Middle East and Africa Offshore Support Vessel Market Share Forecast by Country, 2024 & 2034 (%)
Figure 138 Middle East & Africa Offshore Support Vessel Market by Application, 2024-2034 (US$ Bn, AGR (%))
Figure 139 Middle East and Africa Offshore Support Vessel Market Share Forecast Application, 2024 & 2034 (%)
Figure 140 Middle East & Africa Offshore Support Vessel Market by Material, 2024-2034 (US$ Bn, AGR (%))
Figure 141 Middle East and Africa Offshore Support Vessel Market Share Forecast by Material, 2024 & 2034 (%)
Figure 142 Middle East & Africa Offshore Support Vessel Market by Vessel Size, 2024-2034 (US$ Bn, AGR (%))
Figure 143 Middle East and Africa Offshore Support Vessel Market Share Forecast by Vessel Size, 2024 & 2034 (%)
Figure 144 Middle East & Africa Offshore Support Vessel Market by End-Use, 2024-2034 (US$ Bn, AGR (%))
Figure 145 Middle East and Africa Offshore Support Vessel Market Share Forecast by End-Use, 2024 & 2034 (%)
Figure 146 Middle East & Africa Offshore Support Vessel Market by Type, 2024-2034 (US$ Bn, AGR (%))
Figure 147 Middle East and Africa Offshore Support Vessel Market Share Forecast by Type, 2024 & 2034 (%)
Figure 148 GCC Offshore Support Vessel Market by Value, 2024-2034 (US$ Bn, AGR (%))
Figure 149 South Africa Offshore Support Vessel Market by Value, 2024-2034 (US$ Bn, AGR (%))
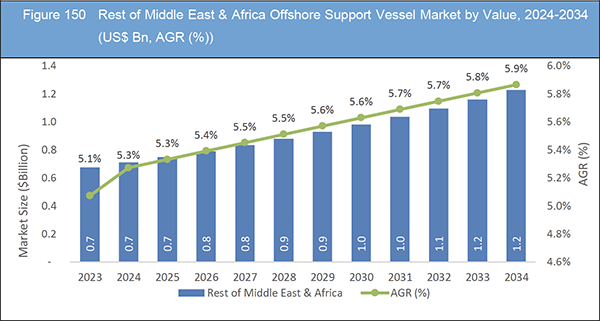
Figure 150 Rest of Middle East & Africa Offshore Support Vessel Market by Value, 2024-2034 (US$ Bn, AGR (%))
Figure 151 Latin America Offshore Support Vessel Market Attractiveness Index
Figure 152 Latin America Offshore Support Vessel Market by Region, 2024, 2029 & 2034 (US$ Billion)
Figure 153 Latin America Offshore Support Vessel Market by Value, 2024-2034 (US$ Bn, AGR (%))
Figure 154 Latin America Offshore Support Vessel Market by Country, 2024-2034 (US$ Bn, AGR (%))
Figure 155 Latin America Offshore Support Vessel Market Share Forecast by Country, 2024 & 2034 (%)
Figure 156 Latin America Offshore Support Vessel Market by Application, 2024-2034 (US$ Bn, AGR (%))
Figure 157 Latin America Offshore Support Vessel Market Share Forecast Application, 2024 & 2034 (%)
Figure 158 Latin America Offshore Support Vessel Market by Material, 2024-2034 (US$ Bn, AGR (%))
Figure 159 Latin America Offshore Support Vessel Market Share Forecast by Material, 2024 & 2034 (%)
Figure 160 Latin America Offshore Support Vessel Market by Vessel Size, 2024-2034 (US$ Bn, AGR (%))
Figure 161 Latin America Offshore Support Vessel Market Share Forecast by Vessel Size, 2024 & 2034 (%)
Figure 162 Latin America Offshore Support Vessel Market by End-Use, 2024-2034 (US$ Bn, AGR (%))
Figure 163 Latin America Offshore Support Vessel Market Share Forecast by End-Use, 2024 & 2034 (%)
Figure 164 Latin America Offshore Support Vessel Market by Type, 2024-2034 (US$ Bn, AGR (%))
Figure 165 Latin America Offshore Support Vessel Market Share Forecast by Type, 2024 & 2034 (%)
Figure 166 Brazil Offshore Support Vessel Market by Value, 2024-2034 (US$ Bn, AGR (%))
Figure 167 Mexico Offshore Support Vessel Market by Value, 2024-2034 (US$ Bn, AGR (%))
Figure 168 Rest of Latin America Offshore Support Vessel Market by Value, 2024-2034 (US$ Bn, AGR (%))
Figure 169 Offshore Support Vessel Market: Company Share, 2023
Figure 170 DOF Group ASA.: Net Revenue, 2018-2022 (US$ Million, AGR%)
Figure 171 DOF Group ASA.: Business Segment Revenue Share, 2022 (%)
Figure 172 Solstad Offshore ASA.: Net Revenue, 2018-2022 (US$ Million, AGR%)
Figure 173 Solstad Offshore ASA.: Regional Revenue Share, 2022 (%)
Figure 174 Solstad Offshore ASA.: Business Segment Revenue Share, 2022 (%)
Figure 175 Tidewater Inc..: Net Revenue, 2018-2022 (US$ Million, AGR%)
Figure 176 Tidewater Inc..: Regional Revenue Share, 2022 (%)
Figure 177 A.P. Møller – Mærsk A/S.: Net Revenue, 2018-2022 (US$ Million, AGR%)
Figure 178 A.P. Møller – Mærsk A/S.: Regional Revenue Share, 2022 (%)
Figure 179 A.P. Møller – Mærsk A/S.: Business Segment Revenue Share, 2022 (%)
Figure 180 Siem Offshore.: Net Revenue, 2018-2022 (US$ Million, AGR%)
Figure 181 Siem Offshore.: Business Segment Revenue Share, 2022 (%)
Figure 182 Seacor Marine Holdings Inc.: Net Revenue, 2018-2022 (US$ Million, AGR%)
Figure 183 Seacor Marine Holdings Inc.: Regional Revenue Share, 2022 (%)
Figure 184 Havila Shipping ASA.: Net Revenue, 2018-2022 (US$ Million, AGR%)
Figure 185 Havila Shipping ASA.: Regional Revenue Share, 2022 (%)
Figure 186 Havila Shipping ASA.: Business Segment Revenue Share, 2022 (%)
Figure 187 Kawasaki Kisen Kaisha Ltd.: Net Revenue, 2018-2022 (US$ Million, AGR%)
Figure 188 Kawasaki Kisen Kaisha Ltd.: Business Segment Revenue Share, 2022 (%)
Figure 189 MMA Offshore Ltd.: Net Revenue, 2018-2022 (US$ Million, AGR%)
Figure 190 MMA Offshore Ltd.: Regional Revenue Share, 2022 (%)
Figure 191 MMA Offshore Ltd.: Business Segment Revenue Share, 2022 (%)
ページTOPに戻る
Summary
Report Details
The Offshore Support Vessel Market Report 2024-2034: This report will prove invaluable to leading firms striving for new revenue pockets if they wish to better understand the industry and its underlying dynamics. It will be useful for companies that would like to expand into different industries or to expand their existing operations in a new region.
The Offshore Support Vessel (OSV) Market Is Poised for Substantial Growth Driven by a Combination of Factors
The offshore support vessel (OSV) market is poised for substantial growth driven by a combination of factors including increasing offshore exploration and production activities, rising demand for energy resources, and advancements in offshore technology. Key drivers such as the expansion of offshore oil and gas industries, particularly in regions like the Middle East, Southeast Asia, and Latin America, are propelling the demand for OSVs globally. Moreover, the versatility and multifunctionality of OSVs, catering to various offshore tasks ranging from seismic surveys to construction support and maintenance, are further fuelling market growth.
Amidst this growth trajectory, the OSV market presents lucrative opportunities for industry players. Geographical expansion to emerging markets offers significant growth potential, with untapped offshore reserves in regions such as Africa and South America presenting new avenues for OSV deployment. Furthermore, the adoption of advanced technologies, such as dynamic positioning systems and remotely operated vehicles, enhances operational efficiency and safety, driving demand for modern OSV fleets. Additionally, strategic collaborations with regional players and investments in upcoming technologies enable companies to strengthen their market presence and capitalize on emerging opportunities.
However, the OSV market is not without its challenges. The volatility of oil prices and cyclical nature of offshore projects pose risks to market stability, impacting vessel utilization rates and profitability. Moreover, stringent regulatory frameworks and compliance requirements, including environmental regulations and safety standards, add complexity to operations and increase operational costs for OSV operators. Furthermore, the aging fleet of OSVs and the need for vessel modernization and retrofitting pose challenges in meeting evolving industry demands and maintaining competitiveness.
Huge Capital to Launch Offshore Support Vessels Hinder the OSV Market
The offshore support vessel (OSV) market faces a significant hindrance in the form of the substantial capital required for launching these vessels. Building, outfitting, and deploying OSVs demand considerable financial resources, posing a challenge for companies operating in this sector. The upfront investment needed for constructing and commissioning OSVs, which are essential for various offshore operations such as oil and gas exploration, offshore wind farming, and marine research, can be daunting. Additionally, ongoing operational expenses, including crew salaries, maintenance costs, fuel expenditures, and regulatory compliance, further contribute to the financial burden. This high capital requirement acts as a deterrent for potential investors and market entrants, limiting the growth and expansion of the OSV market. Moreover, fluctuations in global economic conditions and uncertainties in the energy sector can exacerbate these financial challenges, making it even more challenging for companies to justify the investment in new OSV projects. As a result, addressing the issue of huge capital requirements is crucial for unlocking the full potential of the OSV market and fostering its sustainable growth in the future.
What Questions Should You Ask before Buying a Market Research Report?
-
How is the offshore support vessel market evolving?
-
What is driving and restraining the offshore support vessel market?
-
How will each offshore support vessel submarket segment grow over the forecast period and how much revenue will these submarkets account for in 2034?
-
How will the market shares for each offshore support vessel submarket develop from 2024 to 2034?
-
What will be the main driver for the overall market from 2024 to 2034?
-
Will leading offshore support vessel markets broadly follow the macroeconomic dynamics, or will individual national markets outperform others?
-
How will the market shares of the national markets change by 2034 and which geographical region will lead the market in 2034?
-
Who are the leading players and what are their prospects over the forecast period?
-
What are the offshore support vessel projects for these leading companies?
-
How will the industry evolve during the period between 2024 and 2034? What are the implications of offshore support vessel projects taking place now and over the next 10 years?
-
Is there a greater need for product commercialisation to further scale the offshore support vessel market?
-
Where is the offshore support vessel market heading and how can you ensure you are at the forefront of the market?
-
What are the best investment options for new product and service lines?
-
What are the key prospects for moving companies into a new growth path and C-suite?
You need to discover how this will impact the offshore support vessel market today, and over the next 10 years:
-
Our 408-page report provides 128 tables and 191 charts/graphs exclusively to you.
-
The report highlights key lucrative areas in the industry so you can target them – NOW.
-
It contains in-depth analysis of global, regional and national sales and growth.
-
It highlights for you the key successful trends, changes and revenue projections made by your competitors.
This report tells you TODAY how the offshore support vessel market will develop in the next 10 years, and in line with the variations in COVID-19 economic recession and bounce. This market is more critical now than at any point over the last 10 years.
Forecasts to 2034 and other analyses reveal commercial prospects
-
In addition to revenue forecasting to 2034, our new study provides you with recent results, growth rates, and market shares.
-
You will find original analyses, with business outlooks and developments.
-
Discover qualitative analyses (including market dynamics, drivers, opportunities, restraints and challenges), cost structure, impact of rising offshore support vessel prices and recent developments.
This report includes data analysis and invaluable insight into how COVID-19 will affect the industry and your company. Four COVID-19 recovery patterns and their impact, namely, “V”, “L”, “W” and “U” are discussed in this report.
Segments Covered in the Report
Market Segment by Application
Market Segment by Material
-
Steel
-
Aluminium
-
Composite Materials
Market Segment by Vessel Size
-
Small Vessels
-
Medium Vessels
-
Large Vessels
-
Very Large Vessels
Market Segment by End-Use
-
Oil and Gas
-
Offshore Wind
-
Offshore Patrolling
-
Research and Surveying
-
Other End-Uses
Market Segment by Type
-
Anchor-handling Tug Supply Vessels
-
Platform Support Vessels
-
Multipurpose Support Vessels
-
Standby and Rescue Vessels
-
Crew Vessels
-
Other Types
In addition to the revenue predictions for the overall world market and segments, you will also find revenue forecasts for four regional and 20 leading national markets:
North America
Europe
-
Norway
-
UK
-
France
-
Denmark
-
Russia
-
Rest of Europe
Asia Pacific
-
China
-
India
-
Indonesia
-
Malaysia
-
Australia
-
Rest of Asia-Pacific
Latin America
-
Brazil
-
Mexico
-
Rest of Latin America
Middle East & Africa
-
GCC
-
South Africa
-
Rest of Middle East & Africa
The report also includes profiles and for some of the leading companies in the Offshore Support Vessel Market, 2024 to 2034, with a focus on this segment of these companies’ operations.
Leading companies profiled in the report
-
A.P. Møller – Mærsk A/S
-
Bourbon
-
DOF Group ASA
-
Edison Chouest Offshore
-
Grupo CBO
-
Harvey Gulf International Marine
-
Havila Shipping ASA
-
Kawasaki Kisen Kaisha Ltd
-
MMA Offshore Ltd
-
Østensjø Rederi
-
Seacor Marine Holdings Inc
-
Siem Offshore
-
Solstad Offshore ASA
-
Tidewater Inc.
-
Vroon
Overall world revenue for Offshore Support Vessel Market, 2024 to 2034 in terms of value the market will surpass US$24.4 billion in 2024, our work calculates. We predict strong revenue growth through to 2034. Our work identifies which organizations hold the greatest potential. Discover their capabilities, progress, and commercial prospects, helping you stay ahead.
How will the Offshore Support Vessel Market, 2024 to 2034 report help you?
In summary, our 400+ page report provides you with the following knowledge:
-
Revenue forecasts to 2034 for Offshore Support Vessel Market, 2024 to 2034 Market, with forecasts for application, material, vessel size, end-use, and type, each forecast at a global and regional level – discover the industry’s prospects, finding the most lucrative places for investments and revenues.
-
Revenue forecasts to 2034 for four regional and 20 key national markets – See forecasts for the Offshore Support Vessel Market, 2024 to 2034 market in North America, Europe, Asia-Pacific, Latin America and Middle East & Africa. Also forecasted is the market in the US, Canada, Brazil, Germany, France, UK, Italy, China, India, Japan, and Australia among other prominent economies.
-
Prospects for established firms and those seeking to enter the market – including company profiles for 15 of the major companies involved in the Offshore Support Vessel Market, 2024 to 2034.
Find quantitative and qualitative analyses with independent predictions. Receive information that only our report contains, staying informed with invaluable business intelligence.
Information found nowhere else
With our new report, you are less likely to fall behind in knowledge or miss out on opportunities. See how our work could benefit your research, analyses, and decisions. Visiongain’s study is for everybody needing commercial analyses for the Offshore Support Vessel Market, 2024 to 2034, market-leading companies. You will find data, trends and predictions.
ページTOPに戻る
Table of Contents
1 Report Overview
1.1 Objectives of the Study
1.2 Introduction to Offshore Support Vessel Market
1.3 What This Report Delivers
1.4 Why You Should Read This Report
1.5 Key Questions Answered by This Analytical Report
1.6 Who Is This Report for?
1.7 Research Methodology
1.7.1 Market Definitions
1.7.2 Market Evaluation & Forecasting Methodology
1.7.3 Data Validation
1.7.3.1 Primary Research
1.7.3.2 Secondary Research
1.8 Frequently Asked Questions (FAQs)
1.9 Associated Visiongain Reports
1.10 About Visiongain
2 Executive Summary
3 Market Overview
3.1 Key Findings
3.2 Market Dynamics
3.2.1 Market Driving Factors
3.2.1.1 Increasing Investment in Offshore Wind and Oil & Gas Projects Driving the OSV Market
3.2.1.2 Increasing Ultra-Deepwater Exploration Activities Driving the OSV Market
3.2.1.3 Growing to Measures to Install More Sustainable Energy Infrastructure to Enhance OSV Market
3.2.2 Market Restraining Factors
3.2.2.1 Huge Capital to Launch Offshore Support Vessels Hinder the OSV Market
3.2.2.2 Supply- Demand Gap in Offshore Support Vehicle Hinder the OSV Market
3.2.2.3 Stringent Regulations for Offshore Activities Hinder the OSV Market
3.2.3 Market Opportunities
3.2.3.1 Offshore Decommissioning Opportunities for the OSV Market
3.2.3.2 Collaboration and Partnership with Other Industry Stakeholders Opportunities
3.2.3.3 The Adoption of Digital Technologies and Automation in Vessel Operations
3.3 Porter’s Five Forces Analysis
3.3.1 Bargaining Power of Suppliers (Medium)
3.3.2 Bargaining Power of Buyers (High)
3.3.3 Competitive Rivalry (Medium to High)
3.3.4 Threat from Substitutes (Low)
3.3.5 Threat of New Entrants (High)
3.4 COVID-19 Impact Analysis
3.4.1 “V-Shaped Recovery”
3.4.2 “U-Shaped Recovery”
3.4.3 “W-Shaped Recovery”
3.4.4 “L-Shaped Recovery”
3.5 PEST Analysis
4 Offshore Support Vessel Market Analysis by Application
4.1 Key Findings
4.2 Application Segment: Market Attractiveness Index
4.3 Offshore Support Vessel Market Size Estimation and Forecast by Application
4.4 Deepwater Segment
4.4.1 Market Size by Region, 2024-2034 (US$ Billion)
4.4.2 Market Share by Region, 2024 & 2034 (%)
4.5 Shallow Water Segment
4.5.1 Market Size by Region, 2024-2034 (US$ Billion)
4.5.2 Market Share by Region, 2024 & 2034 (%)
5 Offshore Support Vessel Market Analysis by Material
5.1 Key Findings
5.2 Material Segment: Market Attractiveness Index
5.3 Offshore Support Vessel Market Size Estimation and Forecast by Material
5.4 Steel Segment
5.4.1 Market Size by Region, 2024-2034 (US$ Billion)
5.4.2 Market Share by Region, 2024 & 2034 (%)
5.5 Aluminium Segment
5.5.1 Market Size by Region, 2024-2034 (US$ Billion)
5.5.2 Market Share by Region, 2024 & 2034 (%)
5.6 Composite Materials Segment
5.6.1 Market Size by Region, 2024-2034 (US$ Billion)
5.6.2 Market Share by Region, 2024 & 2034 (%)
6 Offshore Support Vessel Market Analysis by Vessel Size
6.1 Key Findings
6.2 Vessel Size Segment: Market Attractiveness Index
6.3 Offshore Support Vessel Market Size Estimation and Forecast by Vessel Size
6.4 Small Vessels Segment
6.4.1 Market Size by Region, 2024-2034 (US$ Billion)
6.4.2 Market Share by Region, 2024 & 2034 (%)
6.5 Medium Vessels Segment
6.5.1 Market Size by Region, 2024-2034 (US$ Billion)
6.5.2 Market Share by Region, 2024 & 2034 (%)
6.6 Large Vessels
6.6.1 Market Size by Region, 2024-2034 (US$ Billion)
6.6.2 Market Share by Region, 2024 & 2034 (%)
6.7 Very Large Vessels Segment
6.7.1 Market Size by Region, 2024-2034 (US$ Billion)
6.7.2 Market Share by Region, 2024 & 2034 (%)
7 Offshore Support Vessel Market Analysis by End-Use
7.1 Key Findings
7.2 End-Use Segment: Market Attractiveness Index
7.3 Offshore Support Vessel Market Size Estimation and Forecast by End-Use
7.4 Oil and Gas
7.4.1 Market Size by Region, 2024-2034 (US$ Billion)
7.4.2 Market Share by Region, 2024 & 2034 (%)
7.5 Offshore Wind Segment
7.5.1 Market Size by Region, 2024-2034 (US$ Billion)
7.5.2 Market Share by Region, 2024 & 2034 (%)
7.6 Offshore Patrolling Segment
7.6.1 Market Size by Region, 2024-2034 (US$ Billion)
7.6.2 Market Share by Region, 2024 & 2034 (%)
7.7 Research and Surveying Segment
7.7.1 Market Size by Region, 2024-2034 (US$ Billion)
7.7.2 Market Share by Region, 2024 & 2034 (%)
7.8 Other End-Uses
7.8.1 Market Size by Region, 2024-2034 (US$ Billion)
7.8.2 Market Share by Region, 2024 & 2034 (%)
8 Offshore Support Vessel Market Analysis by Type
8.1 Key Findings
8.2 Type Segment: Market Attractiveness Index
8.3 Offshore Support Vessel Market Size Estimation and Forecast by Type
8.4 Anchor-handling Tug Supply Vessels
8.4.1 Market Size by Region, 2024-2034 (US$ Million)
8.4.2 Market Share by Region, 2024 & 2034 (%)
8.5 Platform Support Vessels
8.5.1 Market Size by Region, 2024-2034 (US$ Million)
8.5.2 Market Share by Region, 2024 & 2034 (%)
8.6 Multipurpose Support Vessels Segment
8.6.1 Market Size by Region, 2024-2034 (US$ Million)
8.6.2 Market Share by Region, 2024 & 2034 (%)
8.7 Standby and Rescue Vessels Segment
8.7.1 Market Size by Region, 2024-2034 (US$ Million)
8.7.2 Market Share by Region, 2024 & 2034 (%)
8.8 Crew Vessels Segment
8.8.1 Market Size by Region, 2024-2034 (US$ Million)
8.8.2 Market Share by Region, 2024 & 2034 (%)
8.9 Other Types
8.9.1 Market Size by Region, 2024-2034 (US$ Million)
8.9.2 Market Share by Region, 2024 & 2034 (%)
9 Offshore Support Vessel Market Analysis by Region
9.1 Key Findings
9.2 Regional Market Size Estimation and Forecast
10 North America Offshore Support Vessel Market Analysis
10.1 Key Findings
10.2 North America Offshore Support Vessel Market Attractiveness Index
10.3 North America Offshore Support Vessel Market by Country, 2024, 2029 & 2034 (US$ Billion)
10.4 North America Offshore Support Vessel Market Size Estimation and Forecast
10.5 North America Offshore Support Vessel Market Size Estimation and Forecast by Country
10.6 North America Offshore Support Vessel Market Size Estimation and Forecast by Application
10.7 North America Offshore Support Vessel Market Size Estimation and Forecast by Material
10.8 North America Offshore Support Vessel Market Size Estimation and Forecast by Vessel Size
10.9 North America Offshore Support Vessel Market Size Estimation and Forecast by End-Use
10.10 North America Offshore Support Vessel Market Size Estimation and Forecast by Type
10.11 U.S. Offshore Support Vessel Market Analysis
10.12 Canada Offshore Support Vessel Market Analysis
11 Europe Offshore Support Vessel Market Analysis
11.1 Key Findings
11.2 Europe Offshore Support Vessel Market Attractiveness Index
11.3 Europe Offshore Support Vessel Market by Country, 2024, 2029 & 2034 (US$ Billion)
11.4 Europe Offshore Support Vessel Market Size Estimation and Forecast
11.5 Europe Offshore Support Vessel Market Size Estimation and Forecast by Country
11.6 Europe Offshore Support Vessel Market Size Estimation and Forecast by Application
11.7 Europe Offshore Support Vessel Market Size Estimation and Forecast by Material
11.8 Europe Offshore Support Vessel Market Size Estimation and Forecast by Vessel Size
11.9 Europe Offshore Support Vessel Market Size Estimation and Forecast by End-Use
11.10 Europe Offshore Support Vessel Market Size Estimation and Forecast by Type
11.11 Norway Offshore Support Vessel Market Analysis
11.12 UK Offshore Support Vessel Market Analysis
11.13 France Offshore Support Vessel Market Analysis
11.14 Denmark Offshore Support Vessel Market Analysis
11.15 Russia Offshore Support Vessel Market Analysis
11.16 Rest of Europe Offshore Support Vessel Market Analysis
12 Asia-Pacific Offshore Support Vessel Market Analysis
12.1 Key Findings
12.2 Asia-Pacific Offshore Support Vessel Market Attractiveness Index
12.3 Asia-Pacific Offshore Support Vessel Market by Country, 2024, 2029 & 2034 (US$ Billion)
12.4 Asia-Pacific Offshore Support Vessel Market Size Estimation and Forecast
12.5 Asia-Pacific Offshore Support Vessel Market Size Estimation and Forecast by Country
12.6 Asia-Pacific Offshore Support Vessel Market Size Estimation and Forecast by Application
12.7 Asia-Pacific Offshore Support Vessel Market Size Estimation and Forecast by Material
12.8 Asia-Pacific Offshore Support Vessel Market Size Estimation and Forecast by Vessel Size
12.9 Asia-Pacific Offshore Support Vessel Market Size Estimation and Forecast by End-Use
12.10 Asia-Pacific Offshore Support Vessel Market Size Estimation and Forecast by Type
12.11 China Offshore Support Vessel Market Analysis
12.12 India Offshore Support Vessel Market Analysis
12.13 Indonesia Offshore Support Vessel Market Analysis
12.14 Malaysia Offshore Support Vessel Market Analysis
12.15 Australia Offshore Support Vessel Market Analysis
12.16 Rest of Asia-Pacific Offshore Support Vessel Market Analysis
13 Middle East and Africa Offshore Support Vessel Market Analysis
13.1 Key Findings
13.2 Middle East and Africa Offshore Support Vessel Market Attractiveness Index
13.3 Middle East and Africa Offshore Support Vessel Market by Country, 2024, 2029 & 2034 (US$ Billion)
13.4 Middle East and Africa Offshore Support Vessel Market Size Estimation and Forecast
13.5 Middle East and Africa Offshore Support Vessel Market Size Estimation and Forecast by Country
13.6 Middle East and Africa Offshore Support Vessel Market Size Estimation and Forecast by Application
13.7 Middle East and Africa Offshore Support Vessel Market Size Estimation and Forecast by Material
13.8 Middle East and Africa Offshore Support Vessel Market Size Estimation and Forecast by Vessel Size
13.9 Middle East and Africa Offshore Support Vessel Market Size Estimation and Forecast by End-Use
13.10 Middle East and Africa Offshore Support Vessel Market Size Estimation and Forecast by Type
13.11 GCC Offshore Support Vessel Market Analysis
13.12 South Africa Offshore Support Vessel Market Analysis
13.13 Rest of Middle East & Africa Offshore Support Vessel Market Analysis
14 Latin America Offshore Support Vessel Market Analysis
14.1 Key Findings
14.2 Latin America Offshore Support Vessel Market Attractiveness Index
14.3 Latin America Offshore Support Vessel Market by Country, 2024, 2029 & 2034 (US$ Billion)
14.4 Latin America Offshore Support Vessel Market Size Estimation and Forecast
14.5 Latin America Offshore Support Vessel Market Size Estimation and Forecast by Country
14.6 Latin America Offshore Support Vessel Market Size Estimation and Forecast by Application
14.7 Latin America Offshore Support Vessel Market Size Estimation and Forecast by Material
14.8 Latin America Offshore Support Vessel Market Size Estimation and Forecast by Vessel Size
14.9 Latin America Offshore Support Vessel Market Size Estimation and Forecast by End-Use
14.10 Latin America Offshore Support Vessel Market Size Estimation and Forecast by Type
14.11 Brazil Offshore Support Vessel Market Analysis
14.12 Mexico Offshore Support Vessel Market Analysis
14.13 Rest of Latin America Offshore Support Vessel Market Analysis
15 Company Profiles
15.1 Competitive Landscape, 2023
15.2 Strategic Outlook
15.3 DOF Group ASA
15.3.1 Company Snapshot
15.3.2 Company Overview
15.3.3 Financial Analysis
15.3.3.1 Net Revenue, 2018-2022
15.3.3.2 Business Segment Revenue Share, 2022 (%)
15.3.4 Product Benchmarking
15.3.5 Strategic Outlook
15.4 Solstad Offshore ASA
15.4.1 Company Snapshot
15.4.2 Company Overview
15.4.3 Financial Analysis
15.4.3.1 Net Revenue, 2018-2022
15.4.3.2 Regional Revenue Share, 2022 (%)
15.4.3.3 Business Segment Revenue Share, 2022 (%)
15.4.4 Product Benchmarking
15.4.5 Strategic Outlook
15.5 Tidewater Inc.
15.5.1 Company Snapshot
15.5.2 Company Overview
15.5.3 Financial Analysis
15.5.3.1 Net Revenue, 2018-2022
15.5.3.2 Regional Revenue Share, 2022 (%)
15.5.4 Product Benchmarking
15.5.5 Strategic Outlook
15.6 A.P. Møller – Mærsk A/S
15.6.1 Company Snapshot
15.6.2 Company Overview
15.6.3 Financial Analysis
15.6.3.1 Net Revenue, 2018-2022
15.6.3.2 Regional Revenue Share, 2022 (%)
15.6.3.3 Business Segment Revenue Share, 2022 (%)
15.6.4 Product Benchmarking
15.6.5 Strategic Outlook
15.7 Siem Offshore
15.7.1 Company Snapshot
15.7.2 Company Overview
15.7.3 Financial Analysis
15.7.3.1 Net Revenue, 2018-2022
15.7.3.2 Business Segment Revenue Share, 2022 (%)
15.7.4 Product Benchmarking
15.7.5 Strategic Outlook
15.8 Bourbon
15.8.1 Company Snapshot
15.8.2 Company Overview
15.8.3 Product Benchmarking
15.9 Vroon
15.9.1 Company Snapshot
15.9.2 Company Overview
15.9.3 Product Benchmarking
15.9.4 Strategic Outlook
15.10 Seacor Marine Holdings Inc
15.10.1 Company Snapshot
15.10.2 Company Overview
15.10.3 Financial Analysis
15.10.3.1 Net Revenue, 2018-2022
15.10.3.2 Regional Revenue Share, 2022 (%)
15.10.4 Product Benchmarking
15.10.5 Strategic Outlook
15.11 Østensjø Rederi
15.11.1 Company Snapshot
15.11.2 Company Overview
15.11.3 Product Benchmarking
15.11.4 Strategic Outlook
15.12 Havila Shipping ASA
15.12.1 Company Snapshot
15.12.2 Company Overview
15.12.3 Financial Analysis
15.12.3.1 Net Revenue, 2018-2022
15.12.3.2 Regional Revenue Share, 2022 (%)
15.12.3.3 Business Segment Revenue Share, 2022 (%)
15.12.4 Product Benchmarking
15.13 Kawasaki Kisen Kaisha Ltd
15.13.1 Company Snapshot
15.13.2 Company Overview
15.13.3 Financial Analysis
15.13.3.1 Net Revenue, 2018-2022
15.13.3.2 Business Segment Revenue Share, 2022 (%)
15.13.4 Product Benchmarking
15.14 MMA Offshore Ltd
15.14.1 Company Snapshot
15.14.2 Company Overview
15.14.3 Financial Analysis
15.14.3.1 Net Revenue, 2018-2022
15.14.3.2 Regional Revenue Share, 2022 (%)
15.14.3.3 Business Segment Revenue Share, 2022 (%)
15.14.4 Product Benchmarking
15.14.5 Strategic Outlook
15.15 Grupo CBO
15.15.1 Company Snapshot
15.15.2 Company Overview
15.15.3 Product Benchmarking
15.16 Harvey Gulf International Marine
15.16.1 Company Snapshot
15.16.2 Company Overview
15.16.3 Product Benchmarking
15.16.4 Strategic Outlook
15.17 Edison Chouest Offshore
15.17.1 Company Snapshot
15.17.2 Company Overview
15.17.3 Product Benchmarking
15.17.4 Strategic Outlook
16 Conclusion and Recommendations
16.1 Concluding Remarks from Visiongain
16.2 Recommendations for Market Players
ページTOPに戻る
Press Release
List of Tables
Table 1 Offshore Support Vessel Market Snapshot, 2024 & 2034 (US$ Billion, CAGR %)
Table 2 Global Offshore Support Vessel Market by Region, 2024-2034 (US$ Bn, AGR (%), CAGR (%)) (V-Shaped Recovery Scenario)
Table 3 Global Offshore Support Vessel Market by Region, 2024-2034 (US$ Bn, AGR (%), CAGR (%)) (U-Shaped Recovery Scenario)
Table 4 Global Offshore Support Vessel Market by Region, 2024-2034 (US$ Bn, AGR (%), CAGR (%)) (W-Shaped Recovery Scenario)
Table 5 Global Offshore Support Vessel Market by Region, 2024-2034 (US$ Bn, AGR (%), CAGR (%)) (L-Shaped Recovery Scenario)
Table 6 Global Offshore Support Vessel Market by Application, 2024-2034 (US$ Bn, AGR (%), CAGR (%))
Table 7 Deepwater Market by Region, 2024-2034 (US$ Bn, AGR (%), CAGR (%))
Table 8 Shallow Water Market by Region, 2024-2034 (US$ Bn, AGR (%), CAGR (%))
Table 9 Global Offshore Support Vessel Market by Material, 2024-2034 (US$ Bn, AGR (%), CAGR (%))
Table 10 Steel Market by Region, 2024-2034 (US$ Bn, AGR (%), CAGR (%))
Table 11 Aluminium Market by Region, 2024-2034 (US$ Bn, AGR (%), CAGR (%))
Table 12 Composite Materials Market by Region, 2024-2034 (US$ Bn, AGR (%), CAGR (%))
Table 13 Global Offshore Support Vessel Market by Vessel Size, 2024-2034 (US$ Bn, AGR (%), CAGR (%))
Table 14 Small Vessels Market by Region, 2024-2034 (US$ Bn, AGR (%), CAGR (%))
Table 15 Medium Vessels Market by Region, 2024-2034 (US$ Bn, AGR (%), CAGR (%))
Table 16 Large Vessels Market by Region, 2024-2034 (US$ Bn, AGR (%), CAGR (%))
Table 17 Very Large Vessels Market by Region, 2024-2034 (US$ Bn, AGR (%), CAGR (%))
Table 18 Global Offshore Support Vessel Market by End-Use, 2024-2034 (US$ Bn, AGR (%), CAGR (%))
Table 19 Oil and Gas Market by Region, 2024-2034 (US$ Bn, AGR (%), CAGR (%))
Table 20 Offshore Wind Market by Region, 2024-2034 (US$ Bn, AGR (%), CAGR (%))
Table 21 Offshore Patrolling Market by Region, 2024-2034 (US$ Bn, AGR (%), CAGR (%))
Table 22 Research and Surveying Market by Region, 2024-2034 (US$ Bn, AGR (%), CAGR (%))
Table 23 Other End-Uses Market by Region, 2024-2034 (US$ Bn, AGR (%), CAGR (%))
Table 24 Global Offshore Support Vessel Market by Type, 2024-2034 (US$ Bn, AGR (%), CAGR (%))
Table 25 Anchor-handling Tug Supply Vessels Market by Region, 2024-2034 (US$ Bn, AGR (%), CAGR (%))
Table 26 Platform Support Vessels Market by Region, 2024-2034 (US$ Bn, AGR (%), CAGR (%))
Table 27 Multipurpose Support Vessels Market by Region, 2024-2034 (US$ Bn, AGR (%), CAGR (%))
Table 28 Standby and Rescue Vessels Market by Region, 2024-2034 (US$ Bn, AGR (%), CAGR (%))
Table 29 Crew Vessels Market by Region, 2024-2034 (US$ Bn, AGR (%), CAGR (%))
Table 30 Other Types Market by Region, 2024-2034 (US$ Bn, AGR (%), CAGR (%))
Table 31 Global Offshore Support Vessel Market by Region, 2024-2034 (US$ Bn, AGR (%), CAGR (%))
Table 32 North America Offshore Support Vessel Market by Value, 2024-2034 (US$ Bn, AGR (%), CAGR (%))
Table 33 North America Offshore Support Vessel Market by Country, 2024-2034 (US$ Bn, AGR (%), CAGR (%))
Table 34 North America Offshore Support Vessel Market by Application, 2024-2034 (US$ Bn, AGR (%), CAGR (%))
Table 35 North America Offshore Support Vessel Market by Material, 2024-2034 (US$ Bn, AGR (%), CAGR (%))
Table 36 North America Offshore Support Vessel Market by Vessel Size, 2024-2034 (US$ Bn, AGR (%), CAGR (%))
Table 37 North America Offshore Support Vessel Market by End-Use, 2024-2034 (US$ Bn, AGR (%), CAGR (%))
Table 38 North America Offshore Support Vessel Market by Type, 2024-2034 (US$ Bn, AGR (%), CAGR (%))
Table 39 US Offshore Support Vessel Market by Value, 2024-2034 (US$ Bn, AGR (%), CAGR (%))
Table 40 Canada Offshore Support Vessel Market by Value, 2024-2034 (US$ Bn, AGR (%), CAGR (%))
Table 41 Europe Offshore Support Vessel Market by Value, 2024-2034 (US$ Bn, AGR (%), CAGR (%))
Table 42 Europe Offshore Support Vessel Market by Country, 2024-2034 (US$ Bn, AGR (%), CAGR (%))
Table 43 Europe Offshore Support Vessel Market by Application, 2024-2034 (US$ Bn, AGR (%), CAGR (%))
Table 44 Europe Offshore Support Vessel Market by Material, 2024-2034 (US$ Bn, AGR (%), CAGR (%))
Table 45 Europe Offshore Support Vessel Market by Vessel Size, 2024-2034 (US$ Bn, AGR (%), CAGR (%))
Table 46 Europe Offshore Support Vessel Market by End-Use, 2024-2034 (US$ Bn, AGR (%), CAGR (%))
Table 47 Europe Offshore Support Vessel Market by Type, 2024-2034 (US$ Bn, AGR (%), CAGR (%))
Table 48 Norway Offshore Support Vessel Market by Value, 2024-2034 (US$ Bn, AGR (%), CAGR (%))
Table 49 UK Offshore Support Vessel Market by Value, 2024-2034 (US$ Bn, AGR (%), CAGR (%))
Table 50 France Offshore Support Vessel Market by Value, 2024-2034 (US$ Bn, AGR (%), CAGR (%))
Table 51 Denmark Offshore Support Vessel Market by Value, 2024-2034 (US$ Bn, AGR (%), CAGR (%))
Table 52 Russia Offshore Support Vessel Market by Value, 2024-2034 (US$ Bn, AGR (%), CAGR (%))
Table 53 Rest of Europe Offshore Support Vessel Market by Value, 2024-2034 (US$ Bn, AGR (%), CAGR (%))
Table 54 Asia-Pacific Offshore Support Vessel Market by Value, 2024-2034 (US$ Bn, AGR (%), CAGR (%))
Table 55 Asia-Pacific Offshore Support Vessel Market by Country, 2024-2034 (US$ Bn, AGR (%), CAGR (%))
Table 56 Asia-Pacific Offshore Support Vessel Market by Application, 2024-2034 (US$ Bn, AGR (%), CAGR (%))
Table 57 Asia-Pacific Offshore Support Vessel Market by Material, 2024-2034 (US$ Bn, AGR (%), CAGR (%))
Table 58 Asia-Pacific Offshore Support Vessel Market by Vessel Size, 2024-2034 (US$ Bn, AGR (%), CAGR (%))
Table 59 Asia-Pacific Offshore Support Vessel Market by End-Use, 2024-2034 (US$ Bn, AGR (%), CAGR (%))
Table 60 Asia-Pacific Offshore Support Vessel Market by Type, 2024-2034 (US$ Bn, AGR (%), CAGR (%))
Table 61 China Offshore Support Vessel Market by Value, 2024-2034 (US$ Bn, AGR (%), CAGR (%))
Table 62 India Offshore Support Vessel Market by Value, 2024-2034 (US$ Bn, AGR (%), CAGR (%))
Table 63 Indonesia Offshore Support Vessel Market by Value, 2024-2034 (US$ Bn, AGR (%), CAGR (%))
Table 64 Malaysia Offshore Support Vessel Market by Value, 2024-2034 (US$ Bn, AGR (%), CAGR (%))
Table 65 Australia Offshore Support Vessel Market by Value, 2024-2034 (US$ Bn, AGR (%), CAGR (%))
Table 66 Rest of Asia-Pacific Offshore Support Vessel Market by Value, 2024-2034 (US$ Bn, AGR (%), CAGR (%))
Table 67 Middle East & Africa Offshore Support Vessel Market by Value, 2024-2034 (US$ Bn, AGR (%), CAGR (%))
Table 68 Middle East & Africa Offshore Support Vessel Market by Country, 2024-2034 (US$ Bn, AGR (%), CAGR (%))
Table 69 Middle East & Africa Offshore Support Vessel Market by Application, 2024-2034 (US$ Bn, AGR (%), CAGR (%))
Table 70 Middle East & Africa Offshore Support Vessel Market by Material, 2024-2034 (US$ Bn, AGR (%), CAGR (%))
Table 71 Middle East & Africa Offshore Support Vessel Market by Vessel Size, 2024-2034 (US$ Bn, AGR (%), CAGR (%))
Table 72 Middle East & Africa Offshore Support Vessel Market by End-Use, 2024-2034 (US$ Bn, AGR (%), CAGR (%))
Table 73 Middle East & Africa Offshore Support Vessel Market by Type, 2024-2034 (US$ Bn, AGR (%), CAGR (%))
Table 74 GCC Offshore Support Vessel Market by Value, 2024-2034 (US$ Bn, AGR (%), CAGR (%))
Table 75 South Africa Offshore Support Vessel Market by Value, 2024-2034 (US$ Bn, AGR (%), CAGR (%))
Table 76 Rest of Middle East & Africa Offshore Support Vessel Market by Value, 2024-2034 (US$ Bn, AGR (%), CAGR (%))
Table 77 Latin America Offshore Support Vessel Market by Value, 2024-2034 (US$ Bn, AGR (%), CAGR (%))
Table 78 Latin America Offshore Support Vessel Market by Country, 2024-2034 (US$ Bn, AGR (%), CAGR (%))
Table 79 Latin America Offshore Support Vessel Market by Application, 2024-2034 (US$ Bn, AGR (%), CAGR (%))
Table 80 Latin America Offshore Support Vessel Market by Material, 2024-2034 (US$ Bn, AGR (%), CAGR (%))
Table 81 Latin America Offshore Support Vessel Market by Vessel Size, 2024-2034 (US$ Bn, AGR (%), CAGR (%))
Table 82 Latin America Offshore Support Vessel Market by End-Use, 2024-2034 (US$ Bn, AGR (%), CAGR (%))
Table 83 Latin America Offshore Support Vessel Market by Type, 2024-2034 (US$ Bn, AGR (%), CAGR (%))
Table 84 Brazil Offshore Support Vessel Market by Value, 2024-2034 (US$ Bn, AGR (%), CAGR (%))
Table 85 Mexico Offshore Support Vessel Market by Value, 2024-2034 (US$ Bn, AGR (%), CAGR (%))
Table 86 Rest of Latin America Offshore Support Vessel Market by Value, 2024-2034 (US$ Bn, AGR (%), CAGR (%))
Table 87 Strategic Outlook - Contract
Table 88 DOF Group ASA: Key Details, (CEO, HQ, Revenue, Founded, No. of Employees, Company Type, Website, Business Segment)
Table 89 DOF Group ASA: Product Benchmarking
Table 90 DOF Group ASA: Strategic Outlook
Table 91 Solstad Offshore ASA: Key Details, (CEO, HQ, Revenue, Founded, No. of Employees, Company Type, Website, Business Segment)
Table 92 Solstad Offshore ASA: Product Benchmarking
Table 93 Solstad Offshore ASA: Strategic Outlook
Table 94 Tidewater Inc.: Key Details, (CEO, HQ, Revenue, Founded, No. of Employees, Company Type, Website, Business Segment)
Table 95 Tidewater Inc.: Product Benchmarking
Table 96 Tidewater Inc.: Strategic Outlook
Table 97 A.P. Møller – Mærsk A/S: Key Details, (CEO, HQ, Revenue, Founded, No. of Employees, Company Type, Website, Business Segment)
Table 98 A.P. Møller – Mærsk A/S: Product Benchmarking
Table 99 A.P. Møller – Mærsk A/S: Strategic Outlook
Table 100 Siem Offshore: Key Details, (CEO, HQ, Revenue, Founded, No. of Employees, Company Type, Website, Business Segment)
Table 101 Siem Offshore: Product Benchmarking
Table 102 Siem Offshore: Strategic Outlook
Table 103 Bourbon: Key Details, (CEO, HQ, Revenue, Founded, No. of Employees, Company Type, Website, Business Segment)
Table 104 Bourbon: Product Benchmarking
Table 105 Vroon: Key Details, (CEO, HQ, Revenue, Founded, No. of Employees, Company Type, Website, Business Segment)
Table 106 Vroon: Product Benchmarking
Table 107 Vroon: Strategic Outlook
Table 108 Seacor Marine Holdings Inc: Key Details, (CEO, HQ, Revenue, Founded, No. of Employees, Company Type, Website, Business Segment)
Table 109 Seacor Marine Holdings Inc: Product Benchmarking
Table 110 Seacor Marine Holdings Inc: Strategic Outlook
Table 111 Østensjø Rederi: Key Details, (CEO, HQ, Revenue, Founded, No. of Employees, Company Type, Website, Business Segment)
Table 112 Østensjø Rederi: Product Benchmarking
Table 113 Østensjø Rederi: Strategic Outlook
Table 114 Havila Shipping ASA: Key Details, (CEO, HQ, Revenue, Founded, No. of Employees, Company Type, Website, Business Segment)
Table 115 Havila Shipping ASA: Product Benchmarking
Table 116 Kawasaki Kisen Kaisha Ltd: Key Details, (CEO, HQ, Revenue, Founded, No. of Employees, Company Type, Website, Business Segment)
Table 117 Kawasaki Kisen Kaisha Ltd: Product Benchmarking
Table 118 MMA Offshore Ltd: Key Details, (CEO, HQ, Revenue, Founded, No. of Employees, Company Type, Website, Business Segment)
Table 119 MMA Offshore Ltd: Product Benchmarking
Table 120 MMA Offshore Ltd: Strategic Outlook
Table 121 Grupo CBO: Key Details, (CEO, HQ, Revenue, Founded, No. of Employees, Company Type, Website, Business Segment)
Table 122 Grupo CBO: Product Benchmarking
Table 123 Harvey Gulf International Marine: Key Details, (CEO, HQ, Revenue, Founded, No. of Employees, Company Type, Website, Business Segment)
Table 124 Harvey Gulf International Marine: Product Benchmarking
Table 125 Harvey Gulf International Marine: Strategic Outlook
Table 126 Edison Chouest Offshore: Key Details, (CEO, HQ, Revenue, Founded, No. of Employees, Company Type, Website, Business Segment)
Table 127 Edison Chouest Offshore: Product Benchmarking
Table 128 Edison Chouest Offshore: Strategic Outlook
List of Figures
Figure 1 Offshore Support Vessel Market Segmentation
Figure 2 Offshore Support Vessel Market by Application: Market Attractiveness Index
Figure 3 Offshore Support Vessel Market by Material: Market Attractiveness Index
Figure 4 Offshore Support Vessel Market by Vessel Size: Market Attractiveness Index
Figure 5 Offshore Support Vessel Market by End-Use: Market Attractiveness Index
Figure 6 Offshore Support Vessel Market by Type: Market Attractiveness Index
Figure 7 Offshore Support Vessel Market Attractiveness Index by Region
Figure 8 Offshore Support Vessel Market: Market Dynamics
Figure 9 Offshore Support Vessel Market: Porter’s Five Forces Analysis
Figure 10 Global Offshore Support Vessel Market Share Forecast by COVID, 2024-2034 (%)
Figure 11 Global Offshore Support Vessel Market by Region, 2024-2034 (US$ Bn, AGR (%)) (V-Shaped Recovery Scenario)
Figure 12 Global Offshore Support Vessel Market by Region, 2024-2034 (US$ Bn, AGR (%)) (U-Shaped Recovery Scenario)
Figure 13 Global Offshore Support Vessel Market by Region, 2024-2034 (US$ Bn, AGR (%)) (W-Shaped Recovery Scenario)
Figure 14 Global Offshore Support Vessel Market by Region, 2024-2034 (US$ Bn, AGR (%)) (L-Shaped Recovery Scenario)
Figure 15 Offshore Support Vessel Market: PEST Analysis
Figure 16 Offshore Support Vessel Market by Application: Market Attractiveness Index
Figure 17 Global Offshore Support Vessel Market by Application, 2024-2034 (US$ Bn, AGR (%))
Figure 18 Offshore Support Vessel Market Share Forecast by Application, 2024, 2029, 2034 (%)
Figure 19 Deepwater Market by Region, 2024-2034 (US$ Bn, AGR (%))
Figure 20 Deepwater Market Share Forecast by Region, 2024 & 2034 (%)
Figure 21 Shallow Water Market by Region, 2024-2034 (US$ Bn, AGR (%))
Figure 22 Shallow Water Market Share Forecast by Region, 2024 & 2034 (%)
Figure 23 Offshore Support Vessel Market by Material: Market Attractiveness Index
Figure 24 Global Offshore Support Vessel Market by Material, 2024-2034 (US$ Bn, AGR (%))
Figure 25 Offshore Support Vessel Market Share Forecast by Material, 2024, 2029, 2034 (%)
Figure 26 Steel Market by Region, 2024-2034 (US$ Bn, AGR (%))
Figure 27 Steel Market Share Forecast by Region, 2024 & 2034 (%)
Figure 28 Aluminium Market by Region, 2024-2034 (US$ Bn, AGR (%))
Figure 29 Aluminium Market Share Forecast by Region, 2024 & 2034 (%)
Figure 30 Composite Materials Market by Region, 2024-2034 (US$ Bn, AGR (%))
Figure 31 Composite Materials Market Share Forecast by Region, 2024 & 2034 (%)
Figure 32 Offshore Support Vessel Market by Vessel Size: Market Attractiveness Index
Figure 33 Global Offshore Support Vessel Market by Vessel Size, 2024-2034 (US$ Bn, AGR (%))
Figure 34 Offshore Support Vessel Market Share Forecast by Vessel Size, 2024, 2029, 2034 (%)
Figure 35 Small Vessels Market by Region, 2024-2034 (US$ Bn, AGR (%))
Figure 36 Small Vessels Market Share Forecast by Region, 2024 & 2034 (%)
Figure 37 Medium Vessels Market by Region, 2024-2034 (US$ Bn, AGR (%))
Figure 38 Medium Vessels Market Share Forecast by Region, 2024 & 2034 (%)
Figure 39 Large Vessels Market by Region, 2024-2034 (US$ Bn, AGR (%))
Figure 40 Large Vessels Market Share Forecast by Region, 2024 & 2034 (%)
Figure 41 Very Large Vessels Market by Region, 2024-2034 (US$ Bn, AGR (%))
Figure 42 Very Large Vessels Market Share Forecast by Region, 2024 & 2034 (%)
Figure 43 Offshore Support Vessel Market by End-Use: Market Attractiveness Index
Figure 44 Global Offshore Support Vessel Market by End-Use, 2024-2034 (US$ Bn, AGR (%))
Figure 45 Offshore Support Vessel Market Share Forecast by End-Use, 2024, 2029, 2034 (%)
Figure 46 Oil and Gas Market by Region, 2024-2034 (US$ Bn, AGR (%))
Figure 47 Oil and Gas Market Share Forecast by Region, 2024 & 2034 (%)
Figure 48 Offshore Wind Market by Region, 2024-2034 (US$ Bn, AGR (%))
Figure 49 Offshore Wind Market Share Forecast by Region, 2024 & 2034 (%)
Figure 50 Offshore Patrolling Market by Region, 2024-2034 (US$ Bn, AGR (%))
Figure 51 Offshore Patrolling Market Share Forecast by Region, 2024 & 2034 (%)
Figure 52 Research and Surveying Market by Region, 2024-2034 (US$ Bn, AGR (%))
Figure 53 Research and Surveying Market Share Forecast by Region, 2024 & 2034 (%)
Figure 54 Other End-Uses Market by Region, 2024-2034 (US$ Bn, AGR (%))
Figure 55 Other End-Uses Market Share Forecast by Region, 2024 & 2034 (%)
Figure 56 Offshore Support Vessel Market by Type: Market Attractiveness Index
Figure 57 Global Offshore Support Vessel Market by Type, 2024-2034 (US$ Bn, AGR (%))
Figure 58 Offshore Support Vessel Market Share Forecast by Type, 2024, 2029, 2034 (%)
Figure 59 Anchor-handling Tug Supply Vessels Market by Region, 2024-2034 (US$ Bn, AGR (%))
Figure 60 Anchor-handling Tug Supply Vessels Market Share Forecast by Region, 2024 & 2034 (%)
Figure 61 Platform Support Vessels Market by Region, 2024-2034 (US$ Bn, AGR (%))
Figure 62 Platform Support Vessels Market Share Forecast by Region, 2024 & 2034 (%)
Figure 63 Multipurpose Support Vessels Market by Region, 2024-2034 (US$ Bn, AGR (%))
Figure 64 Multipurpose Support Vessels Market Share Forecast by Region, 2024 & 2034 (%)
Figure 65 Standby and Rescue Vessels Market by Region, 2024-2034 (US$ Bn, AGR (%))
Figure 66 Standby and Rescue Vessels Market Share Forecast by Region, 2024 & 2034 (%)
Figure 67 Crew Vessels Market by Region, 2024-2034 (US$ Bn, AGR (%))
Figure 68 Crew Vessels Market Share Forecast by Region, 2024 & 2034 (%)
Figure 69 Other Types Market by Region, 2024-2034 (US$ Bn, AGR (%))
Figure 70 Other Types Market Share Forecast by Region, 2024 & 2034 (%)
Figure 71 Offshore Support Vessel Market Forecast by Region 2024 and 2034 (Revenue, CAGR%)
Figure 72 Offshore Support Vessel Market Share Forecast by Region 2024, 2029, 2034 (%)
Figure 73 Global Offshore Support Vessel Market by Region, 2024-2034 (US$ Bn, AGR (%))
Figure 74 North America Offshore Support Vessel Market Attractiveness Index
Figure 75 North America Offshore Support Vessel Market by Region, 2024, 2029 & 2034 (US$ Billion)
Figure 76 North America Offshore Support Vessel Market by Value, 2024-2034 (US$ Bn, AGR (%))
Figure 77 North America Offshore Support Vessel Market by Country, 2024-2034 (US$ Bn, AGR (%))
Figure 78 North America Offshore Support Vessel Market Share Forecast by Country, 2024 & 2034 (%)
Figure 79 North America Offshore Support Vessel Market by Application, 2024-2034 (US$ Bn, AGR (%))
Figure 80 North America Offshore Support Vessel Market Share Forecast Application, 2024 & 2034 (%)
Figure 81 North America Offshore Support Vessel Market by Material, 2024-2034 (US$ Bn, AGR (%))
Figure 82 North America Offshore Support Vessel Market Share Forecast by Material, 2024 & 2034 (%)
Figure 83 North America Offshore Support Vessel Market by Vessel Size, 2024-2034 (US$ Bn, AGR (%))
Figure 84 North America Offshore Support Vessel Market Share Forecast by Vessel Size, 2024 & 2034 (%)
Figure 85 North America Offshore Support Vessel Market by End-Use, 2024-2034 (US$ Bn, AGR (%))
Figure 86 North America Offshore Support Vessel Market Share Forecast by End-Use, 2024 & 2034 (%)
Figure 87 North America Offshore Support Vessel Market by Type, 2024-2034 (US$ Bn, AGR (%))
Figure 88 North America Offshore Support Vessel Market Share Forecast by Type, 2024 & 2034 (%)
Figure 89 US Offshore Support Vessel Market by Value, 2024-2034 (US$ Bn, AGR (%))
Figure 90 Canada Offshore Support Vessel Market by Value, 2024-2034 (US$ Bn, AGR (%))
Figure 91 Europe Offshore Support Vessel Market Attractiveness Index
Figure 92 Europe Offshore Support Vessel Market by Region, 2024, 2029 & 2034 (US$ Billion)
Figure 93 Europe Offshore Support Vessel Market by Value, 2024-2034 (US$ Bn, AGR (%))
Figure 94 Europe Offshore Support Vessel Market by Country, 2024-2034 (US$ Bn, AGR (%))
Figure 95 Europe Offshore Support Vessel Market Share Forecast by Country, 2024 & 2034 (%)
Figure 96 Europe Offshore Support Vessel Market by Application, 2024-2034 (US$ Bn, AGR (%))
Figure 97 Europe Offshore Support Vessel Market Share Forecast Application, 2024 & 2034 (%)
Figure 98 Europe Offshore Support Vessel Market by Material, 2024-2034 (US$ Bn, AGR (%))
Figure 99 Europe Offshore Support Vessel Market Share Forecast by Material, 2024 & 2034 (%)
Figure 100 Europe Offshore Support Vessel Market by Vessel Size, 2024-2034 (US$ Bn, AGR (%))
Figure 101 Europe Offshore Support Vessel Market Share Forecast by Vessel Size, 2024 & 2034 (%)
Figure 102 Europe Offshore Support Vessel Market by End-Use, 2024-2034 (US$ Bn, AGR (%))
Figure 103 Europe Offshore Support Vessel Market Share Forecast by End-Use, 2024 & 2034 (%)
Figure 104 Europe Offshore Support Vessel Market by Type, 2024-2034 (US$ Bn, AGR (%))
Figure 105 Europe Offshore Support Vessel Market Share Forecast by Type, 2024 & 2034 (%)
Figure 106 Norway Offshore Support Vessel Market by Value, 2024-2034 (US$ Bn, AGR (%))
Figure 107 UK Offshore Support Vessel Market by Value, 2024-2034 (US$ Bn, AGR (%))
Figure 108 France Offshore Support Vessel Market by Value, 2024-2034 (US$ Bn, AGR (%))
Figure 109 Denmark Offshore Support Vessel Market by Value, 2024-2034 (US$ Bn, AGR (%))
Figure 110 Russia Offshore Support Vessel Market by Value, 2024-2034 (US$ Bn, AGR (%))
Figure 111 Rest of Europe Offshore Support Vessel Market by Value, 2024-2034 (US$ Bn, AGR (%))
Figure 112 Asia-Pacific Offshore Support Vessel Market Attractiveness Index
Figure 113 Asia-Pacific Offshore Support Vessel Market by Region, 2024, 2029 & 2034 (US$ Billion)
Figure 114 Asia-Pacific Offshore Support Vessel Market by Value, 2024-2034 (US$ Bn, AGR (%))
Figure 115 Asia-Pacific Offshore Support Vessel Market by Country, 2024-2034 (US$ Bn, AGR (%))
Figure 116 Asia-Pacific Offshore Support Vessel Market Share Forecast by Country, 2024 & 2034 (%)
Figure 117 Asia-Pacific Offshore Support Vessel Market by Application, 2024-2034 (US$ Bn, AGR (%))
Figure 118 Asia-Pacific Offshore Support Vessel Market Share Forecast Application, 2024 & 2034 (%)
Figure 119 Asia-Pacific Offshore Support Vessel Market by Material, 2024-2034 (US$ Bn, AGR (%))
Figure 120 Asia-Pacific Offshore Support Vessel Market Share Forecast by Material, 2024 & 2034 (%)
Figure 121 Asia-Pacific Offshore Support Vessel Market by Vessel Size, 2024-2034 (US$ Bn, AGR (%))
Figure 122 Asia-Pacific Offshore Support Vessel Market Share Forecast by Vessel Size, 2024 & 2034 (%)
Figure 123 Asia-Pacific Offshore Support Vessel Market by End-Use, 2024-2034 (US$ Bn, AGR (%))
Figure 124 Asia-Pacific Offshore Support Vessel Market Share Forecast by End-Use, 2024 & 2034 (%)
Figure 125 Asia-Pacific Offshore Support Vessel Market by Type, 2024-2034 (US$ Bn, AGR (%))
Figure 126 Asia-Pacific Offshore Support Vessel Market Share Forecast by Type, 2024 & 2034 (%)
Figure 127 China Offshore Support Vessel Market by Value, 2024-2034 (US$ Bn, AGR (%))
Figure 128 India Offshore Support Vessel Market by Value, 2024-2034 (US$ Bn, AGR (%))
Figure 129 Indonesia Offshore Support Vessel Market by Value, 2024-2034 (US$ Bn, AGR (%))
Figure 130 Malaysia Offshore Support Vessel Market by Value, 2024-2034 (US$ Bn, AGR (%))
Figure 131 Australia Offshore Support Vessel Market by Value, 2024-2034 (US$ Bn, AGR (%))
Figure 132 Rest of Asia-Pacific Offshore Support Vessel Market by Value, 2024-2034 (US$ Bn, AGR (%))
Figure 133 Middle East and Africa Offshore Support Vessel Market Attractiveness Index
Figure 134 Middle East and Africa Offshore Support Vessel Market by Region, 2024, 2029 & 2034 (US$ Billion)
Figure 135 Middle East & Africa Offshore Support Vessel Market by Value, 2024-2034 (US$ Bn, AGR (%))
Figure 136 Middle East & Africa Offshore Support Vessel Market by Country, 2024-2034 (US$ Bn, AGR (%))
Figure 137 Middle East and Africa Offshore Support Vessel Market Share Forecast by Country, 2024 & 2034 (%)
Figure 138 Middle East & Africa Offshore Support Vessel Market by Application, 2024-2034 (US$ Bn, AGR (%))
Figure 139 Middle East and Africa Offshore Support Vessel Market Share Forecast Application, 2024 & 2034 (%)
Figure 140 Middle East & Africa Offshore Support Vessel Market by Material, 2024-2034 (US$ Bn, AGR (%))
Figure 141 Middle East and Africa Offshore Support Vessel Market Share Forecast by Material, 2024 & 2034 (%)
Figure 142 Middle East & Africa Offshore Support Vessel Market by Vessel Size, 2024-2034 (US$ Bn, AGR (%))
Figure 143 Middle East and Africa Offshore Support Vessel Market Share Forecast by Vessel Size, 2024 & 2034 (%)
Figure 144 Middle East & Africa Offshore Support Vessel Market by End-Use, 2024-2034 (US$ Bn, AGR (%))
Figure 145 Middle East and Africa Offshore Support Vessel Market Share Forecast by End-Use, 2024 & 2034 (%)
Figure 146 Middle East & Africa Offshore Support Vessel Market by Type, 2024-2034 (US$ Bn, AGR (%))
Figure 147 Middle East and Africa Offshore Support Vessel Market Share Forecast by Type, 2024 & 2034 (%)
Figure 148 GCC Offshore Support Vessel Market by Value, 2024-2034 (US$ Bn, AGR (%))
Figure 149 South Africa Offshore Support Vessel Market by Value, 2024-2034 (US$ Bn, AGR (%))
Figure 150 Rest of Middle East & Africa Offshore Support Vessel Market by Value, 2024-2034 (US$ Bn, AGR (%))
Figure 151 Latin America Offshore Support Vessel Market Attractiveness Index
Figure 152 Latin America Offshore Support Vessel Market by Region, 2024, 2029 & 2034 (US$ Billion)
Figure 153 Latin America Offshore Support Vessel Market by Value, 2024-2034 (US$ Bn, AGR (%))
Figure 154 Latin America Offshore Support Vessel Market by Country, 2024-2034 (US$ Bn, AGR (%))
Figure 155 Latin America Offshore Support Vessel Market Share Forecast by Country, 2024 & 2034 (%)
Figure 156 Latin America Offshore Support Vessel Market by Application, 2024-2034 (US$ Bn, AGR (%))
Figure 157 Latin America Offshore Support Vessel Market Share Forecast Application, 2024 & 2034 (%)
Figure 158 Latin America Offshore Support Vessel Market by Material, 2024-2034 (US$ Bn, AGR (%))
Figure 159 Latin America Offshore Support Vessel Market Share Forecast by Material, 2024 & 2034 (%)
Figure 160 Latin America Offshore Support Vessel Market by Vessel Size, 2024-2034 (US$ Bn, AGR (%))
Figure 161 Latin America Offshore Support Vessel Market Share Forecast by Vessel Size, 2024 & 2034 (%)
Figure 162 Latin America Offshore Support Vessel Market by End-Use, 2024-2034 (US$ Bn, AGR (%))
Figure 163 Latin America Offshore Support Vessel Market Share Forecast by End-Use, 2024 & 2034 (%)
Figure 164 Latin America Offshore Support Vessel Market by Type, 2024-2034 (US$ Bn, AGR (%))
Figure 165 Latin America Offshore Support Vessel Market Share Forecast by Type, 2024 & 2034 (%)
Figure 166 Brazil Offshore Support Vessel Market by Value, 2024-2034 (US$ Bn, AGR (%))
Figure 167 Mexico Offshore Support Vessel Market by Value, 2024-2034 (US$ Bn, AGR (%))
Figure 168 Rest of Latin America Offshore Support Vessel Market by Value, 2024-2034 (US$ Bn, AGR (%))
Figure 169 Offshore Support Vessel Market: Company Share, 2023
Figure 170 DOF Group ASA.: Net Revenue, 2018-2022 (US$ Million, AGR%)
Figure 171 DOF Group ASA.: Business Segment Revenue Share, 2022 (%)
Figure 172 Solstad Offshore ASA.: Net Revenue, 2018-2022 (US$ Million, AGR%)
Figure 173 Solstad Offshore ASA.: Regional Revenue Share, 2022 (%)
Figure 174 Solstad Offshore ASA.: Business Segment Revenue Share, 2022 (%)
Figure 175 Tidewater Inc..: Net Revenue, 2018-2022 (US$ Million, AGR%)
Figure 176 Tidewater Inc..: Regional Revenue Share, 2022 (%)
Figure 177 A.P. Møller – Mærsk A/S.: Net Revenue, 2018-2022 (US$ Million, AGR%)
Figure 178 A.P. Møller – Mærsk A/S.: Regional Revenue Share, 2022 (%)
Figure 179 A.P. Møller – Mærsk A/S.: Business Segment Revenue Share, 2022 (%)
Figure 180 Siem Offshore.: Net Revenue, 2018-2022 (US$ Million, AGR%)
Figure 181 Siem Offshore.: Business Segment Revenue Share, 2022 (%)
Figure 182 Seacor Marine Holdings Inc.: Net Revenue, 2018-2022 (US$ Million, AGR%)
Figure 183 Seacor Marine Holdings Inc.: Regional Revenue Share, 2022 (%)
Figure 184 Havila Shipping ASA.: Net Revenue, 2018-2022 (US$ Million, AGR%)
Figure 185 Havila Shipping ASA.: Regional Revenue Share, 2022 (%)
Figure 186 Havila Shipping ASA.: Business Segment Revenue Share, 2022 (%)
Figure 187 Kawasaki Kisen Kaisha Ltd.: Net Revenue, 2018-2022 (US$ Million, AGR%)
Figure 188 Kawasaki Kisen Kaisha Ltd.: Business Segment Revenue Share, 2022 (%)
Figure 189 MMA Offshore Ltd.: Net Revenue, 2018-2022 (US$ Million, AGR%)
Figure 190 MMA Offshore Ltd.: Regional Revenue Share, 2022 (%)
Figure 191 MMA Offshore Ltd.: Business Segment Revenue Share, 2022 (%)
ページTOPに戻る
Visiongain社のエネルギーと資源分野での最新刊レポート
本レポートと同じKEY WORD(offshore support)の最新刊レポート
- 本レポートと同じKEY WORDの最新刊レポートはありません。
よくあるご質問
Visiongain社はどのような調査会社ですか?
英国の調査会社ヴィジョンゲイン社(Visiongain)は、通信とエネルギーのほか、自動車や化学・医薬品、金属など、広範な市場を対象に調査を行っています。自動車市場については、市場全般に関する調査のほ... もっと見る
調査レポートの納品までの日数はどの程度ですか?
在庫のあるものは速納となりますが、平均的には 3-4日と見て下さい。
但し、一部の調査レポートでは、発注を受けた段階で内容更新をして納品をする場合もあります。
発注をする前のお問合せをお願いします。
注文の手続きはどのようになっていますか?
1)お客様からの御問い合わせをいただきます。
2)見積書やサンプルの提示をいたします。
3)お客様指定、もしくは弊社の発注書をメール添付にて発送してください。
4)データリソース社からレポート発行元の調査会社へ納品手配します。
5) 調査会社からお客様へ納品されます。最近は、pdfにてのメール納品が大半です。
お支払方法の方法はどのようになっていますか?
納品と同時にデータリソース社よりお客様へ請求書(必要に応じて納品書も)を発送いたします。
お客様よりデータリソース社へ(通常は円払い)の御振り込みをお願いします。
請求書は、納品日の日付で発行しますので、翌月最終営業日までの当社指定口座への振込みをお願いします。振込み手数料は御社負担にてお願いします。
お客様の御支払い条件が60日以上の場合は御相談ください。
尚、初めてのお取引先や個人の場合、前払いをお願いすることもあります。ご了承のほど、お願いします。
データリソース社はどのような会社ですか?
当社は、世界各国の主要調査会社・レポート出版社と提携し、世界各国の市場調査レポートや技術動向レポートなどを日本国内の企業・公官庁及び教育研究機関に提供しております。
世界各国の「市場・技術・法規制などの」実情を調査・収集される時には、データリソース社にご相談ください。
お客様の御要望にあったデータや情報を抽出する為のレポート紹介や調査のアドバイスも致します。
|
|

