石炭火力発電の廃止措置市場レポート:2023-2033
Coal Power Decommissioning Market Report 2023-2033
レポート詳細
石炭火力発電の廃止措置市場レポート 2023-2033年 : 本レポートは、業界とその基礎となる原動力をよりよく理解することを望むなら、新たな収益ポケットを目指す大手企業にとって貴重な... もっと見る
※上記価格は部署ライセンス(Departmental licence)価格です。
その他の価格についてはデータリソースまでお問合せください。
日本語のページは自動翻訳を利用し作成しています。
実際のレポートは英文のみでご納品いたします。

|

|
サマリー
レポート詳細
石炭火力発電の廃止措置市場レポート 2023-2033年: 本レポートは、業界とその基礎となる原動力をよりよく理解することを望むなら、新たな収益ポケットを目指す大手企業にとって貴重なものとなるでしょう。異業種への進出や新規地域での既存事業の拡大を目指す企業にも有用です。
政策と規制、他燃料とのコスト競争、低経済成長と石炭火力発電需要の伸び悩み、発展途上国の老朽化した石炭船隊のための石炭発電所再利用などが市場成長を促進
石炭火力発電の廃止措置市場を推進している主な要因には、政策や規制、他の燃料とのコスト競争などがある。さらに、石炭発電所の再利用は、石炭発電所廃止の障壁を克服するのに役立ち、市場成長を促進すると期待されている。一方、脱石炭における政治的抵抗や法的制約が市場成長を抑制している。
石炭酸業の成長を妨げる石炭発電所の廃炉コストへの挑戦
包括的な廃止措置のコストには、廃止措置費用と再開発費用が含まれる。アスベストや有害物質の除去、構造物の破壊、引き揚げやスクラップの回収、清掃、安全な状態へのサイト修復、エンジニアリング・プロジェクト管理、公的関与はすべて、初期の廃炉費用の一部である。
次の段階の復旧のための支出は、用地計画、購入、新築から商業運転まで多岐にわたる。石炭灰プラントの廃止費用は、その中でも最も大きなものである。石炭プラントの所有者が廃炉を決定した場合、廃炉作業の資金調達はプロセスの重要な次の段階である。石炭廃炉のための資金調達オプションは州によって異なる。これらの違いは、州のエネルギー市場が統制されているか、規制緩和されているかによって決まることがほとんどだ。
市場調査レポートを購入する前にすべき質問とは?
- 石炭火力発電の廃止措置市場はどのように進化しているのか?
- 何が石炭火力発電廃止措置市場を促進し、抑制しているのか?
- 石炭火力発電の各サブ市場セグメントは予測期間中にどのように成長し、2033年にどれくらいの収益を占めるのか?
- 2023年から2033年にかけて、石炭火力発電廃止措置の各サブマーケットの市場シェアはどのように推移するのか?
- 2023年から2033年にかけて市場全体の主な牽引役は何か?
- 主要な石炭火力発電廃止措置市場はマクロ経済の動きに概ね追随するのか、それとも個々の国内市場が他を凌駕するのか?
- 2033年までに各国市場のシェアはどのように変化し、2033年にはどの地域が市場をリードするのか?
- 主要プレーヤーは誰で、予測期間中の見通しは?
- これらの大手企業の石炭火力発電廃炉プロジェクトとは?
- 2023年から2033年の間に産業はどのように発展するか?現在および今後10年間に行われる石炭火力発電の廃止措置プロジェクトにはどのような意味があるのか?
- 石炭火力発電の廃止措置市場をさらに拡大するために、製品の商業化の必要性は高まっているか?
- 石炭火力発電の廃止措置市場はどこに向かっているのか?
- 新しい製品・サービスラインへの最適な投資方法とは?
- 企業を新たな成長軌道に乗せ、C-suiteに移行させるための重要な展望とは?
このことが、現在、そして今後10年間の石炭火力発電の廃止措置市場にどのような影響を与えるかを見極める必要がある:
- 273ページにわたる本レポートでは、120の表と105の図表を掲載しています。
- 本レポートでは、業界における主要な有利分野を取り上げているため、今すぐターゲットを絞ることができます。
- 世界、地域、国の売上と成長に関する詳細な分析が含まれています。
- 競合他社が成功した主なトレンド、変化、収益予測をハイライトしています。
本レポートは、石炭火力発電の廃止措置市場が今後10年間でどのように発展していくのか、またCOVID-19の景気後退と好転の変動に合わせてどのように発展していくのかをお伝えします。この市場は、過去10年間のどの時点よりも今が重要です。
2033年までの予測やその他の分析から、商業的な展望が明らかになる
- 2033年までの収益予測に加え、直近の業績、成長率、市場シェアもご覧いただけます。
- ビジネスの展望と展開に関する独自の分析をご覧いただけます。
- 定性的分析(市場ダイナミクス、促進要因、機会、阻害要因、課題を含む)、コスト構造、石炭火力発電の廃炉価格上昇の影響、最近の動向をご覧いただけます。
本レポートには、COVID-19が業界と貴社にどのような影響を与えるかについてのデータ分析と貴重な洞察が含まれている。本レポートでは、COVID-19の4つの回収パターンとその影響、すなわち「V」、「L」、「W」、「U」について論じている。
レポート対象セグメント
タイプ展望
- 廃炉を伴わないプラントのリタイアメント
- 燃料転換による再利用
- 負荷ポケットや遠隔送電を処理するための再開発
- 他の商業活動への再利用
- その他のタイプ
世界市場全体と各分野の売上予測に加え、4つの地域と17の主要国市場の売上予測も掲載しています:
北米
- アメリカ
- カナダ
欧州
- ドイツ
- 英国
- フランス
- スペイン
- イタリア
- その他の欧州
アジア太平洋
- 中国
- 日本
- インド
- オーストラリア
- 韓国
- その他のアジア太平洋地域
MEA
- UAE
- 南アフリカ
- その他のMEA
また、石炭火力発電の廃止措置市場の2023年から2033年にかけての主要企業のプロファイルも掲載している。
報告書に掲載されている主要企業
・ AECOM
・ AF Gruppen ASA Company
・ AFRY Company
・ Arup Group
・ Aurecon
・ D.H. Griffin Companies
・ Jacobs Engineering Group
・ Keltbray Group (Holdings) Limited
・ Mott MacDonald
・ SNC-Lavalin Group Inc
・ TRC Company Inc
・ Veolia Company
・ Worley Engineering services company
・ WSP Global Company
2023年から2033年までの石炭火力発電廃止措置市場全体の世界売上高(金額ベース)は、2023年に325億5300万米ドルを突破する。2033年まで力強い収益成長を予測。当調査では、最も大きな可能性を秘めた組織を特定しています。彼らの能力、進歩、商業的展望を発見し、一歩先を行くお手伝いをします。
石炭火力発電の廃止措置市場、2023-2033年レポートはどのように役立つのか?
要約すると、270ページを超えるこのレポートは、以下のような知識を提供する:
- 石炭火力発電の廃止措置市場、2023年から2033年までの収益予測 世界と地域レベルでタイプ別に予測 - 業界の展望を発見し、投資と収益に最も有利な場所を見つけます。
- 5つの地域と17の主要国市場の2033年までの収益予測 - 北米、欧州、アジア太平洋、MEAの石炭火力発電廃止措置市場2023年から2033年までの予測をご覧ください。また、米国、カナダ、ドイツ、フランス、英国、イタリア、中国、インド、日本、オーストラリアなどの著名経済圏の市場も予測しています。
- 石炭火力発電の廃止措置市場(2023年~2033年)に関わる主要企業の企業プロファイルを含む、既存企業および市場参入を目指す企業の展望。
独自の予測による定量的・定性的分析をご覧ください。私たちのレポートだけに含まれる情報を入手し、貴重なビジネスインテリジェンスで情報を得ることができます。
他にはない情報
私たちの新しいレポートがあれば、知識に遅れをとったり、チャンスを逃したりする可能性が低くなります。Visiongainの調査レポートが貴社の調査、分析、意思決定にどのように役立つかをご覧ください。Visiongainの調査は、石炭火力発電の廃止措置市場、2023年から2033年、市場をリードする企業の商業分析を必要とするすべての人のためのものです。データ、トレンド、予測をご覧いただけます。
ページTOPに戻る
目次
目次
1 レポート概要
1.1 石炭発電廃止措置市場の紹介
1.2 世界の石炭発電廃止措置市場の概要
1.2.1 廃炉の選択肢の評価
1.3 本レポートの目的は?
1.4 レポートのスコープは?
1.5 石炭発電廃止措置市場の定義
1.6 本レポートを読むべき理由
1.7 本レポートが提供するもの
1.8 本分析レポートが回答する主な質問は以下の通り:
1.9 本レポートは誰のためのものか?
1.10 調査方法
1.10.1 一次調査
1.10.2 セカンダリーリサーチ
1.10.3 市場評価・予測手法
1.11 よくある質問(FAQ)
1.12 Visiongainの関連レポート
1.13 Visiongainについて
2 エグゼクティブ・サマリー
3 石炭火力発電廃炉産業構造
3.1 概要
3.1.1 プロセス
3.1.2 廃炉
3.1.3 レメディエーション
3.1.4 再開発
4 世界市場のダイナミクス
4.1 世界市場の最新動向
4.2 市場牽引要因
4.2.1 低経済成長と電力需要の伸び悩みによる破綻
4.2.2 寿命の終わり
4.2.3 発展途上国における老朽化した石炭プラントの再利用
4.2.4 石炭汚染に対する世論の反対
4.2.5 他の燃料とのコスト競争
4.2.6 企業の排出目標
4.2.7 政策と規制
4.3 市場抑制要因
4.3.1 労働者補償と労働力開発
4.3.2 脱石炭における政治的抵抗と法的制約
4.4 世界市場における機会
4.4.1 再利用に利用可能な幅広い技術オプション
4.4.2 石炭プラントの再利用は、石炭プラント撤退の障壁を克服するのに役立つ
4.5 世界市場における課題
4.5.1 石炭は代替不可能な一次燃料源である
4.5.2 石炭発電所の廃止費用
4.5.3 健康コストと気候計算
4.6 COVID-19影響分析
4.6.1 "V字回復"
4.6.2 "U字回復"
4.6.3 "W字回復"
4.6.4 "L字回復"
4.6.5 "V字回復"
4.7 SWOT分析
4.7.1 長所
4.7.2 弱点
4.7.3 機会
4.7.4 脅威
4.8 PEST分析
4.8.1 政治的要因
4.8.2 経済的要因
4.8.3 社会的要因
4.8.4 技術的要因
5 世界市場規模の推定と予測:タイプ別
5.1 タイプ別セグメント 市場魅力度指数
5.2 タイプ別石炭火力発電廃止措置の世界市場規模予測
5.3 廃炉を伴わないプラント除却
5.3.1 廃炉を伴わないプラント除却の地域別市場規模、2023年~2033年(US$ Million)
5.3.2 廃炉を伴わないプラント除却の地域別市場規模、2023-2033年(MW)
5.3.3 廃炉を伴わないプラントの除却市場シェア
5.4 燃料転換による再利用
5.4.1 燃料転換による再利用の地域別市場規模、2023-2033年、(US$ Million)
5.4.2 燃料スイッチによる再利用の地域別市場規模、2023〜2033年(MW)
5.4.3 燃料スイッチによる再利用市場シェア
5.5 ロードポケットや遠隔送電に対応するための再開発
5.5.1 ロードポケットまたは遠隔送電を扱う再開発の地域別市場規模、2023-2033年、(US$ Million)
5.5.2 ロードポケットまたは遠隔送電を扱う再開発の地域別市場規模、2023〜2033年(MW)
5.5.3 ロードポケットまたは遠隔送電を扱う再開発市場シェア
5.6 他の商業活動による再利用
5.6.1 他の商業活動を伴う再利用の地域別市場規模、2023-2033年、(US$ Million)
5.6.2 燃料スイッチによる再利用の地域別市場規模、2023〜2033年(MW)
5.6.3 再利用その他の商業活動市場シェア
6 北米の石炭火力発電廃止措置市場分析
6.1 北米の市場のシナリオ
6.2 北米の石炭火力発電廃止措置市場魅力度指数
6.3 北米の国別市場、2023年、2028年、2033年(US$ Million)
6.4 北米の石炭火力発電廃止措置市場規模推定と予測:国別
6.5 北米の石炭火力発電廃止措置市場規模推定と予測:タイプ別
6.6 アメリカの石炭火力発電廃止措置市場分析
6.7 カナダの石炭火力発電廃止措置市場分析
7 欧州の石炭火力発電廃止措置市場分析
7.1 欧州市場シナリオ
7.2 欧州の石炭火力発電廃止措置市場魅力度指数
7.3 欧州の国別市場、2023年、2028年、2033年(US$ Million)
7.4 欧州の石炭火力発電廃止措置市場規模推定と予測:国別
7.5 欧州の石炭火力発電廃止措置市場規模推定と予測:タイプ別
7.6 ドイツの石の炭火力発電廃止措置市場分析
7.7 フランスの石炭火力発電廃止措置市場分析
7.8 イギリスの石炭火力発電廃止措置市場分析
7.9 スペインの石炭火力発電廃止措置市場分析
7.10 イタリアの石炭火力発電廃止措置市場分析
7.11 その他の欧州石炭火力発電市場分析
8 アジア太平洋(APAC)の石炭火力発電の廃止措置市場分析
8.1 APAC市場のシナリオ
8.2 APACの石炭火力発電廃止措置市場魅力度指数
8.3 APACの国別市場、2023年、2028年、2033年、(US$ Million)
8.4 APACの石炭火力発電廃止措置市場規模推定と予測:国別
8.5 APACの石炭火力発電廃止措置市場規模推定と予測:タイプ別
8.6 日本の石炭火力発電廃止措置市場分析
8.7 中国の石炭火力発電廃止措置市場分析
8.8 オーストラリアの石炭火力発電廃止措置市場分析
8.9 インドの石炭火力発電廃止措置市場分析
8.10 韓国の石炭火力発電廃止措置市場分析
8.11 その他のアジア太平洋地域の石炭火力発電廃止措置市場分析
9 中東・アフリカ(MEA)石炭火力発電廃止措置市場分析
9.1 MEAの市場のシナリオ
9.2 MEAの石炭火力発電廃止措置市場魅力度指数
9.3 MEAの国別市場、2023年、2028年、2033年、(US$ Million)
9.4 MEAの石炭火力発電廃止措置市場規模推定と予測:国別
9.5 MEAの石炭火力発電廃止措置市場規模推定と予測:タイプ別
9.6 南アフリカの石炭火力発電廃止措置市場分析
9.7 UAEの石炭火力発電廃止措置市場分析
9.8 その他のMEA石炭火力発電廃止措置市場分析
10 企業プロフィール
10.1 AF Gruppen ASA Company
10.1.1 会社概要
10.1.2 会社概要
10.1.3 財務プロフィール
10.1.4 製品ベンチマーク
10.1.5 会社の最近の動向
10.2 D.H. Griffin Companies
10.2.1 会社概要
10.2.2 会社概要
10.2.3 製品ベンチマーク
10.2.4 会社の最近の動向
10.3 Keltbray Group (Holdings) Limited
10.3.1 会社概要
10.3.2 会社概要
10.3.3 製品ベンチマーク
10.3.4 会社の最近の動向
10.4 Mott MacDonald
10.4.1 会社概要
10.4.2 会社概要
10.4.3 製品ベンチマーク
10.4.4 企業動向
10.5 AFRY社
10.5.1 会社概要
10.5.2 会社概要
10.5.3 財務プロフィール
10.5.4 製品ベンチマーク
10.5.5 会社の最近の動向
10.6 Arup Group
10.6.1 会社概要
10.6.2 会社概要
10.6.3 製品ベンチマーク
10.6.4 会社の最近の動向
10.7 TRC Company Inc
10.7.1 会社概要
10.7.2 会社概要
10.7.3 製品ベンチマーク
10.7.4 会社の最近の動向
10.8 Veolia Company
10.8.1 会社概要
10.8.2 会社概要
10.8.3 財務プロフィール
10.8.4 製品ベンチマーク
10.8.5 会社の最近の動向
10.9 Jacobs Engineering Group
10.9.1 会社概要
10.9.2 会社概要
10.9.3 財務プロフィール
10.9.4 製品ベンチマーク
10.9.5 会社の最近の動向
10.10 WSP Global Company
10.10.1 会社概要
10.10.2 会社概要
10.10.3 財務プロフィール
10.10.4 製品ベンチマーク
10.10.5 会社の最近の動向
10.11 Aurecon
10.11.1 会社概要
10.11.2 会社概要
10.11.3 製品ベンチマーク
10.11.4 会社の最近の動向
10.12 SNC-Lavalin Group Inc
10.12.1 会社概要
10.12.2 会社概要
10.12.3 財務プロフィール
10.12.4 製品ベンチマーク
10.12.5 会社の最近の動向
10.13 Worley Engineering services company
10.13.1 会社概要
10.13.2 会社概要
10.13.3 財務プロフィール
10.13.4 製品ベンチマーク
10.13.5 会社の最近の動き
10.14 AECOM
10.14.1 会社概要
10.14.2 会社概要
10.14.3 財務プロフィール
10.14.4 製品ベンチマーク
10.14.5 会社の最近の動向
11 結論と提言
11.1 まとめ
11.2 市場プレイヤーへの提言
ページTOPに戻る
図表リスト
表の一覧
Table 1 Global Coal Power Decommissioning Market Snapshot, 2023 & 2033 (US$ Million, CAGR %)
Table 2 Coal Power Decommissioning Market Forecast by Region 2023-2033 (US$ Million, AGR%, CAGR%)) ("V" Shaped Recovery)
Table 3 Coal Power Decommissioning Market Forecast by Region 2023-2033 (US$ Million, AGR%, CAGR%)) (“U" Shaped Recovery)
Table 4 Coal Power Decommissioning Market Forecast by Region 2023-2033 (US$ Million, AGR%, CAGR)) (“W" Shaped Recovery)
Table 5 Coal Power Decommissioning Market Forecast by Region 2023-2033 (US$ Million, AGR%, CAGR%)) ("L" Shaped Recovery)
Table 6 Coal Power Decommissioning Market Forecast by Region 2023-2033 (MW, AGR%, CAGR%)) (“V" Shaped Recovery)
Table 7 Coal Power Decommissioning Market Forecast by Region 2023-2033 (MW, AGR%, CAGR%)) (“U" Shaped Recovery)
Table 8 Coal Power Decommissioning Market Forecast by Region 2023-2033 (MW, AGR%, CAGR%)) (“W" Shaped Recovery)
Table 9 Coal Power Decommissioning Market Forecast by Region 2023-2033 (MW, AGR%, CAGR%)) (“L" Shaped Recovery)
Table 10 Global Coal Power Decommissioning Market Forecast by Type, 2023-2033 (US$ Million, AGR%, CAGR%)
Table 11 Global Coal Power Decommissioning Market Forecast by Indication, 2023-2033 (MW, AGR%, CAGR%)
Table 12 Plant Retirement without Decommissioning Market Forecast by Region, 2023-2033 (US$ Million, AGR%, CAGR%)
Table 13 Plant Retirement without Decommissioning Market Forecast by Region, 2023-2033 (MW, AGR%, CAGR%)
Table 14 Repurposing with Fuel Switch Segment Market Forecast by Region, 2023-2033 (US$ Million, AGR%, CAGR%)
Table 15 Repurposing with Fuel Switch Segment Market Forecast by Region, 2023-2033 (MW, AGR%, CAGR%)
Table 16 Redevelopment to Handle Load Pockets or Remote Transmission Segment Market Forecast by Region, 2023-2033 (US$ Million, AGR%, CAGR%)
Table 17 Redevelopment to Handle Load Pockets or Remote Transmission Segment Market Forecast by Region, 2023-2033 (MW, AGR%, CAGR%)
Table 18 Repurposing with Other Commercial Activity Segment Market Forecast by Region, 2023-2033 (US$ Million, AGR%, CAGR%)
Table 19 Repurposing with Other Commercial Activity Segment Market Forecast by Region, 2023-2033 (MW, AGR%, CAGR%)
Table 20 North America Coal Power Decommissioning Market Forecast by Country, 2023-2033 (US$ Million, AGR%, CAGR%)
Table 21 North America Coal Power Decommissioning Market Forecast by Country, 2023-2033 (MW, AGR%, CAGR%)
Table 22 North America Coal Power Decommissioning Market Forecast by Type, 2023-2033 (US$ Million, AGR%, CAGR%)
Table 23 North America Coal Power Decommissioning Market Forecast by Type, 2023-2033 (MW, AGR%, CAGR%)
Table 24 US Coal Power Decommissioning Market Forecast, 2023-2033 (US$ Million, AGR%, CAGR%)
Table 25 US Coal Power Decommissioning Market Forecast, 2023-2033 (MW, AGR%, CAGR%)
Table 26 Canada Coal Power Decommissioning Market Forecast, 2023-2033 (US$ Million, AGR%, CAGR%)
Table 27 Canada Coal Power Decommissioning Market Forecast, 2023-2033 (MW, AGR%, CAGR%)
Table 28 Europe Coal Power Decommissioning Market Forecast by Country, 2023-2033 (US$ Million, AGR%, CAGR%)
Table 29 Europe Coal Power Decommissioning Market Forecast by Country, 2023-2033 (MW, AGR%, CAGR%)
Table 30 Europe Coal Power Decommissioning Market Forecast by Type, 2023-2033 (US$ Million, AGR%, CAGR%)
Table 31 Europe Coal Power Decommissioning Market Forecast by Type, 2023-2033 (MW, AGR%, CAGR%)
Table 32 Germany Coal Power Decommissioning Market Forecast, 2023-2033 (US$ Million, AGR%, CAGR%)
Table 33 Germany Coal Power Decommissioning Market Forecast, 2023-2033 (MW, AGR%, CAGR%)
Table 34 France Coal Power Decommissioning Market Forecast, 2023-2033 (US$ Million, AGR%, CAGR%)
Table 35 France Coal Power Decommissioning Market Forecast, 2023-2033 (MW, AGR%, CAGR%)
Table 36 UK Coal Power Decommissioning Market Forecast, 2023-2033 (US$ Million, AGR%, CAGR%)
Table 37 UK Coal Power Decommissioning Market Forecast, 2023-2033 (MW, AGR%, CAGR%)
Table 38 Spain Coal Power Decommissioning Market Forecast, 2023-2033 (US$ Million, AGR%, CAGR%)
Table 39 Spain Coal Power Decommissioning Market Forecast, 2023-2033 (MW, AGR%, CAGR%)
Table 40 Italy Coal Power Decommissioning Market Forecast, 2023-2033 (US$ Million, AGR%, CAGR%)
Table 41 Italy Coal Power Decommissioning Market Forecast, 2023-2033 (MW, AGR%, CAGR%)
Table 42 Rest of Europe Coal Power Decommissioning Market Forecast, 2023-2033 (US$ Million, AGR%, CAGR%)
Table 43 Rest of Europe Coal Power Decommissioning Market Forecast, 2023-2033 (MW, AGR%, CAGR%)
Table 44 Asia-Pacific Coal Power Decommissioning Market Forecast by Country, 2023-2033 (US$ Million, AGR%, CAGR%)
Table 45 Asia-Pacific Coal Power Decommissioning Market Forecast by Country, 2023-2033 (MW, AGR%, CAGR%)
Table 46 Asia-Pacific Coal Power Decommissioning Market Forecast by Type, 2023-2033 (US$ Million, AGR%, CAGR%)
Table 47 Asia-Pacific Coal Power Decommissioning Market Forecast by Type, 2023-2033 (MW, AGR%, CAGR%)
Table 48 Japan Coal Power Decommissioning Market Forecast, 2023-2033 (US$ Million, AGR%, CAGR%)
Table 49 Japan Coal Power Decommissioning Market Forecast, 2023-2033 (MW, AGR%, CAGR%)
Table 50 China Coal Power Decommissioning Market Forecast, 2023-2033 (US$ Million, AGR%, CAGR%)
Table 51 China Coal Power Decommissioning Market Forecast, 2023-2033 (MW, AGR%, CAGR%)
Table 52 Australia Coal Power Decommissioning Market Forecast, 2023-2033 (US$ Million, AGR%, CAGR%)
Table 53 Australia Coal Power Decommissioning Market Forecast, 2023-2033 (MW, AGR%, CAGR%)
Table 54 India Coal Power Decommissioning Market Forecast, 2023-2033 (US$ Million, AGR%, CAGR%)
Table 55 India Coal Power Decommissioning Market Forecast, 2023-2033 (MW, AGR%, CAGR%)
Table 56 South Korea Coal Power Decommissioning Market Forecast, 2023-2033 (US$ Million, AGR%, CAGR%)
Table 57 South Korea Coal Power Decommissioning Market Forecast, 2023-2033 (MW, AGR%, CAGR%)
Table 58 Rest of Asia-Pacific Coal Power Decommissioning Market Forecast, 2023-2033 (US$ Million, AGR%, CAGR%)
Table 59 Rest of Asia-Pacific Coal Power Decommissioning Market Forecast, 2023-2033 (MW, AGR%, CAGR%)
Table 60 MEA Coal Power Decommissioning Market Forecast by Country, 2023-2033 (US$ Million, AGR%, CAGR%)
Table 61 MEA Coal Power Decommissioning Market Forecast by Country, 2023-2033 (MW, AGR%, CAGR%)
Table 62 MEA Coal Power Decommissioning Market Forecast by Type, 2023-2033 (US$ Million, AGR%, CAGR%)
Table 63 MEA Coal Power Decommissioning Market Forecast by Type, 2023-2033 (MW, AGR%, CAGR%)
Table 64 South Africa Coal Power Decommissioning Market Forecast, 2023-2033 (US$ Million, AGR%, CAGR%)
Table 65 South Africa Coal Power Decommissioning Market Forecast, 2023-2033 (MW, AGR%, CAGR%)
Table 66 UAE Coal Power Decommissioning Market Forecast, 2023-2033 (US$ Million, AGR%, CAGR%)
Table 67 UAE Coal Power Decommissioning Market Forecast, 2023-2033 (MW, AGR%, CAGR%)
Table 68 Rest of MEA Coal Power Decommissioning Market Forecast, 2023-2033 (US$ Million, AGR%, CAGR%)
Table 69 Rest of MEA Coal Power Decommissioning Market Forecast, 2023-2033 (MW, AGR%, CAGR%)
Table 70 AF Gruppen ASA: Company Information
Table 71 AF Gruppen ASA: Company Revenue 2017-2022 (US$ Mn, AGR %)
Table 72 AF Gruppen ASA: Company Product and Service Benchmarking
Table 73 AF Gruppen ASA: Company Recent Developments till Dec,2021
Table 74 D.H. Griffin: Company Information
Table 75 D.H. Griffin: Company Product and Service Benchmarking
Table 76 D.H. Griffin: Company Recent Developments till Dec,2021
Table 77 Keltbray Group: Company Information
Table 78 Keltbray Group: Company Product and Service Benchmarking
Table 79 Keltbray Group: Company Recent Developments till Dec,2021
Table 80 Mott MacDonald: Company Information
Table 81 Mott MacDonald: Company Product and Service Benchmarking
Table 82 Mott MacDonald: Company Recent Developments till Dec,2021
Table 83 AFRY: Company Information
Table 84 AFRY: Company Revenue 2017-2022 (US$ Mn, AGR %)
Table 85 AFRY: Company Product and Service Benchmarking
Table 86 AFRY: Company Recent Developments till Dec,2021
Table 87 Arup Group: Company Information
Table 88 Arup Group: Company Product and Service Benchmarking
Table 89 Arup Group: Company Recent Developments till Dec,2021
Table 90 TRC: Company Information
Table 91 TRC: Company Product and Service Benchmarking
Table 92 TRC: Company Recent Developments till Dec,2021
Table 93 Veolia: Company Information
Table 94 Veolia: Company Revenue 2017-2022 (US$ Mn, AGR %)
Table 95 Veolia: Company Product and Service Benchmarking
Table 96 Veolia: Company Recent Developments till Dec,2021
Table 97 Jacobs: Company Information
Table 98 Jacobs: Company Revenue 2017-2022 (US$ Mn, AGR %)
Table 99 Jacobs: Company Product and Service Benchmarking
Table 100 Jacobs: Company Recent Developments till Dec,2021
Table 101 WSP: Company Information
Table 102 WSP: Company Revenue 2017-2022 (US$ Mn, AGR %)
Table 103 WSP: Company Product and Service Benchmarking
Table 104 WSP: Company Recent Developments till Dec,2021
Table 105 Aurecon: Company Information
Table 106 Aurecon: Company Product and Service Benchmarking
Table 107 Aurecon: Company Recent Developments till Dec,2021
Table 108 SNC: Company Information
Table 109 SNC: Company Revenue 2018-2022 (US$ Mn, AGR %)
Table 110 SNC: Company Product and Service Benchmarking
Table 111 SNC: Company Recent Developments till Dec,2021
Table 112 Worley: Company Information
Table 113 Worley: Company Revenue 2018-2022 (US$ Mn, AGR %)
Table 114 Worley: Company Product and Service Benchmarking
Table 115 Worley: Company Recent Developments till Dec,2021
Table 116 AECOM: Company Information
Table 117 AECOM: Company Revenue 2017-2021(US$ Mn, AGR %)
Table 118 AECOM: Company Product and Service Benchmarking
Table 119 AECOM: Company Recent Developments till Dec,2021
図の一覧
Figure 1 Option for Decommissioning
Figure 2 Global Coal Power Decommissioning Market Segmentation
Figure 3 Global Coal Power Decommissioning Market Forecast by Type: Market Attractiveness Index
Figure 4 Global Coal Power Decommissioning Market Attractiveness Index by Region
Figure 5 Process Steps of Coal Power Plant Decommissioning
Figure 6 Current Trends in the Global Market
Figure 7 Coal Power Decommissioning Market Forecast by Region 2023-2033 (US$ Million, AGR%,)) ("V" Shaped Recovery)
Figure 8 Coal Power Decommissioning Market Forecast by Region 2023-2033 (US$ Million, AGR%)) (“U" Shaped Recovery)
Figure 9 Coal Power Decommissioning Market Forecast by Region 2023-2033 (US$ Million, AGR%,)) (“W" Shaped Recovery)
Figure 10 Coal Power Decommissioning Market Forecast by Region 2023-2033 (US$ Million, AGR%,)) (“L" Shaped Recovery)
Figure 11 Coal Power Decommissioning Market Forecast by region 2023-2033 (MW, AGR%,)): "V" Shaped Recovery
Figure 12 Coal Power Decommissioning Market Forecast by Region 2023-2033 (MW, AGR%,)) (“U" Shaped Recovery)
Figure 13 Coal Power Decommissioning Market Forecast by Region 2023-2033 (MW, AGR%,)) (“W" Shaped Recovery)
Figure 14 Coal Power Decommissioning Market Forecast by Region 2023-2033 (MW, AGR%,)) ( "L" Shaped Recovery
Figure 15 Coal Power Decommissioning Market Forecast by Type: Market Attractiveness Index
Figure 16 Global Coal Power Decommissioning Market Forecast by Type, 2023-2033 (US$ Million, AGR%))
Figure 17 Global Coal Power Decommissioning Market Forecast by Type, 2023-2033 (US$ Million, AGR%,))
Figure 18 Global Coal Power Decommissioning Market Share Forecast by Type, 2023, 2028, 2033 (%)
Figure 19 Plant Retirement without Decommissioning Market Forecast by Region, 2023-2033 (US$ Million, AGR%,))
Figure 20 Plant Retirement without Decommissioning Market Forecast by Region, 2023-2033 (MW, AGR%,))
Figure 21 Plant Retirement without Decommissioning Market Share by Region, 2023-2033 (%)
Figure 22 Repurposing with Fuel Switch Market Forecast by Region, 2023-2033 (US$ Million, AGR%,))
Figure 23 Repurposing with Fuel Switch Market Forecast by Region, 2023-2033 (MW, AGR%,))
Figure 24 Repurposing with Fuel Switch Market Share by Region, 2023-2033 (%)
Figure 25 Redevelopment to Handle Load Pockets or Remote Transmission Market Forecast by Region, 2023-2033 (US$ Million, AGR%,))
Figure 26 Redevelopment to Handle Load Pockets or Remote Transmission Market Forecast by Region, 2023-2033 (MW, AGR%,))
Figure 27 Redevelopment to Handle Load Pockets or Remote Transmission Market Share by Region, 2023-2033 (%)
Figure 28 Repurposing Other Commercial Activity Market Forecast by Region, 2023-2033 (US$ Million, AGR%,))
Figure 29 Repurposing with Other Commercial Activity Market Forecast by Region, 2023-2033 (MW, AGR%,))
Figure 30 Repurposing Other Commercial Activity Market Share by Region, 2023-2033 (%)
Figure 31 North America Coal Power Decommissioning Market Attractiveness Index
Figure 32 North America Coal Power Decommissioning Market by Country, 2023, 2028 & 2033 (US$ Million)
Figure 33 North America Coal Power Decommissioning Market Forecast by Country, 2023-2033 (US$ Million, AGR %)
Figure 34 North America Coal Power Decommissioning Market Forecast by Country, 2023-2033 (MW, AGR %)
Figure 35 North America Coal Power Decommissioning Market Share Forecast by Country, 2023 & 2033 (%)
Figure 36 North America Coal Power Decommissioning Market Forecast by Type, 2023-2033 (US$ Million, AGR%, CAGR%)
Figure 37 North America Coal Power Decommissioning Market Forecast by Type, 2023-2033 (MW, AGR %)
Figure 38 North America Coal Power Decommissioning Market Share Forecast by Type, 2023 & 2033 (%)
Figure 39 US Coal Power Decommissioning Market Forecast, 2023-2033 (US$ Million, AGR %)
Figure 40 US Coal Power Decommissioning Market Forecast, 2023-2033 (MW, AGR %))
Figure 41 Canada Coal Power Decommissioning Market Forecast, 2023-2033 (US$ Million, AGR %)
Figure 42 Canada Coal Power Decommissioning Market Forecast, 2023-2033 (MW, AGR %))
Figure 43 Europe Coal Power Decommissioning Market Attractiveness Index
Figure 44 Europe Coal Power Decommissioning Market by Country, 2023, 2028 & 2033 (US$ Million)
Figure 45 Europe Coal Power Decommissioning Market Forecast by Country, 2023-2033 (US$ Million, AGR %))
Figure 46 Europe Coal Power Decommissioning Market Forecast by Country, 2023-2033 (MW, AGR %))
Figure 47 Europe Coal Power Decommissioning Market Share Forecast by Country, 2023 & 2033 (%)
Figure 48 Europe Coal Power Decommissioning Market Forecast by Type, 2023-2033 (US$ Million, AGR%,))
Figure 49 Europe Coal Power Decommissioning Market Forecast by Type, 2023-2033 (MW, AGR %))
Figure 50 Europe Coal Power Decommissioning Market Share Forecast by Type, 2023 & 2033 (%)
Figure 51 Germany Coal Power Decommissioning Market Forecast, 2023-2033 (US$ Million, AGR %))
Figure 52 Germany Coal Power Decommissioning Market Forecast, 2023-2033 (MW, AGR %))
Figure 53 France Coal Power Decommissioning Market Forecast, 2023-2033 (US$ Million, AGR %))
Figure 54 France Coal Power Decommissioning Market Forecast, 2023-2033 (MW, AGR %))
Figure 55 UK Coal Power Decommissioning Market Forecast, 2023-2033 (US$ Million, AGR %))
Figure 56 UK Coal Power Decommissioning Market Forecast, 2023-2033 (MW, AGR %))
Figure 57 Spain Coal Power Decommissioning Market Forecast, 2023-2033 (US$ Million, AGR %)
Figure 58 Spain Coal Power Decommissioning Market Forecast, 2023-2033 (MW, AGR %))
Figure 59 Italy Coal Power Decommissioning Market Forecast, 2023-2033 (US$ Million, AGR %))
Figure 60 Italy Coal Power Decommissioning Market Forecast, 2023-2033 (MW, AGR %))
Figure 61 Rest of Europe Coal Power Decommissioning Market Forecast, 2023-2033 (US$ Million, AGR %))
Figure 62 Rest of Europe Coal Power Decommissioning Market Forecast, 2023-2033 (MW, AGR %))
Figure 63 APAC Coal Power Decommissioning Market Attractiveness Index
Figure 64 APAC Coal Power Decommissioning Market by Country, 2023, 2028 & 2033 (US$ Million)
Figure 65 APAC Coal Power Decommissioning Market Forecast by Country, 2023-2033 (US$ Million, AGR %))
Figure 66 APAC Coal Power Decommissioning Market Forecast by Country, 2023-2033 (MW, AGR %))
Figure 67 APAC Coal Power Decommissioning Market Share Forecast by Country, 2023 & 2033 (%)
Figure 68 APAC Coal Power Decommissioning Market Forecast by Type, 2023-2033 (US$ Million, AGR%, CAGR%)
Figure 69 APAC Coal Power Decommissioning Market Forecast by Type, 2023-2033 (MW, AGR %))
Figure 70 APAC Coal Power Decommissioning Market Share Forecast by Type, 2023 & 2033 (%)
Figure 71 Japan Coal Power Decommissioning Market Forecast, 2023-2033 (US$ Million, AGR %))
Figure 72 Japan Coal Power Decommissioning Market Forecast, 2023-2033 (MW, AGR %))
Figure 73 China Coal Power Decommissioning Market Forecast, 2023-2033 (US$ Million, AGR %))
Figure 74 China Coal Power Decommissioning Market Forecast, 2023-2033 (MW, AGR %))
Figure 75 Australia Coal Power Decommissioning Market Forecast, 2023-2033 (US$ Million, AGR %))
Figure 76 Australia Coal Power Decommissioning Market Forecast, 2023-2033 (MW, AGR %))
Figure 77 India Coal Power Decommissioning Market Forecast, 2023-2033 (US$ Million, AGR %))
Figure 78 India Coal Power Decommissioning Market Forecast, 2023-2033 (MW, AGR %)
Figure 79 South Korea Power Decommissioning Market Forecast, 2023-2033 (US$ Million, AGR %))
Figure 80 South Korea Coal Power Decommissioning Market Forecast, 2023-2033 (MW, AGR %))
Figure 81 Rest of Asia-Pacific Coal Power Decommissioning Market Forecast, 2023-2033 (US$ Million, AGR %))
Figure 82 Rest of Europe Coal Power Decommissioning Market Forecast, 2023-2033 (MW, AGR %))
Figure 83 MEA Coal Power Decommissioning Market Attractiveness Index
Figure 84 MEA Coal Power Decommissioning Market by Country, 2023, 2028 & 2033 (US$ Million)
Figure 85 MEA Coal Power Decommissioning Market Forecast by Country, 2023-2033 (US$ Million, AGR %))
Figure 86 MEA Coal Power Decommissioning Market Forecast by Country, 2023-2033 (MW, AGR %))
Figure 87 MEA Coal Power Decommissioning Market Share Forecast by Country, 2023 & 2033 (%)
Figure 88 MEA Coal Power Decommissioning Market Forecast by Type, 2023-2033 (US$ Million, AGR%,))
Figure 89 MEA Coal Power Decommissioning Market Forecast by Type, 2023-2033 (MW, AGR %))
Figure 90 MEA Coal Power Decommissioning Market Share Forecast by Type, 2023 & 2033 (%)
Figure 91 South Africa Coal Power Decommissioning Market Forecast, 2023-2033 (US$ Million, AGR %))
Figure 92 South Africa Coal Power Decommissioning Market Forecast, 2023-2033 (MW, AGR %))
Figure 93 UAE Coal Power Decommissioning Market Forecast, 2023-2033 (US$ Million, AGR %))
Figure 94 UAE Coal Power Decommissioning Market Forecast, 2023-2033 (MW, AGR %))
Figure 95 Rest of MEA Coal Power Decommissioning Market Forecast, 2023-2033 (US$ Million, AGR %))
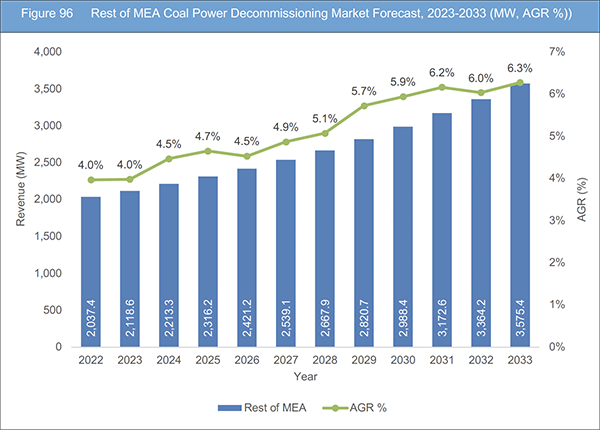
Figure 96 Rest of MEA Coal Power Decommissioning Market Forecast, 2023-2033 (MW, AGR %))
Figure 97 AF Gruppen ASA: Company Revenue 2017-2022 (US$ Mn, AGR %))
Figure 98 AF Gruppen ASA: Company Operating Income 2017-2022(US$ Mn, AGR %))
Figure 99 AFRY: Company Revenue 2017-2022 (US$ Mn, AGR %)
Figure 100 Veolia: Company Revenue 2017-2022 (US$ Mn, AGR %))
Figure 101 Jacobs: Company Revenue 2017-2022 (US$ Mn, AGR %))
Figure 102 WSP: Company Revenue 2017-2022 (US$ Mn, AGR %)
Figure 103 SNC: Company Revenue 2018-2022 (US$ Mn, AGR %))
Figure 104 Worley: Company Revenue 2018-2022 (US$ Mn, AGR %))
Figure 105 AECOM: Company Revenue 2017-2021(US$ Mn, AGR %)
ページTOPに戻る
Summary
Report Details
The Coal Power Decommissioning Market Report 2023-2033: This report will prove invaluable to leading firms striving for new revenue pockets if they wish to better understand the industry and its underlying dynamics. It will be useful for companies that would like to expand into different industries or to expand their existing operations in a new region.
Policy and Regulations, Cost Competition with Other Fuels, Low Economic Growth and Poor Growth in Power Demand Ended Up Bankrupting the Sector, Coal Plant Repurposing for Ageing Coal Fleets in Developing Countries among others Driving Market Growth
Some of the major forces propelling the coal power decommissioning market include policy and regulations, cost competition with other fuels and others. Furthermore, repurposing coal plants can help overcome barriers to coal plant retirement is expected to propel market growth. On the other hand, political resistance and legal constraints in transitioning away from coal restrain the market growth.
Costs of Coal Plant Decommissioning Challenge to Hamper Industry Growth
The costs of comprehensive decommissioning include decommissioning and redevelopment charges. Asbestos and hazardous material abatement, structure destruction, salvage and scrap recovery, clean-up, site restoration to a safe state, engineering project management, and public involvement are all part of the initial decommissioning expenditures.
The expenditures for the following stage of rehabilitation might range from site planning, purchase, and new building through commercial operation. The expenses of decommissioning coal ash plants are the most significant of them. When a coal plant owner decides to decommission it, funding the plant decommissioning operations is a critical next stage in the process. The finance options for coal decommissioning differ from state to state. These variations are mostly determined by whether a state’s energy market is controlled or deregulated.
What Questions Should You Ask before Buying a Market Research Report?
• How is the coal power decommissioning market evolving?
• What is driving and restraining the coal power decommissioning market?
• How will each coal power decommissioning submarket segment grow over the forecast period and how much revenue will these submarkets account for in 2033?
• How will the market shares for each coal power decommissioning submarket develop from 2023 to 2033?
• What will be the main driver for the overall market from 2023 to 2033?
• Will leading coal power decommissioning markets broadly follow the macroeconomic dynamics, or will individual national markets outperform others?
• How will the market shares of the national markets change by 2033 and which geographical region will lead the market in 2033?
• Who are the leading players and what are their prospects over the forecast period?
• What are the coal power decommissioning projects for these leading companies?
• How will the industry evolve during the period between 2023 and 2033? What are the implications of coal power decommissioning projects taking place now and over the next 10 years?
• Is there a greater need for product commercialisation to further scale the coal power decommissioning market?
• Where is the coal power decommissioning market heading and how can you ensure you are at the forefront of the market?
• What are the best investment options for new product and service lines?
• What are the key prospects for moving companies into a new growth path and C-suite?
You need to discover how this will impact the coal power decommissioning market today, and over the next 10 years:
• Our 273-page report provides 120 tables and 105 charts/graphs exclusively to you.
• The report highlights key lucrative areas in the industry so you can target them – NOW.
• It contains in-depth analysis of global, regional and national sales and growth.
• It highlights for you the key successful trends, changes and revenue projections made by your competitors.
This report tells you TODAY how the coal power decommissioning market will develop in the next 10 years, and in line with the variations in COVID-19 economic recession and bounce. This market is more critical now than at any point over the last 10 years.
Forecasts to 2033 and other analyses reveal commercial prospects
• In addition to revenue forecasting to 2033, our new study provides you with recent results, growth rates, and market shares.
• You will find original analyses, with business outlooks and developments.
• Discover qualitative analyses (including market dynamics, drivers, opportunities, restraints and challenges), cost structure, impact of rising coal power decommissioning prices and recent developments.
This report includes data analysis and invaluable insight into how COVID-19 will affect the industry and your company. Four COVID-19 recovery patterns and their impact, namely, “V”, “L”, “W” and “U” are discussed in this report.
Segments Covered in the Report
Type Outlook
• Plant Retirement without Decommissioning
• Repurposing with Fuel Switch
• Redevelopment to Handle Load Pockets or Remote Transmission
• Repurposing with Other Commercial Activity
• Other Types
In addition to the revenue predictions for the overall world market and segments, you will also find revenue forecasts for four regional and 17 leading national markets:
North America
• U.S.
• Canada
Europe
• Germany
• UK
• France
• Spain
• Italy
• Rest of Europe
Asia Pacific
• China
• Japan
• India
• Australia
• South Korea
• Rest of Asia Pacific
MEA
• UAE
• South Africa
• Rest of MEA
The report also includes profiles and for some of the leading companies in the Coal power decommissioning Market, 2023 to 2033, with a focus on this segment of these companies’ operations.
Leading companies profiled in the report
• AECOM
• AF Gruppen ASA Company
• AFRY Company
• Arup Group
• Aurecon
• D.H. Griffin Companies
• Jacobs Engineering Group
• Keltbray Group (Holdings) Limited
• Mott MacDonald
• SNC-Lavalin Group Inc
• TRC Company Inc
• Veolia Company
• Worley Engineering services company
• WSP Global Company
Overall world revenue for Coal power decommissioning Market, 2023 to 2033 in terms of value the market will surpass US$32,553 million in 2023, our work calculates. We predict strong revenue growth through to 2033. Our work identifies which organizations hold the greatest potential. Discover their capabilities, progress, and commercial prospects, helping you stay ahead.
How will the Coal Power Decommissioning Market, 2023 to 2033 report help you?
In summary, our 270+ page report provides you with the following knowledge:
• Revenue forecasts to 2033 for Coal power decommissioning Market, 2023 to 2033 Market, with forecasts for type, each forecast at a global and regional level – discover the industry’s prospects, finding the most lucrative places for investments and revenues.
• Revenue forecasts to 2033 for five regional and 17 key national markets – See forecasts for the Coal power decommissioning Market, 2023 to 2033 market in North America, Europe, Asia-Pacific, and MEA. Also forecasted is the market in the US, Canada, Germany, France, UK, Italy, China, India, Japan, and Australia among other prominent economies.
• Prospects for established firms and those seeking to enter the market – including company profiles of the major companies involved in the Coal power decommissioning Market, 2023 to 2033.
Find quantitative and qualitative analyses with independent predictions. Receive information that only our report contains, staying informed with invaluable business intelligence.
Information found nowhere else
With our new report, you are less likely to fall behind in knowledge or miss out on opportunities. See how our work could benefit your research, analyses, and decisions. Visiongain’s study is for everybody needing commercial analyses for the Coal power decommissioning Market, 2023 to 2033, market-leading companies. You will find data, trends and predictions.
ページTOPに戻る
Table of Contents
Table of Contents
1 Report Overview
1.1 Introduction to Coal Power Decommissioning Market
1.2 Global Coal Power Decommissioning Market Overview
1.2.1 Assess Options for Decommissioning
1.3 What are the Objectives of this Report?
1.4 What is the Scope of the Report?
1.5 Coal Power Decommissioning Market Definition
1.6 Why You Should Read This Report
1.7 What This Report Delivers
1.8 Key Questions Answered by This Analytical Report Include:
1.9 Who is This Report for?
1.10 Research Methodology
1.10.1 Primary Research
1.10.2 Secondary Research
1.10.3 Market Evaluation & Forecasting Methodology
1.11 Frequently Asked Questions (FAQs)
1.12 Associated Visiongain Reports
1.13 About Visiongain
2 Executive Summary
3 Coal Power Decommissioning Industry Structure
3.1 Overview
3.1.1 The Process
3.1.2 Decommissioning
3.1.3 Remediation
3.1.4 Redevelopment
4 Global Market Dynamics
4.1 Current Trends in the Global Market
4.2 Market Driving Factors
4.2.1 Low Economic Growth and Poor Growth in Power Demand Ended Up Bankrupting the Sector
4.2.2 End of the Lifespan
4.2.3 Coal Plant Repurposing for Ageing Coal Fleets in Developing Countries
4.2.4 Public Opposition to Coal Pollution
4.2.5 Cost Competition with Other Fuels
4.2.6 Corporate Emissions Goals
4.2.7 Policy and Regulations
4.3 Market Restraining Factors
4.3.1 Worker Compensation and Workforce Development
4.3.2 Political Resistance and Legal Constraints in Transitioning Away from Coal
4.4 Opportunities in the Global Market
4.4.1 A Wide Range of Technology Options Available for Repurposing
4.4.2 Repurposing Coal Plants Can Help Overcome Barriers to Coal Plant Retirement
4.5 Challenges in the Global Market
4.5.1 Coal is An Irreplaceable Source of Primary Fuel
4.5.2 Costs of Coal Plant Decommissioning
4.5.3 Health costs and climate maths
4.6 COVID-19 Impact Analysis
4.6.1 “V-Shaped Recovery”
4.6.2 “U-Shaped Recovery”
4.6.3 “W-Shaped Recovery”
4.6.4 “L-Shaped Recovery”
4.6.5 “V-Shaped Recovery”
4.7 SWOT Analysis
4.7.1 Strengths
4.7.2 Weakness
4.7.3 Opportunities
4.7.4 Threats
4.8 PEST Analysis
4.8.1 Political Factors
4.8.2 Economic Factor
4.8.3 Social Factors
4.8.4 Technological Factors
5 Global Market Size Estimation and Forecast by Type
5.1 Type Segment: Market Attractiveness Index
5.2 Global Coal Power Decommissioning Market Size Forecast by Type
5.3 Plant Retirement without Decommissioning
5.3.1 Plant Retirement without Decommissioning Market Size by Region, 2023-2033 (US$ Million)
5.3.2 Plant Retirement without Decommissioning Market Size by Region, 2023-2033 (MW)
5.3.3 Plant Retirement without Decommissioning Market Share
5.4 Repurposing with Fuel Switch
5.4.1 Repurposing with Fuel Switch Market Size by Region, 2023-2033 (US$ Million)
5.4.2 Repurposing with Fuel Switch Market Size by Region, 2023-2033 (MW)
5.4.3 Repurposing with Fuel Switch Market Share
5.5 Redevelopment to Handle Load Pockets or Remote Transmission
5.5.1 Redevelopment to Handle Load Pockets or Remote Transmission Market Size by Region, 2023-2033 (US$ Million)
5.5.2 Redevelopment to Handle Load Pockets or Remote Transmission Market Size by Region, 2023-2033 (MW)
5.5.3 Redevelopment to Handle Load Pockets or Remote Transmission Market Share
5.6 Repurposing with Other Commercial Activity
5.6.1 Repurposing with Other Commercial Activity Market Size by Region, 2023-2033 (US$ Million)
5.6.2 Repurposing with Fuel Switch Market Size by Region, 2023-2033 (MW)
5.6.3 Repurposing Other Commercial Activity Market Share
6 North America Coal Power Decommissioning Market Analysis
6.1 North America Market Scenario
6.2 North America Coal Power Decommissioning Market Attractiveness Index
6.3 North America Market by Country, 2023, 2028 & 2033 (US$ Million)
6.4 North America Coal Power Decommissioning Market Size Estimation and Forecast by Country
6.5 North America Coal Power Decommissioning Market Size Estimation and Forecast by Type
6.6 U.S. Coal Power Decommissioning Market Analysis
6.7 Canada Coal Power Decommissioning Market Analysis
7 Europe Coal Power Decommissioning Market Analysis
7.1 Europe Market Scenario
7.2 Europe Coal Power Decommissioning Market Attractiveness Index
7.3 Europe Market by Country, 2023, 2028 & 2033 (US$ Million)
7.4 Europe Coal Power Decommissioning Market Size Estimation and Forecast by Country
7.5 Europe Coal Power Decommissioning Market Size Estimation and Forecast by Type
7.6 Germany Coal Power Decommissioning Market Analysis
7.7 France Coal Power Decommissioning Market Analysis
7.8 United Kingdom (UK) Coal Power Decommissioning Market Analysis
7.9 Spain Coal Power Decommissioning Market Analysis
7.10 Italy Coal Power Decommissioning Market Analysis
7.11 Rest of Europe Coal Power Decommissioning Market Analysis
8 Asia Pacific (APAC) Coal Power Decommissioning Market Analysis
8.1 APAC Market Scenario
8.2 APAC Coal Power Decommissioning Market Attractiveness Index
8.3 APAC Market by Country, 2023, 2028 & 2033 (US$ Million)
8.4 APAC Coal Power Decommissioning Market Size Estimation and Forecast by Country
8.5 APAC Coal Power Decommissioning Market Size Estimation and Forecast by Type
8.6 Japan Coal Power Decommissioning Market Analysis
8.7 China Coal Power Decommissioning Market Analysis
8.8 Australia Coal Power Decommissioning Market Analysis
8.9 India Coal Power Decommissioning Market Analysis
8.10 South Korea Coal Power Decommissioning Market Analysis
8.11 Rest of Asia-Pacific Coal Power Decommissioning Market Analysis
9 Middle East and Africa (MEA) Coal Power Decommissioning Market Analysis
9.1 MEA Market Scenario
9.2 MEA Coal Power Decommissioning Market Attractiveness Index
9.3 MEA Market by Country, 2023, 2028 & 2033 (US$ Million)
9.4 MEA Coal Power Decommissioning Market Size Estimation and Forecast by Country
9.5 MEA Coal Power Decommissioning Market Size Estimation and Forecast by Type
9.6 South Africa Coal Power Decommissioning Market Analysis
9.7 UAE Coal Power Decommissioning Market Analysis
9.8 Rest of MEA Coal Power Decommissioning Market Analysis
10 Company Profiles
10.1 AF Gruppen ASA Company
10.1.1 Company Snapshot
10.1.2 Company Overview
10.1.3 Company Financial Profile
10.1.4 Company Product Benchmarking
10.1.5 Company Recent Developments
10.2 D.H. Griffin Companies
10.2.1 Company Snapshot
10.2.2 Company Overview
10.2.3 Company Product Benchmarking
10.2.4 Company Recent Developments
10.3 Keltbray Group (Holdings) Limited
10.3.1 Company Snapshot
10.3.2 Company Overview
10.3.3 Company Product Benchmarking
10.3.4 Company Recent Developments
10.4 Mott MacDonald
10.4.1 Company Snapshot
10.4.2 Company Overview
10.4.3 Company Product Benchmarking
10.4.4 Company Recent Developments
10.5 AFRY Company
10.5.1 Company Snapshot
10.5.2 Company Overview
10.5.3 Company Financial Profile
10.5.4 Company Product Benchmarking
10.5.5 Company Recent Developments
10.6 Arup Group
10.6.1 Company Snapshot
10.6.2 Company Overview
10.6.3 Company Product Benchmarking
10.6.4 Company Recent Developments
10.7 TRC Company Inc
10.7.1 Company Snapshot
10.7.2 Company Overview
10.7.3 Company Product Benchmarking
10.7.4 Company Recent Developments
10.8 Veolia Company
10.8.1 Company Snapshot
10.8.2 Company Overview
10.8.3 Company Financial Profile
10.8.4 Company Product Benchmarking
10.8.5 Company Recent Developments
10.9 Jacobs Engineering Group
10.9.1 Company Snapshot
10.9.2 Company Overview
10.9.3 Company Financial Profile
10.9.4 Company Product Benchmarking
10.9.5 Company Recent Developments
10.10 WSP Global Company
10.10.1 Company Snapshot
10.10.2 Company Overview
10.10.3 Company Financial Profile
10.10.4 Company Product Benchmarking
10.10.5 Company Recent Developments
10.11 Aurecon
10.11.1 Company Snapshot
10.11.2 Company Overview
10.11.3 Company Product Benchmarking
10.11.4 Company Recent Developments
10.12 SNC-Lavalin Group Inc
10.12.1 Company Snapshot
10.12.2 Company Overview
10.12.3 Company Financial Profile
10.12.4 Company Product Benchmarking
10.12.5 Company Recent Developments
10.13 Worley Engineering services company
10.13.1 Company Snapshot
10.13.2 Company Overview
10.13.3 Company Financial Profile
10.13.4 Company Product Benchmarking
10.13.5 Company Recent Developments
10.14 AECOM
10.14.1 Company Snapshot
10.14.2 Company Overview
10.14.3 Company Financial Profile
10.14.4 Company Product Benchmarking
10.14.5 Company Recent Developments
11 Conclusion and Recommendations
11.1 Conclusion Summary
11.2 Recommendations for Market Players
ページTOPに戻る
List of Tables/Graphs
List of Tables
Table 1 Global Coal Power Decommissioning Market Snapshot, 2023 & 2033 (US$ Million, CAGR %)
Table 2 Coal Power Decommissioning Market Forecast by Region 2023-2033 (US$ Million, AGR%, CAGR%)) ("V" Shaped Recovery)
Table 3 Coal Power Decommissioning Market Forecast by Region 2023-2033 (US$ Million, AGR%, CAGR%)) (“U" Shaped Recovery)
Table 4 Coal Power Decommissioning Market Forecast by Region 2023-2033 (US$ Million, AGR%, CAGR)) (“W" Shaped Recovery)
Table 5 Coal Power Decommissioning Market Forecast by Region 2023-2033 (US$ Million, AGR%, CAGR%)) ("L" Shaped Recovery)
Table 6 Coal Power Decommissioning Market Forecast by Region 2023-2033 (MW, AGR%, CAGR%)) (“V" Shaped Recovery)
Table 7 Coal Power Decommissioning Market Forecast by Region 2023-2033 (MW, AGR%, CAGR%)) (“U" Shaped Recovery)
Table 8 Coal Power Decommissioning Market Forecast by Region 2023-2033 (MW, AGR%, CAGR%)) (“W" Shaped Recovery)
Table 9 Coal Power Decommissioning Market Forecast by Region 2023-2033 (MW, AGR%, CAGR%)) (“L" Shaped Recovery)
Table 10 Global Coal Power Decommissioning Market Forecast by Type, 2023-2033 (US$ Million, AGR%, CAGR%)
Table 11 Global Coal Power Decommissioning Market Forecast by Indication, 2023-2033 (MW, AGR%, CAGR%)
Table 12 Plant Retirement without Decommissioning Market Forecast by Region, 2023-2033 (US$ Million, AGR%, CAGR%)
Table 13 Plant Retirement without Decommissioning Market Forecast by Region, 2023-2033 (MW, AGR%, CAGR%)
Table 14 Repurposing with Fuel Switch Segment Market Forecast by Region, 2023-2033 (US$ Million, AGR%, CAGR%)
Table 15 Repurposing with Fuel Switch Segment Market Forecast by Region, 2023-2033 (MW, AGR%, CAGR%)
Table 16 Redevelopment to Handle Load Pockets or Remote Transmission Segment Market Forecast by Region, 2023-2033 (US$ Million, AGR%, CAGR%)
Table 17 Redevelopment to Handle Load Pockets or Remote Transmission Segment Market Forecast by Region, 2023-2033 (MW, AGR%, CAGR%)
Table 18 Repurposing with Other Commercial Activity Segment Market Forecast by Region, 2023-2033 (US$ Million, AGR%, CAGR%)
Table 19 Repurposing with Other Commercial Activity Segment Market Forecast by Region, 2023-2033 (MW, AGR%, CAGR%)
Table 20 North America Coal Power Decommissioning Market Forecast by Country, 2023-2033 (US$ Million, AGR%, CAGR%)
Table 21 North America Coal Power Decommissioning Market Forecast by Country, 2023-2033 (MW, AGR%, CAGR%)
Table 22 North America Coal Power Decommissioning Market Forecast by Type, 2023-2033 (US$ Million, AGR%, CAGR%)
Table 23 North America Coal Power Decommissioning Market Forecast by Type, 2023-2033 (MW, AGR%, CAGR%)
Table 24 US Coal Power Decommissioning Market Forecast, 2023-2033 (US$ Million, AGR%, CAGR%)
Table 25 US Coal Power Decommissioning Market Forecast, 2023-2033 (MW, AGR%, CAGR%)
Table 26 Canada Coal Power Decommissioning Market Forecast, 2023-2033 (US$ Million, AGR%, CAGR%)
Table 27 Canada Coal Power Decommissioning Market Forecast, 2023-2033 (MW, AGR%, CAGR%)
Table 28 Europe Coal Power Decommissioning Market Forecast by Country, 2023-2033 (US$ Million, AGR%, CAGR%)
Table 29 Europe Coal Power Decommissioning Market Forecast by Country, 2023-2033 (MW, AGR%, CAGR%)
Table 30 Europe Coal Power Decommissioning Market Forecast by Type, 2023-2033 (US$ Million, AGR%, CAGR%)
Table 31 Europe Coal Power Decommissioning Market Forecast by Type, 2023-2033 (MW, AGR%, CAGR%)
Table 32 Germany Coal Power Decommissioning Market Forecast, 2023-2033 (US$ Million, AGR%, CAGR%)
Table 33 Germany Coal Power Decommissioning Market Forecast, 2023-2033 (MW, AGR%, CAGR%)
Table 34 France Coal Power Decommissioning Market Forecast, 2023-2033 (US$ Million, AGR%, CAGR%)
Table 35 France Coal Power Decommissioning Market Forecast, 2023-2033 (MW, AGR%, CAGR%)
Table 36 UK Coal Power Decommissioning Market Forecast, 2023-2033 (US$ Million, AGR%, CAGR%)
Table 37 UK Coal Power Decommissioning Market Forecast, 2023-2033 (MW, AGR%, CAGR%)
Table 38 Spain Coal Power Decommissioning Market Forecast, 2023-2033 (US$ Million, AGR%, CAGR%)
Table 39 Spain Coal Power Decommissioning Market Forecast, 2023-2033 (MW, AGR%, CAGR%)
Table 40 Italy Coal Power Decommissioning Market Forecast, 2023-2033 (US$ Million, AGR%, CAGR%)
Table 41 Italy Coal Power Decommissioning Market Forecast, 2023-2033 (MW, AGR%, CAGR%)
Table 42 Rest of Europe Coal Power Decommissioning Market Forecast, 2023-2033 (US$ Million, AGR%, CAGR%)
Table 43 Rest of Europe Coal Power Decommissioning Market Forecast, 2023-2033 (MW, AGR%, CAGR%)
Table 44 Asia-Pacific Coal Power Decommissioning Market Forecast by Country, 2023-2033 (US$ Million, AGR%, CAGR%)
Table 45 Asia-Pacific Coal Power Decommissioning Market Forecast by Country, 2023-2033 (MW, AGR%, CAGR%)
Table 46 Asia-Pacific Coal Power Decommissioning Market Forecast by Type, 2023-2033 (US$ Million, AGR%, CAGR%)
Table 47 Asia-Pacific Coal Power Decommissioning Market Forecast by Type, 2023-2033 (MW, AGR%, CAGR%)
Table 48 Japan Coal Power Decommissioning Market Forecast, 2023-2033 (US$ Million, AGR%, CAGR%)
Table 49 Japan Coal Power Decommissioning Market Forecast, 2023-2033 (MW, AGR%, CAGR%)
Table 50 China Coal Power Decommissioning Market Forecast, 2023-2033 (US$ Million, AGR%, CAGR%)
Table 51 China Coal Power Decommissioning Market Forecast, 2023-2033 (MW, AGR%, CAGR%)
Table 52 Australia Coal Power Decommissioning Market Forecast, 2023-2033 (US$ Million, AGR%, CAGR%)
Table 53 Australia Coal Power Decommissioning Market Forecast, 2023-2033 (MW, AGR%, CAGR%)
Table 54 India Coal Power Decommissioning Market Forecast, 2023-2033 (US$ Million, AGR%, CAGR%)
Table 55 India Coal Power Decommissioning Market Forecast, 2023-2033 (MW, AGR%, CAGR%)
Table 56 South Korea Coal Power Decommissioning Market Forecast, 2023-2033 (US$ Million, AGR%, CAGR%)
Table 57 South Korea Coal Power Decommissioning Market Forecast, 2023-2033 (MW, AGR%, CAGR%)
Table 58 Rest of Asia-Pacific Coal Power Decommissioning Market Forecast, 2023-2033 (US$ Million, AGR%, CAGR%)
Table 59 Rest of Asia-Pacific Coal Power Decommissioning Market Forecast, 2023-2033 (MW, AGR%, CAGR%)
Table 60 MEA Coal Power Decommissioning Market Forecast by Country, 2023-2033 (US$ Million, AGR%, CAGR%)
Table 61 MEA Coal Power Decommissioning Market Forecast by Country, 2023-2033 (MW, AGR%, CAGR%)
Table 62 MEA Coal Power Decommissioning Market Forecast by Type, 2023-2033 (US$ Million, AGR%, CAGR%)
Table 63 MEA Coal Power Decommissioning Market Forecast by Type, 2023-2033 (MW, AGR%, CAGR%)
Table 64 South Africa Coal Power Decommissioning Market Forecast, 2023-2033 (US$ Million, AGR%, CAGR%)
Table 65 South Africa Coal Power Decommissioning Market Forecast, 2023-2033 (MW, AGR%, CAGR%)
Table 66 UAE Coal Power Decommissioning Market Forecast, 2023-2033 (US$ Million, AGR%, CAGR%)
Table 67 UAE Coal Power Decommissioning Market Forecast, 2023-2033 (MW, AGR%, CAGR%)
Table 68 Rest of MEA Coal Power Decommissioning Market Forecast, 2023-2033 (US$ Million, AGR%, CAGR%)
Table 69 Rest of MEA Coal Power Decommissioning Market Forecast, 2023-2033 (MW, AGR%, CAGR%)
Table 70 AF Gruppen ASA: Company Information
Table 71 AF Gruppen ASA: Company Revenue 2017-2022 (US$ Mn, AGR %)
Table 72 AF Gruppen ASA: Company Product and Service Benchmarking
Table 73 AF Gruppen ASA: Company Recent Developments till Dec,2021
Table 74 D.H. Griffin: Company Information
Table 75 D.H. Griffin: Company Product and Service Benchmarking
Table 76 D.H. Griffin: Company Recent Developments till Dec,2021
Table 77 Keltbray Group: Company Information
Table 78 Keltbray Group: Company Product and Service Benchmarking
Table 79 Keltbray Group: Company Recent Developments till Dec,2021
Table 80 Mott MacDonald: Company Information
Table 81 Mott MacDonald: Company Product and Service Benchmarking
Table 82 Mott MacDonald: Company Recent Developments till Dec,2021
Table 83 AFRY: Company Information
Table 84 AFRY: Company Revenue 2017-2022 (US$ Mn, AGR %)
Table 85 AFRY: Company Product and Service Benchmarking
Table 86 AFRY: Company Recent Developments till Dec,2021
Table 87 Arup Group: Company Information
Table 88 Arup Group: Company Product and Service Benchmarking
Table 89 Arup Group: Company Recent Developments till Dec,2021
Table 90 TRC: Company Information
Table 91 TRC: Company Product and Service Benchmarking
Table 92 TRC: Company Recent Developments till Dec,2021
Table 93 Veolia: Company Information
Table 94 Veolia: Company Revenue 2017-2022 (US$ Mn, AGR %)
Table 95 Veolia: Company Product and Service Benchmarking
Table 96 Veolia: Company Recent Developments till Dec,2021
Table 97 Jacobs: Company Information
Table 98 Jacobs: Company Revenue 2017-2022 (US$ Mn, AGR %)
Table 99 Jacobs: Company Product and Service Benchmarking
Table 100 Jacobs: Company Recent Developments till Dec,2021
Table 101 WSP: Company Information
Table 102 WSP: Company Revenue 2017-2022 (US$ Mn, AGR %)
Table 103 WSP: Company Product and Service Benchmarking
Table 104 WSP: Company Recent Developments till Dec,2021
Table 105 Aurecon: Company Information
Table 106 Aurecon: Company Product and Service Benchmarking
Table 107 Aurecon: Company Recent Developments till Dec,2021
Table 108 SNC: Company Information
Table 109 SNC: Company Revenue 2018-2022 (US$ Mn, AGR %)
Table 110 SNC: Company Product and Service Benchmarking
Table 111 SNC: Company Recent Developments till Dec,2021
Table 112 Worley: Company Information
Table 113 Worley: Company Revenue 2018-2022 (US$ Mn, AGR %)
Table 114 Worley: Company Product and Service Benchmarking
Table 115 Worley: Company Recent Developments till Dec,2021
Table 116 AECOM: Company Information
Table 117 AECOM: Company Revenue 2017-2021(US$ Mn, AGR %)
Table 118 AECOM: Company Product and Service Benchmarking
Table 119 AECOM: Company Recent Developments till Dec,2021
List of Figures
Figure 1 Option for Decommissioning
Figure 2 Global Coal Power Decommissioning Market Segmentation
Figure 3 Global Coal Power Decommissioning Market Forecast by Type: Market Attractiveness Index
Figure 4 Global Coal Power Decommissioning Market Attractiveness Index by Region
Figure 5 Process Steps of Coal Power Plant Decommissioning
Figure 6 Current Trends in the Global Market
Figure 7 Coal Power Decommissioning Market Forecast by Region 2023-2033 (US$ Million, AGR%,)) ("V" Shaped Recovery)
Figure 8 Coal Power Decommissioning Market Forecast by Region 2023-2033 (US$ Million, AGR%)) (“U" Shaped Recovery)
Figure 9 Coal Power Decommissioning Market Forecast by Region 2023-2033 (US$ Million, AGR%,)) (“W" Shaped Recovery)
Figure 10 Coal Power Decommissioning Market Forecast by Region 2023-2033 (US$ Million, AGR%,)) (“L" Shaped Recovery)
Figure 11 Coal Power Decommissioning Market Forecast by region 2023-2033 (MW, AGR%,)): "V" Shaped Recovery
Figure 12 Coal Power Decommissioning Market Forecast by Region 2023-2033 (MW, AGR%,)) (“U" Shaped Recovery)
Figure 13 Coal Power Decommissioning Market Forecast by Region 2023-2033 (MW, AGR%,)) (“W" Shaped Recovery)
Figure 14 Coal Power Decommissioning Market Forecast by Region 2023-2033 (MW, AGR%,)) ( "L" Shaped Recovery
Figure 15 Coal Power Decommissioning Market Forecast by Type: Market Attractiveness Index
Figure 16 Global Coal Power Decommissioning Market Forecast by Type, 2023-2033 (US$ Million, AGR%))
Figure 17 Global Coal Power Decommissioning Market Forecast by Type, 2023-2033 (US$ Million, AGR%,))
Figure 18 Global Coal Power Decommissioning Market Share Forecast by Type, 2023, 2028, 2033 (%)
Figure 19 Plant Retirement without Decommissioning Market Forecast by Region, 2023-2033 (US$ Million, AGR%,))
Figure 20 Plant Retirement without Decommissioning Market Forecast by Region, 2023-2033 (MW, AGR%,))
Figure 21 Plant Retirement without Decommissioning Market Share by Region, 2023-2033 (%)
Figure 22 Repurposing with Fuel Switch Market Forecast by Region, 2023-2033 (US$ Million, AGR%,))
Figure 23 Repurposing with Fuel Switch Market Forecast by Region, 2023-2033 (MW, AGR%,))
Figure 24 Repurposing with Fuel Switch Market Share by Region, 2023-2033 (%)
Figure 25 Redevelopment to Handle Load Pockets or Remote Transmission Market Forecast by Region, 2023-2033 (US$ Million, AGR%,))
Figure 26 Redevelopment to Handle Load Pockets or Remote Transmission Market Forecast by Region, 2023-2033 (MW, AGR%,))
Figure 27 Redevelopment to Handle Load Pockets or Remote Transmission Market Share by Region, 2023-2033 (%)
Figure 28 Repurposing Other Commercial Activity Market Forecast by Region, 2023-2033 (US$ Million, AGR%,))
Figure 29 Repurposing with Other Commercial Activity Market Forecast by Region, 2023-2033 (MW, AGR%,))
Figure 30 Repurposing Other Commercial Activity Market Share by Region, 2023-2033 (%)
Figure 31 North America Coal Power Decommissioning Market Attractiveness Index
Figure 32 North America Coal Power Decommissioning Market by Country, 2023, 2028 & 2033 (US$ Million)
Figure 33 North America Coal Power Decommissioning Market Forecast by Country, 2023-2033 (US$ Million, AGR %)
Figure 34 North America Coal Power Decommissioning Market Forecast by Country, 2023-2033 (MW, AGR %)
Figure 35 North America Coal Power Decommissioning Market Share Forecast by Country, 2023 & 2033 (%)
Figure 36 North America Coal Power Decommissioning Market Forecast by Type, 2023-2033 (US$ Million, AGR%, CAGR%)
Figure 37 North America Coal Power Decommissioning Market Forecast by Type, 2023-2033 (MW, AGR %)
Figure 38 North America Coal Power Decommissioning Market Share Forecast by Type, 2023 & 2033 (%)
Figure 39 US Coal Power Decommissioning Market Forecast, 2023-2033 (US$ Million, AGR %)
Figure 40 US Coal Power Decommissioning Market Forecast, 2023-2033 (MW, AGR %))
Figure 41 Canada Coal Power Decommissioning Market Forecast, 2023-2033 (US$ Million, AGR %)
Figure 42 Canada Coal Power Decommissioning Market Forecast, 2023-2033 (MW, AGR %))
Figure 43 Europe Coal Power Decommissioning Market Attractiveness Index
Figure 44 Europe Coal Power Decommissioning Market by Country, 2023, 2028 & 2033 (US$ Million)
Figure 45 Europe Coal Power Decommissioning Market Forecast by Country, 2023-2033 (US$ Million, AGR %))
Figure 46 Europe Coal Power Decommissioning Market Forecast by Country, 2023-2033 (MW, AGR %))
Figure 47 Europe Coal Power Decommissioning Market Share Forecast by Country, 2023 & 2033 (%)
Figure 48 Europe Coal Power Decommissioning Market Forecast by Type, 2023-2033 (US$ Million, AGR%,))
Figure 49 Europe Coal Power Decommissioning Market Forecast by Type, 2023-2033 (MW, AGR %))
Figure 50 Europe Coal Power Decommissioning Market Share Forecast by Type, 2023 & 2033 (%)
Figure 51 Germany Coal Power Decommissioning Market Forecast, 2023-2033 (US$ Million, AGR %))
Figure 52 Germany Coal Power Decommissioning Market Forecast, 2023-2033 (MW, AGR %))
Figure 53 France Coal Power Decommissioning Market Forecast, 2023-2033 (US$ Million, AGR %))
Figure 54 France Coal Power Decommissioning Market Forecast, 2023-2033 (MW, AGR %))
Figure 55 UK Coal Power Decommissioning Market Forecast, 2023-2033 (US$ Million, AGR %))
Figure 56 UK Coal Power Decommissioning Market Forecast, 2023-2033 (MW, AGR %))
Figure 57 Spain Coal Power Decommissioning Market Forecast, 2023-2033 (US$ Million, AGR %)
Figure 58 Spain Coal Power Decommissioning Market Forecast, 2023-2033 (MW, AGR %))
Figure 59 Italy Coal Power Decommissioning Market Forecast, 2023-2033 (US$ Million, AGR %))
Figure 60 Italy Coal Power Decommissioning Market Forecast, 2023-2033 (MW, AGR %))
Figure 61 Rest of Europe Coal Power Decommissioning Market Forecast, 2023-2033 (US$ Million, AGR %))
Figure 62 Rest of Europe Coal Power Decommissioning Market Forecast, 2023-2033 (MW, AGR %))
Figure 63 APAC Coal Power Decommissioning Market Attractiveness Index
Figure 64 APAC Coal Power Decommissioning Market by Country, 2023, 2028 & 2033 (US$ Million)
Figure 65 APAC Coal Power Decommissioning Market Forecast by Country, 2023-2033 (US$ Million, AGR %))
Figure 66 APAC Coal Power Decommissioning Market Forecast by Country, 2023-2033 (MW, AGR %))
Figure 67 APAC Coal Power Decommissioning Market Share Forecast by Country, 2023 & 2033 (%)
Figure 68 APAC Coal Power Decommissioning Market Forecast by Type, 2023-2033 (US$ Million, AGR%, CAGR%)
Figure 69 APAC Coal Power Decommissioning Market Forecast by Type, 2023-2033 (MW, AGR %))
Figure 70 APAC Coal Power Decommissioning Market Share Forecast by Type, 2023 & 2033 (%)
Figure 71 Japan Coal Power Decommissioning Market Forecast, 2023-2033 (US$ Million, AGR %))
Figure 72 Japan Coal Power Decommissioning Market Forecast, 2023-2033 (MW, AGR %))
Figure 73 China Coal Power Decommissioning Market Forecast, 2023-2033 (US$ Million, AGR %))
Figure 74 China Coal Power Decommissioning Market Forecast, 2023-2033 (MW, AGR %))
Figure 75 Australia Coal Power Decommissioning Market Forecast, 2023-2033 (US$ Million, AGR %))
Figure 76 Australia Coal Power Decommissioning Market Forecast, 2023-2033 (MW, AGR %))
Figure 77 India Coal Power Decommissioning Market Forecast, 2023-2033 (US$ Million, AGR %))
Figure 78 India Coal Power Decommissioning Market Forecast, 2023-2033 (MW, AGR %)
Figure 79 South Korea Power Decommissioning Market Forecast, 2023-2033 (US$ Million, AGR %))
Figure 80 South Korea Coal Power Decommissioning Market Forecast, 2023-2033 (MW, AGR %))
Figure 81 Rest of Asia-Pacific Coal Power Decommissioning Market Forecast, 2023-2033 (US$ Million, AGR %))
Figure 82 Rest of Europe Coal Power Decommissioning Market Forecast, 2023-2033 (MW, AGR %))
Figure 83 MEA Coal Power Decommissioning Market Attractiveness Index
Figure 84 MEA Coal Power Decommissioning Market by Country, 2023, 2028 & 2033 (US$ Million)
Figure 85 MEA Coal Power Decommissioning Market Forecast by Country, 2023-2033 (US$ Million, AGR %))
Figure 86 MEA Coal Power Decommissioning Market Forecast by Country, 2023-2033 (MW, AGR %))
Figure 87 MEA Coal Power Decommissioning Market Share Forecast by Country, 2023 & 2033 (%)
Figure 88 MEA Coal Power Decommissioning Market Forecast by Type, 2023-2033 (US$ Million, AGR%,))
Figure 89 MEA Coal Power Decommissioning Market Forecast by Type, 2023-2033 (MW, AGR %))
Figure 90 MEA Coal Power Decommissioning Market Share Forecast by Type, 2023 & 2033 (%)
Figure 91 South Africa Coal Power Decommissioning Market Forecast, 2023-2033 (US$ Million, AGR %))
Figure 92 South Africa Coal Power Decommissioning Market Forecast, 2023-2033 (MW, AGR %))
Figure 93 UAE Coal Power Decommissioning Market Forecast, 2023-2033 (US$ Million, AGR %))
Figure 94 UAE Coal Power Decommissioning Market Forecast, 2023-2033 (MW, AGR %))
Figure 95 Rest of MEA Coal Power Decommissioning Market Forecast, 2023-2033 (US$ Million, AGR %))
Figure 96 Rest of MEA Coal Power Decommissioning Market Forecast, 2023-2033 (MW, AGR %))
Figure 97 AF Gruppen ASA: Company Revenue 2017-2022 (US$ Mn, AGR %))
Figure 98 AF Gruppen ASA: Company Operating Income 2017-2022(US$ Mn, AGR %))
Figure 99 AFRY: Company Revenue 2017-2022 (US$ Mn, AGR %)
Figure 100 Veolia: Company Revenue 2017-2022 (US$ Mn, AGR %))
Figure 101 Jacobs: Company Revenue 2017-2022 (US$ Mn, AGR %))
Figure 102 WSP: Company Revenue 2017-2022 (US$ Mn, AGR %)
Figure 103 SNC: Company Revenue 2018-2022 (US$ Mn, AGR %))
Figure 104 Worley: Company Revenue 2018-2022 (US$ Mn, AGR %))
Figure 105 AECOM: Company Revenue 2017-2021(US$ Mn, AGR %)
ページTOPに戻る
本レポートと同じKEY WORD(coal)の最新刊レポート
よくあるご質問
Visiongain社はどのような調査会社ですか?
英国の調査会社ヴィジョンゲイン社(Visiongain)は、通信とエネルギーのほか、自動車や化学・医薬品、金属など、広範な市場を対象に調査を行っています。自動車市場については、市場全般に関する調査のほ... もっと見る
調査レポートの納品までの日数はどの程度ですか?
在庫のあるものは速納となりますが、平均的には 3-4日と見て下さい。
但し、一部の調査レポートでは、発注を受けた段階で内容更新をして納品をする場合もあります。
発注をする前のお問合せをお願いします。
注文の手続きはどのようになっていますか?
1)お客様からの御問い合わせをいただきます。
2)見積書やサンプルの提示をいたします。
3)お客様指定、もしくは弊社の発注書をメール添付にて発送してください。
4)データリソース社からレポート発行元の調査会社へ納品手配します。
5) 調査会社からお客様へ納品されます。最近は、pdfにてのメール納品が大半です。
お支払方法の方法はどのようになっていますか?
納品と同時にデータリソース社よりお客様へ請求書(必要に応じて納品書も)を発送いたします。
お客様よりデータリソース社へ(通常は円払い)の御振り込みをお願いします。
請求書は、納品日の日付で発行しますので、翌月最終営業日までの当社指定口座への振込みをお願いします。振込み手数料は御社負担にてお願いします。
お客様の御支払い条件が60日以上の場合は御相談ください。
尚、初めてのお取引先や個人の場合、前払いをお願いすることもあります。ご了承のほど、お願いします。
データリソース社はどのような会社ですか?
当社は、世界各国の主要調査会社・レポート出版社と提携し、世界各国の市場調査レポートや技術動向レポートなどを日本国内の企業・公官庁及び教育研究機関に提供しております。
世界各国の「市場・技術・法規制などの」実情を調査・収集される時には、データリソース社にご相談ください。
お客様の御要望にあったデータや情報を抽出する為のレポート紹介や調査のアドバイスも致します。
|
|


