石油・ガス海底アンビリカル、ライザー、フローライン(SURF)市場レポート:2024-2034
Oil & Gas Subsea Umbilicals, Risers & Flowlines (SURF) Market Report 2024-2034
レポート詳細
石油・ガス海底アンビリカル、ライザー、フローライン(SURF)市場レポート 2024-2034年 :この調査レポートは、業界とその基礎となる原動力をより良く理解することを望むなら、新たな... もっと見る
※上記価格は部署ライセンス(Departmental licence)価格です。
その他の価格についてはデータリソースまでお問合せください。
日本語のページは自動翻訳を利用し作成しています。
実際のレポートは英文のみでご納品いたします。

|

|
サマリー
レポート詳細
石油・ガス海底アンビリカル、ライザー、フローライン(SURF)市場レポート 2024-2034年:この調査レポートは、業界とその基礎となる原動力をより良く理解することを望むなら、新たな収益ポケットを目指す大手企業にとって貴重なものとなるでしょう。異業種への進出や新規地域での既存事業の拡大を目指す企業にも有用です。
深海探査と生産の機会
深海での石油・ガス探査・生産活動への注目が高まっていることが、世界の海底アンビリカル、ライザー、フローライン(SURF)市場の主要な推進力となっている。従来の埋蔵量が枯渇しつつある中、業界は世界のエネルギー需要を満たすため、より深海での探査を余儀なくされている。こうした困難な深海環境から炭化水素を抽出するためには、先進的なSURFシステムの開発が不可欠である。例えば、ペルディド開発のようなメキシコ湾の深海プロジェクトでは、海底から地上施設まで炭化水素を効率的に輸送するため、高度なSURFシステムに大きく依存している。
拡大する海底油田開発
世界的な海底油田開発の増加は、SURF市場の重要な推進要因である。石油・ガス事業者はオフショアポートフォリオを拡大しており、既存のインフラへの海底タイバックや単独の海底開発には、堅牢なSURFシステムが必要である。その一例がバレンツ海のヨハン・カストベルグ・プロジェクトで、海底インフラの開発には、坑井と生産施設を効率的に接続する包括的なSURFソリューションの展開が必要である。
市場調査レポートを購入する前にすべき質問とは?
- 石油・ガス海底アンビリカル、ライザー、フローライン(SURF)市場はどのように進化しているのか?
- 何が石油・ガス海底アンビリカル、ライザー、フローライン(SURF)市場を促進し、抑制しているのか?
- 石油・ガス海底アンビリカル、ライザー、フローライン(SURF)市場の各サブマーケットセグメントは予測期間中にどのように成長し、2034年にどれくらいの収益を占めるのか?
- 2024年から2034年にかけて、石油・ガス海底アンビリカル、ライザー&フローライン(SURF)サブマーケットの各市場シェアはどのように推移するのか?
- 2024年から2034年までの市場全体の主な牽引役は何か?
- 主要な石油・ガス海底アンビリカル、ライザー、フローライン(SURF)市場はマクロ経済の動きに大枠で追随するのか、それとも個々の国市場が他を凌駕するのか?
- 2034年までに各国市場のシェアはどのように変化し、どの地域が2034年に市場をリードするのか?
- 主要プレーヤーと予測期間中の見通しは?
- これらの大手企業の石油・ガス海底アンビリカル、ライザー、フローライン(SURF)プロジェクトとは?
- 2024年から2034年の間に、業界はどのように発展するのか?石油・ガス海底アンビリカル、ライザー、フローライン(SURF)プロジェクトは、現在、そして今後10年間にどのような影響を及ぼすのか?
- 石油・ガス海底アンビリカル、ライザー、フローライン(SURF)市場をさらに拡大するために、製品の商業化の必要性は高まっていますか?
- 石油・ガス海底アンビリカル、ライザー、フローライン(SURF)市場はどこに向かっているのか?
- 新製品やサービスラインへの最適な投資方法とは?
- 企業を新たな成長軌道に乗せ、C-suiteに移行させるための重要な展望とは?
このことが石油・ガス海底アンビリカル、ライザー、フローライン(SURF)市場に現在、そして今後10年間、どのような影響を与えるかを見極める必要がある:
- 431ページにわたる本レポートは、132の表と214の図表で構成されています。
- 本レポートでは、業界における主要な有利分野を取り上げているため、今すぐターゲットを絞ることができます。
- 本レポートには、世界、地域、国の売上と成長に関する詳細な分析が含まれています。
- 競合他社が成功した主なトレンド、変化、収益予測をハイライトしています。
本レポートは、石油・ガス海底アンビリカル、ライザー、フローライン(SURF)市場が今後10年間でどのように発展するか、またCOVID-19の景気後退と好転の変動に合わせてどのように発展するかをTODAYでお伝えします。この市場は、過去10年間のどの時点よりも今が重要である。
2034年までの予測やその他の分析から、商業的な展望が明らかになる
- 2034年までの収益予測に加え、直近の実績、成長率、市場シェアを提供します。
- ビジネスの展望と展開に関する独自の分析をご覧いただけます。
- 定性的分析(市場ダイナミクス、促進要因、機会、阻害要因、課題など)、コスト構造、石油・ガス用海底アンビリカル、ライザー&フローライン(SURF)価格上昇の影響、最近の動向などをご覧いただけます。
本レポートには、COVID-19が業界と貴社にどのような影響を与えるかについてのデータ分析と貴重な洞察が含まれている。本レポートでは、COVID-19の4つの回収パターンとその影響、すなわち「V」、「L」、「W」、「U」について論じている。
レポート対象セグメント
用途別市場セグメント
- 探鉱井
- 生産井
コンポーネント別市場セグメント
- アンビリカル
- ライザー
- フローライン
フローライン別市場セグメント
- 生産ライン
- インジェクションフラウライン
- 輸出用ファウルライン
- その他のフローライン
ライザー別市場市場セグメント
- スチールカテナリーライザー(SCR)
- トップテンションライザー(TTR)
- 鋼製レイジーウェーブライザー
- 浮力式ライザー
- フレキシブル・ハイブリッドライザー
アンビリカル別市場セグメント
- 油圧式アンビリカル
- 電気油圧式アンビリカル
- 電気光学式アンビリカル
- 制御アンビリカル
- インターベンションアンビリカル
- プロダクションアンビリカル
世界市場全体とセグメント別の収益予測に加え、4つの地域と20の主要国市場の収益予測も掲載しています:
北米
- アメリカ
- カナダ
欧州
- ノルウェー
- 英国
- フランス
- ロシア
- デンマーク
- その他の欧州
アジア太平洋
- 中国
- インド
- インドネシア
- マレーシア
- オーストラリア
- その他のアジア太平洋地域
ラテンアメリカ
- ブラジル
- メキシコ
- その他のラテンアメリカ
中東・アフリカ
- GCC
- 南アフリカ
- その他の中東・アフリカ
本レポートには、2024年から2034年までの石油・ガス海底アンビリカル、ライザー、フローライン(SURF)市場の主要企業のプロファイルも含まれており、これらの企業の事業のこのセグメントに焦点を当てています。
主要企業と市場成長の可能性
・ Baker Hughes Company
・ Cameron International Corporation
・ FMC Technologies Inc.
・ General Electric Company
・ Haliburton Corporation
・ JDR Cable Systems Ltd.
・ McDermott International, Ltd
・ National Oilwell Varco Inc.
・ Oceaneering International, Inc.
・ Saipem S.p.A.
・ Siemens AG
・ Subsea 7 S.A.
・ TechnipFMC plc
・ Vallourec S.A.
・ Weatherford International plc
2024年から2034年までの石油・ガス海底アンビリカル、ライザー、フローライン(SURF)市場全体の世界売上高(金額ベース)は、2024年に101億9670万米ドルを突破するとの試算が発表された。2034年まで力強い収益成長を予測しています。当研究所では、最大の可能性を秘めた組織を特定しています。彼らの能力、進歩、商業的展望を発見し、一歩先を行くお手伝いをします。
この調査レポートは石油・ガス海底アンビリカル、ライザー、フローライン(SURF)市場の調査結果を分析・予測したものです。
要約すると、430ページを超えるこのレポートは、以下のような知識を提供する:
- 石油・ガス海底アンビリカル、ライザー、フローライン(SURF)市場の2024年から2034年までの収益予測 用途、コンポーネント、フローライン、ライザー、アンビリカルの各予測を世界および地域レベルで掲載 - 業界の将来性を発見し、投資と収益に最も有利な場所を見つけることができます。
- 4つの地域と20の主要国市場の2034年までの収益予測 - 北米、欧州、アジア太平洋、中南米、中東・アフリカの石油・ガス海底アンビリカル、ライザー、フローライン(SURF)市場の2024年から2034年までの予測をご覧ください。また、米国、カナダ、ブラジル、フランス、ノルウェー、ロシア、中国、インド、インドネシア、オーストラリアなどの経済圏の市場も予測されています。
- 2024年から2034年までの石油・ガス海底アンビリカル、ライザー、フローライン(SURF)市場に関わる主要企業15社の企業プロファイルを含む。
独自の予測による定量的・定性的分析をご覧ください。私たちのレポートだけに含まれる情報を入手し、貴重なビジネスインテリジェンスで情報を得ることができます。
他にはない情報
私たちの新しいレポートがあれば、知識に遅れをとったり、チャンスを逃したりする可能性が低くなります。Visiongainのレポートが貴社の調査、分析、意思決定にどのように役立つかをご覧ください。Visiongainの調査は、石油・ガス海底アンビリカル、ライザー、フローライン(SURF)市場、2024年から2034年、市場をリードする企業の商業分析を必要とするすべての人のためのものです。データ、トレンド、予測をご覧いただけます。
ページTOPに戻る
目次
目次
1 レポート概要
1.1 調査の目的
1.2 石油・ガス海底アンビリカル、ライザー、フローライン(SURF)市場の紹介
1.3 本レポートの内容
1.4 本レポートを読むべき理由
1.5 本分析レポートが回答する主な質問
1.6 本レポートは誰のためのものか?
1.7 方法論
1.7.1 市場の定義
1.7.2 市場評価・予測手法
1.7.3 データの検証
1.7.3.1 一次調査
1.7.3.2 セカンダリーリサーチ
1.8 よくある質問(FAQ)
1.9 Visiongainの関連レポート
1.10 Visiongainについて
2 エグゼクティブ・サマリー
3 市場概要
3.1 主要な調査結果
3.2 市場ダイナミクス
3.2.1 市場促進要因
3.2.1.1 特に深海・超深海地域における海洋探査・生産活動の増加傾向
3.2.1.2 サブシーエンジニアリングと製造における継続的な技術進歩が市場成長の重要な役割を果たす
3.2.1.3 海底生産システムの急速な進歩
3.2.2 市場抑制要因
3.2.2.1 原油部門は、環境へのVOC排出の最大源の一つとして認識されている
3.2.2.2 海洋掘削に伴う高コスト
3.2.2.3 深海掘削と生産活動が環境に与える潜在的な影響は、SURF市場にとっての課題である。
3.2.3 市場機会
3.2.3.1 大手石油・ガス会社による戦略的投資の機会
3.2.3.2 海底インフラ業界における統合の進展
3.2.3.3 オフショアE&P活動に対する厳しい規制の実施
3.3 ポーターのファイブフォース分析
3.3.1 サプライヤーの交渉力(中〜高)
3.3.2 買い手の交渉力(中程度)
3.3.3 競争力(高)
3.3.4 代替品による脅威(低)
3.3.5 新規参入の脅威(高)
3.4 COVID-19の影響分析
3.4.1 "V字型回復"
3.4.2 "U字型回復"
3.4.3 "W字型回復"
3.4.4 "L字型回復"
3.5 PEST分析
4 石油・ガス海底アンビリカル、ライザー、フローライン(SURF)市場分析:用途別
4.1 主要な調査結果
4.2 アプリケーションセグメント 市場魅力度指数
4.3 石油・ガス海底アンビリカル、ライザー、フローライン(SURF)の用途別市場規模推定と予測
4.4 探査井
4.4.1 2024〜2034年の地域別市場規模(US$ Million)
4.4.2 地域別市場シェア、2024年・2034年(%)
4.5 生産井
4.5.1 2024~2034年の地域別市場規模(US$ Million)
4.5.2 地域別市場シェア、2024年・2034年(%)
5 石油・ガス海底アンビリカル、ライザー、フローライン(SURF)市場分析:コンポーネント別
5.1 主要調査結果
5.2 コンポーネントセグメント 市場魅力度指数
5.3 コンポーネント別海底アンビリカル、ライザー、フローライン(SURF)市場規模推定と予測
5.4 アンビリカル
5.4.1 2024〜2034年の地域別市場規模(US$ Million)
5.4.2 地域別市場シェア、2024年・2034年(%)
5.5 ライザー
5.5.1 2024~2034年の地域別市場規模(US$ Million)
5.5.2 地域別市場シェア、2024年・2034年 (%)
5.6 フローライン
5.6.1 2024年~2034年の地域別市場規模(US$ Million)
5.6.2 地域別市場シェア、2024年・2034年 (%)
6 石油・ガス海底アンビリカル、ライザー、フローライン(SURF)市場分析:フローライン別
6.1 主要調査結果
6.2 フローライン部門 市場魅力度指数
6.3 石油・ガス海底アンビリカル、ライザー、フローライン(SURF):フローライン別市場規模推定と予測
6.4 生産用フローライン
6.4.1 2024〜2034年の地域別市場規模(US$ Million)
6.4.2 地域別市場シェア、2024年・2034年(%)
6.5 インジェクション・フラウライン
6.5.1 2024~2034年の地域別市場規模(US$ Million)
6.5.2 地域別市場シェア、2024年・2034年 (%)
6.6 輸出用フローライン
6.6.1 2024~2034年の地域別市場規模(US$ Million)
6.6.2 地域別市場シェア、2024年・2034年 (%)
6.7 その他のフローライン
6.7.1 2024~2034年の地域別市場規模(US$ Million)
6.7.2 地域別市場シェア、2024年・2034年(%)
7 石油・ガス海底アンビリカル、ライザー、フローライン(SURF)市場分析:ライザー別
7.1 主要な調査結果
7.2 ライザーセグメント 市場魅力度指数
7.3 ライザー別の海底アンビリカル、ライザー、フローライン(SURF)市場規模推定と予測
7.4 鋼製カテナリーライザー(SCR)
7.4.1 2024年~2034年の地域別市場規模(US$ Million)
7.4.2 地域別市場シェア、2024年・2034年(%)
7.5 トップテンショナー(TTR)
7.5.1 2024~2034年の地域別市場規模(US$ Million)
7.5.2 地域別市場シェア、2024年・2034年 (%)
7.6 鋼製レイジーウェーブライザー
7.6.1 2024~2034年の地域別市場規模(US$ Million)
7.6.2 地域別市場シェア、2024年・2034年(%)
7.7 浮力式ライザー
7.7.1 2024~2034年の地域別市場規模(US$ Million)
7.7.2 地域別市場シェア、2024年・2034年(%)
7.8 フレキシブル&ハイブリッドライザー
7.8.1 2024~2034年の地域別市場規模(US$ Million)
7.8.2 地域別市場シェア、2024年・2034年(%)
8 アンビリカル別の石油・ガス海底アンビリカル、ライザー、フローライン(SURF)市場分析
8.1 主要な調査結果
8.2 アンビリカルセグメント: 市場魅力度指数
8.3 ライザー別の海底アンビリカル、ライザー、フローライン(SURF)市場規模の推定と予測
8.4 油圧アンビリカル
8.4.1 2024〜2034年の地域別市場規模(US$ Million)
8.4.2 地域別市場シェア、2024年・2034年(%)
8.5 油圧アンビリカル
8.5.1 2024~2034年の地域別市場規模(US$ Million)
8.5.2 地域別市場シェア、2024年・2034年(%)
8.6 電気光学式アンビリカル
8.6.1 2024~2034年の地域別市場規模(US$ Million)
8.6.2 地域別市場シェア、2024年・2034年(%)
8.7 制御アンビリカル
8.7.1 2024~2034年の地域別市場規模(US$ Million)
8.7.2 地域別市場シェア、2024年・2034年(%)
8.8 介入用アンビリカル
8.8.1 2024~2034年の地域別市場規模(US$ Million)
8.8.2 地域別市場シェア、2024年・2034年(%)
8.9 生産用アンビリカル
8.9.1 2024~2034年の地域別市場規模(US$ Million)
8.9.2 地域別市場シェア、2024年・2034年(%)
9 石油・ガス海底アンビリカル、ライザー、フローライン(SURF)市場分析:地域別
9.1 主要な調査結果
9.2 地域別市場規模の推定と予測
10 北米の石油・ガス海底アンビリカル、ライザー、フローライン(SURF)市場分析
10.1 主要な調査結果
10.2 北米の石油・ガス海底アンビリカル、ライザー、フローライン(SURF)市場魅力度指数
10.3 北米の石油・ガス海底アンビリカル、ライザー、フローライン(SURF)国別市場、2024年、2029年、2034年 (US$ Million)
10.4 北米の石油・ガス海底アンビリカル、ライザー、フローライン(SURF)市場規模推定と予測
10.5 北米の石油・ガス海底アンビリカル、ライザー、フローライン(SURF)市場規模推定と予測:国別
10.6 北米の石油・ガス海底アンビリカル、ライザー、フローライン(SURF)市場規模推定と予測:用途別
10.7 北米の石油・ガス海底アンビリカル、ライザー、フローライン(SURF)市場規模推定と予測:コンポーネント別
10.8 北米の石油・ガス海底アンビリカル、ライザー、フローライン(SURF)市場規模推定と予測:フローライン別
10.9 北米の石油・ガス海底アンビリカル、ライザー、フローライン(SURF)市場規模推定と予測:ライザー別
10.10 北米の石油・ガス海底アンビリカル、ライザー、フローライン(SURF)市場規模推定と予測:アンビリカル別
10.11 米国の石油・ガス海底アンビリカル、ライザー、フローライン(SURF)市場分析
10.12 カナダの石油・ガス海底アンビリカル、ライザー、フローライン(SURF)市場分析
11 欧州の石油・ガス海底アンビリカル、ライザー、フローライン(SURF)市場分析
11.1 主要な調査結果
11.2 欧州の石油・ガス海底アンビリカル、ライザー、フローライン(SURF)市場魅力度指数
11.3 欧州の石油・ガス海底アンビリカル、ライザー、フローライン(SURF)国別市場、2024年、2029年、2034年 (US$ Million)
11.4 欧州の石油・ガス海底アンビリカル、ライザー、フローライン(SURF)市場規模推定と予測
11.5 欧州の石油・ガス海底アンビリカル、ライザー、フローライン(SURF)市場規模推定と予測:国別
11.6 欧州の石油・ガス海底アンビリカル、ライザー、フローライン(SURF)市場規模推定と予測:用途別
11.7 欧州の石油・ガス海底アンビリカル、ライザー、フローライン(SURF)市場規模推定と予測:コンポーネント別
11.8 欧州の石油・ガス海底アンビリカル、ライザー、フローライン(SURF)市場規模推定と予測:フローライン別
11.9 欧州の石油・ガス海底アンビリカル、ライザー、フローライン(SURF)市場規模推定と予測:ライザー別
11.10 欧州の石油・ガス海底アンビリカル、ライザー、フローライン(SURF)市場規模推定と予測:アンビリカル別
11.11 ノルウェーの石油・ガス海底アンビリカル、ライザー、フローライン(SURF)市場分析
11.12 イギリスの石油・ガス海底アンビリカル、ライザー、フローライン(SURF)市場分析
11.13 フランスの石油・ガス海底アンビリカル、ライザー、フローライン(SURF)市場分析
11.14 ロシアの石油・ガス海底アンビリカル、ライザー、フローライン(SURF)市場分析
11.15 デンマークの石油・ガス海底アンビリカル、ライザー、フローライン(SURF)市場分析
11.16 その他の欧州の石油・ガス海底アンビリカル、ライザー、フローライン(SURF)市場分析
12 アジア太平洋地域の石油・ガス海底アンビリカル、ライザー、フローライン(SURF)市場分析
12.1 主要な調査結果
12.2 アジア太平洋地域の石油・ガス海底アンビリカル、ライザー、フローライン(SURF)市場魅力度指数
12.3 アジア太平洋地域の石油・ガス海底アンビリカル、ライザー、フローライン(SURF)国別市場、2024年、2029年、2034年 (US$ Million)
12.4 アジア太平洋地域の石油・ガス海底アンビリカル、ライザー、フローライン(SURF)市場規模推定と予測
12.5 アジア太平洋地域の石油・ガス海底アンビリカル、ライザー、フローライン(SURF)市場規模推定と予測:国別
12.6 アジア太平洋地域の石油・ガス海底アンビリカル、ライザー、フローライン(SURF)市場規模推定と予測:用途別
12.7 アジア太平洋地域の石油・ガス海底アンビリカル、ライザー、フローライン(SURF)市場規模推定と予測:コンポーネント別
12.8 アジア太平洋地域の石油・ガス海底アンビリカル、ライザー、フローライン(SURF)市場規模推定と予測:フローライン別
12.9 アジア太平洋地域の石油・ガス海底アンビリカル、ライザー、フローライン(SURF)市場規模推定と予測:ライザー別
12.10 アジア太平洋地域の石油・ガス海底アンビリカル、ライザー、フローライン(SURF)市場規模推定と予測:アンビリカル別
12.11 中国の石油・ガス海底アンビリカル、ライザー、フローライン(SURF)市場分析
12.12 インドの石油・ガス海底アンビリカル、ライザー、フローライン(SURF)市場分析
12.13 インドネシアの石油・ガス海底アンビリカル、ライザー、フローライン(SURF)市場分析
12.14 マレーシアの石油・ガス海底アンビリカル、ライザー、フローライン(SURF)市場分析
12.15 オーストラリアの石油・ガス海底アンビリカル、ライザー、フローライン(SURF)市場分析
12.16 その他のアジア太平洋地域の海底アンビリカル、ライザー、フローライン(SURF)市場分析
13 中東・アフリカの石油・ガス海底アンビリカル、ライザー、フローライン(SURF)市場分析
13.1 主要な調査結果
13.2 中東・アフリカの石油・ガス海底アンビリカル、ライザー、フローライン(SURF)市場魅力度指数
13.3 中東・アフリカの石油・ガス海底アンビリカル、ライザー、フローライン(SURF)国別市場、2024年、2029年、2034年 (US$ Million)
13.4 中東・アフリカの石油・ガス海底アンビリカル、ライザー、フローライン(SURF)市場規模推定と予測
13.5 中東・アフリカの石油・ガス海底アンビリカル、ライザー、フローライン(SURF)市場規模推定と予測:国別
13.6 中東・アフリカの石油・ガス海底アンビリカル、ライザー、フローライン(SURF)市場規模推定と予測:用途別
13.7 中東・アフリカの石油・ガス海底アンビリカル、ライザー、フローライン(SURF)市場規模推定と予測:コンポーネント別
13.8 中東・アフリカの石油・ガス海底アンビリカル、ライザー、フローライン(SURF)市場規模推定と予測:フローライン別
13.9 中東・アフリカの石油・ガス海底アンビリカル、ライザー、フローライン(SURF)市場規模推定と予測:ライザー別
13.10 中東・アフリカの石油・ガス海底アンビリカル、ライザー、フローライン(SURF)市場規模推定と予測:アンビリカル別
13.11 GCCの石油・ガス海底アンビリカル、ライザー、フローライン(SURF)市場分析
13.12 南アフリカの石油・ガス海底アンビリカル、ライザー、フローライン(SURF)市場分析
13.13 その他の中東・アフリカの石油・ガス海底アンビリカル、ライザー、フローライン(SURF)市場分析
14 ラテンアメリカの石油・ガス海底アンビリカル、ライザー、フローライン(SURF)市場分析
14.1 主要な調査結果
14.2 ラテンアメリカの石油・ガス海底アンビリカル、ライザー、フローライン(SURF)市場魅力度指数
14.3 ラテンアメリカの石油・ガス海底アンビリカル、ライザー、フローライン(SURF)国別市場、2024年、2029年、2034年 (US$ Million)
14.4 ラテンアメリカの石油・ガス海底アンビリカル、ライザー、フローライン(SURF)市場規模推定と予測
14.5 ラテンアメリカの石油・ガス海底アンビリカル、ライザー、フローライン(SURF)市場規模推定と予測:国別
14.6 ラテンアメリカの石油・ガス海底アンビリカル、ライザー、フローライン(SURF)市場規模推定と予測:用途別
14.7 ラテンアメリカの石油・ガス海底アンビリカル、ライザー、フローライン(SURF)市場規模推定と予測:コンポーネント別
14.8 ラテンアメリカの石油・ガス海底アンビリカル、ライザー、フローライン(SURF)市場規模推定と予測:フローライン別
14.9 ラテンアメリカの海底アンビリカル、ライザー&フローライン(SURF)市場規模推定と予測:ライザー別
14.10 ラテンアメリカの海底アンビリカル、ライザー、フローライン(SURF)市場規模推定と予測:アンビリカル別
14.11 ブラジルの石油・ガス海底アンビリカル、ライザー、フローライン(SURF)市場分析
14.12 メキシコの石油・ガス海底アンビリカル、ライザー、フローライン(SURF)市場分析
14.13 その他のラテンアメリカの石油・ガス海底アンビリカル、ライザー、フローライン(SURF)市場分析
15 会社概要
15.1 競争環境、2022年
15.2 戦略的展望
15.3 Subsea 7 S.A.
15.3.1 会社概要
15.3.2 会社概要
15.3.3 財務分析
15.3.4 純収入、2018-2022年
15.3.4.1 売上高、2018-2022年
15.3.5 製品ベンチマーク
15.3.6 戦略的展望
15.4 TechnipFMC plc
15.4.1 会社概要
15.4.2 会社概要
15.4.3 財務分析
15.4.4 純収入、2018-2022年
15.4.4.1 R&D、2018年~2022年
15.4.4.2 地域別収益シェア、2022年(%)
15.4.4.3 事業セグメント別売上シェア、2022年(%)
15.4.5 製品ベンチマーク
15.4.6 戦略的展望
15.5 Saipem S.p.A.
15.5.1 会社概要
15.5.2 会社概要
15.5.3 財務分析
15.5.4 純収入、2018-2022年
15.5.4.1 R&D、2018年〜2022年
15.5.4.2 地域別収益シェア、2022年(%)
15.5.4.3 事業セグメント別売上シェア、2022年(%)
15.5.5 製品ベンチマーク
15.5.6 戦略的展望
15.6 McDermott International, Ltd
15.6.1 会社概要
15.6.2 会社概要
15.6.3 製品ベンチマーク
15.6.4 戦略的展望
15.7 Oceaneering International, Inc.
15.7.1 会社概要
15.7.2 会社概要
15.7.3 財務分析
15.7.4 純収入、2018年~2022年
15.7.4.1 事業セグメント別売上高シェア、2022年(%)
15.7.5 製品ベンチマーク
15.7.6 戦略的展望
15.8 Vallourec S.A.
15.8.1 会社概要
15.8.2 会社概要
15.8.3 財務分析
15.8.4 純収入、2018年~2022年
15.8.4.1 事業セグメント別売上高シェア、2022年(%)
15.8.5 製品ベンチマーク
15.8.6 戦略的展望
15.9 JDR Cable Systems Ltd.
15.9.1 会社概要
15.9.2 会社概要
15.9.3 製品ベンチマーク
15.9.4 戦略的展望
15.10 Siemens AG
15.10.1 会社概要
15.10.2 会社概要
15.10.3 財務分析
15.10.4 純収入、2018-2022年
15.10.4.1 売上高、2018年~2022年
15.10.4.2 地域別収益シェア、2022年(%)
15.10.4.3 事業セグメント別売上シェア、2022年(%)
15.10.5 製品ベンチマーク
15.10.6 戦略的展望
15.11 NOV Inc.
15.11.1 会社概要
15.11.2 会社概要
15.11.3 財務分析
15.11.4 純収入、2018年~2022年
15.11.4.1 地域別収入シェア、2022年(%)
15.11.4.2 事業セグメント別売上シェア、2022年(%)
15.11.5 製品ベンチマーク
15.11.6 戦略的展望
15.12 Baker Hughes Company
15.12.1 会社概要
15.12.2 会社概要
15.12.3 財務分析
15.12.4 純収入、2018-2022年
15.12.4.1 R&D、2018年~2022年
15.12.4.2 地域別売上シェア、2022年 (%)
15.12.4.3 事業セグメント別売上シェア、2022年(%)
15.12.5 製品ベンチマーク
15.12.6 戦略的展望
15.13 Weatherford International plc
15.13.1 会社概要
15.13.2 会社概要
15.13.3 財務分析
15.13.4 純収入、2018年~2022年
15.13.4.1 R&D、2018年~2022年
15.13.4.2 地域別売上シェア、2022年(%)
15.13.4.3 事業セグメント別売上シェア、2022年(%)
15.13.5 製品ベンチマーク
15.13.6 戦略的展望
15.14 General Electric Company
15.14.1 会社概要
15.14.2 会社概要
15.14.3 財務分析
15.14.4 純収入、2018-2022年
15.14.4.1 R&D、2018年〜2022年
15.14.4.2 地域別収入シェア、2022年(%)
15.14.4.3 事業セグメント別売上シェア、2022年(%)
15.14.5 製品ベンチマーク
15.14.6 戦略的展望
15.15 Haliburton Corporation
15.15.1 会社概要
15.15.2 会社概要
15.15.3 財務分析
15.15.4 純収入、2018年~2022年
15.15.4.1 R&D、2018年~2022年
15.15.4.2 地域別収益シェア、2022年(%)
15.15.4.3 事業セグメント別売上高シェア、2022年(%)
15.15.5 製品ベンチマーク
15.15.6 戦略的展望
15.16 FMC Technologies Inc
15.16.1 会社概要
15.16.2 会社概要
15.16.3 財務分析
15.16.4 純収入、2018-2022年
15.16.4.1 R&D、2018年〜2022年
15.16.4.2 地域別収益シェア、2022年(%)
15.16.4.3 事業セグメント別売上シェア、2022年(%)
15.16.5 製品ベンチマーク
15.16.6 戦略的展望
15.17 Cameron International Corporation
15.17.1 会社概要
15.17.2 会社概要
15.17.3 財務分析
15.17.4 純収入、2018-2022年
15.17.4.1 売上高、2018年~2022年
15.17.4.2 地域別売上シェア、2022年(%)
15.17.4.3 事業セグメント別売上シェア、2022年(%)
15.17.5 製品ベンチマーク
15.17.6 戦略的展望
16 結論と提言
16.1 Visiongainからの結びの言葉
16.2 市場プレイヤーへの提言
ページTOPに戻る
図表リスト
表の一覧
Table 1 Oil & Gas Subsea Umbilical, Risers & Flowlines (SURF) Market Snapshot, 2024 & 2034 (US$ Million, CAGR %)
Table 2 Global Oil & Gas Subsea Umbilical, Risers & Flowlines (SURF) Market by Region, 2024-2034 (US$ Mn, AGR (%), CAGR (%)) (V-Shaped Recovery Scenario)
Table 3 Global Oil & Gas Subsea Umbilical, Risers & Flowlines (SURF) Market by Region, 2024-2034 (US$ Mn, AGR (%), CAGR (%)) (U-Shaped Recovery Scenario)
Table 4 Global Oil & Gas Subsea Umbilical, Risers & Flowlines (SURF) Market by Region, 2024-2034 (US$ Mn, AGR (%), CAGR (%)) (W-Shaped Recovery Scenario)
Table 5 Global Oil & Gas Subsea Umbilical, Risers & Flowlines (SURF) Market by Region, 2024-2034 (US$ Mn, AGR (%), CAGR (%)) (L-Shaped Recovery Scenario)
Table 6 Global Oil & Gas Subsea Umbilical, Risers & Flowlines (SURF) Market by Application, 2024-2034 (US$ Mn, AGR (%), CAGR (%))
Table 7 Exploration Wells Market by Region, 2024-2034 (US$ Mn, AGR (%), CAGR (%))
Table 8 Production Wells Market by Region, 2024-2034 (US$ Mn, AGR (%), CAGR (%))
Table 9 Global Oil & Gas Subsea Umbilical, Risers & Flowlines (SURF) Market by Component, 2024-2034 (US$ Mn, AGR (%), CAGR (%))
Table 10 Umbilical Market by Region, 2024-2034 (US$ Mn, AGR (%), CAGR (%))
Table 11 Risers Market by Region, 2024-2034 (US$ Mn, AGR (%), CAGR (%))
Table 12 Flowlines Market by Region, 2024-2034 (US$ Mn, AGR (%), CAGR (%))
Table 13 Global Oil & Gas Subsea Umbilical, Risers & Flowlines (SURF) Market by Flowlines, 2024-2034 (US$ Mn, AGR (%), CAGR (%))
Table 14 Production Flowlines Market by Region, 2024-2034 (US$ Mn, AGR (%), CAGR (%))
Table 15 Injection Flowlines Market by Region, 2024-2034 (US$ Mn, AGR (%), CAGR (%))
Table 16 Export Flowlines Market by Region, 2024-2034 (US$ Mn, AGR (%), CAGR (%))
Table 17 Other Flowlines Market by Region, 2024-2034 (US$ Mn, AGR (%), CAGR (%))
Table 18 Global Oil & Gas Subsea Umbilical, Risers & Flowlines (SURF) Market by Risers, 2024-2034 (US$ Mn, AGR (%), CAGR (%))
Table 19 Steel Catenary Risers (SCR) Market by Region, 2024-2034 (US$ Mn, AGR (%), CAGR (%))
Table 20 Top Tensioned Risers (TTR) Market by Region, 2024-2034 (US$ Mn, AGR (%), CAGR (%))
Table 21 Steel Lazy Wave Risers Market by Region, 2024-2034 (US$ Mn, AGR (%), CAGR (%))
Table 22 Buoyant Risers Market by Region, 2024-2034 (US$ Mn, AGR (%), CAGR (%))
Table 23 Flexible & Hybrid Risers Market by Region, 2024-2034 (US$ Mn, AGR (%), CAGR (%))
Table 24 Global Oil & Gas Subsea Umbilical, Risers & Flowlines (SURF) Market by Umbilical, 2024-2034 (US$ Mn, AGR (%), CAGR (%))
Table 25 Hydraulic Umbilical Market by Region, 2024-2034 (US$ Mn, AGR (%), CAGR (%))
Table 26 Electro Hydraulic Umbilical Market by Region, 2024-2034 (US$ Mn, AGR (%), CAGR (%))
Table 27 Electro-Optical Umbilical Market by Region, 2024-2034 (US$ Mn, AGR (%), CAGR (%))
Table 28 Control Umbilical Market by Region, 2024-2034 (US$ Mn, AGR (%), CAGR (%))
Table 29 Intervention Umbilical Market by Region, 2024-2034 (US$ Mn, AGR (%), CAGR (%))
Table 30 Production Umbilical Market by Region, 2024-2034 (US$ Mn, AGR (%), CAGR (%))
Table 31 Oil & Gas Subsea Umbilical, Risers & Flowlines (SURF) Market Forecast by Region, 2024-2034 (US$ Million, AGR%, CAGR%)
Table 32 North America Oil & Gas Subsea Umbilical, Risers & Flowlines (SURF) Market by Value, 2024-2034 (US$ Mn, AGR (%), CAGR (%))
Table 33 North America Oil & Gas Subsea Umbilical, Risers & Flowlines (SURF) Market by Country, 2024-2034 (US$ Mn, AGR (%), CAGR (%))
Table 34 North America Oil & Gas Subsea Umbilical, Risers & Flowlines (SURF) Market by Application, 2024-2034 (US$ Mn, AGR (%), CAGR (%))
Table 35 North America Oil & Gas Subsea Umbilical, Risers & Flowlines (SURF) Market by Component, 2024-2034 (US$ Mn, AGR (%), CAGR (%))
Table 36 North America Oil & Gas Subsea Umbilical, Risers & Flowlines (SURF) Market by Flowlines, 2024-2034 (US$ Mn, AGR (%), CAGR (%))
Table 37 North America Oil & Gas Subsea Umbilical, Risers & Flowlines (SURF) Market by Risers, 2024-2034 (US$ Mn, AGR (%), CAGR (%))
Table 38 North America Oil & Gas Subsea Umbilical, Risers & Flowlines (SURF) Market by Umbilical, 2024-2034 (US$ Mn, AGR (%), CAGR (%))
Table 39 US Oil & Gas Subsea Umbilical, Risers & Flowlines (SURF) Market by Value, 2024-2034 (US$ Mn, AGR (%), CAGR (%))
Table 40 Canada Oil & Gas Subsea Umbilical, Risers & Flowlines (SURF) Market by Value, 2024-2034 (US$ Mn, AGR (%), CAGR (%))
Table 41 Europe Oil & Gas Subsea Umbilical, Risers & Flowlines (SURF) Market by Value, 2024-2034 (US$ Mn, AGR (%), CAGR (%))
Table 42 Europe Oil & Gas Subsea Umbilical, Risers & Flowlines (SURF) Market by Country, 2024-2034 (US$ Mn, AGR (%), CAGR (%))
Table 43 Europe Oil & Gas Subsea Umbilical, Risers & Flowlines (SURF) Market by Application, 2024-2034 (US$ Mn, AGR (%), CAGR (%))
Table 44 Europe Oil & Gas Subsea Umbilical, Risers & Flowlines (SURF) Market by Component, 2024-2034 (US$ Mn, AGR (%), CAGR (%))
Table 45 Europe Oil & Gas Subsea Umbilical, Risers & Flowlines (SURF) Market by Flowlines, 2024-2034 (US$ Mn, AGR (%), CAGR (%))
Table 46 Europe Oil & Gas Subsea Umbilical, Risers & Flowlines (SURF) Market by Risers, 2024-2034 (US$ Mn, AGR (%), CAGR (%))
Table 47 Europe Oil & Gas Subsea Umbilical, Risers & Flowlines (SURF) Market by Umbilical, 2024-2034 (US$ Mn, AGR (%), CAGR (%))
Table 48 Norway Oil & Gas Subsea Umbilical, Risers & Flowlines (SURF) Market by Value, 2024-2034 (US$ Mn, AGR (%), CAGR (%))
Table 49 UK Oil & Gas Subsea Umbilical, Risers & Flowlines (SURF) Market by Value, 2024-2034 (US$ Mn, AGR (%), CAGR (%))
Table 50 France Oil & Gas Subsea Umbilical, Risers & Flowlines (SURF) Market by Value, 2024-2034 (US$ Mn, AGR (%), CAGR (%))
Table 51 Russia Oil & Gas Subsea Umbilical, Risers & Flowlines (SURF) Market by Value, 2024-2034 (US$ Mn, AGR (%), CAGR (%))
Table 52 Denmark Oil & Gas Subsea Umbilical, Risers & Flowlines (SURF) Market by Value, 2024-2034 (US$ Mn, AGR (%), CAGR (%))
Table 53 Rest of Europe Oil & Gas Subsea Umbilical, Risers & Flowlines (SURF) Market by Value, 2024-2034 (US$ Mn, AGR (%), CAGR (%))
Table 54 Asia-Pacific Oil & Gas Subsea Umbilical, Risers & Flowlines (SURF) Market by Value, 2024-2034 (US$ Mn, AGR (%), CAGR (%))
Table 55 Asia-Pacific Oil & Gas Subsea Umbilical, Risers & Flowlines (SURF) Market by Country, 2024-2034 (US$ Mn, AGR (%), CAGR (%))
Table 56 Asia-Pacific Oil & Gas Subsea Umbilical, Risers & Flowlines (SURF) Market by Application, 2024-2034 (US$ Mn, AGR (%), CAGR (%))
Table 57 Asia-Pacific Oil & Gas Subsea Umbilical, Risers & Flowlines (SURF) Market by Component, 2024-2034 (US$ Mn, AGR (%), CAGR (%))
Table 58 Asia-Pacific Oil & Gas Subsea Umbilical, Risers & Flowlines (SURF) Market by Flowlines, 2024-2034 (US$ Mn, AGR (%), CAGR (%))
Table 59 Asia-Pacific Oil & Gas Subsea Umbilical, Risers & Flowlines (SURF) Market by Risers, 2024-2034 (US$ Mn, AGR (%), CAGR (%))
Table 60 Asia-Pacific Oil & Gas Subsea Umbilical, Risers & Flowlines (SURF) Market by Umbilical, 2024-2034 (US$ Mn, AGR (%), CAGR (%))
Table 61 China Oil & Gas Subsea Umbilical, Risers & Flowlines (SURF) Market by Value, 2024-2034 (US$ Mn, AGR (%), CAGR (%))
Table 62 India Oil & Gas Subsea Umbilical, Risers & Flowlines (SURF) Market by Value, 2024-2034 (US$ Mn, AGR (%), CAGR (%))
Table 63 Indonesia Oil & Gas Subsea Umbilical, Risers & Flowlines (SURF) Market by Value, 2024-2034 (US$ Mn, AGR (%), CAGR (%))
Table 64 Malaysia Oil & Gas Subsea Umbilical, Risers & Flowlines (SURF) Market by Value, 2024-2034 (US$ Mn, AGR (%), CAGR (%))
Table 65 Australia Oil & Gas Subsea Umbilical, Risers & Flowlines (SURF) Market by Value, 2024-2034 (US$ Mn, AGR (%), CAGR (%))
Table 66 Rest of Asia-Pacific Oil & Gas Subsea Umbilical, Risers & Flowlines (SURF) Market by Value, 2024-2034 (US$ Mn, AGR (%), CAGR (%))
Table 67 Middle East & Africa Oil & Gas Subsea Umbilical, Risers & Flowlines (SURF) Market by Value, 2024-2034 (US$ Mn, AGR (%), CAGR (%))
Table 68 Middle East & Africa Oil & Gas Subsea Umbilical, Risers & Flowlines (SURF) Market by Country, 2024-2034 (US$ Mn, AGR (%), CAGR (%))
Table 69 Middle East & Africa Oil & Gas Subsea Umbilical, Risers & Flowlines (SURF) Market by Application, 2024-2034 (US$ Mn, AGR (%), CAGR (%))
Table 70 Middle East & Africa Oil & Gas Subsea Umbilical, Risers & Flowlines (SURF) Market by Component, 2024-2034 (US$ Mn, AGR (%), CAGR (%))
Table 71 Middle East & Africa Oil & Gas Subsea Umbilical, Risers & Flowlines (SURF) Market by Flowlines, 2024-2034 (US$ Mn, AGR (%), CAGR (%))
Table 72 Middle East & Africa Oil & Gas Subsea Umbilical, Risers & Flowlines (SURF) Market by Risers, 2024-2034 (US$ Mn, AGR (%), CAGR (%))
Table 73 Middle East & Africa Oil & Gas Subsea Umbilical, Risers & Flowlines (SURF) Market by Umbilical, 2024-2034 (US$ Mn, AGR (%), CAGR (%))
Table 74 GCC Oil & Gas Subsea Umbilical, Risers & Flowlines (SURF) Market by Value, 2024-2034 (US$ Mn, AGR (%), CAGR (%))
Table 75 South Africa Oil & Gas Subsea Umbilical, Risers & Flowlines (SURF) Market by Value, 2024-2034 (US$ Mn, AGR (%), CAGR (%))
Table 76 Rest of Middle East & Africa Oil & Gas Subsea Umbilical, Risers & Flowlines (SURF) Market by Value, 2024-2034 (US$ Mn, AGR (%), CAGR (%))
Table 77 Latin America Oil & Gas Subsea Umbilical, Risers & Flowlines (SURF) Market by Value, 2024-2034 (US$ Mn, AGR (%), CAGR (%))
Table 78 Latin America Oil & Gas Subsea Umbilical, Risers & Flowlines (SURF) Market by Country, 2024-2034 (US$ Mn, AGR (%), CAGR (%))
Table 79 Latin America Oil & Gas Subsea Umbilical, Risers & Flowlines (SURF) Market by Application, 2024-2034 (US$ Mn, AGR (%), CAGR (%))
Table 80 Latin America Oil & Gas Subsea Umbilical, Risers & Flowlines (SURF) Market by Component, 2024-2034 (US$ Mn, AGR (%), CAGR (%))
Table 81 Latin America Oil & Gas Subsea Umbilical, Risers & Flowlines (SURF) Market by Flowlines, 2024-2034 (US$ Mn, AGR (%), CAGR (%))
Table 82 Latin America Oil & Gas Subsea Umbilical, Risers & Flowlines (SURF) Market by Risers, 2024-2034 (US$ Mn, AGR (%), CAGR (%))
Table 83 Latin America Oil & Gas Subsea Umbilical, Risers & Flowlines (SURF) Market by Umbilical, 2024-2034 (US$ Mn, AGR (%), CAGR (%))
Table 84 Brazil Oil & Gas Subsea Umbilical, Risers & Flowlines (SURF) Market by Value, 2024-2034 (US$ Mn, AGR (%), CAGR (%))
Table 85 Mexico Oil & Gas Subsea Umbilical, Risers & Flowlines (SURF) Market by Value, 2024-2034 (US$ Mn, AGR (%), CAGR (%))
Table 86 Rest of Latin America Oil & Gas Subsea Umbilical, Risers & Flowlines (SURF) Market by Value, 2024-2034 (US$ Mn, AGR (%), CAGR (%))
Table 87 Strategic Outlook - Contract
Table 88 Subsea 7 S.A.: Key Details, (CEO, HQ, Revenue, Founded, No. of Employees, Company Type, Website, Business Segment)
Table 89 Subsea 7 S.A.: Product Benchmarking
Table 90 Subsea 7 S.A.: Strategic Outlook
Table 91 TechnipFMC plc: Key Details, (CEO, HQ, Revenue, Founded, No. of Employees, Company Type, Website, Business Segment)
Table 92 TechnipFMC plc: Product Benchmarking
Table 93 TechnipFMC plc: Strategic Outlook
Table 94 Saipem S.p.A.: Key Details, (CEO, HQ, Revenue, Founded, No. of Employees, Company Type, Website, Business Segment)
Table 95 Saipem S.p.A.: Product Benchmarking
Table 96 Saipem S.p.A.: Strategic Outlook
Table 97 McDermott International, Ltd: Key Details, (CEO, HQ, Revenue, Founded, No. of Employees, Company Type, Website, Business Segment)
Table 98 McDermott International, Ltd: Product Benchmarking
Table 99 McDermott International, Ltd: Strategic Outlook
Table 100 Oceaneering International, Inc.: Key Details, (CEO, HQ, Revenue, Founded, No. of Employees, Company Type, Website, Business Segment)
Table 101 Oceaneering International, Inc.: Product Benchmarking
Table 102 Oceaneering International, Inc. Strategic Outlook
Table 103 Vallourec S.A.: Key Details, (CEO, HQ, Revenue, Founded, No. of Employees, Company Type, Website, Business Segment)
Table 104 Vallourec S.A.: Product Benchmarking
Table 105 Vallourec S.A.: Strategic Outlook
Table 106 JDR Cable Systems Ltd.: Key Details, (CEO, HQ, Revenue, Founded, No. of Employees, Company Type, Website, Business Segment)
Table 107 JDR Cable Systems Ltd.: Product Benchmarking
Table 108 JDR Cable Systems Ltd.: Strategic Outlook
Table 109 Siemens AG: Key Details, (CEO, HQ, Revenue, Founded, No. of Employees, Company Type, Website, Business Segment)
Table 110 Siemens AG: Product Benchmarking
Table 111 Siemens AG: Strategic Outlook
Table 112 NOV Inc: Key Details, (CEO, HQ, Revenue, Founded, No. of Employees, Company Type, Website, Business Segment)
Table 113 NOV Inc: Product Benchmarking
Table 114 NOV Inc: Strategic Outlook
Table 115 Baker Hughes Company: Key Details, (CEO, HQ, Revenue, Founded, No. of Employees, Company Type, Website, Business Segment)
Table 116 Baker Hughes Company: Product Benchmarking
Table 117 Baker Hughes Company: Strategic Outlook
Table 118 Weatherford International plc: Key Details, (CEO, HQ, Revenue, Founded, No. of Employees, Company Type, Website, Business Segment)
Table 119 Weatherford International plc: Product Benchmarking
Table 120 Weatherford International plc: Strategic Outlook
Table 121 General Electric Company: Key Details, (CEO, HQ, Revenue, Founded, No. of Employees, Company Type, Website, Business Segment)
Table 122 General Electric Company: Product Benchmarking
Table 123 General Electric Company: Strategic Outlook
Table 124 Haliburton Corporation: Key Details, (CEO, HQ, Revenue, Founded, No. of Employees, Company Type, Website, Business Segment)
Table 125 Haliburton Corporation: Product Benchmarking
Table 126 Haliburton Corporation: Strategic Outlook
Table 127 FMC Technologies Inc: Key Details, (CEO, HQ, Revenue, Founded, No. of Employees, Company Type, Website, Business Segment)
Table 128 FMC Technologies Inc: Product Benchmarking
Table 129 FMC Technologies Inc: Strategic Outlook
Table 130 Cameron International Corporation: Key Details, (CEO, HQ, Revenue, Founded, No. of Employees, Company Type, Website, Business Segment)
Table 131 Cameron International Corporation: Product Benchmarking
Table 132 Cameron International Corporation: Strategic Outlook
図の一覧
Figure 1 Oil & Gas Subsea Umbilical, Risers & Flowlines (SURF) Market Segmentation
Figure 2 Oil & Gas Subsea Umbilical, Risers & Flowlines (SURF) Market by Application: Market Attractiveness Index
Figure 3 Oil & Gas Subsea Umbilical, Risers & Flowlines (SURF) Market by Component: Market Attractiveness Index
Figure 4 Oil & Gas Subsea Umbilical, Risers & Flowlines (SURF) Market by Flowlines: Market Attractiveness Index
Figure 5 Oil & Gas Subsea Umbilical, Risers & Flowlines (SURF) Market by Risers: Market Attractiveness Index
Figure 6 Oil & Gas Subsea Umbilical, Risers & Flowlines (SURF) Market by Umbilical: Market Attractiveness Index
Figure 7 Oil & Gas Subsea Umbilical, Risers & Flowlines (SURF) Market Attractiveness Index by Region
Figure 8 Oil & Gas Subsea Umbilical, Risers & Flowlines (SURF) Market: Market Dynamics
Figure 9 Oil & Gas Subsea Umbilical, Risers & Flowlines (SURF) Market: Porter’s Five Forces Analysis
Figure 10 Global Oil & Gas Subsea Umbilical, Risers & Flowlines (SURF) Market Share Forecast by COVID, 2024-2034 (%)
Figure 11 Global Oil & Gas Subsea Umbilical, Risers & Flowlines (SURF) Market by Region, 2024-2034 (US$ Mn, AGR (%)) (V-Shaped Recovery Scenario)
Figure 12 Global Oil & Gas Subsea Umbilical, Risers & Flowlines (SURF) Market by Region, 2024-2034 (US$ Mn, AGR (%)) (U-Shaped Recovery Scenario)
Figure 13 Global Oil & Gas Subsea Umbilical, Risers & Flowlines (SURF) Market by Region, 2024-2034 (US$ Mn, AGR (%)) (W-Shaped Recovery Scenario)
Figure 14 Global Oil & Gas Subsea Umbilical, Risers & Flowlines (SURF) Market by Region, 2024-2034 (US$ Mn, AGR (%)) (L-Shaped Recovery Scenario)
Figure 15 Oil & Gas Subsea Umbilical, Risers & Flowlines (SURF) Market: PEST Analysis
Figure 16 Oil & Gas Subsea Umbilical, Risers & Flowlines (SURF) Market by Application: Market Attractiveness Index
Figure 17 Global Oil & Gas Subsea Umbilical, Risers & Flowlines (SURF) Market by Application, 2024-2034 (US$ Mn, AGR (%), CAGR (%))
Figure 18 Oil & Gas Subsea Umbilical, Risers & Flowlines (SURF) Market Share Forecast by Application, 2024, 2029, 2034 (%)
Figure 19 Exploration Wells Market by Region, 2024-2034 (US$ Mn, AGR (%))
Figure 20 Exploration Wells Market Share Forecast by Region, 2024 & 2034 (%)
Figure 21 Production Wells Market by Region, 2024-2034 (US$ Mn, AGR (%))
Figure 22 Production Wells Market Share Forecast by Region, 2024 & 2034 (%)
Figure 23 Oil & Gas Subsea Umbilical, Risers & Flowlines (SURF) Market by Component: Market Attractiveness Index
Figure 24 Global Oil & Gas Subsea Umbilical, Risers & Flowlines (SURF) Market by Component, 2024-2034 (US$ Mn, AGR (%))
Figure 25 Oil & Gas Subsea Umbilical, Risers & Flowlines (SURF) Market Share Forecast by Component, 2024, 2029, 2034 (%)
Figure 26 Umbilical Market by Region, 2024-2034 (US$ Mn, AGR (%))
Figure 27 Umbilical Market Share Forecast by Region, 2024 & 2034 (%)
Figure 28 Risers Market by Region, 2024-2034 (US$ Mn, AGR (%))
Figure 29 Risers Market Share Forecast by Region, 2024 & 2034 (%)
Figure 30 Flowlines Market by Region, 2024-2034 (US$ Mn, AGR (%))
Figure 31 Flowlines Market Share Forecast by Region, 2024 & 2034 (%)
Figure 32 Oil & Gas Subsea Umbilical, Risers & Flowlines (SURF) Market by Flowlines: Market Attractiveness Index
Figure 33 Global Oil & Gas Subsea Umbilical, Risers & Flowlines (SURF) Market by Flowlines, 2024-2034 (US$ Mn, AGR (%))
Figure 34 Oil & Gas Subsea Umbilical, Risers & Flowlines (SURF) Market Share Forecast by Flowlines, 2024, 2029, 2034 (%)
Figure 35 Production Flowlines Market by Region, 2024-2034 (US$ Mn, AGR (%))
Figure 36 Production Flowlines Market Share Forecast by Region, 2024 & 2034 (%)
Figure 37 Injection Flowlines Market by Region, 2024-2034 (US$ Mn, AGR (%))
Figure 38 Injection Flowlines Market Share Forecast by Region, 2024 & 2034 (%)
Figure 39 Export Flowlines Market by Region, 2024-2034 (US$ Mn, AGR (%))
Figure 40 Export Flowlines Market Share Forecast by Region, 2024 & 2034 (%)
Figure 41 Other Flowlines Market by Region, 2024-2034 (US$ Mn, AGR (%))
Figure 42 Other Flowlines Market Share Forecast by Region, 2024 & 2034 (%)
Figure 43 Oil & Gas Subsea Umbilical, Risers & Flowlines (SURF) Market by Risers: Market Attractiveness Index
Figure 44 Global Oil & Gas Subsea Umbilical, Risers & Flowlines (SURF) Market by Risers, 2024-2034 (US$ Mn, AGR (%))
Figure 45 Oil & Gas Subsea Umbilical, Risers & Flowlines (SURF) Market Share Forecast by Risers, 2024, 2029, 2034 (%)
Figure 46 Steel Catenary Risers (SCR) Market by Region, 2024-2034 (US$ Mn, AGR (%))
Figure 47 Steel Catenary Risers (SCR) Market Share Forecast by Region, 2024 & 2034 (%)
Figure 48 Top Tensioned Risers (TTR) Market by Region, 2024-2034 (US$ Mn, AGR (%))
Figure 49 Top Tensioned Risers (TTR) Market Share Forecast by Region, 2024 & 2034 (%)
Figure 50 Steel Lazy Wave Risers Market by Region, 2024-2034 (US$ Mn, AGR (%))
Figure 51 Steel Lazy Wave Risers Market Share Forecast by Region, 2024 & 2034 (%)
Figure 52 Buoyant Risers Market by Region, 2024-2034 (US$ Mn, AGR (%))
Figure 53 Buoyant Risers Market Share Forecast by Region, 2024 & 2034 (%)
Figure 54 Flexible & Hybrid Risers Market by Region, 2024-2034 (US$ Mn, AGR (%))
Figure 55 Flexible & Hybrid Risers Market Share Forecast by Region, 2024 & 2034 (%)
Figure 56 Oil & Gas Subsea Umbilical, Risers & Flowlines (SURF) Market by Umbilical: Market Attractiveness Index
Figure 57 Global Oil & Gas Subsea Umbilical, Risers & Flowlines (SURF) Market by Umbilical, 2024-2034 (US$ Mn, AGR (%))
Figure 58 Oil & Gas Subsea Umbilical, Risers & Flowlines (SURF) Market Share Forecast by Umbilical, 2024, 2029, 2034 (%)
Figure 59 Hydraulic Umbilical Market by Region, 2024-2034 (US$ Mn, AGR (%))
Figure 60 Hydraulic Umbilical Market Share Forecast by Region, 2024 & 2034 (%)
Figure 61 Electro Hydraulic Umbilical Market by Region, 2024-2034 (US$ Mn, AGR (%))
Figure 62 Electro Hydraulic Umbilical Market Share Forecast by Region, 2024 & 2034 (%)
Figure 63 Electro-Optical Umbilical Market by Region, 2024-2034 (US$ Mn, AGR (%))
Figure 64 Electro-Optical Umbilical Market Share Forecast by Region, 2024 & 2034 (%)
Figure 65 Control Umbilical Market by Region, 2024-2034 (US$ Mn, AGR (%))
Figure 66 Control Umbilical Market Share Forecast by Region, 2024 & 2034 (%)
Figure 67 Intervention Umbilical Market by Region, 2024-2034 (US$ Mn, AGR (%))
Figure 68 Intervention Umbilical Market Share Forecast by Region, 2024 & 2034 (%)
Figure 69 Production Umbilical Market by Region, 2024-2034 (US$ Mn, AGR (%))
Figure 70 Production Umbilical Market Share Forecast by Region, 2024 & 2034 (%)
Figure 71 Oil & Gas Subsea Umbilical, Risers & Flowlines (SURF) Market Forecast by Region 2024 and 2034 (Revenue, CAGR%)
Figure 72 Oil & Gas Subsea Umbilical, Risers & Flowlines (SURF) Market Share Forecast by Region 2024, 2029, 2034 (%)
Figure 73 Oil & Gas Subsea Umbilical, Risers & Flowlines (SURF) Market by Region, 2024-2034 (US$ Million, AGR %)
Figure 74 North America Oil & Gas Subsea Umbilical, Risers & Flowlines (SURF) Market Attractiveness Index
Figure 75 North America Oil & Gas Subsea Umbilical, Risers & Flowlines (SURF) Market by Region, 2024, 2029 & 2034 (US$ Million)
Figure 76 North America Oil & Gas Subsea Umbilical, Risers & Flowlines (SURF) Market by Value, 2024-2034 (US$ Mn, AGR (%))
Figure 77 North America Oil & Gas Subsea Umbilical, Risers & Flowlines (SURF) Market by Value, 2024-2034 (US$ Mn, AGR (%))
Figure 78 North America Oil & Gas Subsea Umbilical, Risers & Flowlines (SURF) Market Share Forecast by Country, 2024 & 2034 (%)
Figure 79 North America Oil & Gas Subsea Umbilical, Risers & Flowlines (SURF) Market by Application, 2024-2034 (US$ Mn, AGR (%))
Figure 80 North America Oil & Gas Subsea Umbilical, Risers & Flowlines (SURF) Market Share Forecast Application, 2024 & 2034 (%)
Figure 81 North America Oil & Gas Subsea Umbilical, Risers & Flowlines (SURF) Market by Component, 2024-2034 (US$ Mn, AGR (%))
Figure 82 North America Oil & Gas Subsea Umbilical, Risers & Flowlines (SURF) Market Share Forecast by Component, 2024 & 2034 (%)
Figure 83 North America Oil & Gas Subsea Umbilical, Risers & Flowlines (SURF) Market by Flowlines, 2024-2034 (US$ Mn, AGR (%))
Figure 84 North America Oil & Gas Subsea Umbilical, Risers & Flowlines (SURF) Market Share Forecast by Flowlines, 2024 & 2034 (%)
Figure 85 North America Oil & Gas Subsea Umbilical, Risers & Flowlines (SURF) Market by Risers, 2024-2034 (US$ Mn, AGR (%))
Figure 86 North America Oil & Gas Subsea Umbilical, Risers & Flowlines (SURF) Market Share Forecast by Risers, 2024 & 2034 (%)
Figure 87 North America Oil & Gas Subsea Umbilical, Risers & Flowlines (SURF) Market by Umbilical, 2024-2034 (US$ Mn, AGR (%))
Figure 88 North America Oil & Gas Subsea Umbilical, Risers & Flowlines (SURF) Market Share Forecast by Umbilical, 2024 & 2034 (%)
Figure 89 US Oil & Gas Subsea Umbilical, Risers & Flowlines (SURF) Market by Value, 2024-2034 (US$ Mn, AGR (%))
Figure 90 Canada Oil & Gas Subsea Umbilical, Risers & Flowlines (SURF) Market by Value, 2024-2034 (US$ Mn, AGR (%))
Figure 91 Europe Oil & Gas Subsea Umbilical, Risers & Flowlines (SURF) Market Attractiveness Index
Figure 92 Europe Oil & Gas Subsea Umbilical, Risers & Flowlines (SURF) Market by Region, 2024, 2029 & 2034 (US$ Million)
Figure 93 Europe Oil & Gas Subsea Umbilical, Risers & Flowlines (SURF) Market by Value, 2024-2034 (US$ Mn, AGR (%))
Figure 94 Europe Oil & Gas Subsea Umbilical, Risers & Flowlines (SURF) Market by Country, 2024-2034 (US$ Mn, AGR (%))
Figure 95 Europe Oil & Gas Subsea Umbilical, Risers & Flowlines (SURF) Market Share Forecast by Country, 2024 & 2034 (%)
Figure 96 Europe Oil & Gas Subsea Umbilical, Risers & Flowlines (SURF) Market by Application, 2024-2034 (US$ Mn, AGR (%))
Figure 97 Europe Oil & Gas Subsea Umbilical, Risers & Flowlines (SURF) Market Share Forecast Application, 2024 & 2034 (%)
Figure 98 Europe Oil & Gas Subsea Umbilical, Risers & Flowlines (SURF) Market by Component, 2024-2034 (US$ Mn, AGR (%))
Figure 99 Europe Oil & Gas Subsea Umbilical, Risers & Flowlines (SURF) Market Share Forecast by Component, 2024 & 2034 (%)
Figure 100 Europe Oil & Gas Subsea Umbilical, Risers & Flowlines (SURF) Market by Flowlines, 2024-2034 (US$ Mn, AGR (%))
Figure 101 Europe Oil & Gas Subsea Umbilical, Risers & Flowlines (SURF) Market Share Forecast by Flowlines, 2024 & 2034 (%)
Figure 102 Europe Oil & Gas Subsea Umbilical, Risers & Flowlines (SURF) Market by Risers, 2024-2034 (US$ Mn, AGR (%))
Figure 103 Europe Oil & Gas Subsea Umbilical, Risers & Flowlines (SURF) Market Share Forecast by Risers, 2024 & 2034 (%)
Figure 104 Europe Oil & Gas Subsea Umbilical, Risers & Flowlines (SURF) Market by Umbilical, 2024-2034 (US$ Mn, AGR (%))
Figure 105 Europe Oil & Gas Subsea Umbilical, Risers & Flowlines (SURF) Market Share Forecast by Umbilical, 2024 & 2034 (%)
Figure 106 Norway Oil & Gas Subsea Umbilical, Risers & Flowlines (SURF) Market by Value, 2024-2034 (US$ Mn, AGR (%))
Figure 107 UK Oil & Gas Subsea Umbilical, Risers & Flowlines (SURF) Market by Value, 2024-2034 (US$ Mn, AGR (%))
Figure 108 France Oil & Gas Subsea Umbilical, Risers & Flowlines (SURF) Market by Value, 2024-2034 (US$ Mn, AGR (%))
Figure 109 Russia Oil & Gas Subsea Umbilical, Risers & Flowlines (SURF) Market by Value, 2024-2034 (US$ Mn, AGR (%))
Figure 110 Denmark Oil & Gas Subsea Umbilical, Risers & Flowlines (SURF) Market by Value, 2024-2034 (US$ Mn, AGR (%))
Figure 111 Rest of Europe Oil & Gas Subsea Umbilical, Risers & Flowlines (SURF) Market by Value, 2024-2034 (US$ Mn, AGR (%))
Figure 112 Asia-Pacific Oil & Gas Subsea Umbilical, Risers & Flowlines (SURF) Market Attractiveness Index
Figure 113 Asia-Pacific Oil & Gas Subsea Umbilical, Risers & Flowlines (SURF) Market by Region, 2024, 2029 & 2034 (US$ Million)
Figure 114 Asia-Pacific Oil & Gas Subsea Umbilical, Risers & Flowlines (SURF) Market by Value, 2024-2034 (US$ Mn, AGR (%))
Figure 115 Asia-Pacific Oil & Gas Subsea Umbilical, Risers & Flowlines (SURF) Market by Country, 2024-2034 (US$ Mn, AGR (%))
Figure 116 Asia-Pacific Oil & Gas Subsea Umbilical, Risers & Flowlines (SURF) Market Share Forecast by Country, 2024 & 2034 (%)
Figure 117 Asia-Pacific Oil & Gas Subsea Umbilical, Risers & Flowlines (SURF) Market by Application, 2024-2034 (US$ Mn, AGR (%))
Figure 118 Asia-Pacific Oil & Gas Subsea Umbilical, Risers & Flowlines (SURF) Market Share Forecast Application, 2024 & 2034 (%)
Figure 119 Asia-Pacific Oil & Gas Subsea Umbilical, Risers & Flowlines (SURF) Market by Component, 2024-2034 (US$ Mn, AGR (%))
Figure 120 Asia-Pacific Oil & Gas Subsea Umbilical, Risers & Flowlines (SURF) Market Share Forecast by Component, 2024 & 2034 (%)
Figure 121 Asia-Pacific Oil & Gas Subsea Umbilical, Risers & Flowlines (SURF) Market by Flowlines, 2024-2034 (US$ Mn, AGR (%))
Figure 122 Asia-Pacific Oil & Gas Subsea Umbilical, Risers & Flowlines (SURF) Market Share Forecast by Flowlines, 2024 & 2034 (%)
Figure 123 Asia-Pacific Oil & Gas Subsea Umbilical, Risers & Flowlines (SURF) Market by Risers, 2024-2034 (US$ Mn, AGR (%))
Figure 124 Asia-Pacific Oil & Gas Subsea Umbilical, Risers & Flowlines (SURF) Market Share Forecast by Risers, 2024 & 2034 (%)
Figure 125 Asia-Pacific Oil & Gas Subsea Umbilical, Risers & Flowlines (SURF) Market by Umbilical, 2024-2034 (US$ Mn, AGR (%))
Figure 126 Asia-Pacific Oil & Gas Subsea Umbilical, Risers & Flowlines (SURF) Market Share Forecast by Umbilical, 2024 & 2034 (%)
Figure 127 China Oil & Gas Subsea Umbilical, Risers & Flowlines (SURF) Market by Value, 2024-2034 (US$ Mn, AGR (%))
Figure 128 India Oil & Gas Subsea Umbilical, Risers & Flowlines (SURF) Market by Value, 2024-2034 (US$ Mn, AGR (%))
Figure 129 Indonesia Oil & Gas Subsea Umbilical, Risers & Flowlines (SURF) Market by Value, 2024-2034 (US$ Mn, AGR (%))
Figure 130 Malaysia Oil & Gas Subsea Umbilical, Risers & Flowlines (SURF) Market by Value, 2024-2034 (US$ Mn, AGR (%))
Figure 131 Australia Oil & Gas Subsea Umbilical, Risers & Flowlines (SURF) Market by Value, 2024-2034 (US$ Mn, AGR (%))
Figure 132 Rest of Asia-Pacific Oil & Gas Subsea Umbilical, Risers & Flowlines (SURF) Market by Value, 2024-2034 (US$ Mn, AGR (%))
Figure 133 Middle East and Africa Oil & Gas Subsea Umbilical, Risers & Flowlines (SURF) Market Attractiveness Index
Figure 134 Middle East and Africa Oil & Gas Subsea Umbilical, Risers & Flowlines (SURF) Market by Region, 2024, 2029 & 2034 (US$ Million)
Figure 135 Middle East & Africa Oil & Gas Subsea Umbilical, Risers & Flowlines (SURF) Market by Value, 2024-2034 (US$ Mn, AGR (%))
Figure 136 Middle East & Africa Oil & Gas Subsea Umbilical, Risers & Flowlines (SURF) Market by Country, 2024-2034 (US$ Mn, AGR (%))
Figure 137 Middle East and Africa Oil & Gas Subsea Umbilical, Risers & Flowlines (SURF) Market Share Forecast by Country, 2024 & 2034 (%)
Figure 138 Middle East & Africa Oil & Gas Subsea Umbilical, Risers & Flowlines (SURF) Market by Application, 2024-2034 (US$ Mn, AGR (%))
Figure 139 Middle East and Africa Oil & Gas Subsea Umbilical, Risers & Flowlines (SURF) Market Share Forecast Application, 2024 & 2034 (%)
Figure 140 Middle East & Africa Oil & Gas Subsea Umbilical, Risers & Flowlines (SURF) Market by Component, 2024-2034 (US$ Mn, AGR (%))
Figure 141 Middle East and Africa Oil & Gas Subsea Umbilical, Risers & Flowlines (SURF) Market Share Forecast by Component, 2024 & 2034 (%)
Figure 142 Middle East & Africa Oil & Gas Subsea Umbilical, Risers & Flowlines (SURF) Market by Flowlines, 2024-2034 (US$ Mn, AGR (%))
Figure 143 Middle East and Africa Oil & Gas Subsea Umbilical, Risers & Flowlines (SURF) Market Share Forecast by Flowlines, 2024 & 2034 (%)
Figure 144 Middle East & Africa Oil & Gas Subsea Umbilical, Risers & Flowlines (SURF) Market by Risers, 2024-2034 (US$ Mn, AGR (%))
Figure 145 Middle East and Africa Oil & Gas Subsea Umbilical, Risers & Flowlines (SURF) Market Share Forecast by Risers, 2024 & 2034 (%)
Figure 146 Middle East & Africa Oil & Gas Subsea Umbilical, Risers & Flowlines (SURF) Market by Umbilical, 2024-2034 (US$ Mn, AGR (%))
Figure 147 Middle East and Africa Oil & Gas Subsea Umbilical, Risers & Flowlines (SURF) Market Share Forecast by Umbilical, 2024 & 2034 (%)
Figure 148 GCC Oil & Gas Subsea Umbilical, Risers & Flowlines (SURF) Market by Value, 2024-2034 (US$ Mn, AGR (%))
Figure 149 South Africa Oil & Gas Subsea Umbilical, Risers & Flowlines (SURF) Market by Value, 2024-2034 (US$ Mn, AGR (%))
Figure 150 Rest of Middle East & Africa Oil & Gas Subsea Umbilical, Risers & Flowlines (SURF) Market by Value, 2024-2034 (US$ Mn, AGR (%))
Figure 151 Latin America Oil & Gas Subsea Umbilical, Risers & Flowlines (SURF) Market Attractiveness Index
Figure 152 Latin America Oil & Gas Subsea Umbilical, Risers & Flowlines (SURF) Market by Region, 2024, 2029 & 2034 (US$ Million)
Figure 153 Latin America Oil & Gas Subsea Umbilical, Risers & Flowlines (SURF) Market by Value, 2024-2034 (US$ Mn, AGR (%))
Figure 154 Latin America Oil & Gas Subsea Umbilical, Risers & Flowlines (SURF) Market by Country, 2024-2034 (US$ Mn, AGR (%))
Figure 155 Latin America Oil & Gas Subsea Umbilical, Risers & Flowlines (SURF) Market Share Forecast by Country, 2024 & 2034 (%)
Figure 156 Latin America Oil & Gas Subsea Umbilical, Risers & Flowlines (SURF) Market by Application, 2024-2034 (US$ Mn, AGR (%))
Figure 157 Latin America Oil & Gas Subsea Umbilical, Risers & Flowlines (SURF) Market Share Forecast Application, 2024 & 2034 (%)
Figure 158 Latin America Oil & Gas Subsea Umbilical, Risers & Flowlines (SURF) Market by Component, 2024-2034 (US$ Mn, AGR (%))
Figure 159 Latin America Oil & Gas Subsea Umbilical, Risers & Flowlines (SURF) Market Share Forecast by Component, 2024 & 2034 (%)
Figure 160 Latin America Oil & Gas Subsea Umbilical, Risers & Flowlines (SURF) Market by Flowlines, 2024-2034 (US$ Mn, AGR (%))
Figure 161 Latin America Oil & Gas Subsea Umbilical, Risers & Flowlines (SURF) Market Share Forecast by Flowlines, 2024 & 2034 (%)
Figure 162 Latin America Oil & Gas Subsea Umbilical, Risers & Flowlines (SURF) Market by Risers, 2024-2034 (US$ Mn, AGR (%))
Figure 163 Latin America Oil & Gas Subsea Umbilical, Risers & Flowlines (SURF) Market Share Forecast by Risers, 2024 & 2034 (%)
Figure 164 Latin America Oil & Gas Subsea Umbilical, Risers & Flowlines (SURF) Market by Umbilical, 2024-2034 (US$ Mn, AGR (%))
Figure 165 Latin America Oil & Gas Subsea Umbilical, Risers & Flowlines (SURF) Market Share Forecast by Umbilical, 2024 & 2034 (%)
Figure 166 Brazil Oil & Gas Subsea Umbilical, Risers & Flowlines (SURF) Market by Value, 2024-2034 (US$ Mn, AGR (%))
Figure 167 Mexico Oil & Gas Subsea Umbilical, Risers & Flowlines (SURF) Market by Value, 2024-2034 (US$ Mn, AGR (%))
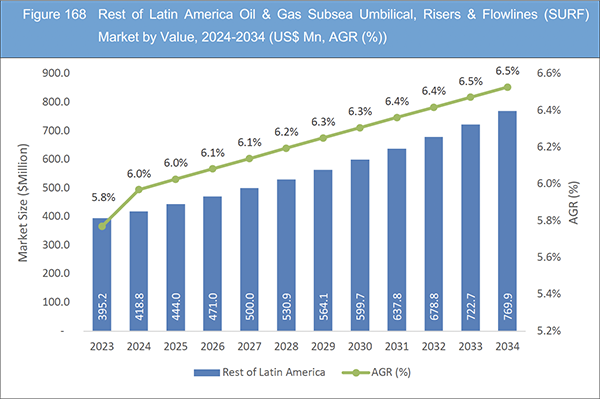
Figure 168 Rest of Latin America Oil & Gas Subsea Umbilical, Risers & Flowlines (SURF) Market by Value, 2024-2034 (US$ Mn, AGR (%))
Figure 169 Oil & Gas Subsea Umbilical, Risers & Flowlines (SURF) Market: Company Share, 2022
Figure 170 Subsea 7 S.A..: Net Revenue, 2018-2022 (US$ Million, AGR%)
Figure 171 Subsea 7 S.A..: R&D, 2018-2022 (US$ Million, AGR%)
Figure 172 TechnipFMC plc.: Net Revenue, 2018-2022 (US$ Million, AGR%)
Figure 173 TechnipFMC plc.: R&D, 2018-2022 (US$ Million, AGR%)
Figure 174 TechnipFMC plc.: Regional Revenue Share, 2022 (%)
Figure 175 TechnipFMC plc.: Business Segment Revenue Share, 2022 (%)
Figure 176 Saipem S.p.A..: Net Revenue, 2018-2022 (US$ Million, AGR%)
Figure 177 Saipem S.p.A..: R&D, 2018-2022 (US$ Million, AGR%)
Figure 178 Saipem S.p.A..: Regional Revenue Share, 2022 (%)
Figure 179 Saipem S.p.A..: Business Segment Revenue Share, 2022 (%)
Figure 180 Oceaneering International, Inc..: Net Revenue, 2018-2022 (US$ Million, AGR%)
Figure 181 Oceaneering International, Inc..: Business Segment Revenue Share, 2022 (%)
Figure 182 Vallourec S.A..: Net Revenue, 2018-2022 (US$ Million, AGR%)
Figure 183 Vallourec S.A..: Business Segment Revenue Share, 2022 (%)
Figure 184 Siemens AG.: Net Revenue, 2018-2022 (US$ Million, AGR%)
Figure 185 Siemens AG.: R&D, 2018-2022 (US$ Million, AGR%)
Figure 186 Siemens AG.: Regional Revenue Share, 2022 (%)
Figure 187 Siemens AG.: Business Segment Revenue Share, 2022 (%)
Figure 188 NOV Inc.: Net Revenue, 2018-2022 (US$ Million, AGR%)
Figure 189 NOV Inc.: Regional Revenue Share, 2022 (%)
Figure 190 NOV Inc.: Business Segment Revenue Share, 2022 (%)
Figure 191 Baker Hughes Company.: Net Revenue, 2018-2022 (US$ Million, AGR%)
Figure 192 Baker Hughes Company.: R&D, 2018-2022 (US$ Million, AGR%)
Figure 193 Baker Hughes Company.: Regional Revenue Share, 2022 (%)
Figure 194 Baker Hughes Company.: Business Segment Revenue Share, 2022 (%)
Figure 195 Weatherford International plc.: Net Revenue, 2018-2022 (US$ Million, AGR%)
Figure 196 Weatherford International plc.: R&D, 2018-2022 (US$ Million, AGR%)
Figure 197 Weatherford International plc.: Regional Revenue Share, 2022 (%)
Figure 198 Weatherford International plc.: Business Segment Revenue Share, 2022 (%)
Figure 199 General Electric Company.: Net Revenue, 2018-2022 (US$ Million, AGR%)
Figure 200 General Electric Company.: R&D, 2018-2022 (US$ Million, AGR%)
Figure 201 General Electric Company.: Regional Revenue Share, 2022 (%)
Figure 202 General Electric Company.: Business Segment Revenue Share, 2022 (%)
Figure 203 Haliburton Corporation.: Net Revenue, 2018-2022 (US$ Million, AGR%)
Figure 204 Haliburton Corporation.: R&D, 2018-2022 (US$ Million, AGR%)
Figure 205 Haliburton Corporation.: Regional Revenue Share, 2022 (%)
Figure 206 Haliburton Corporation.: Business Segment Revenue Share, 2022 (%)
Figure 207 FMC Technologies Inc.: Net Revenue, 2018-2022 (US$ Million, AGR%)
Figure 208 FMC Technologies Inc.: R&D, 2018-2022 (US$ Million, AGR%)
Figure 209 FMC Technologies Inc.: Regional Revenue Share, 2022 (%)
Figure 210 FMC Technologies Inc.: Business Segment Revenue Share, 2022 (%)
Figure 211 Cameron International Corporation.: Net Revenue, 2018-2022 (US$ Million, AGR%)
Figure 212 Cameron International Corporation.: R&D, 2018-2022 (US$ Million, AGR%)
Figure 213 Cameron International Corporation.: Regional Revenue Share, 2022 (%)
Figure 214 Cameron International Corporation.: Business Segment Revenue Share, 2022 (%)
ページTOPに戻る
Summary
Report Details
The Oil & Gas Subsea Umbilical, Risers & Flowlines (SURF) Market Report 2024-2034: This report will prove invaluable to leading firms striving for new revenue pockets if they wish to better understand the industry and its underlying dynamics. It will be useful for companies that would like to expand into different industries or to expand their existing operations in a new region.
Deepwater Exploration and Production Opportunities
The increasing focus on deepwater oil and gas exploration and production activities is a key driver for the global subsea umbilical, risers, and flowlines (SURF) market. As traditional reserves are depleting, the industry is compelled to explore deeper waters to meet global energy demands. The development of advanced SURF systems is essential to extract hydrocarbons from these challenging deepwater environments. For instance, the Gulf of Mexico’s deepwater projects, such as the Perdido development, rely heavily on sophisticated SURF systems to transport hydrocarbons efficiently from the seabed to the surface facilities.
Growing Subsea Field Developments
The increasing number of subsea field developments globally is a significant driving factor for the SURF market. Oil and gas operators are expanding their offshore portfolios, and subsea tie-backs to existing infrastructure or standalone subsea developments require robust SURF systems. One example is the Johan Castberg project in the Barents Sea, where the development of subsea infrastructure necessitates the deployment of comprehensive SURF solutions to connect wells to production facilities efficiently.
What Questions Should You Ask before Buying a Market Research Report?
• How is the oil & gas subsea umbilical, risers & flowlines (SURF) market evolving?
• What is driving and restraining the oil & gas subsea umbilical, risers & flowlines (SURF) market?
• How will each oil & gas subsea umbilical, risers & flowlines (SURF) submarket segment grow over the forecast period and how much revenue will these submarkets account for in 2034?
• How will the market shares for each oil & gas subsea umbilical, risers & flowlines (SURF) submarket develop from 2024 to 2034?
• What will be the main driver for the overall market from 2024 to 2034?
• Will leading oil & gas subsea umbilical, risers & flowlines (SURF) markets broadly follow the macroeconomic dynamics, or will individual national markets outperform others?
• How will the market shares of the national markets change by 2034 and which geographical region will lead the market in 2034?
• Who are the leading players and what are their prospects over the forecast period?
• What are the oil & gas subsea umbilical, risers & flowlines (SURF) projects for these leading companies?
• How will the industry evolve during the period between 2024 and 2034? What are the implications of oil & gas subsea umbilical, risers & flowlines (SURF) projects taking place now and over the next 10 years?
• Is there a greater need for product commercialisation to further scale the oil & gas subsea umbilical, risers & flowlines (SURF) market?
• Where is the oil & gas subsea umbilical, risers & flowlines (SURF) market heading and how can you ensure you are at the forefront of the market?
• What are the best investment options for new product and service lines?
• What are the key prospects for moving companies into a new growth path and C-suite?
You need to discover how this will impact the oil & gas subsea umbilical, risers & flowlines (SURF) market today, and over the next 10 years:
• Our 431-page report provides 132 tables and 214 charts/graphs exclusively to you.
• The report highlights key lucrative areas in the industry so you can target them – NOW.
• It contains in-depth analysis of global, regional and national sales and growth.
• It highlights for you the key successful trends, changes and revenue projections made by your competitors.
This report tells you TODAY how the oil & gas subsea umbilical, risers & flowlines (SURF) market will develop in the next 10 years, and in line with the variations in COVID-19 economic recession and bounce. This market is more critical now than at any point over the last 10 years.
Forecasts to 2034 and other analyses reveal commercial prospects
• In addition to revenue forecasting to 2034, our new study provides you with recent results, growth rates, and market shares.
• You will find original analyses, with business outlooks and developments.
• Discover qualitative analyses (including market dynamics, drivers, opportunities, restraints and challenges), cost structure, impact of rising oil & gas subsea umbilical, risers & flowlines (SURF) prices and recent developments.
This report includes data analysis and invaluable insight into how COVID-19 will affect the industry and your company. Four COVID-19 recovery patterns and their impact, namely, “V”, “L”, “W” and “U” are discussed in this report.
Segments Covered in the Report
Market Segment by Application
• Exploration Wells
• Production Wells
Market Segment by Component
• Umbilicals
• Risers
• Flowlines
Market Segment by Flowlines
• Production Flowlines
• Injection Flowlines
• Export Flowlines
• Other Flowlines
Market Segment by Risers
• Steel Catenary Risers (SCR)
• Top Tensioned Risers (TTR)
• Steel Lazy Wave Risers
• Buoyant Risers
• Flexible & Hybrid Risers
Market Segment by Umbilicals
• Hydraulic Umbilicals
• Electro Hydraulic Umbilicals
• Electro-Optical Umbilicals
• Control Umbilicals
• Intervention Umbilicals
• Production Umbilicals
In addition to the revenue predictions for the overall world market and segments, you will also find revenue forecasts for four regional and 20 leading national markets:
North America
• U.S.
• Canada
Europe
• Norway
• UK
• France
• Russia
• Denmark
• Rest of Europe
Asia Pacific
• China
• India
• Indonesia
• Malaysia
• Australia
• Rest of Asia-Pacific
Latin America
• Brazil
• Mexico
• Rest of Latin America
Middle East & Africa
• GCC
• South Africa
• Rest of Middle East & Africa
The report also includes profiles and for some of the leading companies in the Oil & Gas Subsea Umbilical, Risers & Flowlines (SURF) Market, 2024 to 2034, with a focus on this segment of these companies’ operations.
Leading companies and the potential for market growth
• Baker Hughes Company
• Cameron International Corporation
• FMC Technologies Inc.
• General Electric Company
• Haliburton Corporation
• JDR Cable Systems Ltd.
• McDermott International, Ltd
• National Oilwell Varco Inc.
• Oceaneering International, Inc.
• Saipem S.p.A.
• Siemens AG
• Subsea 7 S.A.
• TechnipFMC plc
• Vallourec S.A.
• Weatherford International plc
Overall world revenue for Oil & Gas Subsea Umbilical, Risers & Flowlines (SURF) Market, 2024 to 2034 in terms of value the market will surpass US$10,196.7 million in 2024, our work calculates. We predict strong revenue growth through to 2034. Our work identifies which organizations hold the greatest potential. Discover their capabilities, progress, and commercial prospects, helping you stay ahead.
How will the Oil & Gas Subsea Umbilical, Risers & Flowlines (SURF) Market, 2024 to 2034 report help you?
In summary, our 430+ page report provides you with the following knowledge:
• Revenue forecasts to 2034 for Oil & Gas Subsea Umbilical, Risers & Flowlines (SURF) Market, 2024 to 2034 Market, with forecasts for application, component, flowlines, risers, and umbilicals, each forecast at a global and regional level – discover the industry’s prospects, finding the most lucrative places for investments and revenues.
• Revenue forecasts to 2034 for four regional and 20 key national markets – See forecasts for the Oil & Gas Subsea Umbilical, Risers & Flowlines (SURF) Market, 2024 to 2034 market in North America, Europe, Asia-Pacific, Latin America and Middle East & Africa. Also forecasted is the market in the US, Canada, Brazil, France, Norway, Russia, China, India, Indonesia, and Australia among other prominent economies.
• Prospects for established firms and those seeking to enter the market – including company profiles for 15 of the major companies involved in the Oil & Gas Subsea Umbilical, Risers & Flowlines (SURF) Market, 2024 to 2034.
Find quantitative and qualitative analyses with independent predictions. Receive information that only our report contains, staying informed with invaluable business intelligence.
Information found nowhere else
With our new report, you are less likely to fall behind in knowledge or miss out on opportunities. See how our work could benefit your research, analyses, and decisions. Visiongain’s study is for everybody needing commercial analyses for the Oil & Gas Subsea Umbilical, Risers & Flowlines (SURF) Market, 2024 to 2034, market-leading companies. You will find data, trends and predictions.
ページTOPに戻る
Table of Contents
Table of Contents
1 Report Overview
1.1 Objectives of the Study
1.2 Introduction to Oil & Gas Subsea Umbilical, Risers & Flowlines (SURF) Market
1.3 What This Report Delivers
1.4 Why You Should Read This Report
1.5 Key Questions Answered by This Analytical Report
1.6 Who Is This Report for?
1.7 Methodology
1.7.1 Market Definitions
1.7.2 Market Evaluation & Forecasting Methodology
1.7.3 Data Validation
1.7.3.1 Primary Research
1.7.3.2 Secondary Research
1.8 Frequently Asked Questions (FAQs)
1.9 Associated Visiongain Reports
1.10 About Visiongain
2 Executive Summary
3 Market Overview
3.1 Key Findings
3.2 Market Dynamics
3.2.1 Market Driving Factors
3.2.1.1 The Increasing Trend of Offshore Exploration and Production Activities, Particularly in Deepwater and Ultra-Deepwater Regions
3.2.1.2 Ongoing Technological Advancements in Subsea Engineering and Manufacturing Play A Pivotal Role in Market Growth
3.2.1.3 Rapid Advancement in Subsea Production Systems
3.2.2 Market Restraining Factors
3.2.2.1 The Crude Oil Sector Is Recognised as One of the Largest Sources of VOC Emission in to the Environment
3.2.2.2 High Cost Associated with Offshore Drilling
3.2.2.3 The Potential Environmental Impact of Deepwater Drilling and Production Activities Poses a Challenge for the SURF Market.
3.2.3 Market Opportunities
3.2.3.1 Strategic Investments by Major Oil and Gas Companies Opportunities
3.2.3.2 Growing Consolidation in Subsea Infrastructure Industry
3.2.3.3 Implementation of Stringent Regulations for Offshore E&P Activities
3.3 Porter’s Five Forces Analysis
3.3.1 Bargaining Power of Suppliers (Medium to High)
3.3.2 Bargaining Power of Buyers (Medium)
3.3.3 Competitive Rivalry (High)
3.3.4 Threat from Substitutes (Low)
3.3.5 Threat of New Entrants (High)
3.4 COVID-19 Impact Analysis
3.4.1 “V-Shaped Recovery”
3.4.2 “U-Shaped Recovery”
3.4.3 “W-Shaped Recovery”
3.4.4 “L-Shaped Recovery”
3.5 PEST Analysis
4 Oil & Gas Subsea Umbilical, Risers & Flowlines (SURF) Market Analysis by Application
4.1 Key Findings
4.2 Application Segment: Market Attractiveness Index
4.3 Oil & Gas Subsea Umbilical, Risers & Flowlines (SURF) Market Size Estimation and Forecast by Application
4.4 Exploration Wells
4.4.1 Market Size by Region, 2024-2034 (US$ Million)
4.4.2 Market Share by Region, 2024 & 2034 (%)
4.5 Production Wells
4.5.1 Market Size by Region, 2024-2034 (US$ Million)
4.5.2 Market Share by Region, 2024 & 2034 (%)
5 Oil & Gas Subsea Umbilical, Risers & Flowlines (SURF) Market Analysis by Component
5.1 Key Findings
5.2 Component Segment: Market Attractiveness Index
5.3 Oil & Gas Subsea Umbilical, Risers & Flowlines (SURF) Market Size Estimation and Forecast by Component
5.4 Umbilical
5.4.1 Market Size by Region, 2024-2034 (US$ Million)
5.4.2 Market Share by Region, 2024 & 2034 (%)
5.5 Risers
5.5.1 Market Size by Region, 2024-2034 (US$ Million)
5.5.2 Market Share by Region, 2024 & 2034 (%)
5.6 Flowlines
5.6.1 Market Size by Region, 2024-2034 (US$ Million)
5.6.2 Market Share by Region, 2024 & 2034 (%)
6 Oil & Gas Subsea Umbilical, Risers & Flowlines (SURF) Market Analysis by Flowlines
6.1 Key Findings
6.2 Flowlines Segment: Market Attractiveness Index
6.3 Oil & Gas Subsea Umbilical, Risers & Flowlines (SURF) Market Size Estimation and Forecast by Flowlines
6.4 Production Flowlines
6.4.1 Market Size by Region, 2024-2034 (US$ Million)
6.4.2 Market Share by Region, 2024 & 2034 (%)
6.5 Injection Flowlines
6.5.1 Market Size by Region, 2024-2034 (US$ Million)
6.5.2 Market Share by Region, 2024 & 2034 (%)
6.6 Export Flowlines
6.6.1 Market Size by Region, 2024-2034 (US$ Million)
6.6.2 Market Share by Region, 2024 & 2034 (%)
6.7 Other Flowlines
6.7.1 Market Size by Region, 2024-2034 (US$ Million)
6.7.2 Market Share by Region, 2024 & 2034 (%)
7 Oil & Gas Subsea Umbilical, Risers & Flowlines (SURF) Market Analysis by Risers
7.1 Key Findings
7.2 Risers Segment: Market Attractiveness Index
7.3 Oil & Gas Subsea Umbilical, Risers & Flowlines (SURF) Market Size Estimation and Forecast by Risers
7.4 Steel Catenary Risers (SCR)
7.4.1 Market Size by Region, 2024-2034 (US$ Million)
7.4.2 Market Share by Region, 2024 & 2034 (%)
7.5 Top Tensioned Risers (TTR)
7.5.1 Market Size by Region, 2024-2034 (US$ Million)
7.5.2 Market Share by Region, 2024 & 2034 (%)
7.6 Steel Lazy Wave Risers
7.6.1 Market Size by Region, 2024-2034 (US$ Million)
7.6.2 Market Share by Region, 2024 & 2034 (%)
7.7 Buoyant Risers
7.7.1 Market Size by Region, 2024-2034 (US$ Million)
7.7.2 Market Share by Region, 2024 & 2034 (%)
7.8 Flexible & Hybrid Risers
7.8.1 Market Size by Region, 2024-2034 (US$ Million)
7.8.2 Market Share by Region, 2024 & 2034 (%)
8 Oil & Gas Subsea Umbilical, Risers & Flowlines (SURF) Market Analysis by Umbilical
8.1 Key Findings
8.2 Umbilical Segment: Market Attractiveness Index
8.3 Oil & Gas Subsea Umbilical, Risers & Flowlines (SURF) Market Size Estimation and Forecast by Risers
8.4 Hydraulic Umbilical
8.4.1 Market Size by Region, 2024-2034 (US$ Million)
8.4.2 Market Share by Region, 2024 & 2034 (%)
8.5 Electro Hydraulic Umbilical
8.5.1 Market Size by Region, 2024-2034 (US$ Million)
8.5.2 Market Share by Region, 2024 & 2034 (%)
8.6 Electro-Optical Umbilical
8.6.1 Market Size by Region, 2024-2034 (US$ Million)
8.6.2 Market Share by Region, 2024 & 2034 (%)
8.7 Control Umbilical
8.7.1 Market Size by Region, 2024-2034 (US$ Million)
8.7.2 Market Share by Region, 2024 & 2034 (%)
8.8 Intervention Umbilical
8.8.1 Market Size by Region, 2024-2034 (US$ Million)
8.8.2 Market Share by Region, 2024 & 2034 (%)
8.9 Production Umbilical
8.9.1 Market Size by Region, 2024-2034 (US$ Million)
8.9.2 Market Share by Region, 2024 & 2034 (%)
9 Oil & Gas Subsea Umbilical, Risers & Flowlines (SURF) Market Analysis by Region
9.1 Key Findings
9.2 Regional Market Size Estimation and Forecast
10 North America Oil & Gas Subsea Umbilical, Risers & Flowlines (SURF) Market Analysis
10.1 Key Findings
10.2 North America Oil & Gas Subsea Umbilical, Risers & Flowlines (SURF) Market Attractiveness Index
10.3 North America Oil & Gas Subsea Umbilical, Risers & Flowlines (SURF) Market by Country, 2024, 2029 & 2034 (US$ Million)
10.4 North America Oil & Gas Subsea Umbilical, Risers & Flowlines (SURF) Market Size Estimation and Forecast
10.5 North America Oil & Gas Subsea Umbilical, Risers & Flowlines (SURF) Market Size Estimation and Forecast by Country
10.6 North America Oil & Gas Subsea Umbilical, Risers & Flowlines (SURF) Market Size Estimation and Forecast by Application
10.7 North America Oil & Gas Subsea Umbilical, Risers & Flowlines (SURF) Market Size Estimation and Forecast by Component
10.8 North America Oil & Gas Subsea Umbilical, Risers & Flowlines (SURF) Market Size Estimation and Forecast by Flowlines
10.9 North America Oil & Gas Subsea Umbilical, Risers & Flowlines (SURF) Market Size Estimation and Forecast by Risers
10.10 North America Oil & Gas Subsea Umbilical, Risers & Flowlines (SURF) Market Size Estimation and Forecast by Umbilical
10.11 U.S. Oil & Gas Subsea Umbilical, Risers & Flowlines (SURF) Market Analysis
10.12 Canada Oil & Gas Subsea Umbilical, Risers & Flowlines (SURF) Market Analysis
11 Europe Oil & Gas Subsea Umbilical, Risers & Flowlines (SURF) Market Analysis
11.1 Key Findings
11.2 Europe Oil & Gas Subsea Umbilical, Risers & Flowlines (SURF) Market Attractiveness Index
11.3 Europe Oil & Gas Subsea Umbilical, Risers & Flowlines (SURF) Market by Country, 2024, 2029 & 2034 (US$ Million)
11.4 Europe Oil & Gas Subsea Umbilical, Risers & Flowlines (SURF) Market Size Estimation and Forecast
11.5 Europe Oil & Gas Subsea Umbilical, Risers & Flowlines (SURF) Market Size Estimation and Forecast by Country
11.6 Europe Oil & Gas Subsea Umbilical, Risers & Flowlines (SURF) Market Size Estimation and Forecast by Application
11.7 Europe Oil & Gas Subsea Umbilical, Risers & Flowlines (SURF) Market Size Estimation and Forecast by Component
11.8 Europe Oil & Gas Subsea Umbilical, Risers & Flowlines (SURF) Market Size Estimation and Forecast by Flowlines
11.9 Europe Oil & Gas Subsea Umbilical, Risers & Flowlines (SURF) Market Size Estimation and Forecast by Risers
11.10 Europe Oil & Gas Subsea Umbilical, Risers & Flowlines (SURF) Market Size Estimation and Forecast by Umbilical
11.11 Norway Oil & Gas Subsea Umbilical, Risers & Flowlines (SURF) Market Analysis
11.12 UK Oil & Gas Subsea Umbilical, Risers & Flowlines (SURF) Market Analysis
11.13 France Oil & Gas Subsea Umbilical, Risers & Flowlines (SURF) Market Analysis
11.14 Russia Oil & Gas Subsea Umbilical, Risers & Flowlines (SURF) Market Analysis
11.15 Denmark Oil & Gas Subsea Umbilical, Risers & Flowlines (SURF) Market Analysis
11.16 Rest of Europe Oil & Gas Subsea Umbilical, Risers & Flowlines (SURF) Market Analysis
12 Asia-Pacific Oil & Gas Subsea Umbilical, Risers & Flowlines (SURF) Market Analysis
12.1 Key Findings
12.2 Asia-Pacific Oil & Gas Subsea Umbilical, Risers & Flowlines (SURF) Market Attractiveness Index
12.3 Asia-Pacific Oil & Gas Subsea Umbilical, Risers & Flowlines (SURF) Market by Country, 2024, 2029 & 2034 (US$ Million)
12.4 Asia-Pacific Oil & Gas Subsea Umbilical, Risers & Flowlines (SURF) Market Size Estimation and Forecast
12.5 Asia-Pacific Oil & Gas Subsea Umbilical, Risers & Flowlines (SURF) Market Size Estimation and Forecast by Country
12.6 Asia-Pacific Oil & Gas Subsea Umbilical, Risers & Flowlines (SURF) Market Size Estimation and Forecast by Application
12.7 Asia-Pacific Oil & Gas Subsea Umbilical, Risers & Flowlines (SURF) Market Size Estimation and Forecast by Component
12.8 Asia-Pacific Oil & Gas Subsea Umbilical, Risers & Flowlines (SURF) Market Size Estimation and Forecast by Flowlines
12.9 Asia-Pacific Oil & Gas Subsea Umbilical, Risers & Flowlines (SURF) Market Size Estimation and Forecast by Risers
12.10 Asia-Pacific Oil & Gas Subsea Umbilical, Risers & Flowlines (SURF) Market Size Estimation and Forecast by Umbilical
12.11 China Oil & Gas Subsea Umbilical, Risers & Flowlines (SURF) Market Analysis
12.12 India Oil & Gas Subsea Umbilical, Risers & Flowlines (SURF) Market Analysis
12.13 Indonesia Oil & Gas Subsea Umbilical, Risers & Flowlines (SURF) Market Analysis
12.14 Malaysia Oil & Gas Subsea Umbilical, Risers & Flowlines (SURF) Market Analysis
12.15 Australia Oil & Gas Subsea Umbilical, Risers & Flowlines (SURF) Market Analysis
12.16 Rest of Asia-Pacific Oil & Gas Subsea Umbilical, Risers & Flowlines (SURF) Market Analysis
13 Middle East and Africa Oil & Gas Subsea Umbilical, Risers & Flowlines (SURF) Market Analysis
13.1 Key Findings
13.2 Middle East and Africa Oil & Gas Subsea Umbilical, Risers & Flowlines (SURF) Market Attractiveness Index
13.3 Middle East and Africa Oil & Gas Subsea Umbilical, Risers & Flowlines (SURF) Market by Country, 2024, 2029 & 2034 (US$ Million)
13.4 Middle East and Africa Oil & Gas Subsea Umbilical, Risers & Flowlines (SURF) Market Size Estimation and Forecast
13.5 Middle East and Africa Oil & Gas Subsea Umbilical, Risers & Flowlines (SURF) Market Size Estimation and Forecast by Country
13.6 Middle East and Africa Oil & Gas Subsea Umbilical, Risers & Flowlines (SURF) Market Size Estimation and Forecast by Application
13.7 Middle East and Africa Oil & Gas Subsea Umbilical, Risers & Flowlines (SURF) Market Size Estimation and Forecast by Component
13.8 Middle East and Africa Oil & Gas Subsea Umbilical, Risers & Flowlines (SURF) Market Size Estimation and Forecast by Flowlines
13.9 Middle East and Africa Oil & Gas Subsea Umbilical, Risers & Flowlines (SURF) Market Size Estimation and Forecast by Risers
13.10 Middle East and Africa Oil & Gas Subsea Umbilical, Risers & Flowlines (SURF) Market Size Estimation and Forecast by Umbilical
13.11 GCC Oil & Gas Subsea Umbilical, Risers & Flowlines (SURF) Market Analysis
13.12 South Africa Oil & Gas Subsea Umbilical, Risers & Flowlines (SURF) Market Analysis
13.13 Rest of Middle East & Africa Oil & Gas Subsea Umbilical, Risers & Flowlines (SURF) Market Analysis
14 Latin America Oil & Gas Subsea Umbilical, Risers & Flowlines (SURF) Market Analysis
14.1 Key Findings
14.2 Latin America Oil & Gas Subsea Umbilical, Risers & Flowlines (SURF) Market Attractiveness Index
14.3 Latin America Oil & Gas Subsea Umbilical, Risers & Flowlines (SURF) Market by Country, 2024, 2029 & 2034 (US$ Million)
14.4 Latin America Oil & Gas Subsea Umbilical, Risers & Flowlines (SURF) Market Size Estimation and Forecast
14.5 Latin America Oil & Gas Subsea Umbilical, Risers & Flowlines (SURF) Market Size Estimation and Forecast by Country
14.6 Latin America Oil & Gas Subsea Umbilical, Risers & Flowlines (SURF) Market Size Estimation and Forecast by Application
14.7 Latin America Oil & Gas Subsea Umbilical, Risers & Flowlines (SURF) Market Size Estimation and Forecast by Component
14.8 Latin America Oil & Gas Subsea Umbilical, Risers & Flowlines (SURF) Market Size Estimation and Forecast by Flowlines
14.9 Latin America Oil & Gas Subsea Umbilical, Risers & Flowlines (SURF) Market Size Estimation and Forecast by Risers
14.10 Latin America Oil & Gas Subsea Umbilical, Risers & Flowlines (SURF) Market Size Estimation and Forecast by Umbilical
14.11 Brazil Oil & Gas Subsea Umbilical, Risers & Flowlines (SURF) Market Analysis
14.12 Mexico Oil & Gas Subsea Umbilical, Risers & Flowlines (SURF) Market Analysis
14.13 Rest of Latin America Oil & Gas Subsea Umbilical, Risers & Flowlines (SURF) Market Analysis
15 Company Profiles
15.1 Competitive Landscape, 2022
15.2 Strategic Outlook
15.3 Subsea 7 S.A.
15.3.1 Company Snapshot
15.3.2 Company Overview
15.3.3 Financial Analysis
15.3.4 Net Revenue, 2018-2022
15.3.4.1 R&D, 2018-2022
15.3.5 Product Benchmarking
15.3.6 Strategic Outlook
15.4 TechnipFMC plc
15.4.1 Company Snapshot
15.4.2 Company Overview
15.4.3 Financial Analysis
15.4.4 Net Revenue, 2018-2022
15.4.4.1 R&D, 2018-2022
15.4.4.2 Regional Revenue Share, 2022 (%)
15.4.4.3 Business Segment Revenue Share, 2022 (%)
15.4.5 Product Benchmarking
15.4.6 Strategic Outlook
15.5 Saipem S.p.A.
15.5.1 Company Snapshot
15.5.2 Company Overview
15.5.3 Financial Analysis
15.5.4 Net Revenue, 2018-2022
15.5.4.1 R&D, 2018-2022
15.5.4.2 Regional Revenue Share, 2022 (%)
15.5.4.3 Business Segment Revenue Share, 2022 (%)
15.5.5 Product Benchmarking
15.5.6 Strategic Outlook
15.6 McDermott International, Ltd
15.6.1 Company Snapshot
15.6.2 Company Overview
15.6.3 Product Benchmarking
15.6.4 Strategic Outlook
15.7 Oceaneering International, Inc.
15.7.1 Company Snapshot
15.7.2 Company Overview
15.7.3 Financial Analysis
15.7.4 Net Revenue, 2018-2022
15.7.4.1 Business Segment Revenue Share, 2022 (%)
15.7.5 Product Benchmarking
15.7.6 Strategic Outlook
15.8 Vallourec S.A.
15.8.1 Company Snapshot
15.8.2 Company Overview
15.8.3 Financial Analysis
15.8.4 Net Revenue, 2018-2022
15.8.4.1 Business Segment Revenue Share, 2022 (%)
15.8.5 Product Benchmarking
15.8.6 Strategic Outlook
15.9 JDR Cable Systems Ltd.
15.9.1 Company Snapshot
15.9.2 Company Overview
15.9.3 Product Benchmarking
15.9.4 Strategic Outlook
15.10 Siemens AG
15.10.1 Company Snapshot
15.10.2 Company Overview
15.10.3 Financial Analysis
15.10.4 Net Revenue, 2018-2022
15.10.4.1 R&D, 2018-2022
15.10.4.2 Regional Revenue Share, 2022 (%)
15.10.4.3 Business Segment Revenue Share, 2022 (%)
15.10.5 Product Benchmarking
15.10.6 Strategic Outlook
15.11 NOV Inc
15.11.1 Company Snapshot
15.11.2 Company Overview
15.11.3 Financial Analysis
15.11.4 Net Revenue, 2018-2022
15.11.4.1 Regional Revenue Share, 2022 (%)
15.11.4.2 Business Segment Revenue Share, 2022 (%)
15.11.5 Product Benchmarking
15.11.6 Strategic Outlook
15.12 Baker Hughes Company
15.12.1 Company Snapshot
15.12.2 Company Overview
15.12.3 Financial Analysis
15.12.4 Net Revenue, 2018-2022
15.12.4.1 R&D, 2018-2022
15.12.4.2 Regional Revenue Share, 2022 (%)
15.12.4.3 Business Segment Revenue Share, 2022 (%)
15.12.5 Product Benchmarking
15.12.6 Strategic Outlook
15.13 Weatherford International plc
15.13.1 Company Snapshot
15.13.2 Company Overview
15.13.3 Financial Analysis
15.13.4 Net Revenue, 2018-2022
15.13.4.1 R&D, 2018-2022
15.13.4.2 Regional Revenue Share, 2022 (%)
15.13.4.3 Business Segment Revenue Share, 2022 (%)
15.13.5 Product Benchmarking
15.13.6 Strategic Outlook
15.14 General Electric Company
15.14.1 Company Snapshot
15.14.2 Company Overview
15.14.3 Financial Analysis
15.14.4 Net Revenue, 2018-2022
15.14.4.1 R&D, 2018-2022
15.14.4.2 Regional Revenue Share, 2022 (%)
15.14.4.3 Business Segment Revenue Share, 2022 (%)
15.14.5 Product Benchmarking
15.14.6 Strategic Outlook
15.15 Haliburton Corporation
15.15.1 Company Snapshot
15.15.2 Company Overview
15.15.3 Financial Analysis
15.15.4 Net Revenue, 2018-2022
15.15.4.1 R&D, 2018-2022
15.15.4.2 Regional Revenue Share, 2022 (%)
15.15.4.3 Business Segment Revenue Share, 2022 (%)
15.15.5 Product Benchmarking
15.15.6 Strategic Outlook
15.16 FMC Technologies Inc
15.16.1 Company Snapshot
15.16.2 Company Overview
15.16.3 Financial Analysis
15.16.4 Net Revenue, 2018-2022
15.16.4.1 R&D, 2018-2022
15.16.4.2 Regional Revenue Share, 2022 (%)
15.16.4.3 Business Segment Revenue Share, 2022 (%)
15.16.5 Product Benchmarking
15.16.6 Strategic Outlook
15.17 Cameron International Corporation
15.17.1 Company Snapshot
15.17.2 Company Overview
15.17.3 Financial Analysis
15.17.4 Net Revenue, 2018-2022
15.17.4.1 R&D, 2018-2022
15.17.4.2 Regional Revenue Share, 2022 (%)
15.17.4.3 Business Segment Revenue Share, 2022 (%)
15.17.5 Product Benchmarking
15.17.6 Strategic Outlook
16 Conclusion and Recommendations
16.1 Concluding Remarks from Visiongain
16.2 Recommendations for Market Players
ページTOPに戻る
List of Tables/Graphs
List of Tables
Table 1 Oil & Gas Subsea Umbilical, Risers & Flowlines (SURF) Market Snapshot, 2024 & 2034 (US$ Million, CAGR %)
Table 2 Global Oil & Gas Subsea Umbilical, Risers & Flowlines (SURF) Market by Region, 2024-2034 (US$ Mn, AGR (%), CAGR (%)) (V-Shaped Recovery Scenario)
Table 3 Global Oil & Gas Subsea Umbilical, Risers & Flowlines (SURF) Market by Region, 2024-2034 (US$ Mn, AGR (%), CAGR (%)) (U-Shaped Recovery Scenario)
Table 4 Global Oil & Gas Subsea Umbilical, Risers & Flowlines (SURF) Market by Region, 2024-2034 (US$ Mn, AGR (%), CAGR (%)) (W-Shaped Recovery Scenario)
Table 5 Global Oil & Gas Subsea Umbilical, Risers & Flowlines (SURF) Market by Region, 2024-2034 (US$ Mn, AGR (%), CAGR (%)) (L-Shaped Recovery Scenario)
Table 6 Global Oil & Gas Subsea Umbilical, Risers & Flowlines (SURF) Market by Application, 2024-2034 (US$ Mn, AGR (%), CAGR (%))
Table 7 Exploration Wells Market by Region, 2024-2034 (US$ Mn, AGR (%), CAGR (%))
Table 8 Production Wells Market by Region, 2024-2034 (US$ Mn, AGR (%), CAGR (%))
Table 9 Global Oil & Gas Subsea Umbilical, Risers & Flowlines (SURF) Market by Component, 2024-2034 (US$ Mn, AGR (%), CAGR (%))
Table 10 Umbilical Market by Region, 2024-2034 (US$ Mn, AGR (%), CAGR (%))
Table 11 Risers Market by Region, 2024-2034 (US$ Mn, AGR (%), CAGR (%))
Table 12 Flowlines Market by Region, 2024-2034 (US$ Mn, AGR (%), CAGR (%))
Table 13 Global Oil & Gas Subsea Umbilical, Risers & Flowlines (SURF) Market by Flowlines, 2024-2034 (US$ Mn, AGR (%), CAGR (%))
Table 14 Production Flowlines Market by Region, 2024-2034 (US$ Mn, AGR (%), CAGR (%))
Table 15 Injection Flowlines Market by Region, 2024-2034 (US$ Mn, AGR (%), CAGR (%))
Table 16 Export Flowlines Market by Region, 2024-2034 (US$ Mn, AGR (%), CAGR (%))
Table 17 Other Flowlines Market by Region, 2024-2034 (US$ Mn, AGR (%), CAGR (%))
Table 18 Global Oil & Gas Subsea Umbilical, Risers & Flowlines (SURF) Market by Risers, 2024-2034 (US$ Mn, AGR (%), CAGR (%))
Table 19 Steel Catenary Risers (SCR) Market by Region, 2024-2034 (US$ Mn, AGR (%), CAGR (%))
Table 20 Top Tensioned Risers (TTR) Market by Region, 2024-2034 (US$ Mn, AGR (%), CAGR (%))
Table 21 Steel Lazy Wave Risers Market by Region, 2024-2034 (US$ Mn, AGR (%), CAGR (%))
Table 22 Buoyant Risers Market by Region, 2024-2034 (US$ Mn, AGR (%), CAGR (%))
Table 23 Flexible & Hybrid Risers Market by Region, 2024-2034 (US$ Mn, AGR (%), CAGR (%))
Table 24 Global Oil & Gas Subsea Umbilical, Risers & Flowlines (SURF) Market by Umbilical, 2024-2034 (US$ Mn, AGR (%), CAGR (%))
Table 25 Hydraulic Umbilical Market by Region, 2024-2034 (US$ Mn, AGR (%), CAGR (%))
Table 26 Electro Hydraulic Umbilical Market by Region, 2024-2034 (US$ Mn, AGR (%), CAGR (%))
Table 27 Electro-Optical Umbilical Market by Region, 2024-2034 (US$ Mn, AGR (%), CAGR (%))
Table 28 Control Umbilical Market by Region, 2024-2034 (US$ Mn, AGR (%), CAGR (%))
Table 29 Intervention Umbilical Market by Region, 2024-2034 (US$ Mn, AGR (%), CAGR (%))
Table 30 Production Umbilical Market by Region, 2024-2034 (US$ Mn, AGR (%), CAGR (%))
Table 31 Oil & Gas Subsea Umbilical, Risers & Flowlines (SURF) Market Forecast by Region, 2024-2034 (US$ Million, AGR%, CAGR%)
Table 32 North America Oil & Gas Subsea Umbilical, Risers & Flowlines (SURF) Market by Value, 2024-2034 (US$ Mn, AGR (%), CAGR (%))
Table 33 North America Oil & Gas Subsea Umbilical, Risers & Flowlines (SURF) Market by Country, 2024-2034 (US$ Mn, AGR (%), CAGR (%))
Table 34 North America Oil & Gas Subsea Umbilical, Risers & Flowlines (SURF) Market by Application, 2024-2034 (US$ Mn, AGR (%), CAGR (%))
Table 35 North America Oil & Gas Subsea Umbilical, Risers & Flowlines (SURF) Market by Component, 2024-2034 (US$ Mn, AGR (%), CAGR (%))
Table 36 North America Oil & Gas Subsea Umbilical, Risers & Flowlines (SURF) Market by Flowlines, 2024-2034 (US$ Mn, AGR (%), CAGR (%))
Table 37 North America Oil & Gas Subsea Umbilical, Risers & Flowlines (SURF) Market by Risers, 2024-2034 (US$ Mn, AGR (%), CAGR (%))
Table 38 North America Oil & Gas Subsea Umbilical, Risers & Flowlines (SURF) Market by Umbilical, 2024-2034 (US$ Mn, AGR (%), CAGR (%))
Table 39 US Oil & Gas Subsea Umbilical, Risers & Flowlines (SURF) Market by Value, 2024-2034 (US$ Mn, AGR (%), CAGR (%))
Table 40 Canada Oil & Gas Subsea Umbilical, Risers & Flowlines (SURF) Market by Value, 2024-2034 (US$ Mn, AGR (%), CAGR (%))
Table 41 Europe Oil & Gas Subsea Umbilical, Risers & Flowlines (SURF) Market by Value, 2024-2034 (US$ Mn, AGR (%), CAGR (%))
Table 42 Europe Oil & Gas Subsea Umbilical, Risers & Flowlines (SURF) Market by Country, 2024-2034 (US$ Mn, AGR (%), CAGR (%))
Table 43 Europe Oil & Gas Subsea Umbilical, Risers & Flowlines (SURF) Market by Application, 2024-2034 (US$ Mn, AGR (%), CAGR (%))
Table 44 Europe Oil & Gas Subsea Umbilical, Risers & Flowlines (SURF) Market by Component, 2024-2034 (US$ Mn, AGR (%), CAGR (%))
Table 45 Europe Oil & Gas Subsea Umbilical, Risers & Flowlines (SURF) Market by Flowlines, 2024-2034 (US$ Mn, AGR (%), CAGR (%))
Table 46 Europe Oil & Gas Subsea Umbilical, Risers & Flowlines (SURF) Market by Risers, 2024-2034 (US$ Mn, AGR (%), CAGR (%))
Table 47 Europe Oil & Gas Subsea Umbilical, Risers & Flowlines (SURF) Market by Umbilical, 2024-2034 (US$ Mn, AGR (%), CAGR (%))
Table 48 Norway Oil & Gas Subsea Umbilical, Risers & Flowlines (SURF) Market by Value, 2024-2034 (US$ Mn, AGR (%), CAGR (%))
Table 49 UK Oil & Gas Subsea Umbilical, Risers & Flowlines (SURF) Market by Value, 2024-2034 (US$ Mn, AGR (%), CAGR (%))
Table 50 France Oil & Gas Subsea Umbilical, Risers & Flowlines (SURF) Market by Value, 2024-2034 (US$ Mn, AGR (%), CAGR (%))
Table 51 Russia Oil & Gas Subsea Umbilical, Risers & Flowlines (SURF) Market by Value, 2024-2034 (US$ Mn, AGR (%), CAGR (%))
Table 52 Denmark Oil & Gas Subsea Umbilical, Risers & Flowlines (SURF) Market by Value, 2024-2034 (US$ Mn, AGR (%), CAGR (%))
Table 53 Rest of Europe Oil & Gas Subsea Umbilical, Risers & Flowlines (SURF) Market by Value, 2024-2034 (US$ Mn, AGR (%), CAGR (%))
Table 54 Asia-Pacific Oil & Gas Subsea Umbilical, Risers & Flowlines (SURF) Market by Value, 2024-2034 (US$ Mn, AGR (%), CAGR (%))
Table 55 Asia-Pacific Oil & Gas Subsea Umbilical, Risers & Flowlines (SURF) Market by Country, 2024-2034 (US$ Mn, AGR (%), CAGR (%))
Table 56 Asia-Pacific Oil & Gas Subsea Umbilical, Risers & Flowlines (SURF) Market by Application, 2024-2034 (US$ Mn, AGR (%), CAGR (%))
Table 57 Asia-Pacific Oil & Gas Subsea Umbilical, Risers & Flowlines (SURF) Market by Component, 2024-2034 (US$ Mn, AGR (%), CAGR (%))
Table 58 Asia-Pacific Oil & Gas Subsea Umbilical, Risers & Flowlines (SURF) Market by Flowlines, 2024-2034 (US$ Mn, AGR (%), CAGR (%))
Table 59 Asia-Pacific Oil & Gas Subsea Umbilical, Risers & Flowlines (SURF) Market by Risers, 2024-2034 (US$ Mn, AGR (%), CAGR (%))
Table 60 Asia-Pacific Oil & Gas Subsea Umbilical, Risers & Flowlines (SURF) Market by Umbilical, 2024-2034 (US$ Mn, AGR (%), CAGR (%))
Table 61 China Oil & Gas Subsea Umbilical, Risers & Flowlines (SURF) Market by Value, 2024-2034 (US$ Mn, AGR (%), CAGR (%))
Table 62 India Oil & Gas Subsea Umbilical, Risers & Flowlines (SURF) Market by Value, 2024-2034 (US$ Mn, AGR (%), CAGR (%))
Table 63 Indonesia Oil & Gas Subsea Umbilical, Risers & Flowlines (SURF) Market by Value, 2024-2034 (US$ Mn, AGR (%), CAGR (%))
Table 64 Malaysia Oil & Gas Subsea Umbilical, Risers & Flowlines (SURF) Market by Value, 2024-2034 (US$ Mn, AGR (%), CAGR (%))
Table 65 Australia Oil & Gas Subsea Umbilical, Risers & Flowlines (SURF) Market by Value, 2024-2034 (US$ Mn, AGR (%), CAGR (%))
Table 66 Rest of Asia-Pacific Oil & Gas Subsea Umbilical, Risers & Flowlines (SURF) Market by Value, 2024-2034 (US$ Mn, AGR (%), CAGR (%))
Table 67 Middle East & Africa Oil & Gas Subsea Umbilical, Risers & Flowlines (SURF) Market by Value, 2024-2034 (US$ Mn, AGR (%), CAGR (%))
Table 68 Middle East & Africa Oil & Gas Subsea Umbilical, Risers & Flowlines (SURF) Market by Country, 2024-2034 (US$ Mn, AGR (%), CAGR (%))
Table 69 Middle East & Africa Oil & Gas Subsea Umbilical, Risers & Flowlines (SURF) Market by Application, 2024-2034 (US$ Mn, AGR (%), CAGR (%))
Table 70 Middle East & Africa Oil & Gas Subsea Umbilical, Risers & Flowlines (SURF) Market by Component, 2024-2034 (US$ Mn, AGR (%), CAGR (%))
Table 71 Middle East & Africa Oil & Gas Subsea Umbilical, Risers & Flowlines (SURF) Market by Flowlines, 2024-2034 (US$ Mn, AGR (%), CAGR (%))
Table 72 Middle East & Africa Oil & Gas Subsea Umbilical, Risers & Flowlines (SURF) Market by Risers, 2024-2034 (US$ Mn, AGR (%), CAGR (%))
Table 73 Middle East & Africa Oil & Gas Subsea Umbilical, Risers & Flowlines (SURF) Market by Umbilical, 2024-2034 (US$ Mn, AGR (%), CAGR (%))
Table 74 GCC Oil & Gas Subsea Umbilical, Risers & Flowlines (SURF) Market by Value, 2024-2034 (US$ Mn, AGR (%), CAGR (%))
Table 75 South Africa Oil & Gas Subsea Umbilical, Risers & Flowlines (SURF) Market by Value, 2024-2034 (US$ Mn, AGR (%), CAGR (%))
Table 76 Rest of Middle East & Africa Oil & Gas Subsea Umbilical, Risers & Flowlines (SURF) Market by Value, 2024-2034 (US$ Mn, AGR (%), CAGR (%))
Table 77 Latin America Oil & Gas Subsea Umbilical, Risers & Flowlines (SURF) Market by Value, 2024-2034 (US$ Mn, AGR (%), CAGR (%))
Table 78 Latin America Oil & Gas Subsea Umbilical, Risers & Flowlines (SURF) Market by Country, 2024-2034 (US$ Mn, AGR (%), CAGR (%))
Table 79 Latin America Oil & Gas Subsea Umbilical, Risers & Flowlines (SURF) Market by Application, 2024-2034 (US$ Mn, AGR (%), CAGR (%))
Table 80 Latin America Oil & Gas Subsea Umbilical, Risers & Flowlines (SURF) Market by Component, 2024-2034 (US$ Mn, AGR (%), CAGR (%))
Table 81 Latin America Oil & Gas Subsea Umbilical, Risers & Flowlines (SURF) Market by Flowlines, 2024-2034 (US$ Mn, AGR (%), CAGR (%))
Table 82 Latin America Oil & Gas Subsea Umbilical, Risers & Flowlines (SURF) Market by Risers, 2024-2034 (US$ Mn, AGR (%), CAGR (%))
Table 83 Latin America Oil & Gas Subsea Umbilical, Risers & Flowlines (SURF) Market by Umbilical, 2024-2034 (US$ Mn, AGR (%), CAGR (%))
Table 84 Brazil Oil & Gas Subsea Umbilical, Risers & Flowlines (SURF) Market by Value, 2024-2034 (US$ Mn, AGR (%), CAGR (%))
Table 85 Mexico Oil & Gas Subsea Umbilical, Risers & Flowlines (SURF) Market by Value, 2024-2034 (US$ Mn, AGR (%), CAGR (%))
Table 86 Rest of Latin America Oil & Gas Subsea Umbilical, Risers & Flowlines (SURF) Market by Value, 2024-2034 (US$ Mn, AGR (%), CAGR (%))
Table 87 Strategic Outlook - Contract
Table 88 Subsea 7 S.A.: Key Details, (CEO, HQ, Revenue, Founded, No. of Employees, Company Type, Website, Business Segment)
Table 89 Subsea 7 S.A.: Product Benchmarking
Table 90 Subsea 7 S.A.: Strategic Outlook
Table 91 TechnipFMC plc: Key Details, (CEO, HQ, Revenue, Founded, No. of Employees, Company Type, Website, Business Segment)
Table 92 TechnipFMC plc: Product Benchmarking
Table 93 TechnipFMC plc: Strategic Outlook
Table 94 Saipem S.p.A.: Key Details, (CEO, HQ, Revenue, Founded, No. of Employees, Company Type, Website, Business Segment)
Table 95 Saipem S.p.A.: Product Benchmarking
Table 96 Saipem S.p.A.: Strategic Outlook
Table 97 McDermott International, Ltd: Key Details, (CEO, HQ, Revenue, Founded, No. of Employees, Company Type, Website, Business Segment)
Table 98 McDermott International, Ltd: Product Benchmarking
Table 99 McDermott International, Ltd: Strategic Outlook
Table 100 Oceaneering International, Inc.: Key Details, (CEO, HQ, Revenue, Founded, No. of Employees, Company Type, Website, Business Segment)
Table 101 Oceaneering International, Inc.: Product Benchmarking
Table 102 Oceaneering International, Inc. Strategic Outlook
Table 103 Vallourec S.A.: Key Details, (CEO, HQ, Revenue, Founded, No. of Employees, Company Type, Website, Business Segment)
Table 104 Vallourec S.A.: Product Benchmarking
Table 105 Vallourec S.A.: Strategic Outlook
Table 106 JDR Cable Systems Ltd.: Key Details, (CEO, HQ, Revenue, Founded, No. of Employees, Company Type, Website, Business Segment)
Table 107 JDR Cable Systems Ltd.: Product Benchmarking
Table 108 JDR Cable Systems Ltd.: Strategic Outlook
Table 109 Siemens AG: Key Details, (CEO, HQ, Revenue, Founded, No. of Employees, Company Type, Website, Business Segment)
Table 110 Siemens AG: Product Benchmarking
Table 111 Siemens AG: Strategic Outlook
Table 112 NOV Inc: Key Details, (CEO, HQ, Revenue, Founded, No. of Employees, Company Type, Website, Business Segment)
Table 113 NOV Inc: Product Benchmarking
Table 114 NOV Inc: Strategic Outlook
Table 115 Baker Hughes Company: Key Details, (CEO, HQ, Revenue, Founded, No. of Employees, Company Type, Website, Business Segment)
Table 116 Baker Hughes Company: Product Benchmarking
Table 117 Baker Hughes Company: Strategic Outlook
Table 118 Weatherford International plc: Key Details, (CEO, HQ, Revenue, Founded, No. of Employees, Company Type, Website, Business Segment)
Table 119 Weatherford International plc: Product Benchmarking
Table 120 Weatherford International plc: Strategic Outlook
Table 121 General Electric Company: Key Details, (CEO, HQ, Revenue, Founded, No. of Employees, Company Type, Website, Business Segment)
Table 122 General Electric Company: Product Benchmarking
Table 123 General Electric Company: Strategic Outlook
Table 124 Haliburton Corporation: Key Details, (CEO, HQ, Revenue, Founded, No. of Employees, Company Type, Website, Business Segment)
Table 125 Haliburton Corporation: Product Benchmarking
Table 126 Haliburton Corporation: Strategic Outlook
Table 127 FMC Technologies Inc: Key Details, (CEO, HQ, Revenue, Founded, No. of Employees, Company Type, Website, Business Segment)
Table 128 FMC Technologies Inc: Product Benchmarking
Table 129 FMC Technologies Inc: Strategic Outlook
Table 130 Cameron International Corporation: Key Details, (CEO, HQ, Revenue, Founded, No. of Employees, Company Type, Website, Business Segment)
Table 131 Cameron International Corporation: Product Benchmarking
Table 132 Cameron International Corporation: Strategic Outlook
List of Figures
Figure 1 Oil & Gas Subsea Umbilical, Risers & Flowlines (SURF) Market Segmentation
Figure 2 Oil & Gas Subsea Umbilical, Risers & Flowlines (SURF) Market by Application: Market Attractiveness Index
Figure 3 Oil & Gas Subsea Umbilical, Risers & Flowlines (SURF) Market by Component: Market Attractiveness Index
Figure 4 Oil & Gas Subsea Umbilical, Risers & Flowlines (SURF) Market by Flowlines: Market Attractiveness Index
Figure 5 Oil & Gas Subsea Umbilical, Risers & Flowlines (SURF) Market by Risers: Market Attractiveness Index
Figure 6 Oil & Gas Subsea Umbilical, Risers & Flowlines (SURF) Market by Umbilical: Market Attractiveness Index
Figure 7 Oil & Gas Subsea Umbilical, Risers & Flowlines (SURF) Market Attractiveness Index by Region
Figure 8 Oil & Gas Subsea Umbilical, Risers & Flowlines (SURF) Market: Market Dynamics
Figure 9 Oil & Gas Subsea Umbilical, Risers & Flowlines (SURF) Market: Porter’s Five Forces Analysis
Figure 10 Global Oil & Gas Subsea Umbilical, Risers & Flowlines (SURF) Market Share Forecast by COVID, 2024-2034 (%)
Figure 11 Global Oil & Gas Subsea Umbilical, Risers & Flowlines (SURF) Market by Region, 2024-2034 (US$ Mn, AGR (%)) (V-Shaped Recovery Scenario)
Figure 12 Global Oil & Gas Subsea Umbilical, Risers & Flowlines (SURF) Market by Region, 2024-2034 (US$ Mn, AGR (%)) (U-Shaped Recovery Scenario)
Figure 13 Global Oil & Gas Subsea Umbilical, Risers & Flowlines (SURF) Market by Region, 2024-2034 (US$ Mn, AGR (%)) (W-Shaped Recovery Scenario)
Figure 14 Global Oil & Gas Subsea Umbilical, Risers & Flowlines (SURF) Market by Region, 2024-2034 (US$ Mn, AGR (%)) (L-Shaped Recovery Scenario)
Figure 15 Oil & Gas Subsea Umbilical, Risers & Flowlines (SURF) Market: PEST Analysis
Figure 16 Oil & Gas Subsea Umbilical, Risers & Flowlines (SURF) Market by Application: Market Attractiveness Index
Figure 17 Global Oil & Gas Subsea Umbilical, Risers & Flowlines (SURF) Market by Application, 2024-2034 (US$ Mn, AGR (%), CAGR (%))
Figure 18 Oil & Gas Subsea Umbilical, Risers & Flowlines (SURF) Market Share Forecast by Application, 2024, 2029, 2034 (%)
Figure 19 Exploration Wells Market by Region, 2024-2034 (US$ Mn, AGR (%))
Figure 20 Exploration Wells Market Share Forecast by Region, 2024 & 2034 (%)
Figure 21 Production Wells Market by Region, 2024-2034 (US$ Mn, AGR (%))
Figure 22 Production Wells Market Share Forecast by Region, 2024 & 2034 (%)
Figure 23 Oil & Gas Subsea Umbilical, Risers & Flowlines (SURF) Market by Component: Market Attractiveness Index
Figure 24 Global Oil & Gas Subsea Umbilical, Risers & Flowlines (SURF) Market by Component, 2024-2034 (US$ Mn, AGR (%))
Figure 25 Oil & Gas Subsea Umbilical, Risers & Flowlines (SURF) Market Share Forecast by Component, 2024, 2029, 2034 (%)
Figure 26 Umbilical Market by Region, 2024-2034 (US$ Mn, AGR (%))
Figure 27 Umbilical Market Share Forecast by Region, 2024 & 2034 (%)
Figure 28 Risers Market by Region, 2024-2034 (US$ Mn, AGR (%))
Figure 29 Risers Market Share Forecast by Region, 2024 & 2034 (%)
Figure 30 Flowlines Market by Region, 2024-2034 (US$ Mn, AGR (%))
Figure 31 Flowlines Market Share Forecast by Region, 2024 & 2034 (%)
Figure 32 Oil & Gas Subsea Umbilical, Risers & Flowlines (SURF) Market by Flowlines: Market Attractiveness Index
Figure 33 Global Oil & Gas Subsea Umbilical, Risers & Flowlines (SURF) Market by Flowlines, 2024-2034 (US$ Mn, AGR (%))
Figure 34 Oil & Gas Subsea Umbilical, Risers & Flowlines (SURF) Market Share Forecast by Flowlines, 2024, 2029, 2034 (%)
Figure 35 Production Flowlines Market by Region, 2024-2034 (US$ Mn, AGR (%))
Figure 36 Production Flowlines Market Share Forecast by Region, 2024 & 2034 (%)
Figure 37 Injection Flowlines Market by Region, 2024-2034 (US$ Mn, AGR (%))
Figure 38 Injection Flowlines Market Share Forecast by Region, 2024 & 2034 (%)
Figure 39 Export Flowlines Market by Region, 2024-2034 (US$ Mn, AGR (%))
Figure 40 Export Flowlines Market Share Forecast by Region, 2024 & 2034 (%)
Figure 41 Other Flowlines Market by Region, 2024-2034 (US$ Mn, AGR (%))
Figure 42 Other Flowlines Market Share Forecast by Region, 2024 & 2034 (%)
Figure 43 Oil & Gas Subsea Umbilical, Risers & Flowlines (SURF) Market by Risers: Market Attractiveness Index
Figure 44 Global Oil & Gas Subsea Umbilical, Risers & Flowlines (SURF) Market by Risers, 2024-2034 (US$ Mn, AGR (%))
Figure 45 Oil & Gas Subsea Umbilical, Risers & Flowlines (SURF) Market Share Forecast by Risers, 2024, 2029, 2034 (%)
Figure 46 Steel Catenary Risers (SCR) Market by Region, 2024-2034 (US$ Mn, AGR (%))
Figure 47 Steel Catenary Risers (SCR) Market Share Forecast by Region, 2024 & 2034 (%)
Figure 48 Top Tensioned Risers (TTR) Market by Region, 2024-2034 (US$ Mn, AGR (%))
Figure 49 Top Tensioned Risers (TTR) Market Share Forecast by Region, 2024 & 2034 (%)
Figure 50 Steel Lazy Wave Risers Market by Region, 2024-2034 (US$ Mn, AGR (%))
Figure 51 Steel Lazy Wave Risers Market Share Forecast by Region, 2024 & 2034 (%)
Figure 52 Buoyant Risers Market by Region, 2024-2034 (US$ Mn, AGR (%))
Figure 53 Buoyant Risers Market Share Forecast by Region, 2024 & 2034 (%)
Figure 54 Flexible & Hybrid Risers Market by Region, 2024-2034 (US$ Mn, AGR (%))
Figure 55 Flexible & Hybrid Risers Market Share Forecast by Region, 2024 & 2034 (%)
Figure 56 Oil & Gas Subsea Umbilical, Risers & Flowlines (SURF) Market by Umbilical: Market Attractiveness Index
Figure 57 Global Oil & Gas Subsea Umbilical, Risers & Flowlines (SURF) Market by Umbilical, 2024-2034 (US$ Mn, AGR (%))
Figure 58 Oil & Gas Subsea Umbilical, Risers & Flowlines (SURF) Market Share Forecast by Umbilical, 2024, 2029, 2034 (%)
Figure 59 Hydraulic Umbilical Market by Region, 2024-2034 (US$ Mn, AGR (%))
Figure 60 Hydraulic Umbilical Market Share Forecast by Region, 2024 & 2034 (%)
Figure 61 Electro Hydraulic Umbilical Market by Region, 2024-2034 (US$ Mn, AGR (%))
Figure 62 Electro Hydraulic Umbilical Market Share Forecast by Region, 2024 & 2034 (%)
Figure 63 Electro-Optical Umbilical Market by Region, 2024-2034 (US$ Mn, AGR (%))
Figure 64 Electro-Optical Umbilical Market Share Forecast by Region, 2024 & 2034 (%)
Figure 65 Control Umbilical Market by Region, 2024-2034 (US$ Mn, AGR (%))
Figure 66 Control Umbilical Market Share Forecast by Region, 2024 & 2034 (%)
Figure 67 Intervention Umbilical Market by Region, 2024-2034 (US$ Mn, AGR (%))
Figure 68 Intervention Umbilical Market Share Forecast by Region, 2024 & 2034 (%)
Figure 69 Production Umbilical Market by Region, 2024-2034 (US$ Mn, AGR (%))
Figure 70 Production Umbilical Market Share Forecast by Region, 2024 & 2034 (%)
Figure 71 Oil & Gas Subsea Umbilical, Risers & Flowlines (SURF) Market Forecast by Region 2024 and 2034 (Revenue, CAGR%)
Figure 72 Oil & Gas Subsea Umbilical, Risers & Flowlines (SURF) Market Share Forecast by Region 2024, 2029, 2034 (%)
Figure 73 Oil & Gas Subsea Umbilical, Risers & Flowlines (SURF) Market by Region, 2024-2034 (US$ Million, AGR %)
Figure 74 North America Oil & Gas Subsea Umbilical, Risers & Flowlines (SURF) Market Attractiveness Index
Figure 75 North America Oil & Gas Subsea Umbilical, Risers & Flowlines (SURF) Market by Region, 2024, 2029 & 2034 (US$ Million)
Figure 76 North America Oil & Gas Subsea Umbilical, Risers & Flowlines (SURF) Market by Value, 2024-2034 (US$ Mn, AGR (%))
Figure 77 North America Oil & Gas Subsea Umbilical, Risers & Flowlines (SURF) Market by Value, 2024-2034 (US$ Mn, AGR (%))
Figure 78 North America Oil & Gas Subsea Umbilical, Risers & Flowlines (SURF) Market Share Forecast by Country, 2024 & 2034 (%)
Figure 79 North America Oil & Gas Subsea Umbilical, Risers & Flowlines (SURF) Market by Application, 2024-2034 (US$ Mn, AGR (%))
Figure 80 North America Oil & Gas Subsea Umbilical, Risers & Flowlines (SURF) Market Share Forecast Application, 2024 & 2034 (%)
Figure 81 North America Oil & Gas Subsea Umbilical, Risers & Flowlines (SURF) Market by Component, 2024-2034 (US$ Mn, AGR (%))
Figure 82 North America Oil & Gas Subsea Umbilical, Risers & Flowlines (SURF) Market Share Forecast by Component, 2024 & 2034 (%)
Figure 83 North America Oil & Gas Subsea Umbilical, Risers & Flowlines (SURF) Market by Flowlines, 2024-2034 (US$ Mn, AGR (%))
Figure 84 North America Oil & Gas Subsea Umbilical, Risers & Flowlines (SURF) Market Share Forecast by Flowlines, 2024 & 2034 (%)
Figure 85 North America Oil & Gas Subsea Umbilical, Risers & Flowlines (SURF) Market by Risers, 2024-2034 (US$ Mn, AGR (%))
Figure 86 North America Oil & Gas Subsea Umbilical, Risers & Flowlines (SURF) Market Share Forecast by Risers, 2024 & 2034 (%)
Figure 87 North America Oil & Gas Subsea Umbilical, Risers & Flowlines (SURF) Market by Umbilical, 2024-2034 (US$ Mn, AGR (%))
Figure 88 North America Oil & Gas Subsea Umbilical, Risers & Flowlines (SURF) Market Share Forecast by Umbilical, 2024 & 2034 (%)
Figure 89 US Oil & Gas Subsea Umbilical, Risers & Flowlines (SURF) Market by Value, 2024-2034 (US$ Mn, AGR (%))
Figure 90 Canada Oil & Gas Subsea Umbilical, Risers & Flowlines (SURF) Market by Value, 2024-2034 (US$ Mn, AGR (%))
Figure 91 Europe Oil & Gas Subsea Umbilical, Risers & Flowlines (SURF) Market Attractiveness Index
Figure 92 Europe Oil & Gas Subsea Umbilical, Risers & Flowlines (SURF) Market by Region, 2024, 2029 & 2034 (US$ Million)
Figure 93 Europe Oil & Gas Subsea Umbilical, Risers & Flowlines (SURF) Market by Value, 2024-2034 (US$ Mn, AGR (%))
Figure 94 Europe Oil & Gas Subsea Umbilical, Risers & Flowlines (SURF) Market by Country, 2024-2034 (US$ Mn, AGR (%))
Figure 95 Europe Oil & Gas Subsea Umbilical, Risers & Flowlines (SURF) Market Share Forecast by Country, 2024 & 2034 (%)
Figure 96 Europe Oil & Gas Subsea Umbilical, Risers & Flowlines (SURF) Market by Application, 2024-2034 (US$ Mn, AGR (%))
Figure 97 Europe Oil & Gas Subsea Umbilical, Risers & Flowlines (SURF) Market Share Forecast Application, 2024 & 2034 (%)
Figure 98 Europe Oil & Gas Subsea Umbilical, Risers & Flowlines (SURF) Market by Component, 2024-2034 (US$ Mn, AGR (%))
Figure 99 Europe Oil & Gas Subsea Umbilical, Risers & Flowlines (SURF) Market Share Forecast by Component, 2024 & 2034 (%)
Figure 100 Europe Oil & Gas Subsea Umbilical, Risers & Flowlines (SURF) Market by Flowlines, 2024-2034 (US$ Mn, AGR (%))
Figure 101 Europe Oil & Gas Subsea Umbilical, Risers & Flowlines (SURF) Market Share Forecast by Flowlines, 2024 & 2034 (%)
Figure 102 Europe Oil & Gas Subsea Umbilical, Risers & Flowlines (SURF) Market by Risers, 2024-2034 (US$ Mn, AGR (%))
Figure 103 Europe Oil & Gas Subsea Umbilical, Risers & Flowlines (SURF) Market Share Forecast by Risers, 2024 & 2034 (%)
Figure 104 Europe Oil & Gas Subsea Umbilical, Risers & Flowlines (SURF) Market by Umbilical, 2024-2034 (US$ Mn, AGR (%))
Figure 105 Europe Oil & Gas Subsea Umbilical, Risers & Flowlines (SURF) Market Share Forecast by Umbilical, 2024 & 2034 (%)
Figure 106 Norway Oil & Gas Subsea Umbilical, Risers & Flowlines (SURF) Market by Value, 2024-2034 (US$ Mn, AGR (%))
Figure 107 UK Oil & Gas Subsea Umbilical, Risers & Flowlines (SURF) Market by Value, 2024-2034 (US$ Mn, AGR (%))
Figure 108 France Oil & Gas Subsea Umbilical, Risers & Flowlines (SURF) Market by Value, 2024-2034 (US$ Mn, AGR (%))
Figure 109 Russia Oil & Gas Subsea Umbilical, Risers & Flowlines (SURF) Market by Value, 2024-2034 (US$ Mn, AGR (%))
Figure 110 Denmark Oil & Gas Subsea Umbilical, Risers & Flowlines (SURF) Market by Value, 2024-2034 (US$ Mn, AGR (%))
Figure 111 Rest of Europe Oil & Gas Subsea Umbilical, Risers & Flowlines (SURF) Market by Value, 2024-2034 (US$ Mn, AGR (%))
Figure 112 Asia-Pacific Oil & Gas Subsea Umbilical, Risers & Flowlines (SURF) Market Attractiveness Index
Figure 113 Asia-Pacific Oil & Gas Subsea Umbilical, Risers & Flowlines (SURF) Market by Region, 2024, 2029 & 2034 (US$ Million)
Figure 114 Asia-Pacific Oil & Gas Subsea Umbilical, Risers & Flowlines (SURF) Market by Value, 2024-2034 (US$ Mn, AGR (%))
Figure 115 Asia-Pacific Oil & Gas Subsea Umbilical, Risers & Flowlines (SURF) Market by Country, 2024-2034 (US$ Mn, AGR (%))
Figure 116 Asia-Pacific Oil & Gas Subsea Umbilical, Risers & Flowlines (SURF) Market Share Forecast by Country, 2024 & 2034 (%)
Figure 117 Asia-Pacific Oil & Gas Subsea Umbilical, Risers & Flowlines (SURF) Market by Application, 2024-2034 (US$ Mn, AGR (%))
Figure 118 Asia-Pacific Oil & Gas Subsea Umbilical, Risers & Flowlines (SURF) Market Share Forecast Application, 2024 & 2034 (%)
Figure 119 Asia-Pacific Oil & Gas Subsea Umbilical, Risers & Flowlines (SURF) Market by Component, 2024-2034 (US$ Mn, AGR (%))
Figure 120 Asia-Pacific Oil & Gas Subsea Umbilical, Risers & Flowlines (SURF) Market Share Forecast by Component, 2024 & 2034 (%)
Figure 121 Asia-Pacific Oil & Gas Subsea Umbilical, Risers & Flowlines (SURF) Market by Flowlines, 2024-2034 (US$ Mn, AGR (%))
Figure 122 Asia-Pacific Oil & Gas Subsea Umbilical, Risers & Flowlines (SURF) Market Share Forecast by Flowlines, 2024 & 2034 (%)
Figure 123 Asia-Pacific Oil & Gas Subsea Umbilical, Risers & Flowlines (SURF) Market by Risers, 2024-2034 (US$ Mn, AGR (%))
Figure 124 Asia-Pacific Oil & Gas Subsea Umbilical, Risers & Flowlines (SURF) Market Share Forecast by Risers, 2024 & 2034 (%)
Figure 125 Asia-Pacific Oil & Gas Subsea Umbilical, Risers & Flowlines (SURF) Market by Umbilical, 2024-2034 (US$ Mn, AGR (%))
Figure 126 Asia-Pacific Oil & Gas Subsea Umbilical, Risers & Flowlines (SURF) Market Share Forecast by Umbilical, 2024 & 2034 (%)
Figure 127 China Oil & Gas Subsea Umbilical, Risers & Flowlines (SURF) Market by Value, 2024-2034 (US$ Mn, AGR (%))
Figure 128 India Oil & Gas Subsea Umbilical, Risers & Flowlines (SURF) Market by Value, 2024-2034 (US$ Mn, AGR (%))
Figure 129 Indonesia Oil & Gas Subsea Umbilical, Risers & Flowlines (SURF) Market by Value, 2024-2034 (US$ Mn, AGR (%))
Figure 130 Malaysia Oil & Gas Subsea Umbilical, Risers & Flowlines (SURF) Market by Value, 2024-2034 (US$ Mn, AGR (%))
Figure 131 Australia Oil & Gas Subsea Umbilical, Risers & Flowlines (SURF) Market by Value, 2024-2034 (US$ Mn, AGR (%))
Figure 132 Rest of Asia-Pacific Oil & Gas Subsea Umbilical, Risers & Flowlines (SURF) Market by Value, 2024-2034 (US$ Mn, AGR (%))
Figure 133 Middle East and Africa Oil & Gas Subsea Umbilical, Risers & Flowlines (SURF) Market Attractiveness Index
Figure 134 Middle East and Africa Oil & Gas Subsea Umbilical, Risers & Flowlines (SURF) Market by Region, 2024, 2029 & 2034 (US$ Million)
Figure 135 Middle East & Africa Oil & Gas Subsea Umbilical, Risers & Flowlines (SURF) Market by Value, 2024-2034 (US$ Mn, AGR (%))
Figure 136 Middle East & Africa Oil & Gas Subsea Umbilical, Risers & Flowlines (SURF) Market by Country, 2024-2034 (US$ Mn, AGR (%))
Figure 137 Middle East and Africa Oil & Gas Subsea Umbilical, Risers & Flowlines (SURF) Market Share Forecast by Country, 2024 & 2034 (%)
Figure 138 Middle East & Africa Oil & Gas Subsea Umbilical, Risers & Flowlines (SURF) Market by Application, 2024-2034 (US$ Mn, AGR (%))
Figure 139 Middle East and Africa Oil & Gas Subsea Umbilical, Risers & Flowlines (SURF) Market Share Forecast Application, 2024 & 2034 (%)
Figure 140 Middle East & Africa Oil & Gas Subsea Umbilical, Risers & Flowlines (SURF) Market by Component, 2024-2034 (US$ Mn, AGR (%))
Figure 141 Middle East and Africa Oil & Gas Subsea Umbilical, Risers & Flowlines (SURF) Market Share Forecast by Component, 2024 & 2034 (%)
Figure 142 Middle East & Africa Oil & Gas Subsea Umbilical, Risers & Flowlines (SURF) Market by Flowlines, 2024-2034 (US$ Mn, AGR (%))
Figure 143 Middle East and Africa Oil & Gas Subsea Umbilical, Risers & Flowlines (SURF) Market Share Forecast by Flowlines, 2024 & 2034 (%)
Figure 144 Middle East & Africa Oil & Gas Subsea Umbilical, Risers & Flowlines (SURF) Market by Risers, 2024-2034 (US$ Mn, AGR (%))
Figure 145 Middle East and Africa Oil & Gas Subsea Umbilical, Risers & Flowlines (SURF) Market Share Forecast by Risers, 2024 & 2034 (%)
Figure 146 Middle East & Africa Oil & Gas Subsea Umbilical, Risers & Flowlines (SURF) Market by Umbilical, 2024-2034 (US$ Mn, AGR (%))
Figure 147 Middle East and Africa Oil & Gas Subsea Umbilical, Risers & Flowlines (SURF) Market Share Forecast by Umbilical, 2024 & 2034 (%)
Figure 148 GCC Oil & Gas Subsea Umbilical, Risers & Flowlines (SURF) Market by Value, 2024-2034 (US$ Mn, AGR (%))
Figure 149 South Africa Oil & Gas Subsea Umbilical, Risers & Flowlines (SURF) Market by Value, 2024-2034 (US$ Mn, AGR (%))
Figure 150 Rest of Middle East & Africa Oil & Gas Subsea Umbilical, Risers & Flowlines (SURF) Market by Value, 2024-2034 (US$ Mn, AGR (%))
Figure 151 Latin America Oil & Gas Subsea Umbilical, Risers & Flowlines (SURF) Market Attractiveness Index
Figure 152 Latin America Oil & Gas Subsea Umbilical, Risers & Flowlines (SURF) Market by Region, 2024, 2029 & 2034 (US$ Million)
Figure 153 Latin America Oil & Gas Subsea Umbilical, Risers & Flowlines (SURF) Market by Value, 2024-2034 (US$ Mn, AGR (%))
Figure 154 Latin America Oil & Gas Subsea Umbilical, Risers & Flowlines (SURF) Market by Country, 2024-2034 (US$ Mn, AGR (%))
Figure 155 Latin America Oil & Gas Subsea Umbilical, Risers & Flowlines (SURF) Market Share Forecast by Country, 2024 & 2034 (%)
Figure 156 Latin America Oil & Gas Subsea Umbilical, Risers & Flowlines (SURF) Market by Application, 2024-2034 (US$ Mn, AGR (%))
Figure 157 Latin America Oil & Gas Subsea Umbilical, Risers & Flowlines (SURF) Market Share Forecast Application, 2024 & 2034 (%)
Figure 158 Latin America Oil & Gas Subsea Umbilical, Risers & Flowlines (SURF) Market by Component, 2024-2034 (US$ Mn, AGR (%))
Figure 159 Latin America Oil & Gas Subsea Umbilical, Risers & Flowlines (SURF) Market Share Forecast by Component, 2024 & 2034 (%)
Figure 160 Latin America Oil & Gas Subsea Umbilical, Risers & Flowlines (SURF) Market by Flowlines, 2024-2034 (US$ Mn, AGR (%))
Figure 161 Latin America Oil & Gas Subsea Umbilical, Risers & Flowlines (SURF) Market Share Forecast by Flowlines, 2024 & 2034 (%)
Figure 162 Latin America Oil & Gas Subsea Umbilical, Risers & Flowlines (SURF) Market by Risers, 2024-2034 (US$ Mn, AGR (%))
Figure 163 Latin America Oil & Gas Subsea Umbilical, Risers & Flowlines (SURF) Market Share Forecast by Risers, 2024 & 2034 (%)
Figure 164 Latin America Oil & Gas Subsea Umbilical, Risers & Flowlines (SURF) Market by Umbilical, 2024-2034 (US$ Mn, AGR (%))
Figure 165 Latin America Oil & Gas Subsea Umbilical, Risers & Flowlines (SURF) Market Share Forecast by Umbilical, 2024 & 2034 (%)
Figure 166 Brazil Oil & Gas Subsea Umbilical, Risers & Flowlines (SURF) Market by Value, 2024-2034 (US$ Mn, AGR (%))
Figure 167 Mexico Oil & Gas Subsea Umbilical, Risers & Flowlines (SURF) Market by Value, 2024-2034 (US$ Mn, AGR (%))
Figure 168 Rest of Latin America Oil & Gas Subsea Umbilical, Risers & Flowlines (SURF) Market by Value, 2024-2034 (US$ Mn, AGR (%))
Figure 169 Oil & Gas Subsea Umbilical, Risers & Flowlines (SURF) Market: Company Share, 2022
Figure 170 Subsea 7 S.A..: Net Revenue, 2018-2022 (US$ Million, AGR%)
Figure 171 Subsea 7 S.A..: R&D, 2018-2022 (US$ Million, AGR%)
Figure 172 TechnipFMC plc.: Net Revenue, 2018-2022 (US$ Million, AGR%)
Figure 173 TechnipFMC plc.: R&D, 2018-2022 (US$ Million, AGR%)
Figure 174 TechnipFMC plc.: Regional Revenue Share, 2022 (%)
Figure 175 TechnipFMC plc.: Business Segment Revenue Share, 2022 (%)
Figure 176 Saipem S.p.A..: Net Revenue, 2018-2022 (US$ Million, AGR%)
Figure 177 Saipem S.p.A..: R&D, 2018-2022 (US$ Million, AGR%)
Figure 178 Saipem S.p.A..: Regional Revenue Share, 2022 (%)
Figure 179 Saipem S.p.A..: Business Segment Revenue Share, 2022 (%)
Figure 180 Oceaneering International, Inc..: Net Revenue, 2018-2022 (US$ Million, AGR%)
Figure 181 Oceaneering International, Inc..: Business Segment Revenue Share, 2022 (%)
Figure 182 Vallourec S.A..: Net Revenue, 2018-2022 (US$ Million, AGR%)
Figure 183 Vallourec S.A..: Business Segment Revenue Share, 2022 (%)
Figure 184 Siemens AG.: Net Revenue, 2018-2022 (US$ Million, AGR%)
Figure 185 Siemens AG.: R&D, 2018-2022 (US$ Million, AGR%)
Figure 186 Siemens AG.: Regional Revenue Share, 2022 (%)
Figure 187 Siemens AG.: Business Segment Revenue Share, 2022 (%)
Figure 188 NOV Inc.: Net Revenue, 2018-2022 (US$ Million, AGR%)
Figure 189 NOV Inc.: Regional Revenue Share, 2022 (%)
Figure 190 NOV Inc.: Business Segment Revenue Share, 2022 (%)
Figure 191 Baker Hughes Company.: Net Revenue, 2018-2022 (US$ Million, AGR%)
Figure 192 Baker Hughes Company.: R&D, 2018-2022 (US$ Million, AGR%)
Figure 193 Baker Hughes Company.: Regional Revenue Share, 2022 (%)
Figure 194 Baker Hughes Company.: Business Segment Revenue Share, 2022 (%)
Figure 195 Weatherford International plc.: Net Revenue, 2018-2022 (US$ Million, AGR%)
Figure 196 Weatherford International plc.: R&D, 2018-2022 (US$ Million, AGR%)
Figure 197 Weatherford International plc.: Regional Revenue Share, 2022 (%)
Figure 198 Weatherford International plc.: Business Segment Revenue Share, 2022 (%)
Figure 199 General Electric Company.: Net Revenue, 2018-2022 (US$ Million, AGR%)
Figure 200 General Electric Company.: R&D, 2018-2022 (US$ Million, AGR%)
Figure 201 General Electric Company.: Regional Revenue Share, 2022 (%)
Figure 202 General Electric Company.: Business Segment Revenue Share, 2022 (%)
Figure 203 Haliburton Corporation.: Net Revenue, 2018-2022 (US$ Million, AGR%)
Figure 204 Haliburton Corporation.: R&D, 2018-2022 (US$ Million, AGR%)
Figure 205 Haliburton Corporation.: Regional Revenue Share, 2022 (%)
Figure 206 Haliburton Corporation.: Business Segment Revenue Share, 2022 (%)
Figure 207 FMC Technologies Inc.: Net Revenue, 2018-2022 (US$ Million, AGR%)
Figure 208 FMC Technologies Inc.: R&D, 2018-2022 (US$ Million, AGR%)
Figure 209 FMC Technologies Inc.: Regional Revenue Share, 2022 (%)
Figure 210 FMC Technologies Inc.: Business Segment Revenue Share, 2022 (%)
Figure 211 Cameron International Corporation.: Net Revenue, 2018-2022 (US$ Million, AGR%)
Figure 212 Cameron International Corporation.: R&D, 2018-2022 (US$ Million, AGR%)
Figure 213 Cameron International Corporation.: Regional Revenue Share, 2022 (%)
Figure 214 Cameron International Corporation.: Business Segment Revenue Share, 2022 (%)
ページTOPに戻る
本レポートと同じKEY WORD(oil)の最新刊レポート
よくあるご質問
Visiongain社はどのような調査会社ですか?
英国の調査会社ヴィジョンゲイン社(Visiongain)は、通信とエネルギーのほか、自動車や化学・医薬品、金属など、広範な市場を対象に調査を行っています。自動車市場については、市場全般に関する調査のほ... もっと見る
調査レポートの納品までの日数はどの程度ですか?
在庫のあるものは速納となりますが、平均的には 3-4日と見て下さい。
但し、一部の調査レポートでは、発注を受けた段階で内容更新をして納品をする場合もあります。
発注をする前のお問合せをお願いします。
注文の手続きはどのようになっていますか?
1)お客様からの御問い合わせをいただきます。
2)見積書やサンプルの提示をいたします。
3)お客様指定、もしくは弊社の発注書をメール添付にて発送してください。
4)データリソース社からレポート発行元の調査会社へ納品手配します。
5) 調査会社からお客様へ納品されます。最近は、pdfにてのメール納品が大半です。
お支払方法の方法はどのようになっていますか?
納品と同時にデータリソース社よりお客様へ請求書(必要に応じて納品書も)を発送いたします。
お客様よりデータリソース社へ(通常は円払い)の御振り込みをお願いします。
請求書は、納品日の日付で発行しますので、翌月最終営業日までの当社指定口座への振込みをお願いします。振込み手数料は御社負担にてお願いします。
お客様の御支払い条件が60日以上の場合は御相談ください。
尚、初めてのお取引先や個人の場合、前払いをお願いすることもあります。ご了承のほど、お願いします。
データリソース社はどのような会社ですか?
当社は、世界各国の主要調査会社・レポート出版社と提携し、世界各国の市場調査レポートや技術動向レポートなどを日本国内の企業・公官庁及び教育研究機関に提供しております。
世界各国の「市場・技術・法規制などの」実情を調査・収集される時には、データリソース社にご相談ください。
お客様の御要望にあったデータや情報を抽出する為のレポート紹介や調査のアドバイスも致します。
|
|


