陸上掘削装置市場レポート:2023-2033
Land Drill Rigs Market Report 2023-2033
レポート詳細
陸上掘削リグ市場レポート 2023-2033年 : 本レポートは、業界とその基礎となるダイナミクスをより良く理解したい場合、新たな収益ポケットを目指している大手企業にとって非常に貴重な... もっと見る
※上記価格は部署ライセンス(Departmental licence)価格です。
その他の価格についてはデータリソースまでお問合せください。
日本語のページは自動翻訳を利用し作成しています。
実際のレポートは英文のみでご納品いたします。
サマリー
レポート詳細
陸上掘削リグ市場レポート 2023-2033年: 本レポートは、業界とその基礎となるダイナミクスをより良く理解したい場合、新たな収益ポケットを目指している大手企業にとって非常に貴重なものとなります。異業種への進出や新規地域での既存事業の拡大を目指す企業にも有用です。
石油・ガス探査需要の高まりが市場成長を牽引
工業化、都市化、エネルギー需要の増加により、世界の石油・ガス需要は新たな高まりを見せている。新興経済圏が拡大するにつれ、エネルギー資源に対する需要も高まり、大規模な探査が必要となっている。陸上掘削リグは、石油・ガス探査の基本的なツールとして、需要が高まっている。ブラジルやインドなど、野心的なエネルギー政策を掲げる国々は、探査イニシアティブに多額の投資を行っている。例えば、ブラジルのプレソルト層(岩塩層)石油の発見は、掘削活動の急増に拍車をかけ、先進的な陸上掘削リグへの需要を煽っている。市場はこの需要にダイナミックに対応し、メーカー各社は進化する探査の課題に対応するために技術革新を行っている。
再生可能エネルギーへの注目の高まりが市場成長の妨げになる可能性
近年、再生可能エネルギーへの注目が高まり、世界のエネルギー事情に顕著な変化が起きている。この変化の背景には、環境問題への意識の高まり、気候変動緩和への取り組み、二酸化炭素排出量削減への意欲がある。その結果、ラテンアメリカの主要なエネルギー消費国を含む多くの国々が、風力、太陽光、地熱などの自然エネルギーを取り入れるべく、エネルギー・ポートフォリオの多様化を進めている。この移行は、同地域の陸上掘削リグ市場に直接的な影響を与えている。従来の石油・ガス掘削リグの需要が安定または減少する一方で、地熱坑井掘削に使用されるドリルリグに対するニーズは高まっている。メーカーと掘削会社は、進化する市場で競争力を維持するために、再生可能エネルギーの探査と掘削に関連する技術と専門知識に投資することで、このような状況の変化に対応しなければならない。
市場調査レポートを購入する前にすべき質問とは?
- 陸上掘削リグ市場はどのように進化しているのか?
- 陸上掘削リグ市場の促進要因と阻害要因は何か?
- 陸上掘削リグの各サブマーケットセグメントは予測期間中にどのように成長し、2033年にはどれくらいの売上高を占めるようになるのか?
- 2023年から2033年にかけて、陸上掘削リグサブマーケットごとの市場シェアはどのように推移するか?
- 2023年から2033年にかけて市場全体を牽引する主要因は何か?
- 陸上掘削リグの主要市場はマクロ経済の動きに概ね追随するのか、それとも各国市場が他を上回るのか?
- 2033年までに各国市場のシェアはどう変化し、2033年に市場をリードするのはどの地域か?
- 主要プレーヤーと予測期間中の見通しは?
- これら大手企業の陸上掘削リグプロジェクトは?
- 2023年から2033年にかけて、業界はどのように発展していくのか?現在および今後10年間に実施される陸上掘削リグプロジェクトにはどのような意味があるのでしょうか?
- 陸上掘削リグ市場をさらに拡大するために、製品の商業化の必要性は高まっていますか?
- 陸上掘削リグ市場の方向性と、市場の最前線に立つための確実な方法とは?
- 新製品やサービスラインへの最適な投資方法とは?
- 企業を新たな成長軌道に乗せ、C-suiteに移行させるための重要な展望とは?
このことが、陸上掘削リグ市場に現在、そして今後10年間でどのような影響を与えるかを見極める必要がある:
- 391ページにわたる本レポートでは、146の表と190の図表を掲載しています。
- 本レポートでは、業界における主要な有利分野をハイライトしているため、今すぐターゲットを絞ることができます。
- 本レポートには、世界、地域、国の売上と成長に関する詳細な分析が含まれています。
- 競合他社が成功した主なトレンド、変化、収益予測をハイライトしています。
本レポートは、陸上掘削リグ市場が今後10年間でどのように発展するか、またCOVID-19の景気後退と好転の変動に合わせてどのように発展するかをお伝えします。この市場は、過去10年間のどの時点よりも今が重要です。
2033年までの予測やその他の分析から、商業的な展望が明らかになる
- 2033年までの収益予測に加え、直近の業績、成長率、市場シェアもご覧いただけます。
- ビジネスの展望と展開に関する独自の分析をご覧いただけます。
- 定性的分析(市場ダイナミクス、促進要因、機会、阻害要因、課題など)、コスト構造、陸上掘削リグ価格上昇の影響、最近の動向などをご覧いただけます。
本レポートには、COVID-19が業界と貴社にどのような影響を与えるかについてのデータ分析と貴重な洞察が含まれている。本レポートでは、COVID-19の4つの回収パターンとその影響、すなわち「V」、「L」、「W」、「U」について論じている。
レポート対象セグメント
タイプ別市場セグメント
- 移動式リグ
- 従来型リグ
パワータイプ別市場セグメント
- 1500馬力未満
- 1500馬力以上2500馬力未満
- 2500馬力以上
坑井クラス別市場セグメント
- 油井
- ガス井
- 水井戸
- 炭層メタン(CBM)生産井戸
- その他の坑井クラス
技術別市場セグメント
- 機械式ドリルリグ
- 油圧式ドリルリグ
- 電気式ドリルリグ
- ロータリーテーブルドリルリグ
- オーガドリルリグ
- その他の技術
世界市場全体とセグメント別の収益予測に加え、4つの地域と20の主要国市場の収益予測も掲載しています:
北米
- アメリカ
- カナダ
欧州
- ドイツ
- 英国
- フランス
- カザフスタン
- ロシア
- その他の欧州
アジア太平洋
- 中国
- インド
- インドネシア
- マレーシア
- ベトナム
- その他のアジア太平洋地域
ラテンアメリカ
- アルゼンチン
- コロンビア
- その他のラテンアメリカ
中東・アフリカ
- GCC
- アルジェリア
- その他の中東・アフリカ
また、陸上掘削リグ市場の2023年から2033年にかけての主要企業のプロファイルも掲載しています。
主要企業と市場成長の可能性
・ Bentec GmbH Drilling & Oilfield Systems
・ Helmerich & Payne, Inc.
・ Independence Contract Drilling, Inc.
・ KCA Deutag
・ KWIPPED
・ Lamprell plc
・ MD Cowan, Inc
・ Nabors Industries Limited
・ NOV Inc.
・ Patterson-UTI Energy, Inc.
・ Precision Drilling Corporation
・ RG Petro-Machinery Group Co., Ltd.
・ Rig Source, Inc.
・ TOTAL Oil Rig Leasing Ltd
・ United Rentals, Inc.
2023年から2033年にかけての陸上掘削リグ市場全体の世界売上高は、金額ベースで2023年に438億米ドルを突破すると当研究所は算出した。2033年まで力強い収益成長を予測。当調査では、最も大きな可能性を秘めた組織を特定しています。彼らの能力、進歩、商業的展望を発見し、一歩先を行くお手伝いをします。
陸上掘削リグ市場、2023-2033年レポートはどのようにお役に立つでしょうか?
要約すると、390ページを超えるこのレポートは、以下の知識を提供する:
- 陸上掘削リグ市場の2023年から2033年までの収益予測 世界および地域レベルでのタイプ、パワータイプ、坑井クラス、技術別の予測 - 業界の展望を発見し、投資と収益に最も有利な場所を見つけます。
- 4つの地域と20の主要国市場の2033年までの収益予測 - 陸上掘削リグ市場の2023年から2033年までの北米、ヨーロッパ、アジア太平洋、ラテンアメリカ、中東&アフリカの市場予測をご覧ください。また、米国、カナダ、ブラジル、英国、フランス、ロシア、カザフスタン、中国、インド、インドネシア、マレーシア、アルジェリアなどの著名経済圏の市場も予測しています。
- 既存企業や市場参入を目指す企業にとっての展望 - 陸上掘削リグ市場に関わる主要企業15社の企業プロファイルを含む、2023年から2033年までの市場。
独自の予測による定量的・定性的分析をご覧ください。私たちのレポートだけに含まれる情報を入手し、貴重なビジネスインテリジェンスで情報を得ることができます。
他にはない情報
私たちの新しいレポートがあれば、知識に遅れをとったり、チャンスを逃したりする可能性が低くなります。弊社の調査レポートが貴社の調査、分析、意思決定にどのように役立つかをご覧ください。Visiongainのこの調査レポートは、陸上掘削リグ市場の2023年から2033年までの商業分析を必要とする方、市場をリードする企業の方々を対象としています。データ、トレンド、予測をご覧いただけます。
ページTOPに戻る
目次
目次
1 レポート概要
1.1 研究の目的
1.2 陸上掘削装置市場の紹介
1.3 本レポートの内容
1.4 本レポートを読むべき理由
1.5 本分析レポートが回答する主な質問
1.6 本レポートは誰のためのものか?
1.7 方法論
1.7.1 市場の定義
1.7.2 市場評価・予測手法
1.7.3 データの検証
1.7.3.1 一次調査
1.7.3.2 セカンダリーリサーチ
1.8 よくある質問(FAQ)
1.9 Visiongainの関連レポート
1.10 Visiongainについて
2 エグゼクティブ・サマリー
3 市場概要
3.1 主要な調査結果
3.2 市場ダイナミクス
3.2.1 市場促進要因
3.2.1.1 高馬力・ハイテクリグの使用増加
3.2.1.2 陸上石油生産の増加が市場成長を牽引
3.2.1.3 石油・ガス産業への投資拡大が市場を牽引
3.2.2 市場抑制要因
3.2.2.1 再生可能エネルギーへの関心の高まりが市場成長の妨げになる可能性
3.2.2.2 低い原油価格が市場成長の妨げになる可能性
3.2.2.3 厳しい政府規制と政策が市場成長の妨げになる可能性
3.2.3 市場機会
3.2.3.1 新技術の開発は市場にとってチャンスとなり得る
3.2.3.2 新世代の自動掘削リグが市場機会をもたらす
3.2.3.3 回転式掘削リグは低環境汚染で現場をクリーンに保つ
3.3 ポーターのファイブフォース分析
3.3.1 サプライヤーの交渉力(中)
3.3.2 買い手の交渉力(高)
3.3.3 競争力(高)
3.3.4 代替品による脅威(低)
3.3.5 新規参入の脅威(高)
3.4 COVID-19の影響分析
3.4.1 "V字型回復"
3.4.2 "U字型回復"
3.4.3 "W字型回復"
3.4.4 "L字型回復"
3.5 PEST分析
4 陸上掘削リグ市場分析:タイプ別
4.1 主要な調査結果
4.2 タイプ別セグメント 市場魅力度指数
4.3 陸上掘削リグのタイプ別市場規模推定と予測
4.4 移動式リグ
4.4.1 2023〜2033年の地域別市場規模(US$ Billion)
4.4.2 地域別市場シェア、2023年・2033年(%)
4.5 従来型リグ
4.5.1 2023〜2033年の地域別市場規模(US$ Billion)
4.5.2 地域別市場シェア、2023年・2033年(%)
5 陸上掘削リグの動力タイプ別市場分析
5.1 主要調査結果
5.2 動力タイプ別セグメント 市場魅力度指数
5.3 陸上掘削リグの動力タイプ別市場規模推定と予測
5.4 1500hp未満
5.4.1 2023〜2033年の地域別市場規模(US$ Billion)
5.4.2 地域別市場シェア、2023年・2033年(%)
5.5 1500hp〜2500hp
5.5.1 2023~2033年の地域別市場規模(US$ Billion)
5.5.2 地域別市場シェア、2023年・2033年(%)
5.6 2500hp以上
5.6.1 2023〜2033年の地域別市場規模(US$ Billion)
5.6.2 地域別市場シェア、2023年・2033年(%)
6 陸上掘削リグ市場分析:坑井クラス別
6.1 主要な調査結果
6.2 坑井クラス別セグメント 市場魅力度指数
6.3 陸上掘削リグの坑井クラス別市場規模の推定と予測
6.4 油井
6.4.1 2023~2033年の地域別市場規模(US$ Billion)
6.4.2 地域別市場シェア、2023年・2033年(%)
6.5 ガス井
6.5.1 2023~2033年の地域別市場規模(US$ Billion)
6.5.2 地域別市場シェア、2023年・2033年(%)
6.6 水井戸
6.6.1 2023〜2033年の地域別市場規模(US$ Billion)
6.6.2 地域別市場シェア、2023年・2033年(%)
6.7 コールベッドメタン(CBM)生産井戸
6.7.1 2023~2033年の地域別市場規模(US$ Billion)
6.7.2 地域別市場シェア、2023年・2033年(%)
6.8 その他の坑井クラス
6.8.1 2023~2033年の地域別市場規模(US$ Billion)
6.8.2 地域別市場シェア、2023年・2033年(%)
7 陸上掘削リグ市場分析:技術別
7.1 主要調査結果
7.2 技術セグメント 市場魅力度指数
7.3 陸上掘削リグの市場規模予測:技術別
7.4 機械式ドリルリグ
7.4.1 2023~2033年の地域別市場規模(US$ Billion)
7.4.2 地域別市場シェア、2023年・2033年(%)
7.5 油圧式ドリルリグ
7.5.1 2023~2033年の地域別市場規模(US$ Billion)
7.5.2 地域別市場シェア、2023年・2033年(%)
7.6 電動ドリルリグ
7.6.1 2023~2033年の地域別市場規模(US$ Billion)
7.6.2 地域別市場シェア、2023年・2033年(%)
7.7 回転テーブル式ドリルリグ
7.7.1 2023~2033年の地域別市場規模(US$ Billion)
7.7.2 地域別市場シェア、2023年・2033年(%)
7.8 オーガドリルリグ
7.8.1 2023~2033年の地域別市場規模(US$ Billion)
7.8.2 地域別市場シェア、2023年・2033年(%)
7.9 その他の技術
7.9.1 2023〜2033年の地域別市場規模(US$ Billion)
7.9.2 地域別市場シェア、2023年・2033年(%)
8 陸上掘削リグ市場分析:地域別
8.1 主要な調査結果
8.2 地域別市場規模の推定と予測
9 北米の陸上掘削リグ市場の分析
9.1 主要な調査結果
9.2 北米の陸上掘削リグ市場魅力度指数
9.3 北米の陸上掘削リグ国別市場:2023年、2028年、2033年 (US$ Billion)
9.4 北米の陸上掘削リグ市場規模推定と予測
9.5 北米の陸上掘削リグ市場規模推定と予測:国別
9.6 北米の陸上掘削リグ市場規模推定と予測:タイプ別
9.7 北米の陸上掘削リグ市場規模推定と予測:動力タイプ別
9.8 北米の陸上掘削リグ市場規模推定と予測:坑井クラス別
9.9 北米の陸上掘削リグ市場規模推定と予測:技術別
9.10 米国の陸上掘削リグ市場分析
9.11 カナダの陸上掘削リグ市場分析
10 欧州の陸上掘削リグ市場分析
10.1 主要な調査結果
10.2 欧州の陸上掘削リグ市場魅力度指数
10.3 欧州の陸上掘削リグ国別市場:2023年、2028年、2033年 (US$ Billion)
10.4 欧州の陸上掘削リグ市場規模推定と予測
10.5 欧州の陸上掘削リグ市場規模推定と予測:国別
10.6 欧州の陸上掘削リグ市場規模推定と予測:タイプ別
10.7 欧州の陸上掘削リグ市場規模推定と予測:動力タイプ別
10.8 欧州の陸上掘削リグ市場規模推定と予測:坑井クラス別
10.9 欧州の陸上掘削リグ市場規模推定と予測:技術別
10.10 ドイツの陸上掘削リグ市場分析
10.11 イギリスの陸上掘削リグ市場分析
10.12 フランスの陸上掘削リグ市場分析
10.13 カザフスタン陸上掘削リグ市場分析
10.14 ロシアの陸上掘削リグ市場分析
10.15 その他の欧州の陸上掘削リグ市場分析
11 アジア太平洋地域の陸上掘削リグ市場分析
11.1 主要な調査結果
11.2 アジア太平洋地域の陸上掘削リグ市場魅力度指数
11.3 アジア太平洋地域の陸上掘削リグ国別市場、2023年、2028年、2033年(US$ Billion)
11.4 アジア太平洋地域の陸上掘削リグ市場規模の推定と予測
11.5 アジア太平洋地域の陸上掘削リグ市場規模推定と予測:国別
11.6 アジア太平洋地域の陸上掘削リグ市場規模推定と予測:タイプ別
11.7 アジア太平洋地域の陸上掘削リグ市場規模推定と予測:タイプ別
11.8 アジア太平洋地域の陸上掘削リグ市場規模推定と予測:坑井クラス別
11.9 アジア太平洋地域の陸上掘削リグ市場規模推定と予測:技術別
11.10 中国の陸上掘削リグ市場分析
11.11 インドの陸上掘削リグ市場分析
11.12 インドネシアの陸上掘削リグ市場分析
11.13 マレーシアの陸上掘削リグ市場分析
11.14 ベトナムの陸上掘削リグ市場分析
11.15 その他のアジア太平洋地域の陸上掘削リグ市場分析
12 中東とアフリカの陸上掘削リグ市場分析
12.1 主要な調査結果
12.2 中東・アフリカの陸上掘削リグ市場魅力度指数
12.3 中東・アフリカの陸上掘削リグ国別市場、2023年、2028年、2033年 (US$ Billion)
12.4 中東・アフリカの陸上掘削リグ市場規模推定と予測
12.5 中東・アフリカの陸上掘削リグ市場規模推定と予測:国別
12.6 中東・アフリカの陸上掘削リグ市場規模推定と予測:タイプ別
12.7 中東・アフリカの陸上掘削リグ市場規模推定と予測:動力タイプ別
12.8 中東・アフリカの陸上掘削リグ市場規模推定と予測:坑井クラス別
12.9 中東・アフリカの陸上掘削リグ市場規模推定と予測:技術別
12.10 GCCの陸上掘削リグ市場分析
12.11 アルジェリアの陸上掘削リグ市場分析
12.12 その他の中東・アフリカ陸上掘削リグ市場分析
13 ラテンアメリカの陸上掘削リグ市場分析
13.1 主要な調査結果
13.2 ラテンアメリカの陸上掘削リグ市場魅力度指数
13.3 ラテンアメリカの陸上掘削リグ国別市場、2023年、2028年、2033年 (US$ Billion)
13.4 ラテンアメリカの陸上掘削リグ市場規模推計・予測
13.5 ラテンアメリカの陸上掘削リグ市場規模推移の国別推計と予測
13.6 ラテンアメリカの陸上掘削リグ市場規模推計・予測:タイプ別
13.7 ラテンアメリカの陸上掘削リグ市場規模推計と予測:動力タイプ別
13.8 ラテンアメリカの陸上掘削リグ市場規模推計と予測:坑井クラス別
13.9 ラテンアメリカの陸上掘削リグ市場規模推計と予測:技術別
13.10 アルゼンチンの陸上掘削リグ市場分析
13.11 コロンビアの陸上掘削リグ市場分析
13.12 その他のラテンアメリカの陸上掘削リグ市場分析
14 主要企業のプロファイル
14.1 競争環境、2022年
14.2 戦略的展望
14.3 Bentec GmbH Drilling & Oilfield Systems
14.3.1 会社概要
14.3.2 会社概要
14.3.3 製品ベンチマーク
14.3.4 戦略的展望
14.4 Helmerich & Payne, Inc.
14.4.1 会社概要
14.4.2 会社概要
14.4.3 財務分析
14.4.3.1 純収入、2018-2022年
14.4.3.2 売上高、2018-2022年
14.4.4 製品ベンチマーク
14.4.5 戦略的展望
14.5 Independence Contract Drilling, Inc.
14.5.1 会社概要
14.5.2 会社概要
14.5.3 財務分析
14.5.3.1 純収入、2018-2022年
14.5.4 製品ベンチマーク
14.5.5 戦略的展望
14.6 KCA Deutag
14.6.1 会社概要
14.6.2 会社概要
14.6.3 製品ベンチマーク
14.6.4 戦略的展望
14.7 KWIPPED
14.7.1 会社概要
14.7.2 会社概要
14.7.3 製品ベンチマーク
14.7.4 戦略的展望
14.8 Lamprell plc
14.8.1 会社概要
14.8.2 会社概要
14.8.3 製品ベンチマーク
14.8.4 戦略的展望
14.9 MD Cowan, Inc
14.9.1 会社概要
14.9.2 会社概要
14.9.3 製品ベンチマーク
14.9.4 戦略的展望
14.10 Nabors Industries Limited
14.10.1 会社概要
14.10.2 会社概要
14.10.3 財務分析
14.10.3.1 純収入、2018-2022年
14.10.3.2 R&D、2018年~2022年
14.10.3.3 地域別収入シェア、2022年(%)
14.10.3.4 事業セグメント収益シェア、2022年(%)
14.10.4 製品ベンチマーク
14.10.5 戦略的展望
14.11 NOV Inc.
14.11.1 会社概要
14.11.2 会社概要
14.11.3 財務分析
14.11.3.1 純収入、2018年~2022年
14.11.3.2 地域別収益シェア、2022年(%)
14.11.3.3 事業セグメント別売上シェア、2022年(%)
14.11.4 製品ベンチマーク
14.11.5 戦略的展望
14.12 Patterson-UTI Energy, Inc.
14.12.1 会社概要
14.12.2 会社概要
14.12.3 財務分析
14.12.3.1 純収入、2018-2022年
14.12.3.2 R&D、2018年-2022年
14.12.3.3 地域別収入シェア、2022年(%)
14.12.3.4 事業セグメント収益シェア、2022年(%)
14.12.4 製品ベンチマーク
14.12.5 戦略的展望
14.13 Precision Drilling Corporation
14.13.1 会社概要
14.13.2 会社概要
14.13.3 財務分析
14.13.3.1 純収入、2018年~2022年
14.13.3.2 地域別収益シェア、2022年(%)
14.13.3.3 事業セグメント別売上シェア、2022年(%)
14.13.4 製品ベンチマーク
14.13.5 戦略的展望
14.14 RG Petro-Machinery Group Co.
14.14.1 会社概要
14.14.2 会社概要
14.14.3 製品ベンチマーク
14.14.4 戦略的展望
14.15 Rig Source, Inc.
14.15.1 会社概要
14.15.2 会社概要
14.15.3 製品ベンチマーク
14.15.4 戦略的展望
14.16 TOTAL Oil Rig Leasing Ltd.
14.16.1 会社概要
14.16.2 会社概要
14.16.3 製品ベンチマーク
14.16.4 戦略的展望
14.17 United Rentals, Inc.
14.17.1 会社概要
14.17.2 会社概要
14.17.3 財務分析
14.17.3.1 純収入、2018-2022年
14.17.3.2 地域別収入シェア、2022年(%)
14.17.3.3 事業セグメント別売上シェア、2022年(%)
14.17.4 製品ベンチマーク
14.17.5 戦略的展望
15 結論と提言
15.1 Visiongainからの結びの言葉
15.2 市場プレイヤーへの提言
ページTOPに戻る
図表リスト
表の一覧
Table 1 Land Drill Rigs Market Snapshot, 2023 & 2033 (US$ Billion, Units, CAGR %)
Table 2 Global Land Drill Rigs Market by Region, 2023-2033 (US$ Bn, AGR (%), CAGR (%)) (V-Shaped Recovery Scenario)
Table 3 Global Land Drill Rigs Market by Region, 2023-2033 (US$ Bn, AGR (%), CAGR (%)) (U-Shaped Recovery Scenario)
Table 4 Global Land Drill Rigs Market by Region, 2023-2033 (US$ Bn, AGR (%), CAGR (%)) (W-Shaped Recovery Scenario)
Table 5 Global Land Drill Rigs Market by Region, 2023-2033 (US$ Bn, AGR (%), CAGR (%)) (L-Shaped Recovery Scenario)
Table 6 Global Land Drill Rigs Market by Type, 2023-2033 (US$ Bn, AGR (%), CAGR (%))
Table 7 Mobile Rig Market by Region, 2023-2033 (US$ Bn, AGR (%), CAGR (%))
Table 8 Conventional Rig Market by Region, 2023-2033 (US$ Bn, AGR (%), CAGR (%))
Table 9 Global Land Drill Rigs Market by Power Type, 2023-2033 (US$ Bn, AGR (%), CAGR (%))
Table 10 Less than 1500 hp Market by Region, 2023-2033 (US$ Bn, AGR (%), CAGR (%))
Table 11 1500 hp to 2500 hp Market by Region, 2023-2033 (US$ Bn, AGR (%), CAGR (%))
Table 12 More than 2500 hp Market by Region, 2023-2033 (US$ Bn, AGR (%), CAGR (%))
Table 13 Global Land Drill Rigs Market by Well Class, 2023-2033 (US$ Bn, AGR (%), CAGR (%))
Table 14 Oil Wells Market by Region, 2023-2033 (US$ Bn, AGR (%), CAGR (%))
Table 15 Gas Wells Market by Region, 2023-2033 (US$ Bn, AGR (%), CAGR (%))
Table 16 Water Wells Market by Region, 2023-2033 (US$ Bn, AGR (%), CAGR (%))
Table 17 Coalbed Methane (CBM) Production Wells Market by Region, 2023-2033 (US$ Bn, AGR (%), CAGR (%))
Table 18 Other Well Classs Market by Region, 2023-2033 (US$ Bn, AGR (%), CAGR (%))
Table 19 Global Land Drill Rigs Market by Technology, 2023-2033 (US$ Bn, AGR (%), CAGR (%))
Table 20 Mechanical Drill Rigs Market by Region, 2023-2033 (US$ Bn, AGR (%), CAGR (%))
Table 21 Hydraulic Drill Rigs Market by Region, 2023-2033 (US$ Bn, AGR (%), CAGR (%))
Table 22 Electric Drill Rigs Market by Region, 2023-2033 (US$ Bn, AGR (%), CAGR (%))
Table 23 Rotary Table Drill Rigs Market by Region, 2023-2033 (US$ Bn, AGR (%), CAGR (%))
Table 24 Auger Drill Rigs Market by Region, 2023-2033 (US$ Bn, AGR (%), CAGR (%))
Table 25 Other Technology Market by Region, 2023-2033 (US$ Bn, AGR (%), CAGR (%))
Table 26 Land Drill Rigs Market Forecast by Region, 2023-2033 (US$ Billion, AGR%, CAGR%)
Table 27 North America Land Drill Rigs Market by Value, 2023-2033 (US$ Bn, AGR (%), CAGR (%))
Table 28 North America Land Drill Rigs Market by Cumulative Installed Capacity, 2023-2033 (Units, AGR (%), CAGR (%))
Table 29 North America Land Drill Rigs Market by Country, 2023-2033 (US$ Bn, AGR (%), CAGR (%))
Table 30 North America Land Drill Rigs Market Cumulative Installed Capacity by Country, 2023-2033 (Units, AGR (%), CAGR (%))
Table 31 North America Land Drill Rigs Market by Type, 2023-2033 (US$ Bn, AGR (%), CAGR (%))
Table 32 North America Land Drill Rigs Market by Power Type, 2023-2033 (US$ Bn, AGR (%), CAGR (%))
Table 33 North America Land Drill Rigs Market by Well Class, 2023-2033 (US$ Bn, AGR (%), CAGR (%))
Table 34 North America Land Drill Rigs Market by Technology, 2023-2033 (US$ Bn, AGR (%), CAGR (%))
Table 35 US Land Drill Rigs Market by Value, 2023-2033 (US$ Bn, AGR (%), CAGR (%))
Table 36 US Land Drill Rigs Market by Volume, 2023-2033 (Units, AGR (%), CAGR (%))
Table 37 Canada Land Drill Rigs Market by Value, 2023-2033 (US$ Bn, AGR (%), CAGR (%))
Table 38 Canada Land Drill Rigs Market by Volume, 2023-2033 (Units, AGR (%), CAGR (%))
Table 39 Europe Land Drill Rigs Market by Value, 2023-2033 (US$ Bn, AGR (%), CAGR (%))
Table 40 Europe Land Drill Rigs Market by Cumulative Installed Capacity, 2023-2033 (Units, AGR (%), CAGR (%))
Table 41 Europe Land Drill Rigs Market by Country, 2023-2033 (US$ Bn, AGR (%), CAGR (%))
Table 42 Europe Land Drill Rigs Market Cumulative Installed Capacity by Country, 2023-2033 (Units, AGR (%), CAGR (%))
Table 43 Europe Land Drill Rigs Market by Type, 2023-2033 (US$ Bn, AGR (%), CAGR (%))
Table 44 Europe Land Drill Rigs Market by Power Type, 2023-2033 (US$ Bn, AGR (%), CAGR (%))
Table 45 Europe Land Drill Rigs Market by Well Class, 2023-2033 (US$ Bn, AGR (%), CAGR (%))
Table 46 Europe Land Drill Rigs Market by Technology, 2023-2033 (US$ Bn, AGR (%), CAGR (%))
Table 47 Germany Land Drill Rigs Market by Value, 2023-2033 (US$ Bn, AGR (%), CAGR (%))
Table 48 Germany Land Drill Rigs Market by Volume, 2023-2033 (Units, AGR (%), CAGR (%))
Table 49 UK Land Drill Rigs Market by Value, 2023-2033 (US$ Bn, AGR (%), CAGR (%))
Table 50 UK Land Drill Rigs Market by Volume, 2023-2033 (Units, AGR (%), CAGR (%))
Table 51 France Land Drill Rigs Market by Value, 2023-2033 (US$ Bn, AGR (%), CAGR (%))
Table 52 France Land Drill Rigs Market by Volume, 2023-2033 (Units, AGR (%), CAGR (%))
Table 53 Kazakhstan Land Drill Rigs Market by Value, 2023-2033 (US$ Bn, AGR (%), CAGR (%))
Table 54 Kazakhstan Land Drill Rigs Market by Volume, 2023-2033 (Units, AGR (%), CAGR (%))
Table 55 Russia Land Drill Rigs Market by Value, 2023-2033 (US$ Bn, AGR (%), CAGR (%))
Table 56 Russia Land Drill Rigs Market by Volume, 2023-2033 (Units, AGR (%), CAGR (%))
Table 57 Rest of Europe Land Drill Rigs Market by Value, 2023-2033 (US$ Bn, AGR (%), CAGR (%))
Table 58 Rest of Europe Land Drill Rigs Market by Volume, 2023-2033 (Units, AGR (%), CAGR (%))
Table 59 Asia-Pacific Land Drill Rigs Market by Value, 2023-2033 (US$ Bn, AGR (%), CAGR (%))
Table 60 Asia-Pacific Land Drill Rigs Market by Cumulative Installed Capacity, 2023-2033 (Units, AGR (%), CAGR (%))
Table 61 Asia-Pacific Land Drill Rigs Market by Country, 2023-2033 (US$ Bn, AGR (%), CAGR (%))
Table 62 Asia-Pacific Land Drill Rigs Market Cumulative Installed Capacity by Country, 2023-2033 (Units, AGR (%), CAGR (%))
Table 63 Asia-Pacific Land Drill Rigs Market by Type, 2023-2033 (US$ Bn, AGR (%), CAGR (%))
Table 64 Asia-Pacific Land Drill Rigs Market by Power Type, 2023-2033 (US$ Bn, AGR (%), CAGR (%))
Table 65 Asia-Pacific Land Drill Rigs Market by Well Class, 2023-2033 (US$ Bn, AGR (%), CAGR (%))
Table 66 Asia-Pacific Land Drill Rigs Market by Technology, 2023-2033 (US$ Bn, AGR (%), CAGR (%))
Table 67 China Land Drill Rigs Market by Value, 2023-2033 (US$ Bn, AGR (%), CAGR (%))
Table 68 China Land Drill Rigs Market by Volume, 2023-2033 (Units, AGR (%), CAGR (%))
Table 69 India Land Drill Rigs Market by Value, 2023-2033 (US$ Bn, AGR (%), CAGR (%))
Table 70 India Land Drill Rigs Market by Volume, 2023-2033 (Units, AGR (%), CAGR (%))
Table 71 Indonesia Land Drill Rigs Market by Value, 2023-2033 (US$ Bn, AGR (%), CAGR (%))
Table 72 Indonesia Land Drill Rigs Market by Volume, 2023-2033 (Units, AGR (%), CAGR (%))
Table 73 Malaysia Land Drill Rigs Market by Value, 2023-2033 (US$ Bn, AGR (%), CAGR (%))
Table 74 Malaysia Land Drill Rigs Market by Volume, 2023-2033 (Units, AGR (%), CAGR (%))
Table 75 Vietnam Land Drill Rigs Market by Value, 2023-2033 (US$ Bn, AGR (%), CAGR (%))
Table 76 Vietnam Land Drill Rigs Market by Volume, 2023-2033 (Units, AGR (%), CAGR (%))
Table 77 Rest of Asia-Pacific Land Drill Rigs Market by Value, 2023-2033 (US$ Bn, AGR (%), CAGR (%))
Table 78 Rest of Asia-Pacific Land Drill Rigs Market by Volume, 2023-2033 (Units, AGR (%), CAGR (%))
Table 79 Middle East & Africa Land Drill Rigs Market by Value, 2023-2033 (US$ Bn, AGR (%), CAGR (%))
Table 80 Middle East & Africa Land Drill Rigs Market by Cumulative Installed Capacity, 2023-2033 (Units, AGR (%), CAGR (%))
Table 81 Middle East & Africa Land Drill Rigs Market by Country, 2023-2033 (US$ Bn, AGR (%), CAGR (%))
Table 82 Middle East & Africa Land Drill Rigs Market by Type, 2023-2033 (US$ Bn, AGR (%), CAGR (%))
Table 83 Middle East & Africa Land Drill Rigs Market by Power Type, 2023-2033 (US$ Bn, AGR (%), CAGR (%))
Table 84 Middle East & Africa Land Drill Rigs Market by Well Class, 2023-2033 (US$ Bn, AGR (%), CAGR (%))
Table 85 Middle East & Africa Land Drill Rigs Market by Technology, 2023-2033 (US$ Bn, AGR (%), CAGR (%))
Table 86 GCC Land Drill Rigs Market by Value, 2023-2033 (US$ Bn, AGR (%), CAGR (%))
Table 87 GCC Land Drill Rigs Market by Volume, 2023-2033 (Units, AGR (%), CAGR (%))
Table 88 Algeria Land Drill Rigs Market by Value, 2023-2033 (US$ Bn, AGR (%), CAGR (%))
Table 89 Algeria Land Drill Rigs Market by Volume, 2023-2033 (Units, AGR (%), CAGR (%))
Table 90 Rest of Latin America Land Drill Rigs Market by Value, 2023-2033 (US$ Bn, AGR (%), CAGR (%))
Table 91 Rest of Middle East & Africa Land Drill Rigs Market by Volume, 2023-2033 (Units, AGR (%), CAGR (%))
Table 92 Latin America Land Drill Rigs Market by Value, 2023-2033 (US$ Bn, AGR (%), CAGR (%))
Table 93 Latin America Land Drill Rigs Market by Cumulative Installed Capacity, 2023-2033 (Units, AGR (%), CAGR (%))
Table 94 Latin America Land Drill Rigs Market by Country, 2023-2033 (US$ Bn, AGR (%), CAGR (%))
Table 95 Latin America Land Drill Rigs Market Cumulative Installed Capacity by Country, 2023-2033 (Units, AGR (%), CAGR (%))
Table 96 Latin America Land Drill Rigs Market by Type, 2023-2033 (US$ Bn, AGR (%), CAGR (%))
Table 97 Latin America Land Drill Rigs Market by Power Type, 2023-2033 (US$ Bn, AGR (%), CAGR (%))
Table 98 Latin America Land Drill Rigs Market by Well Class, 2023-2033 (US$ Bn, AGR (%), CAGR (%))
Table 99 Latin America Land Drill Rigs Market by Technology, 2023-2033 (US$ Bn, AGR (%), CAGR (%))
Table 100 Argentina Land Drill Rigs Market by Value, 2023-2033 (US$ Bn, AGR (%), CAGR (%))
Table 101 Argentina Land Drill Rigs Market by Volume, 2023-2033 (Units, AGR (%), CAGR (%))
Table 102 Colombia Land Drill Rigs Market by Value, 2023-2033 (US$ Bn, AGR (%), CAGR (%))
Table 103 Colombia Land Drill Rigs Market by Volume, 2023-2033 (Units, AGR (%), CAGR (%))
Table 104 Rest of Latin America Land Drill Rigs Market by Value, 2023-2033 (US$ Bn, AGR (%), CAGR (%))
Table 105 Rest of Latin America Land Drill Rigs Market by Volume, 2023-2033 (Units, AGR (%), CAGR (%))
Table 106 Strategic Outlook - Contract
Table 107 Bentec GmbH Drilling & Oilfield Systems: Key Details, (CEO, HQ, Revenue, Founded, No. of Employees, Company Type, Website, Business Segment)
Table 108 Bentec GmbH Drilling & Oilfield Systems: Product Benchmarking
Table 109 Bentec GmbH Drilling & Oilfield Systems: Strategic Outlook
Table 110 Helmerich & Payne, Inc.: Key Details, (CEO, HQ, Revenue, Founded, No. of Employees, Company Type, Website, Business Segment)
Table 111 Helmerich & Payne, Inc.: Product Benchmarking
Table 112 Helmerich & Payne, Inc.: Strategic Outlook
Table 113 Independence Contract Drilling, Inc.: Key Details, (CEO, HQ, Revenue, Founded, No. of Employees, Company Type, Website, Business Segment)
Table 114 Independence Contract Drilling, Inc.: Product Benchmarking
Table 115 KCA Deutag: Key Details, (CEO, HQ, Revenue, Founded, No. of Employees, Company Type, Website, Business Segment)
Table 116 KCA Deutag: Product Benchmarking
Table 117 KCA Deutag: Strategic Outlook
Table 118 KWIPPED: Key Details, (CEO, HQ, Revenue, Founded, No. of Employees, Company Type, Website, Business Segment)
Table 119 KWIPPED: Product Benchmarking
Table 120 KWIPPED: Strategic Outlook
Table 121 Lamprell plc: Key Details, (CEO, HQ, Revenue, Founded, No. of Employees, Company Type, Website, Business Segment)
Table 122 Lamprell plc: Product Benchmarking
Table 123 Lamprell plc: Strategic Outlook
Table 124 MD Cowan, Inc: Key Details, (CEO, HQ, Revenue, Founded, No. of Employees, Company Type, Website, Business Segment)
Table 125 MD Cowan, Inc: Product Benchmarking
Table 126 Nabors Industries Limited: Key Details, (CEO, HQ, Revenue, Founded, No. of Employees, Company Type, Website, Business Segment)
Table 127 Nabors Industries Limited: Product Benchmarking
Table 128 Nabors Industries Limited: Strategic Outlook
Table 129 NOV Inc.: Key Details, (CEO, HQ, Revenue, Founded, No. of Employees, Company Type, Website, Business Segment)
Table 130 NOV Inc.: Product Benchmarking
Table 131 Patterson-UTI Energy, Inc.: Key Details, (CEO, HQ, Revenue, Founded, No. of Employees, Company Type, Website, Business Segment)
Table 132 Patterson-UTI Energy, Inc.: Product Benchmarking
Table 133 Patterson-UTI Energy, Inc.: Strategic Outlook
Table 134 Precision Drilling Corporation: Key Details, (CEO, HQ, Revenue, Founded, No. of Employees, Company Type, Website, Business Segment)
Table 135 Precision Drilling Corporation: Product Benchmarking
Table 136 Precision Drilling Corporation: Strategic Outlook
Table 137 RG Petro-Machinery Group Co., Ltd: Key Details, (CEO, HQ, Revenue, Founded, No. of Employees, Company Type, Website, Business Segment)
Table 138 RG Petro-Machinery Group Co., Ltd: Product Benchmarking
Table 139 Rig Source, Inc.: Key Details, (CEO, HQ, Revenue, Founded, No. of Employees, Company Type, Website, Business Segment)
Table 140 Rig Source, Inc.: Product Benchmarking
Table 141 Rig Source, Inc.: Strategic Outlook
Table 142 TOTAL Oil Rig Leasing Ltd: Key Details, (CEO, HQ, Revenue, Founded, No. of Employees, Company Type, Website, Business Segment)
Table 143 TOTAL Oil Rig Leasing Ltd: Product Benchmarking
Table 144 TOTAL Oil Rig Leasing Ltd.: Strategic Outlook
Table 145 United Rentals, Inc.: Key Details, (CEO, HQ, Revenue, Founded, No. of Employees, Company Type, Website, Business Segment)
Table 146 United Rentals, Inc.: Product Benchmarking
図の一覧
Figure 1 Land Drill Rigs Market Segmentation
Figure 2 Land Drill Rigs Market by Type: Market Attractiveness Index
Figure 3 Land Drill Rigs Market by Power Type: Market Attractiveness Index
Figure 4 Land Drill Rigs Market by Well Class: Market Attractiveness Index
Figure 5 Land Drill Rigs Market by Technology: Market Attractiveness Index
Figure 6 Land Drill Rigs Market Attractiveness Index by Region
Figure 7 Land Drill Rigs Market: Market Dynamics
Figure 8 Surge in crude oil production 2018- 2022
Figure 9 Estimated oil and gas investments 2019- 2024
Figure 1 Global Crude Oil Prices, 2018- 2022
Figure 2 Land Drill Rigs Market: Porter’s Five Forces Analysis
Figure 3 Global Land Drill Rigs Market Share Forecast by COVID, 2023-2033 (%)
Figure 4 Global Land Drill Rigs Market by Region, 2023-2033 (US$ Bn, AGR (%)) (V-Shaped Recovery Scenario)
Figure 5 Global Land Drill Rigs Market by Region, 2023-2033 (US$ Bn, AGR (%)) (U-Shaped Recovery Scenario)
Figure 6 Global Land Drill Rigs Market by Region, 2023-2033 (US$ Bn, AGR (%)) (W-Shaped Recovery Scenario)
Figure 7 Global Land Drill Rigs Market by Region, 2023-2033 (US$ Bn, AGR (%)) (L-Shaped Recovery Scenario)
Figure 8 Land Drill Rigs Market: PEST Analysis
Figure 9 Land Drill Rigs Market by Type: Market Attractiveness Index
Figure 10 Global Land Drill Rigs Market by Type, 2023-2033 (US$ Bn, AGR (%))
Figure 11 Land Drill Rigs Market Share Forecast by Type, 2023, 2028, 2033 (%)
Figure 12 Mobile Rig Market by Region, 2023-2033 (US$ Bn, AGR (%))
Figure 13 Mobile Rig Market Share Forecast by Region, 2023 & 2033 (%)
Figure 14 Conventional Rig Market by Region, 2023-2033 (US$ Bn, AGR (%))
Figure 15 Conventional Rig Market Share Forecast by Region, 2023 & 2033 (%)
Figure 16 Land Drill Rigs Market by Power Type: Market Attractiveness Index
Figure 17 Global Land Drill Rigs Market by Power Type, 2023-2033 (US$ Bn, AGR (%))
Figure 18 Land Drill Rigs Market Share Forecast by Power Type, 2023, 2028, 2033 (%)
Figure 19 Less than 1500 hp Market by Region, 2023-2033 (US$ Bn, AGR (%))
Figure 20 Less than 1500 hp Market Share Forecast by Region, 2023 & 2033 (%)
Figure 21 1500 hp to 2500 hp Market by Region, 2023-2033 (US$ Bn, AGR (%))
Figure 22 1500 hp to 2500 hp Market Share Forecast by Region, 2023 & 2033 (%)
Figure 23 More than 2500 hp Market by Region, 2023-2033 (US$ Bn, AGR (%))
Figure 24 More than 2500 hp Market Share Forecast by Region, 2023 & 2033 (%)
Figure 25 Land Drill Rigs Market by Well Class: Market Attractiveness Index
Figure 26 Global Land Drill Rigs Market by Well Class, 2023-2033 (US$ Bn, AGR (%))
Figure 27 Land Drill Rigs Market Share Forecast by Well Class, 2023, 2028, 2033 (%)
Figure 28 Oil Wells Market by Region, 2023-2033 (US$ Bn, AGR (%))
Figure 29 Oil Wells Market Share Forecast by Region, 2023 & 2033 (%)
Figure 30 Gas Wells Market by Region, 2023-2033 (US$ Bn, AGR (%))
Figure 31 Gas Wells Market Share Forecast by Region, 2023 & 2033 (%)
Figure 32 Water Wells Market by Region, 2023-2033 (US$ Bn, AGR (%))
Figure 33 Water Wells Market Share Forecast by Region, 2023 & 2033 (%)
Figure 34 Coalbed Methane (CBM) Production Wells Market by Region, 2023-2033 (US$ Bn, AGR (%))
Figure 35 Coalbed Methane (CBM) Production Wells Market Share Forecast by Region, 2023 & 2033 (%)
Figure 36 Other Well Class Market by Region, 2023-2033 (US$ Bn, AGR (%))
Figure 37 Other Well Classes Market Share Forecast by Region, 2023 & 2033 (%)
Figure 38 Land Drill Rigs Market by Technology: Market Attractiveness Index
Figure 39 Global Land Drill Rigs Market by Technology, 2023-2033 (US$ Bn, AGR (%))
Figure 40 Land Drill Rigs Market Share Forecast by Technology, 2023, 2028, 2033 (%)
Figure 41 Mechanical Drill Rigs Market by Region, 2023-2033 (US$ Bn, AGR (%))
Figure 42 Mechanical Drill Rigs Market Share Forecast by Region, 2023 & 2033 (%)
Figure 43 Hydraulic Drill Rigs Market by Region, 2023-2033 (US$ Bn, AGR (%))
Figure 44 Hydraulic Drill Rigs Market Share Forecast by Region, 2023 & 2033 (%)
Figure 45 Electric Drill Rigs Market by Region, 2023-2033 (US$ Bn, AGR (%))
Figure 46 Electric Drill Rigs Market Share Forecast by Region, 2023 & 2033 (%)
Figure 47 Rotary Table Drill Rigs Market by Region, 2023-2033 (US$ Bn, AGR (%))
Figure 48 Rotary Table Drill Rigs Market Share Forecast by Region, 2023 & 2033 (%)
Figure 49 Auger Drill Rigs Market by Region, 2023-2033 (US$ Bn, AGR (%))
Figure 50 Auger Drill Rigs Market Share Forecast by Region, 2023 & 2033 (%)
Figure 51 Other Technology Market by Region, 2023-2033 (US$ Bn, AGR (%))
Figure 52 Other Technology Market Share Forecast by Region, 2023 & 2033 (%)
Figure 53 Land Drill Rigs Market Forecast by Region 2023 and 2033 (Revenue, CAGR%)
Figure 54 Land Drill Rigs Market Share Forecast by Region 2023, 2028, 2033 (%)
Figure 55 Land Drill Rigs Market by Region, 2023-2033 (US$ Billion, AGR %)
Figure 56 North America Land Drill Rigs Market Attractiveness Index
Figure 57 North America Land Drill Rigs Market by Region, 2023, 2028 & 2033 (US$ Billion)
Figure 58 North America Land Drill Rigs Market by Value, 2023-2033 (US$ Bn, AGR (%))
Figure 59 North America Land Drill Rigs Market by Cumulative Installed Capacity, 2023-2033 (Units, AGR (%))
Figure 60 North America Land Drill Rigs Market by Country, 2023-2033 (US$ Bn, AGR (%))
Figure 61 North America Land Drill Rigs Market Cumulative Installed Capacity by Country, 2023-2033 (Units, AGR (%))
Figure 62 North America Land Drill Rigs Market Share Forecast by Country, 2023 & 2033 (%)
Figure 63 North America Land Drill Rigs Market by Type, 2023-2033 (US$ Bn, AGR (%))
Figure 64 North America Land Drill Rigs Market Share Forecast Type, 2023 & 2033 (%)
Figure 65 North America Land Drill Rigs Market by Power Type, 2023-2033 (US$ Bn, AGR (%))
Figure 66 North America Land Drill Rigs Market Share Forecast by Power Type, 2023 & 2033 (%)
Figure 67 North America Land Drill Rigs Market by Well Class, 2023-2033 (US$ Bn, AGR (%))
Figure 68 North America Land Drill Rigs Market Share Forecast by Well Class, 2023 & 2033 (%)
Figure 69 North America Land Drill Rigs Market by Technology, 2023-2033 (US$ Bn, AGR (%))
Figure 70 North America Land Drill Rigs Market Share Forecast by Technology, 2023 & 2033 (%)
Figure 71 US Land Drill Rigs Market by Value, 2023-2033 (US$ Bn, AGR (%))
Figure 72 US Land Drill Rigs Market by Volume, 2023-2033 (Units, AGR (%))
Figure 73 Canada Land Drill Rigs Market by Value, 2023-2033 (US$ Bn, AGR (%))
Figure 74 Canada Land Drill Rigs Market by Volume, 2023-2033 (Units, AGR (%))
Figure 75 Europe Land Drill Rigs Market Attractiveness Index
Figure 76 Europe Land Drill Rigs Market by Region, 2023, 2028 & 2033 (US$ Billion)
Figure 77 Europe Land Drill Rigs Market by Value, 2023-2033 (US$ Bn, AGR (%))
Figure 78 Europe Land Drill Rigs Market by Cumulative Installed Capacity, 2023-2033 (Units, AGR (%))
Figure 79 Europe Land Drill Rigs Market by Country, 2023-2033 (US$ Bn, AGR (%))
Figure 80 Europe Land Drill Rigs Market Cumulative Installed Capacity by Country, 2023-2033 (Units, AGR (%))
Figure 81 Europe Land Drill Rigs Market Share Forecast by Country, 2023 & 2033 (%)
Figure 82 Europe Land Drill Rigs Market by Type, 2023-2033 (US$ Bn, AGR (%))
Figure 83 Europe Land Drill Rigs Market Share Forecast Type, 2023 & 2033 (%)
Figure 84 Europe Land Drill Rigs Market by Power Type, 2023-2033 (US$ Bn, AGR (%))
Figure 85 Europe Land Drill Rigs Market Share Forecast by Power Type, 2023 & 2033 (%)
Figure 86 Europe Land Drill Rigs Market by Well Class, 2023-2033 (US$ Bn, AGR (%))
Figure 87 Europe Land Drill Rigs Market Share Forecast by Well Class, 2023 & 2033 (%)
Figure 88 Europe Land Drill Rigs Market by Technology, 2023-2033 (US$ Bn, AGR (%))
Figure 89 Europe Land Drill Rigs Market Share Forecast by Technology, 2023 & 2033 (%)
Figure 90 Germany Land Drill Rigs Market by Value, 2023-2033 (US$ Bn, AGR (%))
Figure 91 Germany Land Drill Rigs Market by Volume, 2023-2033 (Units, AGR (%))
Figure 92 UK Land Drill Rigs Market by Value, 2023-2033 (US$ Bn, AGR (%))
Figure 93 UK Land Drill Rigs Market by Volume, 2023-2033 (Units, AGR (%))
Figure 94 France Land Drill Rigs Market by Value, 2023-2033 (US$ Bn, AGR (%))
Figure 95 France Land Drill Rigs Market by Volume, 2023-2033 (Units, AGR (%))
Figure 96 Kazakhstan Land Drill Rigs Market by Value, 2023-2033 (US$ Bn, AGR (%))
Figure 97 Kazakhstan Land Drill Rigs Market by Volume, 2023-2033 (Units, AGR (%))
Figure 98 Russia Land Drill Rigs Market by Value, 2023-2033 (US$ Bn, AGR (%))
Figure 99 Russia Land Drill Rigs Market by Volume, 2023-2033 (Units, AGR (%))
Figure 100 Rest of Europe Land Drill Rigs Market by Value, 2023-2033 (US$ Bn, AGR (%))
Figure 101 Rest of Europe Land Drill Rigs Market by Volume, 2023-2033 (Units, AGR (%))
Figure 102 Asia-Pacific Land Drill Rigs Market Attractiveness Index
Figure 103 Asia-Pacific Land Drill Rigs Market by Region, 2023, 2028 & 2033 (US$ Billion)
Figure 104 Asia-Pacific Land Drill Rigs Market by Value, 2023-2033 (US$ Bn, AGR (%))
Figure 105 Asia-Pacific Land Drill Rigs Market by Cumulative Installed Capacity, 2023-2033 (Units, AGR (%))
Figure 106 Asia-Pacific Land Drill Rigs Market by Country, 2023-2033 (US$ Bn, AGR (%))
Figure 107 Asia-Pacific Land Drill Rigs Market Cumulative Installed Capacity by Country, 2023-2033 (Units, AGR (%))
Figure 108 Asia-Pacific Land Drill Rigs Market Share Forecast by Country, 2023 & 2033 (%)
Figure 109 Asia-Pacific Land Drill Rigs Market by Type, 2023-2033 (US$ Bn, AGR (%))
Figure 110 Asia-Pacific Land Drill Rigs Market Share Forecast Type, 2023 & 2033 (%)
Figure 111 Asia-Pacific Land Drill Rigs Market by Power Type, 2023-2033 (US$ Bn, AGR (%))
Figure 112 Asia-Pacific Land Drill Rigs Market Share Forecast by Power Type, 2023 & 2033 (%)
Figure 113 Asia-Pacific Land Drill Rigs Market by Well Class, 2023-2033 (US$ Bn, AGR (%))
Figure 114 Asia-Pacific Land Drill Rigs Market Share Forecast by Well Class, 2023 & 2033 (%)
Figure 115 Asia-Pacific Land Drill Rigs Market by Technology, 2023-2033 (US$ Bn, AGR (%))
Figure 116 Asia-Pacific Land Drill Rigs Market Share Forecast by Technology, 2023 & 2033 (%)
Figure 117 China Land Drill Rigs Market by Value, 2023-2033 (US$ Bn, AGR (%))
Figure 118 China Land Drill Rigs Market by Volume, 2023-2033 (Units, AGR (%))
Figure 119 India Land Drill Rigs Market by Value, 2023-2033 (US$ Bn, AGR (%))
Figure 120 India Land Drill Rigs Market by Volume, 2023-2033 (Units, AGR (%))
Figure 121 Indonesia Land Drill Rigs Market by Value, 2023-2033 (US$ Bn, AGR (%))
Figure 122 Indonesia Land Drill Rigs Market by Volume, 2023-2033 (Units, AGR (%))
Figure 123 Malaysia Land Drill Rigs Market by Value, 2023-2033 (US$ Bn, AGR (%))
Figure 124 Malaysia Land Drill Rigs Market by Volume, 2023-2033 (Units, AGR (%))
Figure 125 Vietnam Land Drill Rigs Market by Value, 2023-2033 (US$ Bn, AGR (%))
Figure 126 Vietnam Land Drill Rigs Market by Volume, 2023-2033 (Units, AGR (%))
Figure 127 Rest of Asia-Pacific Land Drill Rigs Market by Value, 2023-2033 (US$ Bn, AGR (%))
Figure 128 Rest of Asia-Pacific Land Drill Rigs Market by Volume, 2023-2033 (Units, AGR (%))
Figure 129 Middle East and Africa Land Drill Rigs Market Attractiveness Index
Figure 130 Middle East and Africa Land Drill Rigs Market by Region, 2023, 2028 & 2033 (US$ Billion)
Figure 131 Middle East & Africa Land Drill Rigs Market by Value, 2023-2033 (US$ Bn, AGR (%))
Figure 132 Middle East & Africa Land Drill Rigs Market by Cumulative Installed Capacity, 2023-2033 (Units, AGR (%))
Figure 133 Middle East & Africa Land Drill Rigs Market by Country, 2023-2033 (US$ Bn, AGR (%))
Figure 134 Middle East and Africa Land Drill Rigs Market Share Forecast by Country, 2023 & 2033 (%)
Figure 135 Middle East & Africa Land Drill Rigs Market by Type, 2023-2033 (US$ Bn, AGR (%))
Figure 136 Middle East and Africa Land Drill Rigs Market Share Forecast Type, 2023 & 2033 (%)
Figure 137 Middle East & Africa Land Drill Rigs Market by Power Type, 2023-2033 (US$ Bn, AGR (%))
Figure 138 Middle East and Africa Land Drill Rigs Market Share Forecast by Power Type, 2023 & 2033 (%)
Figure 139 Middle East & Africa Land Drill Rigs Market by Well Class, 2023-2033 (US$ Bn, AGR (%))
Figure 140 Middle East and Africa Land Drill Rigs Market Share Forecast by Well Class, 2023 & 2033 (%)
Figure 141 Middle East & Africa Land Drill Rigs Market by Technology, 2023-2033 (US$ Bn, AGR (%))
Figure 142 Middle East and Africa Land Drill Rigs Market Share Forecast by Technology, 2023 & 2033 (%)
Figure 143 GCC Land Drill Rigs Market by Value, 2023-2033 (US$ Bn, AGR (%))
Figure 144 GCC Land Drill Rigs Market by Volume, 2023-2033 (Units, AGR (%))
Figure 145 Algeria Land Drill Rigs Market by Value, 2023-2033 (US$ Bn, AGR (%))
Figure 146 Algeria Land Drill Rigs Market by Volume, 2023-2033 (Units, AGR (%))
Figure 147 Rest of Latin America Land Drill Rigs Market by Value, 2023-2033 (US$ Bn, AGR (%))
Figure 148 Rest of Middle East & Africa Land Drill Rigs Market by Volume, 2023-2033 (Units, AGR (%))
Figure 149 Latin America Land Drill Rigs Market Attractiveness Index
Figure 150 Latin America Land Drill Rigs Market by Region, 2023, 2028 & 2033 (US$ Billion)
Figure 151 Latin America Land Drill Rigs Market by Value, 2023-2033 (US$ Bn, AGR (%))
Figure 152 Latin America Land Drill Rigs Market by Cumulative Installed Capacity, 2023-2033 (Units, AGR (%))
Figure 153 Latin America Land Drill Rigs Market by Country, 2023-2033 (US$ Bn, AGR (%))
Figure 154 Latin America Land Drill Rigs Market Cumulative Installed Capacity by Country, 2023-2033 (Units, AGR (%))
Figure 155 Latin America Land Drill Rigs Market Share Forecast by Country, 2023 & 2033 (%)
Figure 156 Latin America Land Drill Rigs Market by Type, 2023-2033 (US$ Bn, AGR (%))
Figure 157 Latin America Land Drill Rigs Market Share Forecast Type, 2023 & 2033 (%)
Figure 158 Latin America Land Drill Rigs Market by Power Type, 2023-2033 (US$ Bn, AGR (%))
Figure 159 Latin America Land Drill Rigs Market Share Forecast by Power Type, 2023 & 2033 (%)
Figure 160 Latin America Land Drill Rigs Market by Well Class, 2023-2033 (US$ Bn, AGR (%))
Figure 161 Latin America Land Drill Rigs Market Share Forecast by Well Class, 2023 & 2033 (%)
Figure 162 Latin America Land Drill Rigs Market by Technology, 2023-2033 (US$ Bn, AGR (%))
Figure 163 Latin America Land Drill Rigs Market Share Forecast by Technology, 2023 & 2033 (%)
Figure 164 Argentina Land Drill Rigs Market by Value, 2023-2033 (US$ Bn, AGR (%))
Figure 165 Argentina Land Drill Rigs Market by Volume, 2023-2033 (Units, AGR (%))
Figure 166 Colombia Land Drill Rigs Market by Value, 2023-2033 (US$ Bn, AGR (%))
Figure 167 Colombia Land Drill Rigs Market by Volume, 2023-2033 (Units, AGR (%))
Figure 168 Rest of Latin America Land Drill Rigs Market by Value, 2023-2033 (US$ Bn, AGR (%))
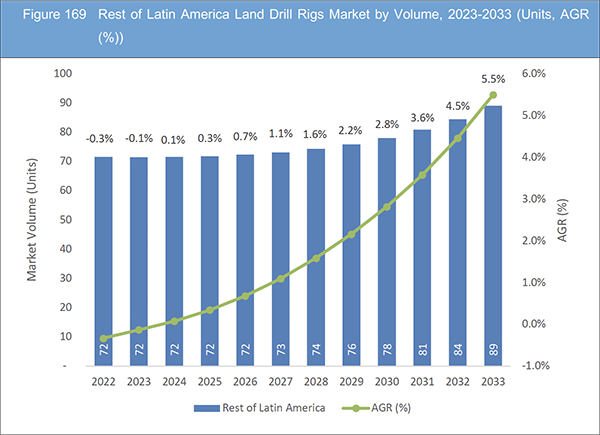
Figure 169 Rest of Latin America Land Drill Rigs Market by Volume, 2023-2033 (Units, AGR (%))
Figure 170 Land Drill Rigs Market: Company Share, 2022
Figure 171 Helmerich & Payne, Inc..: Net Revenue, 2018-2022 (US$Million, AGR%)
Figure 172 Helmerich & Payne, Inc..: R&D, 2018-2022 (US$Million, AGR%)
Figure 173 Independence Contract Drilling, Inc..: Net Revenue, 2018-2022 (US$Million, AGR%)
Figure 174 Nabors Industries Limited.: Net Revenue, 2018-2022 (US$Million, AGR%)
Figure 175 Nabors Industries Limited.: R&D, 2018-2022 (US$Million, AGR%)
Figure 176 Nabors Industries Limited.: Regional Revenue Share, 2022 (%)
Figure 177 Nabors Industries Limited.: Business Segment Revenue Share, 2022 (%)
Figure 178 NOV Inc..: Net Revenue, 2018-2022 (US$Million, AGR%)
Figure 179 NOV Inc..: Regional Revenue Share, 2022 (%)
Figure 180 NOV Inc..: Business Segment Revenue Share, 2022 (%)
Figure 181 Patterson-UTI Energy, Inc..: Net Revenue, 2018-2022 (US$Million, AGR%)
Figure 182 Patterson-UTI Energy, Inc..: R&D, 2018-2022 (US$Million, AGR%)
Figure 183 Patterson-UTI Energy, Inc..: Regional Revenue Share, 2022 (%)
Figure 184 Patterson-UTI Energy, Inc..: Business Segment Revenue Share, 2022 (%)
Figure 185 Precision Drilling Corporation.: Net Revenue, 2018-2022 (US$Million, AGR%)
Figure 186 Precision Drilling Corporation.: Regional Revenue Share, 2022 (%)
Figure 187 Precision Drilling Corporation.: Business Segment Revenue Share, 2022 (%)
Figure 188 United Rentals, Inc..: Net Revenue, 2018-2022 (US$Million, AGR%)
Figure 189 United Rentals, Inc..: Regional Revenue Share, 2022 (%)
Figure 190 United Rentals, Inc..: Business Segment Revenue Share, 2022 (%)
ページTOPに戻る
Summary
Report Details
The Land Drill Rigs Market Report 2023-2033: This report will prove invaluable to leading firms striving for new revenue pockets if they wish to better understand the industry and its underlying dynamics. It will be useful for companies that would like to expand into different industries or to expand their existing operations in a new region.
Rising Demand for Oil & Gas Exploration Is Driving the Market Growth
The global demand for oil and gas is reaching new heights due to industrialization, urbanization, and increasing energy needs. As emerging economies expand, the appetite for energy resources grows, necessitating extensive exploration. Land drill rigs, as fundamental tools in oil and gas exploration, witness heightened demand. Countries like Brazil and India, with ambitious energy agendas, invest significantly in exploration initiatives. For instance, Brazil’s pre-salt oil discoveries have spurred a surge in drilling activities, fuelling the demand for advanced land drill rigs. The market responds dynamically to this demand, with manufacturers innovating to meet evolving exploration challenges.
Increasing Focus on Renewable Energy May Hinder the Market Growth
In recent years, there has been a notable shift in the global energy landscape with an increasing focus on renewable energy sources. This shift is driven by a growing awareness of environmental concerns, climate change mitigation efforts, and the desire to reduce carbon emissions. As a result, many countries, including major energy consumers in Latin America, are diversifying their energy portfolios to incorporate renewables such as wind, solar, and geothermal power. This transition has a direct impact on the Land Drill Rigs Market in the region. While the demand for traditional oil and gas drilling rigs may stabilize or decline, there is a rising need for drill rigs used in geothermal well drilling, an example being geothermal drilling rigs mentioned earlier. Manufacturers and drilling companies must adapt to this changing landscape by investing in technology and expertise relevant to renewable energy exploration and drilling to remain competitive in the evolving market.
What Questions Should You Ask before Buying a Market Research Report?
• How is the land drill rigs market evolving?
• What is driving and restraining the land drill rigs market?
• How will each land drill rigs submarket segment grow over the forecast period and how much revenue will these submarkets account for in 2033?
• How will the market shares for each land drill rigs submarket develop from 2023 to 2033?
• What will be the main driver for the overall market from 2023 to 2033?
• Will leading land drill rigs markets broadly follow the macroeconomic dynamics, or will individual national markets outperform others?
• How will the market shares of the national markets change by 2033 and which geographical region will lead the market in 2033?
• Who are the leading players and what are their prospects over the forecast period?
• What are the land drill rigs projects for these leading companies?
• How will the industry evolve during the period between 2023 and 2033? What are the implications of land drill rigs projects taking place now and over the next 10 years?
• Is there a greater need for product commercialisation to further scale the land drill rigs market?
• Where is the land drill rigs market heading and how can you ensure you are at the forefront of the market?
• What are the best investment options for new product and service lines?
• What are the key prospects for moving companies into a new growth path and C-suite?
You need to discover how this will impact the land drill rigs market today, and over the next 10 years:
• Our 391-page report provides 146 tables and 190 charts/graphs exclusively to you.
• The report highlights key lucrative areas in the industry so you can target them – NOW.
• It contains in-depth analysis of global, regional and national sales and growth.
• It highlights for you the key successful trends, changes and revenue projections made by your competitors.
This report tells you TODAY how the land drill rigs market will develop in the next 10 years, and in line with the variations in COVID-19 economic recession and bounce. This market is more critical now than at any point over the last 10 years.
Forecasts to 2033 and other analyses reveal commercial prospects
• In addition to revenue forecasting to 2033, our new study provides you with recent results, growth rates, and market shares.
• You will find original analyses, with business outlooks and developments.
• Discover qualitative analyses (including market dynamics, drivers, opportunities, restraints and challenges), cost structure, impact of rising land drill rigs prices and recent developments.
This report includes data analysis and invaluable insight into how COVID-19 will affect the industry and your company. Four COVID-19 recovery patterns and their impact, namely, “V”, “L”, “W” and “U” are discussed in this report.
Segments Covered in the Report
Market Segment by Type
• Mobile Rig
• Conventional Rig
Market Segment by Power Type
• Less than 1500 hp
• 1500 hp to 2500 hp
• More than 2500 hp
Market Segment by Well Class
• Oil Wells
• Gas Wells
• Water Wells
• Coalbed Methane (CBM) Production Wells
• Other Well Class
Market Segment by Technology
• Mechanical Drill Rigs
• Hydraulic Drill Rigs
• Electric Drill Rigs
• Rotary Table Drill Rigs
• Auger Drill Rigs
• Other Technology
In addition to the revenue predictions for the overall world market and segments, you will also find revenue forecasts for four regional and 20 leading national markets:
North America
• U.S.
• Canada
Europe
• Germany
• UK
• France
• Kazakhstan
• Russia
• Rest of Europe
Asia-Pacific
• China
• India
• Indonesia
• Malaysia
• Vietnam
• Rest of Asia-Pacific
Latin America
• Argentina
• Colombia
• Rest of Latin America
Middle East & Africa
• GCC
• Algeria
• Rest of Middle East & Africa
The report also includes profiles and for some of the leading companies in the Land Drill Rigs Market, 2023 to 2033, with a focus on this segment of these companies’ operations.
Leading companies and the potential for market growth
• Bentec GmbH Drilling & Oilfield Systems
• Helmerich & Payne, Inc.
• Independence Contract Drilling, Inc.
• KCA Deutag
• KWIPPED
• Lamprell plc
• MD Cowan, Inc
• Nabors Industries Limited
• NOV Inc.
• Patterson-UTI Energy, Inc.
• Precision Drilling Corporation
• RG Petro-Machinery Group Co., Ltd.
• Rig Source, Inc.
• TOTAL Oil Rig Leasing Ltd
• United Rentals, Inc.
Overall world revenue for Land Drill Rigs Market, 2023 to 2033 in terms of value the market will surpass US$43.8 billion in 2023, our work calculates. We predict strong revenue growth through to 2033. Our work identifies which organizations hold the greatest potential. Discover their capabilities, progress, and commercial prospects, helping you stay ahead.
How will the Land Drill Rigs Market, 2023 to 2033 report help you?
In summary, our 390+ page report provides you with the following knowledge:
• Revenue forecasts to 2033 for Land Drill Rigs Market, 2023 to 2033 Market, with forecasts for type, power type, well class, and technology, each forecast at a global and regional level – discover the industry’s prospects, finding the most lucrative places for investments and revenues.
• Revenue forecasts to 2033 for four regional and 20 key national markets – See forecasts for the Land Drill Rigs Market, 2023 to 2033 market in North America, Europe, Asia-Pacific, Latin America and Middle East & Africa. Also forecasted is the market in the US, Canada, Brazil, UK, France, Russia, Kazakhstan, China, India, Indonesia, Malaysia and Algeria among other prominent economies.
• Prospects for established firms and those seeking to enter the market – including company profiles for 15 of the major companies involved in the Land Drill Rigs Market, 2023 to 2033.
Find quantitative and qualitative analyses with independent predictions. Receive information that only our report contains, staying informed with invaluable business intelligence.
Information found nowhere else
With our new report, you are less likely to fall behind in knowledge or miss out on opportunities. See how our work could benefit your research, analyses, and decisions. Visiongain’s study is for everybody needing commercial analyses for the Land Drill Rigs Market, 2023 to 2033, market-leading companies. You will find data, trends and predictions.
ページTOPに戻る
Table of Contents
Table of Contents
1 Report Overview
1.1 Objectives of the Study
1.2 Introduction to Land Drill Rigs Market
1.3 What This Report Delivers
1.4 Why You Should Read This Report
1.5 Key Questions Answered by This Analytical Report
1.6 Who Is This Report for?
1.7 Methodology
1.7.1 Market Definitions
1.7.2 Market Evaluation & Forecasting Methodology
1.7.3 Data Validation
1.7.3.1 Primary Research
1.7.3.2 Secondary Research
1.8 Frequently Asked Questions (FAQs)
1.9 Associated Visiongain Reports
1.10 About Visiongain
2 Executive Summary
3 Market Overview
3.1 Key Findings
3.2 Market Dynamics
3.2.1 Market Driving Factors
3.2.1.1 Increasing Use of High Horsepower and Hi-Tech Rigs
3.2.1.2 Increasing Onshore Oil Production Driving the Market Growth
3.2.1.3 Growing Investment in the Oil and Gas Industry Driving the Market
3.2.2 Market Restraining Factors
3.2.2.1 Increasing Focus on Renewable Energy Can Hinder the Market Growth
3.2.2.2 Low Crude Oil Prices Can Hinder the Market Growth
3.2.2.3 Stringent Government Regulations and Policies Can Hinder the Market Growth
3.2.3 Market Opportunities
3.2.3.1 Development of New Technologies can be Opportunities for the Market
3.2.3.2 New-Generation Automated Drilling Rigs Opportunities for the Market
3.2.3.3 Rotary Drilling Rigs Keep the Job Site Clean with Low Environmental Pollution
3.3 Porter’s Five Forces Analysis
3.3.1 Bargaining Power of Suppliers (Medium)
3.3.2 Bargaining Power of Buyers (High)
3.3.3 Competitive Rivalry (High)
3.3.4 Threat from Substitutes (Low)
3.3.5 Threat of New Entrants (High)
3.4 COVID-19 Impact Analysis
3.4.1 “V-Shaped Recovery”
3.4.2 “U-Shaped Recovery”
3.4.3 “W-Shaped Recovery”
3.4.4 “L-Shaped Recovery”
3.5 PEST Analysis
4 Land Drill Rigs Market Analysis by Type
4.1 Key Findings
4.2 Type Segment: Market Attractiveness Index
4.3 Land Drill Rigs Market Size Estimation and Forecast by Type
4.4 Mobile Rig
4.4.1 Market Size by Region, 2023-2033 (US$ Billion)
4.4.2 Market Share by Region, 2023 & 2033 (%)
4.5 Conventional Rig
4.5.1 Market Size by Region, 2023-2033 (US$ Billion)
4.5.2 Market Share by Region, 2023 & 2033 (%)
5 Land Drill Rigs Market Analysis by Power Type
5.1 Key Findings
5.2 Power Type Segment: Market Attractiveness Index
5.3 Land Drill Rigs Market Size Estimation and Forecast by Power Type
5.4 Less than 1500 hp
5.4.1 Market Size by Region, 2023-2033 (US$ Billion)
5.4.2 Market Share by Region, 2023 & 2033 (%)
5.5 1500 hp to 2500 hp
5.5.1 Market Size by Region, 2023-2033 (US$ Billion)
5.5.2 Market Share by Region, 2023 & 2033 (%)
5.6 More than 2500 hp
5.6.1 Market Size by Region, 2023-2033 (US$ Billion)
5.6.2 Market Share by Region, 2023 & 2033 (%)
6 Land Drill Rigs Market Analysis by Well Class
6.1 Key Findings
6.2 Well Class Segment: Market Attractiveness Index
6.3 Land Drill Rigs Market Size Estimation and Forecast by Well Class
6.4 Oil Wells
6.4.1 Market Size by Region, 2023-2033 (US$ Billion)
6.4.2 Market Share by Region, 2023 & 2033 (%)
6.5 Gas Wells
6.5.1 Market Size by Region, 2023-2033 (US$ Billion)
6.5.2 Market Share by Region, 2023 & 2033 (%)
6.6 Water Wells
6.6.1 Market Size by Region, 2023-2033 (US$ Billion)
6.6.2 Market Share by Region, 2023 & 2033 (%)
6.7 Coalbed Methane (CBM) Production Wells
6.7.1 Market Size by Region, 2023-2033 (US$ Billion)
6.7.2 Market Share by Region, 2023 & 2033 (%)
6.8 Other Well Classes
6.8.1 Market Size by Region, 2023-2033 (US$ Billion)
6.8.2 Market Share by Region, 2023 & 2033 (%)
7 Land Drill Rigs Market Analysis by Technology
7.1 Key Findings
7.2 Technology Segment: Market Attractiveness Index
7.3 Land Drill Rigs Market Size Estimation and Forecast by Technology
7.4 Mechanical Drill Rigs
7.4.1 Market Size by Region, 2023-2033 (US$ Billion)
7.4.2 Market Share by Region, 2023 & 2033 (%)
7.5 Hydraulic Drill Rigs
7.5.1 Market Size by Region, 2023-2033 (US$ Billion)
7.5.2 Market Share by Region, 2023 & 2033 (%)
7.6 Electric Drill Rigs
7.6.1 Market Size by Region, 2023-2033 (US$ Billion)
7.6.2 Market Share by Region, 2023 & 2033 (%)
7.7 Rotary Table Drill Rigs
7.7.1 Market Size by Region, 2023-2033 (US$ Billion)
7.7.2 Market Share by Region, 2023 & 2033 (%)
7.8 Auger Drill Rigs
7.8.1 Market Size by Region, 2023-2033 (US$ Billion)
7.8.2 Market Share by Region, 2023 & 2033 (%)
7.9 Other Technology
7.9.1 Market Size by Region, 2023-2033 (US$ Billion)
7.9.2 Market Share by Region, 2023 & 2033 (%)
8 Land Drill Rigs Market Analysis by Region
8.1 Key Findings
8.2 Regional Market Size Estimation and Forecast
9 North America Land Drill Rigs Market Analysis
9.1 Key Findings
9.2 North America Land Drill Rigs Market Attractiveness Index
9.3 North America Land Drill Rigs Market by Country, 2023, 2028 & 2033 (US$ Billion)
9.4 North America Land Drill Rigs Market Size Estimation and Forecast
9.5 North America Land Drill Rigs Market Size Estimation and Forecast by Country
9.6 North America Land Drill Rigs Market Size Estimation and Forecast by Type
9.7 North America Land Drill Rigs Market Size Estimation and Forecast by Power Type
9.8 North America Land Drill Rigs Market Size Estimation and Forecast by Well Class
9.9 North America Land Drill Rigs Market Size Estimation and Forecast by Technology
9.10 U.S. Land Drill Rigs Market Analysis
9.11 Canada Land Drill Rigs Market Analysis
10 Europe Land Drill Rigs Market Analysis
10.1 Key Findings
10.2 Europe Land Drill Rigs Market Attractiveness Index
10.3 Europe Land Drill Rigs Market by Country, 2023, 2028 & 2033 (US$ Billion)
10.4 Europe Land Drill Rigs Market Size Estimation and Forecast
10.5 Europe Land Drill Rigs Market Size Estimation and Forecast by Country
10.6 Europe Land Drill Rigs Market Size Estimation and Forecast by Type
10.7 Europe Land Drill Rigs Market Size Estimation and Forecast by Power Type
10.8 Europe Land Drill Rigs Market Size Estimation and Forecast by Well Class
10.9 Europe Land Drill Rigs Market Size Estimation and Forecast by Technology
10.10 Germany Land Drill Rigs Market Analysis
10.11 UK Land Drill Rigs Market Analysis
10.12 France Land Drill Rigs Market Analysis
10.13 Kazakhstan Land Drill Rigs Market Analysis
10.14 Russia Land Drill Rigs Market Analysis
10.15 Rest of Europe Land Drill Rigs Market Analysis
11 Asia-Pacific Land Drill Rigs Market Analysis
11.1 Key Findings
11.2 Asia-Pacific Land Drill Rigs Market Attractiveness Index
11.3 Asia-Pacific Land Drill Rigs Market by Country, 2023, 2028 & 2033 (US$ Billion)
11.4 Asia-Pacific Land Drill Rigs Market Size Estimation and Forecast
11.5 Asia-Pacific Land Drill Rigs Market Size Estimation and Forecast by Country
11.6 Asia-Pacific Land Drill Rigs Market Size Estimation and Forecast by Type
11.7 Asia-Pacific Land Drill Rigs Market Size Estimation and Forecast by Power Type
11.8 Asia-Pacific Land Drill Rigs Market Size Estimation and Forecast by Well Class
11.9 Asia-Pacific Land Drill Rigs Market Size Estimation and Forecast by Technology
11.10 China Land Drill Rigs Market Analysis
11.11 India Land Drill Rigs Market Analysis
11.12 Indonesia Land Drill Rigs Market Analysis
11.13 Malaysia Land Drill Rigs Market Analysis
11.14 Vietnam Land Drill Rigs Market Analysis
11.15 Rest of Asia-Pacific Land Drill Rigs Market Analysis
12 Middle East and Africa Land Drill Rigs Market Analysis
12.1 Key Findings
12.2 Middle East and Africa Land Drill Rigs Market Attractiveness Index
12.3 Middle East and Africa Land Drill Rigs Market by Country, 2023, 2028 & 2033 (US$ Billion)
12.4 Middle East and Africa Land Drill Rigs Market Size Estimation and Forecast
12.5 Middle East and Africa Land Drill Rigs Market Size Estimation and Forecast by Country
12.6 Middle East and Africa Land Drill Rigs Market Size Estimation and Forecast by Type
12.7 Middle East and Africa Land Drill Rigs Market Size Estimation and Forecast by Power Type
12.8 Middle East and Africa Land Drill Rigs Market Size Estimation and Forecast by Well Class
12.9 Middle East and Africa Land Drill Rigs Market Size Estimation and Forecast by Technology
12.10 GCC Land Drill Rigs Market Analysis
12.11 Algeria Land Drill Rigs Market Analysis
12.12 Rest of Middle East & Africa Land Drill Rigs Market Analysis
13 Latin America Land Drill Rigs Market Analysis
13.1 Key Findings
13.2 Latin America Land Drill Rigs Market Attractiveness Index
13.3 Latin America Land Drill Rigs Market by Country, 2023, 2028 & 2033 (US$ Billion)
13.4 Latin America Land Drill Rigs Market Size Estimation and Forecast
13.5 Latin America Land Drill Rigs Market Size Estimation and Forecast by Country
13.6 Latin America Land Drill Rigs Market Size Estimation and Forecast by Type
13.7 Latin America Land Drill Rigs Market Size Estimation and Forecast by Power Type
13.8 Latin America Land Drill Rigs Market Size Estimation and Forecast by Well Class
13.9 Latin America Land Drill Rigs Market Size Estimation and Forecast by Technology
13.10 Argentina Land Drill Rigs Market Analysis
13.11 Colombia Land Drill Rigs Market Analysis
13.12 Rest of Latin America Land Drill Rigs Market Analysis
14 Company Profiles
14.1 Competitive Landscape, 2022
14.2 Strategic Outlook
14.3 Bentec GmbH Drilling & Oilfield Systems
14.3.1 Company Snapshot
14.3.2 Company Overview
14.3.3 Product Benchmarking
14.3.4 Strategic Outlook
14.4 Helmerich & Payne, Inc.
14.4.1 Company Snapshot
14.4.2 Company Overview
14.4.3 Financial Analysis
14.4.3.1 Net Revenue, 2018-2022
14.4.3.2 R&D, 2018-2022
14.4.4 Product Benchmarking
14.4.5 Strategic Outlook
14.5 Independence Contract Drilling, Inc.
14.5.1 Company Snapshot
14.5.2 Company Overview
14.5.3 Financial Analysis
14.5.3.1 Net Revenue, 2018-2022
14.5.4 Product Benchmarking
14.5.5 Strategic Outlook
14.6 KCA Deutag
14.6.1 Company Snapshot
14.6.2 Company Overview
14.6.3 Product Benchmarking
14.6.4 Strategic Outlook
14.7 KWIPPED
14.7.1 Company Snapshot
14.7.2 Company Overview
14.7.3 Product Benchmarking
14.7.4 Strategic Outlook
14.8 Lamprell plc
14.8.1 Company Snapshot
14.8.2 Company Overview
14.8.3 Product Benchmarking
14.8.4 Strategic Outlook
14.9 MD Cowan, Inc
14.9.1 Company Snapshot
14.9.2 Company Overview
14.9.3 Product Benchmarking
14.9.4 Strategic Outlook
14.10 Nabors Industries Limited
14.10.1 Company Snapshot
14.10.2 Company Overview
14.10.3 Financial Analysis
14.10.3.1 Net Revenue, 2018-2022
14.10.3.2 R&D, 2018-2022
14.10.3.3 Regional Revenue Share, 2022 (%)
14.10.3.4 Business Segment Revenue Share, 2022 (%)
14.10.4 Product Benchmarking
14.10.5 Strategic Outlook
14.11 NOV Inc.
14.11.1 Company Snapshot
14.11.2 Company Overview
14.11.3 Financial Analysis
14.11.3.1 Net Revenue, 2018-2022
14.11.3.2 Regional Revenue Share, 2022 (%)
14.11.3.3 Business Segment Revenue Share, 2022 (%)
14.11.4 Product Benchmarking
14.11.5 Strategic Outlook
14.12 Patterson-UTI Energy, Inc.
14.12.1 Company Snapshot
14.12.2 Company Overview
14.12.3 Financial Analysis
14.12.3.1 Net Revenue, 2018-2022
14.12.3.2 R&D, 2018-2022
14.12.3.3 Regional Revenue Share, 2022 (%)
14.12.3.4 Business Segment Revenue Share, 2022 (%)
14.12.4 Product Benchmarking
14.12.5 Strategic Outlook
14.13 Precision Drilling Corporation
14.13.1 Company Snapshot
14.13.2 Company Overview
14.13.3 Financial Analysis
14.13.3.1 Net Revenue, 2018-2022
14.13.3.2 Regional Revenue Share, 2022 (%)
14.13.3.3 Business Segment Revenue Share, 2022 (%)
14.13.4 Product Benchmarking
14.13.5 Strategic Outlook
14.14 RG Petro-Machinery Group Co., Ltd.
14.14.1 Company Snapshot
14.14.2 Company Overview
14.14.3 Product Benchmarking
14.14.4 Strategic Outlook
14.15 Rig Source, Inc.
14.15.1 Company Snapshot
14.15.2 Company Overview
14.15.3 Product Benchmarking
14.15.4 Strategic Outlook
14.16 TOTAL Oil Rig Leasing Ltd
14.16.1 Company Snapshot
14.16.2 Company Overview
14.16.3 Product Benchmarking
14.16.4 Strategic Outlook
14.17 United Rentals, Inc.
14.17.1 Company Snapshot
14.17.2 Company Overview
14.17.3 Financial Analysis
14.17.3.1 Net Revenue, 2018-2022
14.17.3.2 Regional Revenue Share, 2022 (%)
14.17.3.3 Business Segment Revenue Share, 2022 (%)
14.17.4 Product Benchmarking
14.17.5 Strategic Outlook
15 Conclusion and Recommendations
15.1 Concluding Remarks from Visiongain
15.2 Recommendations for Market Players
ページTOPに戻る
List of Tables/Graphs
List of Tables
Table 1 Land Drill Rigs Market Snapshot, 2023 & 2033 (US$ Billion, Units, CAGR %)
Table 2 Global Land Drill Rigs Market by Region, 2023-2033 (US$ Bn, AGR (%), CAGR (%)) (V-Shaped Recovery Scenario)
Table 3 Global Land Drill Rigs Market by Region, 2023-2033 (US$ Bn, AGR (%), CAGR (%)) (U-Shaped Recovery Scenario)
Table 4 Global Land Drill Rigs Market by Region, 2023-2033 (US$ Bn, AGR (%), CAGR (%)) (W-Shaped Recovery Scenario)
Table 5 Global Land Drill Rigs Market by Region, 2023-2033 (US$ Bn, AGR (%), CAGR (%)) (L-Shaped Recovery Scenario)
Table 6 Global Land Drill Rigs Market by Type, 2023-2033 (US$ Bn, AGR (%), CAGR (%))
Table 7 Mobile Rig Market by Region, 2023-2033 (US$ Bn, AGR (%), CAGR (%))
Table 8 Conventional Rig Market by Region, 2023-2033 (US$ Bn, AGR (%), CAGR (%))
Table 9 Global Land Drill Rigs Market by Power Type, 2023-2033 (US$ Bn, AGR (%), CAGR (%))
Table 10 Less than 1500 hp Market by Region, 2023-2033 (US$ Bn, AGR (%), CAGR (%))
Table 11 1500 hp to 2500 hp Market by Region, 2023-2033 (US$ Bn, AGR (%), CAGR (%))
Table 12 More than 2500 hp Market by Region, 2023-2033 (US$ Bn, AGR (%), CAGR (%))
Table 13 Global Land Drill Rigs Market by Well Class, 2023-2033 (US$ Bn, AGR (%), CAGR (%))
Table 14 Oil Wells Market by Region, 2023-2033 (US$ Bn, AGR (%), CAGR (%))
Table 15 Gas Wells Market by Region, 2023-2033 (US$ Bn, AGR (%), CAGR (%))
Table 16 Water Wells Market by Region, 2023-2033 (US$ Bn, AGR (%), CAGR (%))
Table 17 Coalbed Methane (CBM) Production Wells Market by Region, 2023-2033 (US$ Bn, AGR (%), CAGR (%))
Table 18 Other Well Classs Market by Region, 2023-2033 (US$ Bn, AGR (%), CAGR (%))
Table 19 Global Land Drill Rigs Market by Technology, 2023-2033 (US$ Bn, AGR (%), CAGR (%))
Table 20 Mechanical Drill Rigs Market by Region, 2023-2033 (US$ Bn, AGR (%), CAGR (%))
Table 21 Hydraulic Drill Rigs Market by Region, 2023-2033 (US$ Bn, AGR (%), CAGR (%))
Table 22 Electric Drill Rigs Market by Region, 2023-2033 (US$ Bn, AGR (%), CAGR (%))
Table 23 Rotary Table Drill Rigs Market by Region, 2023-2033 (US$ Bn, AGR (%), CAGR (%))
Table 24 Auger Drill Rigs Market by Region, 2023-2033 (US$ Bn, AGR (%), CAGR (%))
Table 25 Other Technology Market by Region, 2023-2033 (US$ Bn, AGR (%), CAGR (%))
Table 26 Land Drill Rigs Market Forecast by Region, 2023-2033 (US$ Billion, AGR%, CAGR%)
Table 27 North America Land Drill Rigs Market by Value, 2023-2033 (US$ Bn, AGR (%), CAGR (%))
Table 28 North America Land Drill Rigs Market by Cumulative Installed Capacity, 2023-2033 (Units, AGR (%), CAGR (%))
Table 29 North America Land Drill Rigs Market by Country, 2023-2033 (US$ Bn, AGR (%), CAGR (%))
Table 30 North America Land Drill Rigs Market Cumulative Installed Capacity by Country, 2023-2033 (Units, AGR (%), CAGR (%))
Table 31 North America Land Drill Rigs Market by Type, 2023-2033 (US$ Bn, AGR (%), CAGR (%))
Table 32 North America Land Drill Rigs Market by Power Type, 2023-2033 (US$ Bn, AGR (%), CAGR (%))
Table 33 North America Land Drill Rigs Market by Well Class, 2023-2033 (US$ Bn, AGR (%), CAGR (%))
Table 34 North America Land Drill Rigs Market by Technology, 2023-2033 (US$ Bn, AGR (%), CAGR (%))
Table 35 US Land Drill Rigs Market by Value, 2023-2033 (US$ Bn, AGR (%), CAGR (%))
Table 36 US Land Drill Rigs Market by Volume, 2023-2033 (Units, AGR (%), CAGR (%))
Table 37 Canada Land Drill Rigs Market by Value, 2023-2033 (US$ Bn, AGR (%), CAGR (%))
Table 38 Canada Land Drill Rigs Market by Volume, 2023-2033 (Units, AGR (%), CAGR (%))
Table 39 Europe Land Drill Rigs Market by Value, 2023-2033 (US$ Bn, AGR (%), CAGR (%))
Table 40 Europe Land Drill Rigs Market by Cumulative Installed Capacity, 2023-2033 (Units, AGR (%), CAGR (%))
Table 41 Europe Land Drill Rigs Market by Country, 2023-2033 (US$ Bn, AGR (%), CAGR (%))
Table 42 Europe Land Drill Rigs Market Cumulative Installed Capacity by Country, 2023-2033 (Units, AGR (%), CAGR (%))
Table 43 Europe Land Drill Rigs Market by Type, 2023-2033 (US$ Bn, AGR (%), CAGR (%))
Table 44 Europe Land Drill Rigs Market by Power Type, 2023-2033 (US$ Bn, AGR (%), CAGR (%))
Table 45 Europe Land Drill Rigs Market by Well Class, 2023-2033 (US$ Bn, AGR (%), CAGR (%))
Table 46 Europe Land Drill Rigs Market by Technology, 2023-2033 (US$ Bn, AGR (%), CAGR (%))
Table 47 Germany Land Drill Rigs Market by Value, 2023-2033 (US$ Bn, AGR (%), CAGR (%))
Table 48 Germany Land Drill Rigs Market by Volume, 2023-2033 (Units, AGR (%), CAGR (%))
Table 49 UK Land Drill Rigs Market by Value, 2023-2033 (US$ Bn, AGR (%), CAGR (%))
Table 50 UK Land Drill Rigs Market by Volume, 2023-2033 (Units, AGR (%), CAGR (%))
Table 51 France Land Drill Rigs Market by Value, 2023-2033 (US$ Bn, AGR (%), CAGR (%))
Table 52 France Land Drill Rigs Market by Volume, 2023-2033 (Units, AGR (%), CAGR (%))
Table 53 Kazakhstan Land Drill Rigs Market by Value, 2023-2033 (US$ Bn, AGR (%), CAGR (%))
Table 54 Kazakhstan Land Drill Rigs Market by Volume, 2023-2033 (Units, AGR (%), CAGR (%))
Table 55 Russia Land Drill Rigs Market by Value, 2023-2033 (US$ Bn, AGR (%), CAGR (%))
Table 56 Russia Land Drill Rigs Market by Volume, 2023-2033 (Units, AGR (%), CAGR (%))
Table 57 Rest of Europe Land Drill Rigs Market by Value, 2023-2033 (US$ Bn, AGR (%), CAGR (%))
Table 58 Rest of Europe Land Drill Rigs Market by Volume, 2023-2033 (Units, AGR (%), CAGR (%))
Table 59 Asia-Pacific Land Drill Rigs Market by Value, 2023-2033 (US$ Bn, AGR (%), CAGR (%))
Table 60 Asia-Pacific Land Drill Rigs Market by Cumulative Installed Capacity, 2023-2033 (Units, AGR (%), CAGR (%))
Table 61 Asia-Pacific Land Drill Rigs Market by Country, 2023-2033 (US$ Bn, AGR (%), CAGR (%))
Table 62 Asia-Pacific Land Drill Rigs Market Cumulative Installed Capacity by Country, 2023-2033 (Units, AGR (%), CAGR (%))
Table 63 Asia-Pacific Land Drill Rigs Market by Type, 2023-2033 (US$ Bn, AGR (%), CAGR (%))
Table 64 Asia-Pacific Land Drill Rigs Market by Power Type, 2023-2033 (US$ Bn, AGR (%), CAGR (%))
Table 65 Asia-Pacific Land Drill Rigs Market by Well Class, 2023-2033 (US$ Bn, AGR (%), CAGR (%))
Table 66 Asia-Pacific Land Drill Rigs Market by Technology, 2023-2033 (US$ Bn, AGR (%), CAGR (%))
Table 67 China Land Drill Rigs Market by Value, 2023-2033 (US$ Bn, AGR (%), CAGR (%))
Table 68 China Land Drill Rigs Market by Volume, 2023-2033 (Units, AGR (%), CAGR (%))
Table 69 India Land Drill Rigs Market by Value, 2023-2033 (US$ Bn, AGR (%), CAGR (%))
Table 70 India Land Drill Rigs Market by Volume, 2023-2033 (Units, AGR (%), CAGR (%))
Table 71 Indonesia Land Drill Rigs Market by Value, 2023-2033 (US$ Bn, AGR (%), CAGR (%))
Table 72 Indonesia Land Drill Rigs Market by Volume, 2023-2033 (Units, AGR (%), CAGR (%))
Table 73 Malaysia Land Drill Rigs Market by Value, 2023-2033 (US$ Bn, AGR (%), CAGR (%))
Table 74 Malaysia Land Drill Rigs Market by Volume, 2023-2033 (Units, AGR (%), CAGR (%))
Table 75 Vietnam Land Drill Rigs Market by Value, 2023-2033 (US$ Bn, AGR (%), CAGR (%))
Table 76 Vietnam Land Drill Rigs Market by Volume, 2023-2033 (Units, AGR (%), CAGR (%))
Table 77 Rest of Asia-Pacific Land Drill Rigs Market by Value, 2023-2033 (US$ Bn, AGR (%), CAGR (%))
Table 78 Rest of Asia-Pacific Land Drill Rigs Market by Volume, 2023-2033 (Units, AGR (%), CAGR (%))
Table 79 Middle East & Africa Land Drill Rigs Market by Value, 2023-2033 (US$ Bn, AGR (%), CAGR (%))
Table 80 Middle East & Africa Land Drill Rigs Market by Cumulative Installed Capacity, 2023-2033 (Units, AGR (%), CAGR (%))
Table 81 Middle East & Africa Land Drill Rigs Market by Country, 2023-2033 (US$ Bn, AGR (%), CAGR (%))
Table 82 Middle East & Africa Land Drill Rigs Market by Type, 2023-2033 (US$ Bn, AGR (%), CAGR (%))
Table 83 Middle East & Africa Land Drill Rigs Market by Power Type, 2023-2033 (US$ Bn, AGR (%), CAGR (%))
Table 84 Middle East & Africa Land Drill Rigs Market by Well Class, 2023-2033 (US$ Bn, AGR (%), CAGR (%))
Table 85 Middle East & Africa Land Drill Rigs Market by Technology, 2023-2033 (US$ Bn, AGR (%), CAGR (%))
Table 86 GCC Land Drill Rigs Market by Value, 2023-2033 (US$ Bn, AGR (%), CAGR (%))
Table 87 GCC Land Drill Rigs Market by Volume, 2023-2033 (Units, AGR (%), CAGR (%))
Table 88 Algeria Land Drill Rigs Market by Value, 2023-2033 (US$ Bn, AGR (%), CAGR (%))
Table 89 Algeria Land Drill Rigs Market by Volume, 2023-2033 (Units, AGR (%), CAGR (%))
Table 90 Rest of Latin America Land Drill Rigs Market by Value, 2023-2033 (US$ Bn, AGR (%), CAGR (%))
Table 91 Rest of Middle East & Africa Land Drill Rigs Market by Volume, 2023-2033 (Units, AGR (%), CAGR (%))
Table 92 Latin America Land Drill Rigs Market by Value, 2023-2033 (US$ Bn, AGR (%), CAGR (%))
Table 93 Latin America Land Drill Rigs Market by Cumulative Installed Capacity, 2023-2033 (Units, AGR (%), CAGR (%))
Table 94 Latin America Land Drill Rigs Market by Country, 2023-2033 (US$ Bn, AGR (%), CAGR (%))
Table 95 Latin America Land Drill Rigs Market Cumulative Installed Capacity by Country, 2023-2033 (Units, AGR (%), CAGR (%))
Table 96 Latin America Land Drill Rigs Market by Type, 2023-2033 (US$ Bn, AGR (%), CAGR (%))
Table 97 Latin America Land Drill Rigs Market by Power Type, 2023-2033 (US$ Bn, AGR (%), CAGR (%))
Table 98 Latin America Land Drill Rigs Market by Well Class, 2023-2033 (US$ Bn, AGR (%), CAGR (%))
Table 99 Latin America Land Drill Rigs Market by Technology, 2023-2033 (US$ Bn, AGR (%), CAGR (%))
Table 100 Argentina Land Drill Rigs Market by Value, 2023-2033 (US$ Bn, AGR (%), CAGR (%))
Table 101 Argentina Land Drill Rigs Market by Volume, 2023-2033 (Units, AGR (%), CAGR (%))
Table 102 Colombia Land Drill Rigs Market by Value, 2023-2033 (US$ Bn, AGR (%), CAGR (%))
Table 103 Colombia Land Drill Rigs Market by Volume, 2023-2033 (Units, AGR (%), CAGR (%))
Table 104 Rest of Latin America Land Drill Rigs Market by Value, 2023-2033 (US$ Bn, AGR (%), CAGR (%))
Table 105 Rest of Latin America Land Drill Rigs Market by Volume, 2023-2033 (Units, AGR (%), CAGR (%))
Table 106 Strategic Outlook - Contract
Table 107 Bentec GmbH Drilling & Oilfield Systems: Key Details, (CEO, HQ, Revenue, Founded, No. of Employees, Company Type, Website, Business Segment)
Table 108 Bentec GmbH Drilling & Oilfield Systems: Product Benchmarking
Table 109 Bentec GmbH Drilling & Oilfield Systems: Strategic Outlook
Table 110 Helmerich & Payne, Inc.: Key Details, (CEO, HQ, Revenue, Founded, No. of Employees, Company Type, Website, Business Segment)
Table 111 Helmerich & Payne, Inc.: Product Benchmarking
Table 112 Helmerich & Payne, Inc.: Strategic Outlook
Table 113 Independence Contract Drilling, Inc.: Key Details, (CEO, HQ, Revenue, Founded, No. of Employees, Company Type, Website, Business Segment)
Table 114 Independence Contract Drilling, Inc.: Product Benchmarking
Table 115 KCA Deutag: Key Details, (CEO, HQ, Revenue, Founded, No. of Employees, Company Type, Website, Business Segment)
Table 116 KCA Deutag: Product Benchmarking
Table 117 KCA Deutag: Strategic Outlook
Table 118 KWIPPED: Key Details, (CEO, HQ, Revenue, Founded, No. of Employees, Company Type, Website, Business Segment)
Table 119 KWIPPED: Product Benchmarking
Table 120 KWIPPED: Strategic Outlook
Table 121 Lamprell plc: Key Details, (CEO, HQ, Revenue, Founded, No. of Employees, Company Type, Website, Business Segment)
Table 122 Lamprell plc: Product Benchmarking
Table 123 Lamprell plc: Strategic Outlook
Table 124 MD Cowan, Inc: Key Details, (CEO, HQ, Revenue, Founded, No. of Employees, Company Type, Website, Business Segment)
Table 125 MD Cowan, Inc: Product Benchmarking
Table 126 Nabors Industries Limited: Key Details, (CEO, HQ, Revenue, Founded, No. of Employees, Company Type, Website, Business Segment)
Table 127 Nabors Industries Limited: Product Benchmarking
Table 128 Nabors Industries Limited: Strategic Outlook
Table 129 NOV Inc.: Key Details, (CEO, HQ, Revenue, Founded, No. of Employees, Company Type, Website, Business Segment)
Table 130 NOV Inc.: Product Benchmarking
Table 131 Patterson-UTI Energy, Inc.: Key Details, (CEO, HQ, Revenue, Founded, No. of Employees, Company Type, Website, Business Segment)
Table 132 Patterson-UTI Energy, Inc.: Product Benchmarking
Table 133 Patterson-UTI Energy, Inc.: Strategic Outlook
Table 134 Precision Drilling Corporation: Key Details, (CEO, HQ, Revenue, Founded, No. of Employees, Company Type, Website, Business Segment)
Table 135 Precision Drilling Corporation: Product Benchmarking
Table 136 Precision Drilling Corporation: Strategic Outlook
Table 137 RG Petro-Machinery Group Co., Ltd: Key Details, (CEO, HQ, Revenue, Founded, No. of Employees, Company Type, Website, Business Segment)
Table 138 RG Petro-Machinery Group Co., Ltd: Product Benchmarking
Table 139 Rig Source, Inc.: Key Details, (CEO, HQ, Revenue, Founded, No. of Employees, Company Type, Website, Business Segment)
Table 140 Rig Source, Inc.: Product Benchmarking
Table 141 Rig Source, Inc.: Strategic Outlook
Table 142 TOTAL Oil Rig Leasing Ltd: Key Details, (CEO, HQ, Revenue, Founded, No. of Employees, Company Type, Website, Business Segment)
Table 143 TOTAL Oil Rig Leasing Ltd: Product Benchmarking
Table 144 TOTAL Oil Rig Leasing Ltd.: Strategic Outlook
Table 145 United Rentals, Inc.: Key Details, (CEO, HQ, Revenue, Founded, No. of Employees, Company Type, Website, Business Segment)
Table 146 United Rentals, Inc.: Product Benchmarking
List of Figures
Figure 1 Land Drill Rigs Market Segmentation
Figure 2 Land Drill Rigs Market by Type: Market Attractiveness Index
Figure 3 Land Drill Rigs Market by Power Type: Market Attractiveness Index
Figure 4 Land Drill Rigs Market by Well Class: Market Attractiveness Index
Figure 5 Land Drill Rigs Market by Technology: Market Attractiveness Index
Figure 6 Land Drill Rigs Market Attractiveness Index by Region
Figure 7 Land Drill Rigs Market: Market Dynamics
Figure 8 Surge in crude oil production 2018- 2022
Figure 9 Estimated oil and gas investments 2019- 2024
Figure 1 Global Crude Oil Prices, 2018- 2022
Figure 2 Land Drill Rigs Market: Porter’s Five Forces Analysis
Figure 3 Global Land Drill Rigs Market Share Forecast by COVID, 2023-2033 (%)
Figure 4 Global Land Drill Rigs Market by Region, 2023-2033 (US$ Bn, AGR (%)) (V-Shaped Recovery Scenario)
Figure 5 Global Land Drill Rigs Market by Region, 2023-2033 (US$ Bn, AGR (%)) (U-Shaped Recovery Scenario)
Figure 6 Global Land Drill Rigs Market by Region, 2023-2033 (US$ Bn, AGR (%)) (W-Shaped Recovery Scenario)
Figure 7 Global Land Drill Rigs Market by Region, 2023-2033 (US$ Bn, AGR (%)) (L-Shaped Recovery Scenario)
Figure 8 Land Drill Rigs Market: PEST Analysis
Figure 9 Land Drill Rigs Market by Type: Market Attractiveness Index
Figure 10 Global Land Drill Rigs Market by Type, 2023-2033 (US$ Bn, AGR (%))
Figure 11 Land Drill Rigs Market Share Forecast by Type, 2023, 2028, 2033 (%)
Figure 12 Mobile Rig Market by Region, 2023-2033 (US$ Bn, AGR (%))
Figure 13 Mobile Rig Market Share Forecast by Region, 2023 & 2033 (%)
Figure 14 Conventional Rig Market by Region, 2023-2033 (US$ Bn, AGR (%))
Figure 15 Conventional Rig Market Share Forecast by Region, 2023 & 2033 (%)
Figure 16 Land Drill Rigs Market by Power Type: Market Attractiveness Index
Figure 17 Global Land Drill Rigs Market by Power Type, 2023-2033 (US$ Bn, AGR (%))
Figure 18 Land Drill Rigs Market Share Forecast by Power Type, 2023, 2028, 2033 (%)
Figure 19 Less than 1500 hp Market by Region, 2023-2033 (US$ Bn, AGR (%))
Figure 20 Less than 1500 hp Market Share Forecast by Region, 2023 & 2033 (%)
Figure 21 1500 hp to 2500 hp Market by Region, 2023-2033 (US$ Bn, AGR (%))
Figure 22 1500 hp to 2500 hp Market Share Forecast by Region, 2023 & 2033 (%)
Figure 23 More than 2500 hp Market by Region, 2023-2033 (US$ Bn, AGR (%))
Figure 24 More than 2500 hp Market Share Forecast by Region, 2023 & 2033 (%)
Figure 25 Land Drill Rigs Market by Well Class: Market Attractiveness Index
Figure 26 Global Land Drill Rigs Market by Well Class, 2023-2033 (US$ Bn, AGR (%))
Figure 27 Land Drill Rigs Market Share Forecast by Well Class, 2023, 2028, 2033 (%)
Figure 28 Oil Wells Market by Region, 2023-2033 (US$ Bn, AGR (%))
Figure 29 Oil Wells Market Share Forecast by Region, 2023 & 2033 (%)
Figure 30 Gas Wells Market by Region, 2023-2033 (US$ Bn, AGR (%))
Figure 31 Gas Wells Market Share Forecast by Region, 2023 & 2033 (%)
Figure 32 Water Wells Market by Region, 2023-2033 (US$ Bn, AGR (%))
Figure 33 Water Wells Market Share Forecast by Region, 2023 & 2033 (%)
Figure 34 Coalbed Methane (CBM) Production Wells Market by Region, 2023-2033 (US$ Bn, AGR (%))
Figure 35 Coalbed Methane (CBM) Production Wells Market Share Forecast by Region, 2023 & 2033 (%)
Figure 36 Other Well Class Market by Region, 2023-2033 (US$ Bn, AGR (%))
Figure 37 Other Well Classes Market Share Forecast by Region, 2023 & 2033 (%)
Figure 38 Land Drill Rigs Market by Technology: Market Attractiveness Index
Figure 39 Global Land Drill Rigs Market by Technology, 2023-2033 (US$ Bn, AGR (%))
Figure 40 Land Drill Rigs Market Share Forecast by Technology, 2023, 2028, 2033 (%)
Figure 41 Mechanical Drill Rigs Market by Region, 2023-2033 (US$ Bn, AGR (%))
Figure 42 Mechanical Drill Rigs Market Share Forecast by Region, 2023 & 2033 (%)
Figure 43 Hydraulic Drill Rigs Market by Region, 2023-2033 (US$ Bn, AGR (%))
Figure 44 Hydraulic Drill Rigs Market Share Forecast by Region, 2023 & 2033 (%)
Figure 45 Electric Drill Rigs Market by Region, 2023-2033 (US$ Bn, AGR (%))
Figure 46 Electric Drill Rigs Market Share Forecast by Region, 2023 & 2033 (%)
Figure 47 Rotary Table Drill Rigs Market by Region, 2023-2033 (US$ Bn, AGR (%))
Figure 48 Rotary Table Drill Rigs Market Share Forecast by Region, 2023 & 2033 (%)
Figure 49 Auger Drill Rigs Market by Region, 2023-2033 (US$ Bn, AGR (%))
Figure 50 Auger Drill Rigs Market Share Forecast by Region, 2023 & 2033 (%)
Figure 51 Other Technology Market by Region, 2023-2033 (US$ Bn, AGR (%))
Figure 52 Other Technology Market Share Forecast by Region, 2023 & 2033 (%)
Figure 53 Land Drill Rigs Market Forecast by Region 2023 and 2033 (Revenue, CAGR%)
Figure 54 Land Drill Rigs Market Share Forecast by Region 2023, 2028, 2033 (%)
Figure 55 Land Drill Rigs Market by Region, 2023-2033 (US$ Billion, AGR %)
Figure 56 North America Land Drill Rigs Market Attractiveness Index
Figure 57 North America Land Drill Rigs Market by Region, 2023, 2028 & 2033 (US$ Billion)
Figure 58 North America Land Drill Rigs Market by Value, 2023-2033 (US$ Bn, AGR (%))
Figure 59 North America Land Drill Rigs Market by Cumulative Installed Capacity, 2023-2033 (Units, AGR (%))
Figure 60 North America Land Drill Rigs Market by Country, 2023-2033 (US$ Bn, AGR (%))
Figure 61 North America Land Drill Rigs Market Cumulative Installed Capacity by Country, 2023-2033 (Units, AGR (%))
Figure 62 North America Land Drill Rigs Market Share Forecast by Country, 2023 & 2033 (%)
Figure 63 North America Land Drill Rigs Market by Type, 2023-2033 (US$ Bn, AGR (%))
Figure 64 North America Land Drill Rigs Market Share Forecast Type, 2023 & 2033 (%)
Figure 65 North America Land Drill Rigs Market by Power Type, 2023-2033 (US$ Bn, AGR (%))
Figure 66 North America Land Drill Rigs Market Share Forecast by Power Type, 2023 & 2033 (%)
Figure 67 North America Land Drill Rigs Market by Well Class, 2023-2033 (US$ Bn, AGR (%))
Figure 68 North America Land Drill Rigs Market Share Forecast by Well Class, 2023 & 2033 (%)
Figure 69 North America Land Drill Rigs Market by Technology, 2023-2033 (US$ Bn, AGR (%))
Figure 70 North America Land Drill Rigs Market Share Forecast by Technology, 2023 & 2033 (%)
Figure 71 US Land Drill Rigs Market by Value, 2023-2033 (US$ Bn, AGR (%))
Figure 72 US Land Drill Rigs Market by Volume, 2023-2033 (Units, AGR (%))
Figure 73 Canada Land Drill Rigs Market by Value, 2023-2033 (US$ Bn, AGR (%))
Figure 74 Canada Land Drill Rigs Market by Volume, 2023-2033 (Units, AGR (%))
Figure 75 Europe Land Drill Rigs Market Attractiveness Index
Figure 76 Europe Land Drill Rigs Market by Region, 2023, 2028 & 2033 (US$ Billion)
Figure 77 Europe Land Drill Rigs Market by Value, 2023-2033 (US$ Bn, AGR (%))
Figure 78 Europe Land Drill Rigs Market by Cumulative Installed Capacity, 2023-2033 (Units, AGR (%))
Figure 79 Europe Land Drill Rigs Market by Country, 2023-2033 (US$ Bn, AGR (%))
Figure 80 Europe Land Drill Rigs Market Cumulative Installed Capacity by Country, 2023-2033 (Units, AGR (%))
Figure 81 Europe Land Drill Rigs Market Share Forecast by Country, 2023 & 2033 (%)
Figure 82 Europe Land Drill Rigs Market by Type, 2023-2033 (US$ Bn, AGR (%))
Figure 83 Europe Land Drill Rigs Market Share Forecast Type, 2023 & 2033 (%)
Figure 84 Europe Land Drill Rigs Market by Power Type, 2023-2033 (US$ Bn, AGR (%))
Figure 85 Europe Land Drill Rigs Market Share Forecast by Power Type, 2023 & 2033 (%)
Figure 86 Europe Land Drill Rigs Market by Well Class, 2023-2033 (US$ Bn, AGR (%))
Figure 87 Europe Land Drill Rigs Market Share Forecast by Well Class, 2023 & 2033 (%)
Figure 88 Europe Land Drill Rigs Market by Technology, 2023-2033 (US$ Bn, AGR (%))
Figure 89 Europe Land Drill Rigs Market Share Forecast by Technology, 2023 & 2033 (%)
Figure 90 Germany Land Drill Rigs Market by Value, 2023-2033 (US$ Bn, AGR (%))
Figure 91 Germany Land Drill Rigs Market by Volume, 2023-2033 (Units, AGR (%))
Figure 92 UK Land Drill Rigs Market by Value, 2023-2033 (US$ Bn, AGR (%))
Figure 93 UK Land Drill Rigs Market by Volume, 2023-2033 (Units, AGR (%))
Figure 94 France Land Drill Rigs Market by Value, 2023-2033 (US$ Bn, AGR (%))
Figure 95 France Land Drill Rigs Market by Volume, 2023-2033 (Units, AGR (%))
Figure 96 Kazakhstan Land Drill Rigs Market by Value, 2023-2033 (US$ Bn, AGR (%))
Figure 97 Kazakhstan Land Drill Rigs Market by Volume, 2023-2033 (Units, AGR (%))
Figure 98 Russia Land Drill Rigs Market by Value, 2023-2033 (US$ Bn, AGR (%))
Figure 99 Russia Land Drill Rigs Market by Volume, 2023-2033 (Units, AGR (%))
Figure 100 Rest of Europe Land Drill Rigs Market by Value, 2023-2033 (US$ Bn, AGR (%))
Figure 101 Rest of Europe Land Drill Rigs Market by Volume, 2023-2033 (Units, AGR (%))
Figure 102 Asia-Pacific Land Drill Rigs Market Attractiveness Index
Figure 103 Asia-Pacific Land Drill Rigs Market by Region, 2023, 2028 & 2033 (US$ Billion)
Figure 104 Asia-Pacific Land Drill Rigs Market by Value, 2023-2033 (US$ Bn, AGR (%))
Figure 105 Asia-Pacific Land Drill Rigs Market by Cumulative Installed Capacity, 2023-2033 (Units, AGR (%))
Figure 106 Asia-Pacific Land Drill Rigs Market by Country, 2023-2033 (US$ Bn, AGR (%))
Figure 107 Asia-Pacific Land Drill Rigs Market Cumulative Installed Capacity by Country, 2023-2033 (Units, AGR (%))
Figure 108 Asia-Pacific Land Drill Rigs Market Share Forecast by Country, 2023 & 2033 (%)
Figure 109 Asia-Pacific Land Drill Rigs Market by Type, 2023-2033 (US$ Bn, AGR (%))
Figure 110 Asia-Pacific Land Drill Rigs Market Share Forecast Type, 2023 & 2033 (%)
Figure 111 Asia-Pacific Land Drill Rigs Market by Power Type, 2023-2033 (US$ Bn, AGR (%))
Figure 112 Asia-Pacific Land Drill Rigs Market Share Forecast by Power Type, 2023 & 2033 (%)
Figure 113 Asia-Pacific Land Drill Rigs Market by Well Class, 2023-2033 (US$ Bn, AGR (%))
Figure 114 Asia-Pacific Land Drill Rigs Market Share Forecast by Well Class, 2023 & 2033 (%)
Figure 115 Asia-Pacific Land Drill Rigs Market by Technology, 2023-2033 (US$ Bn, AGR (%))
Figure 116 Asia-Pacific Land Drill Rigs Market Share Forecast by Technology, 2023 & 2033 (%)
Figure 117 China Land Drill Rigs Market by Value, 2023-2033 (US$ Bn, AGR (%))
Figure 118 China Land Drill Rigs Market by Volume, 2023-2033 (Units, AGR (%))
Figure 119 India Land Drill Rigs Market by Value, 2023-2033 (US$ Bn, AGR (%))
Figure 120 India Land Drill Rigs Market by Volume, 2023-2033 (Units, AGR (%))
Figure 121 Indonesia Land Drill Rigs Market by Value, 2023-2033 (US$ Bn, AGR (%))
Figure 122 Indonesia Land Drill Rigs Market by Volume, 2023-2033 (Units, AGR (%))
Figure 123 Malaysia Land Drill Rigs Market by Value, 2023-2033 (US$ Bn, AGR (%))
Figure 124 Malaysia Land Drill Rigs Market by Volume, 2023-2033 (Units, AGR (%))
Figure 125 Vietnam Land Drill Rigs Market by Value, 2023-2033 (US$ Bn, AGR (%))
Figure 126 Vietnam Land Drill Rigs Market by Volume, 2023-2033 (Units, AGR (%))
Figure 127 Rest of Asia-Pacific Land Drill Rigs Market by Value, 2023-2033 (US$ Bn, AGR (%))
Figure 128 Rest of Asia-Pacific Land Drill Rigs Market by Volume, 2023-2033 (Units, AGR (%))
Figure 129 Middle East and Africa Land Drill Rigs Market Attractiveness Index
Figure 130 Middle East and Africa Land Drill Rigs Market by Region, 2023, 2028 & 2033 (US$ Billion)
Figure 131 Middle East & Africa Land Drill Rigs Market by Value, 2023-2033 (US$ Bn, AGR (%))
Figure 132 Middle East & Africa Land Drill Rigs Market by Cumulative Installed Capacity, 2023-2033 (Units, AGR (%))
Figure 133 Middle East & Africa Land Drill Rigs Market by Country, 2023-2033 (US$ Bn, AGR (%))
Figure 134 Middle East and Africa Land Drill Rigs Market Share Forecast by Country, 2023 & 2033 (%)
Figure 135 Middle East & Africa Land Drill Rigs Market by Type, 2023-2033 (US$ Bn, AGR (%))
Figure 136 Middle East and Africa Land Drill Rigs Market Share Forecast Type, 2023 & 2033 (%)
Figure 137 Middle East & Africa Land Drill Rigs Market by Power Type, 2023-2033 (US$ Bn, AGR (%))
Figure 138 Middle East and Africa Land Drill Rigs Market Share Forecast by Power Type, 2023 & 2033 (%)
Figure 139 Middle East & Africa Land Drill Rigs Market by Well Class, 2023-2033 (US$ Bn, AGR (%))
Figure 140 Middle East and Africa Land Drill Rigs Market Share Forecast by Well Class, 2023 & 2033 (%)
Figure 141 Middle East & Africa Land Drill Rigs Market by Technology, 2023-2033 (US$ Bn, AGR (%))
Figure 142 Middle East and Africa Land Drill Rigs Market Share Forecast by Technology, 2023 & 2033 (%)
Figure 143 GCC Land Drill Rigs Market by Value, 2023-2033 (US$ Bn, AGR (%))
Figure 144 GCC Land Drill Rigs Market by Volume, 2023-2033 (Units, AGR (%))
Figure 145 Algeria Land Drill Rigs Market by Value, 2023-2033 (US$ Bn, AGR (%))
Figure 146 Algeria Land Drill Rigs Market by Volume, 2023-2033 (Units, AGR (%))
Figure 147 Rest of Latin America Land Drill Rigs Market by Value, 2023-2033 (US$ Bn, AGR (%))
Figure 148 Rest of Middle East & Africa Land Drill Rigs Market by Volume, 2023-2033 (Units, AGR (%))
Figure 149 Latin America Land Drill Rigs Market Attractiveness Index
Figure 150 Latin America Land Drill Rigs Market by Region, 2023, 2028 & 2033 (US$ Billion)
Figure 151 Latin America Land Drill Rigs Market by Value, 2023-2033 (US$ Bn, AGR (%))
Figure 152 Latin America Land Drill Rigs Market by Cumulative Installed Capacity, 2023-2033 (Units, AGR (%))
Figure 153 Latin America Land Drill Rigs Market by Country, 2023-2033 (US$ Bn, AGR (%))
Figure 154 Latin America Land Drill Rigs Market Cumulative Installed Capacity by Country, 2023-2033 (Units, AGR (%))
Figure 155 Latin America Land Drill Rigs Market Share Forecast by Country, 2023 & 2033 (%)
Figure 156 Latin America Land Drill Rigs Market by Type, 2023-2033 (US$ Bn, AGR (%))
Figure 157 Latin America Land Drill Rigs Market Share Forecast Type, 2023 & 2033 (%)
Figure 158 Latin America Land Drill Rigs Market by Power Type, 2023-2033 (US$ Bn, AGR (%))
Figure 159 Latin America Land Drill Rigs Market Share Forecast by Power Type, 2023 & 2033 (%)
Figure 160 Latin America Land Drill Rigs Market by Well Class, 2023-2033 (US$ Bn, AGR (%))
Figure 161 Latin America Land Drill Rigs Market Share Forecast by Well Class, 2023 & 2033 (%)
Figure 162 Latin America Land Drill Rigs Market by Technology, 2023-2033 (US$ Bn, AGR (%))
Figure 163 Latin America Land Drill Rigs Market Share Forecast by Technology, 2023 & 2033 (%)
Figure 164 Argentina Land Drill Rigs Market by Value, 2023-2033 (US$ Bn, AGR (%))
Figure 165 Argentina Land Drill Rigs Market by Volume, 2023-2033 (Units, AGR (%))
Figure 166 Colombia Land Drill Rigs Market by Value, 2023-2033 (US$ Bn, AGR (%))
Figure 167 Colombia Land Drill Rigs Market by Volume, 2023-2033 (Units, AGR (%))
Figure 168 Rest of Latin America Land Drill Rigs Market by Value, 2023-2033 (US$ Bn, AGR (%))
Figure 169 Rest of Latin America Land Drill Rigs Market by Volume, 2023-2033 (Units, AGR (%))
Figure 170 Land Drill Rigs Market: Company Share, 2022
Figure 171 Helmerich & Payne, Inc..: Net Revenue, 2018-2022 (US$Million, AGR%)
Figure 172 Helmerich & Payne, Inc..: R&D, 2018-2022 (US$Million, AGR%)
Figure 173 Independence Contract Drilling, Inc..: Net Revenue, 2018-2022 (US$Million, AGR%)
Figure 174 Nabors Industries Limited.: Net Revenue, 2018-2022 (US$Million, AGR%)
Figure 175 Nabors Industries Limited.: R&D, 2018-2022 (US$Million, AGR%)
Figure 176 Nabors Industries Limited.: Regional Revenue Share, 2022 (%)
Figure 177 Nabors Industries Limited.: Business Segment Revenue Share, 2022 (%)
Figure 178 NOV Inc..: Net Revenue, 2018-2022 (US$Million, AGR%)
Figure 179 NOV Inc..: Regional Revenue Share, 2022 (%)
Figure 180 NOV Inc..: Business Segment Revenue Share, 2022 (%)
Figure 181 Patterson-UTI Energy, Inc..: Net Revenue, 2018-2022 (US$Million, AGR%)
Figure 182 Patterson-UTI Energy, Inc..: R&D, 2018-2022 (US$Million, AGR%)
Figure 183 Patterson-UTI Energy, Inc..: Regional Revenue Share, 2022 (%)
Figure 184 Patterson-UTI Energy, Inc..: Business Segment Revenue Share, 2022 (%)
Figure 185 Precision Drilling Corporation.: Net Revenue, 2018-2022 (US$Million, AGR%)
Figure 186 Precision Drilling Corporation.: Regional Revenue Share, 2022 (%)
Figure 187 Precision Drilling Corporation.: Business Segment Revenue Share, 2022 (%)
Figure 188 United Rentals, Inc..: Net Revenue, 2018-2022 (US$Million, AGR%)
Figure 189 United Rentals, Inc..: Regional Revenue Share, 2022 (%)
Figure 190 United Rentals, Inc..: Business Segment Revenue Share, 2022 (%)
ページTOPに戻る
Visiongain社のエネルギーと資源分野での最新刊レポート
本レポートと同じKEY WORD(rig)の最新刊レポート
- 本レポートと同じKEY WORDの最新刊レポートはありません。
よくあるご質問
Visiongain社はどのような調査会社ですか?
英国の調査会社ヴィジョンゲイン社(Visiongain)は、通信とエネルギーのほか、自動車や化学・医薬品、金属など、広範な市場を対象に調査を行っています。自動車市場については、市場全般に関する調査のほ... もっと見る
調査レポートの納品までの日数はどの程度ですか?
在庫のあるものは速納となりますが、平均的には 3-4日と見て下さい。
但し、一部の調査レポートでは、発注を受けた段階で内容更新をして納品をする場合もあります。
発注をする前のお問合せをお願いします。
注文の手続きはどのようになっていますか?
1)お客様からの御問い合わせをいただきます。
2)見積書やサンプルの提示をいたします。
3)お客様指定、もしくは弊社の発注書をメール添付にて発送してください。
4)データリソース社からレポート発行元の調査会社へ納品手配します。
5) 調査会社からお客様へ納品されます。最近は、pdfにてのメール納品が大半です。
お支払方法の方法はどのようになっていますか?
納品と同時にデータリソース社よりお客様へ請求書(必要に応じて納品書も)を発送いたします。
お客様よりデータリソース社へ(通常は円払い)の御振り込みをお願いします。
請求書は、納品日の日付で発行しますので、翌月最終営業日までの当社指定口座への振込みをお願いします。振込み手数料は御社負担にてお願いします。
お客様の御支払い条件が60日以上の場合は御相談ください。
尚、初めてのお取引先や個人の場合、前払いをお願いすることもあります。ご了承のほど、お願いします。
データリソース社はどのような会社ですか?
当社は、世界各国の主要調査会社・レポート出版社と提携し、世界各国の市場調査レポートや技術動向レポートなどを日本国内の企業・公官庁及び教育研究機関に提供しております。
世界各国の「市場・技術・法規制などの」実情を調査・収集される時には、データリソース社にご相談ください。
お客様の御要望にあったデータや情報を抽出する為のレポート紹介や調査のアドバイスも致します。
|
|

