希少疾病用医薬品市場レポート:2023-2033
Orphan Drugs Market Report 2023-2033
レポート詳細
希少疾病用医薬品市場レポート 2023-2033 : 本レポートは、業界とその基礎となるダイナミクスをより深く理解したいと願う、新たな収益ポケットを目指す大手企業にとって貴重なものとな... もっと見る
※上記価格は部署ライセンス(Departmental licence)価格です。
その他の価格についてはデータリソースまでお問合せください。
日本語のページは自動翻訳を利用し作成しています。
実際のレポートは英文のみでご納品いたします。
サマリー
レポート詳細
希少疾病用医薬品市場レポート 2023-2033: 本レポートは、業界とその基礎となるダイナミクスをより深く理解したいと願う、新たな収益ポケットを目指す大手企業にとって貴重なものとなるでしょう。また、異業種への進出や新規地域での既存事業の拡大を目指す企業にとっても有用です。
プレミアム価格と規制優遇措置による高い収益性が業界の成長を促進すると予測
希少疾病用医薬品市場は、複合的な要因によって推進されている。何よりもまず、高い収益性が期待できることが重要な推進力となっている。希少疾病は患者数が限られており、特殊な疾患であるため、製薬企業は希少疾病用医薬品に割高な価格を設定することができ、大きな収益が期待できます。市場独占権の延長、規制当局への手数料の減免、税額控除などの規制上の優遇措置は、希少疾病用医薬品開発への投資意欲をさらに高め、これらの治療法を経済的に実行可能なものにしている。
さらに、希少疾患領域におけるアンメット・メディカル・ニーズへの対応を目指した研究開発活動の活発化が、市場の成長を後押ししている。学術機関、市場関係者、規制当局の連携により、知識の共有が促進され、希少疾病用医薬品の開発が加速しているため、重複した取り組みが削減され、研究成果からの治療への転換が加速しています。
新興国における希少疾患の有病率の上昇と、医療インフラや認知度の向上への取り組みが、大きな成長機会をもたらしています。発展途上国の政府も、インドの希少疾病用医薬品国家政策など好意的な政策を実施しており、希少疾病用医薬品メーカーや市場関係者にとって好都合な環境が整いつつあります。
最後に、迅速な審査や希少疾病用医薬品メーカーへの優遇措置など、規制当局の承認プロセスが合理化されたことで、これらの重要な治療薬への価格と患者のアクセスが向上し、希少疾病用医薬品市場の拡大にさらに拍車がかかっている。
医薬品開発に伴う高コストが業界の成長を阻む可能性が高い
希少疾病用医薬品の開発に伴う高コストは、同市場の成長にとって大きな課題となっている。希少疾患治療薬の開発は、臨床試験に利用できる患者数が限られていること、専門的な研究が必要であること、安全性と有効性を確立するために広範な試験が必要であることなどから、高額な費用がかかることが多い。こうした開発費の高騰は、製薬会社が希少疾病用医薬品の研究開発に投資することを躊躇させる要因となっています。
さらに、希少疾病の患者数が少ないため、希少疾病用医薬品からの潜在的な収益は限られており、多額の開発費を回収することは困難です。このような経済的なハードルは、特に、より経済的な見返りの大きい主流医薬品の開発にリソースを割くことができる企業にとって、希少疾病用医薬品プロジェクトを進める意欲を削ぐ要因となります。
この問題に対処するため、規制当局は希少疾病用医薬品の開発をより経済的に魅力的なものにするため、市場独占権の延長や規制当局への手数料の減額といったインセンティブを導入している。それにもかかわらず、高額な初期費用は、希少疾病用医薬品市場の成長を妨げ、希少疾病のために切望されている治療法の開発を妨げる大きな障壁となっている。
市場調査レポートを購入する前にすべき質問とは?
- 希少疾病用医薬品市場はどのように進化しているのか?
- 希少疾病用医薬品市場の促進要因と阻害要因は何か?
- 希少疾病用医薬品の各サブマーケットセグメントは予測期間中にどのように成長し、2033年にはどれくらいの売上を占めるようになるのか?
- 2023年から2033年にかけて、希少疾病用医薬品の各サブマーケットの市場シェアはどのように推移するのか?
- 2023年から2033年にかけて、市場全体を牽引する主な要因は何か?
- 希少疾病用医薬品の主要市場はマクロ経済の動きに概ね追随するのか、それとも個々の国市場が他を凌駕するのか?
- 2033年までに各国市場のシェアはどのように変化し、2033年に市場をリードするのはどの地域か?
- 主要プレーヤーと予測期間中の見通しは?
- これら大手企業の希少疾病用医薬品プロジェクトとは?
- 2023年から2033年の間に、業界はどのように発展していくのでしょうか?現在および今後10年間に実施される希少疾病用医薬品プロジェクトにはどのような意味がありますか?
- 希少疾病用医薬品市場をさらに拡大するために、製品化の必要性は高まっていますか?
- 希少疾病用医薬品市場はどこへ向かっているのか、そしてどのようにすれば市場の最前線に立てるのか?
- 新製品やサービスラインへの最適な投資方法とは?
- 企業を新たな成長軌道に乗せ、C-suiteに移行させるための重要な展望とは?
このことが希少疾病用医薬品市場に現在、そして今後10年間でどのような影響を与えるかを見極める必要がある:
- 262ページにわたる本レポートは、96の表と143の図表で構成されています。
- 本レポートでは、業界における主要な有利分野を取り上げているため、今すぐターゲットを絞ることができます。
- 世界、地域、国の売上と成長に関する詳細な分析が含まれています。
- 競合他社が成功した主なトレンド、変化、収益予測をハイライトしています。
本レポートは、希少疾病用医薬品市場が今後10年間でどのように発展していくのか、またCOVID-19の景気後退と好転の変動に合わせてどのように変化していくのかをお伝えします。この市場は、過去10年間のどの時点よりも今が重要です。
2033年までの予測やその他の分析から、商業的な展望が明らかになる
- 2033年までの収益予測に加え、直近の業績、成長率、市場シェアもご覧いただけます。
- ビジネスの展望と展開に関する独自の分析をご覧いただけます。
- 質的分析(市場ダイナミクス、促進要因、機会、阻害要因、課題など)、コスト構造、希少疾病用医薬品価格上昇の影響、最新動向をご覧いただけます。
本レポートには、COVID-19が業界と貴社にどのような影響を与えるかについてのデータ分析と貴重な洞察が含まれている。本レポートでは、COVID-19の4つの回収パターンとその影響、すなわち「V」、「L」、「W」、「U」について論じている。
レポート対象セグメント
治療領域
- 癌
- 神経疾患
- 心血管疾患
- 血液疾患
- 感染症
- 代謝性疾患
- その他
薬剤タイプ
- 生物製剤
- バイオシミラー
- その他
世界市場全体と各分野の収益予測に加え、5つの地域と24の主要国市場の収益予測も掲載している:
北米
- アメリカ
- カナダ
欧州
- ドイツ
- 英国
- フランス
- スペイン
- イタリア
- ロシア
- その他の欧州
アジア太平洋
- 中国
- 日本
- インド
- オーストラリア
- 韓国
- シンガポール
- その他のアジア太平洋地域
ラテンアメリカ
- ブラジル
- メキシコ
- アルゼンチン
- コロンビア
- その他のラテンアメリカ
MEA
- GCC
- 南アフリカ
- その他のMEA
また、本レポートでは、2023年から2033年にかけての希少疾病用医薬品市場における主要企業のプロファイルと、これらの企業の事業のこのセグメントに焦点を当てたいくつかの企業についても掲載している。
主要企業と市場成長の可能性
・ AbbVie Inc.
・ AstraZeneca
・ Biogen
・ Bristol-Myers Squibb Company
・ F. Hoffmann-La Roche Ltd.
・ GSK plc
・ Johnson & Johnson Services, Inc.
・ Merck & Co., Inc.
・ Novartis AG
・ Pfizer Inc.
・ Sanofi
・ Vertex Pharmaceuticals Incorporated
2023年から2033年までの希少疾病用医薬品市場全体の世界売上高(金額ベース)は、2023年に1870億米ドルを突破する。2033年まで売上は力強く成長すると予測。当社の調査では、最も大きな可能性を秘めた企業を特定しています。各社の能力、進捗状況、商業的見通しを把握し、一歩先を行くための一助としてください。
希少疾病用医薬品市場、2023-2033年レポートはどのようにお役に立ちますか?
まとめると、250ページを超えるこのレポートは、以下のような知識を提供する:
- 希少疾病用医薬品市場の2023年〜2033年までの収益予測 - 治療分野、医薬品タイプ、ブランド別に世界および地域レベルで予測 - 業界の将来性を発見し、投資と収益に最も有利な場所を見つけることができます。
- 5つの地域と24の主要国市場の2033年までの収益予測 - 北米、欧州、アジア太平洋、中南米、MEAの希少医薬品市場2023年から2033年までの予測をご覧ください。また、米国、カナダ、メキシコ、ブラジル、ドイツ、フランス、英国、イタリア、中国、インド、日本、オーストラリアなどの主要国の市場も予測しています。
- 既存企業および市場参入を目指す企業の展望 - 希少疾病用医薬品市場に関わる主要企業12社の企業プロファイルを含む、2023年から2033年までの市場。
独自の予測による定量的・定性的分析をご覧ください。私たちのレポートだけに含まれる情報を入手し、貴重なビジネスインテリジェンスで情報を入手しましょう。
他では得られない情報
私たちの新しいレポートがあれば、知識に遅れをとったり、チャンスを逃したりする可能性が低くなります。Visiongainの調査レポートが貴社の調査、分析、意思決定にどのように役立つかをご覧ください。Visiongainのこの調査レポートは、希少疾病用医薬品市場(2023年〜2033年)の商業分析を必要とする全ての方、市場をリードする企業の方々を対象としています。データ、トレンド、予測をご覧いただけます。
ページTOPに戻る
目次
目次
1 レポート概要
1.1 研究の目的
1.2 希少疾病用医薬品市場の紹介
1.3 本レポートの内容
1.4 本レポートを読むべき理由
1.5 本分析レポートが回答する主な質問
1.6 本レポートの対象者
1.7 方法論
1.7.1 市場の定義
1.7.2 市場評価・予測手法
1.7.3 データの検証
1.7.3.1 一次調査
1.7.3.2 セカンダリーリサーチ
1.8 よくある質問(FAQ)
1.9 Visiongainの関連レポート
1.10 Visiongainについて
2 エグゼクティブ・サマリー
3 市場概要
3.1 主要な調査結果
3.2 市場ダイナミクス
3.2.1 市場促進要因
3.2.1.1 希少疾病用医薬品の市場独占性
3.2.1.2 政府の好意的な政策
3.2.1.3 新規治療薬開発におけるR&D活動の活発化
3.2.2 市場抑制要因
3.2.2.1 医薬品開発に伴う高コスト
3.2.2.2 主要製品の独占販売権の失効
3.2.3 市場機会
3.2.3.1 新興国における高い成長の可能性
3.2.3.2 希少疾病用医薬品の新規適応症への使用
3.3 COVID-19の影響分析
3.4 ポーターのファイブフォース分析
3.4.1 サプライヤーの交渉力
3.4.2 買い手の交渉力
3.4.3 競争上のライバル関係
3.4.4 代替品による脅威
3.4.5 新規参入企業の脅威
3.5 PEST分析
4 希少疾病用医薬品市場分析治:療領域別
4.1 主な調査結果
4.2 治療領域セグメント 市場魅力度指数
4.3 治療領域別希少疾病用医薬品市場規模の推定と予測
4.4 癌
4.4.1 2023〜2033年の地域別市場規模(US$ Billion)
4.4.2 地域別市場シェア、2023年・2033年(%)
4.5 神経疾患
4.5.1 2023〜2033年の地域別市場規模(US$ Billion)
4.5.2 地域別市場シェア、2023年・2033年(%)
4.6 循環器疾患
4.6.1 2023〜2033年の地域別市場規模(US$ Billion)
4.6.2 地域別市場シェア、2023年・2033年(%)
4.7 血液疾患
4.7.1 2023〜2033年の地域別市場規模(US$ Billion)
4.7.2 地域別市場シェア、2023年・2033年(%)
4.8 感染症
4.8.1 2023〜2033年の地域別市場規模(US$ Billion)
4.8.2 地域別市場シェア、2023年・2033年(%)
4.9 代謝性疾患
4.9.1 2023〜2033年の地域別市場規模(US$ Billion)
4.9.2 地域別市場シェア、2023年・2033年(%)
4.10 その他
4.10.1 2023〜2033年の地域別市場規模(US$ Billion)
4.10.2 地域別市場シェア、2023年・2033年(%)
5 希少疾病用医薬品市場分析:薬剤タイプ別
5.1 主な調査結果
5.2 薬剤タイプ別セグメント 市場魅力度指数
5.3 薬剤タイプ別希少疾病用医薬品市場規模の推定と予測
5.4 生物製剤
5.4.1 2023〜2033年の地域別市場規模(US$ Billion)
5.4.2 地域別市場シェア、2023年・2033年(%)
5.5 バイオシミラー
5.5.1 2023〜2033年の地域別市場規模(US$ Billion)
5.5.2 地域別市場シェア、2023年・2033年(%)
5.6 その他
5.6.1 2023〜2033年の地域別市場規模(US$ Billion)
5.6.2 地域別市場シェア、2023年・2033年(%)
6 希少疾病用医薬品市場分析:トップ10ブランド
6.1 主要調査結果
6.2 トップ10ブランド希少疾病用医薬品市場規模推定と予測
7 希少疾病用医薬品市場分析:地域別
7.1 主要調査結果
7.2 地域別市場規模の推定と予測
8 北米の希少疾病用医薬品市場分析
8.1 主要な調査結果
8.2 北米の希少疾病用医薬品市場魅力度指数
8.3 北米の希少疾病用医薬品国別市場、2023年、2028年、2033年(US$ Billion)
8.4 北米の希少疾病用医薬品市場規模推定と予測:国別
8.5 北米の希少疾病用医薬品市場規模推定と予測:治療領域別
8.6 北米の希少疾病用医薬品市場規模推定と予測:薬剤タイプ別
8.7 米国の希少疾病用医薬品市場分析
8.8 カナダの希少疾病用医薬品市場分析
9 欧州の希少疾病用医薬品の市場分析
9.1 主要な調査結果
9.2 欧州の希少疾病用医薬品市場魅力度指数
9.3 欧州の希少疾病用医薬品の国別市場、2023年、2028年、2033年(US$ Billion)
9.4 欧州の希少疾病用医薬品市場規模推定と予測:国別
9.5 欧州の希少疾病用医薬品市場規模推定と予測:治療領域別
9.6 欧州の希少疾病用医薬品市場規模推定と予測:薬剤タイプ別
9.7 ドイツの希少疾病用医薬品市場分析
9.8 フランスの希少疾病用医薬品市場分析
9.9 イギリスの希少疾病用医薬品市場分析
9.10 イタリアの希少疾病用医薬品市場分析
9.11 スペインの希少疾病用医薬品市場分析
9.12 ロシアの希少疾病用医薬品市場分析
9.13 その他の欧州の希少疾病用医薬品市場分析
10 アジア太平洋地域の希少疾病用医薬品市場分析
10.1 主要な調査結果
10.2 アジア太平洋地域の希少疾病用医薬品市場魅力度指数
10.3 アジア太平洋地域の希少疾病用医薬品国別市場規模、2023年、2028年、2033年(US$ Billion)
10.4 アジア太平洋地域の希少疾病用医薬品市場規模推定と予測:国別
10.5 アジア太平洋地域の希少疾病用医薬品市場規模推定と予測:治療領域別
10.6 アジア太平洋地域の希少疾病用医薬品市場規模推定と予測:薬剤タイプ別
10.7 日本の希少疾病用医薬品市場分析
10.8 中国の希少疾病用医薬品市場分析
10.9 インドの希少疾病用医薬品市場分析
10.10 オーストラリアの希少疾病用医薬品市場分析
10.11 韓国の希少疾病用医薬品市場分析
10.12 シンガポールの希少疾病用医薬品市場分析
10.13 その他のアジア太平洋地域の希少疾病用医薬品市場分析
11 ラテンアメリカの希少疾病用医薬品の市場分析
11.1 主要な調査結果
11.2 ラテンアメリカの希少疾病用医薬品市場魅力度指数
11.3 ラテンアメリカの希少疾病用医薬品国別市場、2023年、2028年、2033年(US$ Billion)
11.4 ラテンアメリカの希少疾病用医薬品市場規模推定と予測:国別
11.5 ラテンアメリカの希少疾病用医薬品市場規模推定と予測:治療領域別
11.6 ラテンアメリカの希少疾病用医薬品市場規模推定と予測:薬剤タイプ別
11.7 ブラジルの希少疾病用医薬品市場分析
11.8 メキシコの希少疾病用医薬品市場分析
11.9 アルゼンチンの希少疾病用医薬品市場分析
11.10 コロンビアの希少疾病用医薬品市場分析
11.11 その他のラテンアメリカの希少疾病用医薬品市場分析
12 MEAの希少疾病用医薬品市場分析
12.1 主要な調査結果
12.2 MEAの希少疾病用医薬品市場魅力度指数
12.3 MEAの希少疾病用医薬品国別市場規模、2023年、2028年、2033年(US$ Billion)
12.4 MEAの希少疾病用医薬品市場規模推定と予測:国別
12.5 MEAの希少疾病用医薬品市場規模推定と予測:治療分野別
12.6 MEAの希少疾病用医薬品市場規模推定と予測:薬剤タイプ別
12.7 GCCの希少疾病用医薬品市場分析
12.8 南アフリカの希少疾病用医薬品市場分析
12.9 その他のMEA希少疾病用医薬品市場分析
13 企業のプロフィール
13.1 競争環境、2022年
13.2 戦略的展望
13.3 Merck & Co., Inc.
13.3.1 会社概要
13.3.2 会社概要
13.3.3 財務分析
13.3.3.1 純収入、2017-2022年
13.3.3.2 売上高、2017-2022年
13.3.3.3 地域市場シェア、2022年
13.3.4 製品ベンチマーク
13.3.5 戦略的展望
13.4 AbbVie Inc.
13.4.1 会社概要
13.4.2 会社概要
13.4.3 財務分析
13.4.3.1 純収入、2017-2022年
13.4.3.2 R&D、2017-2022年
13.4.3.3 地域市場シェア、2022年
13.4.4 製品ベンチマーク
13.4.5 戦略的展望
13.5 Vertex Pharmaceuticals Incorporated
13.5.1 会社概要
13.5.2 会社概要
13.5.3 財務分析
13.5.3.1 純収入、2017-2022年
13.5.3.2 R&D、2017年〜2022年
13.5.3.3 地域市場シェア、2022年
13.5.4 製品ベンチマーク
13.5.5 戦略的展望
13.6 Pfizer Inc.
13.6.1 会社概要
13.6.2 会社概要
13.6.3 財務分析
13.6.3.1 純収入、2017-2022年
13.6.3.2 R&D、2017-2022年
13.6.3.3 地域市場シェア、2022年
13.6.4 製品ベンチマーク
13.6.5 戦略的展望
13.7 Bristol-Myers Squibb Company
13.7.1 会社概要
13.7.2 会社概要
13.7.3 財務分析
13.7.3.1 純収入、2017-2022年
13.7.3.2 R&D、2017年~2022年
13.7.3.3 地域市場シェア、2022年
13.7.4 製品ベンチマーク
13.7.5 戦略的展望
13.8 AstraZeneca
13.8.1 会社概要
13.8.2 会社概要
13.8.3 財務分析
13.8.3.1 純収入、2017-2022年
13.8.3.2 R&D、2017年〜2022年
13.8.3.3 地域市場シェア、2022年
13.8.4 製品ベンチマーク
13.8.5 戦略的展望
13.9 Johnson & Johnson Services, Inc.
13.9.1 会社概要
13.9.2 会社概要
13.9.3 財務分析
13.9.3.1 純収入2017-2022年
13.9.3.2 売上高、2017-2022年
13.9.3.3 地域市場シェア、2022年
13.9.4 製品ベンチマーク
13.9.5 戦略的展望
13.10 F.ホフマン・ラ・ロシュ社
13.10.1 会社概要
13.10.2 会社概要
13.10.3 財務分析
13.10.3.1 純収入、2017-2022年
13.10.3.2 R&D、2017年〜2022年
13.10.3.3 地域市場シェア、2022年
13.10.4 製品ベンチマーク
13.10.5 戦略的展望
13.11 ノバルティスAG
13.11.1 会社概要
13.11.2 会社概要
13.11.3 財務分析
13.11.3.1 純収入、2017-2022年
13.11.3.2 R&D、2017-2022年
13.11.3.3 地域市場シェア、2022年
13.11.4 製品ベンチマーク
13.11.5 戦略的展望
13.12 バイオジェン
13.12.1 会社概要
13.12.2 会社概要
13.12.3 財務分析
13.12.3.1 純収入、2017-2022年
13.12.3.2 R&D、2017-2022年
13.12.3.3 地域市場シェア、2022年
13.12.4 製品ベンチマーク
13.12.5 戦略的展望
13.13 GSK plc
13.13.1 会社概要
13.13.2 会社概要
13.13.3 財務分析
13.13.3.1 純収入、2017-2022年
13.13.3.2 売上高、2017-2022年
13.13.3.3 地域市場シェア、2022年
13.13.4 製品ベンチマーク
13.13.5 戦略的展望
13.14 Sanofi
13.14.1 会社概要
13.14.2 会社概要
13.14.3 財務分析
13.14.3.1 純収入、2017-2022年
13.14.3.2 R&D、2017-2022年
13.14.3.3 地域市場シェア、2022年
13.14.4 製品ベンチマーク
13.14.5 戦略的展望
14 結論と提言
14.1 Visiongainからの結びの言葉
14.2 市場プレイヤーへの提言
ページTOPに戻る
図表リスト
表の一覧
Table 1 Orphan Drugs Market Snapshot, 2024 & 2034 (US$ Billion, CAGR %)
Table 2 Capital Raised by Rare Disease Therapeutics Companies to Date in 2021 (US$ Million)
Table 3 Orphan Drugs Market, by Region, 2023-2033 (US$ Billion, AGR%, CAGR%): "V" Shaped Recovery
Table 4 Orphan Drugs Market, by Region, 2023-2033 (US$ Billion, AGR%, CAGR%): "U" Shaped Recovery
Table 5 Orphan Drugs Market, by Region, 2023-2033 (US$ Billion, AGR%, CAGR%): "W" Shaped Recovery
Table 6 Orphan Drugs Market, by Region, 2023-2033 (US$ Billion, AGR%, CAGR%): "L" Shaped Recovery
Table 7 Orphan Drugs Market Forecast by Therapeutic Area, 2023-2033 (US$ Billion, AGR%, CAGR%)
Table 8 Oncology Segment Market Forecast by Region, 2023-2033 (US$ Billion, AGR%, CAGR%)
Table 9 Neurological Diseases Segment Market Forecast by Region, 2023-2033 (US$ Billion, AGR%, CAGR%)
Table 10 Cardiovascular Diseases Segment Market Forecast by Region, 2023-2033 (US$ Billion, AGR%, CAGR%)
Table 11 Hematologic Disorders Segment Market Forecast by Region, 2023-2033 (US$ Billion, AGR%, CAGR%)
Table 12 Infectious Diseases Segment Market Forecast by Region, 2023-2033 (US$ Billion, AGR%, CAGR%)
Table 13 Metabolic Diseases Segment Market Forecast by Region, 2023-2033 (US$ Billion, AGR%, CAGR%)
Table 14 Others Segment Market Forecast by Region, 2023-2033 (US$ Billion, AGR%, CAGR%)
Table 15 Orphan Drugs Market Forecast by Drug Type, 2023-2033 (US$ Billion, AGR%, CAGR%)
Table 16 Biologics Segment Market Forecast by Region, 2023-2033 (US$ Billion, AGR%, CAGR%)
Table 17 Biosimilar Segment Market Forecast by Region, 2023-2033 (US$ Billion, AGR%, CAGR%)
Table 18 Others Segment Market Forecast by Region, 2023-2033 (US$ Billion, AGR%, CAGR%)
Table 19 Orphan Drugs Market, by Top 10 Brands, 2023-2033 (US$ Billion, AGR%, CAGR%)
Table 20 Orphan Drugs Market Forecast by Region, 2023-2033 (US$ Billion, AGR%, CAGR%)
Table 21 North America Orphan Drugs Market Forecast by Country, 2023-2033 (US$ Billion, AGR%, CAGR%)
Table 22 North America Orphan Drugs Market Forecast by Therapeutic Area, 2023-2033 (US$ Billion, AGR%, CAGR%)
Table 23 North America Orphan Drugs Market Forecast by Drug Type, 2023-2033 (US$ Billion, AGR%, CAGR%)
Table 24 U.S Orphan Drugs Market Forecast, 2023-2033 (US$ Billion, AGR%, CAGR%)
Table 25 Canada Orphan Drugs Market Forecast, 2023-2033 (US$ Billion, AGR%, CAGR%)
Table 26 Europe Orphan Drugs Market Forecast by Country, 2023-2033 (US$ Billion, AGR%, CAGR%)
Table 27 Europe Orphan Drugs Market Forecast by Therapeutic Area, 2023-2033 (US$ Billion, AGR%, CAGR%)
Table 28 Europe Orphan Drugs Market Forecast by Drug Type, 2023-2033 (US$ Billion, AGR%, CAGR%)
Table 29 Germany Orphan Drugs Market Forecast, 2023-2033 (US$ Billion, AGR%, CAGR%)
Table 30 France Orphan Drugs Market Forecast, 2023-2033 (US$ Billion, AGR%, CAGR%)
Table 31 UK Orphan Drugs Market Forecast, 2023-2033 (US$ Billion, AGR%, CAGR%)
Table 32 Italy Orphan Drugs Market Forecast, 2023-2033 (US$ Billion, AGR%, CAGR%)
Table 33 Spain Orphan Drugs Market Forecast, 2023-2033 (US$ Billion, AGR%, CAGR%)
Table 34 Russia Orphan Drugs Market Forecast, 2023-2033 (US$ Billion, AGR%, CAGR%)
Table 35 Rest of Europe Orphan Drugs Market Forecast, 2023-2033 (US$ Billion, AGR%, CAGR%)
Table 36 Asia Pacific Orphan Drugs Market Forecast by Country, 2023-2033 (US$ Billion, AGR%, CAGR%)
Table 37 Asia Pacific Orphan Drugs Market Forecast by Therapeutic Area, 2023-2033 (US$ Billion, AGR%, CAGR%)
Table 38 Asia Pacific Orphan Drugs Market Forecast by Drug Type, 2023-2033 (US$ Billion, AGR%, CAGR%)
Table 39 Japan Orphan Drugs Market Forecast, 2023-2033 (US$ Billion, AGR%, CAGR%)
Table 40 China Orphan Drugs Market Forecast, 2023-2033 (US$ Billion, AGR%, CAGR%)
Table 41 India Orphan Drugs Market Forecast, 2023-2033 (US$ Billion, AGR%, CAGR%)
Table 42 Australia Orphan Drugs Market Forecast, 2023-2033 (US$ Billion, AGR%, CAGR%)
Table 43 South Korea Orphan Drugs Market Forecast, 2023-2033 (US$ Billion, AGR%, CAGR%)
Table 44 Singapore Orphan Drugs Market Forecast, 2023-2033 (US$ Billion, AGR%, CAGR%)
Table 45 Rest of Asia Pacific Orphan Drugs Market Forecast, 2023-2033 (US$ Billion, AGR%, CAGR%)
Table 46 Latin America Orphan Drugs Market Forecast by Country, 2023-2033 (US$ Billion, AGR%, CAGR%)
Table 47 Latin America Orphan Drugs Market Forecast by Therapeutic Area, 2023-2033 (US$ Billion, AGR%, CAGR%)
Table 48 Latin America Orphan Drugs Market Forecast by Drug Type, 2023-2033 (US$ Billion, AGR%, CAGR%)
Table 49 Brazil Orphan Drugs Market Forecast, 2023-2033 (US$ Billion, AGR%, CAGR%)
Table 50 Mexico Orphan Drugs Market Forecast, 2023-2033 (US$ Billion, AGR%, CAGR%)
Table 51 Argentina Orphan Drugs Market Forecast, 2023-2033 (US$ Billion, AGR%, CAGR%)
Table 52 Colombia Orphan Drugs Market Forecast, 2023-2033 (US$ Billion, AGR%, CAGR%)
Table 53 Rest of Latin America Orphan Drugs Market Forecast, 2023-2033 (US$ Billion, AGR%, CAGR%)
Table 54 MEA Orphan Drugs Market Forecast by Country, 2023-2033 (US$ Billion, AGR%, CAGR%)
Table 55 MEA Orphan Drugs Market Forecast by Therapeutic Area, 2023-2033 (US$ Billion, AGR%, CAGR%)
Table 56 MEA Orphan Drugs Market Forecast by Drug Type, 2023-2033 (US$ Billion, AGR%, CAGR%)
Table 57 GCC Orphan Drugs Market Forecast, 2023-2033 (US$ Billion, AGR%, CAGR%)
Table 58 South Africa Orphan Drugs Market Forecast, 2023-2033 (US$ Billion, AGR%, CAGR%)
Table 59 Rest of MEA Orphan Drugs Market Forecast, 2023-2033 (US$ Billion, AGR%, CAGR%)
Table 60 Strategic Outlook
Table 61 Merck & Co., Inc.: Key Details, (CEO, HQ, Revenue, Founded, No. of Employees, Company Type, Website, Business Segment)
Table 62 Merck & Co., Inc.: Product Benchmarking
Table 63 Merck & Co., Inc.: Strategic Outlook
Table 64 AbbVie Inc.: Key Details, (CEO, HQ, Revenue, Founded, No. of Employees, Company Type, Website, Business Segment)
Table 65 AbbVie Inc.: Product Benchmarking
Table 66 AbbVie Inc.: Strategic Outlook
Table 67 Vertex Pharmaceuticals Incorporated: Key Details, (CEO, HQ, Revenue, Founded, No. of Employees, Company Type, Website, Business Segment)
Table 68 Vertex Pharmaceuticals Incorporated: Product Benchmarking
Table 69 Vertex Pharmaceuticals Incorporated: Strategic Outlook
Table 70 Pfizer Inc.: Key Details, (CEO, HQ, Revenue, Founded, No. of Employees, Company Type, Website, Business Segment)
Table 71 Pfizer Inc.: Product Benchmarking
Table 72 Pfizer Inc.: Strategic Outlook
Table 73 Bristol-Myers Squibb Company: Key Details, (CEO, HQ, Revenue, Founded, No. of Employees, Company Type, Website, Business Segment)
Table 74 Bristol-Myers Squibb Company: Product Benchmarking
Table 75 Bristol-Myers Squibb Company: Strategic Outlook
Table 76 AstraZeneca: Key Details, (CEO, HQ, Revenue, Founded, No. of Employees, Company Type, Website, Business Segment)
Table 77 AstraZeneca: Product Benchmarking
Table 78 AstraZeneca: Strategic Outlook
Table 79 Johnson & Johnson Services, Inc.: Key Details, (CEO, HQ, Revenue, Founded, No. of Employees, Company Type, Website, Business Segment)
Table 80 Johnson & Johnson Services, Inc.: Product Benchmarking
Table 81 Johnson & Johnson Services, Inc.: Strategic Outlook
Table 82 F. Hoffmann-La Roche Ltd.: Key Details, (CEO, HQ, Revenue, Founded, No. of Employees, Company Type, Website, Business Segment)
Table 83 F. Hoffmann-La Roche Ltd.: Product Benchmarking
Table 84 F. Hoffmann-La Roche Ltd.: Strategic Outlook
Table 85 Novartis AG: Key Details, (CEO, HQ, Revenue, Founded, No. of Employees, Company Type, Website, Business Segment)
Table 86 Novartis AG: Product Benchmarking
Table 87 Novartis AG: Strategic Outlook
Table 88 Biogen: Key Details, (CEO, HQ, Revenue, Founded, No. of Employees, Company Type, Website, Business Segment)
Table 89 Biogen: Product Benchmarking
Table 90 Biogen: Strategic Outlook
Table 91 GSK plc: Key Details, (CEO, HQ, Revenue, Founded, No. of Employees, Company Type, Website, Business Segment)
Table 92 GSK plc: Product Benchmarking
Table 93 GSK plc: Strategic Outlook
Table 94 Sanofi: Key Details, (CEO, HQ, Revenue, Founded, No. of Employees, Company Type, Website, Business Segment)
Table 95 Sanofi: Product Benchmarking
Table 96 Sanofi: Strategic Outlook
図の一覧
Figure 1 Orphan Drugs Market Segmentation
Figure 2 Orphan Drugs Market by Therapeutic Area: Market Attractiveness Index
Figure 3 Orphan Drugs Market by Drug Type: Market Attractiveness Index
Figure 4 Orphan Drugs Market by Brand: Market Attractiveness Index
Figure 5 Orphan Drugs Market Attractiveness Index by Region
Figure 6 Orphan Drugs Market: Market Dynamics
Figure 7 Orphan Drugs Market by Region, 2023-2033 (US$ Billion, AGR %): “V” Shaped Recovery
Figure 8 Orphan Drugs Market by Region, 2023-2033 (US$ Billion, AGR %): “U” Shaped Recovery
Figure 9 Orphan Drugs Market by Region, 2023-2033 (US$ Billion, AGR %): “W” Shaped Recovery
Figure 10 Orphan Drugs Market by Region, 2023-2033 (US$ Billion, AGR %): “L” Shaped Recovery
Figure 11 Orphan Drugs Market: Porter’s Five Forces Analysis
Figure 12 Orphan Drugs Market: PEST Analysis
Figure 13 Orphan Drugs Market by Therapeutic Area: Market Attractiveness Index
Figure 14 Orphan Drugs Market Forecast by Therapeutic Area, 2023-2033 (US$ Billion, AGR %)
Figure 15 Orphan Drugs Market Share Forecast by Therapeutic Area, 2023, 2028, 2033 (%)
Figure 16 Oncology Segment Market Forecast by Region, 2023-2033 (US$ Billion, AGR %)
Figure 17 Oncology Segment Market Share Forecast by Region, 2023 & 2033 (%)
Figure 18 Neurological Diseases Segment Market Forecast by Region, 2023-2033 (US$ Billion, AGR %)
Figure 19 Neurological Diseases Segment Market Share Forecast by Region, 2023 & 2033 (%)
Figure 20 Cardiovascular Diseases Segment Market Forecast by Region, 2023-2033 (US$ Billion, AGR %)
Figure 21 Cardiovascular Diseases Segment Market Share Forecast by Region, 2023 & 2033 (%)
Figure 22 Hematologic Disorders Segment Market Forecast by Region, 2023-2033 (US$ Billion, AGR %)
Figure 23 Hematologic Disorders Segment Market Share Forecast by Region, 2023 & 2033 (%)
Figure 24 Infectious Diseases Segment Market Forecast by Region, 2023-2033 (US$ Billion, AGR %)
Figure 25 Infectious Diseases Segment Market Share Forecast by Region, 2023 & 2033 (%)
Figure 26 Metabolic Diseases Segment Market Forecast by Region, 2023-2033 (US$ Billion, AGR %)
Figure 27 Metabolic Diseases Segment Market Share Forecast by Region, 2023 & 2033 (%)
Figure 28 Others Segment Market Forecast by Region, 2023-2033 (US$ Billion, AGR %)
Figure 29 Others Segment Market Share Forecast by Region, 2023 & 2033 (%)
Figure 30 Orphan Drugs Market by Drug Type: Market Attractiveness Index
Figure 31 Orphan Drugs Market Forecast by Drug Type, 2023-2033 (US$ Billion, AGR %)
Figure 32 Orphan Drugs Market Share Forecast by Drug Type, 2023, 2028, 2033 (%)
Figure 33 Biologics Segment Market Forecast by Region, 2023-2033 (US$ Billion, AGR %)
Figure 34 Biologics Segment Market Share Forecast by Region, 2023 & 2033 (%)
Figure 35 Biosimilar Segment Market Forecast by Region, 2023-2033 (US$ Billion, AGR %)
Figure 36 Biosimilar Segment Market Share Forecast by Region, 2023 & 2033 (%)
Figure 37 Others Segment Market Forecast by Region, 2023-2033 (US$ Billion, AGR %)
Figure 38 Others Segment Market Share Forecast by Region, 2023 & 2033 (%)
Figure 39 Orphan Drugs Market Forecast by Top 10 brands, 2023-2033 (US$ Billion, AGR %)
Figure 40 Orphan Drugs Market Forecast by Region 2023 and 2033 (Revenue, CAGR%)
Figure 41 Orphan Drugs Market Share Forecast by Region 2023, 2028, 2033 (%)
Figure 42 Orphan Drugs Market by Region, 2023-2033 (US$ Billion, AGR %)
Figure 43 North America Orphan Drugs Market Attractiveness Index
Figure 44 North America Orphan Drugs Market by Region, 2023, 2028 & 2033 (US$ Billion)
Figure 45 North America Orphan Drugs Market Forecast by Country, 2023-2033 (US$ Billion, AGR %)
Figure 46 North America Orphan Drugs Market Share Forecast by Country, 2023 & 2033 (%)
Figure 47 North America Orphan Drugs Market Forecast by Therapeutic Area, 2023-2033 (US$ Billion, AGR %)
Figure 48 North America Orphan Drugs Market Share Forecast by Therapeutic Area, 2023 & 2033 (%)
Figure 49 North America Orphan Drugs Market Forecast by Drug Type, 2023-2033 (US$ Billion, AGR %)
Figure 50 North America Orphan Drugs Market Share Forecast by Drug Type, 2023 & 2033 (%)
Figure 51 U.S. Orphan Drugs Market Forecast, 2023-2033 (US$ Billion, AGR %)
Figure 52 Canada Orphan Drugs Market Forecast, 2023-2033 (US$ Billion, AGR %)
Figure 53 Europe Orphan Drugs Market Attractiveness Index
Figure 54 Europe Orphan Drugs Market by Region, 2023, 2028 & 2033 (US$ Billion)
Figure 55 Europe Orphan Drugs Market Forecast by Country, 2023-2033 (US$ Billion, AGR %)
Figure 56 Europe Orphan Drugs Market Share Forecast by Country, 2023 & 2033 (%)
Figure 57 Europe Orphan Drugs Market Forecast by Therapeutic Area, 2023-2033 (US$ Billion, AGR %)
Figure 58 Europe Orphan Drugs Market Share Forecast by Therapeutic Area, 2023 & 2033 (%)
Figure 59 Europe Orphan Drugs Market Forecast by Drug Type, 2023-2033 (US$ Billion, AGR %)
Figure 60 Europe Orphan Drugs Market Share Forecast by Drug Type, 2023 & 2033 (%)
Figure 61 Germany Orphan Drugs Market Forecast, 2023-2033 (US$ Billion, AGR %)
Figure 62 France Orphan Drugs Market Forecast, 2023-2033 (US$ Billion, AGR %)
Figure 63 UK Orphan Drugs Market Forecast, 2023-2033 (US$ Billion, AGR %)
Figure 64 Italy Orphan Drugs Market Forecast, 2023-2033 (US$ Billion, AGR %)
Figure 65 Spain Orphan Drugs Market Forecast, 2023-2033 (US$ Billion, AGR %)
Figure 66 Russia Orphan Drugs Market Forecast, 2023-2033 (US$ Billion, AGR %)
Figure 67 Rest of Europe Orphan Drugs Market Forecast, 2023-2033 (US$ Billion, AGR %)
Figure 68 Asia Pacific Orphan Drugs Market Attractiveness Index
Figure 69 Asia Pacific Orphan Drugs Market by Region, 2023, 2028 & 2033 (US$ Billion)
Figure 70 Asia Pacific Orphan Drugs Market Forecast by Country, 2023-2033 (US$ Billion, AGR %)
Figure 71 Asia Pacific Orphan Drugs Market Share Forecast by Country, 2023 & 2033 (%)
Figure 72 Asia Pacific Orphan Drugs Market Forecast by Therapeutic Area, 2023-2033 (US$ Billion, AGR %)
Figure 73 Asia Pacific Orphan Drugs Market Share Forecast by Therapeutic Area, 2023 & 2033 (%)
Figure 74 Asia Pacific Orphan Drugs Market Forecast by Drug Type, 2023-2033 (US$ Billion, AGR %)
Figure 75 Asia Pacific Orphan Drugs Market Share Forecast by Drug Type, 2023 & 2033 (%)
Figure 76 Japan Orphan Drugs Market Forecast, 2023-2033 (US$ Billion, AGR %)
Figure 77 China Orphan Drugs Market Forecast, 2023-2033 (US$ Billion, AGR %)
Figure 78 India Orphan Drugs Market Forecast, 2023-2033 (US$ Billion, AGR %)
Figure 79 Australia Orphan Drugs Market Forecast, 2023-2033 (US$ Billion, AGR %)
Figure 80 South Korea Orphan Drugs Market Forecast, 2023-2033 (US$ Billion, AGR %)
Figure 81 Singapore Orphan Drugs Market Forecast, 2023-2033 (US$ Billion, AGR %)
Figure 82 Rest of Asia Pacific Orphan Drugs Market Forecast, 2023-2033 (US$ Billion, AGR %)
Figure 83 Latin America Orphan Drugs Market Attractiveness Index
Figure 84 Latin America Orphan Drugs Market by Region, 2023, 2028 & 2033 (US$ Billion)
Figure 85 Latin America Orphan Drugs Market Forecast by Country, 2023-2033 (US$ Billion, AGR %)
Figure 86 Latin America Orphan Drugs Market Share Forecast by Country, 2023 & 2033 (%)
Figure 87 Latin America Orphan Drugs Market Forecast by Therapeutic Area, 2023-2033 (US$ Billion, AGR %)
Figure 88 Latin America Orphan Drugs Market Share Forecast by Therapeutic Area, 2023 & 2033 (%)
Figure 89 Latin America Orphan Drugs Market Forecast by Drug Type, 2023-2033 (US$ Billion, AGR %)
Figure 90 Latin America Orphan Drugs Market Share Forecast by Drug Type, 2023 & 2033 (%)
Figure 91 Brazil Orphan Drugs Market Forecast, 2023-2033 (US$ Billion, AGR %)
Figure 92 Mexico Orphan Drugs Market Forecast, 2023-2033 (US$ Billion, AGR %)
Figure 93 Argentina Orphan Drugs Market Forecast, 2023-2033 (US$ Billion, AGR %)
Figure 94 Colombia Orphan Drugs Market Forecast, 2023-2033 (US$ Billion, AGR %)
Figure 95 Rest of Latin America Orphan Drugs Market Forecast, 2023-2033 (US$ Billion, AGR %)
Figure 96 MEA Orphan Drugs Market Attractiveness Index
Figure 97 MEA Orphan Drugs Market by Region, 2023, 2028 & 2033 (US$ Billion)
Figure 98 MEA Orphan Drugs Market Forecast by Country, 2023-2033 (US$ Billion, AGR %)
Figure 99 MEA Orphan Drugs Market Share Forecast by Country, 2023 & 2033 (%)
Figure 100 MEA Orphan Drugs Market Forecast by Therapeutic Area, 2023-2033 (US$ Billion, AGR %)
Figure 101 MEA Orphan Drugs Market Share Forecast by Therapeutic Area, 2023 & 2033 (%)
Figure 102 MEA Orphan Drugs Market Forecast by Drug Type, 2023-2033 (US$ Billion, AGR %)
Figure 103 MEA Orphan Drugs Market Share Forecast by Drug Type, 2023 & 2033 (%)
Figure 104 GCC Orphan Drugs Market Forecast, 2023-2033 (US$ Billion, AGR %)
Figure 105 South Africa Orphan Drugs Market Forecast, 2023-2033 (US$ Billion, AGR %)
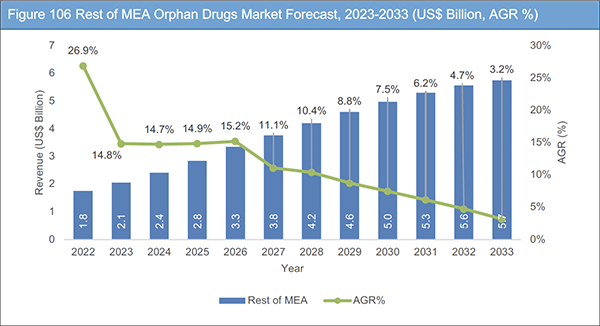
Figure 106 Rest of MEA Orphan Drugs Market Forecast, 2023-2033 (US$ Billion, AGR %)
Figure 107 Orphan Drugs Market: Company Share/Ranking, 2022
Figure 108 Merck & Co., Inc.: Net Revenue, 2017-2022 (US$ Million, AGR%)
Figure 109 Merck & Co., Inc.: R&D, 2017-2022 (US$ Million, AGR%)
Figure 110 Merck & Co., Inc.: Regional Market Shares, 2022
Figure 111 AbbVie Inc.: Net Revenue, 2017-2022 (US$ Million, AGR%)
Figure 112 AbbVie Inc.: R&D, 2017-2022 (US$ Million, AGR%)
Figure 113 AbbVie Inc.: Regional Market Shares, 2022
Figure 114 Vertex Pharmaceuticals Incorporated: Net Revenue, 2017-2022 (US$ Million, AGR%)
Figure 115 Vertex Pharmaceuticals Incorporated: R&D, 2017-2022 (US$ Million, AGR%)
Figure 116 Vertex Pharmaceuticals Incorporated: Regional Market Shares, 2022
Figure 117 Pfizer Inc.: Net Revenue, 2017-2022 (US$ Million, AGR%)
Figure 118 Pfizer Inc.: R&D, 2017-2022 (US$ Million, AGR%)
Figure 119 Pfizer Inc.: Regional Market Shares, 2022
Figure 120 Bristol-Myers Squibb Company: Net Revenue, 2017-2022 (US$ Million, AGR%)
Figure 121 Bristol-Myers Squibb Company: R&D, 2017-2022 (US$ Million, AGR%)
Figure 122 Bristol-Myers Squibb Company: Regional Market Shares, 2022
Figure 123 AstraZeneca: Net Revenue, 2017-2022 (US$ Million, AGR%)
Figure 124 AstraZeneca: R&D, 2017-2022 (US$ Million, AGR%)
Figure 125 AstraZeneca: Regional Market Shares, 2022
Figure 126 Johnson & Johnson Services, Inc.: Net Revenue, 2017-2022 (US$ Million, AGR%)
Figure 127 Johnson & Johnson Services, Inc.: R&D, 2017-2022 (US$ Million, AGR%)
Figure 128 Johnson & Johnson Services, Inc.: Regional Market Shares, 2022
Figure 129 F. Hoffmann-La Roche Ltd.: Net Revenue, 2017-2022 (US$ Million, AGR%)
Figure 130 F. Hoffmann-La Roche Ltd.: R&D, 2017-2022 (US$ Million, AGR%)
Figure 131 F. Hoffmann-La Roche Ltd.: Regional Market Shares, 2022
Figure 132 Novartis AG: Net Revenue, 2017-2022 (US$ Million, AGR%)
Figure 133 Novartis AG: R&D, 2017-2022 (US$ Million, AGR%)
Figure 134 Novartis AG: Regional Market Shares, 2022
Figure 135 Biogen: Net Revenue, 2017-2022 (US$ Million, AGR%)
Figure 136 Biogen: R&D, 2017-2022 (US$ Million, AGR%)
Figure 137 Biogen: Regional Market Shares, 2022
Figure 138 GSK plc: Net Revenue, 2017-2022 (US$ Million, AGR%)
Figure 139 GSK plc: R&D, 2017-2022 (US$ Million, AGR%)
Figure 140 GSK plc: Regional Market Shares, 2022
Figure 141 Sanofi: Net Revenue, 2017-2022 (US$ Million, AGR%)
Figure 142 Sanofi: R&D, 2017-2022 (US$ Million, AGR%)
Figure 143 Sanofi: Regional Market Shares, 2022
ページTOPに戻る
Summary
Report Details
The Orphan Drugs Market Report 2023-2033: This report will prove invaluable to leading firms striving for new revenue pockets if they wish to better understand the industry and its underlying dynamics. It will be useful for companies that would like to expand into different industries or to expand their existing operations in a new region.
High Profitability Due to Premium Pricing and Regulatory Incentives Projected to Spur Industry Growth
The orphan drugs market is being propelled by a combination of factors. First and foremost, the potential for high profitability stands out as a key driver. Due to the limited patient populations and the specialized nature of rare diseases, pharmaceutical companies can price orphan drugs at premium levels, creating a significant revenue potential. Regulatory incentives, such as extended market exclusivity, reduced regulatory fees, and tax credits, further motivate companies to invest in orphan drug development, making these treatments financially viable.
Additionally, increasing research and development efforts aimed at addressing unmet medical needs in the rare disease space are bolstering market growth. Collaborations between academic institutions, market players, and regulatory authorities are fostering knowledge sharing and accelerating orphan drug development, thereby reducing duplication of efforts and expediting treatments’ translation from research findings.
Furthermore, the rising prevalence of rare diseases in emerging economies, coupled with efforts to improve healthcare infrastructure and awareness, has opened up significant growth opportunities. Governments in developing countries are also implementing favourable policies, such as India’s National Policy for Rare Diseases, which is creating a conducive environment for orphan drug manufacturers and market stakeholders.
Lastly, streamlined regulatory approval processes, which include expedited review pathways and incentives for orphan drug manufacturers, enhance affordability and patient access to these critical treatments, further fueling the orphan drugs market’s expansion.
High Cost Associated with Drug Development Likely to Challenge Industry Growth
The high cost associated with orphan drug development poses a significant challenge to the growth of this market. Developing drugs for rare diseases is often an expensive endeavour due to the limited patient populations available for clinical trials, specialized research requirements, and the need for extensive testing to establish safety and efficacy. These elevated development costs can deter pharmaceutical companies from investing in orphan drug research and development.
Additionally, the smaller patient pool for rare diseases means that the potential revenue from orphan drugs is limited, which makes it challenging to recoup the substantial development expenses. This financial hurdle can discourage companies from pursuing orphan drug projects, particularly when they could allocate resources to more financially rewarding mainstream drug development.
To address this issue, regulatory authorities have introduced incentives such as extended market exclusivity and reduced regulatory fees to make orphan drug development more financially attractive. Nonetheless, the high upfront costs remain a substantial barrier that may hamper the growth of the orphan drugs market and hinder the development of much-needed therapies for rare diseases.
What Questions Should You Ask before Buying a Market Research Report?
• How is the Orphan Drugs market evolving?
• What is driving and restraining the Orphan Drugs market?
• How will each Orphan Drugs submarket segment grow over the forecast period and how much revenue will these submarkets account for in 2033?
• How will the market shares for each Orphan Drugs submarket develop from 2023 to 2033?
• What will be the main driver for the overall market from 2023 to 2033?
• Will leading Orphan Drugs markets broadly follow the macroeconomic dynamics, or will individual national markets outperform others?
• How will the market shares of the national markets change by 2033 and which geographical region will lead the market in 2033?
• Who are the leading players and what are their prospects over the forecast period?
• What are the Orphan Drugs projects for these leading companies?
• How will the industry evolve during the period between 2023 and 2033? What are the implications of Orphan Drugs projects taking place now and over the next 10 years?
• Is there a greater need for product commercialisation to further scale the Orphan Drugs market?
• Where is the Orphan Drugs market heading and how can you ensure you are at the forefront of the market?
• What are the best investment options for new product and service lines?
• What are the key prospects for moving companies into a new growth path and C-suite?
You need to discover how this will impact the Orphan Drugs market today, and over the next 10 years:
• Our 262-page report provides 96 tables and 143 charts/graphs exclusively to you.
• The report highlights key lucrative areas in the industry so you can target them – NOW.
• It contains in-depth analysis of global, regional and national sales and growth.
• It highlights for you the key successful trends, changes and revenue projections made by your competitors.
This report tells you TODAY how the Orphan Drugs market will develop in the next 10 years, and in line with the variations in COVID-19 economic recession and bounce. This market is more critical now than at any point over the last 10 years.
Forecasts to 2033 and other analyses reveal commercial prospects
• In addition to revenue forecasting to 2033, our new study provides you with recent results, growth rates, and market shares.
• You will find original analyses, with business outlooks and developments.
• Discover qualitative analyses (including market dynamics, drivers, opportunities, restraints and challenges), cost structure, impact of rising Orphan Drugs prices and recent developments.
This report includes data analysis and invaluable insight into how COVID-19 will affect the industry and your company. Four COVID-19 recovery patterns and their impact, namely, “V”, “L”, “W” and “U” are discussed in this report.
Segments Covered in the Report
Therapeutic Area
• Cancer
• Neurological Diseases
• Cardiovascular Diseases
• Hematologic Disorders
• Infectious Diseases
• Metabolic Diseases
• Others
Drug Type
• Biologics
• Biosimilar
• Others
In addition to the revenue predictions for the overall world market and segments, you will also find revenue forecasts for five regional and 24 leading national markets:
North America
• U.S.
• Canada
Europe
• Germany
• UK
• France
• Spain
• Italy
• Russia
• Rest of Europe
Asia Pacific
• China
• Japan
• India
• Australia
• South Korea
• Singapore
• Rest of Asia Pacific
Latin America
• Brazil
• Mexico
• Argentina
• Colombia
• Rest of Latin America
MEA
• GCC
• South Africa
• Rest of MEA
The report also includes profiles and for some of the leading companies in the Orphan Drugs Market, 2023 to 2033, with a focus on this segment of these companies’ operations.
Leading companies and the potential for market growth
• AbbVie Inc.
• AstraZeneca
• Biogen
• Bristol-Myers Squibb Company
• F. Hoffmann-La Roche Ltd.
• GSK plc
• Johnson & Johnson Services, Inc.
• Merck & Co., Inc.
• Novartis AG
• Pfizer Inc.
• Sanofi
• Vertex Pharmaceuticals Incorporated
Overall world revenue for Orphan Drugs Market, 2023 to 2033 in terms of value the market will surpass US$187 billion in 2023, our work calculates. We predict strong revenue growth through to 2033. Our work identifies which organizations hold the greatest potential. Discover their capabilities, progress, and commercial prospects, helping you stay ahead.
How will the Orphan Drugs Market, 2023 to 2033 report help you?
In summary, our 250+ page report provides you with the following knowledge:
• Revenue forecasts to 2033 for Orphan Drugs Market, 2023 to 2033 Market, with forecasts for therapeutic area, drug type, and brands, each forecast at a global and regional level – discover the industry’s prospects, finding the most lucrative places for investments and revenues.
• Revenue forecasts to 2033 for five regional and 24 key national markets – See forecasts for the Orphan Drugs Market, 2023 to 2033 market in North America, Europe, Asia-Pacific, Latin America, and MEA. Also forecasted is the market in the US, Canada, Mexico, Brazil, Germany, France, UK, Italy, China, India, Japan, and Australia among other prominent economies.
• Prospects for established firms and those seeking to enter the market – including company profiles for 12 of the major companies involved in the Orphan Drugs Market, 2023 to 2033.
Find quantitative and qualitative analyses with independent predictions. Receive information that only our report contains, staying informed with invaluable business intelligence.
Information found nowhere else
With our new report, you are less likely to fall behind in knowledge or miss out on opportunities. See how our work could benefit your research, analyses, and decisions. Visiongain’s study is for everybody needing commercial analyses for the Orphan Drugs Market, 2023 to 2033, market-leading companies. You will find data, trends and predictions.
ページTOPに戻る
Table of Contents
Table of Contents
1 Report Overview
1.1 Objectives of the Study
1.2 Introduction to Orphan Drugs Market
1.3 What This Report Delivers
1.4 Why You Should Read This Report
1.5 Key Questions Answered by This Analytical Report
1.6 Who is This Report for?
1.7 Methodology
1.7.1 Market Definitions
1.7.2 Market Evaluation & Forecasting Methodology
1.7.3 Data Validation
1.7.3.1 Primary Research
1.7.3.2 Secondary Research
1.8 Frequently Asked Questions (FAQs)
1.9 Associated Visiongain Reports
1.10 About Visiongain
2 Executive Summary
3 Market Overview
3.1 Key Findings
3.2 Market Dynamics
3.2.1 Market Driving Factors
3.2.1.1 Market Exclusivity for Orphan Drugs
3.2.1.2 Favourable Government Policies
3.2.1.3 Increasing R&D Activities in the Development of Novel Therapies
3.2.2 Market Restraining Factors
3.2.2.1 High Cost Associated with Drug Development
3.2.2.2 Expiration of Exclusive Marketing Rights for Vital Products
3.2.3 Market Opportunities
3.2.3.1 High Growth Potential in Emerging Economies
3.2.3.2 Use of Orphan Drugs for Novel Indications
3.3 COVID-19 Impact Analysis
3.4 Porter’s Five Forces Analysis
3.4.1 Bargaining Power of Suppliers
3.4.2 Bargaining Power of Buyers
3.4.3 Competitive Rivalry
3.4.4 Threat from Substitutes
3.4.5 Threat of New Entrants
3.5 PEST Analysis
4 Orphan Drugs Market Analysis by Therapeutic Area
4.1 Key Findings
4.2 Therapeutic Area Segment: Market Attractiveness Index
4.3 Orphan Drugs Market Size Estimation and Forecast by Therapeutic Area
4.4 Cancer
4.4.1 Market Size by Region, 2023-2033 (US$ Billion)
4.4.2 Market Share by Region, 2023 & 2033 (%)
4.5 Neurological Diseases
4.5.1 Market Size by Region, 2023-2033 (US$ Billion)
4.5.2 Market Share by Region, 2023 & 2033 (%)
4.6 Cardiovascular Diseases
4.6.1 Market Size by Region, 2023-2033 (US$ Billion)
4.6.2 Market Share by Region, 2023 & 2033 (%)
4.7 Hematologic Disorders
4.7.1 Market Size by Region, 2023-2033 (US$ Billion)
4.7.2 Market Share by Region, 2023 & 2033 (%)
4.8 Infectious Diseases
4.8.1 Market Size by Region, 2023-2033 (US$ Billion)
4.8.2 Market Share by Region, 2023 & 2033 (%)
4.9 Metabolic Diseases
4.9.1 Market Size by Region, 2023-2033 (US$ Billion)
4.9.2 Market Share by Region, 2023 & 2033 (%)
4.10 Others
4.10.1 Market Size by Region, 2023-2033 (US$ Billion)
4.10.2 Market Share by Region, 2023 & 2033 (%)
5 Orphan Drugs Market Analysis by Drug Type
5.1 Key Findings
5.2 Drug Type Segment: Market Attractiveness Index
5.3 Orphan Drugs Market Size Estimation and Forecast by Drug Type
5.4 Biologics
5.4.1 Market Size by Region, 2023-2033 (US$ Billion)
5.4.2 Market Share by Region, 2023 & 2033 (%)
5.5 Biosimilar
5.5.1 Market Size by Region, 2023-2033 (US$ Billion)
5.5.2 Market Share by Region, 2023 & 2033 (%)
5.6 Others
5.6.1 Market Size by Region, 2023-2033 (US$ Billion)
5.6.2 Market Share by Region, 2023 & 2033 (%)
6 Orphan Drugs Market Analysis by Top 10 Brands
6.1 Key Findings
6.2 Orphan Drugs Market Size Estimation and Forecast by Top 10 Brands
7 Orphan Drugs Market Analysis by Region
7.1 Key Findings
7.2 Regional Market Size Estimation and Forecast
8 North America Orphan Drugs Market Analysis
8.1 Key Findings
8.2 North America Orphan Drugs Market Attractiveness Index
8.3 North America Orphan Drugs Market by Country, 2023, 2028 & 2033 (US$ Billion)
8.4 North America Orphan Drugs Market Size Estimation and Forecast by Country
8.5 North America Orphan Drugs Market Size Estimation and Forecast by Therapeutic Area
8.6 North America Orphan Drugs Market Size Estimation and Forecast by Drug Type
8.7 U.S. Orphan Drugs Market Analysis
8.8 Canada Orphan Drugs Market Analysis
9 Europe Orphan Drugs Market Analysis
9.1 Key Findings
9.2 Europe Orphan Drugs Market Attractiveness Index
9.3 Europe Orphan Drugs Market by Country, 2023, 2028 & 2033 (US$ Billion)
9.4 Europe Orphan Drugs Market Size Estimation and Forecast by Country
9.5 Europe Orphan Drugs Market Size Estimation and Forecast by Therapeutic Area
9.6 Europe Orphan Drugs Market Size Estimation and Forecast by Drug Type
9.7 Germany Orphan Drugs Market Analysis
9.8 France Orphan Drugs Market Analysis
9.9 UK Orphan Drugs Market Analysis
9.10 Italy Orphan Drugs Market Analysis
9.11 Spain Orphan Drugs Market Analysis
9.12 Russia Orphan Drugs Market Analysis
9.13 Rest of Europe Orphan Drugs Market Analysis
10 Asia Pacific Orphan Drugs Market Analysis
10.1 Key Findings
10.2 Asia Pacific Orphan Drugs Market Attractiveness Index
10.3 Asia Pacific Orphan Drugs Market by Country, 2023, 2028 & 2033 (US$ Billion)
10.4 Asia Pacific Orphan Drugs Market Size Estimation and Forecast by Country
10.5 Asia Pacific Orphan Drugs Market Size Estimation and Forecast by Therapeutic Area
10.6 Asia Pacific Orphan Drugs Market Size Estimation and Forecast by Drug Type
10.7 Japan Orphan Drugs Market Analysis
10.8 China Orphan Drugs Market Analysis
10.9 India Orphan Drugs Market Analysis
10.10 Australia Orphan Drugs Market Analysis
10.11 South Korea Orphan Drugs Market Analysis
10.12 Singapore Orphan Drugs Market Analysis
10.13 Rest of Asia Pacific Orphan Drugs Market Analysis
11 Latin America Orphan Drugs Market Analysis
11.1 Key Findings
11.2 Latin America Orphan Drugs Market Attractiveness Index
11.3 Latin America Orphan Drugs Market by Country, 2023, 2028 & 2033 (US$ Billion)
11.4 Latin America Orphan Drugs Market Size Estimation and Forecast by Country
11.5 Latin America Orphan Drugs Market Size Estimation and Forecast by Therapeutic Area
11.6 Latin America Orphan Drugs Market Size Estimation and Forecast by Drug Type
11.7 Brazil Orphan Drugs Market Analysis
11.8 Mexico Orphan Drugs Market Analysis
11.9 Argentina Orphan Drugs Market Analysis
11.10 Colombia Orphan Drugs Market Analysis
11.11 Rest of Latin America Orphan Drugs Market Analysis
12 MEA Orphan Drugs Market Analysis
12.1 Key Findings
12.2 MEA Orphan Drugs Market Attractiveness Index
12.3 MEA Orphan Drugs Market by Country, 2023, 2028 & 2033 (US$ Billion)
12.4 MEA Orphan Drugs Market Size Estimation and Forecast by Country
12.5 MEA Orphan Drugs Market Size Estimation and Forecast by Therapeutic Area
12.6 MEA Orphan Drugs Market Size Estimation and Forecast by Drug Type
12.7 GCC Orphan Drugs Market Analysis
12.8 South Africa Orphan Drugs Market Analysis
12.9 Rest of MEA Orphan Drugs Market Analysis
13 Company Profiles
13.1 Competitive Landscape, 2022
13.2 Strategic Outlook
13.3 Merck & Co., Inc.
13.3.1 Company Snapshot
13.3.2 Company Overview
13.3.3 Financial Analysis
13.3.3.1 Net Revenue, 2017-2022
13.3.3.2 R&D, 2017-2022
13.3.3.3 Regional Market Shares, 2022
13.3.4 Product Benchmarking
13.3.5 Strategic Outlook
13.4 AbbVie Inc.
13.4.1 Company Snapshot
13.4.2 Company Overview
13.4.3 Financial Analysis
13.4.3.1 Net Revenue, 2017-2022
13.4.3.2 R&D, 2017-2022
13.4.3.3 Regional Market Shares, 2022
13.4.4 Product Benchmarking
13.4.5 Strategic Outlook
13.5 Vertex Pharmaceuticals Incorporated
13.5.1 Company Snapshot
13.5.2 Company Overview
13.5.3 Financial Analysis
13.5.3.1 Net Revenue, 2017-2022
13.5.3.2 R&D, 2017-2022
13.5.3.3 Regional Market Shares, 2022
13.5.4 Product Benchmarking
13.5.5 Strategic Outlook
13.6 Pfizer Inc.
13.6.1 Company Snapshot
13.6.2 Company Overview
13.6.3 Financial Analysis
13.6.3.1 Net Revenue, 2017-2022
13.6.3.2 R&D, 2017-2022
13.6.3.3 Regional Market Shares, 2022
13.6.4 Product Benchmarking
13.6.5 Strategic Outlook
13.7 Bristol-Myers Squibb Company
13.7.1 Company Snapshot
13.7.2 Company Overview
13.7.3 Financial Analysis
13.7.3.1 Net Revenue, 2017-2022
13.7.3.2 R&D, 2017-2022
13.7.3.3 Regional Market Shares, 2022
13.7.4 Product Benchmarking
13.7.5 Strategic Outlook
13.8 AstraZeneca
13.8.1 Company Snapshot
13.8.2 Company Overview
13.8.3 Financial Analysis
13.8.3.1 Net Revenue, 2017-2022
13.8.3.2 R&D, 2017-2022
13.8.3.3 Regional Market Shares, 2022
13.8.4 Product Benchmarking
13.8.5 Strategic Outlook
13.9 Johnson & Johnson Services, Inc.
13.9.1 Company Snapshot
13.9.2 Company Overview
13.9.3 Financial Analysis
13.9.3.1 Net Revenue, 2017-2022
13.9.3.2 R&D, 2017-2022
13.9.3.3 Regional Market Shares, 2022
13.9.4 Product Benchmarking
13.9.5 Strategic Outlook
13.10 F. Hoffmann-La Roche Ltd.
13.10.1 Company Snapshot
13.10.2 Company Overview
13.10.3 Financial Analysis
13.10.3.1 Net Revenue, 2017-2022
13.10.3.2 R&D, 2017-2022
13.10.3.3 Regional Market Shares, 2022
13.10.4 Product Benchmarking
13.10.5 Strategic Outlook
13.11 Novartis AG
13.11.1 Company Snapshot
13.11.2 Company Overview
13.11.3 Financial Analysis
13.11.3.1 Net Revenue, 2017-2022
13.11.3.2 R&D, 2017-2022
13.11.3.3 Regional Market Shares, 2022
13.11.4 Product Benchmarking
13.11.5 Strategic Outlook
13.12 Biogen
13.12.1 Company Snapshot
13.12.2 Company Overview
13.12.3 Financial Analysis
13.12.3.1 Net Revenue, 2017-2022
13.12.3.2 R&D, 2017-2022
13.12.3.3 Regional Market Shares, 2022
13.12.4 Product Benchmarking
13.12.5 Strategic Outlook
13.13 GSK plc
13.13.1 Company Snapshot
13.13.2 Company Overview
13.13.3 Financial Analysis
13.13.3.1 Net Revenue, 2017-2022
13.13.3.2 R&D, 2017-2022
13.13.3.3 Regional Market Shares, 2022
13.13.4 Product Benchmarking
13.13.5 Strategic Outlook
13.14 Sanofi
13.14.1 Company Snapshot
13.14.2 Company Overview
13.14.3 Financial Analysis
13.14.3.1 Net Revenue, 2017-2022
13.14.3.2 R&D, 2017-2022
13.14.3.3 Regional Market Shares, 2022
13.14.4 Product Benchmarking
13.14.5 Strategic Outlook
14 Conclusion and Recommendations
14.1 Concluding Remarks from Visiongain
14.2 Recommendations for Market Players
ページTOPに戻る
List of Tables/Graphs
List of Tables
Table 1 Orphan Drugs Market Snapshot, 2024 & 2034 (US$ Billion, CAGR %)
Table 2 Capital Raised by Rare Disease Therapeutics Companies to Date in 2021 (US$ Million)
Table 3 Orphan Drugs Market, by Region, 2023-2033 (US$ Billion, AGR%, CAGR%): "V" Shaped Recovery
Table 4 Orphan Drugs Market, by Region, 2023-2033 (US$ Billion, AGR%, CAGR%): "U" Shaped Recovery
Table 5 Orphan Drugs Market, by Region, 2023-2033 (US$ Billion, AGR%, CAGR%): "W" Shaped Recovery
Table 6 Orphan Drugs Market, by Region, 2023-2033 (US$ Billion, AGR%, CAGR%): "L" Shaped Recovery
Table 7 Orphan Drugs Market Forecast by Therapeutic Area, 2023-2033 (US$ Billion, AGR%, CAGR%)
Table 8 Oncology Segment Market Forecast by Region, 2023-2033 (US$ Billion, AGR%, CAGR%)
Table 9 Neurological Diseases Segment Market Forecast by Region, 2023-2033 (US$ Billion, AGR%, CAGR%)
Table 10 Cardiovascular Diseases Segment Market Forecast by Region, 2023-2033 (US$ Billion, AGR%, CAGR%)
Table 11 Hematologic Disorders Segment Market Forecast by Region, 2023-2033 (US$ Billion, AGR%, CAGR%)
Table 12 Infectious Diseases Segment Market Forecast by Region, 2023-2033 (US$ Billion, AGR%, CAGR%)
Table 13 Metabolic Diseases Segment Market Forecast by Region, 2023-2033 (US$ Billion, AGR%, CAGR%)
Table 14 Others Segment Market Forecast by Region, 2023-2033 (US$ Billion, AGR%, CAGR%)
Table 15 Orphan Drugs Market Forecast by Drug Type, 2023-2033 (US$ Billion, AGR%, CAGR%)
Table 16 Biologics Segment Market Forecast by Region, 2023-2033 (US$ Billion, AGR%, CAGR%)
Table 17 Biosimilar Segment Market Forecast by Region, 2023-2033 (US$ Billion, AGR%, CAGR%)
Table 18 Others Segment Market Forecast by Region, 2023-2033 (US$ Billion, AGR%, CAGR%)
Table 19 Orphan Drugs Market, by Top 10 Brands, 2023-2033 (US$ Billion, AGR%, CAGR%)
Table 20 Orphan Drugs Market Forecast by Region, 2023-2033 (US$ Billion, AGR%, CAGR%)
Table 21 North America Orphan Drugs Market Forecast by Country, 2023-2033 (US$ Billion, AGR%, CAGR%)
Table 22 North America Orphan Drugs Market Forecast by Therapeutic Area, 2023-2033 (US$ Billion, AGR%, CAGR%)
Table 23 North America Orphan Drugs Market Forecast by Drug Type, 2023-2033 (US$ Billion, AGR%, CAGR%)
Table 24 U.S Orphan Drugs Market Forecast, 2023-2033 (US$ Billion, AGR%, CAGR%)
Table 25 Canada Orphan Drugs Market Forecast, 2023-2033 (US$ Billion, AGR%, CAGR%)
Table 26 Europe Orphan Drugs Market Forecast by Country, 2023-2033 (US$ Billion, AGR%, CAGR%)
Table 27 Europe Orphan Drugs Market Forecast by Therapeutic Area, 2023-2033 (US$ Billion, AGR%, CAGR%)
Table 28 Europe Orphan Drugs Market Forecast by Drug Type, 2023-2033 (US$ Billion, AGR%, CAGR%)
Table 29 Germany Orphan Drugs Market Forecast, 2023-2033 (US$ Billion, AGR%, CAGR%)
Table 30 France Orphan Drugs Market Forecast, 2023-2033 (US$ Billion, AGR%, CAGR%)
Table 31 UK Orphan Drugs Market Forecast, 2023-2033 (US$ Billion, AGR%, CAGR%)
Table 32 Italy Orphan Drugs Market Forecast, 2023-2033 (US$ Billion, AGR%, CAGR%)
Table 33 Spain Orphan Drugs Market Forecast, 2023-2033 (US$ Billion, AGR%, CAGR%)
Table 34 Russia Orphan Drugs Market Forecast, 2023-2033 (US$ Billion, AGR%, CAGR%)
Table 35 Rest of Europe Orphan Drugs Market Forecast, 2023-2033 (US$ Billion, AGR%, CAGR%)
Table 36 Asia Pacific Orphan Drugs Market Forecast by Country, 2023-2033 (US$ Billion, AGR%, CAGR%)
Table 37 Asia Pacific Orphan Drugs Market Forecast by Therapeutic Area, 2023-2033 (US$ Billion, AGR%, CAGR%)
Table 38 Asia Pacific Orphan Drugs Market Forecast by Drug Type, 2023-2033 (US$ Billion, AGR%, CAGR%)
Table 39 Japan Orphan Drugs Market Forecast, 2023-2033 (US$ Billion, AGR%, CAGR%)
Table 40 China Orphan Drugs Market Forecast, 2023-2033 (US$ Billion, AGR%, CAGR%)
Table 41 India Orphan Drugs Market Forecast, 2023-2033 (US$ Billion, AGR%, CAGR%)
Table 42 Australia Orphan Drugs Market Forecast, 2023-2033 (US$ Billion, AGR%, CAGR%)
Table 43 South Korea Orphan Drugs Market Forecast, 2023-2033 (US$ Billion, AGR%, CAGR%)
Table 44 Singapore Orphan Drugs Market Forecast, 2023-2033 (US$ Billion, AGR%, CAGR%)
Table 45 Rest of Asia Pacific Orphan Drugs Market Forecast, 2023-2033 (US$ Billion, AGR%, CAGR%)
Table 46 Latin America Orphan Drugs Market Forecast by Country, 2023-2033 (US$ Billion, AGR%, CAGR%)
Table 47 Latin America Orphan Drugs Market Forecast by Therapeutic Area, 2023-2033 (US$ Billion, AGR%, CAGR%)
Table 48 Latin America Orphan Drugs Market Forecast by Drug Type, 2023-2033 (US$ Billion, AGR%, CAGR%)
Table 49 Brazil Orphan Drugs Market Forecast, 2023-2033 (US$ Billion, AGR%, CAGR%)
Table 50 Mexico Orphan Drugs Market Forecast, 2023-2033 (US$ Billion, AGR%, CAGR%)
Table 51 Argentina Orphan Drugs Market Forecast, 2023-2033 (US$ Billion, AGR%, CAGR%)
Table 52 Colombia Orphan Drugs Market Forecast, 2023-2033 (US$ Billion, AGR%, CAGR%)
Table 53 Rest of Latin America Orphan Drugs Market Forecast, 2023-2033 (US$ Billion, AGR%, CAGR%)
Table 54 MEA Orphan Drugs Market Forecast by Country, 2023-2033 (US$ Billion, AGR%, CAGR%)
Table 55 MEA Orphan Drugs Market Forecast by Therapeutic Area, 2023-2033 (US$ Billion, AGR%, CAGR%)
Table 56 MEA Orphan Drugs Market Forecast by Drug Type, 2023-2033 (US$ Billion, AGR%, CAGR%)
Table 57 GCC Orphan Drugs Market Forecast, 2023-2033 (US$ Billion, AGR%, CAGR%)
Table 58 South Africa Orphan Drugs Market Forecast, 2023-2033 (US$ Billion, AGR%, CAGR%)
Table 59 Rest of MEA Orphan Drugs Market Forecast, 2023-2033 (US$ Billion, AGR%, CAGR%)
Table 60 Strategic Outlook
Table 61 Merck & Co., Inc.: Key Details, (CEO, HQ, Revenue, Founded, No. of Employees, Company Type, Website, Business Segment)
Table 62 Merck & Co., Inc.: Product Benchmarking
Table 63 Merck & Co., Inc.: Strategic Outlook
Table 64 AbbVie Inc.: Key Details, (CEO, HQ, Revenue, Founded, No. of Employees, Company Type, Website, Business Segment)
Table 65 AbbVie Inc.: Product Benchmarking
Table 66 AbbVie Inc.: Strategic Outlook
Table 67 Vertex Pharmaceuticals Incorporated: Key Details, (CEO, HQ, Revenue, Founded, No. of Employees, Company Type, Website, Business Segment)
Table 68 Vertex Pharmaceuticals Incorporated: Product Benchmarking
Table 69 Vertex Pharmaceuticals Incorporated: Strategic Outlook
Table 70 Pfizer Inc.: Key Details, (CEO, HQ, Revenue, Founded, No. of Employees, Company Type, Website, Business Segment)
Table 71 Pfizer Inc.: Product Benchmarking
Table 72 Pfizer Inc.: Strategic Outlook
Table 73 Bristol-Myers Squibb Company: Key Details, (CEO, HQ, Revenue, Founded, No. of Employees, Company Type, Website, Business Segment)
Table 74 Bristol-Myers Squibb Company: Product Benchmarking
Table 75 Bristol-Myers Squibb Company: Strategic Outlook
Table 76 AstraZeneca: Key Details, (CEO, HQ, Revenue, Founded, No. of Employees, Company Type, Website, Business Segment)
Table 77 AstraZeneca: Product Benchmarking
Table 78 AstraZeneca: Strategic Outlook
Table 79 Johnson & Johnson Services, Inc.: Key Details, (CEO, HQ, Revenue, Founded, No. of Employees, Company Type, Website, Business Segment)
Table 80 Johnson & Johnson Services, Inc.: Product Benchmarking
Table 81 Johnson & Johnson Services, Inc.: Strategic Outlook
Table 82 F. Hoffmann-La Roche Ltd.: Key Details, (CEO, HQ, Revenue, Founded, No. of Employees, Company Type, Website, Business Segment)
Table 83 F. Hoffmann-La Roche Ltd.: Product Benchmarking
Table 84 F. Hoffmann-La Roche Ltd.: Strategic Outlook
Table 85 Novartis AG: Key Details, (CEO, HQ, Revenue, Founded, No. of Employees, Company Type, Website, Business Segment)
Table 86 Novartis AG: Product Benchmarking
Table 87 Novartis AG: Strategic Outlook
Table 88 Biogen: Key Details, (CEO, HQ, Revenue, Founded, No. of Employees, Company Type, Website, Business Segment)
Table 89 Biogen: Product Benchmarking
Table 90 Biogen: Strategic Outlook
Table 91 GSK plc: Key Details, (CEO, HQ, Revenue, Founded, No. of Employees, Company Type, Website, Business Segment)
Table 92 GSK plc: Product Benchmarking
Table 93 GSK plc: Strategic Outlook
Table 94 Sanofi: Key Details, (CEO, HQ, Revenue, Founded, No. of Employees, Company Type, Website, Business Segment)
Table 95 Sanofi: Product Benchmarking
Table 96 Sanofi: Strategic Outlook
List of Figures
Figure 1 Orphan Drugs Market Segmentation
Figure 2 Orphan Drugs Market by Therapeutic Area: Market Attractiveness Index
Figure 3 Orphan Drugs Market by Drug Type: Market Attractiveness Index
Figure 4 Orphan Drugs Market by Brand: Market Attractiveness Index
Figure 5 Orphan Drugs Market Attractiveness Index by Region
Figure 6 Orphan Drugs Market: Market Dynamics
Figure 7 Orphan Drugs Market by Region, 2023-2033 (US$ Billion, AGR %): “V” Shaped Recovery
Figure 8 Orphan Drugs Market by Region, 2023-2033 (US$ Billion, AGR %): “U” Shaped Recovery
Figure 9 Orphan Drugs Market by Region, 2023-2033 (US$ Billion, AGR %): “W” Shaped Recovery
Figure 10 Orphan Drugs Market by Region, 2023-2033 (US$ Billion, AGR %): “L” Shaped Recovery
Figure 11 Orphan Drugs Market: Porter’s Five Forces Analysis
Figure 12 Orphan Drugs Market: PEST Analysis
Figure 13 Orphan Drugs Market by Therapeutic Area: Market Attractiveness Index
Figure 14 Orphan Drugs Market Forecast by Therapeutic Area, 2023-2033 (US$ Billion, AGR %)
Figure 15 Orphan Drugs Market Share Forecast by Therapeutic Area, 2023, 2028, 2033 (%)
Figure 16 Oncology Segment Market Forecast by Region, 2023-2033 (US$ Billion, AGR %)
Figure 17 Oncology Segment Market Share Forecast by Region, 2023 & 2033 (%)
Figure 18 Neurological Diseases Segment Market Forecast by Region, 2023-2033 (US$ Billion, AGR %)
Figure 19 Neurological Diseases Segment Market Share Forecast by Region, 2023 & 2033 (%)
Figure 20 Cardiovascular Diseases Segment Market Forecast by Region, 2023-2033 (US$ Billion, AGR %)
Figure 21 Cardiovascular Diseases Segment Market Share Forecast by Region, 2023 & 2033 (%)
Figure 22 Hematologic Disorders Segment Market Forecast by Region, 2023-2033 (US$ Billion, AGR %)
Figure 23 Hematologic Disorders Segment Market Share Forecast by Region, 2023 & 2033 (%)
Figure 24 Infectious Diseases Segment Market Forecast by Region, 2023-2033 (US$ Billion, AGR %)
Figure 25 Infectious Diseases Segment Market Share Forecast by Region, 2023 & 2033 (%)
Figure 26 Metabolic Diseases Segment Market Forecast by Region, 2023-2033 (US$ Billion, AGR %)
Figure 27 Metabolic Diseases Segment Market Share Forecast by Region, 2023 & 2033 (%)
Figure 28 Others Segment Market Forecast by Region, 2023-2033 (US$ Billion, AGR %)
Figure 29 Others Segment Market Share Forecast by Region, 2023 & 2033 (%)
Figure 30 Orphan Drugs Market by Drug Type: Market Attractiveness Index
Figure 31 Orphan Drugs Market Forecast by Drug Type, 2023-2033 (US$ Billion, AGR %)
Figure 32 Orphan Drugs Market Share Forecast by Drug Type, 2023, 2028, 2033 (%)
Figure 33 Biologics Segment Market Forecast by Region, 2023-2033 (US$ Billion, AGR %)
Figure 34 Biologics Segment Market Share Forecast by Region, 2023 & 2033 (%)
Figure 35 Biosimilar Segment Market Forecast by Region, 2023-2033 (US$ Billion, AGR %)
Figure 36 Biosimilar Segment Market Share Forecast by Region, 2023 & 2033 (%)
Figure 37 Others Segment Market Forecast by Region, 2023-2033 (US$ Billion, AGR %)
Figure 38 Others Segment Market Share Forecast by Region, 2023 & 2033 (%)
Figure 39 Orphan Drugs Market Forecast by Top 10 brands, 2023-2033 (US$ Billion, AGR %)
Figure 40 Orphan Drugs Market Forecast by Region 2023 and 2033 (Revenue, CAGR%)
Figure 41 Orphan Drugs Market Share Forecast by Region 2023, 2028, 2033 (%)
Figure 42 Orphan Drugs Market by Region, 2023-2033 (US$ Billion, AGR %)
Figure 43 North America Orphan Drugs Market Attractiveness Index
Figure 44 North America Orphan Drugs Market by Region, 2023, 2028 & 2033 (US$ Billion)
Figure 45 North America Orphan Drugs Market Forecast by Country, 2023-2033 (US$ Billion, AGR %)
Figure 46 North America Orphan Drugs Market Share Forecast by Country, 2023 & 2033 (%)
Figure 47 North America Orphan Drugs Market Forecast by Therapeutic Area, 2023-2033 (US$ Billion, AGR %)
Figure 48 North America Orphan Drugs Market Share Forecast by Therapeutic Area, 2023 & 2033 (%)
Figure 49 North America Orphan Drugs Market Forecast by Drug Type, 2023-2033 (US$ Billion, AGR %)
Figure 50 North America Orphan Drugs Market Share Forecast by Drug Type, 2023 & 2033 (%)
Figure 51 U.S. Orphan Drugs Market Forecast, 2023-2033 (US$ Billion, AGR %)
Figure 52 Canada Orphan Drugs Market Forecast, 2023-2033 (US$ Billion, AGR %)
Figure 53 Europe Orphan Drugs Market Attractiveness Index
Figure 54 Europe Orphan Drugs Market by Region, 2023, 2028 & 2033 (US$ Billion)
Figure 55 Europe Orphan Drugs Market Forecast by Country, 2023-2033 (US$ Billion, AGR %)
Figure 56 Europe Orphan Drugs Market Share Forecast by Country, 2023 & 2033 (%)
Figure 57 Europe Orphan Drugs Market Forecast by Therapeutic Area, 2023-2033 (US$ Billion, AGR %)
Figure 58 Europe Orphan Drugs Market Share Forecast by Therapeutic Area, 2023 & 2033 (%)
Figure 59 Europe Orphan Drugs Market Forecast by Drug Type, 2023-2033 (US$ Billion, AGR %)
Figure 60 Europe Orphan Drugs Market Share Forecast by Drug Type, 2023 & 2033 (%)
Figure 61 Germany Orphan Drugs Market Forecast, 2023-2033 (US$ Billion, AGR %)
Figure 62 France Orphan Drugs Market Forecast, 2023-2033 (US$ Billion, AGR %)
Figure 63 UK Orphan Drugs Market Forecast, 2023-2033 (US$ Billion, AGR %)
Figure 64 Italy Orphan Drugs Market Forecast, 2023-2033 (US$ Billion, AGR %)
Figure 65 Spain Orphan Drugs Market Forecast, 2023-2033 (US$ Billion, AGR %)
Figure 66 Russia Orphan Drugs Market Forecast, 2023-2033 (US$ Billion, AGR %)
Figure 67 Rest of Europe Orphan Drugs Market Forecast, 2023-2033 (US$ Billion, AGR %)
Figure 68 Asia Pacific Orphan Drugs Market Attractiveness Index
Figure 69 Asia Pacific Orphan Drugs Market by Region, 2023, 2028 & 2033 (US$ Billion)
Figure 70 Asia Pacific Orphan Drugs Market Forecast by Country, 2023-2033 (US$ Billion, AGR %)
Figure 71 Asia Pacific Orphan Drugs Market Share Forecast by Country, 2023 & 2033 (%)
Figure 72 Asia Pacific Orphan Drugs Market Forecast by Therapeutic Area, 2023-2033 (US$ Billion, AGR %)
Figure 73 Asia Pacific Orphan Drugs Market Share Forecast by Therapeutic Area, 2023 & 2033 (%)
Figure 74 Asia Pacific Orphan Drugs Market Forecast by Drug Type, 2023-2033 (US$ Billion, AGR %)
Figure 75 Asia Pacific Orphan Drugs Market Share Forecast by Drug Type, 2023 & 2033 (%)
Figure 76 Japan Orphan Drugs Market Forecast, 2023-2033 (US$ Billion, AGR %)
Figure 77 China Orphan Drugs Market Forecast, 2023-2033 (US$ Billion, AGR %)
Figure 78 India Orphan Drugs Market Forecast, 2023-2033 (US$ Billion, AGR %)
Figure 79 Australia Orphan Drugs Market Forecast, 2023-2033 (US$ Billion, AGR %)
Figure 80 South Korea Orphan Drugs Market Forecast, 2023-2033 (US$ Billion, AGR %)
Figure 81 Singapore Orphan Drugs Market Forecast, 2023-2033 (US$ Billion, AGR %)
Figure 82 Rest of Asia Pacific Orphan Drugs Market Forecast, 2023-2033 (US$ Billion, AGR %)
Figure 83 Latin America Orphan Drugs Market Attractiveness Index
Figure 84 Latin America Orphan Drugs Market by Region, 2023, 2028 & 2033 (US$ Billion)
Figure 85 Latin America Orphan Drugs Market Forecast by Country, 2023-2033 (US$ Billion, AGR %)
Figure 86 Latin America Orphan Drugs Market Share Forecast by Country, 2023 & 2033 (%)
Figure 87 Latin America Orphan Drugs Market Forecast by Therapeutic Area, 2023-2033 (US$ Billion, AGR %)
Figure 88 Latin America Orphan Drugs Market Share Forecast by Therapeutic Area, 2023 & 2033 (%)
Figure 89 Latin America Orphan Drugs Market Forecast by Drug Type, 2023-2033 (US$ Billion, AGR %)
Figure 90 Latin America Orphan Drugs Market Share Forecast by Drug Type, 2023 & 2033 (%)
Figure 91 Brazil Orphan Drugs Market Forecast, 2023-2033 (US$ Billion, AGR %)
Figure 92 Mexico Orphan Drugs Market Forecast, 2023-2033 (US$ Billion, AGR %)
Figure 93 Argentina Orphan Drugs Market Forecast, 2023-2033 (US$ Billion, AGR %)
Figure 94 Colombia Orphan Drugs Market Forecast, 2023-2033 (US$ Billion, AGR %)
Figure 95 Rest of Latin America Orphan Drugs Market Forecast, 2023-2033 (US$ Billion, AGR %)
Figure 96 MEA Orphan Drugs Market Attractiveness Index
Figure 97 MEA Orphan Drugs Market by Region, 2023, 2028 & 2033 (US$ Billion)
Figure 98 MEA Orphan Drugs Market Forecast by Country, 2023-2033 (US$ Billion, AGR %)
Figure 99 MEA Orphan Drugs Market Share Forecast by Country, 2023 & 2033 (%)
Figure 100 MEA Orphan Drugs Market Forecast by Therapeutic Area, 2023-2033 (US$ Billion, AGR %)
Figure 101 MEA Orphan Drugs Market Share Forecast by Therapeutic Area, 2023 & 2033 (%)
Figure 102 MEA Orphan Drugs Market Forecast by Drug Type, 2023-2033 (US$ Billion, AGR %)
Figure 103 MEA Orphan Drugs Market Share Forecast by Drug Type, 2023 & 2033 (%)
Figure 104 GCC Orphan Drugs Market Forecast, 2023-2033 (US$ Billion, AGR %)
Figure 105 South Africa Orphan Drugs Market Forecast, 2023-2033 (US$ Billion, AGR %)
Figure 106 Rest of MEA Orphan Drugs Market Forecast, 2023-2033 (US$ Billion, AGR %)
Figure 107 Orphan Drugs Market: Company Share/Ranking, 2022
Figure 108 Merck & Co., Inc.: Net Revenue, 2017-2022 (US$ Million, AGR%)
Figure 109 Merck & Co., Inc.: R&D, 2017-2022 (US$ Million, AGR%)
Figure 110 Merck & Co., Inc.: Regional Market Shares, 2022
Figure 111 AbbVie Inc.: Net Revenue, 2017-2022 (US$ Million, AGR%)
Figure 112 AbbVie Inc.: R&D, 2017-2022 (US$ Million, AGR%)
Figure 113 AbbVie Inc.: Regional Market Shares, 2022
Figure 114 Vertex Pharmaceuticals Incorporated: Net Revenue, 2017-2022 (US$ Million, AGR%)
Figure 115 Vertex Pharmaceuticals Incorporated: R&D, 2017-2022 (US$ Million, AGR%)
Figure 116 Vertex Pharmaceuticals Incorporated: Regional Market Shares, 2022
Figure 117 Pfizer Inc.: Net Revenue, 2017-2022 (US$ Million, AGR%)
Figure 118 Pfizer Inc.: R&D, 2017-2022 (US$ Million, AGR%)
Figure 119 Pfizer Inc.: Regional Market Shares, 2022
Figure 120 Bristol-Myers Squibb Company: Net Revenue, 2017-2022 (US$ Million, AGR%)
Figure 121 Bristol-Myers Squibb Company: R&D, 2017-2022 (US$ Million, AGR%)
Figure 122 Bristol-Myers Squibb Company: Regional Market Shares, 2022
Figure 123 AstraZeneca: Net Revenue, 2017-2022 (US$ Million, AGR%)
Figure 124 AstraZeneca: R&D, 2017-2022 (US$ Million, AGR%)
Figure 125 AstraZeneca: Regional Market Shares, 2022
Figure 126 Johnson & Johnson Services, Inc.: Net Revenue, 2017-2022 (US$ Million, AGR%)
Figure 127 Johnson & Johnson Services, Inc.: R&D, 2017-2022 (US$ Million, AGR%)
Figure 128 Johnson & Johnson Services, Inc.: Regional Market Shares, 2022
Figure 129 F. Hoffmann-La Roche Ltd.: Net Revenue, 2017-2022 (US$ Million, AGR%)
Figure 130 F. Hoffmann-La Roche Ltd.: R&D, 2017-2022 (US$ Million, AGR%)
Figure 131 F. Hoffmann-La Roche Ltd.: Regional Market Shares, 2022
Figure 132 Novartis AG: Net Revenue, 2017-2022 (US$ Million, AGR%)
Figure 133 Novartis AG: R&D, 2017-2022 (US$ Million, AGR%)
Figure 134 Novartis AG: Regional Market Shares, 2022
Figure 135 Biogen: Net Revenue, 2017-2022 (US$ Million, AGR%)
Figure 136 Biogen: R&D, 2017-2022 (US$ Million, AGR%)
Figure 137 Biogen: Regional Market Shares, 2022
Figure 138 GSK plc: Net Revenue, 2017-2022 (US$ Million, AGR%)
Figure 139 GSK plc: R&D, 2017-2022 (US$ Million, AGR%)
Figure 140 GSK plc: Regional Market Shares, 2022
Figure 141 Sanofi: Net Revenue, 2017-2022 (US$ Million, AGR%)
Figure 142 Sanofi: R&D, 2017-2022 (US$ Million, AGR%)
Figure 143 Sanofi: Regional Market Shares, 2022
ページTOPに戻る
本レポートと同分野(生物学的製剤)の最新刊レポート
Visiongain社のヘルスケアと医薬・化学品分野での最新刊レポート
本レポートと同じKEY WORD(drug)の最新刊レポート
よくあるご質問
Visiongain社はどのような調査会社ですか?
英国の調査会社ヴィジョンゲイン社(Visiongain)は、通信とエネルギーのほか、自動車や化学・医薬品、金属など、広範な市場を対象に調査を行っています。自動車市場については、市場全般に関する調査のほ... もっと見る
調査レポートの納品までの日数はどの程度ですか?
在庫のあるものは速納となりますが、平均的には 3-4日と見て下さい。
但し、一部の調査レポートでは、発注を受けた段階で内容更新をして納品をする場合もあります。
発注をする前のお問合せをお願いします。
注文の手続きはどのようになっていますか?
1)お客様からの御問い合わせをいただきます。
2)見積書やサンプルの提示をいたします。
3)お客様指定、もしくは弊社の発注書をメール添付にて発送してください。
4)データリソース社からレポート発行元の調査会社へ納品手配します。
5) 調査会社からお客様へ納品されます。最近は、pdfにてのメール納品が大半です。
お支払方法の方法はどのようになっていますか?
納品と同時にデータリソース社よりお客様へ請求書(必要に応じて納品書も)を発送いたします。
お客様よりデータリソース社へ(通常は円払い)の御振り込みをお願いします。
請求書は、納品日の日付で発行しますので、翌月最終営業日までの当社指定口座への振込みをお願いします。振込み手数料は御社負担にてお願いします。
お客様の御支払い条件が60日以上の場合は御相談ください。
尚、初めてのお取引先や個人の場合、前払いをお願いすることもあります。ご了承のほど、お願いします。
データリソース社はどのような会社ですか?
当社は、世界各国の主要調査会社・レポート出版社と提携し、世界各国の市場調査レポートや技術動向レポートなどを日本国内の企業・公官庁及び教育研究機関に提供しております。
世界各国の「市場・技術・法規制などの」実情を調査・収集される時には、データリソース社にご相談ください。
お客様の御要望にあったデータや情報を抽出する為のレポート紹介や調査のアドバイスも致します。
|
|

