バイオリアクター市場レポート:2023-2033
Bioreactors Market Report 2023-2033
レポート詳細
バイオリアクター市場レポート 2023-2033年 :本レポートは、業界とその基礎となる原動力をよりよく理解することを望むなら、新たな収益ポケットを目指す大手企業にとって貴重なものと... もっと見る
※上記価格は部署ライセンス(Departmental licence)価格です。
その他の価格についてはデータリソースまでお問合せください。
日本語のページは自動翻訳を利用し作成しています。
実際のレポートは英文のみでご納品いたします。

|

|
サマリー
レポート詳細
バイオリアクター市場レポート 2023-2033年:本レポートは、業界とその基礎となる原動力をよりよく理解することを望むなら、新たな収益ポケットを目指す大手企業にとって貴重なものとなるでしょう。異業種への進出や新地域での既存事業の拡大を目指す企業にも有用です。
シングルユース・バイオリアクターの需要増加
シングルユース・バイオリアクターの使用が増加していることは、バイオプロセス産業における顕著な傾向であり、いくつかの有力な成長要因に後押しされている。第一に、シングルユース・バイオリアクターは柔軟性と拡張性を高め、バイオ製薬企業が生産ニーズの変化に迅速に対応し、少量バッチから大規模生産まで幅広い生物製剤を効率的に生産できるようにする。第二に、交差汚染のリスクを軽減し、製品の完全性と安全性を確保すると同時に、洗浄とバリデーションのプロセスを簡素化する。さらに、シングルユースシステムに関連する資本コストと運用コストの削減により、既存企業と新興バイオテクノロジー企業の両方にとって魅力的な選択肢となる。さらに、従来のステンレス製バイオリアクターに比べて廃棄物の発生が少なく、必要な資源も少なくて済むため、持続可能性とバイオプロセスによる環境への影響の低減にますます注目が集まっており、シングルユース技術の採用が増加している。その結果、シングルユース・バイオリアクターの利用は上昇を続け、製薬・バイオテクノロジー部門におけるバイオプロセスの展望を再構築する勢いである。
シングルユース・バイオリアクターの限られた容量が大規模工業生産の妨げになる可能性が高い
シングルユース・バイオリアクターは、ステンレス製に比べて一般的に規模が小さいため、バイオ医薬品の大量生産を必要とする企業にとっては課題となる。この制限は、特にブロックバスター医薬品やワクチンの場合、生物製剤の需要増に対応する妨げとなる可能性があります。製造業者は、小規模の研究開発から商業生産に移行する際に拡張性の問題に直面する可能性があり、複数のユニットや連続運転が必要となるため、コストや複雑さが増す可能性がある。業界が拡大を続ける中、急速に進化するバイオ医薬品市場の需要に応えつつ、シングルユース・バイオリアクターの利点を十分に生かすためには、容量の制約に対処することが極めて重要になります。
市場調査レポートを購入する前にすべき質問とは?
- バイオリアクター市場はどのように進化しているのか?
- バイオリアクター市場の推進要因と阻害要因は何か?
- バイオリアクターの各サブマーケットセグメントは予測期間中にどのように成長し、2033年にはどれくらいの収益を占めるようになるのか?
- 2023年から2033年にかけて、各バイオリアクターサブマーケットの市場シェアはどのように推移するのか?
- 2023年から2033年にかけて市場全体を牽引する主な要因は何か?
- 主要なバイオリアクター市場はマクロ経済の動きに大枠で追随するのか、それとも個々の国内市場が他を凌駕するのか?
- 2033年までに各国市場のシェアはどう変化し、2033年に市場をリードするのはどの地域か?
- 主要プレイヤーは誰で、予測期間中の見通しは?
- これらの主要企業のバイオリアクター・プロジェクトは?
- 2023年から2033年の間に、業界はどのように発展していくのか?現在および今後10年間に実施されるバイオリアクター・プロジェクトにはどのような意味があるのか?
- バイオリアクター市場をさらに拡大するために、製品の商業化の必要性は高まっているのか?
- バイオリアクター市場はどこへ向かい、どのようにすれば市場の最前線に立てるのか?
- 新製品やサービスラインに対する最適な投資オプションは何か?
- 企業を新たな成長軌道に乗せ、C-suiteに移行させるための重要な展望とは?
このことがバイオリアクター市場に現在、そして今後10年間にどのような影響を与えるかを知る必要がある:
- 2830ページに及ぶ本レポートでは、119の表、183の図表を掲載しています。
- 本レポートでは、業界における主要な有利分野を取り上げているため、今すぐターゲットを絞ることができます。
- 世界、地域、国の売上と成長に関する詳細な分析が含まれています。
- 競合他社が成功した主なトレンド、変化、収益予測をハイライトしています。
本レポートは、バイオリアクター市場が今後10年間でどのように発展していくのか、またCOVID-19の景気後退と好転の変動に合わせてどのように発展していくのかをお伝えします。この市場は、過去10年間のどの時点よりも今が重要です。
2033年までの予測やその他の分析から、商業的な展望が明らかになる
- 2033年までの収益予測に加え、直近の業績、成長率、市場シェアもご覧いただけます。
- ビジネスの展望と展開に関する独自の分析をご覧いただけます。
- 質的分析(市場力学、促進要因、機会、阻害要因、課題を含む)、コスト構造、バイオリアクター価格上昇の影響、最近の動向をご覧いただけます。
本レポートには、COVID-19が業界と貴社にどのような影響を与えるかについてのデータ分析と貴重な洞察が含まれている。本レポートでは、COVID-19の4つの回復パターンとその影響、すなわち「V」、「L」、「W」、「U」について論じている。
レポート対象セグメント
製品
- 単回使用
- 再使用
細胞
- 哺乳類細胞
- 細菌細胞
- 酵母細胞
- その他
分子
- モノクローナル抗体
- ワクチン
- 組み換えタンパク質
- 幹細胞
- 遺伝子治療
- その他
用途
- 開発段階
- 前臨床・臨床
- 商業生産
エンドユーザー
- 研究開発機関
- バイオ医薬品メーカー
- 製造受託機関(CMO)
世界市場全体と各分野の収益予測に加え、4つの地域と24の主要国市場の収益予測も掲載している:
北米
- アメリカ
- カナダ
欧州
- ドイツ
- 英国
- フランス
- スペイン
- イタリア
- ロシア
- その他の欧州
アジア太平洋
- 中国
- 日本
- インド
- オーストラリア
- 韓国
- シンガポール
- その他のアジア太平洋地域
ラテンアメリカ
- ブラジル
- メキシコ
- アルゼンチン
- コロンビア
- その他のラテンアメリカ
MEA
- GCC
- 南アフリカ
- その他のMEA
報告書に掲載されている主要企業
・ Bbi Biotech GmbH
・ セルexus International Ltd.
・ Cerセル A/S
・ CESCO Bioengineering Co. Ltd.
・ Danaher Corporation
・ Eppendorf SE
・ GEA Group Aktiengesellschaft
・ Getinge AB
・ Merck KGaA
・ PBS Biotech, Inc.
・ Sartorius AG
・ Shanghai Bailun Biological Technology Co., Ltd.
・ Thermo Fisher Scientific Inc.
バイオリアクター市場の2023年~2033年の世界全体の売上高(金額ベース)は、2023年に99億7,000万米ドルを超えると予測。2033年まで力強い収益成長が予測される。当研究所では、最大の可能性を秘めた組織を特定します。彼らの能力、進歩、商業的展望を発見し、一歩先を行くお手伝いをします。
バイオリアクター市場、2023-2033年レポートはどのように役立つのでしょうか?
要約すると、280ページに及ぶこのレポートは、以下のような知識を提供する:
- バイオリアクター市場の2033年までの収益予測、製品別、細胞別、分子別、用途別、エンドユーザー別の予測を世界レベルと地域レベルで掲載 - 業界の将来性を発見し、投資と収益に最も有利な場所を見つけることができます。
- 5つの地域と24の主要国市場の2033年までの収益予測 - 北米、欧州、アジア太平洋、中南米、MEAのバイオリアクター市場の2023年から2033年までの予測をご覧ください。また、米国、カナダ、メキシコ、ブラジル、ドイツ、フランス、英国、イタリア、中国、インド、日本、オーストラリアなどの主要国の市場も予測しています。
- 既存企業および市場参入を目指す企業の展望 - バイオリアクター市場に関わる主要企業13社の企業プロファイルを含む、2023年から2033年までの市場。
独自の予測による定量的・定性的分析をご覧ください。私たちのレポートだけに含まれる情報を入手し、貴重なビジネスインテリジェンスで情報を得ることができます。
他にはない情報
私たちの新しいレポートがあれば、知識に遅れをとったり、チャンスを逃したりする可能性が低くなります。弊社の調査レポートが貴社の調査、分析、意思決定にどのように役立つかをご覧ください。Visiongainの調査は、バイオリアクター市場、2023年から2033年、市場をリードする企業の商業分析を必要とするすべての人のためのものです。データ、トレンド、予測をご覧いただけます。
ページTOPに戻る
目次
目次
1 レポート概要
1.1 研究の目的
1.2 バイオリアクター市場の紹介
1.3 本レポートの特徴
1.4 本レポートを読むべき理由
1.5 本分析レポートが回答する主な質問
1.6 本レポートは誰のためのものか?
1.7 方法論
1.7.1 市場の定義
1.7.2 市場評価・予測手法
1.7.3 データの検証
1.7.3.1 一次調査
1.7.3.2 セカンダリーリサーチ
1.8 よくある質問(FAQ)
1.9 Visiongainの関連レポート
1.10 Visiongainについて
2 エグゼクティブ・サマリー
3 市場概要
3.1 主要な調査結果
3.2 市場ダイナミクス
3.2.1 市場促進要因
3.2.1.1 製薬・バイオテクノロジー業界におけるシングルユース・バイオリアクターの需要拡大
3.2.1.2 バイオリアクターの技術進歩
3.2.1.3 希少薬開発への注目の高まり
3.2.1.4 個別化医薬品に対する需要の高まり
3.2.2 市場抑制要因
3.2.2.1 シングルユースバイオリアクターの生産能力の低さ
3.2.2.2 抽出性および/または溶出性に関する懸念
3.2.3 市場機会
3.2.3.1 高度な自動化と制御
3.2.3.2 カスタマイズとモジュラーシステム
3.3 COVID-19インパクト分析
3.4 ポーターのファイブフォース分析
3.4.1 供給者の交渉力
3.4.2 買い手の交渉力
3.4.3 競争相手のライバル関係
3.4.4 代替品による脅威
3.4.5 新規参入企業の脅威
3.5 PEST分析
4 バイオリアクター市場分析:製品別
4.1 主要な調査結果
4.2 製品セグメント 市場魅力度指数
4.3 バイオリアクターの製品別市場規模推定と予測
4.4 シングルユース
4.4.1 2023〜2033年の地域別市場規模(US$ Million)
4.4.2 地域別市場シェア、2023年・2033年(%)
4.5 再利用可能
4.5.1 2023~2033年の地域別市場規模(US$ Million)
4.5.2 地域別市場シェア、2023年・2033年(%)
5 バイオリアクター市場分析:細胞別
5.1 主要な調査結果
5.2 細胞セグメント 市場魅力度指数
5.3 バイオリアクターの細胞別市場規模推定と予測
5.4 哺乳類細胞
5.4.1 2023〜2033年の地域別市場規模(US$ Million)
5.4.2 地域別市場シェア、2023年・2033年(%)
5.5 細菌細胞
5.5.1 2023~2033年の地域別市場規模(US$ Million)
5.5.2 地域別市場シェア、2023年・2033年(%)
5.6 酵母細胞
5.6.1 2023~2033年の地域別市場規模(US$ Million)
5.6.2 地域別市場シェア、2023年・2033年(%)
5.7 その他
5.7.1 2023〜2033年の地域別市場規模(US$ Million)
5.7.2 地域別市場シェア、2023年・2033年 (%)
6 バイオリアクター市場分析:分子別
6.1 主要な調査結果
6.2 分子セグメント 市場魅力度指数
6.3 バイオリアクターの分子別市場規模推定と予測
6.4 モノクローナル抗体
6.4.1 2023〜2033年の地域別市場規模(US$ Million)
6.4.2 地域別市場シェア、2023年・2033年(%)
6.5 ワクチン
6.5.1 2023〜2033年の地域別市場規模(US$ Million)
6.5.2 地域別市場シェア、2023年・2033年(%)
6.6 組換えタンパク質
6.6.1 2023~2033年の地域別市場規模(US$ Million)
6.6.2 地域別市場シェア、2023年・2033年(%)
6.7 幹細胞
6.7.1 2023~2033年の地域別市場規模(US$ Million)
6.7.2 地域別市場シェア、2023年・2033年(%)
6.8 遺伝子治療
6.8.1 2023~2033年の地域別市場規模(US$ Million)
6.8.2 地域別市場シェア、2023年・2033年(%)
6.9 その他
6.9.1 2023〜2033年の地域別市場規模(US$ Million)
6.9.2 地域別市場シェア、2023年・2033年 (%)
7 バイオリアクター市場分析:用途別
7.1 主要調査結果
7.2 用途セグメント 市場魅力度指数
7.3 バイオリアクターの用途別市場規模推定と予測
7.4 発展性
7.4.1 2023〜2033年の地域別市場規模(US$ Million)
7.4.2 地域別市場シェア、2023年・2033年(%)
7.5 前臨床および臨床
7.5.1 2023〜2033年の地域別市場規模(US$ Million)
7.5.2 地域別市場シェア、2023年・2033年(%)
7.6 商業生産
7.6.1 2023〜2033年の地域別市場規模(US$ Million)
7.6.2 地域別市場シェア、2023年・2033年(%)
8 バイオリアクター市場分析:エンドユーザー別
8.1 主要な調査結果
8.2 エンドユーザー区分: 市場魅力度指数
8.3 バイオリアクターのエンドユーザー別市場規模推定と予測
8.4 研究開発機関
8.4.1 2023〜2033年の地域別市場規模(US$ Million)
8.4.2 地域別市場シェア、2023年・2033年(%)
8.5 バイオ医薬品メーカー
8.5.1 2023~2033年の地域別市場規模(US$ Million)
8.5.2 地域別市場シェア、2023年・2033年(%)
8.6 受託製造機関(CMO)
8.6.1 2023~2033年の地域別市場規模(US$ Million)
8.6.2 地域別市場シェア、2023年・2033年(%)
9 バイオリアクター市場分析:地域別
9.1 主要な調査結果
9.2 地域別市場規模の推定と予測
10 北米のバイオリアクター市場分析
10.1 主要な調査結果
10.2 北米バイオリアクター市場魅力度指数
10.3 北米のバイオリアクター国別市場、2023年、2028年、2033年(US$ Million)
10.4 北米のバイオリアクター市場規模推定と予測:国別
10.5 北米のバイオリアクター市場規模推定と予測:製品別
10.6 北米のバイオリアクター市場規模推定と予測:細胞別
10.7 北米のバイオリアクター市場規模推定と予測:分子別
10.8 北米のバイオリアクター市場規模推定と予測:用途別
10.9 北米のバイオリアクター市場規模推定と予測:エンドユーザー別
10.10 米国のバイオリアクター市場分析
10.11 カナダのバイオリアクターの市場分析
11 欧州のバイオリアクター市場分析
11.1 主要な調査結果
11.2 欧州のバイオリアクター市場魅力度指数
11.3 欧州のバイオリアクター国別市場、2023年、2028年、2033年(US$ Million)
11.4 欧州のバイオリアクター市場規模推定と予測:国別
11.5 欧州のバイオリアクター市場規模推定と予測:製品別
11.6 欧州のバイオリアクター市場規模推定と予測:細胞別
11.7 欧州のバイオリアクター市場規模推定と予測:分子別
11.8 欧州のバイオリアクター市場規模推定と予測:用途別
11.9 欧州のバイオリアクター市場規模推定と予測:エンドユーザー別
11.10 ドイツのバイオリアクター市場分析
11.11 フランスのバイオリアクター市場分析
11.12 イギリスのバイオリアクター市場分析
11.13 イタリアのバイオリアクター市場分析
11.14 スペインのバイオリアクター市場分析
11.15 ロシアのバイオリアクター市場分析
11.16 その他の欧州のバイオリアクター市場分析
12 アジア太平洋地域のバイオリアクター市場分析
12.1 主要な調査結果
12.2 アジア太平洋地域のバイオリアクター市場魅力度指数
12.3 アジア太平洋地域のバイオリアクター国別市場、2023年、2028年、2033年(US$ Million)
12.4 アジア太平洋地域のバイオリアクター市場規模推定と予測:国別
12.5 アジア太平洋地域のバイオリアクター市場規模推定と予測:製品別
12.6 アジア太平洋地域のバイオリアクター市場規模推定と予測:細胞別
12.7 アジア太平洋地域のバイオリアクター市場規模推定と予測:分子別
12.8 アジア太平洋地域のバイオリアクター市場規模推定と予測:用途別
12.9 アジア太平洋地域のバイオリアクター市場規模推定と予測:エンドユーザー別
12.10 日本のバイオリアクター市場分析
12.11 中国のバイオリアクター市場分析
12.12 インドのバイオリアクター市場分析
12.13 オーストラリアのバイオリアクター市場分析
12.14 韓国のバイオリアクター市場分析
12.15 シンガポールのバイオリアクター市場分析
12.16 その他のアジア太平洋地域のバイオリアクター市場分析
13 ラテンアメリカのバイオリアクター市場分析
13.1 主要な調査結果
13.2 ラテンアメリカのバイオリアクター市場魅力度指数
13.3 ラテンアメリカのバイオリアクター国別市場、2023年、2028年、2033年(US$ Million)
13.4 ラテンアメリカのバイオリアクター市場規模推定と予測:国別
13.5 ラテンアメリカのバイオリアクター市場規模推定と予測:製品別
13.6 ラテンアメリカのバイオリアクター市場規模推定と予測:細胞別
13.7 ラテンアメリカのバイオリアクター市場規模推定と予測:分子別
13.8 ラテンアメリカのバイオリアクター市場規模推定と予測:用途別
13.9 ラテンアメリカのバイオリアクター市場規模推定と予測:エンドユーザー別
13.10 ブラジルのバイオリアクター市場分析
13.11 メキシコのバイオリアクター市場分析
13.12 アルゼンチンのバイオリアクター市場分析
13.13 コロンビアのバイオリアクター市場分析
13.14 その他のラテンアメリカのバイオリアクター市場分析
14 MEAのバイオリアクター市場分析
14.1 主要な調査結果
14.2 MEAのバイオリアクター市場魅力度指数
14.3 MEAのバイオリアクター国別市場、2023年、2028年、2033年(US$ Million)
14.4 MEAのバイオリアクター市場規模推定と予測:国別
14.5 MEAのバイオリアクター市場規模推定と予測:製品別
14.6 MEAのバイオリアクター市場規模推定と予測:細胞別
14.7 MEAのバイオリアクター市場規模推定と予測:分子別
14.8 MEAのバイオリアクター市場規模推定と予測:用途別
14.9 MEAのバイオリアクター市場規模推定と予測:エンドユーザー別
14.10 GCCのバイオリアクター市場分析
14.11 南アフリカのバイオリアクター市場分析
14.12 その他のMEAバイオリアクター市場分析
15 会社概要
15.1 競争環境、2022年
15.2 戦略的展望
15.3 Bbi Biotech GmbH
15.3.1 会社概要
15.3.2 会社概要
15.3.3 製品ベンチマーク
15.3.4 戦略的展望
15.4 Cellexus International
15.4.1 会社概要
15.4.2 会社概要
15.4.3 製品ベンチマーク
15.4.4 戦略的展望
15.5 CerCell A/S
15.5.1 会社概要
15.5.2 会社概要
15.5.3 製品ベンチマーク
15.6 CESCO Bioengineering Co.Ltd.
15.6.1 会社概要
15.6.2 会社概要
15.6.3 製品ベンチマーク
15.7 Danaher Corporation
15.7.1 会社概要
15.7.2 会社概要
15.7.3 財務分析
15.7.3.1 純収入、2017-2022年
15.7.3.2 R&D、2017-2022年
15.7.3.3 地域市場シェア、2022年
15.7.4 製品ベンチマーク
15.7.5 戦略的展望
15.8 Eppendorf SE
15.8.1 会社概要
15.8.2 会社概要
15.8.3 財務分析
15.8.3.1 純売上高、2017-2022年
15.8.3.2 売上高、2017-2022年
15.8.3.3 地域市場シェア、2022年
15.8.4 製品ベンチマーク
15.8.5 戦略的展望
15.9 GEA Group Aktiengesellschaft
15.9.1 会社概要
15.9.2 会社概要
15.9.3 財務分析
15.9.3.1 純収入、2017年~2022年
15.9.3.2 R&D、2017年〜2022年
15.9.3.3 地域市場シェア、2022年
15.9.4 製品ベンチマーク
15.9.5 戦略的展望
15.10 Getinge AB
15.10.1 会社概要
15.10.2 会社概要
15.10.3 財務分析
15.10.3.1 純収入、2017-2022年
15.10.3.2 売上高、2017-2022年
15.10.3.3 地域市場シェア、2022年
15.10.4 製品ベンチマーク
15.10.5 戦略的展望
15.11 Merck KGaA
15.11.1 会社概要
15.11.2 会社概要
15.11.3 財務分析
15.11.3.1 純収入、2017-2022年
15.11.3.2 R&D、2017-2022年
15.11.3.3 地域市場シェア、2022年
15.11.4 製品ベンチマーク
15.11.5 戦略的展望
15.12 PBS Biotech, Inc.
15.12.1 会社概要
15.12.2 会社概要
15.12.3 製品ベンチマーク
15.12.4 戦略的展望
15.13 Sartorius AG
15.13.1 会社概要
15.13.2 会社概要
15.13.3 財務分析
15.13.3.1 純収入、2017-2022年
15.13.3.2 売上高、2017-2022年
15.13.3.3 地域市場シェア、2022年
15.13.4 製品ベンチマーク
15.14 Shanghai Bailun Biological Technology Co., Ltd.
15.14.1 会社概要
15.14.2 会社概要
15.14.3 製品ベンチマーク
15.15 Thermo Fisher Scientific Inc.
15.15.1 会社概要
15.15.2 会社概要
15.15.3 財務分析
15.15.3.1 純収入、2017-2022年
15.15.3.2 地域市場シェア、2022年
15.15.4 製品ベンチマーク
15.15.5 戦略的展望
16 結論と提言
16.1 Visiongainからの結びの言葉
16.2 市場プレイヤーへの提言
ページTOPに戻る
図表リスト
表の一覧
Table 1 Bioreactors Market Snapshot, 2023 & 2033 (US$ Million, CAGR %)
Table 2 Bioreactors Market Forecast by Region, 2023-2033 (US$ Million, AGR%, CAGR%): “V” Shaped Recovery
Table 3 Bioreactors Market Forecast by Region, 2023-2033 (US$ Million, AGR%, CAGR%): “U” Shaped Recovery
Table 4 Bioreactors Market Forecast by Region, 2023-2033 (US$ Million, AGR%, CAGR%): “W” Shaped Recovery
Table 5 Bioreactors Market Forecast by Region, 2023-2033 (US$ Million, AGR%, CAGR%): “L” Shaped Recovery
Table 6 Bioreactors Market Forecast by Product, 2023-2033 (US$ Million, AGR%, CAGR %)
Table 7 Single-use Market Forecast by Region, 2023-2033 (US$ Million, AGR%, CAGR %)
Table 8 Reusable Market Forecast by Region, 2023-2033 (US$ Million, AGR%, CAGR %)
Table 9 Bioreactors Market Forecast by Cell, 2023-2033 (US$ Million, AGR%, CAGR%)
Table 10 Mammalian Cells Market Forecast by Region, 2023-2033 (US$ Million, AGR%, CAGR%)
Table 11 Bacterial Cells Market Forecast by Region, 2023-2033 (US$ Million, AGR%, CAGR%)
Table 12 Yeast Cells Market Forecast by Region, 2023-2033 (US$ Million, AGR%, CAGR%)
Table 13 Others Market Forecast by Region, 2023-2033 (US$ Million, AGR%, CAGR%)
Table 14 Bioreactors Market Molecule, 2023-2033 (US$ Million, AGR%, CAGR%)
Table 15 Monoclonal Antibodies Market Forecast by Region, 2023-2033 (US$ Million, AGR%, CAGR%)
Table 16 Vaccines Market Forecast by Region, 2023-2033 (US$ Million, AGR%, CAGR%)
Table 17 Recombinant Proteins Market Forecast by Region, 2023-2033 (US$ Million, AGR%, CAGR%)
Table 18 Stem Cells Market Forecast by Region, 2023-2033 (US$ Million, AGR%, CAGR%)
Table 19 Gene Therapy Market Forecast by Region, 2023-2033 (US$ Million, AGR%, CAGR%)
Table 20 Others Market Forecast by Region, 2023-2033 (US$ Million, AGR%, CAGR%)
Table 21 Bioreactors Market Usage, 2023-2033 (US$ Million, AGR%, CAGR%)
Table 22 Developmental Market Forecast by Region, 2023-2033 (US$ Million, AGR%, CAGR%)
Table 23 Pre-clinical & Clinical Market Forecast by Region, 2023-2033 (US$ Million, AGR%, CAGR%)
Table 24 Commercial Production Market Forecast by Region, 2023-2033 (US$ Million, AGR%, CAGR%)
Table 25 Bioreactors Market End-users, 2023-2033 (US$ Million, AGR%, CAGR%)
Table 26 R&D Organisations Market Forecast by Region, 2023-2033 (US$ Million, AGR%, CAGR%)
Table 27 Biopharma Manufacturers Market Forecast by Region, 2023-2033 (US$ Million, AGR%, CAGR%)
Table 28 Contract Manufacturing Organisations (CMOs) Market Forecast by Region, 2023-2033 (US$ Million, AGR%, CAGR%)
Table 29 Bioreactors Market Forecast by Region, 2023-2033 (US$ Million, AGR%, CAGR%)
Table 30 North America Bioreactors Market Forecast by Country, 2023-2033 (US$ Million, AGR%, CAGR %)
Table 31 North America Bioreactors Market Forecast by Product, 2023-2033 (US$ Million, AGR%, CAGR %)
Table 32 North America Bioreactors Market Forecast by Cell, 2023-2033 (US$ Million, AGR%, CAGR%)
Table 33 North America Bioreactors Market Molecule, 2023-2033 (US$ Million, AGR%, CAGR%)
Table 34 North America Bioreactors Market Usage, 2023-2033 (US$ Million, AGR%, CAGR%)
Table 35 North America Bioreactors Market End-users, 2023-2033 (US$ Million, AGR%, CAGR%)
Table 36 U.S. Bioreactors Market Forecast, 2023-2033 (US$ Million, AGR%, CAGR%)
Table 37 Canada Bioreactors Market Forecast, 2023-2033 (US$ Million, AGR%, CAGR %)
Table 38 Europe Bioreactors Market Forecast by Country, 2023-2033 (US$ Million, AGR%, CAGR%)
Table 39 Europe Bioreactors Market Forecast by Product, 2023-2033 (US$ Million, AGR%, CAGR %)
Table 40 Europe Bioreactors Market Forecast by Cell, 2023-2033 (US$ Million, AGR%, CAGR%)
Table 41 Bioreactors Market Molecule, 2023-2033 (US$ Million, AGR%, CAGR%)
Table 42 Bioreactors Market Usage, 2023-2033 (US$ Million, AGR%, CAGR%)
Table 43 Bioreactors Market End-users, 2023-2033 (US$ Million, AGR%, CAGR%)
Table 44 Germany Bioreactors Market Forecast, 2023-2033 (US$ Million, AGR%, CAGR %)
Table 45 France Bioreactors Market Forecast, 2023-2033 (US$ Million, AGR%, CAGR %)
Table 46 UK Bioreactors Market Forecast, 2023-2033 (US$ Million, AGR%, CAGR%)
Table 47 Italy Bioreactors Market Forecast, 2023-2033 (US$ Million, AGR%, CAGR %)
Table 48 Spain Bioreactors Market Forecast, 2023-2033 (US$ Million, AGR%, CAGR%)
Table 49 Russia Bioreactors Market Forecast, 2023-2033 (US$ Million, AGR%, CAGR%)
Table 50 Rest of Europe Bioreactors Market Forecast, 2023-2033 (US$ Million, AGR%, CAGR%)
Table 51 Asia Pacific Bioreactors Market Forecast by Country, 2023-2033 (US$ Million,, AGR%, CAGR%)
Table 52 Bioreactors Market Forecast by Product, 2023-2033 (US$ Million, AGR%, CAGR %)
Table 53 Bioreactors Market Forecast by Cell, 2023-2033 (US$ Million, AGR%, CAGR%)
Table 54 Bioreactors Market Molecule, 2023-2033 (US$ Million, AGR%, CAGR%)
Table 55 Bioreactors Market Usage, 2023-2033 (US$ Million, AGR%, CAGR%)
Table 56 Bioreactors Market End-users, 2023-2033 (US$ Million, AGR%, CAGR%)
Table 57 Japan Bioreactors Market Forecast, 2023-2033 (US$ Million, AGR%, CAGR%)
Table 58 China Bioreactors Market Forecast, 2023-2033 (US$ Million, AGR%, CAGR%)
Table 59 India Bioreactors Market Forecast, 2023-2033 (US$ Million, AGR%, CAGR %)
Table 60 Australia Bioreactors Market Forecast, 2023-2033 (US$ Million, AGR%, CAGR %)
Table 61 South Korea Bioreactors Market Forecast, 2023-2033 (US$ Million, AGR%, CAGR%)
Table 62 Singapore Bioreactors Market Forecast, 2023-2033 (US$ Million, AGR%, CAGR%)
Table 63 Rest of Asia Pacific Bioreactors Market Forecast, 2023-2033 (US$ Million, AGR%, CAGR %)
Table 64 Latin America Bioreactors Market Forecast by Country, 2023-2033 (US$ Million,, AGR%, CAGR%)
Table 65 Bioreactors Market Forecast by Product, 2023-2033 (US$ Million, AGR%, CAGR %)
Table 66 Bioreactors Market Forecast by Cell, 2023-2033 (US$ Million, AGR%, CAGR%)
Table 67 Bioreactors Market Molecule, 2023-2033 (US$ Million, AGR%, CAGR%)
Table 68 Bioreactors Market Usage, 2023-2033 (US$ Million, AGR%, CAGR%)
Table 69 Bioreactors Market End-users, 2023-2033 (US$ Million, AGR%, CAGR%)
Table 70 Brazil Bioreactors Market Forecast, 2023-2033 (US$ Million, AGR%, CAGR %)
Table 71 Mexico Bioreactors Market Forecast, 2023-2033 (US$ Million, AGR%, CAGR%)
Table 72 Argentina Bioreactors Market Forecast, 2023-2033 (US$ Million, AGR%, CAGR%)
Table 73 Colombia Bioreactors Market Forecast, 2023-2033 (US$ Million, AGR%, CAGR%)
Table 74 Rest of Latin America Bioreactors Market Forecast, 2023-2033 (US$ Million, AGR%, CAGR%)
Table 75 MEA Bioreactors Market Forecast by Country, 2023-2033 (US$ Million, AGR%, CAGR%)
Table 76 Bioreactors Market Forecast by Product, 2023-2033 (US$ Million, AGR%, CAGR %)
Table 77 Bioreactors Market Forecast by Cell, 2023-2033 (US$ Million, AGR%, CAGR%)
Table 78 Bioreactors Market Molecule, 2023-2033 (US$ Million, AGR%, CAGR%)
Table 79 Bioreactors Market Usage, 2023-2033 (US$ Million, AGR%, CAGR%)
Table 80 Bioreactors Market End-users, 2023-2033 (US$ Million, AGR%, CAGR%)
Table 81 GCC Bioreactors Market Forecast, 2023-2033 (US$ Million, AGR%, CAGR%)
Table 82 South Africa Bioreactors Market Forecast, 2023-2033 (US$ Million, AGR%, CAGR%)
Table 83 Rest of MEA Bioreactors Market Forecast, 2023-2033 (US$ Million, AGR%, CAGR %)
Table 84 Strategic Outlook
Table 85 Bbi Biotech GmbH: Key Details, (CEO, HQ, Revenue, Founded, No. of Employees, Company Type, Website, Business Segment)
Table 86 Bbi Biotech GmbH: Product Benchmarking
Table 87 Bbi Biotech GmbH.: Strategic Outlook
Table 88 Cellexus International.: Key Details, (CEO, HQ, Revenue, Founded, No. of Employees, Company Type, Website, Business Segment)
Table 89 Cellexus International: Product Benchmarking
Table 90 Cellexus International: Strategic Outlook
Table 91 CerCell A/S: Key Details, (CEO, HQ, Revenue, Founded, No. of Employees, Company Type, Website, Business Segment)
Table 92 CerCell A/S: Product Benchmarking
Table 93 CESCO Bioengineering Co. Ltd.: Key Details, (CEO, HQ, Revenue, Founded, No. of Employees, Company Type, Website, Business Segment)
Table 94 CESCO Bioengineering Co. Ltd.: Product Benchmarking
Table 95 Danaher Corporation: Key Details, (CEO, HQ, Revenue, Founded, No. of Employees, Company Type, Website, Business Segment)
Table 96 Danaher Corporation: Product Benchmarking
Table 97 Danaher Corporation: Strategic Outlook
Table 98 Eppendorf SE: Key Details, (CEO, HQ, Revenue, Founded, No. of Employees, Company Type, Website, Business Segment)
Table 99 Eppendorf SE: Product Benchmarking
Table 100 Eppendorf SE: Strategic Outlook
Table 101 GEA Group Aktiengesellschaft: Key Details, (CEO, HQ, Revenue, Founded, No. of Employees, Company Type, Website, Business Segment)
Table 102 GEA Group Aktiengesellschaft: Product Benchmarking
Table 103 GEA Group: Strategic Outlook
Table 104 Getinge AB: Key Details, (CEO, HQ, Revenue, Founded, No. of Employees, Company Type, Website, Business Segment)
Table 105 Getinge AB: Product Benchmarking
Table 106 Getinge AB: Strategic Outlook
Table 107 Merck KGaA: Key Details, (CEO, HQ, Revenue, Founded, No. of Employees, Company Type, Website, Business Segment)
Table 108 Merck KGaA: Product Benchmarking
Table 109 Merck KGaA: Strategic Outlook
Table 110 PBS Biotech, Inc.: Key Details, (CEO, HQ, Revenue, Founded, No. of Employees, Company Type, Website, Business Segment)
Table 111 PBS Biotech, Inc.: Product Benchmarking
Table 112 PBS Biotech, Inc.: Strategic Outlook
Table 113 Sartorius AG: Key Details, (CEO, HQ, Revenue, Founded, No. of Employees, Company Type, Website, Business Segment)
Table 114 Sartorius AG: Product Benchmarking
Table 115 Shanghai Bailun Biological Technology Co., Ltd.: Key Details, (CEO, HQ, Revenue, Founded, No. of Employees, Company Type, Website, Business Segment)
Table 116 Shanghai Bailun Biological Technology Co., Ltd.: Product Benchmarking
Table 117 Thermo Fisher Scientific Inc.: Key Details, (CEO, HQ, Revenue, Founded, No. of Employees, Company Type, Website, Business Segment)
Table 118 Thermo Fisher Scientific Inc.: Product Benchmarking
Table 119 Thermo Fisher Scientific Inc.: Strategic Outlook
図の一覧
Figure 1 Bioreactors Market Segmentation
Figure 2 Bioreactors Market by Product: Market Attractiveness Index
Figure 3 Bioreactors Market by Cell: Market Attractiveness Index
Figure 4 Bioreactors Market by Molecule: Market Attractiveness Index
Figure 5 Bioreactors Market by Usage: Market Attractiveness Index
Figure 6 Bioreactors Market by End-users: Market Attractiveness Index
Figure 7 Bioreactors Market Attractiveness Index by Region
Figure 8 Bioreactors Market: Market Dynamics
Figure 9 Bioreactors Market by Region, 2023-2033 (US$ Million, AGR %): “V” Shaped Recovery
Figure 10 Bioreactors Market by Region, 2023-2033 (US$ Million, AGR %): “U” Shaped Recovery
Figure 11 Bioreactors Market by Region, 2023-2033 (US$ Million, AGR %): “W” Shaped Recovery
Figure 12 Bioreactors Market by Region, 2023-2033 (US$ Million, AGR %): “L” Shaped Recovery
Figure 13 Bioreactors Market: Porter’s Five Forces Analysis
Figure 14 Bioreactors Market: PEST Analysis
Figure 15 Bioreactors Market by Product: Market Attractiveness Index
Figure 16 Bioreactors Market Forecast by Product, 2023-2033 (US$ Million, AGR %)
Figure 17 Bioreactors Market Share Forecast by Product, 2023, 2028, 2033 (%)
Figure 18 Single-use Market Forecast by Region, 2023-2033 (US$ Million, AGR %)
Figure 19 Single-use Market Share Forecast by Region, 2023 & 2033 (%)
Figure 20 Reusable Market Forecast by Region, 2023-2033 (US$ Million, AGR %)
Figure 21 Reusable Market Share Forecast by Region, 2023 & 2033 (%)
Figure 22 Bioreactors Market by Cell: Market Attractiveness Index
Figure 23 Bioreactors Market Forecast by Cell, 2023-2033 (US$ Million, AGR %)
Figure 24 Bioreactors Market Share Forecast by Cell, 2023, 2028, 2033 (%)
Figure 25 Mammalian Cells Market Forecast by Region, 2023-2033 (US$ Million, AGR %)
Figure 26 Mammalian Cells Market Share Forecast by Region, 2023 & 2033 (%)
Figure 27 Bacterial Cells Market Forecast by Region, 2023-2033 (US$ Million, AGR %)
Figure 28 Bacterial Cells Market Share Forecast by Region, 2023 & 2033 (%)
Figure 29 Yeast Cells Market Forecast by Region, 2023-2033 (US$ Million, AGR %)
Figure 30 Yeast Cells Market Share Forecast by Region, 2023 & 2033 (%)
Figure 31 Others Market Forecast by Region, 2023-2033 (US$ Million, AGR %)
Figure 32 Others Market Share Forecast by Region, 2023 & 2033 (%)
Figure 33 Bioreactors Market by Molecule: Market Attractiveness Index
Figure 34 Bioreactors Market Forecast by Molecule, 2023-2033 (US$ Million, AGR %)
Figure 35 Bioreactors Market Share Forecast by Molecule, 2023, 2028, 2033 (%)
Figure 36 Monoclonal Antibodies Segment Market Forecast by Region, 2023-2033 (US$ Million, AGR %)
Figure 37 Monoclonal Antibodies Segment Market Share Forecast by Region, 2023 & 2033 (%)
Figure 38 Vaccines Market Forecast by Region, 2023-2033 (US$ Million, AGR %)
Figure 39 Vaccines Market Share Forecast by Region, 2023 & 2033 (%)
Figure 40 Recombinant Proteins Market Forecast by Region, 2023-2033 (US$ Million, AGR %)
Figure 41 Recombinant Proteins Market Share Forecast by Region, 2023 & 2033 (%)
Figure 42 Stem Cells Market Forecast by Region, 2023-2033 (US$ Million, AGR %)
Figure 43 Stem Cells Market Share Forecast by Region, 2023 & 2033 (%)
Figure 44 Gene Therapy Market Forecast by Region, 2023-2033 (US$ Million, AGR %)
Figure 45 Gene Therapy Market Share Forecast by Region, 2023 & 2033 (%)
Figure 46 Others Market Forecast by Region, 2023-2033 (US$ Million, AGR %)
Figure 47 Others Market Share Forecast by Region, 2023 & 2033 (%)
Figure 48 Bioreactors Market by Usage: Market Attractiveness Index
Figure 49 Bioreactors Market Forecast by Usage, 2023-2033 (US$ Million, AGR %)
Figure 50 Bioreactors Market Share Forecast by Usage, 2023, 2028, 2033 (%)
Figure 51 Developmental Market Forecast by Region, 2023-2033 (US$ Million, AGR %)
Figure 52 Developmental Market Share Forecast by Region, 2023 & 2033 (%)
Figure 53 Pre-clinical & Clinical Market Forecast by Region, 2023-2033 (US$ Million, AGR %)
Figure 54 Pre-clinical & Clinical Market Share Forecast by Region, 2023 & 2033 (%)
Figure 55 Commercial Production Market Forecast by Region, 2023-2033 (US$ Million, AGR %)
Figure 56 Commercial Production Market Share Forecast by Region, 2023 & 2033 (%)
Figure 57 Bioreactors Market by End-users: Market Attractiveness Index
Figure 58 Bioreactors Market Forecast by End-users, 2023-2033 (US$ Million, AGR %)
Figure 59 Bioreactors Market Share Forecast by End-users, 2023, 2028, 2033 (%)
Figure 60 R&D Organisations Market Forecast by Region, 2023-2033 (US$ Million, AGR %)
Figure 61 R&D Organisations Market Share Forecast by Region, 2023 & 2033 (%)
Figure 62 Biopharma Manufacturers Market Forecast by Region, 2023-2033 (US$ Million, AGR %)
Figure 63 Biopharma Manufacturers Market Share Forecast by Region, 2023 & 2033 (%)
Figure 64 Contract Manufacturing Organisations (CMOs) Market Forecast by Region, 2023-2033 (US$ Million, AGR %)
Figure 65 Contract Manufacturing Organisations (CMOs) Market Share Forecast by Region, 2023 & 2033 (%)
Figure 66 Bioreactors Market Forecast by Region 2023 and 2033 (Revenue, CAGR %)
Figure 67 Bioreactors Market Share Forecast by Region 2023, 2028, 2033 (%)
Figure 68 Bioreactors Market by Region, 2023-2033 (US$ Million, AGR %)
Figure 69 North America Bioreactors Market Attractiveness Index
Figure 70 North America Bioreactors Market by Region, 2023, 2028 & 2033 (US$ Million)
Figure 71 North America Bioreactors Market Forecast by Country, 2023-2033 (US$ Million, AGR %)
Figure 72 North America Bioreactors Market Share Forecast by Country, 2023 & 2033 (%)
Figure 73 North America Bioreactors Market Forecast by Product, 2023-2033 (US$ Million, AGR %)
Figure 74 North America Bioreactors Market Share Forecast by Product, 2023 & 2033 (%)
Figure 75 North America Bioreactors Market Forecast by Cell, 2023-2033 (US$ Million, AGR %)
Figure 76 North America Bioreactors Market Share Forecast by Cell, 2023 & 2033 (%)
Figure 77 North America Bioreactors Market Forecast by Molecule, 2023-2033 (US$ Million, AGR %)
Figure 78 North America Bioreactors Market Share Forecast by Molecule, 2023 & 2033 (%)
Figure 79 North America Bioreactors Market Forecast by Usage, 2023-2033 (US$ Million, AGR %)
Figure 80 North America Bioreactors Market Share Forecast by Usage, 2023 & 2033 (%)
Figure 81 North America Bioreactors Market Forecast by End-users, 2023-2033 (US$ Million, AGR %)
Figure 82 North America Bioreactors Market Share Forecast by End-users, 2023 & 2033 (%)
Figure 83 U.S. Bioreactors Market Forecast, 2023-2033 (US$ Million, AGR %)
Figure 84 Canada Bioreactors Market Forecast, 2023-2033 (US$ Million, AGR %)
Figure 85 Europe Bioreactors Market Attractiveness Index
Figure 86 Europe Bioreactors Market by Region, 2023, 2028 & 2033 (US$ Million)
Figure 87 Europe Bioreactors Market Forecast by Country, 2023-2033 (US$ Million, AGR %)
Figure 88 Europe Bioreactors Market Share Forecast by Country, 2023 & 2033 (%)
Figure 89 Europe Bioreactors Market Forecast by Product, 2023-2033 (US$ Million, AGR %)
Figure 90 Europe Bioreactors Market Share Forecast by Product, 2023 & 2033 (%)
Figure 91 Europe Bioreactors Market Forecast by Cell, 2023-2033 (US$ Million, AGR %)
Figure 92 Europe Bioreactors Market Share Forecast by Cell, 2023 & 2033 (%)
Figure 93 Europe Bioreactors Market Forecast by Molecule, 2023-2033 (US$ Million, AGR %)
Figure 94 Europe Bioreactors Market Share Forecast by Molecule, 2023 & 2033 (%)
Figure 95 Europe Bioreactors Market Forecast by Usage, 2023-2033 (US$ Million, AGR %)
Figure 96 Europe Bioreactors Market Share Forecast by Usage, 2023 & 2033 (%)
Figure 97 Europe Bioreactors Market Forecast by End-users, 2023-2033 (US$ Million, AGR %)
Figure 98 Europe Bioreactors Market Share Forecast by End-users, 2023 & 2033 (%)
Figure 99 Germany Bioreactors Market Forecast, 2023-2033 (US$ Million, AGR %)
Figure 100 France Bioreactors Market Forecast, 2023-2033 (US$ Million, AGR %)
Figure 101 UK Bioreactors Market Forecast, 2023-2033 (US$ Million, AGR %)
Figure 102 Italy Bioreactors Market Forecast, 2023-2033 (US$ Million, AGR %)
Figure 103 Spain Bioreactors Market Forecast, 2023-2033 (US$ Million, AGR %)
Figure 104 Russia Bioreactors Market Forecast, 2023-2033 (US$ Million, AGR %)
Figure 105 Rest of Europe Bioreactors Market Forecast, 2023-2033 (US$ Million, AGR %)
Figure 106 Asia Pacific Bioreactors Market Attractiveness Index
Figure 107 Asia Pacific Bioreactors Market by Region, 2023, 2028 & 2033 (US$ Million)
Figure 108 Asia Pacific Bioreactors Market Forecast by Country, 2023-2033 (US$ Million, AGR %)
Figure 109 Asia Pacific Bioreactors Market Share Forecast by Country, 2023 & 2033 (%)
Figure 110 Asia Pacific Bioreactors Market Forecast by Product, 2023-2033 (US$ Million, AGR %)
Figure 111 Asia Pacific Bioreactors Market Share Forecast by Product, 2023 & 2033 (%)
Figure 112 Asia Pacific Bioreactors Market Forecast by Cell, 2023-2033 (US$ Million, AGR %)
Figure 113 Asia Pacific Bioreactors Market Share Forecast by Cell, 2023 & 2033 (%)
Figure 114 Asia Pacific Bioreactors Market Forecast by Molecule, 2023-2033 (US$ Million, AGR %)
Figure 115 Asia Pacific Bioreactors Market Share Forecast by Molecule, 2023 & 2033 (%)
Figure 116 Asia Pacific Bioreactors Market Forecast by Usage, 2023-2033 (US$ Million, AGR %)
Figure 117 Asia Pacific Bioreactors Market Share Forecast by Usage, 2023 & 2033 (%)
Figure 118 Asia Pacific Bioreactors Market Forecast by End-users, 2023-2033 (US$ Million, AGR %)
Figure 119 Asia Pacific Bioreactors Market Share Forecast by Usage, 2023 & 2033 (%)
Figure 120 Japan Bioreactors Market Forecast, 2023-2033 (US$ Million, AGR %)
Figure 121 China Bioreactors Market Forecast, 2023-2033 (US$ Million, AGR %)
Figure 122 India Bioreactors Market Forecast, 2023-2033 (US$ Million, AGR %)
Figure 123 Australia Bioreactors Market Forecast, 2023-2033 (US$ Million, AGR %)
Figure 124 South Korea Bioreactors Market Forecast, 2023-2033 (US$ Million, AGR %)
Figure 125 Singapore Bioreactors Market Forecast, 2023-2033 (US$ Million, AGR %)
Figure 126 Rest of Asia Pacific Bioreactors Market Forecast, 2023-2033 (US$ Million, AGR %)
Figure 127 Latin America Bioreactors Market Attractiveness Index
Figure 128 Latin America Bioreactors Market by Region, 2023, 2028 & 2033 (US$ Million)
Figure 129 Latin America Bioreactors Market Forecast by Country, 2023-2033 (US$ Million, AGR %)
Figure 130 Latin America Bioreactors Market Share Forecast by Country, 2023 & 2033 (%)
Figure 131 Latin America Bioreactors Market Forecast by Product, 2023-2033 (US$ Million, AGR %)
Figure 132 Latin America Bioreactors Market Share Forecast by Product, 2023 & 2033 (%)
Figure 133 Latin America Bioreactors Market Forecast by Cell, 2023-2033 (US$ Million, AGR %)
Figure 134 Latin America Bioreactors Market Share Forecast by Cell, 2023 & 2033 (%)
Figure 135 Latin America Bioreactors Market Forecast by Molecule, 2023-2033 (US$ Million, AGR %)
Figure 136 Latin America Bioreactors Market Share Forecast by Molecule, 2023 & 2033 (%)
Figure 137 Latin America Bioreactors Market Forecast by Usage, 2023-2033 (US$ Million, AGR %)
Figure 138 Latin America Bioreactors Market Share Forecast by Usage, 2023 & 2033 (%)
Figure 139 Latin America Bioreactors Market Forecast by End-users, 2023-2033 (US$ Million, AGR %)
Figure 140 Latin America Bioreactors Market Share Forecast by End-users, 2023 & 2033 (%)
Figure 141 Brazil Bioreactors Market Forecast, 2023-2033 (US$ Million, AGR %)
Figure 142 Mexico Bioreactors Market Forecast, 2023-2033 (US$ Million, AGR %)
Figure 143 Argentina Bioreactors Market Forecast, 2023-2033 (US$ Million, AGR %)
Figure 144 Colombia Bioreactors Market Forecast, 2023-2033 (US$ Million, AGR %)
Figure 145 Rest of Latin America Bioreactors Market Forecast, 2023-2033 (US$ Million, AGR %)
Figure 146 MEA Bioreactors Market Attractiveness Index
Figure 147 MEA Bioreactors Market by Region, 2023, 2028 & 2033 (US$ Million)
Figure 148 MEA Bioreactors Market Forecast by Country, 2023-2033 (US$ Million, AGR %)
Figure 149 MEA Bioreactors Market Share Forecast by Country, 2023 & 2033 (%)
Figure 150 MEA Bioreactors Market Forecast by Product, 2023-2033 (US$ Million, AGR %)
Figure 151 MEA Bioreactors Market Share Forecast by Product, 2023 & 2033 (%)
Figure 152 MEA Bioreactors Market Forecast by Cell, 2023-2033 (US$ Million, AGR %)
Figure 153 MEA Bioreactors Market Share Forecast by Cell, 2023 & 2033 (%)
Figure 154 MEA Bioreactors Market Forecast by Molecule, 2023-2033 (US$ Million, AGR %)
Figure 155 MEA Bioreactors Market Share Forecast by Molecule, 2023 & 2033 (%)
Figure 156 MEA Bioreactors Market Forecast by Usage, 2023-2033 (US$ Million, AGR %)
Figure 157 MEA Bioreactors Market Share Forecast by Usage, 2023 & 2033 (%)
Figure 158 MEA Bioreactors Market Forecast by End-users, 2023-2033 (US$ Million, AGR %)
Figure 159 MEA Bioreactors Market Share Forecast by End-users, 2023 & 2033 (%)
Figure 160 GCC Bioreactors Market Forecast, 2023-2033 (US$ Million, AGR %)
Figure 161 South Africa Bioreactors Market Forecast, 2023-2033 (US$ Million, AGR %)
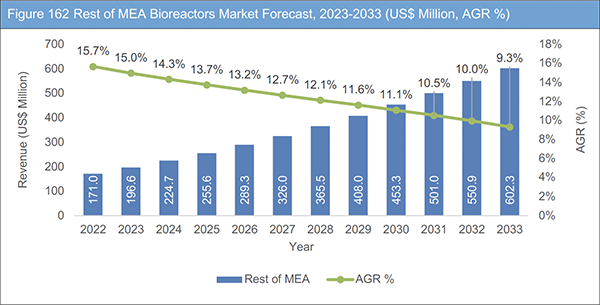
Figure 162 Rest of MEA Bioreactors Market Forecast, 2023-2033 (US$ Million, AGR %)
Figure 163 Bioreactors Market: Company Share, 2022
Figure 164 Danaher Corporation: Net Revenue, 2017-2022 (US$ Million, AGR%)
Figure 165 Danaher Corporation: R&D, 2017-2022 (US$ Million, AGR%)
Figure 166 Danaher Corporation: Regional Market Shares, 2022
Figure 167 Eppendorf SE: Net Revenue, 2017-2022 (US$ Million, AGR%)
Figure 168 Eppendorf SE: R&D, 2017-2022 (US$ Million, AGR%)
Figure 169 Eppendorf SE: Regional Market Shares, 2022
Figure 170 GEA Group Aktiengesellschaft: Net Revenue, 2017-2022 (US$ Million, AGR%)
Figure 171 GEA Group Aktiengesellschaft: R&D, 2017-2022 (US$ Million, AGR%)
Figure 172 GEA Group Aktiengesellschaft: Regional Market Shares, 2022
Figure 173 Getinge AB: Net Revenue, 2017-2022 (US$ Million, AGR%)
Figure 174 Getinge AB: R&D, 2017-2022 (US$ Million, AGR%)
Figure 175 Getinge AB: Regional Market Shares, 2022
Figure 176 Merck KGaA: Net Revenue, 2017-2022 (US$ Million, AGR%)
Figure 177 Merck KGaA: R&D, 2017-2022 (US$ Million, AGR%)
Figure 178 Merck KGaA: Regional Market Shares, 2022
Figure 179 Sartorius AG: Net Revenue, 2017-2022 (US$ Million, AGR%)
Figure 180 Sartorius AG: R&D, 2017-2022 (US$ Million, AGR%)
Figure 181 Sartorius AG: Regional Market Shares, 2022
Figure 182 Thermo Fisher Scientific Inc.: Net Revenue, 2017-2022 (US$ Million, AGR%)
Figure 183 Thermo Fisher Scientific Inc.: Regional Market Shares, 2022
ページTOPに戻る
Summary
Report Details
The Bioreactors Market Report 2023-2033: This report will prove invaluable to leading firms striving for new revenue pockets if they wish to better understand the industry and its underlying dynamics. It will be useful for companies that would like to expand into different industries or to expand their existing operations in a new region.
Increasing Demand for Single-use Bioreactors
The increasing use of single-use bioreactors is a notable trend in the bioprocessing industry, driven by several compelling growth factors. Firstly, single-use bioreactors offer enhanced flexibility and scalability, enabling biopharmaceutical companies to adapt quickly to changing production needs and efficiently produce a wide range of biologics, from small batches to large-scale operations. Secondly, they mitigate the risk of cross-contamination, ensuring product integrity and safety while simplifying cleaning and validation processes. Additionally, the reduced capital and operational costs associated with single-use systems make them an attractive option for both established companies and emerging biotech start-ups. Furthermore, the growing focus on sustainability and reducing the environmental impact of bioprocessing has led to increased adoption of single-use technologies, as they typically generate less waste and require fewer resources compared to traditional stainless-steel bioreactors. As a result, the utilization of single-use bioreactors is poised to continue its ascent, reshaping the landscape of bioprocessing in the pharmaceutical and biotechnology sectors.
Limited Capacity of Single-use Bioreactors Likely to Hinder Large-scale Industrial Production
Single-use bioreactors are generally smaller in scale compared to their stainless-steel counterparts, which poses challenges for companies that require large-scale production of biopharmaceuticals. This limitation can hinder the ability to meet the growing demand for biologics, particularly in the case of blockbuster drugs or vaccines. Manufacturers may face scalability issues when transitioning from small-scale research and development to commercial production, necessitating multiple units or continuous operation, which can increase costs and complexity. As the industry continues to expand, addressing the capacity constraints of single-use bioreactors will be crucial to fully capitalize on their advantages while meeting the demands of a rapidly evolving biopharmaceutical market.
What Questions Should You Ask before Buying a Market Research Report?
• How is the bioreactors market evolving?
• What is driving and restraining the Bioreactors Market?
• How will each bioreactors submarket segment grow over the forecast period and how much revenue will these submarkets account for in 2033?
• How will the market shares for each bioreactors submarket develop from 2023 to 2033?
• What will be the main driver for the overall market from 2023 to 2033?
• Will leading bioreactors markets broadly follow the macroeconomic dynamics, or will individual national markets outperform others?
• How will the market shares of the national markets change by 2033 and which geographical region will lead the market in 2033?
• Who are the leading players and what are their prospects over the forecast period?
• What are the bioreactors projects for these leading companies?
• How will the industry evolve during the period between 2023 and 2033? What are the implications of bioreactors projects taking place now and over the next 10 years?
• Is there a greater need for product commercialisation to further scale the bioreactors market?
• Where is the bioreactors market heading and how can you ensure you are at the forefront of the market?
• What are the best investment options for new product and service lines?
• What are the key prospects for moving companies into a new growth path and C-suite?
You need to discover how this will impact the Bioreactors Market today, and over the next 10 years:
• Our 2830page report provides 119 tables, 183 charts/graphs exclusively to you.
• The report highlights key lucrative areas in the industry so you can target them – NOW.
• It contains in-depth analysis of global, regional and national sales and growth.
• It highlights for you the key successful trends, changes and revenue projections made by your competitors.
This report tells you TODAY how the Bioreactors Market will develop in the next 10 years, and in line with the variations in COVID-19 economic recession and bounce. This market is more critical now than at any point over the last 10 years.
Forecasts to 2033 and other analyses reveal commercial prospects
• In addition to revenue forecasting to 2033, our new study provides you with recent results, growth rates, and market shares.
• You will find original analyses, with business outlooks and developments.
• Discover qualitative analyses (including market dynamics, drivers, opportunities, restraints and challenges), cost structure, impact of rising Bioreactor prices and recent developments.
This report includes data analysis and invaluable insight into how COVID-19 will affect the industry and your company. Four COVID-19 recovery patterns and their impact, namely, “V”, “L”, “W” and “U” are discussed in this report.
Segments Covered in the Report
Product
• Single-use
• Reusable
Cell
• Mammalian Cells
• Bacterial Cells
• Yeast Cells
• Others
Molecule
• Monoclonal Antibodies
• Vaccines
• Recombinant Proteins
• Stem Cells
• Gene Therapy
• Others
Usage
• Developmental
• Pre-clinical & Clinical
• Commercial Production
End-users
• R&D Organisations
• Biopharma Manufacturers
• Contract Manufacturing Organisations (CMOs)
In addition to the revenue predictions for the overall world market and segments, you will also find revenue forecasts for four regional and 24 leading national markets:
North America
• U.S.
• Canada
Europe
• Germany
• UK
• France
• Spain
• Italy
• Russia
• Rest of Europe
Asia Pacific
• China
• Japan
• India
• Australia
• South Korea
• Singapore
• Rest of Asia Pacific
Latin America
• Brazil
• Mexico
• Argentina
• Colombia
• Rest of Latin America
MEA
• GCC
• South Africa
• Rest of MEA
Leading companies profiled in the report
• Bbi Biotech GmbH
• Cellexus International Ltd.
• CerCell A/S
• CESCO Bioengineering Co. Ltd.
• Danaher Corporation
• Eppendorf SE
• GEA Group Aktiengesellschaft
• Getinge AB
• Merck KGaA
• PBS Biotech, Inc.
• Sartorius AG
• Shanghai Bailun Biological Technology Co., Ltd.
• Thermo Fisher Scientific Inc.
Overall world revenue for Bioreactors Market, 2023 to 2033 in terms of value the market will surpass US9,9770.0 million in 2023, our work calculates. We predict strong revenue growth through to 2033. Our work identifies which Organisations hold the greatest potential. Discover their capabilities, progress, and commercial prospects, helping you stay ahead.
How will the Bioreactors Market, 2023 to 2033 report help you?
In summary, our 280-page report provides you with the following knowledge:
• Revenue forecasts to 2033 for Bioreactors Market, with forecasts for product, cell, molecule, usage, and end-users, each forecast at a global and regional level – discover the industry’s prospects, finding the most lucrative places for investments and revenues.
• Revenue forecasts to 2033 for five regional and 24 key national markets – See forecasts for the Bioreactors Market, 2023 to 2033 market in North America, Europe, Asia-Pacific, Latin America, and MEA. Also forecasted is the market in the US, Canada, Mexico, Brazil, Germany, France, UK, Italy, China, India, Japan, and Australia among other prominent economies.
• Prospects for established firms and those seeking to enter the market – including company profiles for 13 of the major companies involved in the Bioreactors Market, 2023 to 2033.
Find quantitative and qualitative analyses with independent predictions. Receive information that only our report contains, staying informed with invaluable business intelligence.
Information found nowhere else
With our new report, you are less likely to fall behind in knowledge or miss out on opportunities. See how our work could benefit your research, analyses, and decisions. Visiongain’s study is for everybody needing commercial analyses for the Bioreactors Market, 2023 to 2033, market-leading companies. You will find data, trends and predictions.
ページTOPに戻る
Table of Contents
Table of Contents
1 Report Overview
1.1 Objectives of the Study
1.2 Introduction to Bioreactors Market
1.3 What This Report Delivers
1.4 Why You Should Read This Report
1.5 Key Questions Answered by This Analytical Report
1.6 Who is This Report for?
1.7 Methodology
1.7.1 Market Definitions
1.7.2 Market Evaluation & Forecasting Methodology
1.7.3 Data Validation
1.7.3.1 Primary Research
1.7.3.2 Secondary Research
1.8 Frequently Asked Questions (FAQs)
1.9 Associated Visiongain Reports
1.10 About Visiongain
2 Executive Summary
3 Market Overview
3.1 Key Findings
3.2 Market Dynamics
3.2.1 Market Driving Factors
3.2.1.1 Growing Demand for Single-use Bioreactors in Pharmaceutical and Biotechnology Industry
3.2.1.2 Technological Advancements in Bioreactors
3.2.1.3 Growing Focus on Orphan Drug Development
3.2.1.4 Rising Demand for Personalized Medicines
3.2.2 Market Restraining Factors
3.2.2.1 Low Capacity of Single-use Bioreactors
3.2.2.2 Concerns Regarding Extractable and/or Leachable
3.2.3 Market Opportunities
3.2.3.1 Advanced Automation and Control
3.2.3.2 Customization and Modular Systems
3.3 COVID-19 Impact Analysis
3.4 Porter’s Five Forces Analysis
3.4.1 Bargaining Power of Suppliers
3.4.2 Bargaining Power of Buyers
3.4.3 Competitive Rivalry
3.4.4 Threat from Substitutes
3.4.5 Threat of New Entrants
3.5 PEST Analysis
4 Bioreactors Market Analysis by Product
4.1 Key Findings
4.2 Product Segment: Market Attractiveness Index
4.3 Bioreactors Market Size Estimation and Forecast by Product
4.4 Single-use
4.4.1 Market Size by Region, 2023-2033 (US$ Million)
4.4.2 Market Share by Region, 2023 & 2033 (%)
4.5 Reusable
4.5.1 Market Size by Region, 2023-2033 (US$ Million)
4.5.2 Market Share by Region, 2023 & 2033 (%)
5 Bioreactors Market Analysis by Cell
5.1 Key Findings
5.2 Cell Segment: Market Attractiveness Index
5.3 Bioreactors Market Size Estimation and Forecast by Cell
5.4 Mammalian Cells
5.4.1 Market Size by Region, 2023-2033 (US$ Million)
5.4.2 Market Share by Region, 2023 & 2033 (%)
5.5 Bacterial Cells
5.5.1 Market Size by Region, 2023-2033 (US$ Million)
5.5.2 Market Share by Region, 2023 & 2033 (%)
5.6 Yeast Cells
5.6.1 Market Size by Region, 2023-2033 (US$ Million)
5.6.2 Market Share by Region, 2023 & 2033 (%)
5.7 Others
5.7.1 Market Size by Region, 2023-2033 (US$ Million)
5.7.2 Market Share by Region, 2023 & 2033 (%)
6 Bioreactors Market Analysis by Molecule
6.1 Key Findings
6.2 Molecule Segment: Market Attractiveness Index
6.3 Bioreactors Market Size Estimation and Forecast by Molecule
6.4 Monoclonal Antibodies
6.4.1 Market Size by Region, 2023-2033 (US$ Million)
6.4.2 Market Share by Region, 2023 & 2033 (%)
6.5 Vaccines
6.5.1 Market Size by Region, 2023-2033 (US$ Million)
6.5.2 Market Share by Region, 2023 & 2033 (%)
6.6 Recombinant Proteins
6.6.1 Market Size by Region, 2023-2033 (US$ Million)
6.6.2 Market Share by Region, 2023 & 2033 (%)
6.7 Stem Cells
6.7.1 Market Size by Region, 2023-2033 (US$ Million)
6.7.2 Market Share by Region, 2023 & 2033 (%)
6.8 Gene Therapy
6.8.1 Market Size by Region, 2023-2033 (US$ Million)
6.8.2 Market Share by Region, 2023 & 2033 (%)
6.9 Others
6.9.1 Market Size by Region, 2023-2033 (US$ Million)
6.9.2 Market Share by Region, 2023 & 2033 (%)
7 Bioreactors Market Analysis by Usage
7.1 Key Findings
7.2 Usage Segment: Market Attractiveness Index
7.3 Bioreactors Market Size Estimation and Forecast by Usage
7.4 Developmental
7.4.1 Market Size by Region, 2023-2033 (US$ Million)
7.4.2 Market Share by Region, 2023 & 2033 (%)
7.5 Pre-clinical & Clinical
7.5.1 Market Size by Region, 2023-2033 (US$ Million)
7.5.2 Market Share by Region, 2023 & 2033 (%)
7.6 Commercial Production
7.6.1 Market Size by Region, 2023-2033 (US$ Million)
7.6.2 Market Share by Region, 2023 & 2033 (%)
8 Bioreactors Market Analysis by End-users
8.1 Key Findings
8.2 End-users Segment: Market Attractiveness Index
8.3 Bioreactors Market Size Estimation and Forecast by End-users
8.4 R&D Organisations
8.4.1 Market Size by Region, 2023-2033 (US$ Million)
8.4.2 Market Share by Region, 2023 & 2033 (%)
8.5 Biopharma Manufacturers
8.5.1 Market Size by Region, 2023-2033 (US$ Million)
8.5.2 Market Share by Region, 2023 & 2033 (%)
8.6 Contract Manufacturing Organisations (CMOs)
8.6.1 Market Size by Region, 2023-2033 (US$ Million)
8.6.2 Market Share by Region, 2023 & 2033 (%)
9 Bioreactors Market Analysis by Region
9.1 Key Findings
9.2 Regional Market Size Estimation and Forecast
10 North America Bioreactors Market Analysis
10.1 Key Findings
10.2 North America Bioreactors Market Attractiveness Index
10.3 North America Bioreactors Market by Country, 2023, 2028 & 2033 (US$ Million)
10.4 North America Bioreactors Market Size Estimation and Forecast by Country
10.5 North America Bioreactors Market Size Estimation and Forecast by Product
10.6 North America Bioreactors Market Size Estimation and Forecast by Cell
10.7 North America Bioreactors Market Size Estimation and Forecast by Molecule
10.8 North America Bioreactors Market Size Estimation and Forecast by Usage
10.9 North America Bioreactors Market Size Estimation and Forecast by End-users
10.10 U.S. Bioreactors Market Analysis
10.11 Canada Bioreactors Market Analysis
11 Europe Bioreactors Market Analysis
11.1 Key Findings
11.2 Europe Bioreactors Market Attractiveness Index
11.3 Europe Bioreactors Market by Country, 2023, 2028 & 2033 (US$ Million)
11.4 Europe Bioreactors Market Size Estimation and Forecast by Country
11.5 Europe Bioreactors Market Size Estimation and Forecast by Product
11.6 Europe Bioreactors Market Size Estimation and Forecast by Cell
11.7 Europe Bioreactors Market Size Estimation and Forecast by Molecule
11.8 Europe Bioreactors Market Size Estimation and Forecast by Usage
11.9 Europe Bioreactors Market Size Estimation and Forecast by End-users
11.10 Germany Bioreactors Market Analysis
11.11 France Bioreactors Market Analysis
11.12 UK Bioreactors Market Analysis
11.13 Italy Bioreactors Market Analysis
11.14 Spain Bioreactors Market Analysis
11.15 Russia Bioreactors Market Analysis
11.16 Rest of Europe Bioreactors Market Analysis
12 Asia Pacific Bioreactors Market Analysis
12.1 Key Findings
12.2 Asia Pacific Bioreactors Market Attractiveness Index
12.3 Asia Pacific Bioreactors Market by Country, 2023, 2028 & 2033 (US$ Million)
12.4 Asia Pacific Bioreactors Market Size Estimation and Forecast by Country
12.5 Asia Pacific Bioreactors Market Size Estimation and Forecast by Product
12.6 Asia Pacific Bioreactors Market Size Estimation and Forecast by Cell
12.7 Asia Pacific Bioreactors Market Size Estimation and Forecast by Molecule
12.8 Asia Pacific Bioreactors Market Size Estimation and Forecast by Usage
12.9 Asia Pacific Bioreactors Market Size Estimation and Forecast by End-users
12.10 Japan Bioreactors Market Analysis
12.11 China Bioreactors Market Analysis
12.12 India Bioreactors Market Analysis
12.13 Australia Bioreactors Market Analysis
12.14 South Korea Bioreactors Market Analysis
12.15 Singapore Bioreactors Market Analysis
12.16 Rest of Asia Pacific Bioreactors Market Analysis
13 Latin America Bioreactors Market Analysis
13.1 Key Findings
13.2 Latin America Bioreactors Market Attractiveness Index
13.3 Latin America Bioreactors Market by Country, 2023, 2028 & 2033 (US$ Million)
13.4 Latin America Bioreactors Market Size Estimation and Forecast by Country
13.5 Latin America Bioreactors Market Size Estimation and Forecast by Product
13.6 Latin America Bioreactors Market Size Estimation and Forecast by Cell
13.7 Latin America Bioreactors Market Size Estimation and Forecast by Molecule
13.8 Latin America Bioreactors Market Size Estimation and Forecast by Usage
13.9 Latin America Bioreactors Market Size Estimation and Forecast by End-users
13.10 Brazil Bioreactors Market Analysis
13.11 Mexico Bioreactors Market Analysis
13.12 Argentina Bioreactors Market Analysis
13.13 Colombia Bioreactors Market Analysis
13.14 Rest of Latin America Bioreactors Market Analysis
14 MEA Bioreactors Market Analysis
14.1 Key Findings
14.2 MEA Bioreactors Market Attractiveness Index
14.3 MEA Bioreactors Market by Country, 2023, 2028 & 2033 (US$ Million)
14.4 MEA Bioreactors Market Size Estimation and Forecast by Country
14.5 MEA Bioreactors Market Size Estimation and Forecast by Product
14.6 MEA Bioreactors Market Size Estimation and Forecast by Cell
14.7 MEA Bioreactors Market Size Estimation and Forecast by Molecule
14.8 MEA Bioreactors Market Size Estimation and Forecast by Usage
14.9 MEA Bioreactors Market Size Estimation and Forecast by End-users
14.10 GCC Bioreactors Market Analysis
14.11 South Africa Bioreactors Market Analysis
14.12 Rest of MEA Bioreactors Market Analysis
15 Company Profiles
15.1 Competitive Landscape, 2022
15.2 Strategic Outlook
15.3 Bbi Biotech GmbH
15.3.1 Company Snapshot
15.3.2 Company Overview
15.3.3 Product Benchmarking
15.3.4 Strategic Outlook
15.4 Cellexus International
15.4.1 Company Snapshot
15.4.2 Company Overview
15.4.3 Product Benchmarking
15.4.4 Strategic Outlook
15.5 CerCell A/S
15.5.1 Company Snapshot
15.5.2 Company Overview
15.5.3 Product Benchmarking
15.6 CESCO Bioengineering Co. Ltd.
15.6.1 Company Snapshot
15.6.2 Company Overview
15.6.3 Product Benchmarking
15.7 Danaher Corporation
15.7.1 Company Snapshot
15.7.2 Company Overview
15.7.3 Financial Analysis
15.7.3.1 Net Revenue, 2017-2022
15.7.3.2 R&D, 2017-2022
15.7.3.3 Regional Market Shares, 2022
15.7.4 Product Benchmarking
15.7.5 Strategic Outlook
15.8 Eppendorf SE
15.8.1 Company Snapshot
15.8.2 Company Overview
15.8.3 Financial Analysis
15.8.3.1 Net Revenue, 2017-2022
15.8.3.2 R&D, 2017-2022
15.8.3.3 Regional Market Shares, 2022
15.8.4 Product Benchmarking
15.8.5 Strategic Outlook
15.9 GEA Group Aktiengesellschaft
15.9.1 Company Snapshot
15.9.2 Company Overview
15.9.3 Financial Analysis
15.9.3.1 Net Revenue, 2017-2022
15.9.3.2 R&D, 2017-2022
15.9.3.3 Regional Market Shares, 2022
15.9.4 Product Benchmarking
15.9.5 Strategic Outlook
15.10 Getinge AB
15.10.1 Company Snapshot
15.10.2 Company Overview
15.10.3 Financial Analysis
15.10.3.1 Net Revenue, 2017-2022
15.10.3.2 R&D, 2017-2022
15.10.3.3 Regional Market Shares, 2022
15.10.4 Product Benchmarking
15.10.5 Strategic Outlook
15.11 Merck KGaA
15.11.1 Company Snapshot
15.11.2 Company Overview
15.11.3 Financial Analysis
15.11.3.1 Net Revenue, 2017-2022
15.11.3.2 R&D, 2017-2022
15.11.3.3 Regional Market Shares, 2022
15.11.4 Product Benchmarking
15.11.5 Strategic Outlook
15.12 PBS Biotech, Inc.
15.12.1 Company Snapshot
15.12.2 Company Overview
15.12.3 Product Benchmarking
15.12.4 Strategic Outlook
15.13 Sartorius AG
15.13.1 Company Snapshot
15.13.2 Company Overview
15.13.3 Financial Analysis
15.13.3.1 Net Revenue, 2017-2022
15.13.3.2 R&D, 2017-2022
15.13.3.3 Regional Market Shares, 2022
15.13.4 Product Benchmarking
15.14 Shanghai Bailun Biological Technology Co., Ltd.
15.14.1 Company Snapshot
15.14.2 Company Overview
15.14.3 Product Benchmarking
15.15 Thermo Fisher Scientific Inc.
15.15.1 Company Snapshot
15.15.2 Company Overview
15.15.3 Financial Analysis
15.15.3.1 Net Revenue, 2017-2022
15.15.3.2 Regional Market Shares, 2022
15.15.4 Product Benchmarking
15.15.5 Strategic Outlook
16 Conclusion and Recommendations
16.1 Concluding Remarks from Visiongain
16.2 Recommendations for Market Players
ページTOPに戻る
List of Tables/Graphs
List of Tables
Table 1 Bioreactors Market Snapshot, 2023 & 2033 (US$ Million, CAGR %)
Table 2 Bioreactors Market Forecast by Region, 2023-2033 (US$ Million, AGR%, CAGR%): “V” Shaped Recovery
Table 3 Bioreactors Market Forecast by Region, 2023-2033 (US$ Million, AGR%, CAGR%): “U” Shaped Recovery
Table 4 Bioreactors Market Forecast by Region, 2023-2033 (US$ Million, AGR%, CAGR%): “W” Shaped Recovery
Table 5 Bioreactors Market Forecast by Region, 2023-2033 (US$ Million, AGR%, CAGR%): “L” Shaped Recovery
Table 6 Bioreactors Market Forecast by Product, 2023-2033 (US$ Million, AGR%, CAGR %)
Table 7 Single-use Market Forecast by Region, 2023-2033 (US$ Million, AGR%, CAGR %)
Table 8 Reusable Market Forecast by Region, 2023-2033 (US$ Million, AGR%, CAGR %)
Table 9 Bioreactors Market Forecast by Cell, 2023-2033 (US$ Million, AGR%, CAGR%)
Table 10 Mammalian Cells Market Forecast by Region, 2023-2033 (US$ Million, AGR%, CAGR%)
Table 11 Bacterial Cells Market Forecast by Region, 2023-2033 (US$ Million, AGR%, CAGR%)
Table 12 Yeast Cells Market Forecast by Region, 2023-2033 (US$ Million, AGR%, CAGR%)
Table 13 Others Market Forecast by Region, 2023-2033 (US$ Million, AGR%, CAGR%)
Table 14 Bioreactors Market Molecule, 2023-2033 (US$ Million, AGR%, CAGR%)
Table 15 Monoclonal Antibodies Market Forecast by Region, 2023-2033 (US$ Million, AGR%, CAGR%)
Table 16 Vaccines Market Forecast by Region, 2023-2033 (US$ Million, AGR%, CAGR%)
Table 17 Recombinant Proteins Market Forecast by Region, 2023-2033 (US$ Million, AGR%, CAGR%)
Table 18 Stem Cells Market Forecast by Region, 2023-2033 (US$ Million, AGR%, CAGR%)
Table 19 Gene Therapy Market Forecast by Region, 2023-2033 (US$ Million, AGR%, CAGR%)
Table 20 Others Market Forecast by Region, 2023-2033 (US$ Million, AGR%, CAGR%)
Table 21 Bioreactors Market Usage, 2023-2033 (US$ Million, AGR%, CAGR%)
Table 22 Developmental Market Forecast by Region, 2023-2033 (US$ Million, AGR%, CAGR%)
Table 23 Pre-clinical & Clinical Market Forecast by Region, 2023-2033 (US$ Million, AGR%, CAGR%)
Table 24 Commercial Production Market Forecast by Region, 2023-2033 (US$ Million, AGR%, CAGR%)
Table 25 Bioreactors Market End-users, 2023-2033 (US$ Million, AGR%, CAGR%)
Table 26 R&D Organisations Market Forecast by Region, 2023-2033 (US$ Million, AGR%, CAGR%)
Table 27 Biopharma Manufacturers Market Forecast by Region, 2023-2033 (US$ Million, AGR%, CAGR%)
Table 28 Contract Manufacturing Organisations (CMOs) Market Forecast by Region, 2023-2033 (US$ Million, AGR%, CAGR%)
Table 29 Bioreactors Market Forecast by Region, 2023-2033 (US$ Million, AGR%, CAGR%)
Table 30 North America Bioreactors Market Forecast by Country, 2023-2033 (US$ Million, AGR%, CAGR %)
Table 31 North America Bioreactors Market Forecast by Product, 2023-2033 (US$ Million, AGR%, CAGR %)
Table 32 North America Bioreactors Market Forecast by Cell, 2023-2033 (US$ Million, AGR%, CAGR%)
Table 33 North America Bioreactors Market Molecule, 2023-2033 (US$ Million, AGR%, CAGR%)
Table 34 North America Bioreactors Market Usage, 2023-2033 (US$ Million, AGR%, CAGR%)
Table 35 North America Bioreactors Market End-users, 2023-2033 (US$ Million, AGR%, CAGR%)
Table 36 U.S. Bioreactors Market Forecast, 2023-2033 (US$ Million, AGR%, CAGR%)
Table 37 Canada Bioreactors Market Forecast, 2023-2033 (US$ Million, AGR%, CAGR %)
Table 38 Europe Bioreactors Market Forecast by Country, 2023-2033 (US$ Million, AGR%, CAGR%)
Table 39 Europe Bioreactors Market Forecast by Product, 2023-2033 (US$ Million, AGR%, CAGR %)
Table 40 Europe Bioreactors Market Forecast by Cell, 2023-2033 (US$ Million, AGR%, CAGR%)
Table 41 Bioreactors Market Molecule, 2023-2033 (US$ Million, AGR%, CAGR%)
Table 42 Bioreactors Market Usage, 2023-2033 (US$ Million, AGR%, CAGR%)
Table 43 Bioreactors Market End-users, 2023-2033 (US$ Million, AGR%, CAGR%)
Table 44 Germany Bioreactors Market Forecast, 2023-2033 (US$ Million, AGR%, CAGR %)
Table 45 France Bioreactors Market Forecast, 2023-2033 (US$ Million, AGR%, CAGR %)
Table 46 UK Bioreactors Market Forecast, 2023-2033 (US$ Million, AGR%, CAGR%)
Table 47 Italy Bioreactors Market Forecast, 2023-2033 (US$ Million, AGR%, CAGR %)
Table 48 Spain Bioreactors Market Forecast, 2023-2033 (US$ Million, AGR%, CAGR%)
Table 49 Russia Bioreactors Market Forecast, 2023-2033 (US$ Million, AGR%, CAGR%)
Table 50 Rest of Europe Bioreactors Market Forecast, 2023-2033 (US$ Million, AGR%, CAGR%)
Table 51 Asia Pacific Bioreactors Market Forecast by Country, 2023-2033 (US$ Million,, AGR%, CAGR%)
Table 52 Bioreactors Market Forecast by Product, 2023-2033 (US$ Million, AGR%, CAGR %)
Table 53 Bioreactors Market Forecast by Cell, 2023-2033 (US$ Million, AGR%, CAGR%)
Table 54 Bioreactors Market Molecule, 2023-2033 (US$ Million, AGR%, CAGR%)
Table 55 Bioreactors Market Usage, 2023-2033 (US$ Million, AGR%, CAGR%)
Table 56 Bioreactors Market End-users, 2023-2033 (US$ Million, AGR%, CAGR%)
Table 57 Japan Bioreactors Market Forecast, 2023-2033 (US$ Million, AGR%, CAGR%)
Table 58 China Bioreactors Market Forecast, 2023-2033 (US$ Million, AGR%, CAGR%)
Table 59 India Bioreactors Market Forecast, 2023-2033 (US$ Million, AGR%, CAGR %)
Table 60 Australia Bioreactors Market Forecast, 2023-2033 (US$ Million, AGR%, CAGR %)
Table 61 South Korea Bioreactors Market Forecast, 2023-2033 (US$ Million, AGR%, CAGR%)
Table 62 Singapore Bioreactors Market Forecast, 2023-2033 (US$ Million, AGR%, CAGR%)
Table 63 Rest of Asia Pacific Bioreactors Market Forecast, 2023-2033 (US$ Million, AGR%, CAGR %)
Table 64 Latin America Bioreactors Market Forecast by Country, 2023-2033 (US$ Million,, AGR%, CAGR%)
Table 65 Bioreactors Market Forecast by Product, 2023-2033 (US$ Million, AGR%, CAGR %)
Table 66 Bioreactors Market Forecast by Cell, 2023-2033 (US$ Million, AGR%, CAGR%)
Table 67 Bioreactors Market Molecule, 2023-2033 (US$ Million, AGR%, CAGR%)
Table 68 Bioreactors Market Usage, 2023-2033 (US$ Million, AGR%, CAGR%)
Table 69 Bioreactors Market End-users, 2023-2033 (US$ Million, AGR%, CAGR%)
Table 70 Brazil Bioreactors Market Forecast, 2023-2033 (US$ Million, AGR%, CAGR %)
Table 71 Mexico Bioreactors Market Forecast, 2023-2033 (US$ Million, AGR%, CAGR%)
Table 72 Argentina Bioreactors Market Forecast, 2023-2033 (US$ Million, AGR%, CAGR%)
Table 73 Colombia Bioreactors Market Forecast, 2023-2033 (US$ Million, AGR%, CAGR%)
Table 74 Rest of Latin America Bioreactors Market Forecast, 2023-2033 (US$ Million, AGR%, CAGR%)
Table 75 MEA Bioreactors Market Forecast by Country, 2023-2033 (US$ Million, AGR%, CAGR%)
Table 76 Bioreactors Market Forecast by Product, 2023-2033 (US$ Million, AGR%, CAGR %)
Table 77 Bioreactors Market Forecast by Cell, 2023-2033 (US$ Million, AGR%, CAGR%)
Table 78 Bioreactors Market Molecule, 2023-2033 (US$ Million, AGR%, CAGR%)
Table 79 Bioreactors Market Usage, 2023-2033 (US$ Million, AGR%, CAGR%)
Table 80 Bioreactors Market End-users, 2023-2033 (US$ Million, AGR%, CAGR%)
Table 81 GCC Bioreactors Market Forecast, 2023-2033 (US$ Million, AGR%, CAGR%)
Table 82 South Africa Bioreactors Market Forecast, 2023-2033 (US$ Million, AGR%, CAGR%)
Table 83 Rest of MEA Bioreactors Market Forecast, 2023-2033 (US$ Million, AGR%, CAGR %)
Table 84 Strategic Outlook
Table 85 Bbi Biotech GmbH: Key Details, (CEO, HQ, Revenue, Founded, No. of Employees, Company Type, Website, Business Segment)
Table 86 Bbi Biotech GmbH: Product Benchmarking
Table 87 Bbi Biotech GmbH.: Strategic Outlook
Table 88 Cellexus International.: Key Details, (CEO, HQ, Revenue, Founded, No. of Employees, Company Type, Website, Business Segment)
Table 89 Cellexus International: Product Benchmarking
Table 90 Cellexus International: Strategic Outlook
Table 91 CerCell A/S: Key Details, (CEO, HQ, Revenue, Founded, No. of Employees, Company Type, Website, Business Segment)
Table 92 CerCell A/S: Product Benchmarking
Table 93 CESCO Bioengineering Co. Ltd.: Key Details, (CEO, HQ, Revenue, Founded, No. of Employees, Company Type, Website, Business Segment)
Table 94 CESCO Bioengineering Co. Ltd.: Product Benchmarking
Table 95 Danaher Corporation: Key Details, (CEO, HQ, Revenue, Founded, No. of Employees, Company Type, Website, Business Segment)
Table 96 Danaher Corporation: Product Benchmarking
Table 97 Danaher Corporation: Strategic Outlook
Table 98 Eppendorf SE: Key Details, (CEO, HQ, Revenue, Founded, No. of Employees, Company Type, Website, Business Segment)
Table 99 Eppendorf SE: Product Benchmarking
Table 100 Eppendorf SE: Strategic Outlook
Table 101 GEA Group Aktiengesellschaft: Key Details, (CEO, HQ, Revenue, Founded, No. of Employees, Company Type, Website, Business Segment)
Table 102 GEA Group Aktiengesellschaft: Product Benchmarking
Table 103 GEA Group: Strategic Outlook
Table 104 Getinge AB: Key Details, (CEO, HQ, Revenue, Founded, No. of Employees, Company Type, Website, Business Segment)
Table 105 Getinge AB: Product Benchmarking
Table 106 Getinge AB: Strategic Outlook
Table 107 Merck KGaA: Key Details, (CEO, HQ, Revenue, Founded, No. of Employees, Company Type, Website, Business Segment)
Table 108 Merck KGaA: Product Benchmarking
Table 109 Merck KGaA: Strategic Outlook
Table 110 PBS Biotech, Inc.: Key Details, (CEO, HQ, Revenue, Founded, No. of Employees, Company Type, Website, Business Segment)
Table 111 PBS Biotech, Inc.: Product Benchmarking
Table 112 PBS Biotech, Inc.: Strategic Outlook
Table 113 Sartorius AG: Key Details, (CEO, HQ, Revenue, Founded, No. of Employees, Company Type, Website, Business Segment)
Table 114 Sartorius AG: Product Benchmarking
Table 115 Shanghai Bailun Biological Technology Co., Ltd.: Key Details, (CEO, HQ, Revenue, Founded, No. of Employees, Company Type, Website, Business Segment)
Table 116 Shanghai Bailun Biological Technology Co., Ltd.: Product Benchmarking
Table 117 Thermo Fisher Scientific Inc.: Key Details, (CEO, HQ, Revenue, Founded, No. of Employees, Company Type, Website, Business Segment)
Table 118 Thermo Fisher Scientific Inc.: Product Benchmarking
Table 119 Thermo Fisher Scientific Inc.: Strategic Outlook
List of Figures
Figure 1 Bioreactors Market Segmentation
Figure 2 Bioreactors Market by Product: Market Attractiveness Index
Figure 3 Bioreactors Market by Cell: Market Attractiveness Index
Figure 4 Bioreactors Market by Molecule: Market Attractiveness Index
Figure 5 Bioreactors Market by Usage: Market Attractiveness Index
Figure 6 Bioreactors Market by End-users: Market Attractiveness Index
Figure 7 Bioreactors Market Attractiveness Index by Region
Figure 8 Bioreactors Market: Market Dynamics
Figure 9 Bioreactors Market by Region, 2023-2033 (US$ Million, AGR %): “V” Shaped Recovery
Figure 10 Bioreactors Market by Region, 2023-2033 (US$ Million, AGR %): “U” Shaped Recovery
Figure 11 Bioreactors Market by Region, 2023-2033 (US$ Million, AGR %): “W” Shaped Recovery
Figure 12 Bioreactors Market by Region, 2023-2033 (US$ Million, AGR %): “L” Shaped Recovery
Figure 13 Bioreactors Market: Porter’s Five Forces Analysis
Figure 14 Bioreactors Market: PEST Analysis
Figure 15 Bioreactors Market by Product: Market Attractiveness Index
Figure 16 Bioreactors Market Forecast by Product, 2023-2033 (US$ Million, AGR %)
Figure 17 Bioreactors Market Share Forecast by Product, 2023, 2028, 2033 (%)
Figure 18 Single-use Market Forecast by Region, 2023-2033 (US$ Million, AGR %)
Figure 19 Single-use Market Share Forecast by Region, 2023 & 2033 (%)
Figure 20 Reusable Market Forecast by Region, 2023-2033 (US$ Million, AGR %)
Figure 21 Reusable Market Share Forecast by Region, 2023 & 2033 (%)
Figure 22 Bioreactors Market by Cell: Market Attractiveness Index
Figure 23 Bioreactors Market Forecast by Cell, 2023-2033 (US$ Million, AGR %)
Figure 24 Bioreactors Market Share Forecast by Cell, 2023, 2028, 2033 (%)
Figure 25 Mammalian Cells Market Forecast by Region, 2023-2033 (US$ Million, AGR %)
Figure 26 Mammalian Cells Market Share Forecast by Region, 2023 & 2033 (%)
Figure 27 Bacterial Cells Market Forecast by Region, 2023-2033 (US$ Million, AGR %)
Figure 28 Bacterial Cells Market Share Forecast by Region, 2023 & 2033 (%)
Figure 29 Yeast Cells Market Forecast by Region, 2023-2033 (US$ Million, AGR %)
Figure 30 Yeast Cells Market Share Forecast by Region, 2023 & 2033 (%)
Figure 31 Others Market Forecast by Region, 2023-2033 (US$ Million, AGR %)
Figure 32 Others Market Share Forecast by Region, 2023 & 2033 (%)
Figure 33 Bioreactors Market by Molecule: Market Attractiveness Index
Figure 34 Bioreactors Market Forecast by Molecule, 2023-2033 (US$ Million, AGR %)
Figure 35 Bioreactors Market Share Forecast by Molecule, 2023, 2028, 2033 (%)
Figure 36 Monoclonal Antibodies Segment Market Forecast by Region, 2023-2033 (US$ Million, AGR %)
Figure 37 Monoclonal Antibodies Segment Market Share Forecast by Region, 2023 & 2033 (%)
Figure 38 Vaccines Market Forecast by Region, 2023-2033 (US$ Million, AGR %)
Figure 39 Vaccines Market Share Forecast by Region, 2023 & 2033 (%)
Figure 40 Recombinant Proteins Market Forecast by Region, 2023-2033 (US$ Million, AGR %)
Figure 41 Recombinant Proteins Market Share Forecast by Region, 2023 & 2033 (%)
Figure 42 Stem Cells Market Forecast by Region, 2023-2033 (US$ Million, AGR %)
Figure 43 Stem Cells Market Share Forecast by Region, 2023 & 2033 (%)
Figure 44 Gene Therapy Market Forecast by Region, 2023-2033 (US$ Million, AGR %)
Figure 45 Gene Therapy Market Share Forecast by Region, 2023 & 2033 (%)
Figure 46 Others Market Forecast by Region, 2023-2033 (US$ Million, AGR %)
Figure 47 Others Market Share Forecast by Region, 2023 & 2033 (%)
Figure 48 Bioreactors Market by Usage: Market Attractiveness Index
Figure 49 Bioreactors Market Forecast by Usage, 2023-2033 (US$ Million, AGR %)
Figure 50 Bioreactors Market Share Forecast by Usage, 2023, 2028, 2033 (%)
Figure 51 Developmental Market Forecast by Region, 2023-2033 (US$ Million, AGR %)
Figure 52 Developmental Market Share Forecast by Region, 2023 & 2033 (%)
Figure 53 Pre-clinical & Clinical Market Forecast by Region, 2023-2033 (US$ Million, AGR %)
Figure 54 Pre-clinical & Clinical Market Share Forecast by Region, 2023 & 2033 (%)
Figure 55 Commercial Production Market Forecast by Region, 2023-2033 (US$ Million, AGR %)
Figure 56 Commercial Production Market Share Forecast by Region, 2023 & 2033 (%)
Figure 57 Bioreactors Market by End-users: Market Attractiveness Index
Figure 58 Bioreactors Market Forecast by End-users, 2023-2033 (US$ Million, AGR %)
Figure 59 Bioreactors Market Share Forecast by End-users, 2023, 2028, 2033 (%)
Figure 60 R&D Organisations Market Forecast by Region, 2023-2033 (US$ Million, AGR %)
Figure 61 R&D Organisations Market Share Forecast by Region, 2023 & 2033 (%)
Figure 62 Biopharma Manufacturers Market Forecast by Region, 2023-2033 (US$ Million, AGR %)
Figure 63 Biopharma Manufacturers Market Share Forecast by Region, 2023 & 2033 (%)
Figure 64 Contract Manufacturing Organisations (CMOs) Market Forecast by Region, 2023-2033 (US$ Million, AGR %)
Figure 65 Contract Manufacturing Organisations (CMOs) Market Share Forecast by Region, 2023 & 2033 (%)
Figure 66 Bioreactors Market Forecast by Region 2023 and 2033 (Revenue, CAGR %)
Figure 67 Bioreactors Market Share Forecast by Region 2023, 2028, 2033 (%)
Figure 68 Bioreactors Market by Region, 2023-2033 (US$ Million, AGR %)
Figure 69 North America Bioreactors Market Attractiveness Index
Figure 70 North America Bioreactors Market by Region, 2023, 2028 & 2033 (US$ Million)
Figure 71 North America Bioreactors Market Forecast by Country, 2023-2033 (US$ Million, AGR %)
Figure 72 North America Bioreactors Market Share Forecast by Country, 2023 & 2033 (%)
Figure 73 North America Bioreactors Market Forecast by Product, 2023-2033 (US$ Million, AGR %)
Figure 74 North America Bioreactors Market Share Forecast by Product, 2023 & 2033 (%)
Figure 75 North America Bioreactors Market Forecast by Cell, 2023-2033 (US$ Million, AGR %)
Figure 76 North America Bioreactors Market Share Forecast by Cell, 2023 & 2033 (%)
Figure 77 North America Bioreactors Market Forecast by Molecule, 2023-2033 (US$ Million, AGR %)
Figure 78 North America Bioreactors Market Share Forecast by Molecule, 2023 & 2033 (%)
Figure 79 North America Bioreactors Market Forecast by Usage, 2023-2033 (US$ Million, AGR %)
Figure 80 North America Bioreactors Market Share Forecast by Usage, 2023 & 2033 (%)
Figure 81 North America Bioreactors Market Forecast by End-users, 2023-2033 (US$ Million, AGR %)
Figure 82 North America Bioreactors Market Share Forecast by End-users, 2023 & 2033 (%)
Figure 83 U.S. Bioreactors Market Forecast, 2023-2033 (US$ Million, AGR %)
Figure 84 Canada Bioreactors Market Forecast, 2023-2033 (US$ Million, AGR %)
Figure 85 Europe Bioreactors Market Attractiveness Index
Figure 86 Europe Bioreactors Market by Region, 2023, 2028 & 2033 (US$ Million)
Figure 87 Europe Bioreactors Market Forecast by Country, 2023-2033 (US$ Million, AGR %)
Figure 88 Europe Bioreactors Market Share Forecast by Country, 2023 & 2033 (%)
Figure 89 Europe Bioreactors Market Forecast by Product, 2023-2033 (US$ Million, AGR %)
Figure 90 Europe Bioreactors Market Share Forecast by Product, 2023 & 2033 (%)
Figure 91 Europe Bioreactors Market Forecast by Cell, 2023-2033 (US$ Million, AGR %)
Figure 92 Europe Bioreactors Market Share Forecast by Cell, 2023 & 2033 (%)
Figure 93 Europe Bioreactors Market Forecast by Molecule, 2023-2033 (US$ Million, AGR %)
Figure 94 Europe Bioreactors Market Share Forecast by Molecule, 2023 & 2033 (%)
Figure 95 Europe Bioreactors Market Forecast by Usage, 2023-2033 (US$ Million, AGR %)
Figure 96 Europe Bioreactors Market Share Forecast by Usage, 2023 & 2033 (%)
Figure 97 Europe Bioreactors Market Forecast by End-users, 2023-2033 (US$ Million, AGR %)
Figure 98 Europe Bioreactors Market Share Forecast by End-users, 2023 & 2033 (%)
Figure 99 Germany Bioreactors Market Forecast, 2023-2033 (US$ Million, AGR %)
Figure 100 France Bioreactors Market Forecast, 2023-2033 (US$ Million, AGR %)
Figure 101 UK Bioreactors Market Forecast, 2023-2033 (US$ Million, AGR %)
Figure 102 Italy Bioreactors Market Forecast, 2023-2033 (US$ Million, AGR %)
Figure 103 Spain Bioreactors Market Forecast, 2023-2033 (US$ Million, AGR %)
Figure 104 Russia Bioreactors Market Forecast, 2023-2033 (US$ Million, AGR %)
Figure 105 Rest of Europe Bioreactors Market Forecast, 2023-2033 (US$ Million, AGR %)
Figure 106 Asia Pacific Bioreactors Market Attractiveness Index
Figure 107 Asia Pacific Bioreactors Market by Region, 2023, 2028 & 2033 (US$ Million)
Figure 108 Asia Pacific Bioreactors Market Forecast by Country, 2023-2033 (US$ Million, AGR %)
Figure 109 Asia Pacific Bioreactors Market Share Forecast by Country, 2023 & 2033 (%)
Figure 110 Asia Pacific Bioreactors Market Forecast by Product, 2023-2033 (US$ Million, AGR %)
Figure 111 Asia Pacific Bioreactors Market Share Forecast by Product, 2023 & 2033 (%)
Figure 112 Asia Pacific Bioreactors Market Forecast by Cell, 2023-2033 (US$ Million, AGR %)
Figure 113 Asia Pacific Bioreactors Market Share Forecast by Cell, 2023 & 2033 (%)
Figure 114 Asia Pacific Bioreactors Market Forecast by Molecule, 2023-2033 (US$ Million, AGR %)
Figure 115 Asia Pacific Bioreactors Market Share Forecast by Molecule, 2023 & 2033 (%)
Figure 116 Asia Pacific Bioreactors Market Forecast by Usage, 2023-2033 (US$ Million, AGR %)
Figure 117 Asia Pacific Bioreactors Market Share Forecast by Usage, 2023 & 2033 (%)
Figure 118 Asia Pacific Bioreactors Market Forecast by End-users, 2023-2033 (US$ Million, AGR %)
Figure 119 Asia Pacific Bioreactors Market Share Forecast by Usage, 2023 & 2033 (%)
Figure 120 Japan Bioreactors Market Forecast, 2023-2033 (US$ Million, AGR %)
Figure 121 China Bioreactors Market Forecast, 2023-2033 (US$ Million, AGR %)
Figure 122 India Bioreactors Market Forecast, 2023-2033 (US$ Million, AGR %)
Figure 123 Australia Bioreactors Market Forecast, 2023-2033 (US$ Million, AGR %)
Figure 124 South Korea Bioreactors Market Forecast, 2023-2033 (US$ Million, AGR %)
Figure 125 Singapore Bioreactors Market Forecast, 2023-2033 (US$ Million, AGR %)
Figure 126 Rest of Asia Pacific Bioreactors Market Forecast, 2023-2033 (US$ Million, AGR %)
Figure 127 Latin America Bioreactors Market Attractiveness Index
Figure 128 Latin America Bioreactors Market by Region, 2023, 2028 & 2033 (US$ Million)
Figure 129 Latin America Bioreactors Market Forecast by Country, 2023-2033 (US$ Million, AGR %)
Figure 130 Latin America Bioreactors Market Share Forecast by Country, 2023 & 2033 (%)
Figure 131 Latin America Bioreactors Market Forecast by Product, 2023-2033 (US$ Million, AGR %)
Figure 132 Latin America Bioreactors Market Share Forecast by Product, 2023 & 2033 (%)
Figure 133 Latin America Bioreactors Market Forecast by Cell, 2023-2033 (US$ Million, AGR %)
Figure 134 Latin America Bioreactors Market Share Forecast by Cell, 2023 & 2033 (%)
Figure 135 Latin America Bioreactors Market Forecast by Molecule, 2023-2033 (US$ Million, AGR %)
Figure 136 Latin America Bioreactors Market Share Forecast by Molecule, 2023 & 2033 (%)
Figure 137 Latin America Bioreactors Market Forecast by Usage, 2023-2033 (US$ Million, AGR %)
Figure 138 Latin America Bioreactors Market Share Forecast by Usage, 2023 & 2033 (%)
Figure 139 Latin America Bioreactors Market Forecast by End-users, 2023-2033 (US$ Million, AGR %)
Figure 140 Latin America Bioreactors Market Share Forecast by End-users, 2023 & 2033 (%)
Figure 141 Brazil Bioreactors Market Forecast, 2023-2033 (US$ Million, AGR %)
Figure 142 Mexico Bioreactors Market Forecast, 2023-2033 (US$ Million, AGR %)
Figure 143 Argentina Bioreactors Market Forecast, 2023-2033 (US$ Million, AGR %)
Figure 144 Colombia Bioreactors Market Forecast, 2023-2033 (US$ Million, AGR %)
Figure 145 Rest of Latin America Bioreactors Market Forecast, 2023-2033 (US$ Million, AGR %)
Figure 146 MEA Bioreactors Market Attractiveness Index
Figure 147 MEA Bioreactors Market by Region, 2023, 2028 & 2033 (US$ Million)
Figure 148 MEA Bioreactors Market Forecast by Country, 2023-2033 (US$ Million, AGR %)
Figure 149 MEA Bioreactors Market Share Forecast by Country, 2023 & 2033 (%)
Figure 150 MEA Bioreactors Market Forecast by Product, 2023-2033 (US$ Million, AGR %)
Figure 151 MEA Bioreactors Market Share Forecast by Product, 2023 & 2033 (%)
Figure 152 MEA Bioreactors Market Forecast by Cell, 2023-2033 (US$ Million, AGR %)
Figure 153 MEA Bioreactors Market Share Forecast by Cell, 2023 & 2033 (%)
Figure 154 MEA Bioreactors Market Forecast by Molecule, 2023-2033 (US$ Million, AGR %)
Figure 155 MEA Bioreactors Market Share Forecast by Molecule, 2023 & 2033 (%)
Figure 156 MEA Bioreactors Market Forecast by Usage, 2023-2033 (US$ Million, AGR %)
Figure 157 MEA Bioreactors Market Share Forecast by Usage, 2023 & 2033 (%)
Figure 158 MEA Bioreactors Market Forecast by End-users, 2023-2033 (US$ Million, AGR %)
Figure 159 MEA Bioreactors Market Share Forecast by End-users, 2023 & 2033 (%)
Figure 160 GCC Bioreactors Market Forecast, 2023-2033 (US$ Million, AGR %)
Figure 161 South Africa Bioreactors Market Forecast, 2023-2033 (US$ Million, AGR %)
Figure 162 Rest of MEA Bioreactors Market Forecast, 2023-2033 (US$ Million, AGR %)
Figure 163 Bioreactors Market: Company Share, 2022
Figure 164 Danaher Corporation: Net Revenue, 2017-2022 (US$ Million, AGR%)
Figure 165 Danaher Corporation: R&D, 2017-2022 (US$ Million, AGR%)
Figure 166 Danaher Corporation: Regional Market Shares, 2022
Figure 167 Eppendorf SE: Net Revenue, 2017-2022 (US$ Million, AGR%)
Figure 168 Eppendorf SE: R&D, 2017-2022 (US$ Million, AGR%)
Figure 169 Eppendorf SE: Regional Market Shares, 2022
Figure 170 GEA Group Aktiengesellschaft: Net Revenue, 2017-2022 (US$ Million, AGR%)
Figure 171 GEA Group Aktiengesellschaft: R&D, 2017-2022 (US$ Million, AGR%)
Figure 172 GEA Group Aktiengesellschaft: Regional Market Shares, 2022
Figure 173 Getinge AB: Net Revenue, 2017-2022 (US$ Million, AGR%)
Figure 174 Getinge AB: R&D, 2017-2022 (US$ Million, AGR%)
Figure 175 Getinge AB: Regional Market Shares, 2022
Figure 176 Merck KGaA: Net Revenue, 2017-2022 (US$ Million, AGR%)
Figure 177 Merck KGaA: R&D, 2017-2022 (US$ Million, AGR%)
Figure 178 Merck KGaA: Regional Market Shares, 2022
Figure 179 Sartorius AG: Net Revenue, 2017-2022 (US$ Million, AGR%)
Figure 180 Sartorius AG: R&D, 2017-2022 (US$ Million, AGR%)
Figure 181 Sartorius AG: Regional Market Shares, 2022
Figure 182 Thermo Fisher Scientific Inc.: Net Revenue, 2017-2022 (US$ Million, AGR%)
Figure 183 Thermo Fisher Scientific Inc.: Regional Market Shares, 2022
ページTOPに戻る
- 細胞分析市場の規模、シェアおよび動向分析レポート:製品・サービス別(試薬・消耗品、機器)、手法別(フローサイトメトリー、細胞マイクロアレイ)、プロセス別、用途別、地域別、およびセグメント別予測(2026年~2033年)
- 密閉型バイオプロセス市場規模、シェアおよび動向分析レポート:製品別(バイオリアクター、発酵槽、撹拌システム)、用途別(ワクチン製造、細胞・遺伝子治療)、最終用途別(製薬・バイオテクノロジー企業)、地域別、およびセグメント別予測(2026年~2033年)
- 免疫ゲノミクス市場規模、シェアおよび動向分析レポート:タイプ別(機器、消耗品、ソフトウェア)、技術別(ポリメラーゼ連鎖反応、マイクロアレイ)、用途別(臨床用途、研究用途)、エンドユーザー別、地域別、およびセグメント別予測(2026年~2033年)
- 凍結乾燥装置およびサービス市場規模、シェア、動向分析レポート:提供形態別(装置、サービス)、事業規模別(実験室規模、パイロット規模)、用途別(診断・研究、食品産業)、地域別、およびセグメント別予測(2026年~2033年)
- 合成遺伝子回路市場規模、シェアおよび動向分析レポート:製品別(トグルスイッチ回路、発振器)、用途別(研究、治療)、最終用途別(学術・研究機関、バイオテクノロジー・製薬企業)、地域別、およびセグメント別予測(2026年~2033年)
- ウイルスベクターおよびプラスミドDNA製造市場の規模、シェア、動向分析レポート:ベクタータイプ別(レンチウイルス、アデノウイルス、レトロウイルス)、ワークフロー別、用途別(遺伝子治療、細胞治療、ワクチン学)、最終用途別、疾患別(がん、遺伝性疾患)、地域別、およびセグメント別予測(2026年~2033年)
- 血小板濃縮血漿(PRP)市場規模、シェアおよび動向分析レポート:タイプ別(純粋PRP、白血球濃縮PRP)、用途別(整形外科、スポーツ医学、美容外科、皮膚科、眼科手術)、エンドユーザー別、地域別、およびセグメント別予測(2026年~2033年)
- 細胞培養培地および細胞株市場の規模、シェア、動向分析レポート:製品別(従来型細胞株、従来型培地)、用途別(バイオ医薬品製造、診断、研究・学術機関)、最終用途別、地域別、およびセグメント別予測(2026年~2033年)
- 製品別(消耗品(キット・試薬)、機器、ソフトウェア)、技術別(PCR、キャピラリー電気泳動、NGS、マイクロアレイ、迅速DNA分析)、用途別(法医学、親子鑑定)、エンドユーザー別の人類識別市場 ― 2031年までの世界予測
- Next-Generation Sequencing Market by Product Type (Consumables, Platforms, Bioinformatics), Technology (SBS, Nanopore), Workflow (Sequencing, Data Analysis), Services, Application (Drug Discovery, Diagnostic, Agriculture) - Global Forecast to 2030
-
密閉型バイオプロセス市場規模、シェアおよび動向分析レポート:製品別(バイオリアクター、発酵槽、撹拌システム)、用途別(ワクチン製造、細胞・遺伝子治療)、最終用途別(製薬・バイオテクノロジー企業)、地域別、およびセグメント別予測(2026年~2033年)
-
シングルユース・バイオリアクターの市場規模、シェア、動向分析レポート:製品別、タイプ別、細胞タイプ別、分子タイプ別、用途別、最終用途別、使用タイプ別、地域別、セグメント別予測、2025年~2033年
-
シングルユースバイオリアクター市場:製品別(システム、バッグ、アセンブリ)、タイプ別(攪拌槽、バブルカラム、波動誘導)、分子別(mAbs、ワクチン)、細胞タイプ別(哺乳類、細菌、酵母)、用途別(研究開発、バイオ生産) - 2029年までの世界予測
-
シングルユースバイオプロセシングの世界市場規模調査、製品別(ろ過アセンブリ、使い捨てバイオリアクター、使い捨てミキサー、培地バッグ・容器、その他)、用途別(ろ過、精製、細胞培養、その他)、エンドユーザー別(バイオ医薬品メーカー、臨床・学術研究機関、その他)、ワークフロー別(上流、発酵、下流)、地域別予測、2022-2032年
-
バイオプロセスバリデーションの世界市場規模調査&予測、試験タイプ別(抽出物試験サービス、微生物試験サービス、物理化学試験サービス、完全性試験サービス、適合性試験サービス、その他試験サービス)、プロセスコンポーネント別(フィルター要素、媒体容器およびバッグ、凍結および解凍プロセスバッグ、混合システム、バイオリアクター、移送システム、その他)、エンドユーザー別(医薬品会社、生物工学会社、開発および製造受託機関、その他)、地域分析 2022-2029
-
Single Use Bioreactors Market by Product (System, Media Bag, Filtration assemblies), Type (Stirred tank, Bubble column), Cell Type (Mammalian, Bacterial, Yeast), Molecule (mAbs, Vaccines), End User (Pharma, Biotech, CROs, CMOs) & Region - Global Forecast to 2028
よくあるご質問
Visiongain社はどのような調査会社ですか?
英国の調査会社ヴィジョンゲイン社(Visiongain)は、通信とエネルギーのほか、自動車や化学・医薬品、金属など、広範な市場を対象に調査を行っています。自動車市場については、市場全般に関する調査のほ... もっと見る
調査レポートの納品までの日数はどの程度ですか?
在庫のあるものは速納となりますが、平均的には 3-4日と見て下さい。
但し、一部の調査レポートでは、発注を受けた段階で内容更新をして納品をする場合もあります。
発注をする前のお問合せをお願いします。
注文の手続きはどのようになっていますか?
1)お客様からの御問い合わせをいただきます。
2)見積書やサンプルの提示をいたします。
3)お客様指定、もしくは弊社の発注書をメール添付にて発送してください。
4)データリソース社からレポート発行元の調査会社へ納品手配します。
5) 調査会社からお客様へ納品されます。最近は、pdfにてのメール納品が大半です。
お支払方法の方法はどのようになっていますか?
納品と同時にデータリソース社よりお客様へ請求書(必要に応じて納品書も)を発送いたします。
お客様よりデータリソース社へ(通常は円払い)の御振り込みをお願いします。
請求書は、納品日の日付で発行しますので、翌月最終営業日までの当社指定口座への振込みをお願いします。振込み手数料は御社負担にてお願いします。
お客様の御支払い条件が60日以上の場合は御相談ください。
尚、初めてのお取引先や個人の場合、前払いをお願いすることもあります。ご了承のほど、お願いします。
データリソース社はどのような会社ですか?
当社は、世界各国の主要調査会社・レポート出版社と提携し、世界各国の市場調査レポートや技術動向レポートなどを日本国内の企業・公官庁及び教育研究機関に提供しております。
世界各国の「市場・技術・法規制などの」実情を調査・収集される時には、データリソース社にご相談ください。
お客様の御要望にあったデータや情報を抽出する為のレポート紹介や調査のアドバイスも致します。
|
|

