ソーラートラッカー市場レポート:2023-2033
Solar Tracker Market Report 2023-2033
レポート詳細
ソーラートラッカー市場レポート 2023-2033年 本レポートは、業界とその基礎となる原動力をよりよく理解することを望むなら、新たな収益ポケットを目指す大手企業にとって貴重なものと... もっと見る
※上記価格は部署ライセンス(Departmental licence)価格です。
その他の価格についてはデータリソースまでお問合せください。
日本語のページは自動翻訳を利用し作成しています。
実際のレポートは英文のみでご納品いたします。
サマリー
レポート詳細
ソーラートラッカー市場レポート 2023-2033年 本レポートは、業界とその基礎となる原動力をよりよく理解することを望むなら、新たな収益ポケットを目指す大手企業にとって貴重なものとなるでしょう。異業種への進出や新地域での既存事業の拡大を目指す企業にも有用です。
ソーラートラッカー業界の技術革新
従来のソーラートラッカーは通常、水平または垂直の1軸であった。しかし、水平・垂直両方向に移動できる二軸トラッカーや、複数列のソーラーパネルに対応できる多列トラッカーが普及しつつあった。これらのシステムは、一日を通して太陽エネルギーの取り込みを増加させ、エネルギー出力を最大化することを可能にした。ソーラートラッカーには、その性能を最適化するための高度なトラッキング・アルゴリズムが実装されていた。これらのアルゴリズムは、太陽位置、気象条件、シェーディング、過去のデータなど様々な要因を考慮し、ソーラーパネルの理想的な位置を決定し、それに応じて向きを調整する。
モノのインターネット(IoT)技術により、ソーラートラッカーシステムをクラウドに接続し、遠隔監視と制御を可能にした。この機能により、リアルタイムのデータ分析、性能追跡、トラブルシューティングが容易になり、メンテナンスと運用効率の向上につながった。両面から太陽光を取り込むことができる二面型ソーラーパネルが人気を集めていた。ソーラートラッカーは、この二面パネルの位置を最適化し、エネルギー収量を高めるために設計された。
ソーラートラッカーの設計の中には、各ソーラーパネルがアクチュエーターを持つ分散型アクチュエーターシステムを実装し始めたものもあった。このアプローチにより、機械的な複雑さが軽減され、信頼性が向上し、各パネルの動きを独立して制御できるようになった。材料科学の進歩により、ソーラートラッカー用に、より軽量で耐久性があり、耐候性のある材料が開発された。これらの材料は、メンテナンスの必要性を減らしながら、トラッカーの寿命を向上させた。
ソーラートラッカーによる追加エネルギー消費
ソーラートラッカーとは、ソーラーパネルが一日中太陽の動きに追従し、入射角度を最適化してエネルギーを最大限に取り込むための機構である。ソーラートラッカーは、太陽光発電システムの全体的なエネルギー出力を増加させることができる反面、作動させるための追加エネルギーも消費する。この追加的なエネルギー消費は、主にソーラーパネルを制御して再配置するために必要な電力によるものである。ソーラートラッカーの種類によって、必要なエネルギーは異なる。パネルを1軸(通常は東西)で動かす1軸トラッカーは、パネルを2軸(東西と南北)で動かす2軸トラッカーに比べて、一般的にエネルギー消費量が少ない。二軸トラッカーは、ソーラーパネルのアライメントをより良くしますが、作動に必要なエネルギーが多くなります。
市場調査レポートを購入する前にすべき質問とは?
- ソーラートラッカー市場はどのように進化しているのか?
- ソーラートラッカー市場の推進要因と抑制要因は何か?
- 各ソーラートラッカーサブマーケットセグメントは予測期間中にどのように成長し、これらのサブマーケットが2033年にどれくらいの収益を占めるのか?
- 2023年から2033年にかけて、各ソーラートラッカーサブマーケットの市場シェアはどのように推移するのか?
- 2023年から2033年にかけて市場全体の主な牽引役は何か?
- 主要なソーラートラッカー市場はマクロ経済の動きに概ね追随するのか、それとも個々の国内市場が他を凌駕するのか?
- 2033年までに各国市場のシェアはどう変化し、2033年に市場をリードするのはどの地域か?
- 主要プレーヤーと予測期間中の見通しは?
- これらの主要企業のソーラートラッカー・プロジェクトは?
- 2023年から2033年の間に、産業はどのように発展するのか?現在および今後10年間に行われるソーラートラッカー・プロジェクトにはどのような意味があるのか?
- ソーラートラッカー市場をさらに拡大するために、製品の商業化の必要性は高まっているか?
- ソーラートラッカー市場はどこへ向かい、どのようにすれば市場の最前線に立てるか?
このことが、今日、そして今後10年間のソーラートラッカー市場にどのような影響を与えるかを見極める必要がある:
- 220ページにわたる本レポートでは、86の表と110の図表を掲載しています。
- 本レポートは、業界における主要な有利分野にハイライトを当てているため、今すぐターゲットを絞ることができます。
- 世界、地域、国の売上と成長に関する詳細な分析が含まれています。
- 競合他社が成功した主なトレンド、変化、収益予測をハイライトしています。
本レポートは、ソーラートラッカー市場が今後10年間でどのように発展するか、またCOVID-19の景気後退と好転の変動に合わせてどのように発展するかをお伝えします。この市場は過去10年間のどの時点よりも今が重要です。
2033年までの予測やその他の分析から、商業的な展望が明らかになる
- 2033年までの収益予測に加え、直近の業績、成長率、市場シェアもご覧いただけます。
- ビジネスの展望と発展に関する独自の分析をご覧いただけます。
- 定性的分析(市場ダイナミクス、促進要因、機会、阻害要因、課題を含む)、ポーターズファイブフォース分析、PEST分析、最近の動向をご覧いただけます。
レポート対象セグメント
タイプ展望
- 一軸
- 二軸
用途
- ユーティリティ
- 住宅用
- 商業
世界市場全体と各分野の売上予測に加え、5つの地域と19の主要国市場の売上予測も掲載しています:
北米
- アメリカ
- カナダ
欧州
- ドイツ
- フランス
- イタリア
- ロシア
- その他の欧州
アジア太平洋
- 中国
- 日本
- インド
- オーストラリア
- 韓国
- その他のアジア太平洋地域
ラテンアメリカ
- ブラジル
- メキシコ
- コロンビア
- その他のラテンアメリカ
中東・アフリカ
- サウジアラビア
- イラン
- イスラエル
- カタール
- アルジェリア
- その他のMEA
また、本レポートには、ソーラートラッカー市場の2023年から2033年にかけての主要企業のプロファイルと、これらの企業の事業のこのセグメントに焦点を当てています。
主要企業と市場成長の可能性
・ Allearth Renewables
・ Arctech Solar Holding Co., Ltd.
・ Array Technologies, Inc.
・ FTC Solar
・ Gamechange Solar
・ Gonvarri Solar Steel
・ Ideematec
・ Nextracker Inc.
・ PV Hardware
・ Soltec Power Holdings S.A.
・ Trina Solar
・ Valmont Industries, Inc.
ソーラートラッカー市場全体の世界売上高、2023年から2033年までの金額ベースでは、2022年に68億米ドルを突破すると弊社では計算している。2033年まで力強い収益成長を予測。当社の調査では、どの企業が最も大きな可能性を秘めているかを特定しています。彼らの能力、進歩、商業的展望を発見し、あなたが一歩先を行くのにお役立てください。
ソーラートラッカー市場、2023-2033年市場レポートはどのように役立つのでしょうか?
要約すると、220ページに及ぶこのレポートは、以下のような知識を提供する:
- ソーラートラッカー市場の2023年から2033年までの収益予測 世界、地域レベルでのタイプ、用途、各予測を掲載 - 業界の展望を発見し、投資と収益に最も有利な場所を見つけます。
- 5つの地域と19の主要国市場の2033年までの収益予測 - 北米、欧州、アジア太平洋、中南米、中東・アフリカのソーラートラッカー市場2023年から2033年までの市場予測をご覧ください。また、米国、カナダ、メキシコ、ブラジル、ドイツ、コロンビア、イタリア、フランス、中国、インド、日本、ロシアなどの主要国について、市場規模の推定と予測を提供します。
- 既存企業および市場参入を目指す企業の展望-ソーラートラッカー市場に関わる主要企業12社の会社概要を含む。
独自の予測による定量的・定性的分析をご覧ください。私たちのレポートだけに含まれる情報を入手し、貴重なビジネスインテリジェンスで情報を得ることができます。
他では得られない情報
私たちの新しいレポートがあれば、知識に遅れをとったり、チャンスを逃したりする可能性が低くなります。弊社の調査レポートが貴社の調査、分析、意思決定にどのように役立つかをご覧ください。Visiongainのこの調査レポートは、ソーラートラッカー市場(2023年~2033年)、市場リーダー企業の商業分析を必要とするすべての方々を対象としています。データ、トレンド、予測をご覧いただけます。
ページTOPに戻る
目次
目次
1 レポート概要
1.1 研究の目的
1.2 ソーラートラッカー市場の紹介
1.3 本レポートの内容
1.4 本レポートを読むべき理由
1.5 本分析レポートが回答する主な質問
1.6 本レポートの対象者
1.7 方法論
1.7.1 市場の定義
1.7.2 市場評価・予測手法
1.7.3 データの検証
1.7.3.1 一次調査
1.7.3.2 セカンダリーリサーチ
1.8 よくある質問(FAQ)
1.9 Visiongainの関連レポート
1.10 Visiongainについて
2 エグゼクティブ・サマリー
3 市場概要
3.1 主要な調査結果
3.2 市場ダイナミクス
3.2.1 市場促進要因
3.2.1.1 エネルギー貯蔵技術の向上がソーラートラッカー産業を牽引
3.2.1.2 太陽エネルギー需要の増加が市場を牽引
3.2.1.3 ソーラートラッカー産業における技術革新
3.2.2 市場抑制要因
3.2.2.1 ソーラートラッカーは資本集約的技術である
3.2.2.2 ソーラートラッカーによる追加エネルギー消費
3.2.3 市場機会
3.2.3.1 新たな機会を開くソーラー設置規模
3.2.3.2 成長する再生可能エネルギー産業
3.3 COVID-19影響分析
3.4 ポーターのファイブフォース分析
3.4.1 サプライヤーの交渉力
3.4.2 買い手の交渉力
3.4.3 競争上のライバル
3.4.4 代替品による脅威
3.4.5 新規参入企業の脅威
4 ソーラートラッカー市場分析:製品別
4.1 主な調査結果
4.2 製品セグメント 市場魅力度指数
4.3 製品別ソーラートラッカー市場規模の推定と予測
4.4 単軸ソーラートラッカー
4.4.1 不均一な土地に対応するためのアップグレード
4.4.2 2023〜2033年の地域別市場規模(US$ Billion)
4.4.3 地域別市場シェア、2023年・2033年(%)
4.5 二軸ソーラートラッカー
4.5.1 IOTを利用したエネルギー効率の高い二軸太陽追尾システム
4.5.2 2023~2033年の地域別市場規模(US$ Billion)
4.5.3 地域別市場シェア、2023年・2033年(%)
5 ソーラートラッカー市場分析:用途別
5.1 主要調査結果
5.2 アプリケーションセグメント 市場魅力度指数
5.3 用途別ソーラートラッカー市場規模の推定と予測
5.4 ユーティリティ
5.4.1 2023〜2033年の地域別市場規模(US$ Billion)
5.4.2 地域別市場シェア、2023年・2033年(%)
5.5 住宅
5.5.1 2023〜2033年の地域別市場規模(US$ Billion)
5.5.2 地域別市場シェア、2023年・2033年(%)
5.6 業務用
5.6.1 2023〜2033年の地域別市場規模(US$ Billion)
5.6.2 地域別市場シェア、2023年・2033年(%)
6 ソーラートラッカー市場分析:地域別
6.1 主要な調査結果
6.2 地域別市場規模の推定と予測
7 北米のソーラートラッカー市場分析
7.1 主要な調査結果
7.2 北米のソーラートラッカー市場魅力度指数
7.3 北米のソーラートラッカー国別市場、2023年、2028年、2033年(US$ Billion)
7.4 北米のソーラートラッカー市場規模推定と予測:国別
7.5 北米のソーラートラッカー市場規模推定と予測:製品別
7.6 北米のソーラートラッカー市場規模推定と予測:用途別
7.7 米国のソーラートラッカー市場分析
7.7.1 米国では家庭用ソーラーパネルの採用が増加し続けている
7.7.2 Array Technologiesが2つの新しい実用規模ソーラートラッカーシステムを発表
7.8 カナダのソーラートラッカー市場分析
7.8.1 Polar Racking社が単軸トラッカーメーカーAxsus Solar社を買収
7.8.2 Solar FlexRackマウント・ソリューションがカナダの48MWソーラー・プロジェクト・ポートフォリオでDGCに採用される
7.8.3 NRG Systemsがカナダ最大のPVプラントに監視ソリューションを提供
8 欧州のソーラートラッカー市場分析
8.1 主要な調査結果
8.2 欧州のソーラートラッカー市場魅力度指数
8.3 欧州のソーラートラッカー国別市場、2023年、2028年、2033年(US$ Billion)
8.4 欧州のソーラートラッカー市場規模推定と予測:国別
8.5 欧州のソーラートラッカー市場規模推定と予測:製品別
8.6 欧州のソーラートラッカー市場規模推定と予測:用途別
8.7 ロシアのソーラートラッカー市場分析
8.8 ドイツのソーラー・トラッカー市場分析
8.8.1 欧州のデベロッパーIbVogt社がNextracker社の地形追従型ソーラートラッカーを採用
8.9 フランスのソーラー・トラッカー市場分析
8.9.1 フランスの新興企業が住宅用PVシステム向けに「手動式」ソーラートラッカーを提供
8.9.2 Ideematec、Amda Energiaの100MWアグリボルタプロジェクトにカスタマイズソーラートラッカーを供給
8.10 イタリアのソーラートラッカー市場分析
8.10.1 EnelとComalがイタリアで1GWのソーラートラッカー工場を計画
8.10.2 ENGIEがイタリア最大のアグロボルタパークを開設
8.11 その他の欧州のソーラートラッカー市場分析
9 アジア太平洋地域のソーラートラッカー市場分析
9.1 主要な調査結果
9.2 アジア太平洋地域のソーラートラッカー市場魅力度指数
9.3 アジア太平洋地域のソーラートラッカー国別市場規模、2023年、2028年、2033年(US$ Billion)
9.4 アジア太平洋地域のソーラートラッカー市場規模推定と予測:国別
9.5 アジア太平洋地域のソーラートラッカー市場規模推定と予測:製品別
9.6 アジア太平洋地域のソーラートラッカー市場規模推定と予測:用途別
9.7 中国ソーラートラッカー市場分析
9.7.1 FTC SolarがHX Trackerの買収を完了
9.8 インドのソーラートラッカー市場分析
9.8.1 最大の単軸ソーラートラッカーシステム
9.8.2 Gensol EngineeringがソーラートラッカープレーヤーScorpius Trackersを買収
9.9 日本のソーラートラッカー市場分析
9.9.1 カナディアンのおソーラーが日本で42MWpのソーラーポートフォリオの運用を開始
9.10 韓国のソーラートラッカー市場分析
9.10.1 トリナソーラー、韓国大邱のグリーンエネルギーエキスポで新技術とトラッカーを発表
9.11 オーストラリアのソーラートラッカー市場分析
9.11.1 太陽追尾装置大手がオーストラリアに製造施設を設立、地元プロジェクトに供給へ
9.12 その他のアジア太平洋地域のソーラートラッカー市場分析
10 中東・アフリカのソーラートラッカー市場分析
10.1 主要な調査結果
10.2 中東・アフリカのソーラートラッカー市場魅力度指数
10.3 中東・アフリカのソーラートラッカー国別市場、2023年、2028年、2033年(US$ Billion)
10.4 中東・アフリカのソーラートラッカー市場規模推定と予測:国別
10.5 中東・アフリカのソーラートラッカー市場規模推定と予測:製品別
10.6 中東・アフリカのソーラートラッカー市場規模推定と予測:用途別
10.7 サウジアラビアのソーラートラッカー市場分析
10.7.1 スペインのPV Hardwareがジッダに年産8GWのソーラートラッカー生産施設を新設
10.8 イランのソーラートラッカー市場の分析
10.8.1 イラン初の産業用太陽光発電トラッカーが完成
10.9 イスラエルPVトラッカー市場分析
10.9.1 Trina Solarがイスラエル最大のモジュールとトラッカー契約に調印
10.10 カタール太陽電池市場分析
10.10.1 トリナ、カタールの太陽光発電所に875MWのトラッカーを供給
10.11 アルジェリアの太陽電池市場分析
10.11.1 アルジェリアの100万kWソーラープロジェクト計画、2024年までに発電開始へ
10.12 その他の中東・アフリカ地域のソーラートラッカー市場分析
11 ラテンアメリカのソーラートラッカー市場分析
11.1 主要な調査結果
11.2 ラテンアメリカのソーラートラッカー市場魅力度指数
11.3 ラテンアメリカのソーラートラッカー国別市場、2023年、2028年、2033年(US$ Billion)
11.4 ラテンアメリカのソーラートラッカー市場規模推定と予測:国別
11.5 ラテンアメリカのソーラートラッカー市場規模推定と予測:製品別
11.6 ラテンアメリカのソーラートラッカー市場規模推定と予測:用途別
11.7 ブラジルのソーラートラッカー市場分析
11.7.1 ソルテック、カナディアン・ソーラーの2つのプロジェクトにSFOneトラッカーを供給
11.8 メキシコのソーラートラッカー市場分析
11.8.1 アークテックがメキシコの365.8MWプロジェクトにソーラートラッカーを供給
11.9 コロンビアのソーラートラッカー市場分析
11.9.1 コロンビア、トリナ・ソーラー初の統合プロジェクトをキックオフ
11.10 その他のラテンアメリカのソーラートラッカー市場分析
12 企業プロフィール
12.1 Nextracker Inc.
12.1.1 会社概要
12.1.2 会社概要
12.1.3 財務分析
12.1.3.1 純収入、2018-2022年
12.1.3.2 売上総利益、2018-2022年
12.1.3.3 営業利益、2018-2022年
12.1.3.4 地域市場シェア、2022年
12.1.4 製品ベンチマーク
12.1.5 戦略的展望
12.2 Array Technologies, Inc.
12.2.1 会社概要
12.2.2 会社概要
12.2.3 財務分析
12.2.3.1 純収入、2018-2022年
12.2.3.2 売上総利益、2018-2022年
12.2.3.3 営業利益、2018-2022年
12.2.3.4 地域市場シェア、2022年
12.2.3.5 セグメント市場シェア、2022年
12.2.4 製品ベンチマーク
12.2.5 戦略的展望
12.3 PV Hardware
12.3.1 会社概要
12.3.2 会社概要
12.3.3 製品ベンチマーク
12.3.4 戦略的展望
12.4 Arctech Solar Holding Co., Ltd.
12.4.1 会社概要
12.4.2 会社概要
12.4.3 財務分析
12.4.3.1 純収入、2018-2022年
12.4.4 製品ベンチマーク
12.4.5 戦略的展望
12.5 Soltec Power Holdings S.A.
12.5.1 会社概要
12.5.2 会社概要
12.5.3 財務分析
12.5.3.1 純収入、2018-2022年
12.5.3.2 地理的多様性(受注残)、2022年
12.5.3.3 地理的多様性(パイプライン)、2022年
12.5.4 製品ベンチマーク
12.5.5 戦略的展望
12.6 Trina Solar
12.6.1 会社概要
12.6.2 会社概要
12.6.3 製品ベンチマーク
12.6.4 戦略的展望
12.7 Valmont Industries, Inc.
12.7.1 会社概要
12.7.2 会社概要
12.7.3 財務分析
12.7.3.1 純収入、2018-2022年
12.7.3.2 売上総利益、2018-2022年
12.7.3.3 営業利益、2018-2022年
12.7.3.4 地域市場シェア、2022年
12.7.3.5 セグメント市場シェア、2022年
12.7.4 製品ベンチマーク
12.7.5 戦略的展望
12.8 Gonvarri Solar Steel
12.8.1 会社概要
12.8.2 会社概要
12.8.3 製品ベンチマーク
12.8.4 戦略的展望
12.9 Gamechange Solar
12.9.1 会社概要
12.9.2 会社概要
12.9.3 製品ベンチマーク
12.9.4 戦略的展望
12.10 Ideematec
12.10.1 会社概要
12.10.2 会社概要
12.10.3 製品ベンチマーク
12.10.4 戦略的展望
12.11 アAllearth Renewables
12.11.1 会社概要
12.11.2 会社概要
12.11.3 製品ベンチマーク
12.12 FTC Solar
12.12.1 会社概要
12.12.2 会社概要
12.12.3 製品ベンチマーク
12.12.4 戦略的展望
13 結論と提言
13.1 Visiongainからの結びの言葉
13.2 市場関係者への提言
ページTOPに戻る
図表リスト
表の一覧
Table 1 Solar Tracker Market Snapshot, 2023 & 2033 (US$ Billion, CAGR %)
Table 2 Solar Tracker Market Forecast by Region, 2023-2033 (US$ Billion, AGR%, CAGR%): “V” Shaped Recovery
Table 3 Solar Tracker Market Forecast by Region, 2023-2033 (US$ Billion, AGR%, CAGR%): “U” Shaped Recovery
Table 4 Solar Tracker Market Forecast by Region, 2023-2033 (US$ Billion, AGR%, CAGR%): “W” Shaped Recovery
Table 5 Solar Tracker Market Forecast by Region, 2023-2033 (US$ Billion, AGR%, CAGR%): “L” Shaped Recovery
Table 6 Solar Tracker Market Forecast by Product, 2023-2033 (US$ Billion, AGR%, CAGR%)
Table 7 Single Axis Segment Market Forecast by Region, 2023-2033 (US$ Billion, AGR%, CAGR%)
Table 8 Dual Axis Segment Market Forecast by Region, 2023-2033 (US$ Billion, AGR%, CAGR%)
Table 9 Solar Tracker Market Forecast by Application, 2023-2033 (US$ Billion, AGR%, CAGR%)
Table 10 Utility Segment Market Forecast by Region, 2023-2033 (US$ Billion, AGR%, CAGR%)
Table 11 Residential Segment Market Forecast by Region, 2023-2033 (US$ Billion, AGR%, CAGR%)
Table 12 Commercial Segment Market Forecast by Region, 2023-2033 (US$ Billion, AGR%, CAGR%)
Table 13 Solar Tracker Market Forecast by Region, 2023-2033 (US$ Billion, AGR%, CAGR%)
Table 14 North America Solar Tracker Market Forecast by Country, 2023-2033 (US$ Billion, AGR%, CAGR%)
Table 15 North America Solar Tracker Market Forecast by Product, 2023-2033 (US$ Billion, AGR%, CAGR%)
Table 16 North America Solar Tracker Market Forecast by Application, 2023-2033 (US$ Billion, AGR%, CAGR%)
Table 17 U.S. Solar Tracker Market Forecast, 2023-2033 (US$ Billion, AGR%, CAGR%)
Table 18 Canada Solar Tracker Market Forecast, 2023-2033 (US$ Billion, AGR%, CAGR%)
Table 19 Europe Solar Tracker Market Forecast by Country, 2023-2033 (US$ Billion, AGR%, CAGR%)
Table 20 Europe Solar Tracker Market Forecast by Product, 2023-2033 (US$ Billion, AGR%, CAGR%)
Table 21 Europe Solar Tracker Market Forecast by Application, 2023-2033 (US$ Billion, AGR%, CAGR%)
Table 22 Russia Solar Tracker Market Forecast, 2023-2033 (US$ Billion, AGR%, CAGR%)
Table 23 Germany Solar Tracker Market Forecast, 2023-2033 (US$ Billion, AGR%, CAGR%)
Table 24 France Solar Tracker Market Forecast, 2023-2033 (US$ Billion, AGR%, CAGR%)
Table 25 Italy Solar Tracker Market Forecast, 2023-2033 (US$ Billion, AGR%, CAGR%)
Table 26 Rest of Europe Solar Tracker Market Forecast, 2023-2033 (US$ Billion, AGR%, CAGR%)
Table 27 Asia Pacific Solar Tracker Market Forecast by Country, 2023-2033 (US$ Billion, AGR%, CAGR%)
Table 28 Asia Pacific Solar Tracker Market Forecast by Product, 2023-2033 (US$ Billion, AGR%, CAGR%)
Table 29 Asia Pacific Solar Tracker Market Forecast by Application, 2023-2033 (US$ Billion, AGR%, CAGR%)
Table 30 China Solar Tracker Market Forecast, 2023-2033 (US$ Billion, AGR%, CAGR%)
Table 31 India Solar Tracker Market Forecast, 2023-2033 (US$ Billion, AGR%, CAGR%)
Table 32 Japan Solar Tracker Market Forecast, 2023-2033 (US$ Billion, AGR%, CAGR%)
Table 33 South Korea Solar Tracker Market Forecast, 2023-2033 (US$ Billion, AGR%, CAGR%)
Table 34 Australia Solar Tracker Market Forecast, 2023-2033 (US$ Billion, AGR%, CAGR%)
Table 35 Rest of Asia Pacific Solar Tracker Market Forecast, 2023-2033 (US$ Billion, AGR%, CAGR%)
Table 36 Middle East & Africa Solar Tracker Market Forecast by Country, 2023-2033 (US$ Billion, AGR%, CAGR%)
Table 37 Middle East & Africa Solar Tracker Market Forecast by Product, 2023-2033 (US$ Billion, AGR%, CAGR%)
Table 38 Middle East & Africa Solar Tracker Market Forecast by Application, 2023-2033 (US$ Billion, AGR%, CAGR%)
Table 39 Saudi Arabia Solar Tracker Market Forecast, 2023-2033 (US$ Billion, AGR%, CAGR%)
Table 40 Iran Solar Tracker Market Forecast, 2023-2033 (US$ Billion, AGR%, CAGR%)
Table 41 Israel Solar Tracker Market Forecast, 2023-2033 (US$ Billion, AGR%, CAGR%)
Table 42 Qatar Solar Tracker Market Forecast, 2023-2033 (US$ Billion, AGR%, CAGR%)
Table 43 Algeria Solar Tracker Market Forecast, 2023-2033 (US$ Billion, AGR%, CAGR%)
Table 44 Rest of Middle East & Africa Solar Tracker Market Forecast, 2023-2033 (US$ Billion, AGR%, CAGR%)
Table 45 Latin America Solar Tracker Market Forecast by Country, 2023-2033 (US$ Billion, AGR%, CAGR%)
Table 46 Latin America Solar Tracker Market Forecast by Product, 2023-2033 (US$ Billion, AGR%, CAGR%)
Table 47 Latin America Solar Tracker Market Forecast by Application, 2023-2033 (US$ Billion, AGR%, CAGR%)
Table 48 Brazil Solar Tracker Market Forecast, 2023-2033 (US$ Billion, AGR%, CAGR%)
Table 49 Mexico Solar Tracker Market Forecast, 2023-2033 (US$ Billion, AGR%, CAGR%)
Table 50 Colombia Solar Tracker Market Forecast, 2023-2033 (US$ Billion, AGR%, CAGR%)
Table 51 Rest of Latin America Solar Tracker Market Forecast, 2023-2033 (US$ Billion, AGR%, CAGR%)
Table 52 Nextracker Inc.: Key Details, (CEO, HQ, USD Million, Founded, No. of Employees, Company Type, Website, Business Segment)
Table 53 Nextracker Inc.: Product Benchmarking
Table 54 Nextracker Inc.: Strategic Outlook
Table 55 Array Technologies, Inc.: Key Details, (CEO, HQ, USD Million, Founded, No. of Employees, Company Type, Website, Business Segment)
Table 56 Array Technologies, Inc.: Product Benchmarking
Table 57 Array Technologies, Inc.: Strategic Outlook
Table 58 PV Hardware: Key Details, (CEO, HQ, USD Million, Founded, No. of Employees, Company Type, Website, Business Segment)
Table 59 PV hardware: Product Benchmarking
Table 60 PV hardware: Strategic Outlook
Table 61 Arctech Solar Holding Co., Ltd.: Key Details, (CEO, HQ, USD Million, Founded, No. of Employees, Company Type, Website, Business Segment)
Table 62 Arctech Solar Holding Co., Ltd.: Product Benchmarking
Table 63 Arctech Solar Holding Co., Ltd.: Strategic Outlook
Table 64 Soltec Power Holdings S.A.: Key Details, (CEO, HQ, USD Million, Founded, No. of Employees, Company Type, Website, Business Segment)
Table 65 Soltec Power Holdings S.A.: Product Benchmarking
Table 66 Soltec Power Holdings S.A.: Strategic Outlook
Table 67 Trina Solar: Key Details, (CEO, HQ, USD Million, Founded, No. of Employees, Company Type, Website, Business Segment)
Table 68 Trina Solar: Product Benchmarking
Table 69 Trina Solar: Strategic Outlook
Table 70 Valmont Industries, Inc.: Key Details, (CEO, HQ, USD Million, Founded, No. of Employees, Company Type, Website, Business Segment)
Table 71 Valmont Industries, Inc.: Product Benchmarking
Table 72 Valmont Industries, Inc.: Strategic Outlook
Table 73 Gonvarri Solar Steel: Key Details, (CEO, HQ, USD Million, Founded, No. of Employees, Company Type, Website, Business Segment)
Table 74 Gonvarri Solar Steel: Product Benchmarking
Table 75 Gonvarri Solar Steel: Strategic Outlook
Table 76 Gamechange Solar: Key Details, (CEO, HQ, USD Million, Founded, No. of Employees, Company Type, Website, Business Segment)
Table 77 Gamechange Solar: Product Benchmarking
Table 78 Gamechange Solar: Strategic Outlook
Table 79 Ideematec: Key Details, (CEO, HQ, USD Million, Founded, No. of Employees, Company Type, Website, Business Segment)
Table 80 Ideematec: Product Benchmarking
Table 81 Ideematec: Strategic Outlook
Table 82 Allearth Renewables: Key Details, (CEO, HQ, USD Million, Founded, No. of Employees, Company Type, Website, Business Segment)
Table 83 Allearth Renewables: Product Benchmarking
Table 84 FTC Solar: Key Details, (CEO, HQ, USD Million, Founded, No. of Employees, Company Type, Website, Business Segment)
Table 85 FTC Solar: Product Benchmarking
Table 86 FTC Solar: Strategic Outlook
図の一覧
Figure 1 Solar Tracker Market Segmentation
Figure 2 Solar Tracker Market by Product: Market Attractiveness Index
Figure 3 Solar Tracker Market by Application: Market Attractiveness Index
Figure 4 Solar Tracker Market Attractiveness Index by Region
Figure 5 Solar Tracker Market: Market Dynamics
Figure 6 Solar Tracker Market by Region, 2023-2033 (US$ Billion, AGR %): “V” Shaped Recovery
Figure 7 Solar Tracker Market by Region, 2023-2033 (US$ Billion, AGR %): “U” Shaped Recovery
Figure 8 Solar Tracker Market by Region, 2023-2033 (US$ Billion, AGR %): “W” Shaped Recovery
Figure 9 Solar Tracker Market by Region, 2023-2033 (US$ Billion, AGR %): “L” Shaped Recovery
Figure 10 Solar Tracker Market: Porter’s Five Forces Analysis
Figure 11 Solar Tracker Market by Product: Market Attractiveness Index
Figure 12 Solar Tracker Market Forecast by Product, 2023-2033 (US$ Billion, AGR %)
Figure 13 Solar Tracker Market Share Forecast by Product, 2023, 2028, 2033 (%)
Figure 14 Single Axis Segment Market Forecast by Region, 2023-2033 (US$ Billion, AGR %)
Figure 15 Single Axis Segment Market Share Forecast by Region, 2023 & 2033 (%)
Figure 16 Dual Axis Segment Market Forecast by Region, 2023-2033 (US$ Billion, AGR %)
Figure 17 Dual Axis Segment Market Share Forecast by Region, 2023 & 2033 (%)
Figure 18 Solar Tracker Market by Application: Market Attractiveness Index
Figure 19 Solar Tracker Market Forecast by Application, 2023-2033 (US$ Billion, AGR %)
Figure 20 Solar Tracker Market Share Forecast by Application, 2023, 2028, 2033 (%)
Figure 21 Utility Segment Market Forecast by Region, 2023-2033 (US$ Billion, AGR %)
Figure 22 Utility Segment Market Share Forecast by Region, 2023 & 2033 (%)
Figure 23 Residential Segment Market Forecast by Region, 2023-2033 (US$ Billion, AGR %)
Figure 24 Residential Segment Market Share Forecast by Region, 2023 & 2033 (%)
Figure 25 Commercial Segment Market Forecast by Region, 2023-2033 (US$ Billion, AGR %)
Figure 26 Commercial Segment Market Share Forecast by Region, 2023 & 2033 (%)
Figure 27 Solar Tracker Market Forecast by Region 2023 and 2033 (USD Million, CAGR%)
Figure 28 Solar Tracker Market Share Forecast by Region 2023, 2028, 2033 (%)
Figure 29 Solar Tracker Market by Region, 2023-2033 (US$ Billion, AGR %)
Figure 30 North America Solar Tracker Market Attractiveness Index
Figure 31 North America Solar Tracker Market by Region, 2023, 2028 & 2033 (US$ Billion)
Figure 32 North America Solar Tracker Market Forecast by Country, 2023-2033 (US$ Billion, AGR %)
Figure 33 North America Solar Tracker Market Share Forecast by Country, 2023 & 2033 (%)
Figure 34 North America Solar Tracker Market Forecast by Product, 2023-2033 (US$ Billion, AGR %)
Figure 35 North America Solar Tracker Market Share Forecast by Product, 2023 & 2033 (%)
Figure 36 North America Solar Tracker Market Forecast by Application, 2023-2033 (US$ Billion, AGR %)
Figure 37 North America Solar Tracker Market Share Forecast by Application, 2023 & 2033 (%)
Figure 38 U.S. Solar Tracker Market Forecast, 2023-2033 (US$ Billion, AGR %)
Figure 39 Canada Solar Tracker Market Forecast, 2023-2033 (US$ Billion, AGR %)
Figure 40 Europe Solar Tracker Market Attractiveness Index
Figure 41 Europe Solar Tracker Market by Region, 2023, 2028 & 2033 (US$ Billion)
Figure 42 Europe Solar Tracker Market Forecast by Country, 2023-2033 (US$ Billion, AGR %)
Figure 43 Europe Solar Tracker Market Share Forecast by Country, 2023 & 2033 (%)
Figure 44 Europe Solar Tracker Market Forecast by Product, 2023-2033 (US$ Billion, AGR %)
Figure 45 Europe Solar Tracker Market Share Forecast by Product, 2023 & 2033 (%)
Figure 46 Europe Solar Tracker Market Forecast by Application, 2023-2033 (US$ Billion, AGR %)
Figure 47 Europe Solar Tracker Market Share Forecast by Application, 2023 & 2033 (%)
Figure 48 Russia Solar Tracker Market Forecast, 2023-2033 (US$ Billion, AGR %)
Figure 49 Germany Solar Tracker Market Forecast, 2023-2033 (US$ Billion, AGR %)
Figure 50 France Solar Tracker Market Forecast, 2023-2033 (US$ Billion, AGR %)
Figure 51 Italy Solar Tracker Market Forecast, 2023-2033 (US$ Billion, AGR %)
Figure 52 Rest of Europe Solar Tracker Market Forecast, 2023-2033 (US$ Billion, AGR %)
Figure 53 Asia Pacific Solar Tracker Market Attractiveness Index
Figure 54 Asia Pacific Solar Tracker Market by Region, 2023, 2028 & 2033 (US$ Billion)
Figure 55 Asia Pacific Solar Tracker Market Forecast by Country, 2023-2033 (US$ Billion, AGR %)
Figure 56 Asia Pacific Solar Tracker Market Share Forecast by Country, 2023 & 2033 (%)
Figure 57 Asia Pacific Solar Tracker Market Forecast by Product, 2023-2033 (US$ Billion, AGR %)
Figure 58 Asia Pacific Solar Tracker Market Share Forecast by Product, 2023 & 2033 (%)
Figure 59 Asia Pacific Solar Tracker Market Forecast by Application, 2023-2033 (US$ Billion, AGR %)
Figure 60 Asia Pacific Solar Tracker Market Share Forecast by Application, 2023 & 2033 (%)
Figure 61 China Solar Tracker Market Forecast, 2023-2033 (US$ Billion, AGR %)
Figure 62 India Solar Tracker Market Forecast, 2023-2033 (US$ Billion, AGR %)
Figure 63 Japan Solar Tracker Market Forecast, 2023-2033 (US$ Billion, AGR %)
Figure 64 South Korea Solar Tracker Market Forecast, 2023-2033 (US$ Billion, AGR %)
Figure 65 Australia Solar Tracker Market Forecast, 2023-2033 (US$ Billion, AGR %)
Figure 66 Rest of Asia Pacific Solar Tracker Market Forecast, 2023-2033 (US$ Billion, AGR %)
Figure 67 Middle East & Africa Solar Tracker Market Attractiveness Index
Figure 68 Middle East & Africa Solar Tracker Market by Region, 2023, 2028 & 2033 (US$ Billion)
Figure 69 Middle East & Africa Solar Tracker Market Forecast by Country, 2023-2033 (US$ Billion, AGR %)
Figure 70 Middle East & Africa Solar Tracker Market Share Forecast by Country, 2023 & 2033 (%)
Figure 71 Middle East & Africa Solar Tracker Market Forecast by Product, 2023-2033 (US$ Billion, AGR %)
Figure 72 Middle East & Africa Solar Tracker Market Share Forecast by Product, 2023 & 2033 (%)
Figure 73 Middle East & Africa Solar Tracker Market Forecast by Application, 2023-2033 (US$ Billion, AGR %)
Figure 74 Middle East & Africa Solar Tracker Market Share Forecast by Application, 2023 & 2033 (%)
Figure 75 Saudi Arabia Solar Tracker Market Forecast, 2023-2033 (US$ Billion, AGR %)
Figure 76 Iran Solar Tracker Market Forecast, 2023-2033 (US$ Billion, AGR %)
Figure 77 Israel Solar Tracker Market Forecast, 2023-2033 (US$ Billion, AGR %)
Figure 78 Qatar Solar Tracker Market Forecast, 2023-2033 (US$ Billion, AGR %)
Figure 79 Algeria Solar Tracker Market Forecast, 2023-2033 (US$ Billion, AGR %)
Figure 80 Rest of Middle East & Africa Solar Tracker Market Forecast, 2023-2033 (US$ Billion, AGR %)
Figure 81 Latin America Solar Tracker Market Attractiveness Index
Figure 82 Latin America Solar Tracker Market by Region, 2023, 2028 & 2033 (US$ Billion)
Figure 83 Latin America Solar Tracker Market Forecast by Country, 2023-2033 (US$ Billion, AGR %)
Figure 84 Latin America Solar Tracker Market Share Forecast by Country, 2023 & 2033 (%)
Figure 85 Latin America Solar Tracker Market Forecast by Product, 2023-2033 (US$ Billion, AGR %)
Figure 86 Latin America Solar Tracker Market Share Forecast by Product, 2023 & 2033 (%)
Figure 87 Latin America Solar Tracker Market Forecast by Application, 2023-2033 (US$ Billion, AGR %)
Figure 88 Latin America Solar Tracker Market Share Forecast by Application, 2023 & 2033 (%)
Figure 89 Brazil Solar Tracker Market Forecast, 2023-2033 (US$ Billion, AGR %)
Figure 90 Mexico Solar Tracker Market Forecast, 2023-2033 (US$ Billion, AGR %)
Figure 91 Colombia Solar Tracker Market Forecast, 2023-2033 (US$ Billion, AGR %)
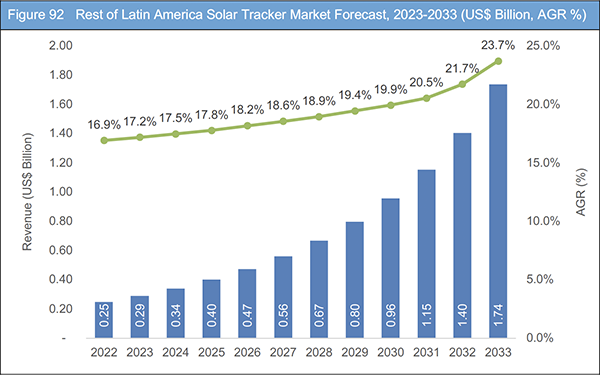
Figure 92 Rest of Latin America Solar Tracker Market Forecast, 2023-2033 (US$ Billion, AGR %)
Figure 93 Nextracker Inc.: Net Revenue, 2018-2022 (US$ Million, AGR%)
Figure 94 Nextracker Inc.: Gross Profit, 2018-2022 (US$ Million, AGR%)
Figure 95 Nextracker Inc.: Operating Income, 2018-2022 (US$ Million, AGR%)
Figure 96 Nextracker Inc.: Regional Market Shares, 2022
Figure 97 Array Technologies, Inc.: Net Revenue, 2018-2022 (US$ Million, AGR%)
Figure 98 Array Technologies, Inc.: Gross Profit, 2018-2022 (US$ Million, AGR%)
Figure 99 Array Technologies, Inc.: Operating Income, 2018-2022 (US$ Million, AGR%)
Figure 100 Array Technologies, Inc.: Regional Market Shares, 2022
Figure 101 Array Technologies, Inc.: Segment Market Shares, 2022
Figure 102 Arctech Solar Holding Co., Ltd.: Net Revenue, 2018-2022 (US$ Million, AGR%)
Figure 103 Soltec: Net Revenue, 2018-2022 (US$ Million, AGR%)
Figure 104 Soltec: Geographic Diversification (Backlog), 2022
Figure 105 Soltec: Geographic Diversification (Pipeline), 2022
Figure 106 Valmont Industries, Inc.: Net Revenue, 2018-2022 (US$ Million, AGR%)
Figure 107 Valmont Industries, Inc.: Gross Profit, 2018-2022 (US$ Million, AGR%)
Figure 108 Valmont Industries, Inc.: Operating Income, 2018-2022 (US$ Million, AGR%)
Figure 109 Valmont Industries, Inc.: Regional Market Shares, 2022
Figure 110 Valmont Industries, Inc.: Segment Market Shares, 2022
ページTOPに戻る
Summary
Report Details
The Solar Tracker Market Report 2023-2033: This report will prove invaluable to leading firms striving for new revenue pockets if they wish to better understand the industry and its underlying dynamics. It will be useful for companies that would like to expand into different industries or to expand their existing operations in a new region.
Technological Innovations in Solar Tracker Industry
Traditional solar trackers were usually single-axis, either horizontal or vertical. However, dual-axis trackers that could move both horizontally and vertically and multi-row trackers that could accommodate multiple rows of solar panels were becoming more prevalent. These systems allowed for increased solar energy capture throughout the day, maximizing the energy output.
Sophisticated tracking algorithms were being implemented in solar trackers to optimize their performance. These algorithms considered various factors such as solar position, weather conditions, shading, and historical data to determine the ideal position for the solar panels and adjust their orientation accordingly.
Internet of Things (IoT) technology enabled solar tracker systems to be connected to the cloud, allowing for remote monitoring and control. This feature facilitated real-time data analysis, performance tracking, and troubleshooting, leading to improved maintenance and operational efficiency. Bifacial solar panels, capable of capturing sunlight from both sides, were gaining popularity. Solar trackers were designed to optimize the positioning of these bifacial panels to enhance their energy yield.
Some solar tracker designs started implementing distributed actuation systems, where each solar panel had its actuator. This approach reduced mechanical complexity, improved reliability, and allowed independent control over each panel’s movement. Advancements in materials science led to the development of lighter, more durable, and weather-resistant materials for solar trackers. These materials enhanced the trackers’ lifespan while reducing maintenance requirements.
Additional Energy Consumption Due To Solar Tracker
Solar trackers are mechanisms that allow solar panels to follow the sun’s movement throughout the day, optimizing their angle of incidence to maximize energy capture. While solar trackers can increase the overall energy output of a solar system, they also consume additional energy themselves to operate. This additional energy consumption is mainly due to the power needed to control and reposition the solar panels. Different types of solar trackers have varying energy requirements. Single-axis trackers, which move the panels on one axis (usually East-West), generally consume less energy compared to dual-axis trackers, which move the panels on two axes (East-West and North-South). Dual-axis trackers provide better solar panel alignment but require more energy to operate.
What Questions Should You Ask before Buying a Market Research Report?
• How is the solar trackers market evolving?
• What is driving and restraining the solar trackers market?
• How will each solar trackers submarket segment grow over the forecast period and how much revenue will these submarkets account for in 2033?
• How will the market shares for each solar trackers submarket develops from 2023 to 2033?
• What will be the main driver for the overall market from 2023 to 2033?
• Will leading solar trackers markets broadly follow the macroeconomic dynamics, or will individual national markets outperform others?
• How will the market shares of the national markets change by 2033 and which geographical region will lead the market in 2033?
• Who are the leading players and what are their prospects over the forecast period?
• What are the solar trackers projects for these leading companies?
• How will the industry evolve during the period between 2023 and 2033? What are the implications of solar trackers projects taking place now and over the next 10 years?
• Is there a greater need for product commercialisation to further scale the solar trackers market?
• Where is the solar trackers market heading and how can you ensure you are at the forefront of the market?
You need to discover how this will impact the solar trackers market today, and over the next 10 years:
• Our 220-page report provides 86 tables and 110 charts/graphs exclusively to you.
• The report highlights key lucrative areas in the industry so you can target them – NOW.
• It contains in-depth analysis of global, regional and national sales and growth.
• It highlights for you the key successful trends, changes and revenue projections made by your competitors.
This report tells you TODAY how the solar trackers market will develop in the next 10 years, and in line with the variations in COVID-19 economic recession and bounce. This market is more critical now than at any point over the last 10 years.
Forecasts to 2033 and other analyses reveal commercial prospects
• In addition to revenue forecasting to 2033, our new study provides you with recent results, growth rates, and market shares.
• You will find original analyses, with business outlooks and developments.
• Discover qualitative analyses (including market dynamics, drivers, opportunities, restraints, and challenges), porters five forces analysis, PEST analysis, and recent developments.
Segments Covered in the Report
Type Outlook
• Single Axis
• Dual Axis
Application Outlook
• Utility
• Residential
• Commercial
In addition to the revenue predictions for the overall world market and segments, you will also find revenue forecasts for five regional and 19 leading national markets:
North America
• U.S.
• Canada
Europe
• Germany
• France
• Italy
• Russia
• Rest of Europe
Asia Pacific
• China
• Japan
• India
• Australia
• South Korea
• Rest of Asia Pacific
Latin America
• Brazil
• Mexico
• Colombia
• Rest of Latin America
Middle East & Africa
• Saudi Arabia
• Iran
• Israel
• Qatar
• Algeria
• Rest of MEA
The report also includes profiles and for some of the leading companies in the Solar Tracker Market, 2023 to 2033, with a focus on this segment of these companies’ operations.
Leading companies and the potential for market growth
• Allearth Renewables
• Arctech Solar Holding Co., Ltd.
• Array Technologies, Inc.
• FTC Solar
• Gamechange Solar
• Gonvarri Solar Steel
• Ideematec
• Nextracker Inc.
• PV Hardware
• Soltec Power Holdings S.A.
• Trina Solar
• Valmont Industries, Inc.
Overall world revenue for Solar Tracker Market, 2023 to 2033 in terms of value the market will surpass US$6.80 billion in 2022, our work calculates. We predict strong revenue growth through to 2033. Our work identifies which organisations hold the greatest potential. Discover their capabilities, progress, and commercial prospects, helping you stay ahead.
How will the Solar Tracker Market, 2023 to 2033 Market report help you?
In summary, our 220-page report provides you with the following knowledge:
• Revenue forecasts to 2033 for Solar Tracker Market, 2023 to 2033 Market, with forecasts for type, application, and each forecast at a global, and regional level – discover the industry’s prospects, finding the most lucrative places for investments and revenues.
• Revenue forecasts to 2033 for five regional and 19 key national markets – See forecasts for the Solar Tracker Market, 2023 to 2033 market in North America, Europe, Asia-Pacific, Latin America, and Middle East & Africa. Also, market size estimation and forecast is provided for US, Canada, Mexico, Brazil, Germany, Colombia, Italy, France, China, India, Japan, and Russia among other prominent economies.
• Prospects for established firms and those seeking to enter the market – including company profiles for 12 of the major companies involved in the Solar Tracker Market.
Find quantitative and qualitative analyses with independent predictions. Receive information that only our report contains, staying informed with invaluable business intelligence.
Information found nowhere else
With our new report, you are less likely to fall behind in knowledge or miss out on opportunities. See how our work could benefit your research, analyses, and decisions. Visiongain’s study is for everybody needing commercial analyses for the Solar Tracker Market, 2023 to 2033, market-leading companies. You will find data, trends and predictions.
ページTOPに戻る
Table of Contents
Table of Contents
1 Report Overview
1.1 Objectives of the Study
1.2 Introduction to Solar Tracker Market
1.3 What This Report Delivers
1.4 Why You Should Read This Report
1.5 Key Questions Answered by This Analytical Report
1.6 Who is This Report for?
1.7 Methodology
1.7.1 Market Definitions
1.7.2 Market Evaluation & Forecasting Methodology
1.7.3 Data Validation
1.7.3.1 Primary Research
1.7.3.2 Secondary Research
1.8 Frequently Asked Questions (FAQs)
1.9 Associated Visiongain Reports
1.10 About Visiongain
2 Executive Summary
3 Market Overview
3.1 Key Findings
3.2 Market Dynamics
3.2.1 Market Driving Factors
3.2.1.1 Improving Energy Storage Technologies to Drive Solar Tracker Industry
3.2.1.2 Growing Solar Energy Demand to Drive the Market
3.2.1.3 Technological Innovations in Solar Tracker Industry
3.2.2 Market Restraining Factors
3.2.2.1 Solar Tracker is a Capital Intensive Technology
3.2.2.2 Additional Energy Consumption Due To Solar Tracker
3.2.3 Market Opportunities
3.2.3.1 Scale of Solar Installations to Open New Opportunities
3.2.3.2 Growing Renewable Energy Industry
3.3 COVID-19 Impact Analysis
3.4 Porter’s Five Forces Analysis
3.4.1 Bargaining Power of Suppliers
3.4.2 Bargaining Power of Buyers
3.4.3 Competitive Rivalry
3.4.4 Threat from Substitutes
3.4.5 Threat of New Entrants
4 Solar Tracker Market Analysis by Product
4.1 Key Findings
4.2 Product Segment: Market Attractiveness Index
4.3 Solar Tracker Market Size Estimation and Forecast by Product
4.4 Single Axis Solar Tracker
4.4.1 Upgrade to Handle Uneven Land Sites
4.4.2 Market Size by Region, 2023-2033 (US$ Billion)
4.4.3 Market Share by Region, 2023 & 2033 (%)
4.5 Dual Axis Solar Tracker
4.5.1 Energy Efficient Dual Axis Solar Tracking System Using IOT
4.5.2 Market Size by Region, 2023-2033 (US$ Billion)
4.5.3 Market Share by Region, 2023 & 2033 (%)
5 Solar Tracker Market Analysis by Application
5.1 Key Findings
5.2 Application Segment: Market Attractiveness Index
5.3 Solar Tracker Market Size Estimation and Forecast by Application
5.4 Utility
5.4.1 Market Size by Region, 2023-2033 (US$ Billion)
5.4.2 Market Share by Region, 2023 & 2033 (%)
5.5 Residential
5.5.1 Market Size by Region, 2023-2033 (US$ Billion)
5.5.2 Market Share by Region, 2023 & 2033 (%)
5.6 Commercial
5.6.1 Market Size by Region, 2023-2033 (US$ Billion)
5.6.2 Market Share by Region, 2023 & 2033 (%)
6 Solar Tracker Market Analysis by Region
6.1 Key Findings
6.2 Regional Market Size Estimation and Forecast
7 North America Solar Tracker Market Analysis
7.1 Key Findings
7.2 North America Solar Tracker Market Attractiveness Index
7.3 North America Solar Tracker Market by Country, 2023, 2028 & 2033 (US$ Billion)
7.4 North America Solar Tracker Market Size Estimation and Forecast by Country
7.5 North America Solar Tracker Market Size Estimation and Forecast by Product
7.6 North America Solar Tracker Market Size Estimation and Forecast by Application
7.7 U.S. Solar Tracker Market Analysis
7.7.1 Home Solar Panel Adoption Continues to Rise in the U.S.
7.7.2 Array Technologies Launched Two New Utility-Scale Solar Tracker Systems
7.8 Canada Solar Tracker Market Analysis
7.8.1 Polar Racking Acquired Single-Axis Tracker Manufacturer Axsus Solar
7.8.2 Solar FlexRack Mounting Solutions Selected by DGC for 48 MW Solar Project Portfolio in Canada
7.8.3 NRG Systems Provides Monitoring Solution for Largest PV Plant in Canada
8 Europe Solar Tracker Market Analysis
8.1 Key Findings
8.2 Europe Solar Tracker Market Attractiveness Index
8.3 Europe Solar Tracker Market by Country, 2023, 2028 & 2033 (US$ Billion)
8.4 Europe Solar Tracker Market Size Estimation and Forecast by Country
8.5 Europe Solar Tracker Market Size Estimation and Forecast by Product
8.6 Europe Solar Tracker Market Size Estimation and Forecast by Application
8.7 Russia Solar Tracker Market Analysis
8.8 Germany Solar Tracker Market Analysis
8.8.1 European Developer IbVogt Chooses Nextracker’s Terrain-Following Solar Tracker
8.9 France Solar Tracker Market Analysis
8.9.1 French Startup Offers ‘Manual’ Solar Tracker for Residential PV Systems
8.9.2 Ideematec To Supply Customized Solar Trackers For Amda Energia’s 100 MW Agrivoltaic Project
8.10 Italy Solar Tracker Market Analysis
8.10.1 Enel, Comal Plan 1GW Solar Tracker Factory in Italy
8.10.2 ENGIE Inaugurated the Biggest Agrovoltaic Park in Italy
8.11 Rest of Europe Solar Tracker Market Analysis
9 Asia Pacific Solar Tracker Market Analysis
9.1 Key Findings
9.2 Asia Pacific Solar Tracker Market Attractiveness Index
9.3 Asia Pacific Solar Tracker Market by Country, 2023, 2028 & 2033 (US$ Billion)
9.4 Asia Pacific Solar Tracker Market Size Estimation and Forecast by Country
9.5 Asia Pacific Solar Tracker Market Size Estimation and Forecast by Product
9.6 Asia Pacific Solar Tracker Market Size Estimation and Forecast by Application
9.7 China Solar Tracker Market Analysis
9.7.1 FTC Solar Closed Acquisition of HX Tracker
9.8 India Solar Tracker Market Analysis
9.8.1 Largest Single-Axis Solar Tracker System
9.8.2 Gensol Engineering Acquired Solar Tracker Player Scorpius Trackers
9.9 Japan Solar Tracker Market Analysis
9.9.1 Canadian Solar Launched Operation for 42 MWp Solar Portfolio in Japan
9.10 South Korea Solar Tracker Market Analysis
9.10.1 Trina Solar to Unveil New Technologies and Tracker at Green Energy Expo in South Korea’s Daegu
9.11 Australia Solar Tracker Market Analysis
9.11.1 Solar Tracker Giant Sets Up Manufacturing Facility In Australia To Supply Local Projects
9.12 Rest of Asia Pacific Solar Tracker Market Analysis
10 Middle East & Africa Solar Tracker Market Analysis
10.1 Key Findings
10.2 Middle East & Africa Solar Tracker Market Attractiveness Index
10.3 Middle East & Africa Solar Tracker Market by Country, 2023, 2028 & 2033 (US$ Billion)
10.4 Middle East & Africa Solar Tracker Market Size Estimation and Forecast by Country
10.5 Middle East & Africa Solar Tracker Market Size Estimation and Forecast by Product
10.6 Middle East & Africa Solar Tracker Market Size Estimation and Forecast by Application
10.7 Saudi Arabia Solar Tracker Market Analysis
10.7.1 Spain’s PV Hardware Opens New Solar Tracker Production Facility In Jeddah With 8 GW Annual Capacity
10.8 Iran Solar Tracker Market Analysis
10.8.1 The First Solar PV Tracker Made in Iran in Industrial Scale
10.9 Israel Solar Tracker Market Analysis
10.9.1 Trina Solar Signs Israel's Largest Module and Tracker Deal
10.10 Qatar Solar Tracker Market Analysis
10.10.1 Trina to Supply 875 MW of Trackers for Qatar Solar Plants
10.11 Algeria Solar Tracker Market Analysis
10.11.1 Algeria’s Solar 1,000 MW Project Scheme To Start Producing Power by 2024
10.12 Rest of Middle East & Africa Solar Tracker Market Analysis
11 Latin America Solar Tracker Market Analysis
11.1 Key Findings
11.2 Latin America Solar Tracker Market Attractiveness Index
11.3 Latin America Solar Tracker Market by Country, 2023, 2028 & 2033 (US$ Billion)
11.4 Latin America Solar Tracker Market Size Estimation and Forecast by Country
11.5 Latin America Solar Tracker Market Size Estimation and Forecast by Product
11.6 Latin America Solar Tracker Market Size Estimation and Forecast by Application
11.7 Brazil Solar Tracker Market Analysis
11.7.1 Soltec Supplied SFOne Trackers to Two Projects of Canadian Solar
11.8 Mexico Solar Tracker Market Analysis
11.8.1 Arctech to Supply Solar Trackers to 365.8MW Project in Mexico
11.9 Colombia Solar Tracker Market Analysis
11.9.1 Colombia Kicks off Trina Solar’s First Integrated Project
11.10 Rest of Latin America Solar Tracker Market Analysis
12 Company Profiles
12.1 Nextracker Inc.
12.1.1 Company Snapshot
12.1.2 Company Overview
12.1.3 Financial Analysis
12.1.3.1 Net Revenue, 2018-2022
12.1.3.2 Gross Profit, 2018-2022
12.1.3.3 Operating Income, 2018-2022
12.1.3.4 Regional Market Shares, 2022
12.1.4 Product Benchmarking
12.1.5 Strategic Outlook
12.2 Array Technologies, Inc.
12.2.1 Company Snapshot
12.2.2 Company Overview
12.2.3 Financial Analysis
12.2.3.1 Net Revenue, 2018-2022
12.2.3.2 Gross Profit, 2018-2022
12.2.3.3 Operating Income, 2018-2022
12.2.3.4 Regional Market Shares, 2022
12.2.3.5 Segment Market Shares, 2022
12.2.4 Product Benchmarking
12.2.5 Strategic Outlook
12.3 PV Hardware
12.3.1 Company Snapshot
12.3.2 Company Overview
12.3.3 Product Benchmarking
12.3.4 Strategic Outlook
12.4 Arctech Solar Holding Co., Ltd.
12.4.1 Company Snapshot
12.4.2 Company Overview
12.4.3 Financial Analysis
12.4.3.1 Net Revenue, 2018-2022
12.4.4 Product Benchmarking
12.4.5 Strategic Outlook
12.5 Soltec Power Holdings S.A.
12.5.1 Company Snapshot
12.5.2 Company Overview
12.5.3 Financial Analysis
12.5.3.1 Net Revenue, 2018-2022
12.5.3.2 Geographic Diversification (Backlog), 2022
12.5.3.3 Geographic Diversification (Pipeline), 2022
12.5.4 Product Benchmarking
12.5.5 Strategic Outlook
12.6 Trina Solar
12.6.1 Company Snapshot
12.6.2 Company Overview
12.6.3 Product Benchmarking
12.6.4 Strategic Outlook
12.7 Valmont Industries, Inc.
12.7.1 Company Snapshot
12.7.2 Company Overview
12.7.3 Financial Analysis
12.7.3.1 Net Revenue, 2018-2022
12.7.3.2 Gross Profit, 2018-2022
12.7.3.3 Operating Income, 2018-2022
12.7.3.4 Regional Market Shares, 2022
12.7.3.5 Segment Market Shares, 2022
12.7.4 Product Benchmarking
12.7.5 Strategic Outlook
12.8 Gonvarri Solar Steel
12.8.1 Company Snapshot
12.8.2 Company Overview
12.8.3 Product Benchmarking
12.8.4 Strategic Outlook
12.9 Gamechange Solar
12.9.1 Company Snapshot
12.9.2 Company Overview
12.9.3 Product Benchmarking
12.9.4 Strategic Outlook
12.10 Ideematec
12.10.1 Company Snapshot
12.10.2 Company Overview
12.10.3 Product Benchmarking
12.10.4 Strategic Outlook
12.11 Allearth Renewables
12.11.1 Company Snapshot
12.11.2 Company Overview
12.11.3 Product Benchmarking
12.12 FTC Solar
12.12.1 Company Snapshot
12.12.2 Company Overview
12.12.3 Product Benchmarking
12.12.4 Strategic Outlook
13 Conclusion and Recommendations
13.1 Concluding Remarks from Visiongain
13.2 Recommendations for Market Players
ページTOPに戻る
List of Tables/Graphs
List of Tables
Table 1 Solar Tracker Market Snapshot, 2023 & 2033 (US$ Billion, CAGR %)
Table 2 Solar Tracker Market Forecast by Region, 2023-2033 (US$ Billion, AGR%, CAGR%): “V” Shaped Recovery
Table 3 Solar Tracker Market Forecast by Region, 2023-2033 (US$ Billion, AGR%, CAGR%): “U” Shaped Recovery
Table 4 Solar Tracker Market Forecast by Region, 2023-2033 (US$ Billion, AGR%, CAGR%): “W” Shaped Recovery
Table 5 Solar Tracker Market Forecast by Region, 2023-2033 (US$ Billion, AGR%, CAGR%): “L” Shaped Recovery
Table 6 Solar Tracker Market Forecast by Product, 2023-2033 (US$ Billion, AGR%, CAGR%)
Table 7 Single Axis Segment Market Forecast by Region, 2023-2033 (US$ Billion, AGR%, CAGR%)
Table 8 Dual Axis Segment Market Forecast by Region, 2023-2033 (US$ Billion, AGR%, CAGR%)
Table 9 Solar Tracker Market Forecast by Application, 2023-2033 (US$ Billion, AGR%, CAGR%)
Table 10 Utility Segment Market Forecast by Region, 2023-2033 (US$ Billion, AGR%, CAGR%)
Table 11 Residential Segment Market Forecast by Region, 2023-2033 (US$ Billion, AGR%, CAGR%)
Table 12 Commercial Segment Market Forecast by Region, 2023-2033 (US$ Billion, AGR%, CAGR%)
Table 13 Solar Tracker Market Forecast by Region, 2023-2033 (US$ Billion, AGR%, CAGR%)
Table 14 North America Solar Tracker Market Forecast by Country, 2023-2033 (US$ Billion, AGR%, CAGR%)
Table 15 North America Solar Tracker Market Forecast by Product, 2023-2033 (US$ Billion, AGR%, CAGR%)
Table 16 North America Solar Tracker Market Forecast by Application, 2023-2033 (US$ Billion, AGR%, CAGR%)
Table 17 U.S. Solar Tracker Market Forecast, 2023-2033 (US$ Billion, AGR%, CAGR%)
Table 18 Canada Solar Tracker Market Forecast, 2023-2033 (US$ Billion, AGR%, CAGR%)
Table 19 Europe Solar Tracker Market Forecast by Country, 2023-2033 (US$ Billion, AGR%, CAGR%)
Table 20 Europe Solar Tracker Market Forecast by Product, 2023-2033 (US$ Billion, AGR%, CAGR%)
Table 21 Europe Solar Tracker Market Forecast by Application, 2023-2033 (US$ Billion, AGR%, CAGR%)
Table 22 Russia Solar Tracker Market Forecast, 2023-2033 (US$ Billion, AGR%, CAGR%)
Table 23 Germany Solar Tracker Market Forecast, 2023-2033 (US$ Billion, AGR%, CAGR%)
Table 24 France Solar Tracker Market Forecast, 2023-2033 (US$ Billion, AGR%, CAGR%)
Table 25 Italy Solar Tracker Market Forecast, 2023-2033 (US$ Billion, AGR%, CAGR%)
Table 26 Rest of Europe Solar Tracker Market Forecast, 2023-2033 (US$ Billion, AGR%, CAGR%)
Table 27 Asia Pacific Solar Tracker Market Forecast by Country, 2023-2033 (US$ Billion, AGR%, CAGR%)
Table 28 Asia Pacific Solar Tracker Market Forecast by Product, 2023-2033 (US$ Billion, AGR%, CAGR%)
Table 29 Asia Pacific Solar Tracker Market Forecast by Application, 2023-2033 (US$ Billion, AGR%, CAGR%)
Table 30 China Solar Tracker Market Forecast, 2023-2033 (US$ Billion, AGR%, CAGR%)
Table 31 India Solar Tracker Market Forecast, 2023-2033 (US$ Billion, AGR%, CAGR%)
Table 32 Japan Solar Tracker Market Forecast, 2023-2033 (US$ Billion, AGR%, CAGR%)
Table 33 South Korea Solar Tracker Market Forecast, 2023-2033 (US$ Billion, AGR%, CAGR%)
Table 34 Australia Solar Tracker Market Forecast, 2023-2033 (US$ Billion, AGR%, CAGR%)
Table 35 Rest of Asia Pacific Solar Tracker Market Forecast, 2023-2033 (US$ Billion, AGR%, CAGR%)
Table 36 Middle East & Africa Solar Tracker Market Forecast by Country, 2023-2033 (US$ Billion, AGR%, CAGR%)
Table 37 Middle East & Africa Solar Tracker Market Forecast by Product, 2023-2033 (US$ Billion, AGR%, CAGR%)
Table 38 Middle East & Africa Solar Tracker Market Forecast by Application, 2023-2033 (US$ Billion, AGR%, CAGR%)
Table 39 Saudi Arabia Solar Tracker Market Forecast, 2023-2033 (US$ Billion, AGR%, CAGR%)
Table 40 Iran Solar Tracker Market Forecast, 2023-2033 (US$ Billion, AGR%, CAGR%)
Table 41 Israel Solar Tracker Market Forecast, 2023-2033 (US$ Billion, AGR%, CAGR%)
Table 42 Qatar Solar Tracker Market Forecast, 2023-2033 (US$ Billion, AGR%, CAGR%)
Table 43 Algeria Solar Tracker Market Forecast, 2023-2033 (US$ Billion, AGR%, CAGR%)
Table 44 Rest of Middle East & Africa Solar Tracker Market Forecast, 2023-2033 (US$ Billion, AGR%, CAGR%)
Table 45 Latin America Solar Tracker Market Forecast by Country, 2023-2033 (US$ Billion, AGR%, CAGR%)
Table 46 Latin America Solar Tracker Market Forecast by Product, 2023-2033 (US$ Billion, AGR%, CAGR%)
Table 47 Latin America Solar Tracker Market Forecast by Application, 2023-2033 (US$ Billion, AGR%, CAGR%)
Table 48 Brazil Solar Tracker Market Forecast, 2023-2033 (US$ Billion, AGR%, CAGR%)
Table 49 Mexico Solar Tracker Market Forecast, 2023-2033 (US$ Billion, AGR%, CAGR%)
Table 50 Colombia Solar Tracker Market Forecast, 2023-2033 (US$ Billion, AGR%, CAGR%)
Table 51 Rest of Latin America Solar Tracker Market Forecast, 2023-2033 (US$ Billion, AGR%, CAGR%)
Table 52 Nextracker Inc.: Key Details, (CEO, HQ, USD Million, Founded, No. of Employees, Company Type, Website, Business Segment)
Table 53 Nextracker Inc.: Product Benchmarking
Table 54 Nextracker Inc.: Strategic Outlook
Table 55 Array Technologies, Inc.: Key Details, (CEO, HQ, USD Million, Founded, No. of Employees, Company Type, Website, Business Segment)
Table 56 Array Technologies, Inc.: Product Benchmarking
Table 57 Array Technologies, Inc.: Strategic Outlook
Table 58 PV Hardware: Key Details, (CEO, HQ, USD Million, Founded, No. of Employees, Company Type, Website, Business Segment)
Table 59 PV hardware: Product Benchmarking
Table 60 PV hardware: Strategic Outlook
Table 61 Arctech Solar Holding Co., Ltd.: Key Details, (CEO, HQ, USD Million, Founded, No. of Employees, Company Type, Website, Business Segment)
Table 62 Arctech Solar Holding Co., Ltd.: Product Benchmarking
Table 63 Arctech Solar Holding Co., Ltd.: Strategic Outlook
Table 64 Soltec Power Holdings S.A.: Key Details, (CEO, HQ, USD Million, Founded, No. of Employees, Company Type, Website, Business Segment)
Table 65 Soltec Power Holdings S.A.: Product Benchmarking
Table 66 Soltec Power Holdings S.A.: Strategic Outlook
Table 67 Trina Solar: Key Details, (CEO, HQ, USD Million, Founded, No. of Employees, Company Type, Website, Business Segment)
Table 68 Trina Solar: Product Benchmarking
Table 69 Trina Solar: Strategic Outlook
Table 70 Valmont Industries, Inc.: Key Details, (CEO, HQ, USD Million, Founded, No. of Employees, Company Type, Website, Business Segment)
Table 71 Valmont Industries, Inc.: Product Benchmarking
Table 72 Valmont Industries, Inc.: Strategic Outlook
Table 73 Gonvarri Solar Steel: Key Details, (CEO, HQ, USD Million, Founded, No. of Employees, Company Type, Website, Business Segment)
Table 74 Gonvarri Solar Steel: Product Benchmarking
Table 75 Gonvarri Solar Steel: Strategic Outlook
Table 76 Gamechange Solar: Key Details, (CEO, HQ, USD Million, Founded, No. of Employees, Company Type, Website, Business Segment)
Table 77 Gamechange Solar: Product Benchmarking
Table 78 Gamechange Solar: Strategic Outlook
Table 79 Ideematec: Key Details, (CEO, HQ, USD Million, Founded, No. of Employees, Company Type, Website, Business Segment)
Table 80 Ideematec: Product Benchmarking
Table 81 Ideematec: Strategic Outlook
Table 82 Allearth Renewables: Key Details, (CEO, HQ, USD Million, Founded, No. of Employees, Company Type, Website, Business Segment)
Table 83 Allearth Renewables: Product Benchmarking
Table 84 FTC Solar: Key Details, (CEO, HQ, USD Million, Founded, No. of Employees, Company Type, Website, Business Segment)
Table 85 FTC Solar: Product Benchmarking
Table 86 FTC Solar: Strategic Outlook
List of Figures
Figure 1 Solar Tracker Market Segmentation
Figure 2 Solar Tracker Market by Product: Market Attractiveness Index
Figure 3 Solar Tracker Market by Application: Market Attractiveness Index
Figure 4 Solar Tracker Market Attractiveness Index by Region
Figure 5 Solar Tracker Market: Market Dynamics
Figure 6 Solar Tracker Market by Region, 2023-2033 (US$ Billion, AGR %): “V” Shaped Recovery
Figure 7 Solar Tracker Market by Region, 2023-2033 (US$ Billion, AGR %): “U” Shaped Recovery
Figure 8 Solar Tracker Market by Region, 2023-2033 (US$ Billion, AGR %): “W” Shaped Recovery
Figure 9 Solar Tracker Market by Region, 2023-2033 (US$ Billion, AGR %): “L” Shaped Recovery
Figure 10 Solar Tracker Market: Porter’s Five Forces Analysis
Figure 11 Solar Tracker Market by Product: Market Attractiveness Index
Figure 12 Solar Tracker Market Forecast by Product, 2023-2033 (US$ Billion, AGR %)
Figure 13 Solar Tracker Market Share Forecast by Product, 2023, 2028, 2033 (%)
Figure 14 Single Axis Segment Market Forecast by Region, 2023-2033 (US$ Billion, AGR %)
Figure 15 Single Axis Segment Market Share Forecast by Region, 2023 & 2033 (%)
Figure 16 Dual Axis Segment Market Forecast by Region, 2023-2033 (US$ Billion, AGR %)
Figure 17 Dual Axis Segment Market Share Forecast by Region, 2023 & 2033 (%)
Figure 18 Solar Tracker Market by Application: Market Attractiveness Index
Figure 19 Solar Tracker Market Forecast by Application, 2023-2033 (US$ Billion, AGR %)
Figure 20 Solar Tracker Market Share Forecast by Application, 2023, 2028, 2033 (%)
Figure 21 Utility Segment Market Forecast by Region, 2023-2033 (US$ Billion, AGR %)
Figure 22 Utility Segment Market Share Forecast by Region, 2023 & 2033 (%)
Figure 23 Residential Segment Market Forecast by Region, 2023-2033 (US$ Billion, AGR %)
Figure 24 Residential Segment Market Share Forecast by Region, 2023 & 2033 (%)
Figure 25 Commercial Segment Market Forecast by Region, 2023-2033 (US$ Billion, AGR %)
Figure 26 Commercial Segment Market Share Forecast by Region, 2023 & 2033 (%)
Figure 27 Solar Tracker Market Forecast by Region 2023 and 2033 (USD Million, CAGR%)
Figure 28 Solar Tracker Market Share Forecast by Region 2023, 2028, 2033 (%)
Figure 29 Solar Tracker Market by Region, 2023-2033 (US$ Billion, AGR %)
Figure 30 North America Solar Tracker Market Attractiveness Index
Figure 31 North America Solar Tracker Market by Region, 2023, 2028 & 2033 (US$ Billion)
Figure 32 North America Solar Tracker Market Forecast by Country, 2023-2033 (US$ Billion, AGR %)
Figure 33 North America Solar Tracker Market Share Forecast by Country, 2023 & 2033 (%)
Figure 34 North America Solar Tracker Market Forecast by Product, 2023-2033 (US$ Billion, AGR %)
Figure 35 North America Solar Tracker Market Share Forecast by Product, 2023 & 2033 (%)
Figure 36 North America Solar Tracker Market Forecast by Application, 2023-2033 (US$ Billion, AGR %)
Figure 37 North America Solar Tracker Market Share Forecast by Application, 2023 & 2033 (%)
Figure 38 U.S. Solar Tracker Market Forecast, 2023-2033 (US$ Billion, AGR %)
Figure 39 Canada Solar Tracker Market Forecast, 2023-2033 (US$ Billion, AGR %)
Figure 40 Europe Solar Tracker Market Attractiveness Index
Figure 41 Europe Solar Tracker Market by Region, 2023, 2028 & 2033 (US$ Billion)
Figure 42 Europe Solar Tracker Market Forecast by Country, 2023-2033 (US$ Billion, AGR %)
Figure 43 Europe Solar Tracker Market Share Forecast by Country, 2023 & 2033 (%)
Figure 44 Europe Solar Tracker Market Forecast by Product, 2023-2033 (US$ Billion, AGR %)
Figure 45 Europe Solar Tracker Market Share Forecast by Product, 2023 & 2033 (%)
Figure 46 Europe Solar Tracker Market Forecast by Application, 2023-2033 (US$ Billion, AGR %)
Figure 47 Europe Solar Tracker Market Share Forecast by Application, 2023 & 2033 (%)
Figure 48 Russia Solar Tracker Market Forecast, 2023-2033 (US$ Billion, AGR %)
Figure 49 Germany Solar Tracker Market Forecast, 2023-2033 (US$ Billion, AGR %)
Figure 50 France Solar Tracker Market Forecast, 2023-2033 (US$ Billion, AGR %)
Figure 51 Italy Solar Tracker Market Forecast, 2023-2033 (US$ Billion, AGR %)
Figure 52 Rest of Europe Solar Tracker Market Forecast, 2023-2033 (US$ Billion, AGR %)
Figure 53 Asia Pacific Solar Tracker Market Attractiveness Index
Figure 54 Asia Pacific Solar Tracker Market by Region, 2023, 2028 & 2033 (US$ Billion)
Figure 55 Asia Pacific Solar Tracker Market Forecast by Country, 2023-2033 (US$ Billion, AGR %)
Figure 56 Asia Pacific Solar Tracker Market Share Forecast by Country, 2023 & 2033 (%)
Figure 57 Asia Pacific Solar Tracker Market Forecast by Product, 2023-2033 (US$ Billion, AGR %)
Figure 58 Asia Pacific Solar Tracker Market Share Forecast by Product, 2023 & 2033 (%)
Figure 59 Asia Pacific Solar Tracker Market Forecast by Application, 2023-2033 (US$ Billion, AGR %)
Figure 60 Asia Pacific Solar Tracker Market Share Forecast by Application, 2023 & 2033 (%)
Figure 61 China Solar Tracker Market Forecast, 2023-2033 (US$ Billion, AGR %)
Figure 62 India Solar Tracker Market Forecast, 2023-2033 (US$ Billion, AGR %)
Figure 63 Japan Solar Tracker Market Forecast, 2023-2033 (US$ Billion, AGR %)
Figure 64 South Korea Solar Tracker Market Forecast, 2023-2033 (US$ Billion, AGR %)
Figure 65 Australia Solar Tracker Market Forecast, 2023-2033 (US$ Billion, AGR %)
Figure 66 Rest of Asia Pacific Solar Tracker Market Forecast, 2023-2033 (US$ Billion, AGR %)
Figure 67 Middle East & Africa Solar Tracker Market Attractiveness Index
Figure 68 Middle East & Africa Solar Tracker Market by Region, 2023, 2028 & 2033 (US$ Billion)
Figure 69 Middle East & Africa Solar Tracker Market Forecast by Country, 2023-2033 (US$ Billion, AGR %)
Figure 70 Middle East & Africa Solar Tracker Market Share Forecast by Country, 2023 & 2033 (%)
Figure 71 Middle East & Africa Solar Tracker Market Forecast by Product, 2023-2033 (US$ Billion, AGR %)
Figure 72 Middle East & Africa Solar Tracker Market Share Forecast by Product, 2023 & 2033 (%)
Figure 73 Middle East & Africa Solar Tracker Market Forecast by Application, 2023-2033 (US$ Billion, AGR %)
Figure 74 Middle East & Africa Solar Tracker Market Share Forecast by Application, 2023 & 2033 (%)
Figure 75 Saudi Arabia Solar Tracker Market Forecast, 2023-2033 (US$ Billion, AGR %)
Figure 76 Iran Solar Tracker Market Forecast, 2023-2033 (US$ Billion, AGR %)
Figure 77 Israel Solar Tracker Market Forecast, 2023-2033 (US$ Billion, AGR %)
Figure 78 Qatar Solar Tracker Market Forecast, 2023-2033 (US$ Billion, AGR %)
Figure 79 Algeria Solar Tracker Market Forecast, 2023-2033 (US$ Billion, AGR %)
Figure 80 Rest of Middle East & Africa Solar Tracker Market Forecast, 2023-2033 (US$ Billion, AGR %)
Figure 81 Latin America Solar Tracker Market Attractiveness Index
Figure 82 Latin America Solar Tracker Market by Region, 2023, 2028 & 2033 (US$ Billion)
Figure 83 Latin America Solar Tracker Market Forecast by Country, 2023-2033 (US$ Billion, AGR %)
Figure 84 Latin America Solar Tracker Market Share Forecast by Country, 2023 & 2033 (%)
Figure 85 Latin America Solar Tracker Market Forecast by Product, 2023-2033 (US$ Billion, AGR %)
Figure 86 Latin America Solar Tracker Market Share Forecast by Product, 2023 & 2033 (%)
Figure 87 Latin America Solar Tracker Market Forecast by Application, 2023-2033 (US$ Billion, AGR %)
Figure 88 Latin America Solar Tracker Market Share Forecast by Application, 2023 & 2033 (%)
Figure 89 Brazil Solar Tracker Market Forecast, 2023-2033 (US$ Billion, AGR %)
Figure 90 Mexico Solar Tracker Market Forecast, 2023-2033 (US$ Billion, AGR %)
Figure 91 Colombia Solar Tracker Market Forecast, 2023-2033 (US$ Billion, AGR %)
Figure 92 Rest of Latin America Solar Tracker Market Forecast, 2023-2033 (US$ Billion, AGR %)
Figure 93 Nextracker Inc.: Net Revenue, 2018-2022 (US$ Million, AGR%)
Figure 94 Nextracker Inc.: Gross Profit, 2018-2022 (US$ Million, AGR%)
Figure 95 Nextracker Inc.: Operating Income, 2018-2022 (US$ Million, AGR%)
Figure 96 Nextracker Inc.: Regional Market Shares, 2022
Figure 97 Array Technologies, Inc.: Net Revenue, 2018-2022 (US$ Million, AGR%)
Figure 98 Array Technologies, Inc.: Gross Profit, 2018-2022 (US$ Million, AGR%)
Figure 99 Array Technologies, Inc.: Operating Income, 2018-2022 (US$ Million, AGR%)
Figure 100 Array Technologies, Inc.: Regional Market Shares, 2022
Figure 101 Array Technologies, Inc.: Segment Market Shares, 2022
Figure 102 Arctech Solar Holding Co., Ltd.: Net Revenue, 2018-2022 (US$ Million, AGR%)
Figure 103 Soltec: Net Revenue, 2018-2022 (US$ Million, AGR%)
Figure 104 Soltec: Geographic Diversification (Backlog), 2022
Figure 105 Soltec: Geographic Diversification (Pipeline), 2022
Figure 106 Valmont Industries, Inc.: Net Revenue, 2018-2022 (US$ Million, AGR%)
Figure 107 Valmont Industries, Inc.: Gross Profit, 2018-2022 (US$ Million, AGR%)
Figure 108 Valmont Industries, Inc.: Operating Income, 2018-2022 (US$ Million, AGR%)
Figure 109 Valmont Industries, Inc.: Regional Market Shares, 2022
Figure 110 Valmont Industries, Inc.: Segment Market Shares, 2022
ページTOPに戻る
Visiongain社のエネルギーと資源分野での最新刊レポート
本レポートと同じKEY WORD(solar)の最新刊レポート
よくあるご質問
Visiongain社はどのような調査会社ですか?
英国の調査会社ヴィジョンゲイン社(Visiongain)は、通信とエネルギーのほか、自動車や化学・医薬品、金属など、広範な市場を対象に調査を行っています。自動車市場については、市場全般に関する調査のほ... もっと見る
調査レポートの納品までの日数はどの程度ですか?
在庫のあるものは速納となりますが、平均的には 3-4日と見て下さい。
但し、一部の調査レポートでは、発注を受けた段階で内容更新をして納品をする場合もあります。
発注をする前のお問合せをお願いします。
注文の手続きはどのようになっていますか?
1)お客様からの御問い合わせをいただきます。
2)見積書やサンプルの提示をいたします。
3)お客様指定、もしくは弊社の発注書をメール添付にて発送してください。
4)データリソース社からレポート発行元の調査会社へ納品手配します。
5) 調査会社からお客様へ納品されます。最近は、pdfにてのメール納品が大半です。
お支払方法の方法はどのようになっていますか?
納品と同時にデータリソース社よりお客様へ請求書(必要に応じて納品書も)を発送いたします。
お客様よりデータリソース社へ(通常は円払い)の御振り込みをお願いします。
請求書は、納品日の日付で発行しますので、翌月最終営業日までの当社指定口座への振込みをお願いします。振込み手数料は御社負担にてお願いします。
お客様の御支払い条件が60日以上の場合は御相談ください。
尚、初めてのお取引先や個人の場合、前払いをお願いすることもあります。ご了承のほど、お願いします。
データリソース社はどのような会社ですか?
当社は、世界各国の主要調査会社・レポート出版社と提携し、世界各国の市場調査レポートや技術動向レポートなどを日本国内の企業・公官庁及び教育研究機関に提供しております。
世界各国の「市場・技術・法規制などの」実情を調査・収集される時には、データリソース社にご相談ください。
お客様の御要望にあったデータや情報を抽出する為のレポート紹介や調査のアドバイスも致します。
|
|

