臨床試験支援サービス市場レポート:2023-2033
Clinical Trials Support Services Market Report 2023-2033
レポート詳細
臨床試験支援サービス市場レポート 2023-2033年 :本レポートは、業界とその基礎となる原動力をより良く理解することを望むなら、新たな収益ポケットを目指す大手企業にとって貴重なも... もっと見る
※上記価格は部署ライセンス(Departmental licence)価格です。
その他の価格についてはデータリソースまでお問合せください。
日本語のページは自動翻訳を利用し作成しています。
実際のレポートは英文のみでご納品いたします。
サマリー
レポート詳細
臨床試験支援サービス市場レポート 2023-2033年:本レポートは、業界とその基礎となる原動力をより良く理解することを望むなら、新たな収益ポケットを目指す大手企業にとって貴重なものとなるでしょう。異業種への進出や新規地域での既存事業の拡大を目指す企業にも有用です。
R&D、臨床試験アウトソーシング、グローバル化などが業界の成長を促進する
臨床試験支援サービス市場は、製薬およびバイオテクノロジー研究の状況を形成するいくつかの極めて重要な要因によって、ここ数年で大幅な成長を遂げている。その中でも、革新的かつ専門的な治療に対する需要の高まりは、臨床試験活動の大幅な増加をもたらしている。製薬企業がアンメット・メディカル・ニーズに対応する最先端の治療法の開発に努める中、包括的な臨床試験支援サービスのニーズが大幅に高まっている。
さらに、慢性疾患の増加や高齢化により、より広範で多様な臨床試験が必要とされている。がん、心血管疾患、神経疾患などの疾患が顕著に増加しており、潜在的な治療法の安全性と有効性を評価するため、より大規模で複雑な臨床試験が求められている。その結果、製薬会社やバイオテクノロジー企業は、こうした複雑な臨床試験をより効果的に進めるため、専門の臨床試験支援サービス・プロバイダーの支援を得るようになっている。
さらに、規制基準の遵守とデータ品質の確保への注目が高まるにつれ、臨床試験領域における専門的な専門知識と技術的進歩に対する需要が高まっている。世界の規制当局は臨床試験データに対する監視を強化しており、企業は最高の品質基準を維持することが極めて重要となっている。その結果、電子データ収集(EDC)や臨床試験管理システム(CTMS)などの先進技術やデータ管理ソリューションの採用が、データの正確性、安全性、規制遵守を保証する上で極めて重要になっている。
これらの要因が相まって、臨床試験支援サービス市場の顕著な成長が促進されている。医療情勢が進化と進歩を続ける中、専門的かつ包括的な臨床試験サービスに対する需要はさらに増加し、この分野で事業を展開する企業に新たな展望と課題を提供すると予測される。
エラー、漏れ、バリデーションのギャップなど、データの品質と管理の問題が患者の安全性と臨床試験の効率性を脅かす
近年、臨床試験支援サービス市場は、医薬品開発プロセスを合理化・迅速化するためのアウトソーシング・ソリューションに対する需要の高まりを背景に、著しい成長を遂げている。とはいえ、この業界はいくつかの課題に直面しており、その中でも大きな障害となっているのがデータの管理と品質に関するものである。データの正確性と信頼性は臨床試験において極めて重要な役割を果たし、十分な情報に基づいた意思決定と正確な結果・結論を保証する基盤を形成する。
データ収集中のエラー、不完全または欠落したデータ、不十分な検証プロセス、データ入力の不一致など、様々な要因がデータの質の問題を引き起こす。これらの要因は試験全体の完全性を損ない、誤った結論を導き、さらに重要なこととして、患者の安全を脅かす可能性がある。さらに、不十分なデータ管理は、プロジェクトのタイムラインの遅延やコストの上昇につながり、臨床試験プロセス全体の効率に悪影響を及ぼす可能性がある。
さらに、データ管理に関する懸念には、データ・セキュリティの必要性と、患者情報の機密性を保持し、プライバシー規制を遵守する保証が含まれる。データ保護対策が不十分な場合、機密情報が不正アクセスにさらされ、情報漏洩や法的な影響を受ける可能性がある。
市場調査レポートを購入する前にすべき質問とは?
- 臨床試験支援サービス市場はどのように進化しているのか?
- 臨床試験支援サービス市場の推進要因と阻害要因は何か?
- 各臨床試験支援サービス市場セグメントは予測期間中にどのように成長し、2033年にこれらのサブマーケットがどの程度の収益を占めるようになるのか?
- 2023年から2033年にかけて、臨床試験支援サービス市場の各サブマーケットの市場シェアはどのように推移するのか?
- 2023年から2033年にかけて市場全体を牽引する主な要因は何か?
- 主要な臨床試験支援サービス市場はマクロ経済の動きに大枠で追随するのか、それとも個々の国内市場が他を凌駕するのか?
- 2033年までに各国市場のシェアはどのように変化し、2033年に市場をリードするのはどの地域か?
- 主要プレーヤーは誰で、予測期間中の見通しは?
- 2023年から2033年にかけて、業界はどのように進化していくのか?現在および今後10年間に実施される臨床試験支援サービスプロジェクトにはどのような意味があるのか?
- 臨床試験支援サービス市場をさらに拡大するために、製品の商業化の必要性は高まっているか?
- 臨床試験支援サービス市場はどこへ向かい、どのようにすれば市場の最前線に立てるのか?
- 新製品やサービスラインに対する最適な投資オプションは何か?
- 企業を新たな成長軌道に乗せ、C-suiteに移行させるための重要な展望とは?
臨床試験支援サービス市場が現在、そして今後10年間でどのような影響を受けるかを見極める必要がある:
・ Our 262-page report provides 99 tables, 132 charts/graphs exclusively to you.
・についてreport highlights key lucrative areas in the industry so you can target them ? NOW.
・ It contains in-depth analysis of global, regional and national sales and growth.
・ It highlights for you the key successful trends, changes and revenue projections made by your competitors.
本レポートでは、臨床試験支援サービス市場が今後10年間、COVID-19の景気後退と好転の変動に合わせてどのように発展するかをTODAYでお伝えします。この市場は過去10年間のどの時点よりも今が重要である。
2033年までの予測やその他の分析から、商業的な展望が明らかになる
- 262ページにわたる本レポートでは、99の表、132の図表を掲載しています。
- 本レポートは、業界における主要な有利分野にハイライトを当てているため、今すぐターゲットを絞ることができます。
- 世界、地域、国の売上と成長に関する詳細な分析が含まれています。
- 競合他社が成功した主なトレンド、変化、収益予測をハイライトしています。
本レポートは、臨床試験支援サービス市場が今後10年間でどのように発展するか、またCOVID-19の景気後退と好転の変動に合わせてどのように発展するかをお伝えします。この市場は過去10年間のどの時点よりも今が重要である。
サービス別
- 治験施設管理
- 患者募集管理
- データ管理および電子データ収集(EDC)サービス
- IRB(治験審査委員会)
- その他
フェーズ別
- フェーズI
- フェーズII
- フェーズ III
- フェーズ IV
スポンサー別
- 製薬会社
- 医療機器メーカー
- その他
世界市場全体とセグメント別の収益予測に加え、4つの地域と20の主要国市場の収益予測も掲載しています:
北米
- アメリカ
- カナダ
欧州
- ドイツ
- スペイン
- 英国
- フランス
- イタリア
- その他の欧州
アジア太平洋
- 中国
- 日本
- インド
- オーストラリア
- 韓国
- その他のアジア太平洋地域
ラテンアメリカ
- ブラジル
- メキシコ
- その他のラテンアメリカ
MEA
- GCC諸国
- 南アフリカ
- その他のMEA
また、本レポートでは、臨床試験支援サービス市場の主要企業のプロファイルと2023年から2033年までの市場推移を、これらの企業のこのセグメントに焦点を当てて掲載しています。
主要企業と市場成長の可能性
・ Caidya
・ Calyx
・ Eurofins Scientific
・ ICON plc
・ IQVIA Inc.
・ Laboratory Corporation of America
・ Merative
・ Parexel International Corporation
・ Thermo Fisher Scientific Inc.
・ WuXi AppTec
2023年から2033年にかけての臨床試験支援サービス市場全体の世界売上高(金額ベース)は、2023年に210億米ドルを突破すると弊社では予測しています。2033年まで力強い収益成長を予測。本調査では、最も大きな可能性を秘めた企業を特定します。各組織の能力、進捗状況、商業的展望を明らかにし、お客様が一歩先を行くための一助とします。
臨床試験支援サービス市場、2023-2033年レポートはどのようにお役に立ちますか?
要約すると、260ページを超えるこのレポートは、以下の知識を提供する:
- 臨床試験支援サービス市場の2023年から2033年までの収益予測(サービス、フェーズ、スポンサーの各予測を世界および地域レベルで掲載) - 業界の将来性を発見し、投資と収益に最も有利な場所を見つけることができます。
- 4つの地域と20の主要国市場の2033年までの収益予測 - 臨床試験支援サービス市場、2023年から2033年までの北米、ヨーロッパ、アジア太平洋、ラテンアメリカ、MEAの市場予測をご覧ください。また、米国、カナダ、メキシコ、ブラジル、ドイツ、フランス、英国、イタリア、中国、インド、日本、オーストラリアなど著名な経済圏の市場も予測しています。
- 既存企業および市場参入を目指す企業の展望 - 臨床試験支援サービス市場に関わる主要企業10社の企業プロファイルを含む、2023年から2033年までの市場展望。
独自の予測による定量的・定性的分析をご覧ください。私たちのレポートだけに含まれる情報を入手し、貴重なビジネスインテリジェンスで情報を得ることができます。
他にはない情報
私たちの新しいレポートがあれば、知識に遅れをとったり、チャンスを逃したりする可能性が低くなります。弊社のレポートが貴社の調査、分析、意思決定にどのように役立つかをご覧ください。Visiongainの調査は、臨床試験支援サービス市場、2023年から2033年、市場をリードする企業の商業分析を必要とするすべての人のためのものです。データ、トレンド、予測をご覧いただけます。
ページTOPに戻る
目次
目次
1 レポート概要
1.1 研究の目的
1.2 臨床試験支援サービス市場の紹介
1.3 本レポートの内容
1.4 本レポートを読むべき理由
1.5 本分析レポートが回答する主な質問
1.6 本レポートの対象者
1.7 方法論
1.7.1 市場の定義
1.7.2 市場評価・予測手法
1.7.3 データの検証
1.7.3.1 一次調査
1.7.3.2 セカンダリーリサーチ
1.8 よくある質問(FAQ)
1.9 Visiongainの関連レポート
1.10 Visiongainについて
2 エグゼクティブ・サマリー
3 市場概要
3.1 主要な調査結果
3.2 市場ダイナミクス
3.2.1 市場促進要因
3.2.1.1 研究開発活動の増加と臨床試験活動の増加
3.2.1.2 治験業務のアウトソーシングが業界の成長を牽引
3.2.1.3 治験のグローバル化が業界の成長を後押しする
3.2.2 市場抑制要因
3.2.2.1 厳しい規制と複雑なコンプライアンスが業界の成長を妨げる可能性が高い
3.2.2.2 データの信頼性を低下させるデータの質と管理の問題
3.2.2.3 多様な患者集団における患者の採用と維持
3.2.3 市場機会
3.2.3.1 患者中心のアプローチと技術の進歩が有利な成長展望をもたらすと予測される
3.2.3.2 プレシジョン・メディシンとバイオマーカー主導型臨床試験
3.2.3.3 遠隔モニタリング、遠隔医療ソリューション、デジタル患者関与プラットフォームを提供する仮想および分散型試験
3.3 COVID-19インパクト分析
3.4 ポーターのファイブフォース分析
3.4.1 サプライヤーの交渉力
3.4.2 買い手の交渉力
3.4.3 競争相手のライバル関係
3.4.4 代替品による脅威
3.4.5 新規参入企業の脅威
3.5 PEST分析
3.5.1 政治
3.5.2 経済
3.5.3 社会
3.5.4 技術
4 臨床試験支援サービス市場分析:サービス別
4.1 主要な調査結果
4.2 サービスセグメント 市場魅力度指数
4.3 サービス別臨床試験支援サービス市場規模の推定と予測
4.4 治験施設管理
4.4.1 2023〜2033年の地域別市場規模(US$ Billion)
4.4.2 地域別市場シェア、2023年・2033年(%)
4.5 患者募集管理
4.5.1 2023〜2033年の地域別市場規模(US$ Billion)
4.5.2 地域別市場シェア、2023年・2033年(%)
4.5.3 臨床試験支援サービスにおける患者募集管理市場
4.6 データマネジメントおよび電子データ収集(EDC)サービス
4.6.1 2023〜2033年の地域別市場規模(US$ Billion)
4.6.2 地域別市場シェア、2023年・2033年(%)
4.7 IRB(インスティテューショナル・レビュー・ボード)
4.7.1 2023〜2033年の地域別市場規模(US$ Billion)
4.7.2 地域別市場シェア、2023年・2033年(%)
4.8 その他
4.8.1 2023〜2033年の地域別市場規模(US$ Billion)
4.8.2 地域別市場シェア、2023年・2033年(%)
5 臨床試験支援サービス市場分析:フェーズ別
5.1 主要調査結果
5.2 フェーズセグメント 市場魅力度指数
5.3 臨床試験支援サービスのフェーズ別市場規模推定と予測
5.4 フェーズI
5.4.1 2023〜2033年の地域別市場規模(US$ Billion)
5.4.2 地域別市場シェア、2023年・2033年(%)
5.5 フェーズII
5.5.1 2023〜2033年の地域別市場規模(US$ Billion)
5.5.2 地域別市場シェア、2023年・2033年(%)
5.6 フェーズ III
5.6.1 2023〜2033年の地域別市場規模(US$ Billion)
5.6.2 地域別市場シェア、2023年・2033年(%)
5.7 フェーズⅣ
5.7.2 2023〜2033年の地域別市場規模(US$ Billion)
5.7.3 地域別市場シェア、2023年・2033年(%)
6 臨床試験支援サービス市場分析:スポンサー別
6.1 主な調査結果
6.2 スポンサーセグメント 市場魅力度指数
6.3 臨床試験支援サービスのスポンサー別市場規模推定と予測
6.4 製薬・バイオ医薬品企業
6.4.1 2023〜2033年の地域別市場規模(US$ Billion)
6.4.2 地域別市場シェア、2023年・2033年(%)
6.5 医療機器メーカー
6.5.2 2023〜2033年の地域別市場規模(US$ Billion)
6.5.3 地域別市場シェア、2023年・2033年(%)
6.6 その他
6.6.1 2023〜2033年の地域別市場規模(US$ Billion)
6.6.2 地域別市場シェア、2023年・2033年(%)
7 臨床試験支援サービス市場分析:地域別
7.1 主要な調査結果
7.3 地域別市場規模の推定と予測
8 北米の臨床試験支援サービス市場分析
8.1 主要な調査結果
8.2 北米の臨床試験支援サービス市場魅力度指数
8.3 北米の臨床試験支援サービス国別市場、2023年、2028年、2033年(US$ Billion)
8.4 北米の臨床試験支援サービス市場規模推定と予測:国別
8.5 北米の臨床試験支援サービス市場規模推定と予測:サービス別
8.5.1 北米の臨床試験支援サービスにおける患者募集管理サービス市場規模推定と予測:サービス別
8.6 北米の臨床試験支援サービス市場規模推移推定と予測:フェーズ別
8.7 北米の臨床試験支援サービス市場規模推定と予測:スポンサー別
8.8 米国臨床試験支援サービス市場分析
8.9 カナダ臨床試験支援サービス市場分析
9 欧州の臨床試験支援サービス市場分析
9.1 主要な調査結果
9.2 欧州の臨床試験支援サービス市場魅力度指数
9.3 欧州の臨床試験支援サービス国別市場、2023年、2028年、2033年(US$ Billion)
9.4 欧州の臨床試験支援サービス市場規模推定と予測:国別
9.5 欧州の臨床試験支援サービス市場規模推定と予測:サービス別
9.5.1 欧州の臨床試験支援サービスにおける患者募集管理サービス市場規模推定と予測:サービス別
9.6 欧州の臨床試験支援サービス市場規模推定と予測:フェーズ別
9.7 欧州の臨床試験支援サービス市場規模推定と予測:スポンサー別
9.8 ドイツの臨床試験支援サービス市場分析
9.9 フランスの臨床試験支援サービス市場分析
9.10 イギリスの臨床試験支援サービス市場分析
9.11 イタリアの臨床試験支援サービス市場分析
9.12 スペインの臨床試験支援サービス市場分析
9.13 その他の欧州の臨床試験支援サービス市場分析
10 アジア太平洋地域の臨床試験支援サービス市場分析
10.1 主要な調査結果
10.2 アジア太平洋地域の臨床試験支援サービス市場魅力度指数
10.3 アジア太平洋地域の臨床試験支援サービス国別市場、2023年、2028年、2033年(US$ Billion)
10.4 アジア太平洋地域の臨床試験支援サービス市場規模推定と予測:国別
10.5 アジア太平洋地域の臨床試験支援サービス市場規模推定と予測:サービス別
10.5.1 アジア太平洋地域の臨床試験支援サービスにおける患者募集管理サービス市場規模推定と予測:サービス別
10.6 アジア太平洋地域の臨床試験支援サービス市場規模推定と予測:フェーズ別
10.7 アジア太平洋地域の臨床試験支援サービス市場規模推定と予測:スポンサー別
10.8 中国の臨床試験支援サービス市場分析
10.9 日本の臨床試験支援サービス市場分析
10.10 インドの臨床試験支援サービス市場分析
10.11 オーストラリアの臨床試験支援サービス市場分析
10.12 韓国の臨床試験支援サービス市場の分析
10.13 その他のアジア太平洋地域の臨床試験支援サービス市場分析
11 ラテンアメリカ臨床試験支援サービス市場分析
11.1 主要な調査結果
11.2 ラテンアメリカの臨床試験支援サービス市場魅力度指数
11.3 ラテンアメリカの臨床試験支援サービス国別市場、2023年、2028年、2033年(US$ Billion)
11.4 ラテンアメリカの臨床試験支援サービス市場規模推定と予測:国別
11.5 ラテンアメリカの臨床試験支援サービス市場規模推定と予測:サービス別
11.5.1 ラテンアメリカの臨床試験支援サービスにおける患者募集管理サービス市場規模推定と予測:サービス別
11.6 ラテンアメリカの臨床試験支援サービス市場規模推移推定と予測:フェーズ別
11.7 ラテンアメリカの臨床試験支援サービス市場規模推定と予測:スポンサー別
11.8 ブラジルの臨床試験支援サービス市場分析
11.9 メキシコの臨床試験支援サービス市場分析
11.10 その他のラテンアメリカ臨床試験支援サービス市場の分析
12 MEA臨床試験支援サービスの市場分析
12.1 主要な調査結果
12.2 MEAの臨床試験支援サービス市場魅力度指数
12.3 MEAの臨床試験支援サービス市場の国別市場規模、2023年、2028年、2033年(US$ Billion)
12.4 MEAの臨床試験支援サービス市場規模推定と予測:国別
12.5 MEAの臨床試験支援サービス市場規模推定と予測:サービス別
12.5.1 MEAの臨床試験支援サービスにおける患者募集管理サービス市場規模推定と予測:サービス別
12.6 MEAの臨床試験支援サービス市場規模推移推定と予測:フェーズ別
12.7 MEAの臨床試験支援サービス市場規模推移推定と予測:スポンサー別
12.8 GCCの臨床試験支援サービス市場分析
12.9 南アフリカの臨床試験支援サービス市場分析
12.10 その他のMEA治験支援サービス市場の分析
13 企業のプロフィール
13.1 競争環境、2022年
13.2 戦略的展望
13.3 Thermo Fisher Scientific Inc.
13.3.1 会社概要
13.3.2 会社概要
13.3.3 財務分析
13.3.3.1 純収入、2018-2022年
13.3.3.2 地域市場シェア、2022年
13.3.4 提供サービス
13.3.5 戦略的展望
13.4 Eurofins Scientific
13.4.1 会社概要
13.4.2 会社概要
13.4.3 財務分析
13.4.3.1 純収入、2018-2022年
13.4.3.2 地域市場シェア、2022年
13.4.4 提供サービス
13.4.5 戦略的展望
13.5 IQVIA Inc.
13.5.1 会社概要
13.5.2 会社概要
13.5.3 財務分析
13.5.3.1 売上高、2018-2022年
13.5.3.2 地域市場シェア、2022年
13.5.3.3 研究開発費、2018年~2022年
13.5.4 提供サービス
13.5.5 戦略的展望
13.6 WuXi AppTec
13.6.1 会社概要
13.6.2 会社概要
13.6.3 財務分析
13.6.3.1 売上高、2019-2022年
13.6.3.2 地域市場シェア、2022年
13.6.4 提供サービス
13.6.5 戦略的展望
13.7 Parexel International Corporation
13.7.1 会社概要
13.7.2 会社概要
13.7.3 提供サービス
13.7.4 戦略的展望
13.8 Merative
13.8.1 会社概要
13.8.2 会社概要
13.8.3 提供サービス
13.8.4 戦略的展望
13.9 Calyx
13.9.1 会社概要
13.9.2 会社概要
13.9.3 提供サービス
13.9.4 戦略的展望
13.10 Caidya
13.10.1 会社概要
13.10.2 会社概要
13.10.3 提供サービス
13.10.4 戦略的展望
13.11 Laboratory Corporation of America
13.11.1 会社概要
13.11.2 会社概要
13.11.3 財務分析
13.11.3.1 売上高、2018-2022年
13.11.3.2 地域市場シェア、2022年
13.11.4 提供サービス
13.11.5 戦略的展望
13.12 ICON plc
13.12.1 会社概要
13.12.2 会社概要
13.12.3 財務分析
13.12.3.1 売上高、2018年~2022年
13.12.3.2 地域市場シェア、2022年
13.12.4 提供サービス
13.12.5 戦略的展望
14 結論と提言
14.1 Visiongainからの結びの言葉
14.2 市場プレイヤーへの提言
ページTOPに戻る
図表リスト
表の一覧
Table 1 Clinical Trials Support Services Market Snapshot, 2023 & 2033 (US$ billion, CAGR %)
Table 2 Total Clinical Trials by Phase of Development
Table 3 Clinical Trials Support Services Market Forecast by Region 2023-2033 (US$ Bn, AGR%, CAGR%): "V" Shaped Recovery
Table 4 Clinical Trials Support Services Market Forecast by Region 2023-2033 (US$ Bn, AGR%, CAGR%): "U" Shaped Recovery
Table 5 Clinical Trials Support Services Market Forecast by Region 2023-2033 (US$ Bn, AGR%, CAGR%): "W" Shaped Recovery
Table 6 Clinical Trials Support Services Market Forecast by Region 2023-2033 (US$ Bn, AGR%, CAGR%): "L" Shaped Recovery
Table 7 Global Clinical Trials Support Services Market Forecast by Services, 2023-2033 (US$ Billion, AGR%, CAGR%)
Table 8 Clinical Trial Site Management Segment Market Forecast by Region, 2023-2033 (US$ Billion, AGR%, CAGR%)
Table 9 Patient Recruitment Management Segment Market Forecast by Region, 2023-2033 (US$ Billion, AGR%, CAGR%)
Table 10 Patient Recruitment Management in Clinical Trials Support Services Market Forecast by Services, 2023-2033 (US$ Billion, AGR%, CAGR%)
Table 11 Data Management and Electronic Data Capture (EDC) Segment Market Forecast by Region, 2023-2033 (US$ Billion, AGR%, CAGR%)
Table 12 IRB (Institutional Review Boards) Segment Market Forecast by Region, 2023-2033
(US$ Billion, AGR%, CAGR%)
Table 13 Others Segment Market Forecast by Region, 2023-2033 (US$ Billion, AGR%, CAGR%)
Table 14 Global Clinical Trials Support Services Market Forecast by Phase, 2023-2033 (US$ Billion, AGR%, CAGR%)
Table 15 Phase I Segment Market Forecast by Region, 2023-2033 (US$ Billion, AGR%, CAGR%)
Table 16 Phase II Segment Market Forecast by Region, 2023-2033 (US$ Billion, AGR%, CAGR%)
Table 17 Phase III Segment Market Forecast by Region, 2023-2033 (US$ Billion, AGR%, CAGR%)
Table 18 Phase IV Segment Market Forecast by Region, 2023-2033 (US$ Billion, AGR%, CAGR%)
Table 19 Global Clinical Trials Support Services Market Forecast by Sponsor, 2023-2033 (US$ Billion, AGR%, CAGR%)
Table 20 Pharmaceutical & Biopharmaceutical Companies Segment Market Forecast by Region, 2023-2033 (US$ Billion, AGR%, CAGR%)
Table 21 Medical Device Manufacturers Segment Market Forecast by Region, 2023-2033 (US$ Billion, AGR%, CAGR%)
Table 22 Others Segment Market Forecast by Region, 2023-2033 (US$ Billion, AGR%, CAGR%)
Table 23 Global Clinical Trials Support Services Market Forecast by Region 2023-2033 (US$ Billion, AGR%, CAGR%)
Table 24 North America Clinical Trials Support Services Market Forecast by Country, 2023-2033 (US$ Billion, AGR%, CAGR%)
Table 25 North America Clinical Trials Support Services Market Forecast by Services, 2023-2033 (US$ Billion, AGR%, CAGR%)
Table 26 North America Patient Recruitment Management in Clinical Trials Support Services Market Forecast by Services, 2023-2033 (US$ Billion, AGR%, CAGR%)
Table 27 North America Clinical Trials Support Services Market Forecast by Phase, 2023-2033 (US$ Billion, AGR%, CAGR%)
Table 28 North America Clinical Trials Support Services Market Forecast by Sponsor, 2023-2033 (US$ Billion, AGR%, CAGR%)
Table 29 U.S. Clinical Trials Support Services Market Forecast by Country, 2023-2033 (US$ Billion, AGR%, CAGR%)
Table 30 Canada Clinical Trials Support Services Market Forecast by Country, 2023-2033 (US$ Billion, AGR%, CAGR%)
Table 31 Europe Clinical Trials Support Services Market Forecast by Country, 2023-2033 (US$ Billion, AGR%, CAGR%)
Table 32 Europe Clinical Trials Support Services Market Forecast by Services, 2023-2033 (US$ Billion, AGR%, CAGR%)
Table 33 Europe Patient Recruitment Management in Clinical Trials Support Services Market Forecast by Services, 2023-2033 (US$ Billion, AGR%, CAGR%)
Table 34 Europe Clinical Trials Support Services Market Forecast by Phase, 2023-2033 (US$ Billion, AGR%, CAGR%)
Table 35 Europe Clinical Trials Support Services Market Forecast by Sponsor, 2023-2033 (US$ Billion, AGR%, CAGR%)
Table 36 Germany Clinical Trials Support Services Market Forecast by Country, 2023-2033 (US$ Billion, AGR%, CAGR%)
Table 37 France Clinical Trials Support Services Market Forecast, 2023-2033 (US$ Billion, AGR%, CAGR%)
Table 38 UK Clinical Trials Support Services Market Forecast, 2023-2033 (US$ Billion, AGR%, CAGR%)
Table 39 Italy Clinical Trials Support Services Market Forecast, 2023-2033 (US$ Billion, AGR%, CAGR%)
Table 40 Spain Clinical Trials Support Services Market Forecast, 2023-2033 (US$ Billion, AGR%, CAGR%)
Table 41 Rest of Europe Clinical Trials Support Services Market Forecast, 2023-2033 (US$ Billion, AGR%, CAGR%)
Table 42 Asia Pacific Clinical Trials Support Services Market Forecast by Country, 2023-2033 (US$ Billion, AGR%, CAGR%)
Table 43 Asia Pacific Clinical Trials Support Services Market Forecast by Services, 2023-2033 (US$ Billion, AGR%, CAGR%)
Table 44 Asia Pacific Patient Recruitment Management in Clinical Trials Support Services Market Forecast by Services, 2023-2033 (US$ Billion, AGR%, CAGR%)
Table 45 Asia Pacific Clinical Trials Support Services Market Forecast by Phase, 2023-2033 (US$ Billion, AGR%, CAGR%)
Table 46 Asia Pacific Clinical Trials Support Services Market Forecast by Sponsor, 2023-2033 (US$ Billion, AGR%, CAGR%)
Table 47 China Clinical Trials Support Services Market Forecast, 2023-2033 (US$ Billion, AGR%, CAGR%)
Table 48 Japan Clinical Trials Support Services Market Forecast, 2023-2033 (US$ Billion, AGR%, CAGR%)
Table 49 India Clinical Trials Support Services Market Forecast, 2023-2033 (US$ Billion, AGR%, CAGR%)
Table 50 Australia Clinical Trials Support Services Market Forecast, 2023-2033 (US$ Billion, AGR%, CAGR%)
Table 51 South Korea Clinical Trials Support Services Market Forecast, 2023-2033 (US$ Billion, AGR%, CAGR%)
Table 52 Asia-Pacific Clinical Trials Support Services Market Forecast, 2023-2033 (US$ Billion, AGR%, CAGR%)
Table 53 Latin America Clinical Trials Support Services Market Forecast by Country, 2023-2033 (US$ Billion, AGR%, CAGR%)
Table 54 Latin America Clinical Trials Support Services Market Forecast by Services, 2023-2033 (US$ Billion, AGR%, CAGR%)
Table 55 Latin America Patient Recruitment Management in Clinical Trials Support Services Market Forecast by Services, 2023-2033 (US$ Billion, AGR%, CAGR%)
Table 56 Latin America Clinical Trials Support Services Market Forecast by Phase, 2023-2033 (US$ Billion, AGR%, CAGR%)
Table 57 Latin America Clinical Trials Support Services Market Forecast by Sponsor, 2023-2033 (US$ Billion, AGR%, CAGR%)
Table 58 Brazil Clinical Trials Support Services Market Forecast, 2023-2033 (US$ Billion, AGR%, CAGR%)
Table 59 Mexico Clinical Trials Support Services Market Forecast, 2023-2033 (US$ Billion, AGR%, CAGR%)
Table 60 Rest of Latin America Clinical Trials Support Services Market Forecast, 2023-2033 (US$ Billion, AGR%, CAGR%)
Table 61 MEA Clinical Trials Support Services Market Forecast by Country, 2023-2033 (US$ Billion, AGR%, CAGR%)
Table 62 MEA Clinical Trials Support Services Market Forecast by Services, 2023-2033 (US$ Billion, AGR%, CAGR%)
Table 63 MEA Patient Recruitment Management in Clinical Trials Support Services Market Forecast by Services, 2023-2033 (US$ Billion, AGR%, CAGR%)
Table 64 MEA Clinical Trials Support Services Market Forecast by Phase, 2023-2033 (US$ Billion, AGR%, CAGR%)
Table 65 MEA Clinical Trials Support Services Market Forecast by Sponsor, 2023-2033 (US$ Billion, AGR%, CAGR%)
Table 66 GCC Clinical Trials Support Services Market Forecast, 2023-2033 (US$ Billion, AGR%, CAGR%)
Table 67 South Africa Clinical Trials Support Services Market Forecast, 2023-2033 (US$ Billion, AGR%, CAGR%)
Table 68 Rest of MEA Clinical Trials Support Services Market Forecast, 2023-2033 (US$ Billion, AGR%, CAGR%)
Table 69 Strategic Outlook
Table 70 Thermo Fisher Scientific Inc: Key Details, (CEO, HQ, Revenue, Founded, No. of Employees, Company Type, Website, Business Segment)
Table 71 Thermo Fisher Scientific Inc: Services Offered
Table 72 Thermo Fisher Scientific Inc: Strategic Outlook
Table 73 Eurofins Scientific: Key Details, (CEO, HQ, Revenue, Founded, No. of Employees, Company Type, Website, Business Segment)
Table 74 Eurofins Scientific: Services Offered
Table 75 Eurofins Scientific: Strategic Outlook
Table 76 IQVIA Inc.: Key Details, (CEO, HQ, Revenue, Founded, No. of Employees, Company Type, Website, Business Segment)
Table 77 IQVIA Inc: Services Offered
Table 78 IQVIA Inc: Strategic Outlook
Table 79 WuXi AppTec: Key Details, (CEO, HQ, Revenue, Founded, No. of Employees, Company Type, Website, Business Segment)
Table 80 WuXi AppTec: Services Offered
Table 81 WuXi AppTec: Strategic Outlook
Table 82 Parexel International Corporation: Key Details, (CEO, HQ, Revenue, Founded, No. of Employees, Company Type, Website, Business Segment)
Table 83 Parexel International Corporation.: Services Offered
Table 84 Parexel International Corporation: Strategic Outlook
Table 85 Merative: Key Details, (CEO, HQ, Revenue, Founded, No. of Employees, Company Type, Website, Business Segment)
Table 86 Amcor plc: Services Offered
Table 87 Merative: Strategic Outlook
Table 88 Calyx: Key Details, (CEO, HQ, Revenue, Founded, No. of Employees, Company Type, Website, Business Segment)
Table 89 Calyx: Service Benchmarking
Table 90 Calyx: Strategic Outlook
Table 91 Caidya: Key Details, (CEO, HQ, Revenue, Founded, No. of Employees, Company Type, Website, Business Segment)
Table 92 Caidya: Service Benchmarking
Table 93 Caidya: Strategic Outlook
Table 94 Laboratory Corporation of America: Key Details, (CEO, HQ, Founded, No. of Employees, Company Type, Website, Business Segment)
Table 95 Laboratory Corporation of America: Service Benchmarking
Table 96 Laboratory Corporation of America: Strategic Outlook
Table 97 ICON plc: Key Details, (CEO, HQ, Revenue, Founded, No. of Employees, Company Type, Website, Business Segment)
Table 98 ICON plc: Services Offered
Table 99 ICON plc: Strategic Outlook
図の一覧
Figure 1 Clinical Trials Support Services Market Segmentation
Figure 2 Clinical Trial Support Market by Service: Market Attractiveness Index
Figure 3 Clinical Trials Support Services Market Forecast by Phase: Market Attractiveness Index
Figure 4 Clinical Trials Support Services Market Forecast by Sponsor: Market Attractiveness Index
Figure 5 Clinical Trials Support Services Market Attractiveness Index by Region
Figure 6 Clinical Trials Support Services Market: Market Dynamics
Figure 7 Clinical Trials Support Services Market by Region, 2023-2033 (US$ Billion, AGR (%), CAGR (%)): “V” Shaped Recovery
Figure 8 Clinical Trials Support Services Market by Region, 2023-2033 (US$ Billion, AGR (%), CAGR (%)): “U” Shaped Recovery
Figure 9 Clinical Trials Support Services Market by Region, 2023-2033 (US$ Billion, AGR (%), CAGR (%)): “W” Shaped Recovery
Figure 10 Clinical Trials Support Services Market by Region, 2023-2033 (US$ Billion, AGR (%), CAGR (%)): “L” Shaped Recovery
Figure 11 Clinical Trials Support Services Market: Porter’s Five Forces Analysis
Figure 12 Clinical Trials Support Services Market: PEST Analysis
Figure 13 Clinical Trials Support Services Market Forecast by Service: Market Attractiveness Index
Figure 14 Clinical Trials Support Services Market Forecast by Service, 2023-2033 (US$ Billion)
Figure 15 Clinical Trials Support Services Market Share Forecast by Service, 2023, 2028, 2033 (%)
Figure 16 Clinical Trial Site Management Market Forecast by Region, 2023 2033 (US$ Billion)
Figure 17 Clinical Trial Site Management Market Share Forecast by Region, 2023 & 2033 (%)
Figure 18 Patient Recruitment Management Market Forecast by Region, 2023-2033 (US$ Billion)
Figure 19 Patient Recruitment Management Market Share Forecast by Region, 2023 & 2033 (%)
Figure 20 Data Management and Electronic Data Capture (EDC) Market Forecast by Region, 2023-2033 (US$ Billion)
Figure 21 Data Management and Electronic Data Capture (EDC) Market Share Forecast by Region, 023 & 2033 (%)
Figure 22 IRB (Institutional Review Boards) Market Forecast by Region, 2023-2033 (US$ Billion)
Figure 23 IRB (Institutional Review Boards) Market Share Forecast by Region, 2023 & 2033 (%)
Figure 24 Others Market Forecast by Region, 2023-2033 (US$ Billion)
Figure 25 Others Market Share Forecast by Region, 2023 & 2033 (%)
Figure 26 Clinical Trials Support Services Market Forecast by Phase: Market Attractiveness Index
Figure 27 Clinical Trials Support Services Market Forecast By Phase, 2023-2033 (US$ Billion)
Figure 28 Clinical Trials Support Services Market Share Forecast by Phase, 2023, 2028, 2033 (%)
Figure 29 Phase I Market Forecast by Region, 2023-2033 (US$ Billion)
Figure 30 Phase I Market Share Forecast by Region, 2023 & 2033 (%)
Figure 31 Phase II Market Forecast by Region, 2023-2033 (US$ Billion)
Figure 32 Phase II Market Share Forecast by Region, 2023 & 2033 (%)
Figure 33 Phase III Market Forecast by Region, 2023-2033 (US$ Billion)
Figure 34 Phase III Market Share Forecast by Region, 2023 & 2033 (%)
Figure 35 Phase IV Market Forecast by Region, 2023-2033 (US$ Billion)
Figure 36 Phase IV Market Share Forecast by Region, 2023 & 2033 (%)
Figure 37 Clinical Trials Support Services Market Forecast by Sponsor: Market Attractiveness Index
Figure 38 Clinical Trials Support Services Market Forecast by Sponsor, 2023-2033 (US$ Billion)
Figure 39 Clinical Trials Support Services Market Share Forecast by Sponsor, 2023, 2028, 2033 (%)
Figure 40 Pharmaceutical & Biopharmaceutical Companies Market Forecast by Region, 2023-2033 (US$ Billion)
Figure 41 Pharmaceutical & Biopharmaceutical Companies Market Share Forecast by Region, 2023 & 2033 (%)
Figure 42 Medical Device Manufacturers Market Forecast by Region, 2023-2033 (US$ Billion)
Figure 43 Medical Device Manufacturers Market Share Forecast by Region, 2023 & 2033 (%)
Figure 44 Others Market Forecast by Region, 2023-2033 (US$ Billion)
Figure 45 Others Market Share Forecast by Region, 2023 & 2033 (%)
Figure 46 Clinical Trials Support Services Market Forecast by Region 2023 & 2033 (Revenue, CAGR%)
Figure 47 Clinical Trials Support Services Market Share Forecast by Region 2023, 2028, 2033(%)
Figure 48 Clinical Trials Support Services Market by Region, 2023-2033 (US$ Billion, AGR (%), CAGR (%))
Figure 49 North America Clinical Trials Support Services Market Attractiveness Index
Figure 50 North America Clinical Trials Support Services Market by Region, 2023, 2028 & 2033 (US$ Billion)
Figure 51 North America Clinical Trials Support Services Market Forecast by Country, 2023-2033 (US$ Billion)
Figure 52 North America Clinical Trials Support Services Market Share Forecast by Country, 2023 & 2033 (%)
Figure 53 North America Clinical Trials Support Services Market Forecast by Service, 2023-2033 (US$ Billion)
Figure 54 North America Clinical Trials Support Services Market Share Forecast by Service, 2023 & 2033 (%)
Figure 55 North America Clinical Trials Support Services Market Forecast by Phase, 2023-2033 (US$ Billion
Figure 56 North America Clinical Trials Support Services Market Share Forecast by Phase, 2023 & 2033 (%)
Figure 57 North America Clinical Trials Support Services Market Forecast by Sponsor, 2023-2033 (US$ Billion)
Figure 58 North America Clinical Trials Support Services Market Share Forecast by Sponsor, 2023 & 2033 (%)
Figure 59 U.S. Clinical Trials Support Services Market Forecast, 2023-2033 (US$ Billion, AGR %)
Figure 60 Canada Clinical Trials Support Services Market Forecast, 2023-2033 (US$ Billion, AGR %)
Figure 61 Europe Clinical Trials Support Services Market Attractiveness Index
Figure 62 Europe Clinical Trials Support Services Market by Region, 2023, 2028 & 2033 (US$ Billion)
Figure 63 Europe Clinical Trials Support Services Market Forecast by Country, 2023-2033 (US$ Billion)
Figure 64 Europe Clinical Trials Support Services Market Share Forecast by Country, 2023 & 2033 (%)
Figure 65 Europe Clinical Trials Support Services Market Forecast by Service, 2023-2033 (US$ Billion
Figure 66 Europe Clinical Trials Support Services Market Share Forecast by Service, 2023 & 2033 (%)
Figure 67 Europe Clinical Trials Support Services Market Forecast by Phase, 2023-2033 (US$ Billion)
Figure 68 Europe Clinical Trials Support Services Market Share Forecast by Phase, 2023 & 2033 (%)
Figure 69 Europe Clinical Trials Support Services Market Forecast by Sponsor, 2023-2033 (US$ Billion)
Figure 70 Europe Clinical Trials Support Services Market Share Forecast by Sponsor, 2023 & 2033 (%)
Figure 71 Germany Clinical Trials Support Services Market Forecast, 2023-2033 (US$ Billion, AGR %)
Figure 72 France Clinical Trials Support Services Market Forecast, 2023-2033 (US$ Billion, AGR %)
Figure 73 UK Clinical Trials Support Services Market Forecast, 2023-2033 (US$ Billion, AGR %)
Figure 74 Italy Clinical Trials Support Services Market Forecast, 2023-2033 (US$ Billion, AGR %)
Figure 75 Spain Clinical Trials Support Services Market Forecast, 2023-2033 (US$ Billion, AGR %)
Figure 76 Rest of Europe Clinical Trials Support Services Market Forecast, 2023-2033 (US$ Billion, AGR %)
Figure 77 Asia Pacific Clinical Trials Support Services Market Attractiveness Index
Figure 78 Asia Pacific Clinical Trials Support Services Market by Region, 2023, 2028 & 2033 (US$ Billion)
Figure 79 Asia Pacific Clinical Trials Support Services Market Forecast by Country, 2023-2033 (US$ Billion)
Figure 80 Asia Pacific Clinical Trials Support Services Market Share Forecast by Country, 2023 & 2033 (%)
Figure 81 Asia Pacific Clinical Trials Support Services Market Forecast by Service, 2023-2033 (US$ Billion
Figure 82 Asia Pacific Clinical Trials Support Services Market Share Forecast by Service, 2023 & 2033 (%)
Figure 83 Asia Pacific Clinical Trials Support Services Market Forecast by Phase, 2023-2033 (US$ Billion)
Figure 84 Asia Pacific Clinical Trials Support Services Market Share Forecast by Phase, 2023 & 2033 (%)
Figure 85 Asia Pacific Clinical Trials Support Services Market Forecast by Sponsor, 2023-2033 (US$ Billion)
Figure 86 Asia Pacific Clinical Trials Support Services Market Share Forecast by Sponsor, 2023 & 2033 (%)
Figure 87 China Clinical Trials Support Services Market Forecast, 2023-2033 (US$ Billion, AGR %)
Figure 88 Japan Clinical Trials Support Services Market Forecast, 2023-2033 (US$ Billion, AGR %)
Figure 89 India Clinical Trials Support Services Market Forecast, 2023-2033 (US$ Billion, AGR %)
Figure 90 Australia Clinical Trials Support Services Market Forecast, 2023-2033 (US$ Billion, AGR %)
Figure 91 South Korea Clinical Trials Support Services Market Forecast, 2023-2033 (US$ Billion, AGR %)
Figure 92 Rest of Asia Pacific Clinical Trials Support Services Market Forecast, 2023-2033 (US$ Billion, AGR %)
Figure 93 Latin America Clinical Trials Support Services Market Attractiveness Index
Figure 94 Latin America Clinical Trials Support Services Market by Region, 2023, 2028 & 2033 (US$ Billion)
Figure 95 Latin America Clinical Trials Support Services Market Forecast by Country, 2023-2033 (US$ Billion)
Figure 96 Latin America Clinical Trials Support Services Market Share Forecast by Country, 2023 & 2033 (%)
Figure 97 Latin America Clinical Trials Support Services Market Forecast by Service, 2023-2033 (US$ Billion
Figure 98 Latin America Clinical Trials Support Services Market Share Forecast by Service, 2023 & 2033 (%)
Figure 99 Latin America Clinical Trials Support Services Market Forecast by Phase, 2023-2033 (US$ Billion)
Figure 100 Latin America Clinical Trials Support Services Market Share Forecast by Phase, 2023 & 2033 (%)
Figure 101 Latin America Clinical Trials Support Services Market Forecast by Sponsor, 2023-2033 (US$ Billion)
Figure 102 Latin America Clinical Trials Support Services Market Share Forecast by Sponsor, 2023 & 2033 (%)
Figure 103 Brazil Clinical Trials Support Services Market Forecast, 2023-2033 (US$ Billion, AGR %)
Figure 104 Mexico Clinical Trials Support Services Market Forecast, 2023-2033 (US$ Billion, AGR %)
Figure 105 Rest of Latin America Clinical Trials Support Services Market Forecast, 2023-2033 (US$ Billion, AGR %)
Figure 106 MEA Clinical Trials Support Services Market Attractiveness Index
Figure 107 MEA Clinical Trials Support Services Market by Region, 2023, 2028 & 2033 (US$ Billion)
Figure 108 MEA Clinical Trials Support Services Market Forecast by Country, 2023-2033 (US$ Billion)
Figure 109 MEA Clinical Trials Support Services Market Share Forecast by Country, 2023 & 2033 (%)
Figure 110 MEA Clinical Trials Support Services Market Forecast by Service, 2023-2033 (US$ Billion)
Figure 111 MEA Clinical Trials Support Services Market Share Forecast by Service, 2023 & 2033 (%)
Figure 112 MEA Clinical Trials Support Services Market Forecast by Phase, 2023-2033 (US$ Billion)
Figure 113 MEA Clinical Trials Support Services Market Share Forecast by Phase, 2023 & 2033 (%)
Figure 114 MEA Clinical Trials Support Services Market Forecast by Sponsor, 2023-2033 (US$ Billion)
Figure 115 MEA Clinical Trials Support Services Market Share Forecast by Sponsor, 2023 & 2033 (%)
Figure 116 GCC Clinical Trials Support Services Market Forecast, 2023-2033 (US$ Billion, AGR %)
Figure 117 South Africa Clinical Trials Support Services Market Forecast, 2023-2033 (US$ Billion, AGR %)
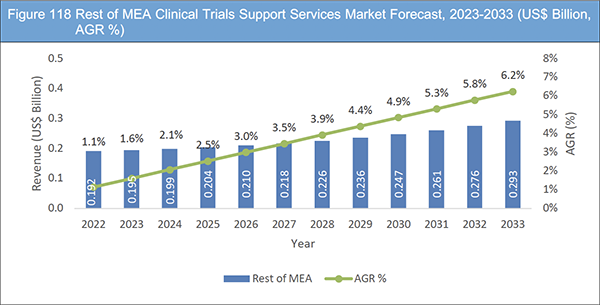
Figure 118 Rest of MEA Clinical Trials Support Services Market Forecast, 2023-2033 (US$ Billion, AGR %)
Figure 119 Clinical Trials Support Services Market: Company Share Analysis, 2022
Figure 120 Thermo Fisher Scientific Inc: Net Revenue, 2018-2022 (US$ million, AGR%)
Figure 121 Thermo Fisher Scientific Inc: Regional Market Shares, 2022
Figure 122 Eurofins Scientific: Net Revenue, 2018-2022 (US$ million, AGR%)
Figure 123 Eurofins Scientific: Regional Market Shares, 2022
Figure 124 IQVIA Inc: Annual Revenue, 2018-2022 (US$ million, AGR%)
Figure 125 IQVIA Inc: Regional Market Shares, 2022
Figure 126 IQVIA Inc: R&D Expense, 2018-2022 (US$ million, AGR%)
Figure 127 WuXi AppTec: Annual Revenue, 2019-2022 (US$ million, AGR%)
Figure 128 WuXi AppTec: Regional Market Shares, 2022
Figure 129 Laboratory Corporation of America: Revenue, 2018-2022 (US$ Million, AGR%)
Figure 130 Laboratory Corporation of America: Regional Market Shares, 2022
Figure 131 ICON plc: Revenue, 2018-2022 (US$ Billion, AGR%)
Figure 132 ICON plc: Regional Market Shares, 2022
ページTOPに戻る
Summary
Report Details
The Clinical Trials Support Services Market Report 2023-2033: This report will prove invaluable to leading firms striving for new revenue pockets if they wish to better understand the industry and its underlying dynamics. It will be useful for companies that would like to expand into different industries or to expand their existing operations in a new region.
Factors such as R&D, Clinical Trials Outsourcing and Globalization Driving Industry Growth
The market for clinical trials support services has witnessed substantial growth in recent times, with several pivotal factors shaping the pharmaceutical and biotechnology research landscape. Among the key drivers is the escalating demand for innovative and specialized treatments, which has led to a significant rise in clinical trial activities. As pharmaceutical companies strive to develop cutting-edge therapies to address unmet medical needs, the need for comprehensive clinical trials support services has surged considerably.
Moreover, the increasing prevalence of chronic illnesses and the aging population have necessitated broader and more diverse clinical trials. Conditions like cancer, cardiovascular disorders, and neurological ailments have seen a marked increase, prompting the requirement for larger and more intricate trials to assess the safety and effectiveness of potential treatments. Consequently, pharmaceutical and biotechnology firms are enlisting the assistance of specialized clinical trial support service providers to navigate the complexities of these trials more effectively.
Additionally, the growing focus on adhering to regulatory standards and ensuring data quality has fuelled the demand for specialized expertise and technological advancements in the clinical trial domain. Regulatory authorities worldwide have tightened their scrutiny of clinical trial data, making it crucial for companies to uphold the highest quality standards. As a result, the adoption of advanced technologies and data management solutions, such as electronic data capture (EDC) and clinical trial management systems (CTMS), has become pivotal to guarantee data accuracy, security, and regulatory compliance.
Collectively, these drivers have played a significant role in propelling the notable growth of the clinical trials support services market. As the healthcare landscape continues to evolve and progress, the demand for specialized and comprehensive clinical trial services is projected to further increase, offering fresh prospects and challenges for companies operating within this sector.
Data Quality and Management Issues such as Errors, Omissions, and Validation Gaps Risk Patient Safety and Trial Efficiency
In recent years, the clinical trials support services market has experienced remarkable growth, driven by a rising demand for outsourced solutions to streamline and expedite drug development processes. Nevertheless, the industry faces several challenges, and a significant impediment relates to the management and quality of data. The accuracy and reliability of data play a crucial role in clinical trials, forming the foundation for well-informed decision-making and ensuring precise outcomes and conclusions.
Various factors contribute to data quality issues, including errors during data collection, incomplete or missing data, inadequate validation processes, and inconsistencies in data entry. These factors can compromise the overall integrity of the trial, leading to erroneous conclusions and, more importantly, potentially jeopardizing the safety of patients. Additionally, poorly managed data can lead to delays in project timelines and escalated costs, negatively impacting the efficiency of the entire trial process.
Moreover, data management concerns encompass the need for data security and the assurance that patient information remains confidential and compliant with privacy regulations. Inadequate data protection measures may expose sensitive information to unauthorized access, leading to breaches and potential legal repercussions.
What Questions Should You Ask before Buying a Market Research Report?
• How is the clinical trials support services market evolving?
• What is driving and restraining the clinical trials support services market?
• How will each clinical trials support services market segment grow over the forecast period and how much revenue will these submarkets account for in 2033?
• How will the market shares for each clinical trials support services market submarket develop from 2023 to 2033?
• What will be the main driver for the overall market from 2023 to 2033?
• Will leading clinical trials support services markets broadly follow the macroeconomic dynamics, or will individual national markets outperform others?
• How will the market shares of the national markets change by 2033 and which geographical region will lead the market in 2033?
• Who are the leading players and what are their prospects over the forecast period?
• How will the industry evolve during the period between 2023 and 2033? What are the implications of clinical trials support services projects taking place now and over the next 10 years?
• Is there a greater need for product commercialisation to further scale the clinical trials support services market?
• Where is the clinical trials support services market heading and how can you ensure you are at the forefront of the market?
• What are the best investment options for new product and service lines?
• What are the key prospects for moving companies into a new growth path and C-suite?
You need to discover how this will impact the clinical trials support services market today, and over the next 10 years:
• Our 262-page report provides 99 tables, 132 charts/graphs exclusively to you.
• The report highlights key lucrative areas in the industry so you can target them – NOW.
• It contains in-depth analysis of global, regional and national sales and growth.
• It highlights for you the key successful trends, changes and revenue projections made by your competitors.
This report tells you TODAY how the clinical trials support services market will develop in the next 10 years, and in line with the variations in COVID-19 economic recession and bounce. This market is more critical now than at any point over the last 10 years.
Forecasts to 2033 and other analyses reveal commercial prospects
• In addition to revenue forecasting to 2033, our new study provides you with recent results, growth rates, and market shares.
• You will find original analyses, with business outlooks and developments.
• Discover qualitative analyses (including market dynamics, drivers, opportunities, restraints and challenges), cost structure, impact of rising clinical trials support services prices and recent developments.
This report includes data analysis and invaluable insight into how COVID-19 will affect the industry and your company. Four COVID-19 recovery patterns and their impact, namely, “V”, “L”, “W” and “U” are discussed in this report.
By Service
• Clinical trial site management
• Patient recruitment management
• Data Management and Electronic Data Capture (EDC) Services
• IRB (Institutional Review Boards)
• Others
Phase
• Phase I
• Phase II
• Phase III
• Phase IV
Sponsor
• Pharmaceutical & Biopharmaceutical Companies
• Medical Device Manufacturers
• Others
In addition to the revenue predictions for the overall world market and segments, you will also find revenue forecasts for four regional and 20 leading national markets:
North America
• U.S.
• Canada
Europe
• Germany
• Spain
• UK
• France
• Italy
• Rest of Europe
Asia Pacific
• China
• Japan
• India
• Australia
• South Korea
• Rest of Asia Pacific
Latin America
• Brazil
• Mexico
• Rest of Latin America
MEA
• GCC Countries
• South Africa
• Rest of MEA
The report also includes profiles and for some of the leading companies in the Clinical Trials Support Services Market, 2023 to 2033, with a focus on this segment of these companies’ operations.
Leading companies and the potential for market growth
• Caidya
• Calyx
• Eurofins Scientific
• ICON plc
• IQVIA Inc.
• Laboratory Corporation of America
• Merative
• Parexel International Corporation
• Thermo Fisher Scientific Inc.
• WuXi AppTec
Overall world revenue for Clinical Trials Support Services Market, 2023 to 2033 in terms of value the market will surpass US$21 billion in 2023, our work calculates. We predict strong revenue growth through to 2033. Our work identifies which organizations hold the greatest potential. Discover their capabilities, progress, and commercial prospects, helping you stay ahead.
How will the Clinical Trials Support Services Market, 2023 to 2033 report help you?
In summary, our 260+ page report provides you with the following knowledge:
• Revenue forecasts to 2033 for Clinical Trials Support Services Market 2023 to 2033, with forecasts for service, phase, and sponsor each forecast at a global and regional level – discover the industry’s prospects, finding the most lucrative places for investments and revenues.
• Revenue forecasts to 2033 for four regional and 20 key national markets – See forecasts for the Clinical Trials Support Services Market, 2023 to 2033 market in North America, Europe, Asia-Pacific, Latin America and MEA. Also forecasted is the market in the US, Canada, Mexico, Brazil, Germany, France, UK, Italy, China, India, Japan, and Australia among other prominent economies.
• Prospects for established firms and those seeking to enter the market – including company profiles for 10 of the major companies involved in the Clinical Trials Support Services Market, 2023 to 2033.
Find quantitative and qualitative analyses with independent predictions. Receive information that only our report contains, staying informed with invaluable business intelligence.
Information found nowhere else
With our new report, you are less likely to fall behind in knowledge or miss out on opportunities. See how our work could benefit your research, analyses, and decisions. Visiongain’s study is for everybody needing commercial analyses for the Clinical Trials Support Services Market, 2023 to 2033, market-leading companies. You will find data, trends and predictions.
ページTOPに戻る
Table of Contents
Table of Contents
1 Report Overview
1.1 Objectives of the Study
1.2 Introduction to Clinical Trials Support Services Market
1.3 What This Report Delivers
1.4 Why You Should Read This Report
1.5 Key Questions Answered by This Analytical Report
1.6 Who is This Report for?
1.7 Methodology
1.7.1 Market Definitions
1.7.2 Market Evaluation & Forecasting Methodology
1.7.3 Data Validation
1.7.3.1 Primary Research
1.7.3.2 Secondary Research
1.8 Frequently Asked Questions (FAQs)
1.9 Associated Visiongain Reports
1.10 About Visiongain
2 Executive Summary
3 Market Overview
3.1 Key Findings
3.2 Market Dynamics
3.2.1 Market Driving Factors
3.2.1.1 Increasing R&D Activities and Increasing Clinical Trials Activities
3.2.1.2 Outsourcing of Clinical Trials Activities Driving Industry Growth
3.2.1.3 Globalization of Clinical Trials Projected to Boost Industry Growth
3.2.2 Market Restraining Factors
3.2.2.1 Strict Regulatory and High Compliance Complexity Likely to Hamper Industry Growth
3.2.2.2 Data Quality and Management Issues Reducing Reliability of Data
3.2.2.3 Patient Recruitment and Retention Over a Diverse Patient Population
3.2.3 Market Opportunities
3.2.3.1 Patient-centric Approaches and Technological Advancements Projected to Offer Lucrative Growth Prospects
3.2.3.2 Precision Medicine and Biomarker-driven Trials
3.2.3.3 Virtual and Decentralized Trials Offering Remote Monitoring, Telemedicine Solutions, and Digital Patient Engagement Platforms
3.3 COVID-19 Impact Analysis
3.4 Porter’s Five Forces Analysis
3.4.1 Bargaining Power of Suppliers
3.4.2 Bargaining Power of Buyers
3.4.3 Competitive Rivalry
3.4.4 Threat from Substitutes
3.4.5 Threat of New Entrants
3.5 PEST Analysis
3.5.1 Political
3.5.2 Economical
3.5.3 Social
3.5.4 Technological
4 Clinical Trials Support Services Market Analysis by Service
4.1 Key Findings
4.2 Service Segment: Market Attractiveness Index
4.3 Clinical Trials Support Services Market Size Estimation and Forecast by Service
4.4 Clinical Trial Site Management
4.4.1 Market Size by Region, 2023-2033 (US$ Billion)
4.4.2 Market Share by Region, 2023 & 2033 (%)
4.5 Patient Recruitment Management
4.5.1 Market Size by Region, 2023-2033 (US$ Billion)
4.5.2 Market Share by Region, 2023 & 2033 (%)
4.5.3 Patient Recruitment Management in Clinical Trials Support Services Market
4.6 Data Management and Electronic Data Capture (EDC) Services
4.6.1 Market Size by Region, 2023-2033 (US$ Billion)
4.6.2 Market Share by Region, 2023 & 2033 (%)
4.7 IRB (Institutional Review Boards)
4.7.1 Market Size by Region, 2023-2033 (US$ Billion)
4.7.2 Market Share by Region, 2023 & 2033 (%)
4.8 Others
4.8.1 Market Size by Region, 2023-2033 (US$ Billion)
4.8.2 Market Share by Region, 2023 & 2033 (%)
5 Clinical Trials Support Services Market Analysis by Phase
5.1 Key Findings
5.2 Phase Segment: Market Attractiveness Index
5.3 Clinical Trials Support Services Market Size Estimation and Forecast by Phase
5.4 Phase I
5.4.1 Market Size by Region, 2023-2033 (US$ Billion)
5.4.2 Market Share by Region, 2023 & 2033 (%)
5.5 Phase II
5.5.1 Market Size by Region, 2023-2033 (US$ Billion)
5.5.2 Market Share by Region, 2023 & 2033 (%)
5.6 Phase III
5.6.1 Market Size by Region, 2023-2033 (US$ Billion)
5.6.2 Market Share by Region, 2023 & 2033 (%)
5.7 Phase IV
5.7.2 Market Size by Region, 2023-2033 (US$ Billion)
5.7.3 Market Share by Region, 2023 & 2033 (%)
6 Clinical Trials Support Services Market Analysis by Sponsor
6.1 Key Findings
6.2 Sponsor Segment: Market Attractiveness Index
6.3 Clinical Trials Support Services Market Size Estimation and Forecast by Sponsor
6.4 Pharmaceutical & Biopharmaceutical Companies
6.4.1 Market Size by Region, 2023-2033 (US$ Billion)
6.4.2 Market Share by Region, 2023 & 2033 (%)
6.5 Medical Device Manufacturers
6.5.2 Market Size by Region, 2023-2033 (US$ Billion)
6.5.3 Market Share by Region, 2023 & 2033 (%)
6.6 Others
6.6.1 Market Size by Region, 2023-2033 (US$ Billion)
6.6.2 Market Share by Region, 2023 & 2033 (%)
7 Clinical Trials Support Services Market Analysis by Region
7.1 Key Findings
7.3 Regional Market Size Estimation and Forecast
8 North America Clinical Trials Support Services Market Analysis
8.1 Key Findings
8.2 North America Clinical Trials Support Services Market Attractiveness Index
8.3 North America Clinical Trials Support Services Market by Country, 2023, 2028 & 2033 (US$ Billion)
8.4 North America Clinical Trials Support Services Market Size Estimation and Forecast by Country
8.5 North America Clinical Trials Support Services Market Size Estimation and Forecast by Service
8.5.1 North America Patient Recruitment Management in Clinical Trials Support Services Market Size Estimation and Forecast by Services
8.6 North America Clinical Trials Support Services Market Size Estimation and Forecast by Phase
8.7 North America Clinical Trials Support Services Market Size Estimation and Forecast by Sponsor
8.8 U.S. Clinical Trials Support Services Market Analysis
8.9 Canada Clinical Trials Support Services Market Analysis
9 Europe Clinical Trials Support Services Market Analysis
9.1 Key Findings
9.2 Europe Clinical Trials Support Services Market Attractiveness Index
9.3 Europe Clinical Trials Support Services Market by Country, 2023, 2028 & 2033 (US$ Billion)
9.4 Europe Clinical Trials Support Services Market Size Estimation and Forecast by Country
9.5 Europe Clinical Trials Support Services Market Size Estimation and Forecast by Service
9.5.1 Europe Patient Recruitment Management in Clinical Trials Support Services Market Size Estimation and Forecast by Services
9.6 Europe Clinical Trials Support Services Market Size Estimation and Forecast by Phase
9.7 Europe Clinical Trials Support Services Market Size Estimation and Forecast by Sponsor
9.8 Germany Clinical Trials Support Services Market Analysis
9.9 France Clinical Trials Support Services Market Analysis
9.10 UK Clinical Trials Support Services Market Analysis
9.11 Italy Clinical Trials Support Services Market Analysis
9.12 Spain Clinical Trials Support Services Market Analysis
9.13 Rest of Europe Clinical Trials Support Services Market Analysis
10 Asia Pacific Clinical Trials Support Services Market Analysis
10.1 Key Findings
10.2 Asia Pacific Clinical Trials Support Services Market Attractiveness Index
10.3 Asia Pacific Clinical Trials Support Services Market by Country, 2023, 2028 & 2033 (US$ Billion)
10.4 Asia Pacific Clinical Trials Support Services Market Size Estimation and Forecast by Country
10.5 Asia Pacific Clinical Trials Support Services Market Size Estimation and Forecast by Service
10.5.1 Asia Pacific Patient Recruitment Management in Clinical Trials Support Services Market Size Estimation and Forecast by Services
10.6 Asia Pacific Clinical Trials Support Services Market Size Estimation and Forecast by Phase
10.7 Asia Pacific Clinical Trials Support Services Market Size Estimation and Forecast by Sponsor
10.8 China Clinical Trials Support Services Market Analysis
10.9 Japan Clinical Trials Support Services Market Analysis
10.10 India Clinical Trials Support Services Market Analysis
10.11 Australia Clinical Trials Support Services Market Analysis
10.12 South Korea Clinical Trials Support Services Market Analysis
10.13 Rest of Asia Pacific Clinical Trials Support Services Market Analysis
11 Latin America Clinical Trials Support Services Market Analysis
11.1 Key Findings
11.2 Latin America Clinical Trials Support Services Market Attractiveness Index
11.3 Latin America Clinical Trials Support Services Market by Country, 2023, 2028 & 2033 (US$ Billion)
11.4 Latin America Clinical Trials Support Services Market Size Estimation and Forecast by Country
11.5 Latin America Clinical Trials Support Services Market Size Estimation and Forecast by Service
11.5.1 Latin America Patient Recruitment Management in Clinical Trials Support Services Market Size Estimation and Forecast by Services
11.6 Latin America Clinical Trials Support Services Market Size Estimation and Forecast by Phase
11.7 Latin America Clinical Trials Support Services Market Size Estimation and Forecast by Sponsor
11.8 Brazil Clinical Trials Support Services Market Analysis
11.9 Mexico Clinical Trials Support Services Market Analysis
11.10 Rest of Latin America Clinical Trials Support Services Market Analysis
12 MEA Clinical Trials Support Services Market Analysis
12.1 Key Findings
12.2 MEA Clinical Trials Support Services Market Attractiveness Index
12.3 MEA Clinical Trials Support Services Market by Country, 2023, 2028 & 2033 (US$ Billion)
12.4 MEA Clinical Trials Support Services Market Size Estimation and Forecast by Country
12.5 MEA Clinical Trials Support Services Market Size Estimation and Forecast by Service
12.5.1 MEA Patient Recruitment Management in Clinical Trials Support Services Market Size Estimation and Forecast by Services
12.6 MEA Clinical Trials Support Services Market Size Estimation and Forecast by Phase
12.7 MEA Clinical Trials Support Services Market Size Estimation and Forecast by Sponsor
12.8 GCC Clinical Trials Support Services Market Analysis
12.9 South Africa Clinical Trials Support Services Market Analysis
12.10 Rest of MEA Clinical Trials Support Services Market Analysis
13 Company Profiles
13.1 Competitive Landscape, 2022
13.2 Strategic Outlook
13.3 Thermo Fisher Scientific Inc.
13.3.1 Company Snapshot
13.3.2 Company Overview
13.3.3 Financial Analysis
13.3.3.1 Net Revenue, 2018-2022
13.3.3.2 Regional Market Shares, 2022
13.3.4 Services Offered
13.3.5 Strategic Outlook
13.4 Eurofins Scientific
13.4.1 Company Snapshot
13.4.2 Company Overview
13.4.3 Financial Analysis
13.4.3.1 Net Revenue, 2018-2022
13.4.3.2 Regional Market Shares, 2022
13.4.4 Services Offered
13.4.5 Strategic Outlook
13.5 IQVIA Inc.
13.5.1 Company Snapshot
13.5.2 Company Overview
13.5.3 Financial Analysis
13.5.3.1 Revenue, 2018-2022
13.5.3.2 Regional Market Shares, 2022
13.5.3.3 R&D Expense, 2018-2022
13.5.4 Services Offered
13.5.5 Strategic Outlook
13.6 WuXi AppTec
13.6.1 Company Snapshot
13.6.2 Company Overview
13.6.3 Financial Analysis
13.6.3.1 Revenue, 2019-2022
13.6.3.2 Regional Market Shares, 2022
13.6.4 Services Offered
13.6.5 Strategic Outlook
13.7 Parexel International Corporation
13.7.1 Company Snapshot
13.7.2 Company Overview
13.7.3 Services Offered
13.7.4 Strategic Outlook
13.8 Merative
13.8.1 Company Snapshot
13.8.2 Company Overview
13.8.3 Services Offered
13.8.4 Strategic Outlook
13.9 Calyx
13.9.1 Company Snapshot
13.9.2 Company Overview
13.9.3 Services Offered
13.9.4 Strategic Outlook
13.10 Caidya
13.10.1 Company Snapshot
13.10.2 Company Overview
13.10.3 Services Offered
13.10.4 Strategic Outlook
13.11 Laboratory Corporation of America
13.11.1 Company Snapshot
13.11.2 Company Overview
13.11.3 Financial Analysis
13.11.3.1 Revenue, 2018-2022
13.11.3.2 Regional Market Shares, 2022
13.11.4 Services Offered
13.11.5 Strategic Outlook
13.12 ICON plc
13.12.1 Company Snapshot
13.12.2 Company Overview
13.12.3 Financial Analysis
13.12.3.1 Revenue, 2018-2022
13.12.3.2 Regional Market Shares, 2022
13.12.4 Services Offered
13.12.5 Strategic Outlook
14 Conclusion and Recommendations
14.1 Concluding Remarks from Visiongain
14.2 Recommendations for Market Players
ページTOPに戻る
List of Tables/Graphs
List of Tables
Table 1 Clinical Trials Support Services Market Snapshot, 2023 & 2033 (US$ billion, CAGR %)
Table 2 Total Clinical Trials by Phase of Development
Table 3 Clinical Trials Support Services Market Forecast by Region 2023-2033 (US$ Bn, AGR%, CAGR%): "V" Shaped Recovery
Table 4 Clinical Trials Support Services Market Forecast by Region 2023-2033 (US$ Bn, AGR%, CAGR%): "U" Shaped Recovery
Table 5 Clinical Trials Support Services Market Forecast by Region 2023-2033 (US$ Bn, AGR%, CAGR%): "W" Shaped Recovery
Table 6 Clinical Trials Support Services Market Forecast by Region 2023-2033 (US$ Bn, AGR%, CAGR%): "L" Shaped Recovery
Table 7 Global Clinical Trials Support Services Market Forecast by Services, 2023-2033 (US$ Billion, AGR%, CAGR%)
Table 8 Clinical Trial Site Management Segment Market Forecast by Region, 2023-2033 (US$ Billion, AGR%, CAGR%)
Table 9 Patient Recruitment Management Segment Market Forecast by Region, 2023-2033 (US$ Billion, AGR%, CAGR%)
Table 10 Patient Recruitment Management in Clinical Trials Support Services Market Forecast by Services, 2023-2033 (US$ Billion, AGR%, CAGR%)
Table 11 Data Management and Electronic Data Capture (EDC) Segment Market Forecast by Region, 2023-2033 (US$ Billion, AGR%, CAGR%)
Table 12 IRB (Institutional Review Boards) Segment Market Forecast by Region, 2023-2033
(US$ Billion, AGR%, CAGR%)
Table 13 Others Segment Market Forecast by Region, 2023-2033 (US$ Billion, AGR%, CAGR%)
Table 14 Global Clinical Trials Support Services Market Forecast by Phase, 2023-2033 (US$ Billion, AGR%, CAGR%)
Table 15 Phase I Segment Market Forecast by Region, 2023-2033 (US$ Billion, AGR%, CAGR%)
Table 16 Phase II Segment Market Forecast by Region, 2023-2033 (US$ Billion, AGR%, CAGR%)
Table 17 Phase III Segment Market Forecast by Region, 2023-2033 (US$ Billion, AGR%, CAGR%)
Table 18 Phase IV Segment Market Forecast by Region, 2023-2033 (US$ Billion, AGR%, CAGR%)
Table 19 Global Clinical Trials Support Services Market Forecast by Sponsor, 2023-2033 (US$ Billion, AGR%, CAGR%)
Table 20 Pharmaceutical & Biopharmaceutical Companies Segment Market Forecast by Region, 2023-2033 (US$ Billion, AGR%, CAGR%)
Table 21 Medical Device Manufacturers Segment Market Forecast by Region, 2023-2033 (US$ Billion, AGR%, CAGR%)
Table 22 Others Segment Market Forecast by Region, 2023-2033 (US$ Billion, AGR%, CAGR%)
Table 23 Global Clinical Trials Support Services Market Forecast by Region 2023-2033 (US$ Billion, AGR%, CAGR%)
Table 24 North America Clinical Trials Support Services Market Forecast by Country, 2023-2033 (US$ Billion, AGR%, CAGR%)
Table 25 North America Clinical Trials Support Services Market Forecast by Services, 2023-2033 (US$ Billion, AGR%, CAGR%)
Table 26 North America Patient Recruitment Management in Clinical Trials Support Services Market Forecast by Services, 2023-2033 (US$ Billion, AGR%, CAGR%)
Table 27 North America Clinical Trials Support Services Market Forecast by Phase, 2023-2033 (US$ Billion, AGR%, CAGR%)
Table 28 North America Clinical Trials Support Services Market Forecast by Sponsor, 2023-2033 (US$ Billion, AGR%, CAGR%)
Table 29 U.S. Clinical Trials Support Services Market Forecast by Country, 2023-2033 (US$ Billion, AGR%, CAGR%)
Table 30 Canada Clinical Trials Support Services Market Forecast by Country, 2023-2033 (US$ Billion, AGR%, CAGR%)
Table 31 Europe Clinical Trials Support Services Market Forecast by Country, 2023-2033 (US$ Billion, AGR%, CAGR%)
Table 32 Europe Clinical Trials Support Services Market Forecast by Services, 2023-2033 (US$ Billion, AGR%, CAGR%)
Table 33 Europe Patient Recruitment Management in Clinical Trials Support Services Market Forecast by Services, 2023-2033 (US$ Billion, AGR%, CAGR%)
Table 34 Europe Clinical Trials Support Services Market Forecast by Phase, 2023-2033 (US$ Billion, AGR%, CAGR%)
Table 35 Europe Clinical Trials Support Services Market Forecast by Sponsor, 2023-2033 (US$ Billion, AGR%, CAGR%)
Table 36 Germany Clinical Trials Support Services Market Forecast by Country, 2023-2033 (US$ Billion, AGR%, CAGR%)
Table 37 France Clinical Trials Support Services Market Forecast, 2023-2033 (US$ Billion, AGR%, CAGR%)
Table 38 UK Clinical Trials Support Services Market Forecast, 2023-2033 (US$ Billion, AGR%, CAGR%)
Table 39 Italy Clinical Trials Support Services Market Forecast, 2023-2033 (US$ Billion, AGR%, CAGR%)
Table 40 Spain Clinical Trials Support Services Market Forecast, 2023-2033 (US$ Billion, AGR%, CAGR%)
Table 41 Rest of Europe Clinical Trials Support Services Market Forecast, 2023-2033 (US$ Billion, AGR%, CAGR%)
Table 42 Asia Pacific Clinical Trials Support Services Market Forecast by Country, 2023-2033 (US$ Billion, AGR%, CAGR%)
Table 43 Asia Pacific Clinical Trials Support Services Market Forecast by Services, 2023-2033 (US$ Billion, AGR%, CAGR%)
Table 44 Asia Pacific Patient Recruitment Management in Clinical Trials Support Services Market Forecast by Services, 2023-2033 (US$ Billion, AGR%, CAGR%)
Table 45 Asia Pacific Clinical Trials Support Services Market Forecast by Phase, 2023-2033 (US$ Billion, AGR%, CAGR%)
Table 46 Asia Pacific Clinical Trials Support Services Market Forecast by Sponsor, 2023-2033 (US$ Billion, AGR%, CAGR%)
Table 47 China Clinical Trials Support Services Market Forecast, 2023-2033 (US$ Billion, AGR%, CAGR%)
Table 48 Japan Clinical Trials Support Services Market Forecast, 2023-2033 (US$ Billion, AGR%, CAGR%)
Table 49 India Clinical Trials Support Services Market Forecast, 2023-2033 (US$ Billion, AGR%, CAGR%)
Table 50 Australia Clinical Trials Support Services Market Forecast, 2023-2033 (US$ Billion, AGR%, CAGR%)
Table 51 South Korea Clinical Trials Support Services Market Forecast, 2023-2033 (US$ Billion, AGR%, CAGR%)
Table 52 Asia-Pacific Clinical Trials Support Services Market Forecast, 2023-2033 (US$ Billion, AGR%, CAGR%)
Table 53 Latin America Clinical Trials Support Services Market Forecast by Country, 2023-2033 (US$ Billion, AGR%, CAGR%)
Table 54 Latin America Clinical Trials Support Services Market Forecast by Services, 2023-2033 (US$ Billion, AGR%, CAGR%)
Table 55 Latin America Patient Recruitment Management in Clinical Trials Support Services Market Forecast by Services, 2023-2033 (US$ Billion, AGR%, CAGR%)
Table 56 Latin America Clinical Trials Support Services Market Forecast by Phase, 2023-2033 (US$ Billion, AGR%, CAGR%)
Table 57 Latin America Clinical Trials Support Services Market Forecast by Sponsor, 2023-2033 (US$ Billion, AGR%, CAGR%)
Table 58 Brazil Clinical Trials Support Services Market Forecast, 2023-2033 (US$ Billion, AGR%, CAGR%)
Table 59 Mexico Clinical Trials Support Services Market Forecast, 2023-2033 (US$ Billion, AGR%, CAGR%)
Table 60 Rest of Latin America Clinical Trials Support Services Market Forecast, 2023-2033 (US$ Billion, AGR%, CAGR%)
Table 61 MEA Clinical Trials Support Services Market Forecast by Country, 2023-2033 (US$ Billion, AGR%, CAGR%)
Table 62 MEA Clinical Trials Support Services Market Forecast by Services, 2023-2033 (US$ Billion, AGR%, CAGR%)
Table 63 MEA Patient Recruitment Management in Clinical Trials Support Services Market Forecast by Services, 2023-2033 (US$ Billion, AGR%, CAGR%)
Table 64 MEA Clinical Trials Support Services Market Forecast by Phase, 2023-2033 (US$ Billion, AGR%, CAGR%)
Table 65 MEA Clinical Trials Support Services Market Forecast by Sponsor, 2023-2033 (US$ Billion, AGR%, CAGR%)
Table 66 GCC Clinical Trials Support Services Market Forecast, 2023-2033 (US$ Billion, AGR%, CAGR%)
Table 67 South Africa Clinical Trials Support Services Market Forecast, 2023-2033 (US$ Billion, AGR%, CAGR%)
Table 68 Rest of MEA Clinical Trials Support Services Market Forecast, 2023-2033 (US$ Billion, AGR%, CAGR%)
Table 69 Strategic Outlook
Table 70 Thermo Fisher Scientific Inc: Key Details, (CEO, HQ, Revenue, Founded, No. of Employees, Company Type, Website, Business Segment)
Table 71 Thermo Fisher Scientific Inc: Services Offered
Table 72 Thermo Fisher Scientific Inc: Strategic Outlook
Table 73 Eurofins Scientific: Key Details, (CEO, HQ, Revenue, Founded, No. of Employees, Company Type, Website, Business Segment)
Table 74 Eurofins Scientific: Services Offered
Table 75 Eurofins Scientific: Strategic Outlook
Table 76 IQVIA Inc.: Key Details, (CEO, HQ, Revenue, Founded, No. of Employees, Company Type, Website, Business Segment)
Table 77 IQVIA Inc: Services Offered
Table 78 IQVIA Inc: Strategic Outlook
Table 79 WuXi AppTec: Key Details, (CEO, HQ, Revenue, Founded, No. of Employees, Company Type, Website, Business Segment)
Table 80 WuXi AppTec: Services Offered
Table 81 WuXi AppTec: Strategic Outlook
Table 82 Parexel International Corporation: Key Details, (CEO, HQ, Revenue, Founded, No. of Employees, Company Type, Website, Business Segment)
Table 83 Parexel International Corporation.: Services Offered
Table 84 Parexel International Corporation: Strategic Outlook
Table 85 Merative: Key Details, (CEO, HQ, Revenue, Founded, No. of Employees, Company Type, Website, Business Segment)
Table 86 Amcor plc: Services Offered
Table 87 Merative: Strategic Outlook
Table 88 Calyx: Key Details, (CEO, HQ, Revenue, Founded, No. of Employees, Company Type, Website, Business Segment)
Table 89 Calyx: Service Benchmarking
Table 90 Calyx: Strategic Outlook
Table 91 Caidya: Key Details, (CEO, HQ, Revenue, Founded, No. of Employees, Company Type, Website, Business Segment)
Table 92 Caidya: Service Benchmarking
Table 93 Caidya: Strategic Outlook
Table 94 Laboratory Corporation of America: Key Details, (CEO, HQ, Founded, No. of Employees, Company Type, Website, Business Segment)
Table 95 Laboratory Corporation of America: Service Benchmarking
Table 96 Laboratory Corporation of America: Strategic Outlook
Table 97 ICON plc: Key Details, (CEO, HQ, Revenue, Founded, No. of Employees, Company Type, Website, Business Segment)
Table 98 ICON plc: Services Offered
Table 99 ICON plc: Strategic Outlook
List of Figures
Figure 1 Clinical Trials Support Services Market Segmentation
Figure 2 Clinical Trial Support Market by Service: Market Attractiveness Index
Figure 3 Clinical Trials Support Services Market Forecast by Phase: Market Attractiveness Index
Figure 4 Clinical Trials Support Services Market Forecast by Sponsor: Market Attractiveness Index
Figure 5 Clinical Trials Support Services Market Attractiveness Index by Region
Figure 6 Clinical Trials Support Services Market: Market Dynamics
Figure 7 Clinical Trials Support Services Market by Region, 2023-2033 (US$ Billion, AGR (%), CAGR (%)): “V” Shaped Recovery
Figure 8 Clinical Trials Support Services Market by Region, 2023-2033 (US$ Billion, AGR (%), CAGR (%)): “U” Shaped Recovery
Figure 9 Clinical Trials Support Services Market by Region, 2023-2033 (US$ Billion, AGR (%), CAGR (%)): “W” Shaped Recovery
Figure 10 Clinical Trials Support Services Market by Region, 2023-2033 (US$ Billion, AGR (%), CAGR (%)): “L” Shaped Recovery
Figure 11 Clinical Trials Support Services Market: Porter’s Five Forces Analysis
Figure 12 Clinical Trials Support Services Market: PEST Analysis
Figure 13 Clinical Trials Support Services Market Forecast by Service: Market Attractiveness Index
Figure 14 Clinical Trials Support Services Market Forecast by Service, 2023-2033 (US$ Billion)
Figure 15 Clinical Trials Support Services Market Share Forecast by Service, 2023, 2028, 2033 (%)
Figure 16 Clinical Trial Site Management Market Forecast by Region, 2023 2033 (US$ Billion)
Figure 17 Clinical Trial Site Management Market Share Forecast by Region, 2023 & 2033 (%)
Figure 18 Patient Recruitment Management Market Forecast by Region, 2023-2033 (US$ Billion)
Figure 19 Patient Recruitment Management Market Share Forecast by Region, 2023 & 2033 (%)
Figure 20 Data Management and Electronic Data Capture (EDC) Market Forecast by Region, 2023-2033 (US$ Billion)
Figure 21 Data Management and Electronic Data Capture (EDC) Market Share Forecast by Region, 023 & 2033 (%)
Figure 22 IRB (Institutional Review Boards) Market Forecast by Region, 2023-2033 (US$ Billion)
Figure 23 IRB (Institutional Review Boards) Market Share Forecast by Region, 2023 & 2033 (%)
Figure 24 Others Market Forecast by Region, 2023-2033 (US$ Billion)
Figure 25 Others Market Share Forecast by Region, 2023 & 2033 (%)
Figure 26 Clinical Trials Support Services Market Forecast by Phase: Market Attractiveness Index
Figure 27 Clinical Trials Support Services Market Forecast By Phase, 2023-2033 (US$ Billion)
Figure 28 Clinical Trials Support Services Market Share Forecast by Phase, 2023, 2028, 2033 (%)
Figure 29 Phase I Market Forecast by Region, 2023-2033 (US$ Billion)
Figure 30 Phase I Market Share Forecast by Region, 2023 & 2033 (%)
Figure 31 Phase II Market Forecast by Region, 2023-2033 (US$ Billion)
Figure 32 Phase II Market Share Forecast by Region, 2023 & 2033 (%)
Figure 33 Phase III Market Forecast by Region, 2023-2033 (US$ Billion)
Figure 34 Phase III Market Share Forecast by Region, 2023 & 2033 (%)
Figure 35 Phase IV Market Forecast by Region, 2023-2033 (US$ Billion)
Figure 36 Phase IV Market Share Forecast by Region, 2023 & 2033 (%)
Figure 37 Clinical Trials Support Services Market Forecast by Sponsor: Market Attractiveness Index
Figure 38 Clinical Trials Support Services Market Forecast by Sponsor, 2023-2033 (US$ Billion)
Figure 39 Clinical Trials Support Services Market Share Forecast by Sponsor, 2023, 2028, 2033 (%)
Figure 40 Pharmaceutical & Biopharmaceutical Companies Market Forecast by Region, 2023-2033 (US$ Billion)
Figure 41 Pharmaceutical & Biopharmaceutical Companies Market Share Forecast by Region, 2023 & 2033 (%)
Figure 42 Medical Device Manufacturers Market Forecast by Region, 2023-2033 (US$ Billion)
Figure 43 Medical Device Manufacturers Market Share Forecast by Region, 2023 & 2033 (%)
Figure 44 Others Market Forecast by Region, 2023-2033 (US$ Billion)
Figure 45 Others Market Share Forecast by Region, 2023 & 2033 (%)
Figure 46 Clinical Trials Support Services Market Forecast by Region 2023 & 2033 (Revenue, CAGR%)
Figure 47 Clinical Trials Support Services Market Share Forecast by Region 2023, 2028, 2033(%)
Figure 48 Clinical Trials Support Services Market by Region, 2023-2033 (US$ Billion, AGR (%), CAGR (%))
Figure 49 North America Clinical Trials Support Services Market Attractiveness Index
Figure 50 North America Clinical Trials Support Services Market by Region, 2023, 2028 & 2033 (US$ Billion)
Figure 51 North America Clinical Trials Support Services Market Forecast by Country, 2023-2033 (US$ Billion)
Figure 52 North America Clinical Trials Support Services Market Share Forecast by Country, 2023 & 2033 (%)
Figure 53 North America Clinical Trials Support Services Market Forecast by Service, 2023-2033 (US$ Billion)
Figure 54 North America Clinical Trials Support Services Market Share Forecast by Service, 2023 & 2033 (%)
Figure 55 North America Clinical Trials Support Services Market Forecast by Phase, 2023-2033 (US$ Billion
Figure 56 North America Clinical Trials Support Services Market Share Forecast by Phase, 2023 & 2033 (%)
Figure 57 North America Clinical Trials Support Services Market Forecast by Sponsor, 2023-2033 (US$ Billion)
Figure 58 North America Clinical Trials Support Services Market Share Forecast by Sponsor, 2023 & 2033 (%)
Figure 59 U.S. Clinical Trials Support Services Market Forecast, 2023-2033 (US$ Billion, AGR %)
Figure 60 Canada Clinical Trials Support Services Market Forecast, 2023-2033 (US$ Billion, AGR %)
Figure 61 Europe Clinical Trials Support Services Market Attractiveness Index
Figure 62 Europe Clinical Trials Support Services Market by Region, 2023, 2028 & 2033 (US$ Billion)
Figure 63 Europe Clinical Trials Support Services Market Forecast by Country, 2023-2033 (US$ Billion)
Figure 64 Europe Clinical Trials Support Services Market Share Forecast by Country, 2023 & 2033 (%)
Figure 65 Europe Clinical Trials Support Services Market Forecast by Service, 2023-2033 (US$ Billion
Figure 66 Europe Clinical Trials Support Services Market Share Forecast by Service, 2023 & 2033 (%)
Figure 67 Europe Clinical Trials Support Services Market Forecast by Phase, 2023-2033 (US$ Billion)
Figure 68 Europe Clinical Trials Support Services Market Share Forecast by Phase, 2023 & 2033 (%)
Figure 69 Europe Clinical Trials Support Services Market Forecast by Sponsor, 2023-2033 (US$ Billion)
Figure 70 Europe Clinical Trials Support Services Market Share Forecast by Sponsor, 2023 & 2033 (%)
Figure 71 Germany Clinical Trials Support Services Market Forecast, 2023-2033 (US$ Billion, AGR %)
Figure 72 France Clinical Trials Support Services Market Forecast, 2023-2033 (US$ Billion, AGR %)
Figure 73 UK Clinical Trials Support Services Market Forecast, 2023-2033 (US$ Billion, AGR %)
Figure 74 Italy Clinical Trials Support Services Market Forecast, 2023-2033 (US$ Billion, AGR %)
Figure 75 Spain Clinical Trials Support Services Market Forecast, 2023-2033 (US$ Billion, AGR %)
Figure 76 Rest of Europe Clinical Trials Support Services Market Forecast, 2023-2033 (US$ Billion, AGR %)
Figure 77 Asia Pacific Clinical Trials Support Services Market Attractiveness Index
Figure 78 Asia Pacific Clinical Trials Support Services Market by Region, 2023, 2028 & 2033 (US$ Billion)
Figure 79 Asia Pacific Clinical Trials Support Services Market Forecast by Country, 2023-2033 (US$ Billion)
Figure 80 Asia Pacific Clinical Trials Support Services Market Share Forecast by Country, 2023 & 2033 (%)
Figure 81 Asia Pacific Clinical Trials Support Services Market Forecast by Service, 2023-2033 (US$ Billion
Figure 82 Asia Pacific Clinical Trials Support Services Market Share Forecast by Service, 2023 & 2033 (%)
Figure 83 Asia Pacific Clinical Trials Support Services Market Forecast by Phase, 2023-2033 (US$ Billion)
Figure 84 Asia Pacific Clinical Trials Support Services Market Share Forecast by Phase, 2023 & 2033 (%)
Figure 85 Asia Pacific Clinical Trials Support Services Market Forecast by Sponsor, 2023-2033 (US$ Billion)
Figure 86 Asia Pacific Clinical Trials Support Services Market Share Forecast by Sponsor, 2023 & 2033 (%)
Figure 87 China Clinical Trials Support Services Market Forecast, 2023-2033 (US$ Billion, AGR %)
Figure 88 Japan Clinical Trials Support Services Market Forecast, 2023-2033 (US$ Billion, AGR %)
Figure 89 India Clinical Trials Support Services Market Forecast, 2023-2033 (US$ Billion, AGR %)
Figure 90 Australia Clinical Trials Support Services Market Forecast, 2023-2033 (US$ Billion, AGR %)
Figure 91 South Korea Clinical Trials Support Services Market Forecast, 2023-2033 (US$ Billion, AGR %)
Figure 92 Rest of Asia Pacific Clinical Trials Support Services Market Forecast, 2023-2033 (US$ Billion, AGR %)
Figure 93 Latin America Clinical Trials Support Services Market Attractiveness Index
Figure 94 Latin America Clinical Trials Support Services Market by Region, 2023, 2028 & 2033 (US$ Billion)
Figure 95 Latin America Clinical Trials Support Services Market Forecast by Country, 2023-2033 (US$ Billion)
Figure 96 Latin America Clinical Trials Support Services Market Share Forecast by Country, 2023 & 2033 (%)
Figure 97 Latin America Clinical Trials Support Services Market Forecast by Service, 2023-2033 (US$ Billion
Figure 98 Latin America Clinical Trials Support Services Market Share Forecast by Service, 2023 & 2033 (%)
Figure 99 Latin America Clinical Trials Support Services Market Forecast by Phase, 2023-2033 (US$ Billion)
Figure 100 Latin America Clinical Trials Support Services Market Share Forecast by Phase, 2023 & 2033 (%)
Figure 101 Latin America Clinical Trials Support Services Market Forecast by Sponsor, 2023-2033 (US$ Billion)
Figure 102 Latin America Clinical Trials Support Services Market Share Forecast by Sponsor, 2023 & 2033 (%)
Figure 103 Brazil Clinical Trials Support Services Market Forecast, 2023-2033 (US$ Billion, AGR %)
Figure 104 Mexico Clinical Trials Support Services Market Forecast, 2023-2033 (US$ Billion, AGR %)
Figure 105 Rest of Latin America Clinical Trials Support Services Market Forecast, 2023-2033 (US$ Billion, AGR %)
Figure 106 MEA Clinical Trials Support Services Market Attractiveness Index
Figure 107 MEA Clinical Trials Support Services Market by Region, 2023, 2028 & 2033 (US$ Billion)
Figure 108 MEA Clinical Trials Support Services Market Forecast by Country, 2023-2033 (US$ Billion)
Figure 109 MEA Clinical Trials Support Services Market Share Forecast by Country, 2023 & 2033 (%)
Figure 110 MEA Clinical Trials Support Services Market Forecast by Service, 2023-2033 (US$ Billion)
Figure 111 MEA Clinical Trials Support Services Market Share Forecast by Service, 2023 & 2033 (%)
Figure 112 MEA Clinical Trials Support Services Market Forecast by Phase, 2023-2033 (US$ Billion)
Figure 113 MEA Clinical Trials Support Services Market Share Forecast by Phase, 2023 & 2033 (%)
Figure 114 MEA Clinical Trials Support Services Market Forecast by Sponsor, 2023-2033 (US$ Billion)
Figure 115 MEA Clinical Trials Support Services Market Share Forecast by Sponsor, 2023 & 2033 (%)
Figure 116 GCC Clinical Trials Support Services Market Forecast, 2023-2033 (US$ Billion, AGR %)
Figure 117 South Africa Clinical Trials Support Services Market Forecast, 2023-2033 (US$ Billion, AGR %)
Figure 118 Rest of MEA Clinical Trials Support Services Market Forecast, 2023-2033 (US$ Billion, AGR %)
Figure 119 Clinical Trials Support Services Market: Company Share Analysis, 2022
Figure 120 Thermo Fisher Scientific Inc: Net Revenue, 2018-2022 (US$ million, AGR%)
Figure 121 Thermo Fisher Scientific Inc: Regional Market Shares, 2022
Figure 122 Eurofins Scientific: Net Revenue, 2018-2022 (US$ million, AGR%)
Figure 123 Eurofins Scientific: Regional Market Shares, 2022
Figure 124 IQVIA Inc: Annual Revenue, 2018-2022 (US$ million, AGR%)
Figure 125 IQVIA Inc: Regional Market Shares, 2022
Figure 126 IQVIA Inc: R&D Expense, 2018-2022 (US$ million, AGR%)
Figure 127 WuXi AppTec: Annual Revenue, 2019-2022 (US$ million, AGR%)
Figure 128 WuXi AppTec: Regional Market Shares, 2022
Figure 129 Laboratory Corporation of America: Revenue, 2018-2022 (US$ Million, AGR%)
Figure 130 Laboratory Corporation of America: Regional Market Shares, 2022
Figure 131 ICON plc: Revenue, 2018-2022 (US$ Billion, AGR%)
Figure 132 ICON plc: Regional Market Shares, 2022
ページTOPに戻る
本レポートと同分野(医療IT)の最新刊レポート
- 経カテーテル大動脈弁置換市場 - 世界の産業分析、規模、シェア、成長、動向、2032年予測 - 製品別, 技術別, グレード別, 用途別, エンドユーザー別, 地域別: (北米, 欧州, アジア太平洋, 中南米, 中東アフリカ)
- 乳房病変局在化法市場 - 世界の産業分析、規模、シェア、成長、動向、2032年予測 - 製品別、技術別、グレード別、用途別、エンドユーザー別、地域別:(北米、欧州、アジア太平洋地域、中南米、中東・アフリカ)
- 下肢補綴市場 - 世界の産業分析、規模、シェア、成長、動向、2032年予測 - 製品別, 技術別, グレード別, 用途別, エンドユーザー別, 地域別: (北米, 欧州, アジア太平洋, 中南米, 中東アフリカ)
- 血中ケトン測定器市場 - 世界の産業分析、市場規模、シェア、成長、動向、2032年予測 - 製品別、技術別、グレード別、用途別、エンドユーザー別、地域別:(北米、欧州、アジア太平洋、中南米、中東アフリカ)
- 炎症性腸疾患市場 - 世界の産業分析、規模、シェア、成長、動向、2032年予測 - 製品別, 技術別, グレード別, 用途別, エンドユーザー別, 地域別:(北米, 欧州, アジア太平洋, 中南米, 中東アフリカ)
- ウェアラブル血圧モニタリングデバイス市場 - 世界の産業分析、規模、シェア、成長、動向、2032年予測 - 製品別, 技術別, グレード別, 用途別, エンドユーザー別, 地域別: (北米, 欧州, アジア太平洋, 中南米, 中東アフリカ)
- 経皮皮膚パッチ市場 - 世界の産業分析、規模、シェア、成長、動向、2032年予測 - 製品別、技術別、グレード別、用途別、エンドユーザー別、地域別:(北米、欧州、アジア太平洋地域、中南米、中東・アフリカ)
- 欧州脳卒中診断市場 - 産業分析、規模、シェア、成長、動向、2032年予測 - 製品別、技術別、グレード別、用途別、エンドユーザー別、地域別:(ヨーロッパ)
- 結核診断薬市場 - 世界の産業分析、規模、シェア、成長、動向、2032年予測 - 製品別, 技術別, グレード別, 用途別, エンドユーザー別, 地域別:(北米, 欧州, アジア太平洋, 中南米, 中東アフリカ)
- サル痘(mpox)診断市場 - 世界の産業分析、市場規模、シェア、成長、動向、2032年予測 - 製品別、技術別、グレード別、用途別、エンドユーザー別、地域別:(北米、欧州、アジア太平洋地域、中南米、中東・アフリカ)
Visiongain社のヘルスケアと医薬・化学品分野での最新刊レポート
本レポートと同じKEY WORD(clinical trial)の最新刊レポート
よくあるご質問
Visiongain社はどのような調査会社ですか?
英国の調査会社ヴィジョンゲイン社(Visiongain)は、通信とエネルギーのほか、自動車や化学・医薬品、金属など、広範な市場を対象に調査を行っています。自動車市場については、市場全般に関する調査のほ... もっと見る
調査レポートの納品までの日数はどの程度ですか?
在庫のあるものは速納となりますが、平均的には 3-4日と見て下さい。
但し、一部の調査レポートでは、発注を受けた段階で内容更新をして納品をする場合もあります。
発注をする前のお問合せをお願いします。
注文の手続きはどのようになっていますか?
1)お客様からの御問い合わせをいただきます。
2)見積書やサンプルの提示をいたします。
3)お客様指定、もしくは弊社の発注書をメール添付にて発送してください。
4)データリソース社からレポート発行元の調査会社へ納品手配します。
5) 調査会社からお客様へ納品されます。最近は、pdfにてのメール納品が大半です。
お支払方法の方法はどのようになっていますか?
納品と同時にデータリソース社よりお客様へ請求書(必要に応じて納品書も)を発送いたします。
お客様よりデータリソース社へ(通常は円払い)の御振り込みをお願いします。
請求書は、納品日の日付で発行しますので、翌月最終営業日までの当社指定口座への振込みをお願いします。振込み手数料は御社負担にてお願いします。
お客様の御支払い条件が60日以上の場合は御相談ください。
尚、初めてのお取引先や個人の場合、前払いをお願いすることもあります。ご了承のほど、お願いします。
データリソース社はどのような会社ですか?
当社は、世界各国の主要調査会社・レポート出版社と提携し、世界各国の市場調査レポートや技術動向レポートなどを日本国内の企業・公官庁及び教育研究機関に提供しております。
世界各国の「市場・技術・法規制などの」実情を調査・収集される時には、データリソース社にご相談ください。
お客様の御要望にあったデータや情報を抽出する為のレポート紹介や調査のアドバイスも致します。
|
|

