眼科医薬品受託製造市場レポート:2023-2033年
Ophthalmic Drugs Contract Manufacturing Market Report 2023-2033
レポート詳細
眼科医薬品受託製造市場レポート 2023-2033年 : 本レポートは、業界とその基礎となる原動力をより良く理解することを望むなら、新たな収益ポケットを目指す大手企業にとって貴重なもの... もっと見る
※上記価格は部署ライセンス(Departmental licence)価格です。
その他の価格についてはデータリソースまでお問合せください。
日本語のページは自動翻訳を利用し作成しています。
実際のレポートは英文のみでご納品いたします。
サマリー
レポート詳細
眼科医薬品受託製造市場レポート 2023-2033年: 本レポートは、業界とその基礎となる原動力をより良く理解することを望むなら、新たな収益ポケットを目指す大手企業にとって貴重なものとなるでしょう。異業種への進出や新規地域での既存事業の拡大を目指す企業にも有用です。
眼科疾患の有病率の増加やCDMOが提供するコスト効率などが市場成長を後押ししている。
製薬業界における眼科医薬品受託製造市場の拡大と重要性を支える重要な要素がいくつかある。主な原因のひとつは、加齢黄斑変性症(AMD)、緑内障、白内障、ドライアイ症候群などの眼疾患の発症率が上昇していることである。製薬会社は、高齢化人口の増加や生活習慣の変化に伴い、これらの眼疾患を治療・維持するための効果的な医薬品の必要性が高まる中、効果的な医薬品製造ソリューションを模索している。
また、CDMOに製造を委託することで、製薬企業は研究やマーケティングなどの中核機能に集中することができる。この戦略的パートナーシップにより、眼科用医薬品が市場に出回るまでの時間が短縮され、医薬品開発プロセスが合理化される。CDMOが使用する最新技術と強力な品質管理手順は、市場のニーズと規制要件を満たす高品質の医薬品を生み出すことを保証する。
新しい医薬品を開発するためには、スタッフ、施設、設備に多額の資金を投入する必要があるため、経済的効果がCDMOサービスを採用する主な要因の一つとなっている。企業は、CDMOへのアウトソーシングを通じて、全体的なコストと人件費を削減したいと考えている。
CDMOはすでに必要な資源と知識を持っており、医薬品を製造することで、投資家にとってより安価で、より少ないリスクで済む。
複雑な規制の枠組みが眼科薬受託製造市場の課題となる可能性
規制基準の不遵守や医薬品の品質低下は、ビジネスやそのブランドの評判に深刻な結果をもたらす可能性があります。そのため、製薬業界では規制ルールの遵守が極めて重要です。開発・製造受託機関(CDMOs)は、特に眼科用医薬品の受託製造業界において、地域や国によって異なる規制要件を確実に遵守するという課題に直面しています。
製薬企業が眼科用医薬品に特化したCDMOsに医薬品製造を委託すると、多様な規制の枠組みが複雑に絡み合うことになります。各地域には、眼科用医薬品の製造と流通のさまざまな側面を管理する独自のガイドライン、基準、手順があります。これには品質管理、安全性評価、表示、包装、流通業務などが含まれます。このような独自の要件に対応するためには、製造委託先がサービスを提供する市場特有の規制を完全に遵守するよう、細心の注意を払う必要がある。この側面は、今後数年間の医薬品CDMO市場の拡大を制限する可能性がある。
市場調査レポートを購入する前にすべき質問とは?
- 眼科医薬品受託製造市場はどのように進化しているのか?
- 眼科医薬品受託製造市場の推進要因と阻害要因は何か?
- 眼科医薬品受託製造サブマーケットの各セグメントは予測期間中にどのように成長し、2033年にはどれくらいの売上を占めるようになるのか?
- 2023年から2033年にかけて、眼科医薬品受託製造の各サブマーケットの市場シェアはどのように推移するのか?
- 2023年から2033年にかけて、市場全体を牽引する主な要因は何か?
- 主要な眼科医薬品受託製造市場はマクロ経済の動きに概ね追随するのか、それとも個々の国市場が他を凌駕するのか?
- 2033年までに各国市場のシェアはどのように変化し、2033年に市場をリードするのはどの地域か?
- 主要プレーヤーは誰で、予測期間中の見通しは?
- 2023年から2033年の間に、業界はどのように発展していくのか?現在および今後10年間に行われる眼科医薬品受託製造プロジェクトにはどのような意味があるのか?
- 眼科医薬品受託製造市場をさらに拡大するために、製品の商業化の必要性は高まっていますか?
- 眼科医薬品受託製造市場はどこに向かっているのか、そしてどのようにすれば市場の最前線に立つことができるのか?
- 新製品やサービスラインへの最適な投資方法とは?
- 企業を新たな成長軌道に乗せ、C-suiteに移行させるための重要な展望とは?
眼科薬受託製造市場が現在、そして今後10年間でどのような影響を受けるかを知る必要がある:
- 334ページにわたる本レポートでは、122の表、174の図表を掲載しています。
- 本レポートでは、業界における主要な有利分野を取り上げているため、今すぐターゲットを絞ることができます。
- 世界、地域、国の売上と成長に関する詳細な分析が含まれています。
- 競合他社が成功した主なトレンド、変化、収益予測をハイライトしています。
本レポートは、眼科医薬品受託製造市場が今後10年間でどのように発展するか、またCOVID-19の景気後退と回復の変動に合わせてどのように発展するかをお伝えします。この市場は過去10年間のどの時点よりも今が重要です。
2033年までの予測やその他の分析から、商業的な展望が明らかになる
- 2033年までの収益予測に加え、直近の業績、成長率、市場シェアもご覧いただけます。
- ビジネスの展望と展開に関する独自の分析をご覧いただけます。
- 定性的分析(市場ダイナミクス、促進要因、機会、阻害要因、課題を含む)、コスト構造、眼科医薬品受託製造価格上昇の影響、最近の動向をご覧いただけます。
本レポートには、COVID-19が業界と貴社にどのような影響を与えるかについてのデータ分析と貴重な洞察が含まれている。本レポートでは、COVID-19の4つの回収パターンとその影響、すなわち「V」、「L」、「W」、「U」について論じている。
レポート対象セグメント
製品タイプ
- API
- FDF
一次包装タイプ
- アンプル&バイアル
- ガラス&プラスチックボトル
- 軟膏チューブ
- その他
製造規模
- 前臨床
- 臨床
- 商業
企業規模
- 小規模
- 中規模
- 大規模
適応症
- 加齢黄斑変性
- 緑内障
- ぶどう膜炎
- ドライアイ
- その他
世界市場全体とセグメント別の収益予測に加え、4つの地域と20の主要国市場の収益予測も掲載しています:
北米
- アメリカ
- カナダ
欧州
- ドイツ
- スペイン
- 英国
- フランス
- イタリア
- その他の欧州
アジア太平洋
- 中国
- 日本
- インド
- オーストラリア
- 韓国
- その他のアジア太平洋地域
ラテンアメリカ
- ブラジル
- メキシコ
- その他のラテンアメリカ
MEA
- GCC諸国
- 南アフリカ
- その他のMEA
また、2023年から2033年までの眼科医薬品受託製造市場における主要企業のプロファイルも掲載しています。
主要企業と市場成長の可能性
・ Abbvie Inc.
・ Catalent Inc.
・ Eurofins Scientific
・ Glenmark Pharmaceuticals
・ Jubilant HollisterStier LLC
・ Laboratorios Salvat, S.A.
・ Lonza
・ Merck KGaA
・ Pillar5 Pharma
・ Recipharm
・ Siegfried Holding AG
・ Thermo Fisher Scientific Inc.
・ Unither Pharmaceuticals
2023年から2033年にかけての眼科用医薬品受託製造市場全体の世界売上高は、金額ベースで2022年に36億8,340万米ドルを突破するとの試算がある。2033年まで売上は力強く成長すると予測している。当研究所では、最も大きな可能性を秘めた組織を特定している。彼らの能力、進歩、商業的展望を発見し、一歩先を行くお手伝いをします。
眼科用医薬品の受託製造市場、2023-2033年レポートはどのようにお役に立ちますか?
要約すると、330ページを超えるこのレポートは、以下のような知識を提供する:
- 眼科医薬品受託製造市場の2023年から2033年までの収益予測 世界および地域レベルで、提供形態、臨床試験フェーズ、治療分野、エンドユーザー、企業規模の各予測を掲載 - 業界の展望を発見し、投資と収益に最も有利な場所を見つけます。
- 5つの地域と20の主要国市場の2033年までの収益予測 - 眼科医薬品受託製造市場、2023年から2033年までの北米、欧州、アジア太平洋、ラテンアメリカ、MEAの市場予測をご覧ください。また、米国、カナダ、メキシコ、ブラジル、ドイツ、フランス、英国、イタリア、中国、インド、日本、オーストラリアなどの主要国の市場も予測しています。
- 既に市場に参入している企業やこれから参入しようとする企業の展望 - 眼科医薬品受託製造市場に参入している主要企業10社の企業プロファイルを含む、2023年から2033年までの展望。
独自の予測による定量的・定性的分析をご覧ください。私たちのレポートだけに含まれる情報を入手し、貴重なビジネスインテリジェンスで情報を得ることができます。
他にはない情報
私たちの新しいレポートがあれば、知識に遅れをとったり、チャンスを逃したりする可能性が低くなります。Visiongainのレポートが貴社の調査、分析、意思決定にどのように役立つかをご覧ください。Visiongainの調査は、眼科医薬品受託製造市場、2023年から2033年、市場をリードする企業の商業分析を必要とするすべての人のためのものです。データ、トレンド、予測をご覧いただけます。
ページTOPに戻る
目次
目次
1 レポート概要
1.1 研究の目的
1.2 眼科医薬品受託製造市場の紹介
1.3 本レポートの内容
1.4 本レポートを読むべき理由
1.5 本分析レポートが回答する主な質問
1.6 本レポートの対象者
1.7 方法論
1.7.1 市場の定義
1.7.2 市場評価・予測手法
1.7.3 データの検証
1.7.3.1 一次調査
1.7.3.2 セカンダリーリサーチ
1.8 よくある質問(FAQ)
1.9 Visiongainの関連レポート
1.10 Visiongainについて
2 エグゼクティブ・サマリー
3 市場概要
3.1 主要な調査結果
3.2 市場ダイナミクス
3.2.1 市場牽引要因
3.2.1.1 自社薬剤開発コストの高さが市場成長を促進する可能性が高い
3.2.1.2 眼科疾患の有病率の増加
3.2.1.3 全体的なコストと時間の削減
3.2.1.4 サプライチェーン問題の緩和とコアコンピテンシーに集中するための帯域幅
3.2.2 市場抑制要因
3.2.2.1 地域によって異なる規制要件
3.2.2.2 シリアル化の導入
3.2.3 市場機会
3.2.3.1 新興市場における成長
3.2.3.2 拡張性と柔軟な生産能力
3.2.3.3 ニッチ市場と後期段階でのカスタマイズに特化したサービス
3.2.3.4 優れたAI、eプラットフォーム、リアルタイム、リモートトレースによるプロセス改善
3.3 COVID-19インパクト分析
3.4 ポーターのファイブフォース分析
3.4.1 サプライヤーの交渉力(中)
3.4.2 買い手の交渉力(中~高)
3.4.3 競争力(高)
3.4.4 代替品による脅威(中)
3.4.5 新規参入企業の脅威(高)
3.5 PEST分析
3.5.1 政治的要因
3.5.2 経済
3.5.3 社会
3.5.4 技術的
4眼科医薬品受託製造市場分析:製品タイプ別
4.1 主要な調査結果
4.2 製品タイプ別セグメント 市場魅力度指数
4.3 製品タイプ別眼科医薬品受託製造市場規模推定と予測
4.4 原薬
4.4.1 2023〜2033年の地域別市場規模(US$ Million)
4.4.2 地域別市場シェア、2023年・2033年(%)
4.5 FDF
4.5.1 2023~2033年の地域別市場規模(US$ Million)
4.5.2 地域別市場シェア、2023年・2033年(%)
4.5.3 眼科医薬品受託製造におけるFDFの製品タイプ別市場規模推定と予測
5 眼科医薬品受託製造市場分析:一次包装別
5.1 主要調査結果
5.2 一次包装セグメント 市場魅力度指数
5.3 一次包装別の眼科医薬品受託製造市場規模推定と予測
5.4 アンプルとバイアル
5.4.1 2023〜2033年の地域別市場規模(US$ Million)
5.4.2 地域別市場シェア、2023年・2033年(%)
5.5 ガラス&プラスチックボトル
5.5.1 2023~2033年の地域別市場規模(US$ Million)
5.5.2 地域別市場シェア、2023年・2033年(%)
5.6 軟膏チューブ
5.6.1 2023~2033年の地域別市場規模(US$ Million)
5.6.2 地域別市場シェア、2023年・2033年(%)
5.7 その他
5.7.1 2023〜2033年の地域別市場規模(US$ Million)
5.7.2 地域別市場シェア、2023年・2033年 (%)
6 眼科医薬品受託製造市場分析:製造規模別
6.1 主な調査結果
6.2 製造規模セグメント 市場魅力度指数
6.3 眼科医薬品受託製造の製造規模別市場規模の推定と予測
6.4 前臨床
6.4.1 2023〜2033年の地域別市場規模(US$ Million)
6.4.2 地域別市場シェア、2023年・2033年(%)
6.5 臨床
6.5.1 2023〜2033年の地域別市場規模(US$ Million)
6.5.2 地域別市場シェア、2023年・2033年(%)
6.6 商業
6.6.1 2023〜2033年の地域別市場規模(US$ Million)
6.6.2 地域別市場シェア、2023年・2033年(%)
7 眼科医薬品受託製造市場分析:企業規模別
7.1 主要調査結果
7.2 企業規模別セグメント 市場魅力度指数
7.3 企業規模別眼科医薬品受託製造市場規模推定と予測
7.4 規模別
7.4.1 2023〜2033年の地域別市場規模(US$ Million)
7.4.2 地域別市場シェア、2023年・2033年(%)
7.5 中型
7.5.1 2023~2033年の地域別市場規模(US$ Million)
7.5.2 地域別市場シェア、2023年・2033年(%)
7.6 大型
7.6.1 2023〜2033年の地域別市場規模(US$ Million)
7.6.2 地域別市場シェア、2023年・2033年 (%)
8 眼科医薬品受託製造市場分析:適応症別
8.1 主要な調査結果
8.2 適応症セグメント 市場魅力度指数
8.3 眼科医薬品受託製造の適応症別市場規模推定と予測
8.4 加齢黄斑変性症
8.4.1 2023〜2033年の地域別市場規模(US$ Million)
8.4.2 地域別市場シェア、2023年・2033年(%)
8.5 緑内障
8.5.1 2023〜2033年の地域別市場規模(US$ Million)
8.5.2 地域別市場シェア、2023年・2033年(%)
8.6 ぶどう膜炎
8.6.1 2023〜2033年の地域別市場規模(US$ Million)
8.6.2 地域別市場シェア、2023年・2033年(%)
8.7 ドライアイ
8.7.1 2023〜2033年の地域別市場規模(US$ Million)
8.7.2 地域別市場シェア、2023年・2033年(%)
8.8 その他
8.8.1 2023〜2033年の地域別市場規模(US$ Million)
8.8.2 地域別市場シェア、2023年~2033年 (%)
9 眼科医薬品受託製造市場分析:地域別
9.1 主要な調査結果
9.2 地域別市場規模の推定と予測
10 北米の眼科医薬品受託製造市場の分析
10.1 主要な調査結果
10.2 北米の眼科医薬品受託製造市場魅力度指数
10.3 北米の眼科医薬品受託製造市場:国別、2023年、2028年、2033年(US$ Million)
10.4 北米の眼科医薬品受託製造市場規模推定と予測:国別
10.5 北米の眼科医薬品受託製造市場規模推定と予測:製品タイプ別
10.5.1 北米のFDFs眼科医薬品受託製造市場規模推定と予測:製品タイプ別
10.6 北米の眼科医薬品受託製造市場規模推定と予測:一次包装別
10.7 北米の眼科医薬品受託製造市場規模推定と予測:製造規模別
10.8 北米の眼科医薬品受託製造市場規模推定と予測:企業規模別
10.9 北米の眼科医薬品受託製造市場規模推定と予測:適応症別
10.10 米国の眼科医薬品受託製造市場分析
10.11 カナダの眼科医薬品受託製造市場分析
11 欧州の眼科医薬品受託製造市場分析
11.1 主要な調査結果
11.2 欧州の眼科医薬品受託製造市場魅力度指数
11.3 欧州の眼科医薬品受託製造市場:国別、2023年、2028年、2033年(US$ Million)
11.4 欧州の眼科医薬品受託製造市場規模推定と予測国別
11.5 欧州の眼科医薬品受託製造市場規模推定と予測:製品タイプ別
11.5.1 欧州のFDFs眼科医薬品受託製造市場規模推定と予測:製品タイプ別
11.6 欧州の眼科医薬品受託製造市場規模推定と予測:一次包装別
11.7 欧州の眼科医薬品受託製造市場規模推定と予測:製造規模別
11.8 欧州の眼科医薬品受託製造市場規模推定と予測:企業規模別
11.9 欧州の眼科医薬品受託製造市場規模推定と予測:適応症別
11.10 ドイツの眼科医薬品受託製造市場分析
11.11 イギリスの眼科医薬品受託製造市場分析
11.12 フランスの眼科医薬品受託製造市場分析
11.13 イタリアの眼科医薬品受託製造市場分析
11.14 スペインの眼科医薬品受託製造市場分析
11.15 その他の欧州の眼科医薬品受託製造市場分析
12 アジア太平洋地域の眼科医薬品受託製造市場分析
12.1 主要な調査結果
12.2 アジア太平洋地域の眼科医薬品受託製造市場魅力度指数
12.3 アジア太平洋地域の眼科医薬品受託製造市場:国別、2023年、2028年、2033年(US$ Million)
12.4 アジア太平洋地域の眼科医薬品受託製造市場規模推定と予測:国別
12.5 アジア太平洋地域の眼科医薬品受託製造市場規模推定と予測:製品タイプ別
12.5.1 アジア太平洋地域のFDFs眼科医薬品受託製造市場規模推定と予測:製品タイプ別
12.6 アジア太平洋地域の眼科医薬品受託製造市場規模推定と予測:一次包装別
12.7 アジア太平洋地域の眼科医薬品受託製造市場規模推定と予測:製造規模別
12.8 アジア太平洋地域の眼科医薬品受託製造市場規模推定と予測:企業規模別
12.9 アジア太平洋地域の眼科医薬品受託製造市場規模推定と予測:適応症別
12.10 日本の眼科医薬品受託製造市場分析
12.11 中国の眼科医薬品受託製造市場分析
12.12 インドの眼科医薬品受託製造市場分析
12.13 オーストラリアの眼科医薬品受託製造市場分析
12.14 韓国の眼科医薬品受託製造市場分析
12.15 その他のアジア太平洋地域の眼科医薬品受託製造市場分析
13 ラテンアメリカの眼科医薬品受託製造市場分析
13.1 主要な調査結果
13.2 ラテンアメリカの眼科医薬品受託製造市場魅力度指数
13.3 ラテンアメリカの眼科医薬品受託製造市場:国別、2023年、2028年、2033年(US$ Million)
13.4 ラテンアメリカの眼科医薬品受託製造市場規模推定と予測:国別
13.5 ラテンアメリカの眼科医薬品受託製造市場市場規模推定と予測:製品タイプ別
13.5.1 ラテンアメリカのFDFs眼科医薬品受託製造市場規模推定と予測:製品タイプ別
13.6 ラテンアメリカの眼科医薬品受託製造市場規模推定と予測:一次包装別
13.7 ラテンアメリカの眼科医薬品受託製造市場規模推定と予測:製造規模別
13.8 ラテンアメリカの眼科医薬品受託製造市場規模推定と予測:企業規模別
13.9 ラテンアメリカの眼科医薬品受託製造市場規模推定と予測:適応症別
13.10 ブラジルの眼科医薬品受託製造市場分析
13.11 メキシコの眼科医薬品受託製造市場分析
13.12 その他のラテンアメリカの眼科医薬品受託製造市場分析
14 MEAの眼科医薬品受託製造市場分析
14.1 主要な調査結果
14.2 MEAの眼科医薬品受託製造市場魅力度指数
14.3 MEAの眼科医薬品受託製造市場:国別2023年、2028年、2033年(US$ Million)
14.4 MEAの眼科医薬品受託製造市場規模推定と予測:国別
14.5 MEAの眼科医薬品受託製造市場規模推定と予測:製品タイプ別
14.5.1 MEAのFDFs眼科医薬品受託製造市場規模推定と予測:製品タイプ別
14.6 MEAの眼科医薬品受託製造市場規模推定と予測:一次包装別
14.7 MEAの眼科医薬品受託製造市場規模推定と予測:製造規模別
14.8 MEAの眼科医薬品受託製造市場規模推定と予測:企業規模別
14.9 MEAの眼科医薬品受託製造市場規模推定と予測:適応症別
14.10 GCCの眼科医薬品受託製造市場分析
14.11 南アフリカの眼科医薬品受託製造市場分析
14.12 その他のMEAの眼科医薬品受託製造市場分析
15 会社概要
15.1 競争環境、2022年
15.2 戦略的展望
15.3 Lonza
15.3.1 会社概要
15.3.2 会社概要
15.3.3 財務分析
15.3.3.1 純収入、2018-2022年
15.3.3.2 R&D、2018-2022年
15.3.4 提供サービス
15.3.5 戦略的展望
15.4 Recipharm
15.4.1 会社概要
15.4.2 会社概要
15.4.3 財務分析
15.4.3.1 純収入、2018-2022年
15.4.4 提供サービス
15.4.5 戦略的展望
15.5 Catalent Inc.
15.5.1 会社概要
15.5.2 会社概要
15.5.3 財務分析
15.5.3.1 純収入、2018-2022年
15.5.3.2 R&D、2018年〜2022年
15.5.3.3 地域市場シェア、2022年
15.5.4 提供サービス
15.5.5 戦略的展望
15.6 Eurofins Scientific
15.6.1 会社概要
15.6.2 会社概要
15.6.3 財務分析
15.6.3.1 純収入、2018-2022年
15.6.3.2 地域市場シェア、2022年
15.6.4 提供サービス
15.6.5 戦略的展望
15.7 Thermo Fisher Scientific Inc.
15.7.1 会社概要
15.7.2 会社概要
15.7.3 財務分析
15.7.3.1 純収入、2018-2022年
15.7.3.2 地域市場シェア、2022年
15.7.4 提供サービス
15.7.5 戦略的展望
15.8 Unither Pharmaceuticals
15.8.1 会社概要
15.8.2 会社概要
15.8.3 提供サービス
15.8.4 戦略的展望
15.9 Laboratorios Salvat, S.A.
15.9.1 会社概要
15.9.2 会社概要
15.9.3 提供サービス
15.9.4 戦略的展望
15.10 Siegfried Holding AG
15.10.1 会社概要
15.10.2 会社概要
15.10.3 財務分析
15.10.3.1 純収入、2018-2022年
15.10.3.2 R&D、2018年~2022年
15.10.4 提供サービス
15.10.5 戦略的展望
15.11 Pillar5 Pharma
15.11.1 会社概要
15.11.2 会社概要
15.11.3 提供サービス
15.11.4 戦略的展望
15.12 Abbvie Inc.
15.12.1 会社概要
15.12.2 会社概要
15.12.3 サービス提供
15.12.4 戦略的展望
15.13 Jubilant HollisterStier LLC
15.13.1 会社概要
15.13.2 会社概要
15.13.3 サービス提供
15.13.4 戦略的展望
15.14 Glenmark Pharmaceuticals
15.14.1 会社概要
15.14.2 会社概要
15.14.3 財務分析
15.14.3.1 純収入、2018-2022年
15.14.3.2 R&D、2021-2022年
15.14.4 製品ベンチマーク
15.15 Merck KGaA
15.15.1 会社概要
15.15.2 会社概要
15.15.3 財務分析
15.15.3.1 純収入、2018-2022年
15.15.3.2 R&D、2018年〜2022年
15.15.3.3 地域市場シェア、2022年
15.15.4 サービス提供
15.15.5 戦略的展望
16 結論と提言
16.1 Visiongainからの結びの言葉
16.2 市場プレイヤーへの提言
ページTOPに戻る
図表リスト
表の一覧
Table 1 Ophthalmic Drugs Contract Manufacturing Market Snapshot, 2023 & 2033 (US$ Million, CAGR %)
Table 2 Global Ophthalmic Drugs Contract Manufacturing Market Forecast by Region 2023-2033 (US$ Mn, AGR%, CAGR%): "V" Shaped Recovery
Table 3 Global Ophthalmic Drugs Contract Manufacturing Market Forecast by Region 2023-2033 (US$ Million, AGR%, CAGR%): "U" Shaped Recovery
Table 4 Global Ophthalmic Drugs Contract Manufacturing Market Forecast by Region 2023-2033 (US$ Million, AGR%, CAGR%): "W" Shaped Recovery
Table 5 Global Ophthalmic Drugs Contract Manufacturing Market Forecast by Region 2023-2033 (US$ Million, AGR%, CAGR%): "L" Shaped Recovery
Table 6 Global Ophthalmic Drugs Contract Manufacturing Market Forecast by Product Type, 2023-2033 (US$ Million, AGR%, CAGR %)
Table 7 APIs Segment Market Forecast by Region, 2023-2033 (US$ Million, AGR%, CAGR %)
Table 8 FDFs Segment Market Forecast by Region, 2023-2033 (US$ Million, AGR%, CAGR %)
Table 9 Global FDFs in Ophthalmic Drugs Contract Manufacturing Market Forecast by Product Type, 2023-2033 (US$ Million, AGR%, CAGR %)
Table 10 Global Ophthalmic Drugs Contract Manufacturing Market Forecast by Primary Packaging, 2023-2033 (US$ Million, AGR%, CAGR %)
Table 11 Ampoules & Vials Segment Market Forecast by Region, 2023-2033 (US$ Million, AGR%, CAGR %)
Table 12 Glass & Plastic Bottles Segment Market Forecast by Region, 2023-2033 (US$ Million, AGR%, CAGR%)
Table 13 Ointment Tubes Segment Market Forecast by Region, 2023-2033 (US$ Million, AGR%, CAGR%)
Table 14 Others Segment Market Forecast by Region, 2023-2033 (US$ Million, AGR%, CAGR%)
Table 15 Ophthalmic Drugs Contract Manufacturing Market Forecast by Scale of Manufacturing, 2023-2033 (US$ Million, AGR%, CAGR %)
Table 16 Pre-Clinical Segment Market Forecast by Region, 2023-2033 (US$ Million, AGR%, CAGR %)
Table 17 Clinical Segment Market Forecast by Region, 2023-2033 (US$ Million, AGR%, CAGR%)
Table 18 Commercial Segment Market Forecast by Region, 2023-2033 (US$ Million, AGR%, CAGR %)
Table 19 Global Ophthalmic Drugs Contract Manufacturing Market Forecast by Company Size, 2023-2033 (US$ Million, AGR%, CAGR %)
Table 20 Small Sized Segment Market Forecast by Region, 2023-2033 (US$ Million, AGR%, CAGR%)
Table 21 Mid-Sized Segment Market Forecast by Region, 2023-2033 (US$ Million, AGR%, CAGR %)
Table 22 Large Sized Segment Market Forecast by Region, 2023-2033 (US$ Million, AGR%, CAGR %)
Table 23 Global Ophthalmic Drugs Contract Manufacturing Market Forecast by Indication, 2023-2033 (US$ Million, AGR%, CAGR %)
Table 24 Age-Related Macular Degeneration Segment Market Forecast by Region, 2023-2033 (US$ Million, AGR%, CAGR%)
Table 25 Glaucoma Segment Market Forecast by Region, 2023-2033 (US$ Million, AGR%, CAGR %)
Table 26 Uveitis Segment Market Forecast by Region, 2023-2033 (US$ Million, AGR%, CAGR %)
Table 27 Dry eye disease Segment Market Forecast by Region, 2023-2033 (US$ Million, AGR%, CAGR%)
Table 28 Others Segment Market Forecast by Region, 2023-2033 (US$ Million, AGR%, CAGR%)
Table 29 Global Ophthalmic Drugs Contract Manufacturing Market Forecast by Region 2023-2033 (US$ Million, AGR%, CAGR%)
Table 30 North America Ophthalmic Drugs Contract Manufacturing Market Forecast by Country, 2023-2033 (US$ Million, AGR%, CAGR%)
Table 31 North America Ophthalmic Drugs Contract Manufacturing Market Forecast by Product Type, 2023-2033 (US$ Million, AGR%, CAGR %)
Table 32 North America FDFs Market Forecast by Product Type, 2023-2033 (US$ Million, AGR%, CAGR%)
Table 33 North America Ophthalmic Drugs Contract Manufacturing Market Forecast by Primary Packaging, 2023-2033 (US$ Million, AGR%, CAGR %)
Table 34 North America Ophthalmic Drugs Contract Manufacturing Market Forecast by Scale of Manufacturing, 2023-2033 (US$ Million, AGR%, CAGR %)
Table 35 North America Ophthalmic Drugs Contract Manufacturing Market Forecast by Company Size, 2023-2033 (US$ Million, AGR%, CAGR %)
Table 36 North America Ophthalmic Drugs Contract Manufacturing Market Forecast by Indication, 2023-2033 (US$ Million, AGR%, CAGR %)
Table 37 U.S. Ophthalmic Drugs Contract Manufacturing Market Forecast by Country, 2023-2033 (US$ Million, AGR%, CAGR %)
Table 38 Canada Ophthalmic Drugs Contract Manufacturing Market Forecast by Country, 2023-2033 (US$ Million, AGR%, CAGR %)
Table 39 Europe Ophthalmic Drugs Contract Manufacturing Market Forecast by Country, 2023-2033 (US$ Million, AGR%, CAGR %)
Table 40 Europe Ophthalmic Drugs Contract Manufacturing Market Forecast by Product Type, 2023-2033 (US$ Million, AGR%, CAGR%)
Table 41 Europe FDFs in Ophthalmic Drugs Contract Manufacturing Market Forecast by Product Type, 2023-2033 (US$ Million, AGR%, CAGR%)
Table 42 Europe Ophthalmic Drugs Contract Manufacturing Market Forecast by Primary Packaging, 2023-2033 (US$ Million, AGR%, CAGR%)
Table 43 Europe Ophthalmic Drugs Contract Manufacturing Market Forecast by Scale of Manufacturing, 2023-2033 (US$ Million, AGR%, CAGR %)
Table 44 Europe Ophthalmic Drugs Contract Manufacturing Market Forecast by Company Size, 2023-2033 (US$ Million, AGR%, CAGR%)
Table 45 Europe Ophthalmic Drugs Contract Manufacturing Market Forecast by Indication, 2023-2033 (US$ Million, AGR%, CAGR%)
Table 46 Germany Ophthalmic Drugs Contract Manufacturing Market Forecast by Country, 2023-2033 (US$ Million, AGR%, CAGR %)
Table 47 UK Ophthalmic Drugs Contract Manufacturing Market Forecast by Country, 2023-2033 (US$ Million, AGR%, CAGR %)
Table 48 France Ophthalmic Drugs Contract Manufacturing Market Forecast by Country, 2023-2033 (US$ Million, AGR%, CAGR %)
Table 49 Italy Ophthalmic Drugs Contract Manufacturing Market Forecast by Country, 2023-2033 (US$ Million, AGR%, CAGR %)
Table 50 Spain Ophthalmic Drugs Contract Manufacturing Market Forecast by Country, 2023-2033 (US$ Million, AGR%, CAGR %)
Table 51 Rest of Europe Ophthalmic Drugs Contract Manufacturing Market Forecast by Country, 2023-2033 (US$ Million, AGR%, CAGR %)
Table 52 Asia Pacific Ophthalmic Drugs Contract Manufacturing Market Forecast by Country, 2023-2033 (US$ Million, AGR%, CAGR %)
Table 53 Asia Pacific Ophthalmic Drugs Contract Manufacturing Market Forecast by Product Type, 2023-2033 (US$ Million, AGR%, CAGR%)
Table 54 Asia Pacific FDFs in Ophthalmic Drugs Contract Manufacturing Market Forecast by Product Type, 2023-2033 (US$ Million, AGR%, CAGR %)
Table 55 Asia Pacific Ophthalmic Drugs Contract Manufacturing Market Forecast by Primary Packaging, 2023-2033 (US$ Million, AGR%, CAGR%)
Table 56 Asia Pacific Ophthalmic Drugs Contract Manufacturing Market Forecast by Scale of Manufacturing, 2023-2033 (US$ Million, AGR%, CAGR%)
Table 57 Asia Pacific Ophthalmic Drugs Contract Manufacturing Market Forecast by Company Size, 2023-2033 (US$ Million, AGR%, CAGR%)
Table 58 Asia Pacific Ophthalmic Drugs Contract Manufacturing Market Forecast by Indication, 2023-2033 (US$ Million, AGR%, CAGR %)
Table 59 Japan Ophthalmic Drugs Contract Manufacturing Market Forecast by Country, 2023-2033 (US$ Million, AGR%, CAGR%)
Table 60 China Ophthalmic Drugs Contract Manufacturing Market Forecast by Country, 2023-2033 (US$ Million, AGR%, CAGR%)
Table 61 India Ophthalmic Drugs Contract Manufacturing Market Forecast by Country, 2023-2033 (US$ Million, AGR%, CAGR%)
Table 62 Australia Ophthalmic Drugs Contract Manufacturing Market Forecast by Country, 2023-2033 (US$ Million, AGR%, CAGR%)
Table 63 South Korea Ophthalmic Drugs Contract Manufacturing Market Forecast by Country, 2023-2033 (US$ Million, AGR%, CAGR %)
Table 64 Rest of Asia Pacific Ophthalmic Drugs Contract Manufacturing Market Forecast by Country, 2023-2033 (US$ Million, AGR%, CAGR %)
Table 65 Latin America Ophthalmic Drugs Contract Manufacturing Market Forecast by Country, 2023-2033 (US$ Million, AGR%, CAGR %)
Table 66 Latin America Ophthalmic Drugs Contract Manufacturing Market Forecast by Product Type, 2023-2033 (US$ Million, AGR%, CAGR %)
Table 67 Latin America FDFs in Ophthalmic Drugs Contract Manufacturing Market Forecast by Product Type, 2023-2033 (US$ Million, AGR%, CAGR %)
Table 68 Latin America Ophthalmic Drugs Contract Manufacturing Market Forecast by Primary Packaging, 2023-2033 (US$ Million, AGR%, CAGR %)
Table 69 Latin America Ophthalmic Drugs Contract Manufacturing Market Forecast by Scale of Manufacturing, 2023-2033 (US$ Million, AGR%, CAGR %)
Table 70 Latin America Ophthalmic Drugs Contract Manufacturing Market Forecast by Company Size, 2023-2033 (US$ Million, AGR%, CAGR %)
Table 71 Latin America Ophthalmic Drugs Contract Manufacturing Market Forecast by Indication, 2023-2033 (US$ Million, AGR%, CAGR %)
Table 72 Brazil Ophthalmic Drugs Contract Manufacturing Market Forecast by Country, 2023-2033 (US$ Million, AGR%, CAGR%)
Table 73 Mexico Ophthalmic Drugs Contract Manufacturing Market Forecast by Country, 2023-2033 (US$ Million, AGR%, CAGR%)
Table 74 Rest of Latin America Ophthalmic Drugs Contract Manufacturing Market Forecast by Country, 2023-2033 (US$ Million, AGR%, CAGR%)
Table 75 MEA Ophthalmic Drugs Contract Manufacturing Market Forecast by Country, 2023-2033 (US$ Million, AGR%, CAGR%)
Table 76 MEA Ophthalmic Drugs Contract Manufacturing Market Forecast by Product Type, 2023-2033 (US$ Million, AGR%, CAGR%)
Table 77 MEA FDFs in Ophthalmic Drugs Contract Manufacturing Market Forecast by Product Type, 2023-2033 (US$ Million, AGR%, CAGR%)
Table 78 MEA Ophthalmic Drugs Contract Manufacturing Market Forecast by Primary Packaging, 2023-2033 (US$ Million, AGR%, CAGR%)
Table 79 MEA Ophthalmic Drugs Contract Manufacturing Market Forecast by Scale of Manufacturing, 2023-2033 (US$ Million, AGR%, CAGR%)
Table 80 MEA Ophthalmic Drugs Contract Manufacturing Market Forecast by Company Size, 2023-2033 (US$ Million, AGR%, CAGR%)
Table 81 MEA Ophthalmic Drugs Contract Manufacturing Market Forecast by Indication, 2023-2033 (US$ Million, AGR%, CAGR%)
Table 82 GCC Ophthalmic Drugs Contract Manufacturing Market Forecast by Country, 2023-2033 (US$ Million, AGR%, CAGR%)
Table 83 South Africa Ophthalmic Drugs Contract Manufacturing Market Forecast by Country, 2023-2033 (US$ Million, AGR%, CAGR%)
Table 84 Rest of MEA Ophthalmic Drugs Contract Manufacturing Market Forecast by Country, 2023-2033 (US$ Million, AGR%, CAGR%)
Table 85 Strategic Outlook
Table 86 Lonza: Key Details, (CEO, HQ, Revenue, Founded, No. of Employees, Company Type, Website, Business Segment)
Table 87 Lonza: Services Offered
Table 88 Lonza: Strategic Outlook
Table 89 Recipharm: Key Details, (CEO, HQ, Revenue, Founded, No. of Employees, Company Type, Website, Business Segment)
Table 90 Recipharm: Product Benchmarking
Table 91 Recipharm: Strategic Outlook
Table 92 Catalent, Inc.: Key Details, (CEO, HQ, Revenue, Founded, No. of Employees, Company Type, Website, Business Segment)
Table 93 Catalent, Inc: Services Offered
Table 94 Catalent, Inc: Strategic Outlook
Table 95 Eurofins Scientific: Key Details, (CEO, HQ, Revenue, Founded, No. of Employees, Company Type, Website, Business Segment)
Table 96 Eurofins Scientific: Services Offered
Table 97 Eurofins Scientific: Strategic Outlook
Table 98 Thermo Fisher Scientific Inc: Key Details, (CEO, HQ, Revenue, Founded, No. of Employees, Company Type, Website, Business Segment)
Table 99 Thermo Fisher Scientific Inc: Services Offered
Table 100 Thermo Fisher Scientific Inc: Strategic Outlook
Table 101 Unither Pharmaceuticals: Key Details, (CEO, HQ, Founded, No. of Employees, Company Type, Website, Business Segment)
Table 102 Unither Pharmaceuticals: Service Offerings
Table 103 Unither Pharmaceuticals: Strategic Outlook
Table 104 Laboratorios Salvat, S.A: Key Details, (CEO, HQ, Founded, No. of Employees, Company Type, Website, Business Segment)
Table 105 Laboratorios Salvat, S.A: Services Offered
Table 106 Laboratorios Salvat, S.A: Strategic Outlook
Table 107 Siegfried Holding AG: Key Details, (CEO, HQ, Revenue, Founded, No. of Employees, Company Type, Website, Business Segment)
Table 108 Siegfried Holding AG: Services Offered
Table 109 Siegfried Holding AG: Strategic Outlook
Table 110 Pillar5 Pharma: Key Details, (CEO, HQ, Founded, No. of Employees, Company Type, Website, Business Segment)
Table 111 Pillar5 Pharma: Product Benchmarking
Table 112 Pillar5 Pharma: Strategic Outlook
Table 113 Abbvie Inc: Key Details, (CEO, HQ, Revenue, Founded, No. of Employees, Company Type, Website, Business Segment)
Table 114 Abbvie Inc.: Service Offerings
Table 115 Abbvie Inc.: Strategic Outlook
Table 116 Jubilant HollisterStier: Key Details, (CEO, HQ, Revenue, Founded, No. of Employees, Company Type, Website, Business Segment)
Table 117 : Service Offerings
Table 118 Jubilant HollisterStier: Strategic Outlook
Table 119 Glenmark Pharmaceuticals: Key Details, (CEO, HQ, Revenue, Founded, No. of Employees, Company Type, Website, Business Segment)
Table 120 Glenmark Pharmaceuticals: Product Benchmarking
Table 121 Merck KGaA: Key Details, (CEO, HQ, Revenue, Founded, No. of Employees, Company Type, Website, Business Segment)
Table 122 Merck KGaA: Product Benchmarking
Table 123 Merck KGaA: Strategic Outlook
図の一覧
Figure 1 Ophthalmic Drugs Contract Manufacturing Market Segmentation
Figure 2 Packaging Market by Product Type: Market Attractiveness Index
Figure 3 Ophthalmic Drugs Contract Manufacturing Market Forecast by Packaging Type: Market Attractiveness Index
Figure 4 Ophthalmic Drugs Contract Manufacturing Market Forecast by Scale of Manufacturing: Market Attractiveness Index
Figure 5 Ophthalmic drugs contract manufacturing Market Forecast by Company Size: Market Attractiveness Index
Figure 6 Ophthalmic drugs contract manufacturing Market Forecast by Indication: Market Attractiveness Index
Figure 7 Ophthalmic Drugs Contract Manufacturing Market: Attractiveness Index by Region
Figure 8 Ophthalmic drug contract manufacturing Market: Market Dynamics
Figure 9 Ophthalmic Drugs Contract Manufacturing Market by Region, 2023-2033 (US$ Million, AGR %, CAGR%): “V” Shaped Recovery
Figure 10 Ophthalmic Drugs Contract Manufacturing Market by Region, 2023-2033 (US$ Million, AGR %, CAGR %): “U” Shaped Recovery
Figure 11 Ophthalmic Drugs Contract Manufacturing Market by Region, 2023-2033 (US$ Million, AGR (%), CAGR (%)): “W” Shaped Recovery
Figure 12 Ophthalmic Drugs Contract Manufacturing Market by Region, 2023-2033 (US$ Million, AGR %, CAGR %): “L” Shaped Recovery
Figure 13 Ophthalmic Drugs Contract Manufacturing Market: Porter’s Five Forces Analysis
Figure 14 Ophthalmic Drugs Contract Manufacturing Market: PEST Analysis
Figure 15 Ophthalmic Drugs Contract Manufacturing Market by Product Type: Market Attractiveness Index
Figure 16 Ophthalmic Drugs Contract Manufacturing Market Forecast by Product Type, 2023-2033 (US$ Million, AGR %)
Figure 17 Ophthalmic Drugs Contract Manufacturing Market Share Forecast by Product Type, 2023, 2028, 2033 (%)
Figure 18 APIs Segment Market Forecast by Region, 2023-2033 (US$ Million, AGR %)
Figure 19 APIs Segment Market Share Forecast by Region, 2023 & 2033 (%)
Figure 20 FDFs Segment Market Forecast by Region, 2023-2033 (US$ Million, AGR %)
Figure 21 FDFs Segment Market Share Forecast by Region, 2023 & 2033 (%)
Figure 22 Ophthalmic Drugs Contract Manufacturing Market by Primary Packaging: Market Attractiveness Index
Figure 23 Ophthalmic Drugs Contract Manufacturing Market Forecast by Primary Packaging, 2023-2033 (US$ Million, AGR %)
Figure 24 Ophthalmic Drugs Contract Manufacturing Market Share Forecast by Primary Packaging, 2023, 2028, 2033 (%)
Figure 25 Ampoules & Vials Segment Market Forecast by Region, 2023-2033 (US$ Million, AGR %)
Figure 26 Ampoules & Vials Segment Market Share Forecast by Region, 2022 & 2032 (%)
Figure 27 Glass & Plastic Bottles Segment Market Forecast by Region, 2023-2033 (US$ Million, AGR %)
Figure 28 Glass & Plastic Bottles Segment Market Share Forecast by Region, 2023 & 2033 (%)
Figure 29 Ointment Tubes Segment Market Forecast by Region, 2023-2033 (US$ Million, AGR %)
Figure 30 Ointment Tubes Segment Market Share Forecast by Region, 2023 & 2033 (%)
Figure 31 Others Segment Market Forecast by Region, 2023-2033 (US$ Million, AGR %)
Figure 32 Others Segment Market Share Forecast by Region, 2023 & 2033 (%)
Figure 33 Ophthalmic Drugs Contract Manufacturing Market by Scale of Manufacturing: Market Attractiveness Index
Figure 34 Ophthalmic Drugs Contract Manufacturing Market Forecast by Scale of Manufacturing, 2023-2033 (US$ Million, AGR %)
Figure 35 Ophthalmic Drugs Contract Manufacturing Market Share Forecast by Scale of Manufacturing, 2023, 2028, 2033 (%)
Figure 36 Pre Clinical Segment Market Forecast by Region, 2023-2033 (US$ Million, AGR %)
Figure 37 Pre Clinical Segment Market Share Forecast by Region, 2022 & 2032 (%)
Figure 38 Clinical Segment Market Forecast by Region, 2023-2033 (US$ Million, AGR %)
Figure 39 Clinical Segment Market Share Forecast by Region, 2023 & 2033 (%)
Figure 40 Commercial Segment Market Forecast by Region, 2023-2033 (US$ Million, AGR %)
Figure 41 Commercial Segment Market Share Forecast by Region, 2023 & 2033 (%)
Figure 42 Ophthalmic Drugs Contract Manufacturing Market by Company Size: Market Attractiveness Index
Figure 43 Ophthalmic Drugs Contract Manufacturing Market Forecast by Company Size, 2023-2033 (US$ Million)
Figure 44 Ophthalmic Drugs Contract Manufacturing Market Share Forecast by Company Size, 2023, 2028, 2033 (%)
Figure 45 Small Sized Segment Market Forecast by Region, 2023-2033 (US$ Million, AGR %)
Figure 46 Small Sized Segment Market Share Forecast by Region, 2023 & 2033 (%)
Figure 47 Mid Sized Segment Market Forecast by Region, 2023-2033 (US$ Million, AGR %)
Figure 48 Mid Sized Segment Market Share Forecast by Region, 2023 & 2033 (%)
Figure 49 Large Sized Segment Market Forecast by Region, 2023-2033 (US$ Million, AGR %)
Figure 50 Large Sized Segment Market Share Forecast by Region, 2023 & 2033 (%)
Figure 51 Ophthalmic Drugs Contract Manufacturing Market by Indication: Market Attractiveness Index
Figure 52 Ophthalmic Drugs Contract Manufacturing Market Forecast by Indication, 2023-2033 (US$ Million, AGR %)
Figure 53 Ophthalmic Drugs Contract Manufacturing Market Share Forecast by Application, 2023, 2028, 2033 (%)
Figure 54 Age-Related Macular Degeneration Segment Market Forecast by Region, 2023-2033 (US$ Million, AGR %)
Figure 55 Age-Related Macular Degeneration Segment Market Share Forecast by Region, 2023 & 2033 (%)
Figure 56 Glaucoma Segment Market Forecast by Region, 2023-2033 (US$ Million, AGR %)
Figure 57 Glaucoma Segment Market Share Forecast by Region, 2023 & 2033 (%)
Figure 58 Uveitis Segment Market Forecast by Region, 2023-2033 (US$ Million, AGR %)
Figure 59 Uveitis Segment Market Share Forecast by Region, 2023 & 2033 (%)
Figure 60 Dry Eye Disease Segment Market Forecast by Region, 2023-2033 (US$ Million, AGR %)
Figure 61 Dry Eye Disease Segment Market Share Forecast by Region, 2023 & 2033 (%)
Figure 62 Others Segment Market Forecast by Region, 2023-2033 (US$ Million, AGR %)
Figure 63 Others Segment Market Share Forecast by Region, 2023 & 2033 (%)
Figure 64 Ophthalmic Drugs Contract Manufacturing Market Forecast by Region 2023, 2033 (Revenue, CAGR%)
Figure 65 Ophthalmic Drugs Contract Manufacturing Market Share Forecast by Region 2023, 2028, 2033(%)
Figure 66 Ophthalmic Drugs Contract Manufacturing Market by Region, 2023-2033 (US$ Million)
Figure 67 North America Ophthalmic Drugs Contract Manufacturing Market Attractiveness Index
Figure 68 North America Ophthalmic Drugs Contract Manufacturing Market by Country, 2023, 2028 & 2033 (US$ Million)
Figure 69 North America Ophthalmic Drugs Contract Manufacturing Market Forecast by Country, 2023-2033 (US$ Million, AGR %)
Figure 70 North America Ophthalmic Drugs Contract Manufacturing Market Share Forecast by Country, 2023 & 2033 (%)
Figure 71 North America Ophthalmic Drugs Contract Manufacturing Market Forecast by Product Type, 2023-2033 (US$ Million, AGR %)
Figure 72 North America Ophthalmic drug contract manufacturing Market Share Forecast by Product Type, 2023 & 2033 (%)
Figure 73 North America Ophthalmic Drugs Contract Manufacturing Market Forecast by Primary Packaging, 2023-2033 (US$ Million, AGR %)
Figure 74 North America Ophthalmic Drugs Contract Manufacturing Market Share Forecast by Primary Packaging, 2023 & 2033 (%)
Figure 75 North America Ophthalmic Drugs Contract Manufacturing Market Forecast by Scale of Manufacturing, 2023-2033 (US$ Million)
Figure 76 North America Ophthalmic Drugs Contract Manufacturing Market Share Forecast by Scale of Manufacturing, 2023 & 2033 (%)
Figure 77 North America Ophthalmic Drugs Contract Manufacturing Market Forecast by Company Size, 2023-2033 (US$ Million, AGR %)
Figure 78 North America Ophthalmic Drugs Contract Manufacturing Market Share Forecast by Company Size, 2023 & 2033 (%)
Figure 79 North America Ophthalmic drug contract manufacturing Market Forecast by Indication, 2023-2033 (US$ Million, AGR %)
Figure 80 North America Ophthalmic Drugs Contract Manufacturing Market Share Forecast by Indication, 2023 & 2033 (%)
Figure 81 U.S. Ophthalmic Drugs Contract Manufacturing Market Forecast, 2023-2033 (US$ Million, AGR %)
Figure 82 Canada Ophthalmic Drugs Contract Manufacturing Market Forecast, 2023-2033 (US$ Million, AGR %)
Figure 83 Europe Ophthalmic Drugs Contract Manufacturing Market Attractiveness Index
Figure 84 Europe Ophthalmic Drugs Contract Manufacturing Market by Region, 2023, 2028 & 2033 (US$ Million)
Figure 85 Europe Ophthalmic Drugs Contract Manufacturing Market Forecast by Country, 2023-2033 (US$ Million, AGR %)
Figure 86 Europe Ophthalmic Drugs Contract Manufacturing Market Share Forecast by Country, 2023 & 2033 (%)
Figure 87 Europe Ophthalmic Drugs Contract Manufacturing Market Forecast by Product Type, 2023-2033 (US$ Million, AGR %)
Figure 88 Europe Ophthalmic Drugs Contract Manufacturing Market Share Forecast by Product Type, 2023 & 2033 (%)
Figure 89 Europe Ophthalmic Drugs Contract Manufacturing Market Forecast by Primary Packaging, 2023-2033 (US$ Million, AGR %)
Figure 90 Europe Ophthalmic Drugs Contract Manufacturing Market Share Forecast by Primary Packaging, 2023 & 2033 (%)
Figure 91 Europe Ophthalmic Drugs Contract Manufacturing Market Forecast by Scale of Manufacturing, 2023-2033 (US$ Million, AGR %)
Figure 92 Europe Ophthalmic Drugs Contract Manufacturing Market Share Forecast by Scale of Manufacturing, 2023 & 2033 (%)
Figure 93 Europe Ophthalmic Drugs Contract Manufacturing Market Forecast by Company Size, 2023-2033 (US$ Million, AGR %)
Figure 94 Europe Ophthalmic Drugs Contract Manufacturing Market Share Forecast by Company Size, 2023 & 2033 (%)
Figure 95 Europe Ophthalmic drug contract manufacturing Market Forecast by Indication, 2023-2033 (US$ Million, AGR %)
Figure 96 Europe Ophthalmic Drugs Contract Manufacturing Market Share Forecast by Indication, 2023 & 2033 (%)
Figure 97 Germany Ophthalmic Drugs Contract Manufacturing Market Forecast, 2023-2033 (US$ Million, AGR %)
Figure 98 UK Ophthalmic Drugs Contract Manufacturing Market Forecast, 2023-2033 (US$ Million, AGR %)
Figure 99 France Ophthalmic Drugs Contract Manufacturing Market Forecast, 2023-2033 (US$ Million, AGR %)
Figure 100 Italy Ophthalmic Drugs Contract Manufacturing Market Forecast, 2023-2033 (US$ Million, AGR %)
Figure 101 Spain Ophthalmic Drugs Contract Manufacturing Market Forecast, 2023-2033 (US$ Million, AGR %)
Figure 102 Rest of Europe Ophthalmic Drugs Contract Manufacturing Market Forecast, 2023-2033 (US$ Million, AGR %)
Figure 103 Asia Pacific Ophthalmic Drugs Contract Manufacturing Market Attractiveness Index
Figure 104 Asia Pacific Ophthalmic Drugs Contract Manufacturing Market by Region, 2023, 2028 & 2033 (US$ Million)
Figure 105 Asia Pacific Ophthalmic Drugs Contract Manufacturing Market Forecast by Country, 2023-2033 (US$ Million, AGR %)
Figure 106 Asia Pacific Ophthalmic Drugs Contract Manufacturing Market Share Forecast by Country, 2023 & 2033 (%)
Figure 107 Asia Pacific Ophthalmic Drugs Contract Manufacturing Market Forecast by Product Type, 2023-2033 (US$ Million, AGR %)
Figure 108 Asia Pacific Ophthalmic drug contract manufacturing Market Share Forecast by Product Type, 2023 & 2033 (%)
Figure 109 Asia Pacific Ophthalmic Drugs Contract Manufacturing Market Forecast by Primary Packaging, 2023-2033 (US$ Million, AGR %)
Figure 110 Asia Pacific Ophthalmic Drugs Contract Manufacturing Market Share Forecast by Primary Packaging, 2023 & 2033 (%)
Figure 111 Asia Pacific Ophthalmic Drugs Contract Manufacturing Market Forecast by Scale of Manufacturing, 2023-2033 (US$ Million, AGR %)
Figure 112 Asia Pacific Ophthalmic Drugs Contract Manufacturing Market Share Forecast by Scale of Manufacturing, 2023 & 2033 (%)
Figure 113 Asia Pacific Ophthalmic Drugs Contract Manufacturing Market Forecast by Company Size, 2023-2033 (US$ Million, AGR %)
Figure 114 Asia Pacific Ophthalmic Drugs Contract Manufacturing Market Share Forecast by Company Size, 2023 & 2033 (%)
Figure 115 Asia Pacific Ophthalmic drug contract manufacturing Market Forecast by Indication, 2023-2033 (US$ Million, AGR %)
Figure 116 Asia Pacific Ophthalmic Drugs Contract Manufacturing Market Share Forecast by Indication, 2023 & 2033 (%)
Figure 117 Japan Ophthalmic Drugs Contract Manufacturing Market Forecast, 2023-2033 (US$ Million, AGR %)
Figure 118 China Ophthalmic Drugs Contract Manufacturing Market Forecast, 2023-2033 (US$ Million, AGR %)
Figure 119 India Ophthalmic Drugs Contract Manufacturing Market Forecast, 2023-2033 (US$ Million, AGR %)
Figure 120 Australia Ophthalmic Drugs Contract Manufacturing Market Forecast, 2023-2033 (US$ Million, AGR %)
Figure 121 South Korea Ophthalmic Drugs Contract Manufacturing Market Forecast, 2023-2033 (US$ Million, AGR %)
Figure 122 Rest of Asia Pacific Ophthalmic Drugs Contract Manufacturing Market Forecast, 2023-2033 (US$ Million, AGR %)
Figure 123 Latin America Ophthalmic Drugs Contract Manufacturing Market Attractiveness Index
Figure 124 Latin America Ophthalmic Drugs Contract Manufacturing Market by Region, 2023, 2028 & 2033 (US$ Million)
Figure 125 Latin America Ophthalmic Drugs Contract Manufacturing Market Forecast by Country, 2023-2033 (US$ Million, AGR %)
Figure 126 Latin America Ophthalmic Drugs Contract Manufacturing Market Share Forecast by Country, 2023 & 2033 (%)
Figure 127 Latin America Ophthalmic Drugs Contract Manufacturing Market Forecast by Product Type, 2023-2033 (US$ Million, AGR %)
Figure 128 Latin America Ophthalmic drug contract manufacturing Market Share Forecast by Product Type, 2023 & 2033 (%)
Figure 129 Latin America Ophthalmic Drugs Contract Manufacturing Market Forecast by Primary Packaging, 2023-2033 (US$ Million, AGR %)
Figure 130 Latin America Ophthalmic Drugs Contract Manufacturing Market Share Forecast by Primary Packaging, 2023 & 2033 (%)
Figure 131 Latin America Ophthalmic Drugs Contract Manufacturing Market Forecast by Scale of Manufacturing, 2023-2033 (US$ Million, AGR %)
Figure 132 Latin America Ophthalmic Drugs Contract Manufacturing Market Share Forecast by Scale of Manufacturing, 2023 & 2033 (%)
Figure 133 Latin America Ophthalmic Drugs Contract Manufacturing Market Forecast by Company Size, 2023-2033 (US$ Million, AGR %)
Figure 134 Latin America Ophthalmic Drugs Contract Manufacturing Market Share Forecast by Company Size, 2023 & 2033 (%)
Figure 135 Latin America Ophthalmic drug contract manufacturing Market Forecast by Indication, 2023-2033 (US$ Million, AGR %)
Figure 136 Latin America Ophthalmic Drugs Contract Manufacturing Market Share Forecast by Indication, 2023 & 2033 (%)
Figure 137 Brazil Ophthalmic Drugs Contract Manufacturing Market Forecast, 2023-2033 (US$ Million, AGR %)
Figure 138 Mexico Ophthalmic Drugs Contract Manufacturing Market Forecast, 2023-2033 (US$ Million, AGR %)
Figure 139 Rest of Latin America Ophthalmic Drugs Contract Manufacturing Market Forecast, 2023-2033 (US$ Million, AGR %)
Figure 140 MEA Ophthalmic Drugs Contract Manufacturing Market Attractiveness Index
Figure 141 MEA Ophthalmic Drugs Contract Manufacturing Market by Region, 2023, 2028 & 2033 (US$ Million)
Figure 142 MEA Ophthalmic Drugs Contract Manufacturing Market Forecast by Country, 2023-2033 (US$ Million, AGR %)
Figure 143 MEA Ophthalmic Drugs Contract Manufacturing Market Share Forecast by Country, 2023 & 2033 (%)
Figure 144 MEA Ophthalmic Drugs Contract Manufacturing Market Forecast by Product Type, 2023-2033 (US$ Million, AGR %)
Figure 145 MEA Ophthalmic drug contract manufacturing Market Share Forecast by Product Type, 2023 & 2033 (%)
Figure 146 MEA Ophthalmic Drugs Contract Manufacturing Market Forecast by Primary Packaging, 2023-2033 (US$ Million, AGR %)
Figure 147 MEA Ophthalmic Drugs Contract Manufacturing Market Share Forecast by Primary Packaging, 2023 & 2033 (%)
Figure 148 MEA Ophthalmic Drugs Contract Manufacturing Market Forecast by Scale of Manufacturing, 2023-2033 (US$ Million, AGR %)
Figure 149 MEA Ophthalmic Drugs Contract Manufacturing Market Share Forecast by Scale of Manufacturing, 2023 & 2033 (%)
Figure 150 MEA Ophthalmic Drugs Contract Manufacturing Market Forecast by Company Size, 2023-2033 (US$ Million, AGR %)
Figure 151 MEA Ophthalmic Drugs Contract Manufacturing Market Share Forecast by Company Size, 2023 & 2033 (%)
Figure 152 MEA Ophthalmic drug contract manufacturing Market Forecast by Indication, 2023-2033 (US$ Million, AGR %)
Figure 153 MEA Ophthalmic Drugs Contract Manufacturing Market Share Forecast by Indication, 2023 & 2033 (%)
Figure 154 GCC Ophthalmic Drugs Contract Manufacturing Market Forecast, 2023-2033 (US$ Million, AGR %)
Figure 155 South Africa Ophthalmic Drugs Contract Manufacturing Market Forecast, 2023-2033 (US$ Million, AGR %)
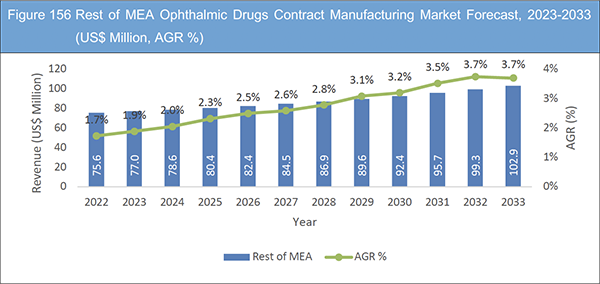
Figure 156 Rest of MEA Ophthalmic Drugs Contract Manufacturing Market Forecast, 2023-2033 (US$ Million, AGR %)
Figure 157 Ophthalmic Drugs Contract Manufacturing Market: Company Share/Ranking, 2022
Figure 158 Lonza: Net Revenue, 2018-2022 (US$ Million, AGR%)
Figure 159 Lonza: R&D, 2021-2022 (US$ Million, AGR%)
Figure 160 Recipharm: Net Revenue, 2018-2022 (US$ Million, AGR%)
Figure 161 Catalent, Inc: Net Revenue, 2018-2022 (US$ Million, AGR%)
Figure 162 Catalent, Inc: R&D, 2018-2022 (US$ Million, AGR%)
Figure 163 Catalent, Inc: Regional Market Shares, 2022
Figure 164 Eurofins Scientific: Net Revenue, 2018-2022 (US$ Million, AGR%)
Figure 165 Eurofins Scientific: Regional Market Shares, 2022
Figure 166 Thermo Fisher Scientific Inc: Net Revenue, 2018-2022 (US$ Million, AGR%)
Figure 167 Thermo Fisher Scientific Inc: Regional Market Shares, 2022
Figure 168 Siegfried Holding AG: Net Revenue, 2018-2022 (US$ Million, AGR%)
Figure 169 Siegfried Holding AG: R&D, 2018-2022 (US$ Million, AGR%)
Figure 170 Glenmark Pharmaceuticals: Net Revenue, 2018-2022 (US$ Million, AGR%)
Figure 171 Glenmark Pharmaceuticals: R&D, 2021-2022 (US$ Million, AGR%)
Figure 172 Merck KGaA: Net Revenue, 2018-2022 (US$ Million, AGR%)
Figure 173 Merck KGaA: R&D, 2018-2022 (US$ Million, AGR%)
Figure 174 Merck KGaA: Regional Market Shares, 2022
ページTOPに戻る
Summary
Report Details
The Ophthalmic Drugs Contract Manufacturing Market Report 2023-2033: This report will prove invaluable to leading firms striving for new revenue pockets if they wish to better understand the industry and its underlying dynamics. It will be useful for companies that would like to expand into different industries or to expand their existing operations in a new region.
Factors Such As increasing prevalence of ophthalmic disorders and cost efficiency provided by CDMOs are driving the market growth
Several important elements that support the expansion and significance of the ophthalmic drugs contract manufacturing market in the pharmaceutical industry. One of the main causes is the rising incidence of ocular conditions like age-related macular degeneration (AMD), glaucoma, cataracts, and dry eye syndrome. Pharmaceutical companies are looking for effective drug manufacturing solutions as the aging population increases and lifestyle habit changes and there is an increasing need for effective pharmaceuticals to treat and maintain these eye problems.
Additionally, by outsourcing manufacturing to the CDMOs, enables pharmaceutical businesses to concentrate on their core capabilities, such as research and marketing. This strategic partnership shortens the time of ophthalmic medications to reach the market and thereby streamlining drug development process. Modern technologies and strong quality control procedures used by CDMOs guarantee the creation of high-quality medicines that satisfy market needs and regulatory requirements.
Economical effectiveness one of the major factor driving these companies to adopt CDMO services as it takes a significant financial investment in staff, facilities, and equipment to develop new pharmaceutical goods. Companies want to reduce the overall the cost and labour costs through outsourcing to the CDMOs.
Since CDMOs already have the necessary resources and knowledge, producing drugs, it turns to be a less expensive and involves fewer risks for investors.
Complex regulatory framework may pose as challenges in the ophthalmic drugs contract manufacturing market
Noncompliance with regulatory standards and poor pharmaceutical quality can have severe consequences for a business and its brand reputation. Therefore, adherence to regulatory rules is crucial in the pharmaceutical industry. Contract development and manufacturing organizations (CDMOs) face challenges in ensuring compliance with varying regulatory requirements across different regions and countries, particularly in the ophthalmic drug contract manufacturing industry.
As pharmaceutical companies outsource drug manufacturing to specialized CDMOs focusing on ophthalmic products, they encounter a complex web of diverse regulatory frameworks. Each region has its distinct guidelines, standards, and procedures governing various aspects of ophthalmic drug manufacturing and distribution. This includes quality control, safety assessments, and labelling, packaging, and distribution practices. Complying with these unique requirements demands a meticulous approach from contract manufacturers to ensure full compliance with the specific regulations of the markets they serve. This aspect could potentially limit the expansion of the pharmaceutical CDMO market in the coming years.
What Questions Should You Ask before Buying a Market Research Report?
• How is the ophthalmic drugs contract manufacturing market evolving?
• What is driving and restraining the ophthalmic drugs contract manufacturing market?
• How will each ophthalmic drugs contract manufacturing submarket segment grow over the forecast period and how much revenue will these submarkets account for in 2033?
• How will the market shares for each ophthalmic drugs contract manufacturing submarket develop from 2023 to 2033?
• What will be the main driver for the overall market from 2023 to 2033?
• Will leading ophthalmic drugs contract manufacturing markets broadly follow the macroeconomic dynamics, or will individual national markets outperform others?
• How will the market shares of the national markets change by 2033 and which geographical region will lead the market in 2033?
• Who are the leading players and what are their prospects over the forecast period?
• How will the industry evolve during the period between 2023 and 2033? What are the implications of ophthalmic drugs contract manufacturing projects taking place now and over the next 10 years?
• Is there a greater need for product commercialisation to further scale the ophthalmic drugs contract manufacturing market?
• Where is the ophthalmic drugs contract manufacturing market heading and how can you ensure you are at the forefront of the market?
• What are the best investment options for new product and service lines?
• What are the key prospects for moving companies into a new growth path and C-suite?
You need to discover how this will impact the Ophthalmic Drugs Contract Manufacturing market today, and over the next 10 years:
• Our 334-page report provides 122 tables, 174 charts/graphs exclusively to you.
• The report highlights key lucrative areas in the industry so you can target them – NOW.
• It contains in-depth analysis of global, regional and national sales and growth.
• It highlights for you the key successful trends, changes and revenue projections made by your competitors.
This report tells you TODAY how the ophthalmic drugs contract manufacturing market will develop in the next 10 years, and in line with the variations in COVID-19 economic recession and bounce. This market is more critical now than at any point over the last 10 years.
Forecasts to 2033 and other analyses reveal commercial prospects
• In addition to revenue forecasting to 2033, our new study provides you with recent results, growth rates, and market shares.
• You will find original analyses, with business outlooks and developments.
• Discover qualitative analyses (including market dynamics, drivers, opportunities, restraints and challenges), cost structure, impact of rising ophthalmic drugs contract manufacturing prices and recent developments.
This report includes data analysis and invaluable insight into how COVID-19 will affect the industry and your company. Four COVID-19 recovery patterns and their impact, namely, “V”, “L”, “W” and “U” are discussed in this report.
Segments Covered in the Report
Product Type
• API
• FDFs
Primary Packaging Type
• Ampoules & Vials
• Glass & Plastic Bottles
• Ointment Tubes
• Others
Scale of Manufacturing
• Preclinical
• Clinical
• Commercial
Company Size
• Small Sized
• Mid Sized
• Large Sized
Indication
• Age-Related Macular Degeneration
• Glaucoma
• Uveitis
• Dry Eye Disease
• Others
In addition to the revenue predictions for the overall world market and segments, you will also find revenue forecasts for four regional and 20 leading national markets:
North America
• U.S.
• Canada
Europe
• Germany
• Spain
• UK
• France
• Italy
• Rest of Europe
Asia Pacific
• China
• Japan
• India
• Australia
• South Korea
• Rest of Asia Pacific
Latin America
• Brazil
• Mexico
• Rest of Latin America
MEA
• GCC Countries
• South Africa
• Rest of MEA
The report also includes profiles and for some of the leading companies in the Ophthalmic Drugs Contract Manufacturing Market, 2023 to 2033, with a focus on this segment of these companies’ operations.
Leading companies and the potential for market growth
• Abbvie Inc.
• Catalent Inc.
• Eurofins Scientific
• Glenmark Pharmaceuticals
• Jubilant HollisterStier LLC
• Laboratorios Salvat, S.A.
• Lonza
• Merck KGaA
• Pillar5 Pharma
• Recipharm
• Siegfried Holding AG
• Thermo Fisher Scientific Inc.
• Unither Pharmaceuticals
Overall world revenue for Ophthalmic Drugs Contract Manufacturing market, 2023 to 2033 in terms of value the market will surpass US$3,683.4 million in 2022, our work calculates. We predict strong revenue growth through to 2033. Our work identifies which organizations hold the greatest potential. Discover their capabilities, progress, and commercial prospects, helping you stay ahead.
How will the Ophthalmic Drugs Contract Manufacturing market, 2023 to 2033 report help you?
In summary, our 330+ page report provides you with the following knowledge:
• Revenue forecasts to 2033 for Ophthalmic Drugs Contract Manufacturing market, 2023 to 2033 Market, with forecasts for mode of delivery, clinical trial phase, therapeutic area, end users and company size, each forecast at a global and regional level – discover the industry’s prospects, finding the most lucrative places for investments and revenues.
• Revenue forecasts to 2033 for five regional and 20 key national markets – See forecasts for the Ophthalmic Drugs Contract Manufacturing Market, 2023 to 2033 market in North America, Europe, Asia-Pacific, Latin America and MEA. Also forecasted is the market in the US, Canada, Mexico, Brazil, Germany, France, UK, Italy, China, India, Japan, and Australia among other prominent economies.
• Prospects for established firms and those seeking to enter the market – including company profiles for 10 of the major companies involved in the Ophthalmic Drugs Contract Manufacturing market, 2023 to 2033.
Find quantitative and qualitative analyses with independent predictions. Receive information that only our report contains, staying informed with invaluable business intelligence.
Information found nowhere else
With our new report, you are less likely to fall behind in knowledge or miss out on opportunities. See how our work could benefit your research, analyses, and decisions. Visiongain’s study is for everybody needing commercial analyses for the Ophthalmic Drugs Contract Manufacturing market, 2023 to 2033, market-leading companies. You will find data, trends and predictions.
ページTOPに戻る
Table of Contents
Table of Contents
1 Report Overview
1.1 Objectives of the Study
1.2 Introduction to Ophthalmic Drugs Contract Manufacturing Market
1.3 What This Report Delivers
1.4 Why You Should Read This Report
1.5 Key Questions Answered by This Analytical Report
1.6 Who is This Report for?
1.7 Methodology
1.7.1 Market Definitions
1.7.2 Market Evaluation & Forecasting Methodology
1.7.3 Data Validation
1.7.3.1 Primary Research
1.7.3.2 Secondary Research
1.8 Frequently Asked Questions (FAQs)
1.9 Associated Visiongain Reports
1.10 About Visiongain
2 Executive Summary
3 Market Overview
3.1 Key Findings
3.2 Market Dynamics
3.2.1 Market Driving Factors
3.2.1.1 High cost of in-house drug development is likely to propel the market growth
3.2.1.2 Growing prevalence of ophthalmic disorders
3.2.1.3 Reduced overall cost and time to the market
3.2.1.4 Ease of Supply Chain Issues and Bandwidth to Focus on Core Competencies
3.2.2 Market Restraining Factors
3.2.2.1 Varying regulatory requirements across regions
3.2.2.2 Introduction of Serialization
3.2.3 Market Opportunities
3.2.3.1 Growth in Emerging Markets
3.2.3.2 Scalability and flexible production capacity
3.2.3.3 Specialized Services for Niche Markets and Late-Stage Customization
3.2.3.4 Process Improvement with better AI, e-Platforms, real time and remote tracing
3.3 COVID-19 Impact Analysis
3.4 Porter’s Five Forces Analysis
3.4.1 Bargaining Power of Suppliers (Medium)
3.4.2 Bargaining Power of Buyers (Medium to High)
3.4.3 Competitive Rivalry (High)
3.4.4 Threat from Substitutes (Medium)
3.4.5 Threat of New Entrants (High)
3.5 PEST Analysis
3.5.1 Political
3.5.2 Economical
3.5.3 Social
3.5.4 Technological
4 Ophthalmic Drugs Contract Manufacturing Market Analysis by Product Type
4.1 Key Findings
4.2 Product Type Segment: Market Attractiveness Index
4.3 Ophthalmic Drugs Contract Manufacturing Market Size Estimation and Forecast by Product Type
4.4 APIs
4.4.1 Market Size by Region, 2023-2033 (US$ Million)
4.4.2 Market Share by Region, 2023 & 2033 (%)
4.5 FDFs
4.5.1 Market Size by Region, 2023-2033 (US$ Million)
4.5.2 Market Share by Region, 2023 & 2033 (%)
4.5.3 FDFs in Ophthalmic Drugs Contract Manufacturing Market Size Estimation and Forecast by Product Type
5 Ophthalmic Drugs Contract Manufacturing Market Analysis by Primary Packaging
5.1 Key Findings
5.2 Primary Packaging Segment: Market Attractiveness Index
5.3 Ophthalmic Drugs Contract Manufacturing Market Size Estimation and Forecast by Primary Packaging
5.4 Ampoules & Vials
5.4.1 Market Size by Region, 2023-2033 (US$ Million)
5.4.2 Market Share by Region, 2023 & 2033 (%)
5.5 Glass & Plastic Bottles
5.5.1 Market Size by Region, 2023-2033 (US$ Million)
5.5.2 Market Share by Region, 2023 & 2033 (%)
5.6 Ointment Tubes
5.6.1 Market Size by Region, 2023-2033 (US$ Million)
5.6.2 Market Share by Region, 2023 & 2033 (%)
5.7 Others
5.7.1 Market Size by Region, 2023-2033 (US$ Million)
5.7.2 Market Share by Region, 2023 & 2033 (%)
6 Ophthalmic Drugs Contract Manufacturing Market Analysis by Scale of Manufacturing
6.1 Key Findings
6.2 Scale of Manufacturing Segment: Market Attractiveness Index
6.3 Ophthalmic Drugs Contract Manufacturing Market Size Estimation and Forecast by Scale of Manufacturing
6.4 Preclinical
6.4.1 Market Size by Region, 2023-2033 (US$ Million)
6.4.2 Market Share by Region, 2023 & 2033 (%)
6.5 Clinical
6.5.1 Market Size by Region, 2023-2033 (US$ Million)
6.5.2 Market Share by Region, 2023 & 2033 (%)
6.6 Commercial
6.6.1 Market Size by Region, 2023-2033 (US$ Million)
6.6.2 Market Share by Region, 2023 & 2033 (%)
7 Ophthalmic Drugs Contract Manufacturing Market Analysis by Company Size
7.1 Key Findings
7.2 Company Size Segment: Market Attractiveness Index
7.3 Ophthalmic Drugs Contract Manufacturing Market Size Estimation and Forecast by Company Size
7.4 Small Size
7.4.1 Market Size by Region, 2023-2033 (US$ Million)
7.4.2 Market Share by Region, 2023 & 2033 (%)
7.5 Mid-Sized
7.5.1 Market Size by Region, 2023-2033 (US$ Million)
7.5.2 Market Share by Region, 2023 & 2033 (%)
7.6 Large Sized
7.6.1 Market Size by Region, 2023-2033 (US$ Million)
7.6.2 Market Share by Region, 2023 & 2033 (%)
8 Ophthalmic Drugs Contract Manufacturing Market Analysis by Indication
8.1 Key Findings
8.2 Indication Segment: Market Attractiveness Index
8.3 Ophthalmic Drugs Contract Manufacturing Market Size Estimation and Forecast by Indication
8.4 Age-Related Macular Degeneration
8.4.1 Market Size by Region, 2023-2033 (US$ Million)
8.4.2 Market Share by Region, 2023 & 2033 (%)
8.5 Glaucoma
8.5.1 Market Size by Region, 2023-2033 (US$ Million)
8.5.2 Market Share by Region, 2023 & 2033 (%)
8.6 Uveitis
8.6.1 Market Size by Region, 2023-2033 (US$ Million)
8.6.2 Market Share by Region, 2023 & 2033 (%)
8.7 Dry Eye Disease
8.7.1 Market Size by Region, 2023-2033 (US$ Million)
8.7.2 Market Share by Region, 2023 & 2033 (%)
8.8 Others
8.8.1 Market Size by Region, 2023-2033 (US$ Million)
8.8.2 Market Share by Region, 2023 & 2033 (%)
9 Ophthalmic Dug Contract Manufacturing Market Analysis by Region
9.1 Key Findings
9.2 Regional Market Size Estimation and Forecast
10 North America Ophthalmic Drugs Contract Manufacturing Market Analysis
10.1 Key Findings
10.2 North America Ophthalmic Drug Contract Manufacturing Market Attractiveness Index
10.3 North America Ophthalmic Drugs Contract Manufacturing Market by Country, 2023, 2028 & 2033 (US$ Million)
10.4 North America Ophthalmic Drug Contract Manufacturing Market Size Estimation and Forecast by Country
10.5 North America Ophthalmic Drugs Contract Manufacturing Market Size Estimation and Forecast by Product Type
10.5.1 North America FDFs Ophthalmic Drugs Contract Manufacturing Market Size Estimation and Forecast by Product Type
10.6 North America Ophthalmic Drug Contract Manufacturing Market Size Estimation and Forecast by Primary Packaging
10.7 North America Ophthalmic Drugs Contract Manufacturing Market Size Estimation and Forecast by Scale of Manufacturing
10.8 North America Ophthalmic Drugs Contract Manufacturing Market Size Estimation and Forecast by Company Size
10.9 North America Ophthalmic Drugs Contract Manufacturing Market Size Estimation and Forecast by Indication
10.10 U.S. Ophthalmic Drugs Contract Manufacturing Market Analysis
10.11 Canada Ophthalmic Drugs Contract Manufacturing Market Analysis
11 Europe Ophthalmic Drugs Contract Manufacturing Market Analysis
11.1 Key Findings
11.2 Europe Ophthalmic Drugs Contract Manufacturing Market Attractiveness Index
11.3 Europe Ophthalmic Drugs Contract Manufacturing Market by Country, 2023, 2028 & 2033 (US$ Million)
11.4 Europe Ophthalmic Drug Contract Manufacturing Market Size Estimation and Forecast by Country
11.5 Europe Ophthalmic Drugs Contract Manufacturing Market Size Estimation and Forecast by Product Type
11.5.1 Europe FDFs in Ophthalmic Drugs Contract Manufacturing Market Size Estimation and Forecast by Product Type
11.6 Europe Ophthalmic Drugs Contract Manufacturing Market Size Estimation and Forecast by Primary Packaging
11.7 Europe Ophthalmic Drugs Contract Manufacturing Market Size Estimation and Forecast by Scale of Manufacturing
11.8 Europe Ophthalmic Drugs Contract Manufacturing Market Size Estimation and Forecast by Company Size
11.9 Europe Ophthalmic Drugs Contract Manufacturing Market Size Estimation and Forecast by Indication
11.10 Germany Ophthalmic Drugs Contract Manufacturing Market Analysis
11.11 UK Ophthalmic Drugs Contract Manufacturing Market Analysis
11.12 France Ophthalmic Drugs Contract Manufacturing Market Analysis
11.13 Italy Ophthalmic Drugs Contract Manufacturing Market Analysis
11.14 Spain Ophthalmic Drugs Contract Manufacturing Market Analysis
11.15 Rest of Europe Ophthalmic Drugs Contract Manufacturing Market Analysis
12 Asia Pacific Ophthalmic Drugs Contract Manufacturing Market Analysis
12.1 Key Findings
12.2 Asia Pacific Ophthalmic Drugs Contract Manufacturing Market Attractiveness Index
12.3 Asia Pacific Ophthalmic Drugs Contract Manufacturing Market by Country, 2023, 2028 & 2033 (US$ Million)
12.4 Asia Pacific Ophthalmic Drug Contract Manufacturing Market Size Estimation and Forecast by Country
12.5 Asia Pacific Ophthalmic Drugs Contract Manufacturing Market Size Estimation and Forecast by Product Type
12.5.1 Asia Pacific FDFs in Ophthalmic Drugs Contract Manufacturing Market Size Estimation and Forecast by Product Type
12.6 Asia Pacific Ophthalmic Drugs Contract Manufacturing Market Size Estimation and Forecast by Primary Packaging
12.7 Asia Pacific Ophthalmic Drugs Contract Manufacturing Market Size Estimation and Forecast by Scale of Manufacturing
12.8 Asia Pacific Ophthalmic Drugs Contract Manufacturing Market Size Estimation and Forecast by Company Size
12.9 Asia Pacific Ophthalmic Drugs Contract Manufacturing Market Size Estimation and Forecast by Indication
12.10 Japan Ophthalmic Drugs Contract Manufacturing Market Analysis
12.11 China Ophthalmic Drugs Contract Manufacturing Market Analysis
12.12 India Ophthalmic Drugs Contract Manufacturing Market Analysis
12.13 Australia Ophthalmic Drugs Contract Manufacturing Market Analysis
12.14 South Korea Ophthalmic Drugs Contract Manufacturing Market Analysis
12.15 Rest of Asia Pacific Ophthalmic Drugs Contract Manufacturing Market Analysis
13 Latin America Ophthalmic Drugs Contract Manufacturing Market Analysis
13.1 Key Findings
13.2 Latin America Ophthalmic Drugs Contract Manufacturing Market Attractiveness Index
13.3 Latin America Ophthalmic Drugs Contract Manufacturing Market by Country, 2023, 2028 & 2033 (US$ Million)
13.4 Latin America Ophthalmic Drug Contract Manufacturing Market Size Estimation and Forecast by Country
13.5 Latin America Ophthalmic Drugs Contract Manufacturing Market Size Estimation and Forecast by Product Type
13.5.1 Latin America FDFs in Ophthalmic Drugs Contract Manufacturing Market Size Estimation and Forecast by Product Type
13.6 Latin America Ophthalmic Drugs Contract Manufacturing Market Size Estimation and Forecast by Primary Packaging
13.7 Latin America Ophthalmic Drugs Contract Manufacturing Market Size Estimation and Forecast by Scale of Manufacturing
13.8 Latin America Ophthalmic Drugs Contract Manufacturing Market Size Estimation and Forecast by Company Size
13.9 Latin America Ophthalmic Drugs Contract Manufacturing Market Size Estimation and Forecast by Indication
13.10 Brazil Ophthalmic Drugs Contract Manufacturing Market Analysis
13.11 Mexico Ophthalmic Drugs Contract Manufacturing Market Analysis
13.12 Rest of Latin America Ophthalmic Drugs Contract Manufacturing Market Analysis
14 MEA Ophthalmic Drugs Contract Manufacturing Market Analysis
14.1 Key Findings
14.2 MEA Ophthalmic Drugs Contract Manufacturing Market Attractiveness Index
14.3 MEA Ophthalmic Drugs Contract Manufacturing Market by Country, 2023, 2028 & 2033 (US$ Million)
14.4 MEA Ophthalmic Drug Contract Manufacturing Market Size Estimation and Forecast by Country
14.5 MEA Ophthalmic Drugs Contract Manufacturing Market Size Estimation and Forecast by Product Type
14.5.1 MEA FDFs in Ophthalmic Drugs Contract Manufacturing Market Size Estimation and Forecast by Product Type
14.6 MEA Ophthalmic Drugs Contract Manufacturing Market Size Estimation and Forecast by Primary Packaging
14.7 MEA Ophthalmic Drugs Contract Manufacturing Market Size Estimation and Forecast by Scale of Manufacturing
14.8 MEA Ophthalmic Drugs Contract Manufacturing Market Size Estimation and Forecast by Company Size
14.9 MEA Ophthalmic Drugs Contract Manufacturing Market Size Estimation and Forecast by Indication
14.10 GCC Ophthalmic Drugs Contract Manufacturing Market Analysis
14.11 South Africa Ophthalmic Drugs Contract Manufacturing Market Analysis
14.12 Rest of MEA Ophthalmic drug contract manufacturing Market Analysis
15 Company Profiles
15.1 Competitive Landscape, 2022
15.2 Strategic Outlook
15.3 Lonza
15.3.1 Company Snapshot
15.3.2 Company Overview
15.3.3 Financial Analysis
15.3.3.1 Net Revenue, 2018-2022
15.3.3.2 R&D, 2018-2022
15.3.4 Services Offered
15.3.5 Strategic Outlook
15.4 Recipharm
15.4.1 Company Snapshot
15.4.2 Company Overview
15.4.3 Financial Analysis
15.4.3.1 Net Revenue, 2018-2022
15.4.4 Services Offered
15.4.5 Strategic Outlook
15.5 Catalent Inc.
15.5.1 Company Snapshot
15.5.2 Company Overview
15.5.3 Financial Analysis
15.5.3.1 Net Revenue, 2018-2022
15.5.3.2 R&D, 2018-2022
15.5.3.3 Regional Market Shares, 2022
15.5.4 Services Offered
15.5.5 Strategic Outlook
15.6 Eurofins Scientific
15.6.1 Company Snapshot
15.6.2 Company Overview
15.6.3 Financial Analysis
15.6.3.1 Net Revenue, 2018-2022
15.6.3.2 Regional Market Shares, 2022
15.6.4 Services Offered
15.6.5 Strategic Outlook
15.7 Thermo Fisher Scientific Inc.
15.7.1 Company Snapshot
15.7.2 Company Overview
15.7.3 Financial Analysis
15.7.3.1 Net Revenue, 2018-2022
15.7.3.2 Regional Market Shares, 2022
15.7.4 Services Offered
15.7.5 Strategic Outlook
15.8 Unither Pharmaceuticals
15.8.1 Company Snapshot
15.8.2 Company Overview
15.8.3 Services Offering
15.8.4 Strategic Outlook
15.9 Laboratorios Salvat, S.A.
15.9.1 Company Snapshot
15.9.2 Company Overview
15.9.3 Services Offered
15.9.4 Strategic Outlook
15.10 Siegfried Holding AG
15.10.1 Company Snapshot
15.10.2 Company Overview
15.10.3 Financial Analysis
15.10.3.1 Net Revenue, 2018-2022
15.10.3.2 R&D, 2018-2022
15.10.4 Services Offered
15.10.5 Strategic Outlook
15.11 Pillar5 Pharma
15.11.1 Company Snapshot
15.11.2 Company Overview
15.11.3 Service Offering
15.11.4 Strategic Outlook
15.12 Abbvie Inc.
15.12.1 Company Snapshot
15.12.2 Company Overview
15.12.3 Service Offerings
15.12.4 Strategic Outlook
15.13 Jubilant HollisterStier LLC
15.13.1 Company Snapshot
15.13.2 Company Overview
15.13.3 Service Offerings
15.13.4 Strategic Outlook
15.14 Glenmark Pharmaceuticals
15.14.1 Company Snapshot
15.14.2 Company Overview
15.14.3 Financial Analysis
15.14.3.1 Net Revenue, 2018-2022
15.14.3.2 R&D, 2021-2022
15.14.4 Product Benchmarking
15.15 Merck KGaA
15.15.1 Company Snapshot
15.15.2 Company Overview
15.15.3 Financial Analysis
15.15.3.1 Net Revenue, 2018-2022
15.15.3.2 R&D, 2018-2022
15.15.3.3 Regional Market Shares, 2022
15.15.4 Service Offerings
15.15.5 Strategic Outlook
16 Conclusion and Recommendations
16.1 Concluding Remarks from Visiongain
16.2 Recommendations for Market Players
ページTOPに戻る
List of Tables/Graphs
List of Tables
Table 1 Ophthalmic Drugs Contract Manufacturing Market Snapshot, 2023 & 2033 (US$ Million, CAGR %)
Table 2 Global Ophthalmic Drugs Contract Manufacturing Market Forecast by Region 2023-2033 (US$ Mn, AGR%, CAGR%): "V" Shaped Recovery
Table 3 Global Ophthalmic Drugs Contract Manufacturing Market Forecast by Region 2023-2033 (US$ Million, AGR%, CAGR%): "U" Shaped Recovery
Table 4 Global Ophthalmic Drugs Contract Manufacturing Market Forecast by Region 2023-2033 (US$ Million, AGR%, CAGR%): "W" Shaped Recovery
Table 5 Global Ophthalmic Drugs Contract Manufacturing Market Forecast by Region 2023-2033 (US$ Million, AGR%, CAGR%): "L" Shaped Recovery
Table 6 Global Ophthalmic Drugs Contract Manufacturing Market Forecast by Product Type, 2023-2033 (US$ Million, AGR%, CAGR %)
Table 7 APIs Segment Market Forecast by Region, 2023-2033 (US$ Million, AGR%, CAGR %)
Table 8 FDFs Segment Market Forecast by Region, 2023-2033 (US$ Million, AGR%, CAGR %)
Table 9 Global FDFs in Ophthalmic Drugs Contract Manufacturing Market Forecast by Product Type, 2023-2033 (US$ Million, AGR%, CAGR %)
Table 10 Global Ophthalmic Drugs Contract Manufacturing Market Forecast by Primary Packaging, 2023-2033 (US$ Million, AGR%, CAGR %)
Table 11 Ampoules & Vials Segment Market Forecast by Region, 2023-2033 (US$ Million, AGR%, CAGR %)
Table 12 Glass & Plastic Bottles Segment Market Forecast by Region, 2023-2033 (US$ Million, AGR%, CAGR%)
Table 13 Ointment Tubes Segment Market Forecast by Region, 2023-2033 (US$ Million, AGR%, CAGR%)
Table 14 Others Segment Market Forecast by Region, 2023-2033 (US$ Million, AGR%, CAGR%)
Table 15 Ophthalmic Drugs Contract Manufacturing Market Forecast by Scale of Manufacturing, 2023-2033 (US$ Million, AGR%, CAGR %)
Table 16 Pre-Clinical Segment Market Forecast by Region, 2023-2033 (US$ Million, AGR%, CAGR %)
Table 17 Clinical Segment Market Forecast by Region, 2023-2033 (US$ Million, AGR%, CAGR%)
Table 18 Commercial Segment Market Forecast by Region, 2023-2033 (US$ Million, AGR%, CAGR %)
Table 19 Global Ophthalmic Drugs Contract Manufacturing Market Forecast by Company Size, 2023-2033 (US$ Million, AGR%, CAGR %)
Table 20 Small Sized Segment Market Forecast by Region, 2023-2033 (US$ Million, AGR%, CAGR%)
Table 21 Mid-Sized Segment Market Forecast by Region, 2023-2033 (US$ Million, AGR%, CAGR %)
Table 22 Large Sized Segment Market Forecast by Region, 2023-2033 (US$ Million, AGR%, CAGR %)
Table 23 Global Ophthalmic Drugs Contract Manufacturing Market Forecast by Indication, 2023-2033 (US$ Million, AGR%, CAGR %)
Table 24 Age-Related Macular Degeneration Segment Market Forecast by Region, 2023-2033 (US$ Million, AGR%, CAGR%)
Table 25 Glaucoma Segment Market Forecast by Region, 2023-2033 (US$ Million, AGR%, CAGR %)
Table 26 Uveitis Segment Market Forecast by Region, 2023-2033 (US$ Million, AGR%, CAGR %)
Table 27 Dry eye disease Segment Market Forecast by Region, 2023-2033 (US$ Million, AGR%, CAGR%)
Table 28 Others Segment Market Forecast by Region, 2023-2033 (US$ Million, AGR%, CAGR%)
Table 29 Global Ophthalmic Drugs Contract Manufacturing Market Forecast by Region 2023-2033 (US$ Million, AGR%, CAGR%)
Table 30 North America Ophthalmic Drugs Contract Manufacturing Market Forecast by Country, 2023-2033 (US$ Million, AGR%, CAGR%)
Table 31 North America Ophthalmic Drugs Contract Manufacturing Market Forecast by Product Type, 2023-2033 (US$ Million, AGR%, CAGR %)
Table 32 North America FDFs Market Forecast by Product Type, 2023-2033 (US$ Million, AGR%, CAGR%)
Table 33 North America Ophthalmic Drugs Contract Manufacturing Market Forecast by Primary Packaging, 2023-2033 (US$ Million, AGR%, CAGR %)
Table 34 North America Ophthalmic Drugs Contract Manufacturing Market Forecast by Scale of Manufacturing, 2023-2033 (US$ Million, AGR%, CAGR %)
Table 35 North America Ophthalmic Drugs Contract Manufacturing Market Forecast by Company Size, 2023-2033 (US$ Million, AGR%, CAGR %)
Table 36 North America Ophthalmic Drugs Contract Manufacturing Market Forecast by Indication, 2023-2033 (US$ Million, AGR%, CAGR %)
Table 37 U.S. Ophthalmic Drugs Contract Manufacturing Market Forecast by Country, 2023-2033 (US$ Million, AGR%, CAGR %)
Table 38 Canada Ophthalmic Drugs Contract Manufacturing Market Forecast by Country, 2023-2033 (US$ Million, AGR%, CAGR %)
Table 39 Europe Ophthalmic Drugs Contract Manufacturing Market Forecast by Country, 2023-2033 (US$ Million, AGR%, CAGR %)
Table 40 Europe Ophthalmic Drugs Contract Manufacturing Market Forecast by Product Type, 2023-2033 (US$ Million, AGR%, CAGR%)
Table 41 Europe FDFs in Ophthalmic Drugs Contract Manufacturing Market Forecast by Product Type, 2023-2033 (US$ Million, AGR%, CAGR%)
Table 42 Europe Ophthalmic Drugs Contract Manufacturing Market Forecast by Primary Packaging, 2023-2033 (US$ Million, AGR%, CAGR%)
Table 43 Europe Ophthalmic Drugs Contract Manufacturing Market Forecast by Scale of Manufacturing, 2023-2033 (US$ Million, AGR%, CAGR %)
Table 44 Europe Ophthalmic Drugs Contract Manufacturing Market Forecast by Company Size, 2023-2033 (US$ Million, AGR%, CAGR%)
Table 45 Europe Ophthalmic Drugs Contract Manufacturing Market Forecast by Indication, 2023-2033 (US$ Million, AGR%, CAGR%)
Table 46 Germany Ophthalmic Drugs Contract Manufacturing Market Forecast by Country, 2023-2033 (US$ Million, AGR%, CAGR %)
Table 47 UK Ophthalmic Drugs Contract Manufacturing Market Forecast by Country, 2023-2033 (US$ Million, AGR%, CAGR %)
Table 48 France Ophthalmic Drugs Contract Manufacturing Market Forecast by Country, 2023-2033 (US$ Million, AGR%, CAGR %)
Table 49 Italy Ophthalmic Drugs Contract Manufacturing Market Forecast by Country, 2023-2033 (US$ Million, AGR%, CAGR %)
Table 50 Spain Ophthalmic Drugs Contract Manufacturing Market Forecast by Country, 2023-2033 (US$ Million, AGR%, CAGR %)
Table 51 Rest of Europe Ophthalmic Drugs Contract Manufacturing Market Forecast by Country, 2023-2033 (US$ Million, AGR%, CAGR %)
Table 52 Asia Pacific Ophthalmic Drugs Contract Manufacturing Market Forecast by Country, 2023-2033 (US$ Million, AGR%, CAGR %)
Table 53 Asia Pacific Ophthalmic Drugs Contract Manufacturing Market Forecast by Product Type, 2023-2033 (US$ Million, AGR%, CAGR%)
Table 54 Asia Pacific FDFs in Ophthalmic Drugs Contract Manufacturing Market Forecast by Product Type, 2023-2033 (US$ Million, AGR%, CAGR %)
Table 55 Asia Pacific Ophthalmic Drugs Contract Manufacturing Market Forecast by Primary Packaging, 2023-2033 (US$ Million, AGR%, CAGR%)
Table 56 Asia Pacific Ophthalmic Drugs Contract Manufacturing Market Forecast by Scale of Manufacturing, 2023-2033 (US$ Million, AGR%, CAGR%)
Table 57 Asia Pacific Ophthalmic Drugs Contract Manufacturing Market Forecast by Company Size, 2023-2033 (US$ Million, AGR%, CAGR%)
Table 58 Asia Pacific Ophthalmic Drugs Contract Manufacturing Market Forecast by Indication, 2023-2033 (US$ Million, AGR%, CAGR %)
Table 59 Japan Ophthalmic Drugs Contract Manufacturing Market Forecast by Country, 2023-2033 (US$ Million, AGR%, CAGR%)
Table 60 China Ophthalmic Drugs Contract Manufacturing Market Forecast by Country, 2023-2033 (US$ Million, AGR%, CAGR%)
Table 61 India Ophthalmic Drugs Contract Manufacturing Market Forecast by Country, 2023-2033 (US$ Million, AGR%, CAGR%)
Table 62 Australia Ophthalmic Drugs Contract Manufacturing Market Forecast by Country, 2023-2033 (US$ Million, AGR%, CAGR%)
Table 63 South Korea Ophthalmic Drugs Contract Manufacturing Market Forecast by Country, 2023-2033 (US$ Million, AGR%, CAGR %)
Table 64 Rest of Asia Pacific Ophthalmic Drugs Contract Manufacturing Market Forecast by Country, 2023-2033 (US$ Million, AGR%, CAGR %)
Table 65 Latin America Ophthalmic Drugs Contract Manufacturing Market Forecast by Country, 2023-2033 (US$ Million, AGR%, CAGR %)
Table 66 Latin America Ophthalmic Drugs Contract Manufacturing Market Forecast by Product Type, 2023-2033 (US$ Million, AGR%, CAGR %)
Table 67 Latin America FDFs in Ophthalmic Drugs Contract Manufacturing Market Forecast by Product Type, 2023-2033 (US$ Million, AGR%, CAGR %)
Table 68 Latin America Ophthalmic Drugs Contract Manufacturing Market Forecast by Primary Packaging, 2023-2033 (US$ Million, AGR%, CAGR %)
Table 69 Latin America Ophthalmic Drugs Contract Manufacturing Market Forecast by Scale of Manufacturing, 2023-2033 (US$ Million, AGR%, CAGR %)
Table 70 Latin America Ophthalmic Drugs Contract Manufacturing Market Forecast by Company Size, 2023-2033 (US$ Million, AGR%, CAGR %)
Table 71 Latin America Ophthalmic Drugs Contract Manufacturing Market Forecast by Indication, 2023-2033 (US$ Million, AGR%, CAGR %)
Table 72 Brazil Ophthalmic Drugs Contract Manufacturing Market Forecast by Country, 2023-2033 (US$ Million, AGR%, CAGR%)
Table 73 Mexico Ophthalmic Drugs Contract Manufacturing Market Forecast by Country, 2023-2033 (US$ Million, AGR%, CAGR%)
Table 74 Rest of Latin America Ophthalmic Drugs Contract Manufacturing Market Forecast by Country, 2023-2033 (US$ Million, AGR%, CAGR%)
Table 75 MEA Ophthalmic Drugs Contract Manufacturing Market Forecast by Country, 2023-2033 (US$ Million, AGR%, CAGR%)
Table 76 MEA Ophthalmic Drugs Contract Manufacturing Market Forecast by Product Type, 2023-2033 (US$ Million, AGR%, CAGR%)
Table 77 MEA FDFs in Ophthalmic Drugs Contract Manufacturing Market Forecast by Product Type, 2023-2033 (US$ Million, AGR%, CAGR%)
Table 78 MEA Ophthalmic Drugs Contract Manufacturing Market Forecast by Primary Packaging, 2023-2033 (US$ Million, AGR%, CAGR%)
Table 79 MEA Ophthalmic Drugs Contract Manufacturing Market Forecast by Scale of Manufacturing, 2023-2033 (US$ Million, AGR%, CAGR%)
Table 80 MEA Ophthalmic Drugs Contract Manufacturing Market Forecast by Company Size, 2023-2033 (US$ Million, AGR%, CAGR%)
Table 81 MEA Ophthalmic Drugs Contract Manufacturing Market Forecast by Indication, 2023-2033 (US$ Million, AGR%, CAGR%)
Table 82 GCC Ophthalmic Drugs Contract Manufacturing Market Forecast by Country, 2023-2033 (US$ Million, AGR%, CAGR%)
Table 83 South Africa Ophthalmic Drugs Contract Manufacturing Market Forecast by Country, 2023-2033 (US$ Million, AGR%, CAGR%)
Table 84 Rest of MEA Ophthalmic Drugs Contract Manufacturing Market Forecast by Country, 2023-2033 (US$ Million, AGR%, CAGR%)
Table 85 Strategic Outlook
Table 86 Lonza: Key Details, (CEO, HQ, Revenue, Founded, No. of Employees, Company Type, Website, Business Segment)
Table 87 Lonza: Services Offered
Table 88 Lonza: Strategic Outlook
Table 89 Recipharm: Key Details, (CEO, HQ, Revenue, Founded, No. of Employees, Company Type, Website, Business Segment)
Table 90 Recipharm: Product Benchmarking
Table 91 Recipharm: Strategic Outlook
Table 92 Catalent, Inc.: Key Details, (CEO, HQ, Revenue, Founded, No. of Employees, Company Type, Website, Business Segment)
Table 93 Catalent, Inc: Services Offered
Table 94 Catalent, Inc: Strategic Outlook
Table 95 Eurofins Scientific: Key Details, (CEO, HQ, Revenue, Founded, No. of Employees, Company Type, Website, Business Segment)
Table 96 Eurofins Scientific: Services Offered
Table 97 Eurofins Scientific: Strategic Outlook
Table 98 Thermo Fisher Scientific Inc: Key Details, (CEO, HQ, Revenue, Founded, No. of Employees, Company Type, Website, Business Segment)
Table 99 Thermo Fisher Scientific Inc: Services Offered
Table 100 Thermo Fisher Scientific Inc: Strategic Outlook
Table 101 Unither Pharmaceuticals: Key Details, (CEO, HQ, Founded, No. of Employees, Company Type, Website, Business Segment)
Table 102 Unither Pharmaceuticals: Service Offerings
Table 103 Unither Pharmaceuticals: Strategic Outlook
Table 104 Laboratorios Salvat, S.A: Key Details, (CEO, HQ, Founded, No. of Employees, Company Type, Website, Business Segment)
Table 105 Laboratorios Salvat, S.A: Services Offered
Table 106 Laboratorios Salvat, S.A: Strategic Outlook
Table 107 Siegfried Holding AG: Key Details, (CEO, HQ, Revenue, Founded, No. of Employees, Company Type, Website, Business Segment)
Table 108 Siegfried Holding AG: Services Offered
Table 109 Siegfried Holding AG: Strategic Outlook
Table 110 Pillar5 Pharma: Key Details, (CEO, HQ, Founded, No. of Employees, Company Type, Website, Business Segment)
Table 111 Pillar5 Pharma: Product Benchmarking
Table 112 Pillar5 Pharma: Strategic Outlook
Table 113 Abbvie Inc: Key Details, (CEO, HQ, Revenue, Founded, No. of Employees, Company Type, Website, Business Segment)
Table 114 Abbvie Inc.: Service Offerings
Table 115 Abbvie Inc.: Strategic Outlook
Table 116 Jubilant HollisterStier: Key Details, (CEO, HQ, Revenue, Founded, No. of Employees, Company Type, Website, Business Segment)
Table 117 : Service Offerings
Table 118 Jubilant HollisterStier: Strategic Outlook
Table 119 Glenmark Pharmaceuticals: Key Details, (CEO, HQ, Revenue, Founded, No. of Employees, Company Type, Website, Business Segment)
Table 120 Glenmark Pharmaceuticals: Product Benchmarking
Table 121 Merck KGaA: Key Details, (CEO, HQ, Revenue, Founded, No. of Employees, Company Type, Website, Business Segment)
Table 122 Merck KGaA: Product Benchmarking
Table 123 Merck KGaA: Strategic Outlook
List of Figures
Figure 1 Ophthalmic Drugs Contract Manufacturing Market Segmentation
Figure 2 Packaging Market by Product Type: Market Attractiveness Index
Figure 3 Ophthalmic Drugs Contract Manufacturing Market Forecast by Packaging Type: Market Attractiveness Index
Figure 4 Ophthalmic Drugs Contract Manufacturing Market Forecast by Scale of Manufacturing: Market Attractiveness Index
Figure 5 Ophthalmic drugs contract manufacturing Market Forecast by Company Size: Market Attractiveness Index
Figure 6 Ophthalmic drugs contract manufacturing Market Forecast by Indication: Market Attractiveness Index
Figure 7 Ophthalmic Drugs Contract Manufacturing Market: Attractiveness Index by Region
Figure 8 Ophthalmic drug contract manufacturing Market: Market Dynamics
Figure 9 Ophthalmic Drugs Contract Manufacturing Market by Region, 2023-2033 (US$ Million, AGR %, CAGR%): “V” Shaped Recovery
Figure 10 Ophthalmic Drugs Contract Manufacturing Market by Region, 2023-2033 (US$ Million, AGR %, CAGR %): “U” Shaped Recovery
Figure 11 Ophthalmic Drugs Contract Manufacturing Market by Region, 2023-2033 (US$ Million, AGR (%), CAGR (%)): “W” Shaped Recovery
Figure 12 Ophthalmic Drugs Contract Manufacturing Market by Region, 2023-2033 (US$ Million, AGR %, CAGR %): “L” Shaped Recovery
Figure 13 Ophthalmic Drugs Contract Manufacturing Market: Porter’s Five Forces Analysis
Figure 14 Ophthalmic Drugs Contract Manufacturing Market: PEST Analysis
Figure 15 Ophthalmic Drugs Contract Manufacturing Market by Product Type: Market Attractiveness Index
Figure 16 Ophthalmic Drugs Contract Manufacturing Market Forecast by Product Type, 2023-2033 (US$ Million, AGR %)
Figure 17 Ophthalmic Drugs Contract Manufacturing Market Share Forecast by Product Type, 2023, 2028, 2033 (%)
Figure 18 APIs Segment Market Forecast by Region, 2023-2033 (US$ Million, AGR %)
Figure 19 APIs Segment Market Share Forecast by Region, 2023 & 2033 (%)
Figure 20 FDFs Segment Market Forecast by Region, 2023-2033 (US$ Million, AGR %)
Figure 21 FDFs Segment Market Share Forecast by Region, 2023 & 2033 (%)
Figure 22 Ophthalmic Drugs Contract Manufacturing Market by Primary Packaging: Market Attractiveness Index
Figure 23 Ophthalmic Drugs Contract Manufacturing Market Forecast by Primary Packaging, 2023-2033 (US$ Million, AGR %)
Figure 24 Ophthalmic Drugs Contract Manufacturing Market Share Forecast by Primary Packaging, 2023, 2028, 2033 (%)
Figure 25 Ampoules & Vials Segment Market Forecast by Region, 2023-2033 (US$ Million, AGR %)
Figure 26 Ampoules & Vials Segment Market Share Forecast by Region, 2022 & 2032 (%)
Figure 27 Glass & Plastic Bottles Segment Market Forecast by Region, 2023-2033 (US$ Million, AGR %)
Figure 28 Glass & Plastic Bottles Segment Market Share Forecast by Region, 2023 & 2033 (%)
Figure 29 Ointment Tubes Segment Market Forecast by Region, 2023-2033 (US$ Million, AGR %)
Figure 30 Ointment Tubes Segment Market Share Forecast by Region, 2023 & 2033 (%)
Figure 31 Others Segment Market Forecast by Region, 2023-2033 (US$ Million, AGR %)
Figure 32 Others Segment Market Share Forecast by Region, 2023 & 2033 (%)
Figure 33 Ophthalmic Drugs Contract Manufacturing Market by Scale of Manufacturing: Market Attractiveness Index
Figure 34 Ophthalmic Drugs Contract Manufacturing Market Forecast by Scale of Manufacturing, 2023-2033 (US$ Million, AGR %)
Figure 35 Ophthalmic Drugs Contract Manufacturing Market Share Forecast by Scale of Manufacturing, 2023, 2028, 2033 (%)
Figure 36 Pre Clinical Segment Market Forecast by Region, 2023-2033 (US$ Million, AGR %)
Figure 37 Pre Clinical Segment Market Share Forecast by Region, 2022 & 2032 (%)
Figure 38 Clinical Segment Market Forecast by Region, 2023-2033 (US$ Million, AGR %)
Figure 39 Clinical Segment Market Share Forecast by Region, 2023 & 2033 (%)
Figure 40 Commercial Segment Market Forecast by Region, 2023-2033 (US$ Million, AGR %)
Figure 41 Commercial Segment Market Share Forecast by Region, 2023 & 2033 (%)
Figure 42 Ophthalmic Drugs Contract Manufacturing Market by Company Size: Market Attractiveness Index
Figure 43 Ophthalmic Drugs Contract Manufacturing Market Forecast by Company Size, 2023-2033 (US$ Million)
Figure 44 Ophthalmic Drugs Contract Manufacturing Market Share Forecast by Company Size, 2023, 2028, 2033 (%)
Figure 45 Small Sized Segment Market Forecast by Region, 2023-2033 (US$ Million, AGR %)
Figure 46 Small Sized Segment Market Share Forecast by Region, 2023 & 2033 (%)
Figure 47 Mid Sized Segment Market Forecast by Region, 2023-2033 (US$ Million, AGR %)
Figure 48 Mid Sized Segment Market Share Forecast by Region, 2023 & 2033 (%)
Figure 49 Large Sized Segment Market Forecast by Region, 2023-2033 (US$ Million, AGR %)
Figure 50 Large Sized Segment Market Share Forecast by Region, 2023 & 2033 (%)
Figure 51 Ophthalmic Drugs Contract Manufacturing Market by Indication: Market Attractiveness Index
Figure 52 Ophthalmic Drugs Contract Manufacturing Market Forecast by Indication, 2023-2033 (US$ Million, AGR %)
Figure 53 Ophthalmic Drugs Contract Manufacturing Market Share Forecast by Application, 2023, 2028, 2033 (%)
Figure 54 Age-Related Macular Degeneration Segment Market Forecast by Region, 2023-2033 (US$ Million, AGR %)
Figure 55 Age-Related Macular Degeneration Segment Market Share Forecast by Region, 2023 & 2033 (%)
Figure 56 Glaucoma Segment Market Forecast by Region, 2023-2033 (US$ Million, AGR %)
Figure 57 Glaucoma Segment Market Share Forecast by Region, 2023 & 2033 (%)
Figure 58 Uveitis Segment Market Forecast by Region, 2023-2033 (US$ Million, AGR %)
Figure 59 Uveitis Segment Market Share Forecast by Region, 2023 & 2033 (%)
Figure 60 Dry Eye Disease Segment Market Forecast by Region, 2023-2033 (US$ Million, AGR %)
Figure 61 Dry Eye Disease Segment Market Share Forecast by Region, 2023 & 2033 (%)
Figure 62 Others Segment Market Forecast by Region, 2023-2033 (US$ Million, AGR %)
Figure 63 Others Segment Market Share Forecast by Region, 2023 & 2033 (%)
Figure 64 Ophthalmic Drugs Contract Manufacturing Market Forecast by Region 2023, 2033 (Revenue, CAGR%)
Figure 65 Ophthalmic Drugs Contract Manufacturing Market Share Forecast by Region 2023, 2028, 2033(%)
Figure 66 Ophthalmic Drugs Contract Manufacturing Market by Region, 2023-2033 (US$ Million)
Figure 67 North America Ophthalmic Drugs Contract Manufacturing Market Attractiveness Index
Figure 68 North America Ophthalmic Drugs Contract Manufacturing Market by Country, 2023, 2028 & 2033 (US$ Million)
Figure 69 North America Ophthalmic Drugs Contract Manufacturing Market Forecast by Country, 2023-2033 (US$ Million, AGR %)
Figure 70 North America Ophthalmic Drugs Contract Manufacturing Market Share Forecast by Country, 2023 & 2033 (%)
Figure 71 North America Ophthalmic Drugs Contract Manufacturing Market Forecast by Product Type, 2023-2033 (US$ Million, AGR %)
Figure 72 North America Ophthalmic drug contract manufacturing Market Share Forecast by Product Type, 2023 & 2033 (%)
Figure 73 North America Ophthalmic Drugs Contract Manufacturing Market Forecast by Primary Packaging, 2023-2033 (US$ Million, AGR %)
Figure 74 North America Ophthalmic Drugs Contract Manufacturing Market Share Forecast by Primary Packaging, 2023 & 2033 (%)
Figure 75 North America Ophthalmic Drugs Contract Manufacturing Market Forecast by Scale of Manufacturing, 2023-2033 (US$ Million)
Figure 76 North America Ophthalmic Drugs Contract Manufacturing Market Share Forecast by Scale of Manufacturing, 2023 & 2033 (%)
Figure 77 North America Ophthalmic Drugs Contract Manufacturing Market Forecast by Company Size, 2023-2033 (US$ Million, AGR %)
Figure 78 North America Ophthalmic Drugs Contract Manufacturing Market Share Forecast by Company Size, 2023 & 2033 (%)
Figure 79 North America Ophthalmic drug contract manufacturing Market Forecast by Indication, 2023-2033 (US$ Million, AGR %)
Figure 80 North America Ophthalmic Drugs Contract Manufacturing Market Share Forecast by Indication, 2023 & 2033 (%)
Figure 81 U.S. Ophthalmic Drugs Contract Manufacturing Market Forecast, 2023-2033 (US$ Million, AGR %)
Figure 82 Canada Ophthalmic Drugs Contract Manufacturing Market Forecast, 2023-2033 (US$ Million, AGR %)
Figure 83 Europe Ophthalmic Drugs Contract Manufacturing Market Attractiveness Index
Figure 84 Europe Ophthalmic Drugs Contract Manufacturing Market by Region, 2023, 2028 & 2033 (US$ Million)
Figure 85 Europe Ophthalmic Drugs Contract Manufacturing Market Forecast by Country, 2023-2033 (US$ Million, AGR %)
Figure 86 Europe Ophthalmic Drugs Contract Manufacturing Market Share Forecast by Country, 2023 & 2033 (%)
Figure 87 Europe Ophthalmic Drugs Contract Manufacturing Market Forecast by Product Type, 2023-2033 (US$ Million, AGR %)
Figure 88 Europe Ophthalmic Drugs Contract Manufacturing Market Share Forecast by Product Type, 2023 & 2033 (%)
Figure 89 Europe Ophthalmic Drugs Contract Manufacturing Market Forecast by Primary Packaging, 2023-2033 (US$ Million, AGR %)
Figure 90 Europe Ophthalmic Drugs Contract Manufacturing Market Share Forecast by Primary Packaging, 2023 & 2033 (%)
Figure 91 Europe Ophthalmic Drugs Contract Manufacturing Market Forecast by Scale of Manufacturing, 2023-2033 (US$ Million, AGR %)
Figure 92 Europe Ophthalmic Drugs Contract Manufacturing Market Share Forecast by Scale of Manufacturing, 2023 & 2033 (%)
Figure 93 Europe Ophthalmic Drugs Contract Manufacturing Market Forecast by Company Size, 2023-2033 (US$ Million, AGR %)
Figure 94 Europe Ophthalmic Drugs Contract Manufacturing Market Share Forecast by Company Size, 2023 & 2033 (%)
Figure 95 Europe Ophthalmic drug contract manufacturing Market Forecast by Indication, 2023-2033 (US$ Million, AGR %)
Figure 96 Europe Ophthalmic Drugs Contract Manufacturing Market Share Forecast by Indication, 2023 & 2033 (%)
Figure 97 Germany Ophthalmic Drugs Contract Manufacturing Market Forecast, 2023-2033 (US$ Million, AGR %)
Figure 98 UK Ophthalmic Drugs Contract Manufacturing Market Forecast, 2023-2033 (US$ Million, AGR %)
Figure 99 France Ophthalmic Drugs Contract Manufacturing Market Forecast, 2023-2033 (US$ Million, AGR %)
Figure 100 Italy Ophthalmic Drugs Contract Manufacturing Market Forecast, 2023-2033 (US$ Million, AGR %)
Figure 101 Spain Ophthalmic Drugs Contract Manufacturing Market Forecast, 2023-2033 (US$ Million, AGR %)
Figure 102 Rest of Europe Ophthalmic Drugs Contract Manufacturing Market Forecast, 2023-2033 (US$ Million, AGR %)
Figure 103 Asia Pacific Ophthalmic Drugs Contract Manufacturing Market Attractiveness Index
Figure 104 Asia Pacific Ophthalmic Drugs Contract Manufacturing Market by Region, 2023, 2028 & 2033 (US$ Million)
Figure 105 Asia Pacific Ophthalmic Drugs Contract Manufacturing Market Forecast by Country, 2023-2033 (US$ Million, AGR %)
Figure 106 Asia Pacific Ophthalmic Drugs Contract Manufacturing Market Share Forecast by Country, 2023 & 2033 (%)
Figure 107 Asia Pacific Ophthalmic Drugs Contract Manufacturing Market Forecast by Product Type, 2023-2033 (US$ Million, AGR %)
Figure 108 Asia Pacific Ophthalmic drug contract manufacturing Market Share Forecast by Product Type, 2023 & 2033 (%)
Figure 109 Asia Pacific Ophthalmic Drugs Contract Manufacturing Market Forecast by Primary Packaging, 2023-2033 (US$ Million, AGR %)
Figure 110 Asia Pacific Ophthalmic Drugs Contract Manufacturing Market Share Forecast by Primary Packaging, 2023 & 2033 (%)
Figure 111 Asia Pacific Ophthalmic Drugs Contract Manufacturing Market Forecast by Scale of Manufacturing, 2023-2033 (US$ Million, AGR %)
Figure 112 Asia Pacific Ophthalmic Drugs Contract Manufacturing Market Share Forecast by Scale of Manufacturing, 2023 & 2033 (%)
Figure 113 Asia Pacific Ophthalmic Drugs Contract Manufacturing Market Forecast by Company Size, 2023-2033 (US$ Million, AGR %)
Figure 114 Asia Pacific Ophthalmic Drugs Contract Manufacturing Market Share Forecast by Company Size, 2023 & 2033 (%)
Figure 115 Asia Pacific Ophthalmic drug contract manufacturing Market Forecast by Indication, 2023-2033 (US$ Million, AGR %)
Figure 116 Asia Pacific Ophthalmic Drugs Contract Manufacturing Market Share Forecast by Indication, 2023 & 2033 (%)
Figure 117 Japan Ophthalmic Drugs Contract Manufacturing Market Forecast, 2023-2033 (US$ Million, AGR %)
Figure 118 China Ophthalmic Drugs Contract Manufacturing Market Forecast, 2023-2033 (US$ Million, AGR %)
Figure 119 India Ophthalmic Drugs Contract Manufacturing Market Forecast, 2023-2033 (US$ Million, AGR %)
Figure 120 Australia Ophthalmic Drugs Contract Manufacturing Market Forecast, 2023-2033 (US$ Million, AGR %)
Figure 121 South Korea Ophthalmic Drugs Contract Manufacturing Market Forecast, 2023-2033 (US$ Million, AGR %)
Figure 122 Rest of Asia Pacific Ophthalmic Drugs Contract Manufacturing Market Forecast, 2023-2033 (US$ Million, AGR %)
Figure 123 Latin America Ophthalmic Drugs Contract Manufacturing Market Attractiveness Index
Figure 124 Latin America Ophthalmic Drugs Contract Manufacturing Market by Region, 2023, 2028 & 2033 (US$ Million)
Figure 125 Latin America Ophthalmic Drugs Contract Manufacturing Market Forecast by Country, 2023-2033 (US$ Million, AGR %)
Figure 126 Latin America Ophthalmic Drugs Contract Manufacturing Market Share Forecast by Country, 2023 & 2033 (%)
Figure 127 Latin America Ophthalmic Drugs Contract Manufacturing Market Forecast by Product Type, 2023-2033 (US$ Million, AGR %)
Figure 128 Latin America Ophthalmic drug contract manufacturing Market Share Forecast by Product Type, 2023 & 2033 (%)
Figure 129 Latin America Ophthalmic Drugs Contract Manufacturing Market Forecast by Primary Packaging, 2023-2033 (US$ Million, AGR %)
Figure 130 Latin America Ophthalmic Drugs Contract Manufacturing Market Share Forecast by Primary Packaging, 2023 & 2033 (%)
Figure 131 Latin America Ophthalmic Drugs Contract Manufacturing Market Forecast by Scale of Manufacturing, 2023-2033 (US$ Million, AGR %)
Figure 132 Latin America Ophthalmic Drugs Contract Manufacturing Market Share Forecast by Scale of Manufacturing, 2023 & 2033 (%)
Figure 133 Latin America Ophthalmic Drugs Contract Manufacturing Market Forecast by Company Size, 2023-2033 (US$ Million, AGR %)
Figure 134 Latin America Ophthalmic Drugs Contract Manufacturing Market Share Forecast by Company Size, 2023 & 2033 (%)
Figure 135 Latin America Ophthalmic drug contract manufacturing Market Forecast by Indication, 2023-2033 (US$ Million, AGR %)
Figure 136 Latin America Ophthalmic Drugs Contract Manufacturing Market Share Forecast by Indication, 2023 & 2033 (%)
Figure 137 Brazil Ophthalmic Drugs Contract Manufacturing Market Forecast, 2023-2033 (US$ Million, AGR %)
Figure 138 Mexico Ophthalmic Drugs Contract Manufacturing Market Forecast, 2023-2033 (US$ Million, AGR %)
Figure 139 Rest of Latin America Ophthalmic Drugs Contract Manufacturing Market Forecast, 2023-2033 (US$ Million, AGR %)
Figure 140 MEA Ophthalmic Drugs Contract Manufacturing Market Attractiveness Index
Figure 141 MEA Ophthalmic Drugs Contract Manufacturing Market by Region, 2023, 2028 & 2033 (US$ Million)
Figure 142 MEA Ophthalmic Drugs Contract Manufacturing Market Forecast by Country, 2023-2033 (US$ Million, AGR %)
Figure 143 MEA Ophthalmic Drugs Contract Manufacturing Market Share Forecast by Country, 2023 & 2033 (%)
Figure 144 MEA Ophthalmic Drugs Contract Manufacturing Market Forecast by Product Type, 2023-2033 (US$ Million, AGR %)
Figure 145 MEA Ophthalmic drug contract manufacturing Market Share Forecast by Product Type, 2023 & 2033 (%)
Figure 146 MEA Ophthalmic Drugs Contract Manufacturing Market Forecast by Primary Packaging, 2023-2033 (US$ Million, AGR %)
Figure 147 MEA Ophthalmic Drugs Contract Manufacturing Market Share Forecast by Primary Packaging, 2023 & 2033 (%)
Figure 148 MEA Ophthalmic Drugs Contract Manufacturing Market Forecast by Scale of Manufacturing, 2023-2033 (US$ Million, AGR %)
Figure 149 MEA Ophthalmic Drugs Contract Manufacturing Market Share Forecast by Scale of Manufacturing, 2023 & 2033 (%)
Figure 150 MEA Ophthalmic Drugs Contract Manufacturing Market Forecast by Company Size, 2023-2033 (US$ Million, AGR %)
Figure 151 MEA Ophthalmic Drugs Contract Manufacturing Market Share Forecast by Company Size, 2023 & 2033 (%)
Figure 152 MEA Ophthalmic drug contract manufacturing Market Forecast by Indication, 2023-2033 (US$ Million, AGR %)
Figure 153 MEA Ophthalmic Drugs Contract Manufacturing Market Share Forecast by Indication, 2023 & 2033 (%)
Figure 154 GCC Ophthalmic Drugs Contract Manufacturing Market Forecast, 2023-2033 (US$ Million, AGR %)
Figure 155 South Africa Ophthalmic Drugs Contract Manufacturing Market Forecast, 2023-2033 (US$ Million, AGR %)
Figure 156 Rest of MEA Ophthalmic Drugs Contract Manufacturing Market Forecast, 2023-2033 (US$ Million, AGR %)
Figure 157 Ophthalmic Drugs Contract Manufacturing Market: Company Share/Ranking, 2022
Figure 158 Lonza: Net Revenue, 2018-2022 (US$ Million, AGR%)
Figure 159 Lonza: R&D, 2021-2022 (US$ Million, AGR%)
Figure 160 Recipharm: Net Revenue, 2018-2022 (US$ Million, AGR%)
Figure 161 Catalent, Inc: Net Revenue, 2018-2022 (US$ Million, AGR%)
Figure 162 Catalent, Inc: R&D, 2018-2022 (US$ Million, AGR%)
Figure 163 Catalent, Inc: Regional Market Shares, 2022
Figure 164 Eurofins Scientific: Net Revenue, 2018-2022 (US$ Million, AGR%)
Figure 165 Eurofins Scientific: Regional Market Shares, 2022
Figure 166 Thermo Fisher Scientific Inc: Net Revenue, 2018-2022 (US$ Million, AGR%)
Figure 167 Thermo Fisher Scientific Inc: Regional Market Shares, 2022
Figure 168 Siegfried Holding AG: Net Revenue, 2018-2022 (US$ Million, AGR%)
Figure 169 Siegfried Holding AG: R&D, 2018-2022 (US$ Million, AGR%)
Figure 170 Glenmark Pharmaceuticals: Net Revenue, 2018-2022 (US$ Million, AGR%)
Figure 171 Glenmark Pharmaceuticals: R&D, 2021-2022 (US$ Million, AGR%)
Figure 172 Merck KGaA: Net Revenue, 2018-2022 (US$ Million, AGR%)
Figure 173 Merck KGaA: R&D, 2018-2022 (US$ Million, AGR%)
Figure 174 Merck KGaA: Regional Market Shares, 2022
ページTOPに戻る
本レポートと同分野(医療)の最新刊レポート
- Protein Diagnostics Market
- Spasticity Treatment Market
- Pharmaceutical Sterility Testing Market
- 外科用機器:テクノロジーと世界市場
- 細胞療法市場(細胞療法の種類:細胞療法タイプ:T細胞療法, 幹細胞療法, ナチュラルキラー細胞, 樹状細胞, その他の細胞療法; 起源:起源:自己細胞療法, 同種細胞療法; 治療領域:がん疾患, 自己免疫疾患, 神経疾患, その他) - 世界の産業分析、規模、シェア、成長、動向、予測、2024-2034年
- オリゴヌクレオチド市場(Type:アンチセンスオリゴヌクレオチド、DNAオリゴ、siRNA、その他;用途:用途:分子生物学、遺伝子治療、医薬品開発、診断、その他;エンドユーザー:病院、製薬・バイオファーマ企業、診断研究所、バイオテクノロジー企業、CRO・CMO、その他) - 世界の産業分析、規模、シェア、成長、動向、予測、2024-2034年
- ドイツ、ベルギー、オランダの研究用消耗品市場(製品タイプ:試薬・キット、一般研究用消耗品、用途:研究開発、診断、生物生産、その他、エンドユーザー:滅菌受託施設、製薬・バイオ製薬会社、食品・飲料会社、病院・研究機関、その他) - 産業分析、規模、シェア、成長、動向、予測、2024-2034年
- MRIコイル市場(コイルタイプ:高周波コイル、勾配コイル、サーフェスコイル、その他(ボリュームコイル、シムコイル、アレイコイルなど);アプリケーション:用途:神経, 心臓血管, 筋骨格系, 腫瘍, その他(消化器など) - 世界の産業分析、規模、シェア、成長、動向、予測、2024-2034年
- 梅毒免疫測定診断市場(製品:分析装置、キット・試薬);技術:(化学発光測定法(CLIA)、酵素結合免疫吸着測定法(ELISA)、免疫クロマトグラフィー測定法/ラテラルフロー測定法、トレポネーマ・パリダム・ラテックス凝集法(TPLA)、非トレポネーマル凝集測定法) - 世界の産業分析、規模、シェア、成長、動向、予測、2024年~2034年
- 持続可能な包装市場:産業動向と2035年までの世界予測
Visiongain社の医薬・化学品分野での最新刊レポート
本レポートと同じKEY WORD(contract)の最新刊レポート
よくあるご質問
Visiongain社はどのような調査会社ですか?
英国の調査会社ヴィジョンゲイン社(Visiongain)は、通信とエネルギーのほか、自動車や化学・医薬品、金属など、広範な市場を対象に調査を行っています。自動車市場については、市場全般に関する調査のほ... もっと見る
調査レポートの納品までの日数はどの程度ですか?
在庫のあるものは速納となりますが、平均的には 3-4日と見て下さい。
但し、一部の調査レポートでは、発注を受けた段階で内容更新をして納品をする場合もあります。
発注をする前のお問合せをお願いします。
注文の手続きはどのようになっていますか?
1)お客様からの御問い合わせをいただきます。
2)見積書やサンプルの提示をいたします。
3)お客様指定、もしくは弊社の発注書をメール添付にて発送してください。
4)データリソース社からレポート発行元の調査会社へ納品手配します。
5) 調査会社からお客様へ納品されます。最近は、pdfにてのメール納品が大半です。
お支払方法の方法はどのようになっていますか?
納品と同時にデータリソース社よりお客様へ請求書(必要に応じて納品書も)を発送いたします。
お客様よりデータリソース社へ(通常は円払い)の御振り込みをお願いします。
請求書は、納品日の日付で発行しますので、翌月最終営業日までの当社指定口座への振込みをお願いします。振込み手数料は御社負担にてお願いします。
お客様の御支払い条件が60日以上の場合は御相談ください。
尚、初めてのお取引先や個人の場合、前払いをお願いすることもあります。ご了承のほど、お願いします。
データリソース社はどのような会社ですか?
当社は、世界各国の主要調査会社・レポート出版社と提携し、世界各国の市場調査レポートや技術動向レポートなどを日本国内の企業・公官庁及び教育研究機関に提供しております。
世界各国の「市場・技術・法規制などの」実情を調査・収集される時には、データリソース社にご相談ください。
お客様の御要望にあったデータや情報を抽出する為のレポート紹介や調査のアドバイスも致します。
|
|

