AI活用の創薬・臨床試験市場レポート:2023-2033
AI-Enabled Drug Discovery and Clinical Trials Market Report 2023-2033
レポート詳細
AI活用の創薬・臨床試験市場レポート 2023-2033年 : 本レポートは、業界とその基礎となる原動力をより深く理解したい場合、新たな収益ポケットを目指す大手企業にとって貴重なものとな... もっと見る
※上記価格は部署ライセンス(Departmental licence)価格です。
その他の価格についてはデータリソースまでお問合せください。
日本語のページは自動翻訳を利用し作成しています。
実際のレポートは英文のみでご納品いたします。
サマリー
レポート詳細
AI活用の創薬・臨床試験市場レポート 2023-2033年: 本レポートは、業界とその基礎となる原動力をより深く理解したい場合、新たな収益ポケットを目指す大手企業にとって貴重なものとなるでしょう。また、異業種への進出や新規地域での既存事業の拡大を目指す企業にも有用です。
ヘルスケアにおけるAIアプリケーションの認知度向上が市場成長を後押し
ヘルスケアサービスにおけるAIアプリケーションの台頭により、AI対応ソリューションに対する人々の認識と受容が高まっている。そのため、これらのソリューションを創薬や臨床試験のプロセスに取り入れようとする製薬企業が増えている。製薬業界では、AIを活用したドラッグデリバリー・ソリューションの人気が高まっている。これらのソリューションには、より効率的で効果的な薬物送達方法を開発するために人工知能技術を利用することが含まれる。ドラッグデリバリーにおけるAIの活用は、コスト削減、薬剤の有効性と安全性の向上、より良い患者の転帰の実現など、業界を変革する可能性を秘めている。
AIベースのドラッグデリバリー・ソリューションの市場は今後数年で成長すると予想され、すでに多くの企業がそのようなソリューションを提供または開発している。この市場の主要プレーヤーには以下のような企業がある:
- ノバルティス - ノバルティスは、呼吸器疾患治療のためのスマート吸入器の開発に注力しており、AIベースのドラッグデリバリー市場における主要企業のひとつである。
- メドトロニック - メドトロニックは医療機器メーカーで、糖尿病患者のインスリンデリバリーを改善するためにAIベースのドラッグデリバリープラットフォームを構築している。
- インシリコ・メディシン - インシリコ・メディシンは創薬企業で、新薬やドラッグデリバリー方法の開発にAIを活用している。
- ジョンソン・エンド・ジョンソン - ジョンソン・エンド・ジョンソンは、スマート薬物注入コンタクトレンズや埋め込み型薬物送達デバイスなど、個別化された薬物送達ソリューションを開発するためにAIを利用している。
- GSK - GSKはAIを利用して、患者の呼吸パターンに基づいて投与量を調整できる吸入器を開発している。
市場関係者間の競争が激化する中、企業は時代の先端を行くために研究開発に多額の投資を行っている。これによりイノベーションが促進され、ドラッグデリバリー業界で可能なことの限界に挑戦している。将来的には、AIベースのドラッグデリバリー・ソリューションはますます洗練され、個別化され、ターゲットを絞ったものになり、患者の転帰を改善し、製薬業界を変革していくでしょう。
市場成長の妨げとなる熟練人材の不足
薬効の解釈や潜在的な副作用の予測を含む活動は、市場に大きな制約をもたらす可能性があるため、患者の安全性は創薬段階における重要な課題である。さらに、熟練した人材の不足や創薬開発のためのデータセットが不十分であることも、市場成長に影響を与えかねない重要な要因である。創薬にAIシステムを導入するには、企業はシステム設計、管理、導入の専門知識を持つ必要がある。AIの複雑性を考えると、これらのシステムに携わる人材は、機械学習、深層学習、その他の人工知能の側面などの技術について深い理解を持つ必要がある。人間の脳の行動を再現するためにAI技術を既存のシステムに組み込むには、かなりのデータ処理が必要になる。AI/MLの開発は、専門的な基準や認定がないために制限されている。
市場調査レポートを購入する前にすべき質問とは?
- AI活用の創薬・臨床試験市場はどのように進化しているのか?
- AI活用の創薬・臨床試験市場の推進要因と阻害要因は何か?
- AI活用の創薬・臨床試験サブマーケットの各セグメントは予測期間中にどのように成長し、2033年にどれくらいの収益を占めるのか?
- 各AI活用の創薬・臨床試験サブマーケットの市場シェアは2023年から2033年にかけてどのように推移するのか?
- 2023年から2033年にかけて、市場全体の主な牽引役となるのは何か?
- 主要なAI活用の創薬・臨床試験市場はマクロ経済の動きに大枠で追随するのか、それとも各国市場が他を凌駕するのか?
- 2033年までに各国市場のシェアはどのように変化し、2033年にはどの地域が市場をリードするのか?
- 主要プレイヤーは誰で、予測期間中の見通しは?
- これらの大手企業のAI活用の創薬・臨床試験プロジェクトは?
- 2023年から2033年の間に、業界はどのように進化するのか?現在および今後10年間に実施されるAI活用の創薬・臨床試験プロジェクトにはどのような意味があるのか?
- AI活用の創薬・臨床試験市場をさらに拡大するために、製品化の必要性は高まっていますか?
- AI活用の創薬・臨床試験市場はどこに向かい、どのようにすれば市場の最前線に立てるのか?
- 新製品やサービスラインに対する最適な投資オプションは何か?
- 企業を新たな成長軌道に乗せ、C-suiteに移行させるための重要な展望とは?
AI活用の創薬・臨床試験市場が現在、そして今後10年間でどのような影響を受けるのか、ぜひご覧ください:
- 本レポートは267ページにわたり、102の表と151の図表で構成されています。
- 本レポートでは、業界における主要な有利分野をハイライトしているため、今すぐターゲットを絞ることができます。
- 世界、地域、国の売上と成長に関する詳細な分析が含まれています。
- 競合他社が成功した主なトレンド、変化、収益予測をハイライトしています。
本レポートは、AI活用の創薬・臨床試験市場が今後10年間でどのように発展し、COVID-19の景気後退と好転の変動に合わせて変化するかをお伝えします。この市場は、過去10年間のどの時点よりも今が重要である。
2033年までの予測やその他の分析から、商業的な展望が明らかになる
- 2033年までの収益予測に加え、直近の業績、成長率、市場シェアもご覧いただけます。
- ビジネスの展望と展開に関する独自の分析をご覧いただけます。
- 定性的分析(市場ダイナミクス、促進要因、機会、阻害要因、課題を含む)、コスト構造、AI活用の創薬・臨床試験価格上昇の影響、最近の動向をご覧いただけます。
本レポートには、COVID-19が業界と貴社にどのような影響を与えるかについてのデータ分析と貴重な洞察が含まれている。本レポートでは、COVID-19の4つの回収パターンとその影響、すなわち「V」、「L」、「W」、「U」について論じている。
レポート対象セグメント
コンポーネント展望
- サービス
- ソフトウェア
用途
- 臨床試験
- 医薬品デザイン
- データ集約と分析
- 薬剤の特性解析
- バイオマーカー研究
- その他
治療領域
- 腫瘍学
- 循環器疾患
- 感染症
- 神経変性疾患
- 代謝性疾患
- その他
エンドユーザー
- 製薬・バイオ医薬品企業
- 医薬品開発業務受託機関(CRO)
- その他
世界市場全体と各分野の売上予測に加え、5つの地域と18の主要国市場の売上予測も掲載しています:
北米
- アメリカ
- カナダ
欧州
- ドイツ
- 英国
- フランス
- スペイン
- イタリア
- ロシア
- その他の欧州
アジア太平洋
- 中国
- 日本
- インド
- オーストラリア
- 韓国
- その他のアジア太平洋地域
ラテンアメリカ
- ブラジル
- メキシコ
- アルゼンチン
- その他のラテンアメリカ
MEA
- GCC
- 南アフリカ
- その他のMEA
このレポートには、AI活用の創薬・臨床試験市場の2023年から2033年にかけての主要企業のプロファイルも掲載しています。
主要企業と市場成長の可能性
・ AbbVie Inc.
・ Exscientia
・ GNS Healthcare
・ IBM Watson
・ Merck & Co., Inc.
・ Novartis AG
・ PathAI
・ Saama Technologies
・ Unlearn.AI, Inc.
AI活用の創薬・臨床試験市場の2023年~2033年の世界全体の売上高は、金額ベースで2023年に21億5,680万米ドルを超えると弊社は算出した。2033年まで力強い収益成長を予測しています。当研究所では、最も大きな可能性を秘めた組織を特定しています。彼らの能力、進歩、商業的展望を発見し、一歩先を行くお手伝いをします。
AI活用の創薬・臨床試験市場、2023年から2033年までのレポートはどのようにお役に立ちますか?
要約すると、260ページを超えるこのレポートは、以下の知識を提供する:
- AI活用の創薬・臨床試験市場の2023年〜2033年までの収益予測 世界および地域レベルで、コンポーネント、アプリケーション、治療分野、エンドユーザーごとに予測 - 業界の展望を発見し、投資と収益に最も有利な場所を見つけます。
- 5つの地域と18の主要国市場の2033年までの収益予測 - AI活用の創薬・臨床試験市場の2023年から2033年までの北米、ヨーロッパ、アジア太平洋、ラテンアメリカ、MEAの市場予測をご覧ください。また、米国、カナダ、メキシコ、ブラジル、ドイツ、フランス、英国、イタリア、中国、インド、日本、オーストラリアなどの著名経済圏の市場も予測しています。
- 既存企業および市場参入を目指す企業の展望 - AI活用の創薬・臨床試験市場に関わる主要企業9社の企業プロファイルを含む、2023年から2033年までの展望。
独自の予測による定量的・定性的分析をご覧ください。私たちのレポートだけに含まれる情報を入手し、貴重なビジネスインテリジェンスで情報を得ることができます。
他にはない情報
私たちの新しいレポートがあれば、知識に遅れをとったり、チャンスを逃したりする可能性が低くなります。弊社のレポートが貴社の調査、分析、意思決定にどのように役立つかをご覧ください。Visiongainの調査は、AI活用の創薬・臨床試験市場、2023年から2033年、市場をリードする企業の商業分析を必要とするすべての人のためのものです。データ、トレンド、予測をご覧いただけます。
ページTOPに戻る
目次
目次
1 レポートの概要
1.1 研究の目的
1.2 AI活用の創薬・臨床試験市場の紹介
1.3 本レポートの内容
1.4 本レポートを読むべき理由
1.5 本分析レポートが回答する主な質問
1.6 本レポートは誰のためのものか?
1.7 方法論
1.7.1 市場の定義
1.7.2 市場評価・予測手法
1.7.3 データの検証
1.7.3.1 一次調査
1.7.3.2 セカンダリーリサーチ
1.8 よくある質問(FAQ)
1.9 Visiongainの関連レポート
1.10 Visiongainについて
2 エグゼクティブ・サマリー
3 市場の概要
3.1 主要な調査結果
3.2 市場ダイナミクス
3.2.1 市場促進要因
3.2.1.1 個別化医療に対する需要の高まり
3.2.1.2 技術の進歩
3.2.1.3 医療におけるAIの認知度の高まり
3.2.1.4 AI対応ソリューションの費用対効果
3.2.2 市場抑制要因
3.2.2.1 市場成長の妨げとなる熟練人材の不足
3.2.2.2 限られたデータの入手可能性がAI対応ソリューションの採用における大きな課題
3.2.2.3 新しいAI対応ソリューションと既存インフラとの統合に伴う課題
3.2.2.4 倫理とデータプライバシーの問題が市場成長の妨げに
3.2.2.5 世界市場の成長を抑制する規制上のハードル
3.2.3 市場機会
3.2.3.1 患者転帰の改善
3.2.3.2 製薬・バイオファーマ企業の臨床試験におけるAI活用ソリューションの採用増加
3.3 COVID-19インパクト分析
3.4 ポーターのファイブフォース分析
3.4.1 サプライヤーの交渉力
3.4.2 買い手の交渉力
3.4.3 競争相手のライバル関係
3.4.4 代替品による脅威
3.4.5 新規参入企業の脅威
3.5 PEST分析
4 AI活用の創薬・臨床試験市場分析:コンポーネント別
4.1 主要な調査結果
4.2 コンポーネントセグメント 市場魅力度指数
4.3 AI活用の創薬・臨床試験市場:コンポーネント別市場規模推定と予測
4.4 サービス
4.4.1 2023〜2033年の地域別市場規模(US$ Million)
4.4.2 地域別市場シェア、2023年・2033年(%)
4.5 ソフトウェアソリューション
4.5.1 2023~2033年の地域別市場規模(US$ Million)
4.5.2 地域別市場シェア、2023年・2033年(%)
5 AI活用の創薬・臨床試験市場分析:用途別
5.1 主要な調査結果
5.2 用途セグメント 市場魅力度指数
5.3 AI活用の創薬・臨床試験市場:用途別市場規模推定と予測
5.4 臨床試験
5.4.1 2023〜2033年の地域別市場規模(US$ Million)
5.4.2 地域別市場シェア、2023年・2033年(%)
5.5 ドラッグデザイン
5.5.1 2023〜2033年の地域別市場規模(US$ Million)
5.5.2 地域別市場シェア、2023年・2033年(%)
5.6 データ集約と分析
5.6.1 2023~2033年の地域別市場規模(US$ Million)
5.6.2 地域別市場シェア、2023年・2033年(%)
5.7 医薬品の特性解析
5.7.1 2023〜2033年の地域別市場規模(US$ Million)
5.7.2 地域別市場シェア、2023年・2033年(%)
5.8 バイオマーカー研究
5.8.1 2023~2033年の地域別市場規模(US$ Million)
5.8.2 地域別市場シェア、2023年・2033年(%)
5.9 その他
5.9.1 2023〜2033年の地域別市場規模(US$ Million)
5.9.2 地域別市場シェア、2023年・2033年 (%)
6 AI活用の創薬・臨床試験市場分析治療:分野別
6.1 主な調査結果
6.2 治療領域セグメント 市場魅力度指数
6.3 AI活用の創薬・臨床試験市場:治療領域別市場規模の推定と予測
6.4 がん領域
6.4.1 2023〜2033年の地域別市場規模(US$ Million)
6.4.2 地域別市場シェア、2023年・2033年(%)
6.5 循環器疾患
6.5.1 2023〜2033年の地域別市場規模(US$ Million)
6.5.2 地域別市場シェア、2023年・2033年(%)
6.6 感染症
6.6.1 2023〜2033年の地域別市場規模(US$ Million)
6.6.2 地域別市場シェア、2023年・2033年(%)
6.7 神経変性疾患
6.7.1 2023〜2033年の地域別市場規模(US$ Million)
6.7.2 地域別市場シェア、2023年・2033年(%)
6.8 代謝性疾患
6.8.1 2023〜2033年の地域別市場規模(US$ Million)
6.8.2 地域別市場シェア、2023年・2033年(%)
6.9 その他
6.9.1 2023〜2033年の地域別市場規模(US$ Million)
6.9.2 地域別市場シェア、2023年・2033年(%)
7 AI活用の創薬・臨床試験市場分析:エンドユーザー別
7.1 主要な調査結果
7.2 エンドユーザー別セグメント 市場魅力度指数
7.3 AI活用の創薬・臨床試験市場:エンドユーザー別市場規模の推定と予測
7.4 製薬・バイオ医薬品企業
7.4.1 2023〜2033年の地域別市場規模(US$ Million)
7.4.2 地域別市場シェア、2023年・2033年(%)
7.5 医薬品開発業務受託機関(CROs)
7.5.1 2023年~2033年の地域別市場規模(US$ Million)
7.5.2 地域別市場シェア、2023年・2033年(%)
7.6 その他
7.6.1 2023〜2033年の地域別市場規模(US$ Million)
7.6.2 地域別市場シェア、2023年~2033年 (%)
8 AI活用の創薬・臨床試験市場分析:地域別
8.1 主要な調査結果
8.2 地域別市場規模の推定と予測
9 北米のAI活用の創薬・臨床試験市場分析
9.1 主要な調査結果
9.2 北米のAI活用の創薬・臨床試験市場魅力度指数
9.3 北米のAI活用の創薬・臨床試験市場の国別市場規模、2023年、2028年、2033年(US$ Million)
9.4 北米のAI活用の創薬・臨床試験市場規模推定と予測:国別
9.5 北米のAI活用の創薬・臨床試験市場規模推定と予測:コンポーネント別
9.6 北米のAI活用の創薬・臨床試験市場規模推定と予測:用途別
9.7 北米のAI活用の創薬・臨床試験市場規模推定と予測:治療分野別
9.8 北米のAI活用の創薬・臨床試験市場規模推定と予測:エンドユーザー別
9.9 米国のAI活用の創薬・臨床試験市場分析
9.10 カナダのAI活用の創薬・臨床試験市場分析
10 欧州のAI活用の創薬・臨床試験市場分析
10.1 主要な調査結果
10.2 欧州のAI活用の創薬・臨床試験市場魅力度指数
10.3 欧州のAI活用の創薬・臨床試験国別市場、2023年、2028年、2033年(US$ Million)
10.4 欧州のAI活用の創薬・臨床試験市場規模推定と予測:国別
10.5 欧州のAI活用の創薬・臨床試験市場規模推定と予測:コンポーネント別
10.6 欧州のAI活用の創薬・臨床試験市場規模推定と予測:用途別
10.7 欧州のAI活用の創薬・臨床試験市場規模推定と予測:治療分野別
10.8 欧州のAI活用の創薬・臨床試験市場規模推定と予測:エンドユーザー別
10.9 ドイツのAI活用の創薬・臨床試験市場分析
10.10 イギリスのAI活用の創薬・臨床試験市場分析
10.11 フランスのAI活用の創薬・臨床試験市場分析
10.12 イタリアのAI活用の創薬・臨床試験市場分析
10.13 スペインのAI活用の創薬・臨床試験市場分析
10.14 ロシアのAI活用の創薬・臨床試験市場分析
10.15 その他の欧州のAI活用の創薬・臨床試験市場分析
11 アジアのAI活用の創薬・臨床試験市場分析
11.1 主要な調査結果
11.2 アジアのAI活用の創薬・臨床試験市場魅力度指数
11.3 アジアのAI活用の創薬・臨床試験国別市場、2023年、2028年、2033年(US$ Million)
11.4 アジアのAI活用の創薬・臨床試験市場規模推定と予測:国別
11.5 アジア太平洋地域のAI活用の創薬・臨床試験市場規模推定と予測:コンポーネント別
11.6 アジア太平洋地域のAI活用の創薬・臨床試験市場規模推定と予測:用途別
11.7 アジア太平洋地域のAI活用の創薬・臨床試験市場規模推定と予測:治療分野別
11.8 アジア太平洋地域のAI活用の創薬・臨床試験市場規模推定と予測:エンドユーザー別
11.9 日本のAI活用の創薬・臨床試験市場分析
11.10 中国のAI活用の創薬・臨床試験市場分析
11.11 インドのAI活用の創薬・臨床試験市場分析
11.12 オーストラリアのAI活用の創薬・臨床試験市場分析
11.13 韓国のAI活用の創薬・臨床試験市場の分析
11.14 その他のアジアのAI活用の創薬・臨床試験市場分析
12 ラテンアメリカのAI活用の創薬・臨床試験市場分析
12.1 主要な調査結果
12.2 ラテンアメリカのAI活用の創薬・臨床試験市場魅力度指数
12.3 ラテンアメリカのAI活用の創薬・臨床試験市場の国別市場規模、2023年、2028年、2033年(US$ Million)
12.4 ラテンアメリカのAI活用の創薬・臨床試験市場規模推定と予測:国別
12.5 ラテンアメリカのAI活用の創薬・臨床試験市場規模推定と予測:コンポーネント別
12.6 ラテンアメリカのAI活用の創薬・臨床試験市場規模推定と予測:用途別
12.7 ラテンアメリカのAI活用の創薬・臨床試験市場規模推定と予測:治療分野別
12.8 ラテンアメリカのAI活用の創薬・臨床試験市場規模推定と予測:エンドユーザー別
12.9 ブラジルのAI活用の創薬・臨床試験市場分析
12.10 メキシコのAI活用の創薬・臨床試験市場分析
12.11 アルゼンチンのAI活用の創薬・臨床試験市場分析
12.12 その他のラテンアメリカのAI活用の創薬・臨床試験市場分析
13 MEAのAI活用の創薬・臨床試験市場分析
13.1 主要な調査結果
13.2 MEAのAI活用の創薬・臨床試験市場魅力度指数
13.3 MEAのAI活用の創薬・臨床試験国別市場、2023年、2028年、2033年(US$ Million)
13.4 MEAのAI活用の創薬・臨床試験市場規模推定と予測:国別
13.5 MEAのAI活用の創薬・臨床試験市場規模推定と予測:コンポーネント別
13.6 MEAのAI活用の創薬・臨床試験市場規模推定と予測:用途別
13.7 MEAのAI活用の創薬・臨床試験市場規模推定と予測:治療分野別
13.8 MEAのAI活用の創薬・臨床試験市場規模推定と予測:エンドユーザー別
13.9 GCCのAI活用の創薬・臨床試験市場分析
13.10 南アフリカのAI活用の創薬・臨床試験市場分析
13.11 その他のMEAのAI活用の創薬・臨床試験市場分析
14 主要企業のプロファイル
14.1 企業シェア分析、2022年
14.2 戦略的展望
14.3 IBM Watson
14.3.1 会社概要
14.3.2 会社概要
14.3.3 財務分析
14.3.3.1 純収入、2019年~2022年
14.3.3.2 R&D、2019年~2022年
14.3.3.3 地域市場シェア、2022年
14.3.4 サービスベンチマーク
14.3.5 戦略的展望
14.4 Saama Technologies
14.4.1 会社概要
14.4.2 会社概要
14.4.3 サービス・ベンチマーク
14.4.4 戦略的展望
14.5 PathAI
14.5.1 会社概要
14.5.2 会社概要
14.5.3 サービスベンチマーク
14.5.4 戦略的展望
14.6 GNS Healthcare
14.6.1 会社概要
14.6.2 会社概要
14.6.3 サービス・ベンチマーク
14.6.4 戦略的展望
14.7 Unlearn.AI, Inc.
14.7.1 会社概要
14.7.2 会社概要
14.7.3 サービスベンチマーク
14.7.4 戦略的展望
14.8 Novartis AG
14.8.1 会社概要
14.8.2 会社概要
14.8.3 財務分析
14.8.3.1 純収入、2020年~2022年
14.8.4 サービス・ベンチマーク
14.8.5 戦略的展望
14.9 Merck & Co., Inc.
14.9.1 会社概要
14.9.2 会社概要
14.9.3 財務分析
14.9.3.1 純収入、2019-2021年
14.9.4 サービスベンチマーク
14.9.5 戦略的展望
14.10 AbbVie Inc.
14.10.1 会社概要
14.10.2 会社概要
14.10.3 財務分析
14.10.3.1 純収入、2019-2021年
14.10.4 サービスベンチマーク
14.10.5 戦略的展望
14.11 Exscientia
14.11.1 会社概要
14.11.2 会社概要
14.11.3 サービス・ベンチマーク
14.11.4 戦略的展望
15 結論と提言
15.1 Visiongainからの結びの言葉
15.2 市場プレイヤーへの提言
ページTOPに戻る
図表リスト
表の一覧
Table 1 AI-Enabled Drug Discovery and Clinical Trials Market Snapshot, 2023 & 2033 (US$ Million, CAGR %)
Table 2 AI-Enabled Drug Discovery and Clinical Trials Market Forecast by Region, 2023-2033 (US$ Million, AGR%, CAGR%): “V” Shaped Recovery
Table 3 AI-Enabled Drug Discovery and Clinical Trials Market Forecast by Region, 2023-2033 (US$ Million, AGR%, CAGR%): “U” Shaped Recovery
Table 4 AI-Enabled Drug Discovery and Clinical Trials Market Forecast by Region, 2023-2033 (US$ Million, AGR%, CAGR%): “W” Shaped Recovery
Table 5 AI-Enabled Drug Discovery and Clinical Trials Market Forecast by Region, 2023-2033 (US$ Million, AGR%, CAGR%): “L” Shaped Recovery
Table 6 AI-Enabled Drug Discovery and Clinical Trials Market Forecast by Components, 2023-2033 (US$ Million, AGR%, CAGR%)
Table 7 Services Segment Market Forecast by Region, 2023-2033 (US$ Million, AGR%, CAGR%)
Table 8 Software Segment Market Forecast by Region, 2023-2033 (US$ Million, AGR%, CAGR%)
Table 9 AI-Enabled Drug Discovery and Clinical Trials Market Forecast by Application, 2023-2033 (US$ Million, AGR%, CAGR%)
Table 10 Clinical Trials Segment Market Forecast by Region, 2023-2033 (US$ Million, AGR%, CAGR%)
Table 11 Drug Design Segment Market Forecast by Region, 2023-2033 (US$ Million, AGR%, CAGR%)
Table 12 Data Aggregation and Analysis Segment Market Forecast by Region, 2023-2033 (US$ Million, AGR%, CAGR%)
Table 13 Drug Characterization Segment Market Forecast by Region, 2023-2033 (US$ Million, AGR%, CAGR%)
Table 14 Biomarker Research Segment Market Forecast by Region, 2023-2033 (US$ Million, AGR%, CAGR%)
Table 15 Others Segment Market Forecast by Region, 2023-2033 (US$ Million, AGR%, CAGR%)
Table 16 AI-Enabled Drug Discovery and Clinical Trials Market Forecast by Therapeutic Area, 2023-2033 (US$ Million, AGR%, CAGR%)
Table 17 Oncology Segment Market Forecast by Region, 2023-2033 (US$ Million, AGR%, CAGR%)
Table 18 Cardiovascular Diseases Segment Market Forecast by Region, 2023-2033 (US$ Million, AGR%, CAGR%)
Table 19 Infectious Diseases Segment Market Forecast by Region, 2023-2033 (US$ Million, AGR%, CAGR%)
Table 20 Neurodegenerative Diseases Segment Market Forecast by Region, 2023-2033 (US$ Million, AGR%, CAGR%)
Table 21 Metabolic Diseases Segment Market Forecast by Region, 2023-2033 (US$ Million, AGR%, CAGR%)
Table 22 Others Segment Market Forecast by Region, 2023-2033 (US$ Million, AGR%, CAGR%)
Table 23 AI-Enabled Drug Discovery and Clinical Trials Market Forecast by End-User, 2023-2033 (US$ Million, AGR%, CAGR%)
Table 24 Pharmaceutical & Biopharmaceutical Companies Segment Market Forecast by Region, 2023-2033 (US$ Million, AGR%, CAGR%)
Table 25 Contract Research Organizations (CROs) Segment Market Forecast by Region, 2023-2033 (US$ Million, AGR%, CAGR%)
Table 26 Others Segment Market Forecast by Region, 2023-2033 (US$ Million, AGR%, CAGR%)
Table 27 AI-Enabled Drug Discovery and Clinical Trials Market Forecast by Region, 2023-2033 (US$ Million, AGR%, CAGR%)
Table 28 North America AI-Enabled Drug Discovery and Clinical Trials Market Forecast by Country, 2023-2033 (US$ Million, AGR%, CAGR%)
Table 29 North America AI-Enabled Drug Discovery and Clinical Trials Market Forecast by Components, 2023-2033 (US$ Million, AGR%, CAGR%)
Table 30 North America AI-Enabled Drug Discovery and Clinical Trials Market Forecast by Application, 2023-2033 (US$ Million, AGR%, CAGR%)
Table 31 North America AI-Enabled Drug Discovery and Clinical Trials Market Forecast by Therapeutic Area, 2023-2033 (US$ Million, AGR%, CAGR%)
Table 32 AI-Enabled Drug Discovery and Clinical Trials Market Forecast by End-User, 2023-2033 (US$ Million, AGR%, CAGR%)
Table 33 U.S. AI-Enabled Drug Discovery and Clinical Trials Market Forecast, 2023-2033 (US$ Million, AGR%, CAGR%)
Table 34 Canada AI-Enabled Drug Discovery and Clinical Trials Market Forecast, 2023-2033 (US$ Million, AGR%, CAGR%)
Table 35 Europe AI-Enabled Drug Discovery and Clinical Trials Market Forecast by Country, 2023-2033 (US$ Million, AGR%, CAGR%)
Table 36 Europe AI-Enabled Drug Discovery and Clinical Trials Market Forecast by Components, 2023-2033 (US$ Million, AGR%, CAGR%)
Table 37 Europe AI-Enabled Drug Discovery and Clinical Trials Market Forecast by Application, 2023-2033 (US$ Million, AGR%, CAGR%)
Table 38 Europe AI-Enabled Drug Discovery and Clinical Trials Market Forecast by Therapeutic Area, 2023-2033 (US$ Million, AGR%, CAGR%)
Table 39 AI-Enabled Drug Discovery and Clinical Trials Market Forecast by End-User, 2023-2033 (US$ Million, AGR%, CAGR%)
Table 40 Germany AI-Enabled Drug Discovery and Clinical Trials Market Forecast, 2023-2033 (US$ Million, AGR%, CAGR%)
Table 41 UK AI-Enabled Drug Discovery and Clinical Trials Market Forecast, 2023-2033 (US$ Million, AGR%, CAGR%)
Table 42 France AI-Enabled Drug Discovery and Clinical Trials Market Forecast, 2023-2033 (US$ Million, AGR%, CAGR%)
Table 43 Italy AI-Enabled Drug Discovery and Clinical Trials Market Forecast, 2023-2033 (US$ Million, AGR%, CAGR%)
Table 44 Spain AI-Enabled Drug Discovery and Clinical Trials Market Forecast, 2023-2033 (US$ Million, AGR%, CAGR%)
Table 45 Russia AI-Enabled Drug Discovery and Clinical Trials Market Forecast, 2023-2033 (US$ Million, AGR%, CAGR%)
Table 46 Rest of Europe AI-Enabled Drug Discovery and Clinical Trials Market Forecast, 2023-2033 (US$ Million, AGR%, CAGR%)
Table 47 Asia AI-Enabled Drug Discovery and Clinical Trials Market Forecast by Country, 2023-2033 (US$ Million, AGR%, CAGR%)
Table 48 Asia Pacific AI-Enabled Drug Discovery and Clinical Trials Market Forecast by Components, 2023-2033 (US$ Million, AGR%, CAGR%)
Table 49 Asia Pacific AI-Enabled Drug Discovery and Clinical Trials Market Forecast by Application, 2023-2033 (US$ Million, AGR%, CAGR%)
Table 50 Asia Pacific AI-Enabled Drug Discovery and Clinical Trials Market Forecast by Therapeutic Area, 2023-2033 (US$ Million, AGR%, CAGR%)
Table 51 AI-Enabled Drug Discovery and Clinical Trials Market Forecast by End-User, 2023-2033 (US$ Million, AGR%, CAGR%)
Table 52 Japan AI-Enabled Drug Discovery and Clinical Trials Market Forecast, 2023-2033 (US$ Million, AGR%, CAGR%)
Table 53 China AI-Enabled Drug Discovery and Clinical Trials Market Forecast, 2023-2033 (US$ Million, AGR%, CAGR%)
Table 54 India AI-Enabled Drug Discovery and Clinical Trials Market Forecast, 2023-2033 (US$ Million, AGR%, CAGR%)
Table 55 Australia AI-Enabled Drug Discovery and Clinical Trials Market Forecast, 2023-2033 (US$ Million, AGR%, CAGR%)
Table 56 South Korea AI-Enabled Drug Discovery and Clinical Trials Market Forecast, 2023-2033 (US$ Million, AGR%, CAGR%)
Table 57 Rest of Asia AI-Enabled Drug Discovery and Clinical Trials Market Forecast, 2023-2033 (US$ Million, AGR%, CAGR%)
Table 58 Latin America AI-Enabled Drug Discovery and Clinical Trials Market Forecast by Country, 2023-2033 (US$ Million, AGR%, CAGR%)
Table 59 Latin America AI-Enabled Drug Discovery and Clinical Trials Market Forecast by Components, 2023-2033 (US$ Million, AGR%, CAGR%)
Table 60 Latin America AI-Enabled Drug Discovery and Clinical Trials Market Forecast by Application, 2023-2033 (US$ Million, AGR%, CAGR%)
Table 61 Latin America AI-Enabled Drug Discovery and Clinical Trials Market Forecast by Therapeutic Area, 2023-2033 (US$ Million, AGR%, CAGR%)
Table 62 AI-Enabled Drug Discovery and Clinical Trials Market Forecast by End-User, 2023-2033 (US$ Million, AGR%, CAGR%)
Table 63 Brazil AI-Enabled Drug Discovery and Clinical Trials Market Forecast, 2023-2033 (US$ Million, AGR%, CAGR%)
Table 64 Mexico AI-Enabled Drug Discovery and Clinical Trials Market Forecast, 2023-2033 (US$ Million, AGR%, CAGR%)
Table 65 Argentina AI-Enabled Drug Discovery and Clinical Trials Market Forecast, 2023-2033 (US$ Million, AGR%, CAGR%)
Table 66 Rest of Latin America AI-Enabled Drug Discovery and Clinical Trials Market Forecast, 2023-2033 (US$ Million, AGR%, CAGR%)
Table 67 MEA AI-Enabled Drug Discovery and Clinical Trials Market Forecast by Country, 2023-2033 (US$ Million, AGR%, CAGR%)
Table 68 MEA AI-Enabled Drug Discovery and Clinical Trials Market Forecast by Components, 2023-2033 (US$ Million, AGR%, CAGR%)
Table 69 MEA AI-Enabled Drug Discovery and Clinical Trials Market Forecast by Application, 2023-2033 (US$ Million, AGR%, CAGR%)
Table 70 MEA AI-Enabled Drug Discovery and Clinical Trials Market Forecast by Therapeutic Area, 2023-2033 (US$ Million, AGR%, CAGR%)
Table 71 AI-Enabled Drug Discovery and Clinical Trials Market Forecast by End-User, 2023-2033 (US$ Million, AGR%, CAGR%)
Table 72 GCC AI-Enabled Drug Discovery and Clinical Trials Market Forecast, 2023-2033 (US$ Million, AGR%, CAGR%)
Table 73 South Africa AI-Enabled Drug Discovery and Clinical Trials Market Forecast, 2023-2033 (US$ Million, AGR%, CAGR%)
Table 74 Rest of MEA AI-Enabled Drug Discovery and Clinical Trials Market Forecast, 2023-2033 (US$ Million, AGR%, CAGR%)
Table 75 Strategic Outlook
Table 76 IBM Watson: Key Details, (CEO, HQ, Revenue, Founded, No. of Employees, Company Type, Website, Business Segment)
Table 77 IBM: Service Benchmarking
Table 78 IBM: Strategic Outlook
Table 79 Saama Technologies: Key Details, (CEO, HQ, Revenue, Founded, No. of Employees, Company Type, Website, Business Segment)
Table 80 Saama Technologies: Service Benchmarking
Table 81 Saama Technologies: Strategic Outlook
Table 82 PathAI: Key Details, (CEO, HQ, Revenue, Founded, No. of Employees, Company Type, Website, Business Segment)
Table 83 PathAI: Service Benchmarking
Table 84 PathAI: Strategic Outlook
Table 85 GNS Healthcare: Key Details, (CEO, HQ, Revenue, Founded, No. of Employees, Company Type, Website, Business Segment)
Table 86 GNS Healthcare: Service Benchmarking
Table 87 GNS Healthcare: Strategic Outlook
Table 88 Unlearn.AI: Key Details, (CEO, HQ, Revenue, Founded, No. of Employees, Company Type, Website, Business Segment)
Table 89 Unlearn.AI: Service Benchmarking
Table 90 Unlearn.AI: Strategic Outlook
Table 91 Novartis: Key Details, (CEO, HQ, Revenue, Founded, No. of Employees, Company Type, Website, Business Segment)
Table 92 Novartis: Service Benchmarking
Table 93 Novartis: Strategic Outlook
Table 94 Merck & Co., Inc.: Key Details, (CEO, HQ, Revenue, Founded, No. of Employees, Company Type, Website, Business Segment)
Table 95 Merck & Co. Inc.: Service Benchmarking
Table 96 Novartis: Strategic Outlook
Table 97 Abbvie Inc.: Key Details, (CEO, HQ, Revenue, Founded, No. of Employees, Company Type, Website, Business Segment)
Table 98 AbbVie Inc.: Service Benchmarking
Table 99 Exscientia: Strategic Outlook
Table 100 Exscientia: Key Details, (CEO, HQ, Revenue, Founded, No. of Employees, Company Type, Website, Business Segment)
Table 101 Exscientia: Service Benchmarking
Table 102 Exscientia: Strategic Outlook
図の一覧
Figure 1 AI-Enabled Drug Discovery and Clinical Trials Market Segmentation
Figure 2 AI-Enabled Drug Discovery and Clinical Trials Market by Component: Market Attractiveness Index
Figure 3 AI-Enabled Drug Discovery and Clinical Trials Market by Application: Market Attractiveness Index
Figure 4 AI-Enabled Drug Discovery and Clinical Trials Market by Therapeutic Area Market Attractiveness Index
Figure 5 AI-Enabled Drug Discovery and Clinical Trials Market by End-user: Market Attractiveness Index
Figure 6 AI-Enabled Drug Discovery and Clinical Trials Market Attractiveness Index by Region
Figure 7 AI-Enabled Drug Discovery and Clinical Trials Market: Market Dynamics
Figure 8 AI-Enabled Drug Discovery and Clinical Trials Market by Region, 2023-2033 (US$ Million, AGR %): “V” Shaped Recovery
Figure 9 AI-Enabled Drug Discovery and Clinical Trials Market by Region, 2023-2033 (US$ Million, AGR %): “U” Shaped Recovery
Figure 10 AI-Enabled Drug Discovery and Clinical Trials Market by Region, 2023-2033 (US$ Million, AGR %): “W” Shaped Recovery
Figure 11 AI-Enabled Drug Discovery and Clinical Trials Market by Region, 2023-2033 (US$ Million, AGR %): “L” Shaped Recovery
Figure 12 AI-Enabled Drug Discovery and Clinical Trials Market: Porter’s Five Forces Analysis
Figure 13 AI-Enabled Drug Discovery and Clinical Trials Market: PEST Analysis
Figure 14 AI-Enabled Drug Discovery and Clinical Trials Market by Components: Market Attractiveness Index
Figure 15 AI-Enabled Drug Discovery and Clinical Trials Market Forecast by Components, 2023-2033 (US$ Million, AGR %)
Figure 16 AI-Enabled Drug Discovery and Clinical Trials Share Forecast by Components, 2023, 2028, 2033 (%)
Figure 17 Services Segment Market Forecast by Region, 2023-2033 (US$ Million, AGR %)
Figure 18 Services Segment Market Share Forecast by Region, 2023 & 2033 (%)
Figure 19 Software Segment Market Forecast by Region, 2023-2033 (US$ Million, AGR %)
Figure 20 Software Segment Market Share Forecast by Region, 2023 & 2033 (%)
Figure 21 AI-Enabled Drug Discovery and Clinical Trials Market by Application: Market Attractiveness Index
Figure 22 AI-Enabled Drug Discovery and Clinical Trials Market Forecast by Application, 2023-2033 (US$ Million, AGR %)
Figure 23 AI-Enabled Drug Discovery and Clinical Trials Share Forecast by Application, 2023, 2028, 2033 (%)
Figure 24 Clinical Trials Segment Market Forecast by Region, 2023-2033 (US$ Million, AGR %)
Figure 25 Clinical Trials Segment Market Share Forecast by Region, 2023 & 2033 (%)
Figure 26 Drug Design Segment Market Forecast by Region, 2023-2033 (US$ Million, AGR %)
Figure 27 Drug Design Segment Market Share Forecast by Region, 2023 & 2033 (%)
Figure 28 Data Aggregation and Analysis Segment Market Forecast by Region, 2023-2033 (US$ Million, AGR %)
Figure 29 Data Aggregation and Analysis Segment Market Share Forecast by Region, 2023 & 2033 (%)
Figure 30 Drug Characterization Segment Market Forecast by Region, 2023-2033 (US$ Million, AGR %)
Figure 31 Drug Characterization Segment Market Share Forecast by Region, 2023 & 2033 (%)
Figure 32 Biomarker Research Segment Market Forecast by Region, 2023-2033 (US$ Million, AGR %)
Figure 33 Biomarker Research Segment Market Share Forecast by Region, 2023 & 2033 (%)
Figure 34 Others Segment Market Forecast by Region, 2023-2033 (US$ Million, AGR %)
Figure 35 Others Segment Market Share Forecast by Region, 2023 & 2033 (%)
Figure 36 AI-Enabled Drug Discovery and Clinical Trials Market by Therapeutic Area: Market Attractiveness Index
Figure 37 AI-Enabled Drug Discovery and Clinical Trials Market Forecast by Therapeutic Area, 2023-2033 (US$ Million, AGR %)
Figure 38 AI-Enabled Drug Discovery and Clinical Trials Share Forecast by Therapeutic Area, 2023, 2028, 2033 (%)
Figure 39 Oncology Segment Market Forecast by Region, 2023-2033 (US$ Million, AGR %)
Figure 40 Oncology Segment Market Share Forecast by Region, 2023 & 2033 (%)
Figure 41 Cardiovascular Diseases Segment Market Forecast by Region, 2023-2033 (US$ Million, AGR %)
Figure 42 Cardiovascular Diseases Segment Market Share Forecast by Region, 2023 & 2033 (%)
Figure 43 Infectious Diseases Segment Market Forecast by Region, 2023-2033 (US$ Million, AGR %)
Figure 44 Infectious Diseases Segment Market Share Forecast by Region, 2023 & 2033 (%)
Figure 45 Neurodegenerative Diseases Segment Market Forecast by Region, 2023-2033 (US$ Million, AGR %)
Figure 46 Neurodegenerative Diseases Segment Market Share Forecast by Region, 2023 & 2033 (%)
Figure 47 Metabolic Diseases Segment Market Forecast by Region, 2023-2033 (US$ Million, AGR %)
Figure 48 Metabolic Diseases Segment Market Share Forecast by Region, 2023 & 2033 (%)
Figure 49 Others Segment Market Forecast by Region, 2023-2033 (US$ Million, AGR %)
Figure 50 Others Segment Market Share Forecast by Region, 2023 & 2033 (%)
Figure 51 AI-Enabled Drug Discovery and Clinical Trials Market by End-User: Market Attractiveness Index
Figure 52 AI-Enabled Drug Discovery and Clinical Trials Market Forecast by End-User, 2023-2033 (US$ Million, AGR %)
Figure 53 AI-Enabled Drug Discovery and Clinical Trials Share Forecast by End-User, 2023, 2028, 2033 (%)
Figure 54 Pharmaceutical & Biopharmaceutical Companies Segment Market Forecast by Region, 2023-2033 (US$ Million, AGR %)
Figure 55 Pharmaceutical & Biopharmaceutical Companies Segment Market Share Forecast by Region, 2023 & 2033 (%)
Figure 56 Contract Research Organizations (CROs) Segment Market Forecast by Region, 2023-2033 (US$ Million, AGR %)
Figure 57 Contract Research Organizations (CROs) Segment Market Share Forecast by Region, 2023 & 2033 (%)
Figure 58 Others Segment Market Forecast by Region, 2023-2033 (US$ Million, AGR %)
Figure 59 Others Segment Market Share Forecast by Region, 2023 & 2033 (%)
Figure 60 AI-Enabled Drug Discovery and Clinical Trials Market Forecast by Region 2023 and 2033 (Revenue, CAGR%)
Figure 61 AI-Enabled Drug Discovery and Clinical Trials Market Share Forecast by Region 2023, 2028, 2033 (%)
Figure 62 AI-Enabled Drug Discovery and Clinical Trials Market by Region, 2023-2033 (US$ Million, AGR %)
Figure 63 North America AI-Enabled Drug Discovery and Clinical Trials Market Attractiveness Index
Figure 64 North America AI-Enabled Drug Discovery and Clinical Trials Market by Region, 2023, 2028 & 2033 (US$ Million)
Figure 65 North America AI-Enabled Drug Discovery and Clinical Trials Market Forecast by Country, 2023-2033 (US$ Million, AGR %)
Figure 66 North America AI-Enabled Drug Discovery and Clinical Trials Market Share Forecast by Country, 2023 & 2033 (%)
Figure 67 North America AI-Enabled Drug Discovery and Clinical Trials Market Forecast by Components, 2023-2033 (US$ Million, AGR %)
Figure 68 North America AI-Enabled Drug Discovery and Clinical Trials Market Share Forecast by Components, 2023 & 2033 (%)
Figure 69 North America AI-Enabled Drug Discovery and Clinical Trials Market Forecast by Application, 2023-2033 (US$ Million, AGR %)
Figure 70 North America AI-Enabled Drug Discovery and Clinical Trials Market Share Forecast by Application, 2023 & 2033 (%)
Figure 71 North America AI-Enabled Drug Discovery and Clinical Trials Market Forecast by Therapeutic Area, 2023-2033 (US$ Million, AGR %)
Figure 72 North America AI-Enabled Drug Discovery and Clinical Trials Market Share Forecast by Therapeutic Area, 2023 & 2033 (%)
Figure 73 North America AI-Enabled Drug Discovery and Clinical Trials Market Forecast by End-user, 2023-2033 (US$ Million, AGR %)
Figure 74 North America AI-Enabled Drug Discovery and Clinical Trials Market Share Forecast by End-user, 2023 & 2033 (%)
Figure 75 U.S. AI-Enabled Drug Discovery and Clinical Trials Market Forecast, 2023-2033 (US$ Million, AGR %)
Figure 76 Canada AI-Enabled Drug Discovery and Clinical Trials Market Forecast, 2023-2033 (US$ Million, AGR %)
Figure 77 Europe AI-Enabled Drug Discovery and Clinical Trials Market Attractiveness Index
Figure 78 Europe AI-Enabled Drug Discovery and Clinical Trials Market by Region, 2023, 2028 & 2033 (US$ Million)
Figure 79 Europe AI-Enabled Drug Discovery and Clinical Trials Market Forecast by Country, 2023-2033 (US$ Million, AGR %)
Figure 80 Europe AI-Enabled Drug Discovery and Clinical Trials Market Share Forecast by Country, 2023 & 2033 (%)
Figure 81 Europe AI-Enabled Drug Discovery and Clinical Trials Market Forecast by Components, 2023-2033 (US$ Million, AGR %)
Figure 82 Europe AI-Enabled Drug Discovery and Clinical Trials Market Share Forecast by Components, 2023 & 2033 (%)
Figure 83 Europe AI-Enabled Drug Discovery and Clinical Trials Market Forecast by Application, 2023-2033 (US$ Million, AGR %)
Figure 84 Europe AI-Enabled Drug Discovery and Clinical Trials Market Share Forecast by Application, 2023 & 2033 (%)
Figure 85 Europe AI-Enabled Drug Discovery and Clinical Trials Market Forecast by Therapeutic Area, 2023-2033 (US$ Million, AGR %)
Figure 86 Europe AI-Enabled Drug Discovery and Clinical Trials Market Share Forecast by Therapeutic Area, 2023 & 2033 (%)
Figure 87 Europe AI-Enabled Drug Discovery and Clinical Trials Market Forecast by End-user, 2023-2033 (US$ Million, AGR %)
Figure 88 Europe AI-Enabled Drug Discovery and Clinical Trials Market Share Forecast by End-user, 2023 & 2033 (%)
Figure 89 Germany AI-Enabled Drug Discovery and Clinical Trials Market Forecast, 2023-2033 (US$ Million, AGR %)
Figure 90 UK AI-Enabled Drug Discovery and Clinical Trials Market Forecast, 2023-2033 (US$ Million, AGR %)
Figure 91 France AI-Enabled Drug Discovery and Clinical Trials Market Forecast, 2023-2033 (US$ Million, AGR %)
Figure 92 Italy AI-Enabled Drug Discovery and Clinical Trials Market Forecast, 2023-2033 (US$ Million, AGR %)
Figure 93 Spain AI-Enabled Drug Discovery and Clinical Trials Market Forecast, 2023-2033 (US$ Million, AGR %)
Figure 94 Russia AI-Enabled Drug Discovery and Clinical Trials Market Forecast, 2023-2033 (US$ Million, AGR %)
Figure 95 Rest of Europe AI-Enabled Drug Discovery and Clinical Trials Market Forecast, 2023-2033 (US$ Million, AGR %)
Figure 96 Asia AI-Enabled Drug Discovery and Clinical Trials Market Attractiveness Index
Figure 97 Asia AI-Enabled Drug Discovery and Clinical Trials Market by Region, 2023, 2028 & 2033 (US$ Million)
Figure 98 Asia AI-Enabled Drug Discovery and Clinical Trials Market Forecast by Country, 2023-2033 (US$ Million, AGR %)
Figure 99 Asia AI-Enabled Drug Discovery and Clinical Trials Market Share Forecast by Country, 2023 & 2033 (%)
Figure 100 Asia Pacific AI-Enabled Drug Discovery and Clinical Trials Market Forecast by Components, 2023-2033 (US$ Million, AGR %)
Figure 101 Asia Pacific AI-Enabled Drug Discovery and Clinical Trials Market Share Forecast by Components, 2023 & 2033 (%)
Figure 102 Asia Pacific AI-Enabled Drug Discovery and Clinical Trials Market Forecast by Application, 2023-2033 (US$ Million, AGR %)
Figure 103 Asia Pacific AI-Enabled Drug Discovery and Clinical Trials Market Share Forecast by Application, 2023 & 2033 (%)
Figure 104 Asia Pacific AI-Enabled Drug Discovery and Clinical Trials Market Forecast by Therapeutic Area, 2023-2033 (US$ Million, AGR %)
Figure 105 Asia Pacific AI-Enabled Drug Discovery and Clinical Trials Market Share Forecast by Therapeutic Area, 2023 & 2033 (%)
Figure 106 Asia Pacific AI-Enabled Drug Discovery and Clinical Trials Market Forecast by End-user, 2023-2033 (US$ Million, AGR %)
Figure 107 Asia Pacific AI-Enabled Drug Discovery and Clinical Trials Market Share Forecast by End-user, 2023 & 2033 (%)
Figure 108 Japan AI-Enabled Drug Discovery and Clinical Trials Market Forecast, 2023-2033 (US$ Million, AGR %)
Figure 109 China AI-Enabled Drug Discovery and Clinical Trials Market Forecast, 2023-2033 (US$ Million, AGR %)
Figure 110 India AI-Enabled Drug Discovery and Clinical Trials Market Forecast, 2023-2033 (US$ Million, AGR %)
Figure 111 Australia AI-Enabled Drug Discovery and Clinical Trials Market Forecast, 2023-2033 (US$ Million, AGR %)
Figure 112 South Korea AI-Enabled Drug Discovery and Clinical Trials Market Forecast, 2023-2033 (US$ Million, AGR %)
Figure 113 Rest of Asia AI-Enabled Drug Discovery and Clinical Trials Market Forecast, 2023-2033 (US$ Million, AGR %)
Figure 114 Latin America AI-Enabled Drug Discovery and Clinical Trials Market Attractiveness Index
Figure 115 Latin America AI-Enabled Drug Discovery and Clinical Trials Market by Region, 2023, 2028 & 2033 (US$ Million)
Figure 116 Latin America AI-Enabled Drug Discovery and Clinical Trials Market Forecast by Country, 2023-2033 (US$ Million, AGR %)
Figure 117 Latin America AI-Enabled Drug Discovery and Clinical Trials Market Share Forecast by Country, 2023 & 2033 (%)
Figure 118 Latin America AI-Enabled Drug Discovery and Clinical Trials Market Forecast by Components, 2023-2033 (US$ Million, AGR %)
Figure 119 Latin America AI-Enabled Drug Discovery and Clinical Trials Market Share Forecast by Components, 2023 & 2033 (%)
Figure 120 Latin America AI-Enabled Drug Discovery and Clinical Trials Market Forecast by Application, 2023-2033 (US$ Million, AGR %)
Figure 121 Latin America AI-Enabled Drug Discovery and Clinical Trials Market Share Forecast by Application, 2023 & 2033 (%)
Figure 122 Latin America AI-Enabled Drug Discovery and Clinical Trials Market Forecast by Therapeutic Area, 2023-2033 (US$ Million, AGR %)
Figure 123 Latin America AI-Enabled Drug Discovery and Clinical Trials Market Share Forecast by Therapeutic Area, 2023 & 2033 (%)
Figure 124 Latin America AI-Enabled Drug Discovery and Clinical Trials Market Forecast by End-user, 2023-2033 (US$ Million, AGR %)
Figure 125 Latin America AI-Enabled Drug Discovery and Clinical Trials Market Share Forecast by End-user, 2023 & 2033 (%)
Figure 126 Brazil AI-Enabled Drug Discovery and Clinical Trials Market Forecast, 2023-2033 (US$ Million, AGR %)
Figure 127 Mexico AI-Enabled Drug Discovery and Clinical Trials Market Forecast, 2023-2033 (US$ Million, AGR %)
Figure 128 Argentina AI-Enabled Drug Discovery and Clinical Trials Market Forecast, 2023-2033 (US$ Million, AGR %)
Figure 129 Rest of Latin America AI-Enabled Drug Discovery and Clinical Trials Market Forecast, 2023-2033 (US$ Million, AGR %)
Figure 130 MEA AI-Enabled Drug Discovery and Clinical Trials Market Attractiveness Index
Figure 131 MEA AI-Enabled Drug Discovery and Clinical Trials Market by Region, 2023, 2028 & 2033 (US$ Million)
Figure 132 MEA AI-Enabled Drug Discovery and Clinical Trials Market Forecast by Country, 2023-2033 (US$ Million, AGR %)
Figure 133 MEA AI-Enabled Drug Discovery and Clinical Trials Market Share Forecast by Country, 2023 & 2033 (%)
Figure 134 MEA AI-Enabled Drug Discovery and Clinical Trials Market Forecast by Components, 2023-2033 (US$ Million, AGR %)
Figure 135 MEA AI-Enabled Drug Discovery and Clinical Trials Market Share Forecast by Components, 2023 & 2033 (%)
Figure 136 MEA AI-Enabled Drug Discovery and Clinical Trials Market Forecast by Application, 2023-2033 (US$ Million, AGR %)
Figure 137 MEA AI-Enabled Drug Discovery and Clinical Trials Market Share Forecast by Application, 2023 & 2033 (%)
Figure 138 MEA AI-Enabled Drug Discovery and Clinical Trials Market Forecast by Therapeutic Area, 2023-2033 (US$ Million, AGR %)
Figure 139 MEA AI-Enabled Drug Discovery and Clinical Trials Market Share Forecast by Therapeutic Area, 2023 & 2033 (%)
Figure 140 MEA AI-Enabled Drug Discovery and Clinical Trials Market Forecast by End-user, 2023-2033 (US$ Million, AGR %)
Figure 141 MEA AI-Enabled Drug Discovery and Clinical Trials Market Share Forecast by End-user, 2023 & 2033 (%)
Figure 142 GCC AI-Enabled Drug Discovery and Clinical Trials Market Forecast, 2023-2033 (US$ Million, AGR %)
Figure 143 South Africa AI-Enabled Drug Discovery and Clinical Trials Market Forecast, 2023-2033 (US$ Million, AGR %)
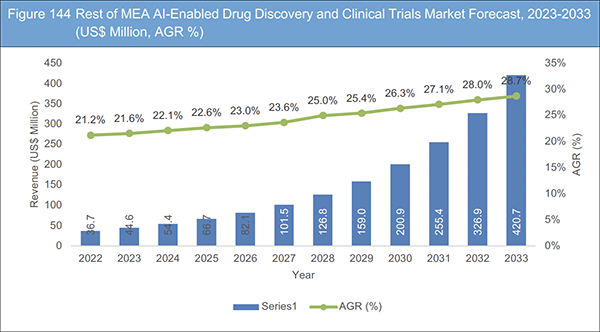
Figure 144 Rest of MEA AI-Enabled Drug Discovery and Clinical Trials Market Forecast, 2023-2033 (US$ Million, AGR %)
Figure 145 AI-Enabled Drug Discovery and Clinical Trials Market: Company Share Analysis, 2022
Figure 146 IBM: Net Revenue, 2019-2022 (US$ Million, AGR%)
Figure 147 IBM: R&D, 2019-2022 (US$ Million, AGR%)
Figure 148 IBM: Regional Market Shares, 2022
Figure 149 Novartis: Net Revenue, 2020-2022 (US$ Million, AGR%)
Figure 150 Merck: Net Revenue, 2019-2021 (US$ million, AGR %)
Figure 151 Net Revenue, 2019-2021 (US$ million, AGR %)
ページTOPに戻る
Summary
Report Details
The AI-Enabled Drug Discovery and Clinical Trials Market Report 2023-2033: This report will prove invaluable to leading firms striving for new revenue pockets if they wish to better understand the industry and its underlying dynamics. It will be useful for companies that would like to expand into different industries or to expand their existing operations in a new region.
Growing Awareness of AI applications in Healthcare is Boosting the Market Growth
With the rise of AI applications in healthcare services, people’s awareness and acceptance of AI-enabled solutions have grown. More pharmaceutical companies are, therefore, seeking to incorporate these solutions into their drug discovery and clinical trial processes. AI-based drug delivery solutions are becoming increasingly popular in the pharmaceutical industry. These solutions involve using artificial intelligence technologies to develop more efficient and effective drug delivery methods. The use of AI in drug delivery has the potential to transform the industry by reducing costs, improving drug efficacy and safety, and providing better patient outcomes.
The market for AI-based drug delivery solutions is expected to grow in the coming years, with a number of companies already offering or developing such solutions. Some of the key players in this market include:
• Novartis – Novartis is one of the leading players in the AI-based drug delivery market, with a focus on developing smart inhalers to treat respiratory diseases.
• Medtronic – Medtronic is a medical devices company that is building an AI-based drug delivery platform to improve the delivery of insulin for diabetic patients.
• Insilico Medicine – Insilico Medicine is a drug discovery company that is using AI to develop new drugs and drug delivery methods.
• Johnson & Johnson – Johnson & Johnson is using AI to develop personalized drug delivery solutions, including smart drug-infused contact lenses and implantable drug delivery devices.
• GSK – GSK is using AI to develop inhalers that can adjust the dosage based on the patient’s breathing pattern.
As the competition between market players intensifies, companies are investing heavily in research and development to stay ahead of the curve. This is driving innovation and pushing the boundaries of what is possible in the drug delivery industry. In the future, AI-based drug delivery solutions are likely to become increasingly sophisticated, personalized, and targeted, improving patient outcomes and transforming the pharmaceutical industry.
Lack of Skilled Personnel to Hinder the Market Growth
Patient safety is a significant challenge during the drug discovery phase, as activities involving the interpretation of drug effects and anticipation of potential side effects can pose a major constraint on the market. Additionally, the lack of skilled personnel and inadequate datasets for drug discovery and development are crucial factors that may impact market growth. The implementation of AI systems in drug discovery requires companies to possess expertise in system design, management, and implementation. Given the complexity of AI, personnel working with these systems need to have a deep understanding of technologies such as machine learning, deep learning, and other aspects of artificial intelligence. Integrating AI technologies into existing systems to replicate human brain behaviour necessitates substantial data processing. AI/ML development is being restricted owing to lack of professional standards and certifications.
What Questions Should You Ask before Buying a Market Research Report?
• How is the AI-enabled drug discovery and clinical trials market evolving?
• What is driving and restraining the AI-enabled drug discovery and clinical trials market?
• How will each AI-enabled drug discovery and clinical trials submarket segment grow over the forecast period and how much revenue will these submarkets account for in 2033?
• How will the market shares for each AI-enabled drug discovery and clinical trials submarket develop from 2023 to 2033?
• What will be the main driver for the overall market from 2023 to 2033?
• Will leading AI-enabled drug discovery and clinical trials markets broadly follow the macroeconomic dynamics, or will individual national markets outperform others?
• How will the market shares of the national markets change by 2033 and which geographical region will lead the market in 2033?
• Who are the leading players and what are their prospects over the forecast period?
• What are the AI-enabled drug discovery and clinical trials projects for these leading companies?
• How will the industry evolve during the period between 2023 and 2033? What are the implications of AI-enabled drug discovery and clinical trials projects taking place now and over the next 10 years?
• Is there a greater need for product commercialisation to further scale the AI-enabled drug discovery and clinical trials market?
• Where is the AI-enabled drug discovery and clinical trials market heading and how can you ensure you are at the forefront of the market?
• What are the best investment options for new product and service lines?
• What are the key prospects for moving companies into a new growth path and C-suite?
You need to discover how this will impact the AI-enabled drug discovery and clinical trials market today, and over the next 10 years:
• Our 267-page report provides 102 tables and 151 charts/graphs exclusively to you.
• The report highlights key lucrative areas in the industry so you can target them – NOW.
• It contains in-depth analysis of global, regional and national sales and growth.
• It highlights for you the key successful trends, changes and revenue projections made by your competitors.
This report tells you TODAY how the AI-enabled drug discovery and clinical trials market will develop in the next 10 years, and in line with the variations in COVID-19 economic recession and bounce. This market is more critical now than at any point over the last 10 years.
Forecasts to 2033 and other analyses reveal commercial prospects
• In addition to revenue forecasting to 2033, our new study provides you with recent results, growth rates, and market shares.
• You will find original analyses, with business outlooks and developments.
• Discover qualitative analyses (including market dynamics, drivers, opportunities, restraints and challenges), cost structure, impact of rising AI-enabled drug discovery and clinical trials prices and recent developments.
This report includes data analysis and invaluable insight into how COVID-19 will affect the industry and your company. Four COVID-19 recovery patterns and their impact, namely, “V”, “L”, “W” and “U” are discussed in this report.
Segments Covered in the Report
Component Outlook
• Services
• Software
Application
• Clinical Trials
• Drug Design
• Data Aggregation and Analysis
• Drug Characterization
• Biomarker Research
• Others
Therapeutic Area
• Oncology
• Cardiovascular Diseases
• Infectious Diseases
• Neurodegenerative Diseases
• Metabolic Diseases
• Others
End-user
• Pharmaceutical & Biopharmaceutical Companies
• Contract Research Organizations (CROs)
• Others
In addition to the revenue predictions for the overall world market and segments, you will also find revenue forecasts for five regional and 18 leading national markets:
North America
• U.S.
• Canada
Europe
• Germany
• UK
• France
• Spain
• Italy
• Russia
• Rest of Europe
Asia Pacific
• China
• Japan
• India
• Australia
• South Korea
• Rest of Asia Pacific
Latin America
• Brazil
• Mexico
• Argentina
• Rest of Latin America
MEA
• GCC
• South Africa
• Rest of MEA
The report also includes profiles and for some of the leading companies in the AI-Enabled Drug Discovery and Clinical Trials Market, 2023 to 2033, with a focus on this segment of these companies’ operations.
Leading companies and the potential for market growth
• AbbVie Inc.
• Exscientia
• GNS Healthcare
• IBM Watson
• Merck & Co., Inc.
• Novartis AG
• PathAI
• Saama Technologies
• Unlearn.AI, Inc.
Overall world revenue for AI-Enabled Drug Discovery and Clinical Trials Market, 2023 to 2033 in terms of value the market will surpass US$2,156.8 million in 2023, our work calculates. We predict strong revenue growth through to 2033. Our work identifies which organizations hold the greatest potential. Discover their capabilities, progress, and commercial prospects, helping you stay ahead.
How will the AI-Enabled Drug Discovery and Clinical Trials Market, 2023 to 2033 report help you?
In summary, our 260+ page report provides you with the following knowledge:
• Revenue forecasts to 2033 for AI-Enabled Drug Discovery and Clinical Trials Market, 2023 to 2033 Market, with forecasts for component, application, therapeutic area, and end-user, each forecast at a global and regional level – discover the industry’s prospects, finding the most lucrative places for investments and revenues.
• Revenue forecasts to 2033 for five regional and 18 key national markets – See forecasts for the AI-Enabled Drug Discovery and Clinical Trials Market, 2023 to 2033 market in North America, Europe, Asia-Pacific, Latin America, and MEA. Also forecasted is the market in the US, Canada, Mexico, Brazil, Germany, France, UK, Italy, China, India, Japan, and Australia among other prominent economies.
• Prospects for established firms and those seeking to enter the market – including company profiles for 9 of the major companies involved in the AI-Enabled Drug Discovery and Clinical Trials Market, 2023 to 2033.
Find quantitative and qualitative analyses with independent predictions. Receive information that only our report contains, staying informed with invaluable business intelligence.
Information found nowhere else
With our new report, you are less likely to fall behind in knowledge or miss out on opportunities. See how our work could benefit your research, analyses, and decisions. Visiongain’s study is for everybody needing commercial analyses for the AI-Enabled Drug Discovery and Clinical Trials Market, 2023 to 2033, market-leading companies. You will find data, trends and predictions.
ページTOPに戻る
Table of Contents
Table of Contents
1 Report Overview
1.1 Objectives of the Study
1.2 Introduction to AI-Enabled Drug Discovery and Clinical Trials Market
1.3 What This Report Delivers
1.4 Why You Should Read This Report
1.5 Key Questions Answered by This Analytical Report
1.6 Who is This Report for?
1.7 Methodology
1.7.1 Market Definitions
1.7.2 Market Evaluation & Forecasting Methodology
1.7.3 Data Validation
1.7.3.1 Primary Research
1.7.3.2 Secondary Research
1.8 Frequently Asked Questions (FAQs)
1.9 Associated Visiongain Reports
1.10 About Visiongain
2 Executive Summary
3 Market Overview
3.1 Key Findings
3.2 Market Dynamics
3.2.1 Market Driving Factors
3.2.1.1 Growing Demand for Personalized Medicine
3.2.1.2 Advancements in Technology
3.2.1.3 Growing Awareness of AI in Healthcare
3.2.1.4 Cost-effectiveness of AI-enabled Solutions
3.2.2 Market Restraining Factors
3.2.2.1 Lack of Skilled Personnel to Hamper the Market Growth
3.2.2.2 Limited Data Availability is a Major Challenge in Adoption of AI-enabled Solutions
3.2.2.3 Challenges Associated with Integration of New AI-enabled Solution with Existing Infrastructure
3.2.2.4 Ethics and Data Privacy Issues Hindering the Market Growth
3.2.2.5 Regulatory Hurdles Restraining the Global Market Growth
3.2.3 Market Opportunities
3.2.3.1 Improved Patient Outcomes
3.2.3.2 Increased Adoption Of AI-Enabled Solution By Pharma & Biopharma Companies For Clinical Trials
3.3 COVID-19 Impact Analysis
3.4 Porter’s Five Forces Analysis
3.4.1 Bargaining Power of Suppliers
3.4.2 Bargaining Power of Buyers
3.4.3 Competitive Rivalry
3.4.4 Threat from Substitutes
3.4.5 Threat of New Entrants
3.5 PEST Analysis
4 AI-Enabled Drug Discovery and Clinical Trials Market Analysis by Components
4.1 Key Findings
4.2 Components Segment: Market Attractiveness Index
4.3 AI-Enabled Drug Discovery and Clinical Trials Market Size Estimation and Forecast by Components
4.4 Services
4.4.1 Market Size by Region, 2023-2033 (US$ Million)
4.4.2 Market Share by Region, 2023 & 2033 (%)
4.5 Software Solutions
4.5.1 Market Size by Region, 2023-2033 (US$ Million)
4.5.2 Market Share by Region, 2023 & 2033 (%)
5 AI-Enabled Drug Discovery and Clinical Trials Market Analysis by Application
5.1 Key Findings
5.2 Application Segment: Market Attractiveness Index
5.3 AI-Enabled Drug Discovery and Clinical Trials Market Size Estimation and Forecast by Application
5.4 Clinical Trials
5.4.1 Market Size by Region, 2023-2033 (US$ Million)
5.4.2 Market Share by Region, 2023 & 2033 (%)
5.5 Drug Design
5.5.1 Market Size by Region, 2023-2033 (US$ Million)
5.5.2 Market Share by Region, 2023 & 2033 (%)
5.6 Data Aggregation and Analysis
5.6.1 Market Size by Region, 2023-2033 (US$ Million)
5.6.2 Market Share by Region, 2023 & 2033 (%)
5.7 Drug Characterization
5.7.1 Market Size by Region, 2023-2033 (US$ Million)
5.7.2 Market Share by Region, 2023 & 2033 (%)
5.8 Biomarker Research
5.8.1 Market Size by Region, 2023-2033 (US$ Million)
5.8.2 Market Share by Region, 2023 & 2033 (%)
5.9 Others
5.9.1 Market Size by Region, 2023-2033 (US$ Million)
5.9.2 Market Share by Region, 2023 & 2033 (%)
6 AI-Enabled Drug Discovery and Clinical Trials Market Analysis by Therapeutic Area
6.1 Key Findings
6.2 Therapeutic Area Segment: Market Attractiveness Index
6.3 AI-Enabled Drug Discovery and Clinical Trials Market Size Estimation and Forecast by Therapeutic Area
6.4 Oncology
6.4.1 Market Size by Region, 2023-2033 (US$ Million)
6.4.2 Market Share by Region, 2023 & 2033 (%)
6.5 Cardiovascular Diseases
6.5.1 Market Size by Region, 2023-2033 (US$ Million)
6.5.2 Market Share by Region, 2023 & 2033 (%)
6.6 Infectious Diseases
6.6.1 Market Size by Region, 2023-2033 (US$ Million)
6.6.2 Market Share by Region, 2023 & 2033 (%)
6.7 Neurodegenerative Diseases
6.7.1 Market Size by Region, 2023-2033 (US$ Million)
6.7.2 Market Share by Region, 2023 & 2033 (%)
6.8 Metabolic Diseases
6.8.1 Market Size by Region, 2023-2033 (US$ Million)
6.8.2 Market Share by Region, 2023 & 2033 (%)
6.9 Others
6.9.1 Market Size by Region, 2023-2033 (US$ Million)
6.9.2 Market Share by Region, 2023 & 2033 (%)
7 AI-Enabled Drug Discovery and Clinical Trials Market Analysis by End-User
7.1 Key Findings
7.2 End-User Segment: Market Attractiveness Index
7.3 AI-Enabled Drug Discovery and Clinical Trials Market Size Estimation and Forecast by End-User
7.4 Pharmaceutical & Biopharmaceutical Companies
7.4.1 Market Size by Region, 2023-2033 (US$ Million)
7.4.2 Market Share by Region, 2023 & 2033 (%)
7.5 Contract Research Organizations (CROs)
7.5.1 Market Size by Region, 2023-2033 (US$ Million)
7.5.2 Market Share by Region, 2023 & 2033 (%)
7.6 Others
7.6.1 Market Size by Region, 2023-2033 (US$ Million)
7.6.2 Market Share by Region, 2023 & 2033 (%)
8 AI-Enabled Drug Discovery and Clinical Trials Market Analysis by Region
8.1 Key Findings
8.2 Regional Market Size Estimation and Forecast
9 North America AI-Enabled Drug Discovery and Clinical Trials Market Analysis
9.1 Key Findings
9.2 North America AI-Enabled Drug Discovery and Clinical Trials Market Attractiveness Index
9.3 North America AI-Enabled Drug Discovery and Clinical Trials Market by Country, 2023, 2028 & 2033 (US$ Million)
9.4 North America AI-Enabled Drug Discovery and Clinical Trials Market Size Estimation and Forecast by Country
9.5 North America AI-Enabled Drug Discovery and Clinical Trials Market Size Estimation and Forecast by Components
9.6 North America AI-Enabled Drug Discovery and Clinical Trials Market Size Estimation and Forecast by Application
9.7 North America AI-Enabled Drug Discovery and Clinical Trials Market Size Estimation and Forecast by Therapeutic Area
9.8 North America AI-Enabled Drug Discovery and Clinical Trials Market Size Estimation and Forecast by End-user
9.9 U.S. AI-Enabled Drug Discovery and Clinical Trials Market Analysis
9.10 Canada AI-Enabled Drug Discovery and Clinical Trials Market Analysis
10 Europe AI-Enabled Drug Discovery and Clinical Trials Market Analysis
10.1 Key Findings
10.2 Europe AI-Enabled Drug Discovery and Clinical Trials Market Attractiveness Index
10.3 Europe AI-Enabled Drug Discovery and Clinical Trials Market by Country, 2023, 2028 & 2033 (US$ Million)
10.4 Europe AI-Enabled Drug Discovery and Clinical Trials Market Size Estimation and Forecast by Country
10.5 Europe AI-Enabled Drug Discovery and Clinical Trials Market Size Estimation and Forecast by Components
10.6 Europe AI-Enabled Drug Discovery and Clinical Trials Market Size Estimation and Forecast by Application
10.7 Europe AI-Enabled Drug Discovery and Clinical Trials Market Size Estimation and Forecast by Therapeutic Area
10.8 Europe AI-Enabled Drug Discovery and Clinical Trials Market Size Estimation and Forecast by End-user
10.9 Germany AI-Enabled Drug Discovery and Clinical Trials Market Analysis
10.10 UK AI-Enabled Drug Discovery and Clinical Trials Market Analysis
10.11 France AI-Enabled Drug Discovery and Clinical Trials Market Analysis
10.12 Italy AI-Enabled Drug Discovery and Clinical Trials Market Analysis
10.13 Spain AI-Enabled Drug Discovery and Clinical Trials Market Analysis
10.14 Russia AI-Enabled Drug Discovery and Clinical Trials Market Analysis
10.15 Rest of Europe AI-Enabled Drug Discovery and Clinical Trials Market Analysis
11 Asia AI-Enabled Drug Discovery and Clinical Trials Market Analysis
11.1 Key Findings
11.2 Asia AI-Enabled Drug Discovery and Clinical Trials Market Attractiveness Index
11.3 Asia AI-Enabled Drug Discovery and Clinical Trials Market by Country, 2023, 2028 & 2033 (US$ Million)
11.4 Asia AI-Enabled Drug Discovery and Clinical Trials Market Size Estimation and Forecast by Country
11.5 Asia Pacific AI-Enabled Drug Discovery and Clinical Trials Market Size Estimation and Forecast by Components
11.6 Asia Pacific AI-Enabled Drug Discovery and Clinical Trials Market Size Estimation and Forecast by Application
11.7 Asia Pacific AI-Enabled Drug Discovery and Clinical Trials Market Size Estimation and Forecast by Therapeutic Area
11.8 Asia Pacific AI-Enabled Drug Discovery and Clinical Trials Market Size Estimation and Forecast by End-user
11.9 Japan AI-Enabled Drug Discovery and Clinical Trials Market Analysis
11.10 China AI-Enabled Drug Discovery and Clinical Trials Market Analysis
11.11 India AI-Enabled Drug Discovery and Clinical Trials Market Analysis
11.12 Australia AI-Enabled Drug Discovery and Clinical Trials Market Analysis
11.13 South Korea AI-Enabled Drug Discovery and Clinical Trials Market Analysis
11.14 Rest of Asia AI-Enabled Drug Discovery and Clinical Trials Market Analysis
12 Latin America AI-Enabled Drug Discovery and Clinical Trials Market Analysis
12.1 Key Findings
12.2 Latin America AI-Enabled Drug Discovery and Clinical Trials Market Attractiveness Index
12.3 Latin America AI-Enabled Drug Discovery and Clinical Trials Market by Country, 2023, 2028 & 2033 (US$ Million)
12.4 Latin America AI-Enabled Drug Discovery and Clinical Trials Market Size Estimation and Forecast by Country
12.5 Latin America AI-Enabled Drug Discovery and Clinical Trials Market Size Estimation and Forecast by Components
12.6 Latin America AI-Enabled Drug Discovery and Clinical Trials Market Size Estimation and Forecast by Application
12.7 Latin America AI-Enabled Drug Discovery and Clinical Trials Market Size Estimation and Forecast by Therapeutic Area
12.8 Latin America AI-Enabled Drug Discovery and Clinical Trials Market Size Estimation and Forecast by End-user
12.9 Brazil AI-Enabled Drug Discovery and Clinical Trials Market Analysis
12.10 Mexico AI-Enabled Drug Discovery and Clinical Trials Market Analysis
12.11 Argentina AI-Enabled Drug Discovery and Clinical Trials Market Analysis
12.12 Rest of Latin America AI-Enabled Drug Discovery and Clinical Trials Market Analysis
13 MEA AI-Enabled Drug Discovery and Clinical Trials Market Analysis
13.1 Key Findings
13.2 MEA AI-Enabled Drug Discovery and Clinical Trials Market Attractiveness Index
13.3 MEA AI-Enabled Drug Discovery and Clinical Trials Market by Country, 2023, 2028 & 2033 (US$ Million)
13.4 MEA AI-Enabled Drug Discovery and Clinical Trials Market Size Estimation and Forecast by Country
13.5 MEA AI-Enabled Drug Discovery and Clinical Trials Market Size Estimation and Forecast by Components
13.6 MEA AI-Enabled Drug Discovery and Clinical Trials Market Size Estimation and Forecast by Application
13.7 MEA AI-Enabled Drug Discovery and Clinical Trials Market Size Estimation and Forecast by Therapeutic Area
13.8 MEA AI-Enabled Drug Discovery and Clinical Trials Market Size Estimation and Forecast by End-user
13.9 GCC AI-Enabled Drug Discovery and Clinical Trials Market Analysis
13.10 South Africa AI-Enabled Drug Discovery and Clinical Trials Market Analysis
13.11 Rest of MEA AI-Enabled Drug Discovery and Clinical Trials Market Analysis
14 Company Profiles
14.1 Company Share Analysis, 2022
14.2 Strategic Outlook
14.3 IBM Watson
14.3.1 Company Snapshot
14.3.2 Company Overview
14.3.3 Financial Analysis
14.3.3.1 Net Revenue, 2019 -2022
14.3.3.2 R&D, 2019-2022
14.3.3.3 Regional Market Shares, 2022
14.3.4 Service Benchmarking
14.3.5 Strategic Outlook
14.4 Saama Technologies
14.4.1 Company Snapshot
14.4.2 Company Overview
14.4.3 Service Benchmarking
14.4.4 Strategic Outlook
14.5 PathAI
14.5.1 Company Snapshot
14.5.2 Company Overview
14.5.3 Service Benchmarking
14.5.4 Strategic Outlook
14.6 GNS Healthcare
14.6.1 Company Snapshot
14.6.2 Company Overview
14.6.3 Service Benchmarking
14.6.4 Strategic Outlook
14.7 Unlearn.AI, Inc.
14.7.1 Company Snapshot
14.7.2 Company Overview
14.7.3 Service Benchmarking
14.7.4 Strategic Outlook
14.8 Novartis AG
14.8.1 Company Snapshot
14.8.2 Company Overview
14.8.3 Financial Analysis
14.8.3.1 Net Revenue, 2020 -2022
14.8.4 Service Benchmarking
14.8.5 Strategic Outlook
14.9 Merck & Co., Inc.
14.9.1 Company Snapshot
14.9.2 Company Overview
14.9.3 Financial Analysis
14.9.3.1 Net Revenue, 2019-2021
14.9.4 Service Benchmarking
14.9.5 Strategic Outlook
14.10 AbbVie Inc.
14.10.1 Company Snapshot
14.10.2 Company Overview
14.10.3 Financial Analysis
14.10.3.1 Net Revenue, 2019-2021
14.10.4 Service Benchmarking
14.10.5 Strategic Outlook
14.11 Exscientia
14.11.1 Company Snapshot
14.11.2 Company Overview
14.11.3 Service Benchmarking
14.11.4 Strategic Outlook
15 Conclusion and Recommendations
15.1 Concluding Remarks from Visiongain
15.2 Recommendations for Market Players
ページTOPに戻る
List of Tables/Graphs
List of Tables
Table 1 AI-Enabled Drug Discovery and Clinical Trials Market Snapshot, 2023 & 2033 (US$ Million, CAGR %)
Table 2 AI-Enabled Drug Discovery and Clinical Trials Market Forecast by Region, 2023-2033 (US$ Million, AGR%, CAGR%): “V” Shaped Recovery
Table 3 AI-Enabled Drug Discovery and Clinical Trials Market Forecast by Region, 2023-2033 (US$ Million, AGR%, CAGR%): “U” Shaped Recovery
Table 4 AI-Enabled Drug Discovery and Clinical Trials Market Forecast by Region, 2023-2033 (US$ Million, AGR%, CAGR%): “W” Shaped Recovery
Table 5 AI-Enabled Drug Discovery and Clinical Trials Market Forecast by Region, 2023-2033 (US$ Million, AGR%, CAGR%): “L” Shaped Recovery
Table 6 AI-Enabled Drug Discovery and Clinical Trials Market Forecast by Components, 2023-2033 (US$ Million, AGR%, CAGR%)
Table 7 Services Segment Market Forecast by Region, 2023-2033 (US$ Million, AGR%, CAGR%)
Table 8 Software Segment Market Forecast by Region, 2023-2033 (US$ Million, AGR%, CAGR%)
Table 9 AI-Enabled Drug Discovery and Clinical Trials Market Forecast by Application, 2023-2033 (US$ Million, AGR%, CAGR%)
Table 10 Clinical Trials Segment Market Forecast by Region, 2023-2033 (US$ Million, AGR%, CAGR%)
Table 11 Drug Design Segment Market Forecast by Region, 2023-2033 (US$ Million, AGR%, CAGR%)
Table 12 Data Aggregation and Analysis Segment Market Forecast by Region, 2023-2033 (US$ Million, AGR%, CAGR%)
Table 13 Drug Characterization Segment Market Forecast by Region, 2023-2033 (US$ Million, AGR%, CAGR%)
Table 14 Biomarker Research Segment Market Forecast by Region, 2023-2033 (US$ Million, AGR%, CAGR%)
Table 15 Others Segment Market Forecast by Region, 2023-2033 (US$ Million, AGR%, CAGR%)
Table 16 AI-Enabled Drug Discovery and Clinical Trials Market Forecast by Therapeutic Area, 2023-2033 (US$ Million, AGR%, CAGR%)
Table 17 Oncology Segment Market Forecast by Region, 2023-2033 (US$ Million, AGR%, CAGR%)
Table 18 Cardiovascular Diseases Segment Market Forecast by Region, 2023-2033 (US$ Million, AGR%, CAGR%)
Table 19 Infectious Diseases Segment Market Forecast by Region, 2023-2033 (US$ Million, AGR%, CAGR%)
Table 20 Neurodegenerative Diseases Segment Market Forecast by Region, 2023-2033 (US$ Million, AGR%, CAGR%)
Table 21 Metabolic Diseases Segment Market Forecast by Region, 2023-2033 (US$ Million, AGR%, CAGR%)
Table 22 Others Segment Market Forecast by Region, 2023-2033 (US$ Million, AGR%, CAGR%)
Table 23 AI-Enabled Drug Discovery and Clinical Trials Market Forecast by End-User, 2023-2033 (US$ Million, AGR%, CAGR%)
Table 24 Pharmaceutical & Biopharmaceutical Companies Segment Market Forecast by Region, 2023-2033 (US$ Million, AGR%, CAGR%)
Table 25 Contract Research Organizations (CROs) Segment Market Forecast by Region, 2023-2033 (US$ Million, AGR%, CAGR%)
Table 26 Others Segment Market Forecast by Region, 2023-2033 (US$ Million, AGR%, CAGR%)
Table 27 AI-Enabled Drug Discovery and Clinical Trials Market Forecast by Region, 2023-2033 (US$ Million, AGR%, CAGR%)
Table 28 North America AI-Enabled Drug Discovery and Clinical Trials Market Forecast by Country, 2023-2033 (US$ Million, AGR%, CAGR%)
Table 29 North America AI-Enabled Drug Discovery and Clinical Trials Market Forecast by Components, 2023-2033 (US$ Million, AGR%, CAGR%)
Table 30 North America AI-Enabled Drug Discovery and Clinical Trials Market Forecast by Application, 2023-2033 (US$ Million, AGR%, CAGR%)
Table 31 North America AI-Enabled Drug Discovery and Clinical Trials Market Forecast by Therapeutic Area, 2023-2033 (US$ Million, AGR%, CAGR%)
Table 32 AI-Enabled Drug Discovery and Clinical Trials Market Forecast by End-User, 2023-2033 (US$ Million, AGR%, CAGR%)
Table 33 U.S. AI-Enabled Drug Discovery and Clinical Trials Market Forecast, 2023-2033 (US$ Million, AGR%, CAGR%)
Table 34 Canada AI-Enabled Drug Discovery and Clinical Trials Market Forecast, 2023-2033 (US$ Million, AGR%, CAGR%)
Table 35 Europe AI-Enabled Drug Discovery and Clinical Trials Market Forecast by Country, 2023-2033 (US$ Million, AGR%, CAGR%)
Table 36 Europe AI-Enabled Drug Discovery and Clinical Trials Market Forecast by Components, 2023-2033 (US$ Million, AGR%, CAGR%)
Table 37 Europe AI-Enabled Drug Discovery and Clinical Trials Market Forecast by Application, 2023-2033 (US$ Million, AGR%, CAGR%)
Table 38 Europe AI-Enabled Drug Discovery and Clinical Trials Market Forecast by Therapeutic Area, 2023-2033 (US$ Million, AGR%, CAGR%)
Table 39 AI-Enabled Drug Discovery and Clinical Trials Market Forecast by End-User, 2023-2033 (US$ Million, AGR%, CAGR%)
Table 40 Germany AI-Enabled Drug Discovery and Clinical Trials Market Forecast, 2023-2033 (US$ Million, AGR%, CAGR%)
Table 41 UK AI-Enabled Drug Discovery and Clinical Trials Market Forecast, 2023-2033 (US$ Million, AGR%, CAGR%)
Table 42 France AI-Enabled Drug Discovery and Clinical Trials Market Forecast, 2023-2033 (US$ Million, AGR%, CAGR%)
Table 43 Italy AI-Enabled Drug Discovery and Clinical Trials Market Forecast, 2023-2033 (US$ Million, AGR%, CAGR%)
Table 44 Spain AI-Enabled Drug Discovery and Clinical Trials Market Forecast, 2023-2033 (US$ Million, AGR%, CAGR%)
Table 45 Russia AI-Enabled Drug Discovery and Clinical Trials Market Forecast, 2023-2033 (US$ Million, AGR%, CAGR%)
Table 46 Rest of Europe AI-Enabled Drug Discovery and Clinical Trials Market Forecast, 2023-2033 (US$ Million, AGR%, CAGR%)
Table 47 Asia AI-Enabled Drug Discovery and Clinical Trials Market Forecast by Country, 2023-2033 (US$ Million, AGR%, CAGR%)
Table 48 Asia Pacific AI-Enabled Drug Discovery and Clinical Trials Market Forecast by Components, 2023-2033 (US$ Million, AGR%, CAGR%)
Table 49 Asia Pacific AI-Enabled Drug Discovery and Clinical Trials Market Forecast by Application, 2023-2033 (US$ Million, AGR%, CAGR%)
Table 50 Asia Pacific AI-Enabled Drug Discovery and Clinical Trials Market Forecast by Therapeutic Area, 2023-2033 (US$ Million, AGR%, CAGR%)
Table 51 AI-Enabled Drug Discovery and Clinical Trials Market Forecast by End-User, 2023-2033 (US$ Million, AGR%, CAGR%)
Table 52 Japan AI-Enabled Drug Discovery and Clinical Trials Market Forecast, 2023-2033 (US$ Million, AGR%, CAGR%)
Table 53 China AI-Enabled Drug Discovery and Clinical Trials Market Forecast, 2023-2033 (US$ Million, AGR%, CAGR%)
Table 54 India AI-Enabled Drug Discovery and Clinical Trials Market Forecast, 2023-2033 (US$ Million, AGR%, CAGR%)
Table 55 Australia AI-Enabled Drug Discovery and Clinical Trials Market Forecast, 2023-2033 (US$ Million, AGR%, CAGR%)
Table 56 South Korea AI-Enabled Drug Discovery and Clinical Trials Market Forecast, 2023-2033 (US$ Million, AGR%, CAGR%)
Table 57 Rest of Asia AI-Enabled Drug Discovery and Clinical Trials Market Forecast, 2023-2033 (US$ Million, AGR%, CAGR%)
Table 58 Latin America AI-Enabled Drug Discovery and Clinical Trials Market Forecast by Country, 2023-2033 (US$ Million, AGR%, CAGR%)
Table 59 Latin America AI-Enabled Drug Discovery and Clinical Trials Market Forecast by Components, 2023-2033 (US$ Million, AGR%, CAGR%)
Table 60 Latin America AI-Enabled Drug Discovery and Clinical Trials Market Forecast by Application, 2023-2033 (US$ Million, AGR%, CAGR%)
Table 61 Latin America AI-Enabled Drug Discovery and Clinical Trials Market Forecast by Therapeutic Area, 2023-2033 (US$ Million, AGR%, CAGR%)
Table 62 AI-Enabled Drug Discovery and Clinical Trials Market Forecast by End-User, 2023-2033 (US$ Million, AGR%, CAGR%)
Table 63 Brazil AI-Enabled Drug Discovery and Clinical Trials Market Forecast, 2023-2033 (US$ Million, AGR%, CAGR%)
Table 64 Mexico AI-Enabled Drug Discovery and Clinical Trials Market Forecast, 2023-2033 (US$ Million, AGR%, CAGR%)
Table 65 Argentina AI-Enabled Drug Discovery and Clinical Trials Market Forecast, 2023-2033 (US$ Million, AGR%, CAGR%)
Table 66 Rest of Latin America AI-Enabled Drug Discovery and Clinical Trials Market Forecast, 2023-2033 (US$ Million, AGR%, CAGR%)
Table 67 MEA AI-Enabled Drug Discovery and Clinical Trials Market Forecast by Country, 2023-2033 (US$ Million, AGR%, CAGR%)
Table 68 MEA AI-Enabled Drug Discovery and Clinical Trials Market Forecast by Components, 2023-2033 (US$ Million, AGR%, CAGR%)
Table 69 MEA AI-Enabled Drug Discovery and Clinical Trials Market Forecast by Application, 2023-2033 (US$ Million, AGR%, CAGR%)
Table 70 MEA AI-Enabled Drug Discovery and Clinical Trials Market Forecast by Therapeutic Area, 2023-2033 (US$ Million, AGR%, CAGR%)
Table 71 AI-Enabled Drug Discovery and Clinical Trials Market Forecast by End-User, 2023-2033 (US$ Million, AGR%, CAGR%)
Table 72 GCC AI-Enabled Drug Discovery and Clinical Trials Market Forecast, 2023-2033 (US$ Million, AGR%, CAGR%)
Table 73 South Africa AI-Enabled Drug Discovery and Clinical Trials Market Forecast, 2023-2033 (US$ Million, AGR%, CAGR%)
Table 74 Rest of MEA AI-Enabled Drug Discovery and Clinical Trials Market Forecast, 2023-2033 (US$ Million, AGR%, CAGR%)
Table 75 Strategic Outlook
Table 76 IBM Watson: Key Details, (CEO, HQ, Revenue, Founded, No. of Employees, Company Type, Website, Business Segment)
Table 77 IBM: Service Benchmarking
Table 78 IBM: Strategic Outlook
Table 79 Saama Technologies: Key Details, (CEO, HQ, Revenue, Founded, No. of Employees, Company Type, Website, Business Segment)
Table 80 Saama Technologies: Service Benchmarking
Table 81 Saama Technologies: Strategic Outlook
Table 82 PathAI: Key Details, (CEO, HQ, Revenue, Founded, No. of Employees, Company Type, Website, Business Segment)
Table 83 PathAI: Service Benchmarking
Table 84 PathAI: Strategic Outlook
Table 85 GNS Healthcare: Key Details, (CEO, HQ, Revenue, Founded, No. of Employees, Company Type, Website, Business Segment)
Table 86 GNS Healthcare: Service Benchmarking
Table 87 GNS Healthcare: Strategic Outlook
Table 88 Unlearn.AI: Key Details, (CEO, HQ, Revenue, Founded, No. of Employees, Company Type, Website, Business Segment)
Table 89 Unlearn.AI: Service Benchmarking
Table 90 Unlearn.AI: Strategic Outlook
Table 91 Novartis: Key Details, (CEO, HQ, Revenue, Founded, No. of Employees, Company Type, Website, Business Segment)
Table 92 Novartis: Service Benchmarking
Table 93 Novartis: Strategic Outlook
Table 94 Merck & Co., Inc.: Key Details, (CEO, HQ, Revenue, Founded, No. of Employees, Company Type, Website, Business Segment)
Table 95 Merck & Co. Inc.: Service Benchmarking
Table 96 Novartis: Strategic Outlook
Table 97 Abbvie Inc.: Key Details, (CEO, HQ, Revenue, Founded, No. of Employees, Company Type, Website, Business Segment)
Table 98 AbbVie Inc.: Service Benchmarking
Table 99 Exscientia: Strategic Outlook
Table 100 Exscientia: Key Details, (CEO, HQ, Revenue, Founded, No. of Employees, Company Type, Website, Business Segment)
Table 101 Exscientia: Service Benchmarking
Table 102 Exscientia: Strategic Outlook
List of Figures
Figure 1 AI-Enabled Drug Discovery and Clinical Trials Market Segmentation
Figure 2 AI-Enabled Drug Discovery and Clinical Trials Market by Component: Market Attractiveness Index
Figure 3 AI-Enabled Drug Discovery and Clinical Trials Market by Application: Market Attractiveness Index
Figure 4 AI-Enabled Drug Discovery and Clinical Trials Market by Therapeutic Area Market Attractiveness Index
Figure 5 AI-Enabled Drug Discovery and Clinical Trials Market by End-user: Market Attractiveness Index
Figure 6 AI-Enabled Drug Discovery and Clinical Trials Market Attractiveness Index by Region
Figure 7 AI-Enabled Drug Discovery and Clinical Trials Market: Market Dynamics
Figure 8 AI-Enabled Drug Discovery and Clinical Trials Market by Region, 2023-2033 (US$ Million, AGR %): “V” Shaped Recovery
Figure 9 AI-Enabled Drug Discovery and Clinical Trials Market by Region, 2023-2033 (US$ Million, AGR %): “U” Shaped Recovery
Figure 10 AI-Enabled Drug Discovery and Clinical Trials Market by Region, 2023-2033 (US$ Million, AGR %): “W” Shaped Recovery
Figure 11 AI-Enabled Drug Discovery and Clinical Trials Market by Region, 2023-2033 (US$ Million, AGR %): “L” Shaped Recovery
Figure 12 AI-Enabled Drug Discovery and Clinical Trials Market: Porter’s Five Forces Analysis
Figure 13 AI-Enabled Drug Discovery and Clinical Trials Market: PEST Analysis
Figure 14 AI-Enabled Drug Discovery and Clinical Trials Market by Components: Market Attractiveness Index
Figure 15 AI-Enabled Drug Discovery and Clinical Trials Market Forecast by Components, 2023-2033 (US$ Million, AGR %)
Figure 16 AI-Enabled Drug Discovery and Clinical Trials Share Forecast by Components, 2023, 2028, 2033 (%)
Figure 17 Services Segment Market Forecast by Region, 2023-2033 (US$ Million, AGR %)
Figure 18 Services Segment Market Share Forecast by Region, 2023 & 2033 (%)
Figure 19 Software Segment Market Forecast by Region, 2023-2033 (US$ Million, AGR %)
Figure 20 Software Segment Market Share Forecast by Region, 2023 & 2033 (%)
Figure 21 AI-Enabled Drug Discovery and Clinical Trials Market by Application: Market Attractiveness Index
Figure 22 AI-Enabled Drug Discovery and Clinical Trials Market Forecast by Application, 2023-2033 (US$ Million, AGR %)
Figure 23 AI-Enabled Drug Discovery and Clinical Trials Share Forecast by Application, 2023, 2028, 2033 (%)
Figure 24 Clinical Trials Segment Market Forecast by Region, 2023-2033 (US$ Million, AGR %)
Figure 25 Clinical Trials Segment Market Share Forecast by Region, 2023 & 2033 (%)
Figure 26 Drug Design Segment Market Forecast by Region, 2023-2033 (US$ Million, AGR %)
Figure 27 Drug Design Segment Market Share Forecast by Region, 2023 & 2033 (%)
Figure 28 Data Aggregation and Analysis Segment Market Forecast by Region, 2023-2033 (US$ Million, AGR %)
Figure 29 Data Aggregation and Analysis Segment Market Share Forecast by Region, 2023 & 2033 (%)
Figure 30 Drug Characterization Segment Market Forecast by Region, 2023-2033 (US$ Million, AGR %)
Figure 31 Drug Characterization Segment Market Share Forecast by Region, 2023 & 2033 (%)
Figure 32 Biomarker Research Segment Market Forecast by Region, 2023-2033 (US$ Million, AGR %)
Figure 33 Biomarker Research Segment Market Share Forecast by Region, 2023 & 2033 (%)
Figure 34 Others Segment Market Forecast by Region, 2023-2033 (US$ Million, AGR %)
Figure 35 Others Segment Market Share Forecast by Region, 2023 & 2033 (%)
Figure 36 AI-Enabled Drug Discovery and Clinical Trials Market by Therapeutic Area: Market Attractiveness Index
Figure 37 AI-Enabled Drug Discovery and Clinical Trials Market Forecast by Therapeutic Area, 2023-2033 (US$ Million, AGR %)
Figure 38 AI-Enabled Drug Discovery and Clinical Trials Share Forecast by Therapeutic Area, 2023, 2028, 2033 (%)
Figure 39 Oncology Segment Market Forecast by Region, 2023-2033 (US$ Million, AGR %)
Figure 40 Oncology Segment Market Share Forecast by Region, 2023 & 2033 (%)
Figure 41 Cardiovascular Diseases Segment Market Forecast by Region, 2023-2033 (US$ Million, AGR %)
Figure 42 Cardiovascular Diseases Segment Market Share Forecast by Region, 2023 & 2033 (%)
Figure 43 Infectious Diseases Segment Market Forecast by Region, 2023-2033 (US$ Million, AGR %)
Figure 44 Infectious Diseases Segment Market Share Forecast by Region, 2023 & 2033 (%)
Figure 45 Neurodegenerative Diseases Segment Market Forecast by Region, 2023-2033 (US$ Million, AGR %)
Figure 46 Neurodegenerative Diseases Segment Market Share Forecast by Region, 2023 & 2033 (%)
Figure 47 Metabolic Diseases Segment Market Forecast by Region, 2023-2033 (US$ Million, AGR %)
Figure 48 Metabolic Diseases Segment Market Share Forecast by Region, 2023 & 2033 (%)
Figure 49 Others Segment Market Forecast by Region, 2023-2033 (US$ Million, AGR %)
Figure 50 Others Segment Market Share Forecast by Region, 2023 & 2033 (%)
Figure 51 AI-Enabled Drug Discovery and Clinical Trials Market by End-User: Market Attractiveness Index
Figure 52 AI-Enabled Drug Discovery and Clinical Trials Market Forecast by End-User, 2023-2033 (US$ Million, AGR %)
Figure 53 AI-Enabled Drug Discovery and Clinical Trials Share Forecast by End-User, 2023, 2028, 2033 (%)
Figure 54 Pharmaceutical & Biopharmaceutical Companies Segment Market Forecast by Region, 2023-2033 (US$ Million, AGR %)
Figure 55 Pharmaceutical & Biopharmaceutical Companies Segment Market Share Forecast by Region, 2023 & 2033 (%)
Figure 56 Contract Research Organizations (CROs) Segment Market Forecast by Region, 2023-2033 (US$ Million, AGR %)
Figure 57 Contract Research Organizations (CROs) Segment Market Share Forecast by Region, 2023 & 2033 (%)
Figure 58 Others Segment Market Forecast by Region, 2023-2033 (US$ Million, AGR %)
Figure 59 Others Segment Market Share Forecast by Region, 2023 & 2033 (%)
Figure 60 AI-Enabled Drug Discovery and Clinical Trials Market Forecast by Region 2023 and 2033 (Revenue, CAGR%)
Figure 61 AI-Enabled Drug Discovery and Clinical Trials Market Share Forecast by Region 2023, 2028, 2033 (%)
Figure 62 AI-Enabled Drug Discovery and Clinical Trials Market by Region, 2023-2033 (US$ Million, AGR %)
Figure 63 North America AI-Enabled Drug Discovery and Clinical Trials Market Attractiveness Index
Figure 64 North America AI-Enabled Drug Discovery and Clinical Trials Market by Region, 2023, 2028 & 2033 (US$ Million)
Figure 65 North America AI-Enabled Drug Discovery and Clinical Trials Market Forecast by Country, 2023-2033 (US$ Million, AGR %)
Figure 66 North America AI-Enabled Drug Discovery and Clinical Trials Market Share Forecast by Country, 2023 & 2033 (%)
Figure 67 North America AI-Enabled Drug Discovery and Clinical Trials Market Forecast by Components, 2023-2033 (US$ Million, AGR %)
Figure 68 North America AI-Enabled Drug Discovery and Clinical Trials Market Share Forecast by Components, 2023 & 2033 (%)
Figure 69 North America AI-Enabled Drug Discovery and Clinical Trials Market Forecast by Application, 2023-2033 (US$ Million, AGR %)
Figure 70 North America AI-Enabled Drug Discovery and Clinical Trials Market Share Forecast by Application, 2023 & 2033 (%)
Figure 71 North America AI-Enabled Drug Discovery and Clinical Trials Market Forecast by Therapeutic Area, 2023-2033 (US$ Million, AGR %)
Figure 72 North America AI-Enabled Drug Discovery and Clinical Trials Market Share Forecast by Therapeutic Area, 2023 & 2033 (%)
Figure 73 North America AI-Enabled Drug Discovery and Clinical Trials Market Forecast by End-user, 2023-2033 (US$ Million, AGR %)
Figure 74 North America AI-Enabled Drug Discovery and Clinical Trials Market Share Forecast by End-user, 2023 & 2033 (%)
Figure 75 U.S. AI-Enabled Drug Discovery and Clinical Trials Market Forecast, 2023-2033 (US$ Million, AGR %)
Figure 76 Canada AI-Enabled Drug Discovery and Clinical Trials Market Forecast, 2023-2033 (US$ Million, AGR %)
Figure 77 Europe AI-Enabled Drug Discovery and Clinical Trials Market Attractiveness Index
Figure 78 Europe AI-Enabled Drug Discovery and Clinical Trials Market by Region, 2023, 2028 & 2033 (US$ Million)
Figure 79 Europe AI-Enabled Drug Discovery and Clinical Trials Market Forecast by Country, 2023-2033 (US$ Million, AGR %)
Figure 80 Europe AI-Enabled Drug Discovery and Clinical Trials Market Share Forecast by Country, 2023 & 2033 (%)
Figure 81 Europe AI-Enabled Drug Discovery and Clinical Trials Market Forecast by Components, 2023-2033 (US$ Million, AGR %)
Figure 82 Europe AI-Enabled Drug Discovery and Clinical Trials Market Share Forecast by Components, 2023 & 2033 (%)
Figure 83 Europe AI-Enabled Drug Discovery and Clinical Trials Market Forecast by Application, 2023-2033 (US$ Million, AGR %)
Figure 84 Europe AI-Enabled Drug Discovery and Clinical Trials Market Share Forecast by Application, 2023 & 2033 (%)
Figure 85 Europe AI-Enabled Drug Discovery and Clinical Trials Market Forecast by Therapeutic Area, 2023-2033 (US$ Million, AGR %)
Figure 86 Europe AI-Enabled Drug Discovery and Clinical Trials Market Share Forecast by Therapeutic Area, 2023 & 2033 (%)
Figure 87 Europe AI-Enabled Drug Discovery and Clinical Trials Market Forecast by End-user, 2023-2033 (US$ Million, AGR %)
Figure 88 Europe AI-Enabled Drug Discovery and Clinical Trials Market Share Forecast by End-user, 2023 & 2033 (%)
Figure 89 Germany AI-Enabled Drug Discovery and Clinical Trials Market Forecast, 2023-2033 (US$ Million, AGR %)
Figure 90 UK AI-Enabled Drug Discovery and Clinical Trials Market Forecast, 2023-2033 (US$ Million, AGR %)
Figure 91 France AI-Enabled Drug Discovery and Clinical Trials Market Forecast, 2023-2033 (US$ Million, AGR %)
Figure 92 Italy AI-Enabled Drug Discovery and Clinical Trials Market Forecast, 2023-2033 (US$ Million, AGR %)
Figure 93 Spain AI-Enabled Drug Discovery and Clinical Trials Market Forecast, 2023-2033 (US$ Million, AGR %)
Figure 94 Russia AI-Enabled Drug Discovery and Clinical Trials Market Forecast, 2023-2033 (US$ Million, AGR %)
Figure 95 Rest of Europe AI-Enabled Drug Discovery and Clinical Trials Market Forecast, 2023-2033 (US$ Million, AGR %)
Figure 96 Asia AI-Enabled Drug Discovery and Clinical Trials Market Attractiveness Index
Figure 97 Asia AI-Enabled Drug Discovery and Clinical Trials Market by Region, 2023, 2028 & 2033 (US$ Million)
Figure 98 Asia AI-Enabled Drug Discovery and Clinical Trials Market Forecast by Country, 2023-2033 (US$ Million, AGR %)
Figure 99 Asia AI-Enabled Drug Discovery and Clinical Trials Market Share Forecast by Country, 2023 & 2033 (%)
Figure 100 Asia Pacific AI-Enabled Drug Discovery and Clinical Trials Market Forecast by Components, 2023-2033 (US$ Million, AGR %)
Figure 101 Asia Pacific AI-Enabled Drug Discovery and Clinical Trials Market Share Forecast by Components, 2023 & 2033 (%)
Figure 102 Asia Pacific AI-Enabled Drug Discovery and Clinical Trials Market Forecast by Application, 2023-2033 (US$ Million, AGR %)
Figure 103 Asia Pacific AI-Enabled Drug Discovery and Clinical Trials Market Share Forecast by Application, 2023 & 2033 (%)
Figure 104 Asia Pacific AI-Enabled Drug Discovery and Clinical Trials Market Forecast by Therapeutic Area, 2023-2033 (US$ Million, AGR %)
Figure 105 Asia Pacific AI-Enabled Drug Discovery and Clinical Trials Market Share Forecast by Therapeutic Area, 2023 & 2033 (%)
Figure 106 Asia Pacific AI-Enabled Drug Discovery and Clinical Trials Market Forecast by End-user, 2023-2033 (US$ Million, AGR %)
Figure 107 Asia Pacific AI-Enabled Drug Discovery and Clinical Trials Market Share Forecast by End-user, 2023 & 2033 (%)
Figure 108 Japan AI-Enabled Drug Discovery and Clinical Trials Market Forecast, 2023-2033 (US$ Million, AGR %)
Figure 109 China AI-Enabled Drug Discovery and Clinical Trials Market Forecast, 2023-2033 (US$ Million, AGR %)
Figure 110 India AI-Enabled Drug Discovery and Clinical Trials Market Forecast, 2023-2033 (US$ Million, AGR %)
Figure 111 Australia AI-Enabled Drug Discovery and Clinical Trials Market Forecast, 2023-2033 (US$ Million, AGR %)
Figure 112 South Korea AI-Enabled Drug Discovery and Clinical Trials Market Forecast, 2023-2033 (US$ Million, AGR %)
Figure 113 Rest of Asia AI-Enabled Drug Discovery and Clinical Trials Market Forecast, 2023-2033 (US$ Million, AGR %)
Figure 114 Latin America AI-Enabled Drug Discovery and Clinical Trials Market Attractiveness Index
Figure 115 Latin America AI-Enabled Drug Discovery and Clinical Trials Market by Region, 2023, 2028 & 2033 (US$ Million)
Figure 116 Latin America AI-Enabled Drug Discovery and Clinical Trials Market Forecast by Country, 2023-2033 (US$ Million, AGR %)
Figure 117 Latin America AI-Enabled Drug Discovery and Clinical Trials Market Share Forecast by Country, 2023 & 2033 (%)
Figure 118 Latin America AI-Enabled Drug Discovery and Clinical Trials Market Forecast by Components, 2023-2033 (US$ Million, AGR %)
Figure 119 Latin America AI-Enabled Drug Discovery and Clinical Trials Market Share Forecast by Components, 2023 & 2033 (%)
Figure 120 Latin America AI-Enabled Drug Discovery and Clinical Trials Market Forecast by Application, 2023-2033 (US$ Million, AGR %)
Figure 121 Latin America AI-Enabled Drug Discovery and Clinical Trials Market Share Forecast by Application, 2023 & 2033 (%)
Figure 122 Latin America AI-Enabled Drug Discovery and Clinical Trials Market Forecast by Therapeutic Area, 2023-2033 (US$ Million, AGR %)
Figure 123 Latin America AI-Enabled Drug Discovery and Clinical Trials Market Share Forecast by Therapeutic Area, 2023 & 2033 (%)
Figure 124 Latin America AI-Enabled Drug Discovery and Clinical Trials Market Forecast by End-user, 2023-2033 (US$ Million, AGR %)
Figure 125 Latin America AI-Enabled Drug Discovery and Clinical Trials Market Share Forecast by End-user, 2023 & 2033 (%)
Figure 126 Brazil AI-Enabled Drug Discovery and Clinical Trials Market Forecast, 2023-2033 (US$ Million, AGR %)
Figure 127 Mexico AI-Enabled Drug Discovery and Clinical Trials Market Forecast, 2023-2033 (US$ Million, AGR %)
Figure 128 Argentina AI-Enabled Drug Discovery and Clinical Trials Market Forecast, 2023-2033 (US$ Million, AGR %)
Figure 129 Rest of Latin America AI-Enabled Drug Discovery and Clinical Trials Market Forecast, 2023-2033 (US$ Million, AGR %)
Figure 130 MEA AI-Enabled Drug Discovery and Clinical Trials Market Attractiveness Index
Figure 131 MEA AI-Enabled Drug Discovery and Clinical Trials Market by Region, 2023, 2028 & 2033 (US$ Million)
Figure 132 MEA AI-Enabled Drug Discovery and Clinical Trials Market Forecast by Country, 2023-2033 (US$ Million, AGR %)
Figure 133 MEA AI-Enabled Drug Discovery and Clinical Trials Market Share Forecast by Country, 2023 & 2033 (%)
Figure 134 MEA AI-Enabled Drug Discovery and Clinical Trials Market Forecast by Components, 2023-2033 (US$ Million, AGR %)
Figure 135 MEA AI-Enabled Drug Discovery and Clinical Trials Market Share Forecast by Components, 2023 & 2033 (%)
Figure 136 MEA AI-Enabled Drug Discovery and Clinical Trials Market Forecast by Application, 2023-2033 (US$ Million, AGR %)
Figure 137 MEA AI-Enabled Drug Discovery and Clinical Trials Market Share Forecast by Application, 2023 & 2033 (%)
Figure 138 MEA AI-Enabled Drug Discovery and Clinical Trials Market Forecast by Therapeutic Area, 2023-2033 (US$ Million, AGR %)
Figure 139 MEA AI-Enabled Drug Discovery and Clinical Trials Market Share Forecast by Therapeutic Area, 2023 & 2033 (%)
Figure 140 MEA AI-Enabled Drug Discovery and Clinical Trials Market Forecast by End-user, 2023-2033 (US$ Million, AGR %)
Figure 141 MEA AI-Enabled Drug Discovery and Clinical Trials Market Share Forecast by End-user, 2023 & 2033 (%)
Figure 142 GCC AI-Enabled Drug Discovery and Clinical Trials Market Forecast, 2023-2033 (US$ Million, AGR %)
Figure 143 South Africa AI-Enabled Drug Discovery and Clinical Trials Market Forecast, 2023-2033 (US$ Million, AGR %)
Figure 144 Rest of MEA AI-Enabled Drug Discovery and Clinical Trials Market Forecast, 2023-2033 (US$ Million, AGR %)
Figure 145 AI-Enabled Drug Discovery and Clinical Trials Market: Company Share Analysis, 2022
Figure 146 IBM: Net Revenue, 2019-2022 (US$ Million, AGR%)
Figure 147 IBM: R&D, 2019-2022 (US$ Million, AGR%)
Figure 148 IBM: Regional Market Shares, 2022
Figure 149 Novartis: Net Revenue, 2020-2022 (US$ Million, AGR%)
Figure 150 Merck: Net Revenue, 2019-2021 (US$ million, AGR %)
Figure 151 Net Revenue, 2019-2021 (US$ million, AGR %)
ページTOPに戻る
Visiongain社の医薬・化学品分野での最新刊レポート
本レポートと同じKEY WORD(drug)の最新刊レポート
よくあるご質問
Visiongain社はどのような調査会社ですか?
英国の調査会社ヴィジョンゲイン社(Visiongain)は、通信とエネルギーのほか、自動車や化学・医薬品、金属など、広範な市場を対象に調査を行っています。自動車市場については、市場全般に関する調査のほ... もっと見る
調査レポートの納品までの日数はどの程度ですか?
在庫のあるものは速納となりますが、平均的には 3-4日と見て下さい。
但し、一部の調査レポートでは、発注を受けた段階で内容更新をして納品をする場合もあります。
発注をする前のお問合せをお願いします。
注文の手続きはどのようになっていますか?
1)お客様からの御問い合わせをいただきます。
2)見積書やサンプルの提示をいたします。
3)お客様指定、もしくは弊社の発注書をメール添付にて発送してください。
4)データリソース社からレポート発行元の調査会社へ納品手配します。
5) 調査会社からお客様へ納品されます。最近は、pdfにてのメール納品が大半です。
お支払方法の方法はどのようになっていますか?
納品と同時にデータリソース社よりお客様へ請求書(必要に応じて納品書も)を発送いたします。
お客様よりデータリソース社へ(通常は円払い)の御振り込みをお願いします。
請求書は、納品日の日付で発行しますので、翌月最終営業日までの当社指定口座への振込みをお願いします。振込み手数料は御社負担にてお願いします。
お客様の御支払い条件が60日以上の場合は御相談ください。
尚、初めてのお取引先や個人の場合、前払いをお願いすることもあります。ご了承のほど、お願いします。
データリソース社はどのような会社ですか?
当社は、世界各国の主要調査会社・レポート出版社と提携し、世界各国の市場調査レポートや技術動向レポートなどを日本国内の企業・公官庁及び教育研究機関に提供しております。
世界各国の「市場・技術・法規制などの」実情を調査・収集される時には、データリソース社にご相談ください。
お客様の御要望にあったデータや情報を抽出する為のレポート紹介や調査のアドバイスも致します。
|
|

