プロピレングリコール市場レポート:2023-2033
Propylene Glycol Market Report 2023-2033
レポート詳細
プロピレングリコール市場レポート 2023-2033 :本レポートは、新たな収益源の開拓を目指すリーディングカンパニーにとって、業界とその基礎となる力学をより深く理解する上で、非常に貴... もっと見る
※上記価格は部署ライセンス(Departmental licence)価格です。
その他の価格についてはデータリソースまでお問合せください。
日本語のページは自動翻訳を利用し作成しています。
実際のレポートは英文のみでご納品いたします。

|

|
サマリー
レポート詳細
プロピレングリコール市場レポート 2023-2033:本レポートは、新たな収益源の開拓を目指すリーディングカンパニーにとって、業界とその基礎となる力学をより深く理解する上で、非常に貴重なものとなるでしょう。また、異業種への進出や新地域での既存事業の拡大を目指す企業にとっても有益なレポートです。
不飽和ポリエステル樹脂の需要増がプロピレングリコール市場の成長を促進すると予想される
プロピレングリコール市場は、不飽和ポリエステル樹脂(UPR)の需要拡大により、大きな成長を遂げると予想されています。UPRはプロピレングリコールの主要な最終用途であり、ガラス繊維強化プラスチックなどの複合材料の生産に主に使用されています。建設、自動車、船舶、電気などさまざまな産業でUPRの採用が進んでおり、プロピレングリコールの需要を後押しすると期待されています。さらに、自動車業界では、軽量素材と燃費を重視する傾向が強まっており、ボディパネル、内装部品、構造補強材などの自動車部品の生産におけるUPRの需要を押し上げています。プロピレングリコールは、UPRの配合において重要な役割を果たし、安定性、粘度制御、硬化特性を向上させます。自動車業界では技術の進歩や軽量化への要求が高まっており、プロピレングリコール市場は持続的な成長が期待されています。
また、海洋産業や電気産業はUPRの重要な消費者であり、これがプロピレングリコールの需要をさらに促進しています。UPRベースの複合材料は、船舶製造、風力タービンブレード、電気絶縁など、幅広い用途に使用されています。風力発電などの再生可能エネルギーへの注目の高まりは、UPRベースの材料への需要を促進し、結果としてプロピレングリコール市場を強化することになります。
業界成長の妨げとなる原材料の入手可能性と価格
プロピレングリコール製造会社の価格と収益性は、石油由来の原料の入手可能性とコストに大きく影響されます。石油原料から精製・石油化学工程を経て得られるこれらの原料は、プロピレングリコール製造の主要な前駆体であるプロピレンの主要な供給源として機能します。酸化プロピレンは石油系プロピレングリコールの主原料であり、価格動態の変化は市場全体の価格に影響を及ぼします。石油原料の入手可能性とコストの変動は、プロピレングリコールの生産コストに直接影響します。石油価格の高騰や変動は、プロピレン原料の調達コストを上昇させ、その結果、プロピレングリコールの生産コストに上昇圧力を与えます。その結果、プロピレングリコール製造会社は、収益性と競争力を維持する上で困難に直面する可能性があります。
さらに、石油原料の入手可能性はプロピレンの供給に影響を与え、その結果、プロピレングリコールの生産能力および入手可能性に影響を与える可能性があります。石油業界における供給の途絶や制約は、プロピレンの不足につながり、プロピレングリコール製造会社が直面する課題をさらに悪化させる可能性があります。
マーケットリサーチレポートを購入する前に、どのような質問をするべきか?
- プロピレングリコール市場はどのように進化しているのか?
- プロピレングリコール市場を牽引し、抑制しているものは何か?
- 各プロピレングリコールサブマーケットセグメントは予測期間中にどのように成長し、2033年にこれらのサブマーケットが占める収益はどの程度になるのか?
- 2023年から2033年にかけて、各プロピレングリコールサブマーケットの市場シェアはどのように推移するのか?
- 2023年から2033年にかけて、市場全体の主な牽引役となるのは何か?
- 主要なプロピレングリコール市場はマクロ経済ダイナミクスに幅広く追随するのか、それとも個々の国別市場が他を凌駕するのか?
- 2033年までに各国市場のシェアはどのように変化し、2033年に市場をリードするのはどの地域か?
- 主要プレイヤーは誰で、予測期間中の見通しは?
- これらのリーディングカンパニーのプロピレングリコールプロジェクトは何か?
- 2023年から2033年の間に、業界はどのように進化していくのでしょうか?現在および今後10年間に実施されるプロピレングリコールプロジェクトには、どのような意味があるのでしょうか?
- プロピレングリコール市場をさらに拡大するために、製品の商業化の必要性は高まっているのか?
- プロピレングリコール市場の方向性と、市場の最前線に立つためにはどうすればよいか?
- 新製品やサービスラインに対する最適な投資オプションは何か?
- 企業を新たな成長軌道に乗せ、C-suiteに移行させるための重要な展望は何か?
このことが、現在、そして今後10年間のプロピレングリコール市場にどのような影響を与えるかを見極める必要があります:
- 366ページにわたる本レポートでは、144の表と240のチャート/グラフを独占的に提供します。
- 本レポートでは、業界における主要な収益性の高い分野を取り上げているため、今すぐその分野をターゲットにすることができます。
- 世界、地域、国の売上と成長を詳細に分析しています。
- 競合他社が成功した主要なトレンド、変化、収益予測をハイライトしています。
本レポートは、今後10年間のプロピレングリコール市場の動向と、COVID-19の景気後退と景気回復の変動に合わせて、今日のあなたに伝えます。この市場は、過去10年間のどの時点よりも今が重要である。
2033年までの予測やその他の分析により、商業的な展望を明らかにする。
- 2033年までの売上予測に加え、直近の実績、成長率、市場シェアも掲載しています。
- ビジネスの展望や展開など、独自の分析がご覧いただけます。
- 定性的分析(市場力学、促進要因、機会、阻害要因、課題など)、コスト構造、プロピレングリコール価格上昇の影響、最近の動向などをご覧いただけます。
本レポートでは、COVID-19が業界や貴社にどのような影響を与えるかについて、データ分析および貴重な知見を提供しています。COVID-19の4つの回収パターン、すなわち「V」「L」「W」「U」の回収パターンとその影響について考察しています。
報告書の対象セグメント
ソース
- 石油由来
- バイオ由来
グレード
- 工業用グレード
- 医薬グレード
用途
- 不飽和ポリエステル樹脂
- 塗料・コーティング
- 不凍液・機能性液体
- 液体洗浄剤
- 可塑剤
- 食品・飲料
- 医薬
- 化粧品・パーソナルケア
- その他
世界市場全体およびセグメントの収益予測に加え、5地域および16の主要国市場の収益予測も掲載しています:
北米
- アメリカ
- カナダ
欧州
- ドイツ
- 英国
- フランス
- イタリア
- スペイン
- ロシア
- その他の欧州地域
アジア太平洋地域
- 中国
- 日本
- インド
- 韓国
- オーストラリア
- その他のAPAC
ラテンアメリカ
- ブラジル
- メキシコ
- その他のラテンアメリカ
MEA
- GCC
- 南アフリカ
- その他のMEA
レポートには、プロピレングリコール市場の主要企業の一部について、2023年から2033年までのプロファイルと、これらの企業の事業のこのセグメントに焦点を当てたものも含まれています。
主要企業と市場成長の可能性
・ ADEKA Corporation
・ Archer Daniels Midland (ADM)
・ BASF SE
・ Dow Inc.
・ Global Bio-chem Technology Group Company Limited
・ Indorama Ventures Public Company Limited
・ Ineos Group Holdings S.A.
・ LyondellBasell Industries N.V.
・ Manali Petrochemicals Limited
・ Monument Chemical
・ Repsol S.A.
・ Sadara Chemical Company (Sadara)
・ Shell plc
・ SKC Co., Ltd.
プロピレングリコール市場の世界全体の収益、金額ベースで2023年から2033年まで、市場は2023年に50億2290万米ドルを突破すると、我々の仕事は計算されます。2033年まで収益が大きく伸びることが予測されます。当社の調査では、最も大きな可能性を秘めた企業を特定しています。彼らの能力、進歩、商業的な展望を発見し、あなたが一歩先を行くのを支援します。
プロピレングリコール市場、2023年から2033年までのレポートはどのように役立つのでしょうか?
まとめると、360ページ以上のレポートでは、以下のような知識を得ることができます:
- プロピレン・グリコール市場の2033年までの収益予測、ソース、グレード、アプリケーションの各予測を世界および地域レベルで掲載 - 業界の展望を発見し、投資や収益に最も有利な場所を見つけることができます。
- 5つの地域と16の主要国市場の2033年までの収益予測 - プロピレングリコール市場の2023年から2033年の市場予測を北米、ヨーロッパ、アジア太平洋、ラテンアメリカ、MEAでご覧いただけます。また、米国、カナダ、メキシコ、ブラジル、ドイツ、フランス、英国、イタリア、中国、インド、日本、オーストラリアなど、著名な経済圏の市場も予測しています。
- 既存企業および市場参入を目指す企業の展望 - プロピレングリコール市場に関わる主要企業14社の企業プロファイルを含む、2023年から2033年の市場。
独自の予測による定量・定性分析をご覧いただけます。私たちのレポートだけが持つ情報を入手し、貴重なビジネスインテリジェンスとして情報を得ることができます。
他にはない情報
私たちの新しいレポートがあれば、知識に遅れをとったり、チャンスを逃したりする可能性は低くなります。私たちの仕事があなたの調査、分析、意思決定にどのように役立つかをご覧ください。Visiongainの研究は、プロピレングリコール市場、2023年から2033年、市場をリードする企業のための商業分析を必要とするすべての人のためのものです。データ、トレンド、予測を見つけることができます。
ページTOPに戻る
目次
目次
1 レポートの概要
1.1 研究の目的
1.2 プロピレングリコール市場の紹介
1.3 本レポートが提供するもの
1.4 本レポートを読むべき理由
1.5 本分析レポートが回答する主な質問事項
1.6 本レポートは誰のためのものか?
1.7 方法論
1.7.1 市場の定義
1.7.2 市場評価・予測手法
1.7.3 データの検証
1.7.3.1 プライマリーリサーチ
1.7.3.2 セカンダリーリサーチ
1.8 よくある質問(FAQ)
1.9 関連するVisiongainのレポート
1.10 Visiongainについて
2 エグゼクティブサマリー
3 市場の概要
3.1 主要な調査結果
3.2 マーケットダイナミクス
3.2.1 市場促進要因
3.2.1.1 不飽和ポリエステル樹脂の需要増がプロピレングリコール市場の成長を促進する見込み
3.2.1.2 医薬品、食品・飲料業界からの需要拡大
3.2.1.3 APACおよび中東・アフリカにおける自動車産業の成長
3.2.1.4 APACおよび中東・アフリカにおける石油系プロピレングリコール需要の増加
3.2.2 市場抑制要因
3.2.2.1 政府の厳しい規制とプロピレングリコールに関連する健康への懸念
3.2.2.2 原材料の入手可能性・価格
3.2.2.3 代替品との厳しい競争
3.2.3 市場機会
3.2.3.1 バイオベースプロピレングリコールへの需要拡大
3.2.3.2 プロピレングリコールの新しいアプリケーションの開発
3.2.3.3 アンチフリーズおよびクーラント用途の需要拡大
3.3 COVID-19影響度分析
3.4 ポーターのファイブフォース分析
3.4.1 サプライヤーのバーゲニングパワー
3.4.2 バイヤーのバーゲニングパワー
3.4.3 競争力のあるライバル
3.4.4 代替品からの脅威
3.4.5 新規参入の脅威
3.5 PEST分析
4 プロピレングリコール市場分析:ソース別
4.1 主要な調査結果
4.2 ソースセグメント別 市場魅力度指数
4.3 ソース別プロピレングリコール市場規模推定と予測
4.4 石油由来プロピレン-グリコール
4.4.1 2023年~2033年、地域別市場規模(US$ Million)
4.4.2 地域別市場シェア、2023年・2033年(%)
4.5 バイオ由来プロピレングリコール
4.5.1 2023年~2033年、地域別市場規模(US$ Million)
4.5.2 地域別市場シェア、2023年・2033年(%)
5 プロピレングリコール市場分析:グレード別
5.1 主要な調査結果
5.2 グレードセグメント別の 市場魅力度指数
5.3 プロピレングリコールグレード別市場規模推定と予測
5.4 工業用グレードのプロピレングリコール
5.4.1 2023年~2033年、地域別市場規模(US$ Million)
5.4.2 地域別市場シェア、2023年・2033年(%)
5.5 医薬品グレードプロピレングリコール
5.5.1 2023年~2033年、地域別市場規模(US$ Million)
5.5.2 地域別市場シェア、2023年・2033年 (%)
6 プロピレングリコール市場分析:用途別
6.1 主要な調査結果
6.2 用途別セグメントの 市場魅力度指数
6.3 プロピレングリコール用途別市場規模推定と予測
6.4 不飽和ポリエステル樹脂
6.4.1 2023年~2033年、地域別市場規模(US$ Million)
6.4.2 地域別市場シェア、2023年・2033年(%)
6.5 塗料およびコーティング剤
6.5.1 2023年~2033年、地域別市場規模 (US$ Million)
6.5.2 地域別市場シェア、2023年・2033年(%)
6.6 アンチフリーズおよび機能性流体
6.6.1 2023年~2033年、地域別市場規模 (US$ Million)
6.6.2 地域別市場シェア、2023年・2033年 (%)
6.7 液体洗浄剤
6.7.1 2023年~2033年、地域別市場規模(US$ Million)
6.7.2 地域別市場シェア、2023年・2033年 (%)
6.8 可塑剤
6.8.1 2023年~2033年、地域別市場規模 (US$ Million)
6.8.2 地域別市場シェア、2023年・2033年(%)
6.9 食品・飲料
6.9.1 2023年~2033年、地域別市場規模 (US$ Million)
6.9.2 地域別市場シェア、2023年・2033年(%) (%)
6.10 医薬品
6.10.1 2023年~2033年、地域別市場規模 (US$ Million)
6.10.2 地域別市場シェア、2023年・2033年 (%)
6.11 化粧品・パーソナルケア
6.11.1 2023年~2033年、地域別市場規模(US$ Million)
6.11.2 地域別市場シェア、2023年・2033年(%)
6.12 その他
6.12.1 2023年~2033年、地域別市場規模(US$ Million)
6.12.2 地域別市場シェア、2023年・2033年(%)
7 プロピレングリコール市場分析:地域別
7.1 主要な調査結果
7.2 地域別市場規模の推定と予測
8 北米のプロピレングリコール市場分析
8.1 主要な調査結果
8.2 北米のプロピレングリコール市場魅力度指数
8.3 北米のプロピレングリコール国別市場、2023年、2028年、2033年(US$ Million、Kilo Tons)
8.4 北米のプロピレングリコール市場規模推定と予測:国別
8.5 北米のプロピレングリコール市場規模推定と予測:ソース別
8.6 北米のプロピレングリコール市場規模推定と予測:グレード別
8.7 北米のプロピレングリコール市場規模推定と予測:用途別
8.8 アメリカのプロピレングリコール市場分析
8.9 カナダのプロピレングリコール市場分析
9 欧州のプロピレングリコール市場分析
9.1 主要な調査結果
9.2 欧州のプロピレングリコール市場魅力度指数
9.3 欧州のプロピレングリコール国別市場、2023年、2028年、2033年(US$ Million、Kilo Tons)
9.4 欧州のプロピレングリコール市場規模推定と予測:国別
9.5 欧州のプロピレングリコール市場規模推定と予測:ソース別
9.6 欧州のプロピレングリコール市場規模推定と予測:グレード別
9.7 欧州のプロピレングリコール市場規模推定と予測:用途別
9.8 ドイツのプロピレングリコール市場分析
9.9 イギリスのプロピレングリコール市場分析
9.10 フランスのプロピレングリコール市場分析
9.11 イタリアのプロピレングリコール市場分析
9.12 スペインのプロピレングリコール市場分析
9.13 ロシアのプロピレングリコール市場分析
9.14 その他の欧州のプロピレングリコール市場分析
10 アジア太平洋地域のプロピレングリコール市場分析
10.1 主要な調査結果
10.2 アジア太平洋地域のプロピレングリコール市場魅力度指数
10.3 アジア太平洋地域のプロピレングリコール国別市場、2023年、2028年、2033年(US$ Million、Kilo Tons)
10.4 アジア太平洋地域のプロピレングリコール市場規模推定と予測:国別
10.5 アジア太平洋地域のプロピレングリコール市場規模推定と予測:ソース別
10.6 アジア太平洋地域のプロピレングリコール市場規模推定と予測:グレード別
10.7 アジア太平洋地域のプロピレングリコール市場規模推定と予測:用途別
10.8 中国のプロピレングリコール市場分析
10.9 日本のプロピレングリコール市場分析
10.10 インドのプロピレングリコール市場の分析
10.11 韓国のプロピレングリコールの市場分析
10.12 オーストラリアのプロピレングリコール市場の分析
10.13 その他のアジア太平洋地域のプロピレングリコール市場分析
11 ラテンアメリカのプロピレングリコール市場分析
11.1 主要な調査結果
11.2 ラテンアメリカのプロピレングリコール市場魅力度指数
11.3 ラテンアメリカのプロピレングリコール国別市場、2023年、2028年、2033年(US$ Million、Kilo Tons)
11.4 ラテンアメリカのプロピレングリコール市場規模推定と予測:国別
11.5 ラテンアメリカのプロピレングリコール市場規模推定と予測:ソース別
11.6 ラテンアメリカのプロピレングリコール市場規模推定と予測:グレード別
11.7 ラテンアメリカのプロピレングリコール市場規模推定と予測:用途別
11.8 メキシコのプロピレングリコール市場分析
11.9 ブラジルのプロピレングリコール市場分析
11.10 その他のラテンアメリカのプロピレングリコール市場の分析
12 中東・アフリカのプロピレングリコール市場分析
12.1 主要な調査結果
12.2 中東・アフリカのプロピレングリコール市場魅力度指数
12.3 中東・アフリカのプロピレングリコール国別市場、2023年、2028年、2033年(US$ Million、Kilo Tons)
12.4 中東・アフリカのプロピレングリコール市場規模推定と予測:国別
12.5 中東・アフリカのプロピレングリコール市場規模推定と予測:ソース別
12.6 中東・アフリカのプロピレングリコール市場規模推定と予測:グレード別
12.7 中東・アフリカのプロピレングリコール市場規模推定と予測:用途別
12.8 GCCプロピレングリコールの市場分析
12.9 南アフリカのプロピレングリコールの市場分析
12.10 その他の中東アフリカプロピレングリコール市場の分析
13 会社概要
13.1 競争環境、2022年
13.2 戦略的な展望
13.3 LyondellBasell Industries N.V.
13.3.1 企業スナップショット
13.3.2 会社概要
13.3.3 財務分析
13.3.3.1 純収益、2017年〜2022年
13.3.3.2 R&D、2017年〜2022年
13.3.3.3 地域別市場シェア、2022年
13.3.3.4 セグメント別市場シェア、2022年
13.3.4 製品のベンチマーキング
13.3.5 戦略的な展望
13.4 Dow Inc.
13.4.1 企業スナップショット
13.4.2 会社概要
13.4.3 財務分析
13.4.3.1 純収益、2018年〜2022年
13.4.3.2 R&D、2018年〜2022年
13.4.3.3 地域別市場シェア、2022年
13.4.3.4 セグメント別市場シェア、2022年
13.4.4 製品のベンチマーキング
13.4.5 戦略的な展望
13.5 Archer Daniels Midland (ADM)
13.5.1 企業スナップショット
13.5.2 会社概要
13.5.3 財務分析
13.5.3.1 純収益、2017年〜2022年
13.5.3.2 R&D、2017年〜2022年
13.5.3.3 地域別市場シェア、2022年
13.5.3.4 セグメント別市場シェア、2022年
13.5.4 製品のベンチマーキング
13.6 Indorama Ventures Public Company Limited
13.6.1 企業スナップショット
13.6.2 会社概要
13.6.3 財務分析
13.6.3.1 純収益、2017年〜2022年
13.6.3.2 r&d、2017年〜2022年
13.6.3.3 地域別市場シェア、2022年
13.6.3.4 セグメント別市場シェア、2022年
13.6.4 製品のベンチマーキング
13.7 Sadara Chemical Company (Sadara)
13.7.1 企業スナップショット
13.7.2 会社概要
13.7.3 プロダクト・ベンチマーク
13.7.4 戦略的展望
13.9 BASF SE
13.9.1 企業スナップショット
13.9.2 会社概要
13.9.3 財務分析
13.9.3.1 純収益、2017年〜2022年
13.9.3.2 R&D、2017年〜2022年
13.9.3.3 地域別市場シェア、2022年
13.9.3.4 セグメント別市場シェア、2022年
13.9.4 製品のベンチマーキング
13.9.5 戦略的な展望
13.10 Shell plc
13.10.1 企業スナップショット
13.10.2 会社概要
13.10.3 財務分析
13.10.3.1 純収益、2017年〜2022年
13.10.3.2 R&D、2017年〜2022年
13.10.3.3 地域別市場シェア、2022年
13.10.3.4 セグメント別市場シェア、2022年
13.10.4 製品ベンチマーキング
13.11 SKC Co., Ltd.
13.11.1 企業スナップショット
13.11.2 会社概要
13.11.3 財務分析
13.11.3.1 純収益、2019-2022年
13.11.3.2 セグメント別市場占有率、2022年
13.11.4 製品ベンチマーキング
13.12 INEOS Group Holdings S.A.
13.12.1 企業スナップショット
13.12.2 会社概要
13.12.3 財務分析
13.12.3.1 純収益、2017-2022年
13.12.3.2 R&D、2017年〜2022年
13.12.3.3 地域別市場シェア、2022年
13.12.3.4 セグメント別市場シェア、2022年
13.12.4 製品のベンチマーキング
13.12.5 戦略的な展望
13.13 Repsol S.A.
13.13.1 企業スナップショット
13.13.2 会社概要
13.13.3 財務分析
13.13.3.1 純収益、2020-2022年
13.13.3.2 R&D、2019-2022年
13.13.4 製品のベンチマーキング
13.13.5 戦略的な展望
13.14 ADEKA Corporation
13.14.1 企業スナップショット
13.14.2 会社概要
13.14.3 財務分析
13.14.3.1 純収益、2017年~2022年
13.14.3.2 R&D、2017年~2021年
13.14.3.3 地域別市場シェア、2021年
13.14.3.4 セグメント別市場シェア、2022年
13.14.4 製品のベンチマーキング
13.15 Manali Petrochemicals Limited
13.15.1 企業スナップショット
13.15.2 会社概要
13.15.3 財務分析
13.15.3.1 純収益、2017年〜2022年
13.15.3.2 R&D、2019年〜2022年
13.15.3.3 セグメント別市場シェア、2022年
13.15.4 製品のベンチマーキング
13.15.5 戦略的な展望
13.16 Monument Chemical
13.16.1 企業スナップショット
13.16.2 会社概要
13.16.3 製品ベンチマーク
13.17 Global Bio-chem Technology Group Company Limited
13.17.1 企業スナップショット
13.17.2 会社概要
13.17.3 財務分析
13.17.3.1 純収入、2017-2022年
13.17.3.2 R&D、2017年〜2022年
13.17.3.3 地域別市場シェア、2022年
13.17.3.4 セグメント別市場シェア、2022年
13.17.4 製品のベンチマーキング
14 結論と提言
14.1 Visiongainからの結びの言葉
14.2 市場関係者への提言
ページTOPに戻る
図表リスト
表の一覧
Table 1 Propylene Glycol Market Snapshot, 2023 & 2033 (US$ Million and Kilo Tons, CAGR %)
Table 2 Propylene Glycol Market Volume Forecast by Country, 2023-2033 (Kilo Tons, AGR%, CAGR%): “V” Shaped Recovery Scenario
Table 3 Propylene Glycol Market Volume Forecast by Country, 2023-2033 (Kilo Tons, AGR%, CAGR%): “U” Shaped Recovery Scenario
Table 4 Propylene Glycol Market Forecast by Country, 2023-2033 (Kilo Tons, AGR%, CAGR%): “W” Shaped Recovery Scenario
Table 5 Propylene Glycol Market Volume Forecast by Country, 2023-2033 (Kilo Tons, AGR%, CAGR%): “L” Shaped Recovery Scenario
Table 6 Propylene Glycol Market Revenue Forecast by Source, 2023-2033 (US$ Million, AGR%, CAGR%)
Table 7 Propylene Glycol Market Volume Forecast by Source, 2023-2033 (Kilo Tons, AGR%, CAGR%)
Table 8 Petroleum-derived Propylene Glycol Market Revenue Forecast by Geography, 2023-2033 (US$ Million, AGR%, CAGR%)
Table 9 Bio-derived Propylene Glycol Market Revenue Forecast by Geography, 2023-2033 (US$ Million, AGR%, CAGR%)
Table 10 Propylene Glycol Market Revenue Forecast by Grade, 2023-2033 (US$ Million, AGR%, CAGR%)
Table 11 Propylene Glycol Market Volume Forecast by Grade, 2023-2033 (Kilo Tons, AGR%, CAGR%)
Table 12 Industrial Grade Propylene Glycol Market Revenue Forecast by Geography, 2023-2033 (US$ Million, AGR%, CAGR%)
Table 13 Pharmaceutical Grade Propylene Glycol Market Revenue Forecast by Geography, 2023-2033 (US$ Million, AGR%, CAGR%)
Table 14 Propylene Glycol Market Revenue Forecast by Application, 2023-2033 (US$ Million, AGR%, CAGR%)
Table 15 Propylene Glycol Market Volume Forecast by Application, 2023-2033 (Kilo Tons, AGR%, CAGR%)
Table 16 Unsaturated Polyester Resin Propylene Glycol Market Revenue Forecast by Geography, 2023-2033 (US$ Million, AGR%, CAGR%)
Table 17 Paints and Coatings Propylene Glycol Market Revenue Forecast by Geography, 2023-2033 (US$ Million, AGR%, CAGR%)
Table 18 Antifreeze & Functional Fluids Propylene Glycol Market Revenue Forecast by Geography, 2023-2033 (US$ Million, AGR%, CAGR%)
Table 19 Liquid Detergents Propylene Glycol Market Revenue Forecast by Geography, 2023-2033 (US$ Million, AGR%, CAGR%)
Table 20 Plasticizers Propylene Glycol Market Revenue Forecast by Geography, 2023-2033 (US$ Million, AGR%, CAGR%)
Table 21 Food & Beverage Propylene Glycol Market Revenue Forecast by Geography, 2023-2033 (US$ Million, AGR%, CAGR%)
Table 22 Pharmaceuticals Propylene Glycol Market Revenue Forecast by Geography, 2023-2033 (US$ Million, AGR%, CAGR%)
Table 23 Cosmetics & Personal Care Propylene Glycol Market Revenue Forecast by Geography, 2023-2033 (US$ Million, AGR%, CAGR%)
Table 24 Other Applications Propylene Glycol Market Revenue Forecast by Geography, 2023-2033 (US$ Million, AGR%, CAGR%)
Table 25 Propylene Glycol Market Revenue Forecast by Geography, 2023-2033 (US$ Million, AGR%, CAGR%)
Table 26 Propylene Glycol Market Volume Forecast by Geography, 2023-2033 (Kilo Tons, AGR%, CAGR%)
Table 27 North America Propylene Glycol Market Revenue Forecast by Country, 2023-2033 (US$ Million, AGR%, CAGR%)
Table 28 North America Propylene Glycol Market Volume Forecast by Country, 2023-2033 (Kilo Tons, AGR%, CAGR%)
Table 29 North America Propylene Glycol Market Revenue Forecast by Source, 2023-2033 (US$ Million, AGR%, CAGR%)
Table 30 North America Propylene Glycol Market Volume Forecast by Source, 2023-2033 (Kilo Tons, AGR%, CAGR%)
Table 31 North America Propylene Glycol Market Revenue Forecast by Grade, 2023-2033 (US$ Million, AGR%, CAGR%)
Table 32 North America Propylene Glycol Market Volume Forecast by Grade, 2023-2033 (Kilo Tons, AGR%, CAGR%)
Table 33 North America Propylene Glycol Market Revenue Forecast by Application, 2023-2033 (US$ Million, AGR%, CAGR%)
Table 34 North America Propylene Glycol Market Volume Forecast by Application, 2023-2033 (Kilo Tons, AGR%, CAGR%)
Table 35 U.S. Propylene Glycol Market Revenue Forecast, 2023-2033 (US$ Million, AGR%, CAGR%)
Table 36 U.S. Propylene Glycol Market Volume Forecast, 2023-2033 (Kilo Tons, AGR%, CAGR%)
Table 37 Canada Propylene Glycol Market Revenue Forecast, 2023-2033 (US$ Million, AGR%, CAGR%)
Table 38 Canada Propylene Glycol Market Volume Forecast, 2023-2033 (Kilo Tons, AGR%, CAGR%)
Table 39 Europe Propylene Glycol Market Revenue Forecast by Country, 2023-2033 (US$ Million, AGR%, CAGR%)
Table 40 Europe Propylene Glycol Market Volume Forecast by Country, 2023-2033 (Kilo Tons, AGR%, CAGR%)
Table 41 Europe Propylene Glycol Market Revenue Forecast by Source, 2023-2033 (US$ Million, AGR%, CAGR%)
Table 42 Europe Propylene Glycol Market Volume Forecast by Source, 2023-2033 (Kilo Tons, AGR%, CAGR%)
Table 43 Europe Propylene Glycol Market Revenue Forecast by Grade, 2023-2033 (US$ Million, AGR%, CAGR%)
Table 44 Europe Propylene Glycol Market Volume Forecast by Grade, 2023-2033 (Kilo Tons, AGR%, CAGR%)
Table 45 Europe Propylene Glycol Market Revenue Forecast by Application, 2023-2033 (US$ Million, AGR%, CAGR%)
Table 46 Europe Propylene Glycol Market Volume Forecast by Application, 2023-2033 (Kilo Tons, AGR%, CAGR%)
Table 47 Germany Propylene Glycol Market Revenue Forecast, 2023-2033 (US$ Million, AGR%, CAGR%)
Table 48 Germany Propylene Glycol Market Volume Forecast, 2023-2033 (Kilo Tons, AGR%, CAGR%)
Table 49 UK Propylene Glycol Market Revenue Forecast, 2023-2033 (US$ Million, AGR%, CAGR%)
Table 50 UK Propylene Glycol Market Volume Forecast, 2023-2033 (Kilo Tons, AGR%, CAGR%)
Table 51 France Propylene Glycol Market Revenue Forecast, 2023-2033 (US$ Million, AGR%, CAGR%)
Table 52 France Propylene Glycol Market Volume Forecast, 2023-2033 (Kilo Tons, AGR%, CAGR%)
Table 53 Italy Propylene Glycol Market Revenue Forecast, 2023-2033 (US$ Million, AGR%, CAGR%)
Table 54 Italy Propylene Glycol Market Volume Forecast, 2023-2033 (Kilo Tons, AGR%, CAGR%)
Table 55 Spain Propylene Glycol Market Revenue Forecast, 2023-2033 (US$ Million, AGR%, CAGR%)
Table 56 Spain Propylene Glycol Market Volume Forecast, 2023-2033 (Kilo Tons, AGR%, CAGR%)
Table 57 Russia Propylene Glycol Market Revenue Forecast, 2023-2033 (US$ Million, AGR%, CAGR%)
Table 58 Russia Propylene Glycol Market Volume Forecast, 2023-2033 (Kilo Tons, AGR%, CAGR%)
Table 59 Rest of Europe Propylene Glycol Market Revenue Forecast, 2023-2033 (US$ Million, AGR%, CAGR%)
Table 60 Rest of Europe Propylene Glycol Market Volume Forecast, 2023-2033 (Kilo Tons, AGR%, CAGR%)
Table 61 Asia Pacific Propylene Glycol Market Revenue Forecast by Country, 2023-2033 (US$ Million, AGR%, CAGR%)
Table 62 Asia Pacific Propylene Glycol Market Volume Forecast by Country, 2023-2033 (Kilo Tons, AGR%, CAGR%)1
Table 63 Asia Pacific Propylene Glycol Market Revenue Forecast by Source, 2023-2033 (US$ Million, AGR%, CAGR%)
Table 64 Asia Pacific Propylene Glycol Market Volume Forecast by Source, 2023-2033 (Kilo Tons, AGR%, CAGR%)
Table 65 Asia Pacific Propylene Glycol Market Revenue Forecast by Grade, 2023-2033 (US$ Million, AGR%, CAGR%)
Table 66 Asia Pacific Propylene Glycol Market Volume Forecast by Grade, 2023-2033 (Kilo Tons, AGR%, CAGR%)
Table 67 Asia Pacific Propylene Glycol Market Revenue Forecast by Application, 2023-2033 (US$ Million, AGR%, CAGR%)
Table 68 Asia Pacific Propylene Glycol Market Volume Forecast by Application, 2023-2033 (Kilo Tons, AGR%, CAGR%)
Table 69 China Propylene Glycol Market Revenue Forecast, 2023-2033 (US$ Million, AGR%, CAGR%)
Table 70 China Propylene Glycol Market Volume Forecast, 2023-2033 (Kilo Tons, AGR%, CAGR%)
Table 71 Japan Propylene Glycol Market Revenue Forecast, 2023-2033 (US$ Million, AGR%, CAGR%)
Table 72 Japan Propylene Glycol Market Volume Forecast, 2023-2033 (Kilo Tons, AGR%, CAGR%)
Table 73 India Propylene Glycol Market Revenue Forecast, 2023-2033 (US$ Million, AGR%, CAGR%)
Table 74 India Propylene Glycol Market Volume Forecast, 2023-2033 (Kilo Tons, AGR%, CAGR%)
Table 75 South Korea Propylene Glycol Market Revenue Forecast, 2023-2033 (US$ Million, AGR%, CAGR%)
Table 76 South Korea Propylene Glycol Market Volume Forecast, 2023-2033 (Kilo Tons, AGR%, CAGR%)
Table 77 Australia Propylene Glycol Market Revenue Forecast, 2023-2033 (US$ Million, AGR%, CAGR%)
Table 78 Australia Propylene Glycol Market Volume Forecast, 2023-2033 (Kilo Tons, AGR%, CAGR%)
Table 79 Rest of APAC Propylene Glycol Market Revenue Forecast, 2023-2033 (US$ Million, AGR%, CAGR%)
Table 80 Rest of APAC Propylene Glycol Market Volume Forecast, 2023-2033 (Kilo Tons, AGR%, CAGR%)
Table 81 Latin America Propylene Glycol Market Revenue Forecast by Country, 2023-2033 (US$ Million, AGR%, CAGR%)
Table 82 Latin America Propylene Glycol Market Volume Forecast by Country, 2023-2033 (Kilo Tons, AGR%, CAGR%)
Table 83 Latin America Propylene Glycol Market Revenue Forecast by Source, 2023-2033 (US$ Million, AGR%, CAGR%)
Table 84 Latin America Propylene Glycol Market Volume Forecast by Source, 2023-2033 (Kilo Tons, AGR%, CAGR%)
Table 85 Latin America Propylene Glycol Market Revenue Forecast by Grade, 2023-2033 (US$ Million, AGR%, CAGR%)
Table 86 Latin America Propylene Glycol Market Volume Forecast by Grade, 2023-2033 (Kilo Tons, AGR%, CAGR%)
Table 87 Latin America Propylene Glycol Market Revenue Forecast by Application, 2023-2033 (US$ Million, AGR%, CAGR%)
Table 88 Latin America Propylene Glycol Market Volume Forecast by Application, 2023-2033 (Kilo Tons, AGR%, CAGR%)
Table 89 Mexico Propylene Glycol Market Revenue Forecast, 2023-2033 (US$ Million, AGR%, CAGR%)
Table 90 Mexico Propylene Glycol Market Volume Forecast, 2023-2033 (Kilo Tons, AGR%, CAGR%)
Table 91 Brazil Propylene Glycol Market Revenue Forecast, 2023-2033 (US$ Million, AGR%, CAGR%)
Table 92 Brazil Propylene Glycol Market Volume Forecast, 2023-2033 (Kilo Tons, AGR%, CAGR%)
Table 93 Rest of Latin America Propylene Glycol Market Revenue Forecast, 2023-2033 (US$ Million, AGR%, CAGR%)
Table 94 Rest of Latin America Propylene Glycol Market Volume Forecast, 2023-2033 (Kilo Tons, AGR%, CAGR%)
Table 95 Middle East & Africa Propylene Glycol Market Revenue Forecast by Country, 2023-2033 (US$ Million, AGR%, CAGR%)
Table 96 Middle East & Africa Propylene Glycol Market Volume Forecast by Country, 2023-2033 (Kilo Tons, AGR%, CAGR%)
Table 97 Middle East & Africa Propylene Glycol Market Revenue Forecast by Source, 2023-2033 (US$ Million, AGR%, CAGR%)
Table 98 Middle East & Africa Propylene Glycol Market Volume Forecast by Source, 2023-2033 (Kilo Tons, AGR%, CAGR%)
Table 99 Middle East & Africa Propylene Glycol Market Revenue Forecast by Grade, 2023-2033 (US$ Million, AGR%, CAGR%)
Table 100 Middle East & Africa Propylene Glycol Market Volume Forecast by Grade, 2023-2033 (Kilo Tons, AGR%, CAGR%)
Table 101 Middle East & Africa Propylene Glycol Market Revenue Forecast by Application, 2023-2033 (US$ Million, AGR%, CAGR%)
Table 102 Middle East & Africa Propylene Glycol Market Volume Forecast by Application, 2023-2033 (Kilo Tons, AGR%, CAGR%)
Table 103 GCC Propylene Glycol Market Revenue Forecast, 2023-2033 (US$ Million, AGR%, CAGR%)
Table 104 GCC Propylene Glycol Market Volume Forecast, 2023-2033 (Kilo Tons, AGR%, CAGR%)
Table 105 South Africa Propylene Glycol Market Revenue Forecast, 2023-2033 (US$ Million, AGR%, CAGR%)
Table 106 South Africa Propylene Glycol Market Volume Forecast, 2023-2033 (Kilo Tons, AGR%, CAGR%)
Table 107 Rest of Middle East & Africa Propylene Glycol Market Revenue Forecast, 2023-2033 (US$ Million, AGR%, CAGR%)
Table 108 Rest of Middle East & Africa Propylene Glycol Market Volume Forecast, 2023-2033 (Kilo Tons, AGR%, CAGR%)
Table 109 Strategic Outlook
Table 110 LyondellBasell Industries N.V.: Key Details, (CEO, HQ, Revenue, Founded, No. of Employees, Company Type, Website, Business Segment)
Table 111 LyondellBasell Industries N.V.: Product Benchmarking
Table 112 LyondellBasell Industries N.V.: Strategic Outlook
Table 113 Dow Inc.: Key Details, (CEO, HQ, Revenue, Founded, No. of Employees, Company Type, Website, Business Segment)
Table 114 Dow Inc.: Product Benchmarking
Table 115 Dow Inc.: Strategic Outlook
Table 116 Archer Daniels Midland (ADM): Key Details, (CEO, HQ, Revenue, Founded, No. of Employees, Company Type, Website, Business Segment)
Table 117 Archer Daniels Midland (ADM): Product Benchmarking
Table 118 Indorama Ventures Public Company Limited: Key Details, (CEO, HQ, Revenue, Founded, No. of Employees, Company Type, Website, Business Segment)
Table 119 Indorama Ventures Public Company Limited: Product Benchmarking
Table 120 Sadara Chemical Company (Sadara): Key Details, (CEO, HQ, Revenue, Founded, No. of Employees, Company Type, Website, Business Segment)
Table 121 Sadara Chemical Company (Sadara): Product Benchmarking
Table 122 Sadara Chemical Company (Sadara): Strategic Outlook
Table 123 BASF SE: Key Details, (CEO, HQ, Revenue, Founded, No. of Employees, Company Type, Website, Business Segment)
Table 124 BASF SE: Product Benchmarking
Table 125 BAS SE: Strategic Outlook
Table 126 Shell plc: Key Details, (CEO, HQ, Revenue, Founded, No. of Employees, Company Type, Website, Business Segment)
Table 127 Shell plc: Product Benchmarking
Table 128 SKC Co., Ltd.: Key Details, (CEO, HQ, Revenue, Founded, No. of Employees, Company Type, Website, Business Segment)
Table 129 SKC Co., Ltd.: Product Benchmarking
Table 130 INEOS Group Holdings S.A.: Key Details, (CEO, HQ, Revenue, Founded, No. of Employees, Company Type, Website, Business Segment)
Table 131 INEOS Group Holdings S.A.: Product Benchmarking
Table 132 INEOS Group Holdings S.A.: Strategic Outlook
Table 133 Repsol S.A.: Key Details, (CEO, HQ, Revenue, Founded, No. of Employees, Company Type, Website, Business Segment)
Table 134 Repsol S.A.: Product Benchmarking
Table 135 Repsol S.A.: Strategic Outlook
Table 136 ADEKA Corporation: Key Details, (CEO, HQ, Revenue, Founded, No. of Employees, Company Type, Website, Business Segment)
Table 137 ADEKA Corporation: Product Benchmarking
Table 138 Manali Petrochemicals Limited: Key Details, (CEO, HQ, Revenue, Founded, No. of Employees, Company Type, Website, Business Segment)
Table 139 Manali Petrochemicals Limited: Product Benchmarking
Table 140 Manali Petrochemicals Limited: Strategic Outlook
Table 141 Monument Chemical: Key Details, (CEO, HQ, Revenue, Founded, No. of Employees, Company Type, Website, Business Segment)
Table 142 Monument Chemical: Product Benchmarking
Table 143 Global Bio-chem Technology Group Company Limited: Key Details, (CEO, HQ, Revenue, Founded, No. of Employees, Company Type, Website, Business Segment)
Table 144 Global Bio-chem Technology Group Company Limited: Product Benchmarking
図の一覧
Figure 1 Propylene Glycol Market Segmentation
Figure 2 Propylene Glycol Market by Source: Market Attractiveness Index
Figure 3 Propylene Glycol Market by Grade: Market Attractiveness Index
Figure 4 Propylene Glycol Market by Application: Market Attractiveness Index
Figure 5 Propylene Glycol Market Attractiveness Index by Region
Figure 6 Propylene Glycol Market: Market Dynamics
Figure 7 Propylene Glycol Market Volume Forecast by Region, 2023-2033 (Kilo Tons, AGR%): “V” Shaped Recovery Scenario
Figure 8 Propylene Glycol Market Volume Forecast by Region, 2023-2033 (Kilo Tons, AGR%): “U” Shaped Recovery Scenario
Figure 9 Propylene Glycol Market Volume Forecast by Region, 2023-2033 (Kilo Tons, AGR%): “W” Shaped Recovery Scenario
Figure 10 Propylene Glycol Market Volume Forecast by Region, 2023-2033 (Kilo Tons, AGR%): “L” Shaped Recovery Scenario
Figure 11 Propylene Glycol Market: Porter’s Five Forces Analysis
Figure 12 Propylene Glycol Market: PEST Analysis
Figure 13 Propylene Glycol Market by Source: Market Attractiveness Index
Figure 14 Propylene Glycol Market Revenue Forecast by Source, 2023-2033 (US$ Million, AGR %)
Figure 15 Propylene Glycol Market Revenue Share Forecast by Source, 2023, 2028, 2033 (%)
Figure 16 Propylene Glycol Market Volume Forecast by Source, 2023-2033 (Kilo Tons, AGR %)
Figure 17 Propylene Glycol Market Volume Share Forecast by Source, 2023, 2028, 2033 (%)
Figure 18 Petroleum-derived Propylene Glycol Market Revenue Forecast by Geography, 2023-2033 (US$ Million, AGR %)
Figure 19 Petroleum-derived Propylene Glycol Market Revenue Share Forecast by Region, 2023 & 2033 (%)
Figure 20 Bio-derived Propylene Glycol Market Revenue Forecast by Geography, 2023-2033 (US$ Million, AGR %)
Figure 21 Bio-derived Propylene Glycol Market Revenue Share Forecast by Region, 2023 & 2033 (%)
Figure 22 Propylene Glycol Market by Grade: Market Attractiveness Index
Figure 23 Propylene Glycol Market Revenue Forecast by Grade, 2023-2033 (US$ Million, AGR %)
Figure 24 Propylene Glycol Market Revenue Share Forecast by Grade, 2023, 2028, 2033 (%)
Figure 25 Propylene Glycol Market Volume Forecast by Grade, 2023-2033 (Kilo Tons, AGR %)
Figure 26 Propylene Glycol Market Volume Share Forecast by Grade, 2023, 2028, 2033 (%)
Figure 27 Industrial Grade Propylene Glycol Market Revenue Forecast by Geography, 2023-2033 (US$ Million, AGR %)
Figure 28 Industrial Grade Propylene Glycol Market Revenue Share Forecast by Region, 2023 & 2033 (%)
Figure 29 Pharmaceutical Grade Propylene Glycol Market Revenue Forecast by Geography, 2023-2033 (US$ Million, AGR %)
Figure 30 Pharmaceutical Grade Propylene Glycol Market Revenue Share Forecast by Region, 2023 & 2033 (%)
Figure 31 Propylene Glycol Market by Application: Market Attractiveness Index
Figure 32 Propylene Glycol Market Revenue Forecast by Application, 2023-2033 (US$ Million, AGR %)
Figure 33 Propylene Glycol Market Revenue Share Forecast by Application, 2023, 2028, 2033 (%)
Figure 34 Propylene Glycol Market Volume Forecast by Application, 2023-2033 (Kilo Tons, AGR %)
Figure 35 Propylene Glycol Market Volume Share Forecast by Application, 2023, 2028, 2033 (%)
Figure 36 Unsaturated Polyester Resin Propylene Glycol Market Revenue Forecast by Geography, 2023-2033 (US$ Million, AGR %)
Figure 37 Unsaturated Polyester Resin Propylene Glycol Market Revenue Share Forecast by Region, 2023 & 2033 (%)
Figure 38 Paints and Coatings Propylene Glycol Market Revenue Forecast by Geography, 2023-2033 (US$ Million, AGR %)
Figure 39 Paints and Coatings Propylene Glycol Market Revenue Share Forecast by Region, 2023 & 2033 (%)
Figure 40 Antifreeze & Functional Fluids Propylene Glycol Market Revenue Forecast by Geography, 2023-2033 (US$ Million, AGR %)
Figure 41 Antifreeze & Functional Fluids Propylene Glycol Market Revenue Share Forecast by Region, 2023 & 2033 (%)
Figure 42 Liquid Detergents Propylene Glycol Market Revenue Forecast by Geography, 2023-2033 (US$ Million, AGR %)
Figure 43 Liquid Detergents Propylene Glycol Market Revenue Share Forecast by Region, 2023 & 2033 (%)
Figure 44 Plasticizers Propylene Glycol Market Revenue Forecast by Geography, 2023-2033 (US$ Million, AGR %)
Figure 45 Plasticizers Propylene Glycol Market Revenue Share Forecast by Region, 2023 & 2033 (%)
Figure 46 Food & Beverage Propylene Glycol Market Revenue Forecast by Geography, 2023-2033 (US$ Million, AGR %)
Figure 47 Food & Beverage Propylene Glycol Market Revenue Share Forecast by Region, 2023 & 2033 (%)
Figure 48 Pharmaceutical Propylene Glycol Market Revenue Forecast by Geography, 2023-2033 (US$ Million, AGR %)
Figure 49 Pharmaceutical Propylene Glycol Market Revenue Share Forecast by Region, 2023 & 2033 (%)
Figure 50 Cosmetics & Personal Care Propylene Glycol Market Revenue Forecast by Geography, 2023-2033 (US$ Million, AGR %)
Figure 51 Cosmetics & Personal Care Propylene Glycol Market Revenue Share Forecast by Region, 2023 & 2033 (%)
Figure 52 Other Applications Propylene Glycol Market Revenue Forecast by Geography, 2023-2033 (US$ Million, AGR %)
Figure 53 Other Applications Propylene Glycol Market Revenue Share Forecast by Region, 2023 & 2033 (%)
Figure 54 Propylene Glycol Market Revenue Forecast by Region 2023 and 2033 (US$ Million, CAGR%)
Figure 55 Propylene Glycol Market Volume Forecast by Region 2023 and 2033 (Kilo Tons, CAGR%)
Figure 56 Propylene Glycol Market Revenue Share Forecast by Region 2023, 2028, 2033 (%)
Figure 57 Propylene Glycol Market Volume Share Forecast by Region 2023, 2028, 2033 (%)
Figure 58 Propylene Glycol Market Revenue by Region, 2023-2033 (US$ Million, AGR %)
Figure 59 Propylene Glycol Market Volume by Region, 2023-2033 (Kilo Tons, AGR %)
Figure 60 North America Propylene Glycol Market Attractiveness Index
Figure 61 North America Propylene Glycol Market Revenue by Country, 2023, 2028 & 2033 (US$ Million)
Figure 62 North America Propylene Glycol Market Volume by Country, 2023, 2028 & 2033 (Kilo Tons)
Figure 63 North America Propylene Glycol Market Revenue Forecast by Country, 2023-2033 (US$ Million, AGR %)
Figure 64 North America Propylene Glycol Market Revenue Share Forecast by Country, 2023 & 2033 (%)
Figure 65 North America Propylene Glycol Market Volume Forecast by Country, 2023-2033 (Kilo Tons, AGR %)
Figure 66 North America Propylene Glycol Market Volume Share Forecast by Country, 2023 & 2033 (%)
Figure 67 North America Propylene Glycol Market Revenue Forecast by Source, 2023-2033 (US$ Million, AGR %)
Figure 68 North America Propylene Glycol Market Revenue Share Forecast by Source, 2023 & 2033 (%)
Figure 69 North America Propylene Glycol Market Volume Forecast by Source, 2023-2033 (Kilo Tons, AGR %)
Figure 70 North America Propylene Glycol Market Volume Share Forecast by Source, 2023 & 2033 (%)
Figure 71 North America Propylene Glycol Market Revenue Forecast by Grade, 2023-2033 (US$ Million, AGR %)
Figure 72 North America Propylene Glycol Market Revenue Share Forecast by Grade, 2023 & 2033 (%)
Figure 73 North America Propylene Glycol Market Volume Forecast by Grade, 2023-2033 (Kilo Tons, AGR %)
Figure 74 North America Propylene Glycol Market Volume Share Forecast by Grade, 2023 & 2033 (%)
Figure 75 North America Propylene Glycol Market Revenue Forecast by Application, 2023-2033 (US$ Million, AGR %)
Figure 76 North America Propylene Glycol Market Revenue Share Forecast by Application, 2023 & 2033 (%)
Figure 77 North America Propylene Glycol Market Volume Forecast by Application, 2023-2033 (Kilo Tons, AGR %)
Figure 78 North America Propylene Glycol Market Volume Share Forecast by Application, 2023 & 2033 (%)
Figure 79 U.S. Propylene Glycol Market Revenue Forecast, 2023-2033 (US$ Million, AGR %)
Figure 80 U.S. Propylene Glycol Market Volume Forecast, 2023-2033 (Kilo Tons, AGR %)
Figure 81 Canada Propylene Glycol Market Revenue Forecast, 2023-2033 (US$ Million, AGR %)
Figure 82 Canada Propylene Glycol Market Volume Forecast, 2023-2033 (Kilo Tons, AGR %)
Figure 83 Europe Propylene Glycol Market Attractiveness Index
Figure 84 Europe Propylene Glycol Market Revenue by Country, 2023, 2028 & 2033 (US$ Million)
Figure 85 Europe Propylene Glycol Market Volume by Country, 2023, 2028 & 2033 (Kilo Tons)
Figure 86 Europe Propylene Glycol Market Revenue Forecast by Country, 2023-2033 (US$ Million, AGR %)
Figure 87 Europe Propylene Glycol Market Revenue Share Forecast by Country, 2023 & 2033 (%)
Figure 88 Europe Propylene Glycol Market Volume Forecast by Country, 2023-2033 (Kilo Tons, AGR %)
Figure 89 Europe Propylene Glycol Market Volume Share Forecast by Country, 2023 & 2033 (%)
Figure 90 Europe Propylene Glycol Market Revenue Forecast by Source, 2023-2033 (US$ Million, AGR %)
Figure 91 Europe Propylene Glycol Market Revenue Share Forecast by Source, 2023 & 2033 (%)
Figure 92 Europe Propylene Glycol Market Volume Forecast by Source, 2023-2033 (Kilo Tons, AGR %)
Figure 93 Europe Propylene Glycol Market Volume Share Forecast by Source, 2023 & 2033 (%)
Figure 94 Europe Propylene Glycol Market Revenue Forecast by Grade, 2023-2033 (US$ Million, AGR %)
Figure 95 Europe Propylene Glycol Market Revenue Share Forecast by Grade, 2023 & 2033 (%)
Figure 96 Europe Propylene Glycol Market Volume Forecast by Grade, 2023-2033 (Kilo Tons, AGR %)
Figure 97 Europe Propylene Glycol Market Volume Share Forecast by Grade, 2023 & 2033 (%)
Figure 98 Europe Propylene Glycol Market Revenue Forecast by Application, 2023-2033 (US$ Million, AGR %)
Figure 99 Europe Propylene Glycol Market Revenue Share Forecast by Application, 2023 & 2033 (%)
Figure 100 Europe Propylene Glycol Market Volume Forecast by Application, 2023-2033 (Kilo Tons, AGR %)
Figure 101 Europe Propylene Glycol Market Volume Share Forecast by Application, 2023 & 2033 (%)
Figure 102 Germany Propylene Glycol Market Revenue Forecast, 2023-2033 (US$ Million, AGR %)
Figure 103 Germany Propylene Glycol Market Volume Forecast, 2023-2033 (Kilo Tons, AGR %)
Figure 104 UK Propylene Glycol Market Revenue Forecast, 2023-2033 (US$ Million, AGR %)
Figure 105 UK Propylene Glycol Market Volume Forecast, 2023-2033 (Kilo Tons, AGR %)
Figure 106 France Propylene Glycol Market Revenue Forecast, 2023-2033 (US$ Million, AGR %)
Figure 107 France Propylene Glycol Market Volume Forecast, 2023-2033 (Kilo Tons, AGR %)
Figure 108 Italy Propylene Glycol Market Revenue Forecast, 2023-2033 (US$ Million, AGR %)
Figure 109 Italy Propylene Glycol Market Volume Forecast, 2023-2033 (Kilo Tons, AGR %)
Figure 110 Spain Propylene Glycol Market Revenue Forecast, 2023-2033 (US$ Million, AGR %)
Figure 111 Spain Propylene Glycol Market Volume Forecast, 2023-2033 (Kilo Tons, AGR %)
Figure 112 Russia Propylene Glycol Market Revenue Forecast, 2023-2033 (US$ Million, AGR %)
Figure 113 Russia Propylene Glycol Market Volume Forecast, 2023-2033 (Kilo Tons, AGR %)
Figure 114 Rest of Europe Propylene Glycol Market Revenue Forecast, 2023-2033 (US$ Million, AGR %)
Figure 115 Rest of Europe Propylene Glycol Market Volume Forecast, 2023-2033 (Kilo Tons, AGR %)
Figure 116 Asia Pacific Propylene Glycol Market Attractiveness Index
Figure 117 Asia Pacific Propylene Glycol Market Revenue by Country, 2023, 2028 & 2033 (US$ Million)
Figure 118 Asia Pacific Propylene Glycol Market Volume by Country, 2023, 2028 & 2033 (Kilo Tons)
Figure 119 Asia Pacific Propylene Glycol Market Revenue Forecast by Country, 2023-2033 (US$ Million, AGR %)
Figure 120 Asia Pacific Propylene Glycol Market Revenue Share Forecast by Country, 2023 & 2033 (%)
Figure 121 Asia Pacific Propylene Glycol Market Volume Forecast by Country, 2023-2033 (Kilo Tons, AGR %)
Figure 122 Asia Pacific Propylene Glycol Market Volume Share Forecast by Country, 2023 & 2033 (%)
Figure 123 Asia Pacific Propylene Glycol Market Revenue Forecast by Source, 2023-2033 (US$ Million, AGR %)
Figure 124 Asia Pacific Propylene Glycol Market Revenue Share Forecast by Source, 2023 & 2033 (%)
Figure 125 Asia Pacific Propylene Glycol Market Volume Forecast by Source, 2023-2033 (Kilo Tons, AGR %)
Figure 126 Asia Pacific Propylene Glycol Market Volume Share Forecast by Source, 2023 & 2033 (%)
Figure 127 Asia Pacific Propylene Glycol Market Revenue Forecast by Grade, 2023-2033 (US$ Million, AGR %)
Figure 128 Asia Pacific Propylene Glycol Market Revenue Share Forecast by Grade, 2023 & 2033 (%)
Figure 129 Asia Pacific Propylene Glycol Market Volume Forecast by Grade, 2023-2033 (Kilo Tons, AGR %)
Figure 130 Asia Pacific Propylene Glycol Market Volume Share Forecast by Grade, 2023 & 2033 (%)
Figure 131 Asia Pacific Propylene Glycol Market Revenue Forecast by Application, 2023-2033 (US$ Million, AGR %)
Figure 132 Asia Pacific Propylene Glycol Market Revenue Share Forecast by Application, 2023 & 2033 (%)
Figure 133 Asia Pacific Propylene Glycol Market Volume Forecast by Application, 2023-2033 (Kilo Tons, AGR %)
Figure 134 Asia Pacific Propylene Glycol Market Volume Share Forecast by Application, 2023 & 2033 (%)
Figure 135 China Propylene Glycol Market Revenue Forecast, 2023-2033 (US$ Million, AGR %)
Figure 136 China Propylene Glycol Market Volume Forecast, 2023-2033 (Kilo Tons, AGR %)
Figure 137 Japan Propylene Glycol Market Revenue Forecast, 2023-2033 (US$ Million, AGR %)
Figure 138 Japan Propylene Glycol Market Volume Forecast, 2023-2033 (Kilo Tons, AGR %)
Figure 139 India Propylene Glycol Market Revenue Forecast, 2023-2033 (US$ Million, AGR %)
Figure 140 India Propylene Glycol Market Volume Forecast, 2023-2033 (Kilo Tons, AGR %)
Figure 141 South Korea Propylene Glycol Market Revenue Forecast, 2023-2033 (US$ Million, AGR %)
Figure 142 South Korea Propylene Glycol Market Volume Forecast, 2023-2033 (Kilo Tons, AGR %)
Figure 143 Australia Propylene Glycol Market Revenue Forecast, 2023-2033 (US$ Million, AGR %)
Figure 144 Australia Propylene Glycol Market Volume Forecast, 2023-2033 (Kilo Tons, AGR %)
Figure 145 Rest of APAC Propylene Glycol Market Revenue Forecast, 2023-2033 (US$ Million, AGR %)
Figure 146 Rest of APAC Propylene Glycol Market Volume Forecast, 2023-2033 (Kilo Tons, AGR %)
Figure 147 Latin America Propylene Glycol Market Attractiveness Index
Figure 148 Latin America Propylene Glycol Market Revenue by Region, 2023, 2028 & 2033 (US$ Million)
Figure 149 Latin America Propylene Glycol Market Volume by Region, 2023, 2028 & 2033 (Kilo Tons)
Figure 150 Latin America Propylene Glycol Market Revenue Forecast by Country, 2023-2033 (US$ Million, AGR %)
Figure 151 Latin America Propylene Glycol Market Revenue Share Forecast by Country, 2023 & 2033 (%)
Figure 152 Latin America Propylene Glycol Market Volume Forecast by Country, 2023-2033 (Kilo Tons, AGR %)
Figure 153 Latin America Propylene Glycol Market Volume Share Forecast by Country, 2023 & 2033 (%)
Figure 154 Latin America Propylene Glycol Market Revenue Forecast by Source, 2023-2033 (US$ Million, AGR %)
Figure 155 Latin America Propylene Glycol Market Revenue Share Forecast by Source, 2023 & 2033 (%)
Figure 156 Latin America Propylene Glycol Market Volume Forecast by Source, 2023-2033 (Kilo Tons, AGR %)
Figure 157 Latin America Propylene Glycol Market Volume Share Forecast by Source, 2023 & 2033 (%)
Figure 158 Latin America Propylene Glycol Market Revenue Forecast by Grade, 2023-2033 (US$ Million, AGR %)
Figure 159 Latin America Propylene Glycol Market Revenue Share Forecast by Grade, 2023 & 2033 (%)
Figure 160 Latin America Propylene Glycol Market Volume Forecast by Grade, 2023-2033 (Kilo Tons, AGR %)
Figure 161 Latin America Propylene Glycol Market Volume Share Forecast by Grade, 2023 & 2033 (%)
Figure 162 Latin America Propylene Glycol Market Revenue Forecast by Application, 2023-2033 (US$ Million, AGR %)
Figure 163 Latin America Propylene Glycol Market Revenue Share Forecast by Application, 2023 & 2033 (%)
Figure 164 Latin America Propylene Glycol Market Volume Forecast by Application, 2023-2033 (Kilo Tons, AGR %)
Figure 165 Latin America Propylene Glycol Market Volume Share Forecast by Application, 2023 & 2033 (%)
Figure 166 Mexico Propylene Glycol Market Revenue Forecast, 2023-2033 (US$ Million, AGR %)
Figure 167 Mexico Propylene Glycol Market Volume Forecast, 2023-2033 (Kilo Tons, AGR %)
Figure 168 Brazil Propylene Glycol Market Revenue Forecast, 2023-2033 (US$ Million, AGR %)
Figure 169 Brazil Propylene Glycol Market Volume Forecast, 2023-2033 (Kilo Tons, AGR %)
Figure 170 Rest of Latin America Propylene Glycol Market Revenue Forecast, 2023-2033 (US$ Million, AGR %)
Figure 171 Rest of Latin America Propylene Glycol Market Volume Forecast, 2023-2033 (Kilo Tons, AGR %)
Figure 172 Middle East & Africa Propylene Glycol Market Attractiveness Index
Figure 173 Middle East & Africa Propylene Glycol Market Revenue by Country, 2023, 2028 & 2033 (US$ Million)
Figure 174 Middle East & Africa Propylene Glycol Market Volume by Country, 2023, 2028 & 2033 (Kilo Tons)
Figure 175 Middle East & Africa Propylene Glycol Market Revenue Forecast by Country, 2023-2033 (US$ Million, AGR %)
Figure 176 Middle East & Africa Propylene Glycol Market Revenue Share Forecast by Country, 2023 & 2033 (%)
Figure 177 Middle East & Africa Propylene Glycol Market Volume Forecast by Country, 2023-2033 (Kilo Tons, AGR %)
Figure 178 Middle East & Africa Propylene Glycol Market Volume Share Forecast by Country, 2023 & 2033 (%)
Figure 179 Middle East & Africa Propylene Glycol Market Revenue Forecast by Source, 2023-2033 (US$ Million, AGR %)
Figure 180 Middle East & Africa Propylene Glycol Market Revenue Share Forecast by Source, 2023 & 2033 (%)
Figure 181 Middle East & Africa Propylene Glycol Market Volume Forecast by Source, 2023-2033 (Kilo Tons, AGR %)
Figure 182 Middle East & Africa Propylene Glycol Market Volume Share Forecast by Source, 2023 & 2033 (%)
Figure 183 Middle East & Africa Propylene Glycol Market Revenue Forecast by Grade, 2023-2033 (US$ Million, AGR %)
Figure 184 Middle East & Africa Propylene Glycol Market Revenue Share Forecast by Grade, 2023 & 2033 (%)
Figure 185 Middle East & Africa Propylene Glycol Market Volume Forecast by Grade, 2023-2033 (Kilo Tons, AGR %)
Figure 186 Middle East & Africa Propylene Glycol Market Volume Share Forecast by Grade, 2023 & 2033 (%)
Figure 187 Middle East & Africa Propylene Glycol Market Revenue Forecast by Application, 2023-2033 (US$ Million, AGR %)
Figure 188 Middle East & Africa Propylene Glycol Market Revenue Share Forecast by Application, 2023 & 2033 (%)
Figure 189 Middle East & Africa Propylene Glycol Market Volume Forecast by Application, 2023-2033 (Kilo Tons, AGR %)
Figure 190 Middle East & Africa Propylene Glycol Market Volume Share Forecast by Application, 2023 & 2033 (%)
Figure 191 GCC Propylene Glycol Market Revenue Forecast, 2023-2033 (US$ Million, AGR %)
Figure 192 GCC Propylene Glycol Market Volume Forecast, 2023-2033 (Kilo Tons, AGR %)
Figure 193 South Africa Propylene Glycol Market Revenue Forecast, 2023-2033 (US$ Million, AGR %)
Figure 194 South Africa Propylene Glycol Market Volume Forecast, 2023-2033 (Kilo Tons, AGR %)
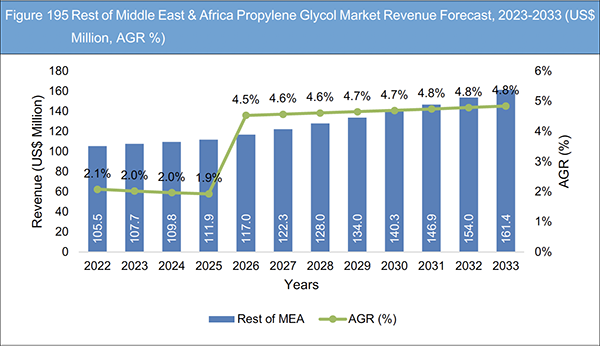
Figure 195 Rest of Middle East & Africa Propylene Glycol Market Revenue Forecast, 2023-2033 (US$ Million, AGR %)
Figure 196 Rest of Middle East & Africa Propylene Glycol Market Volume Forecast, 2023-2033 (Kilo Tons, AGR %)
Figure 197 Propylene Glycol Market: Company Share, 2022
Figure 198 LyondellBasell Industries N.V.: Net Revenue, 2017-2022 (US$ Million, AGR%)
Figure 199 LyondellBasell Industries N.V.: R&D, 2017-2022 (US$ Million, AGR%)
Figure 200 LyondellBasell Industries N.V.: Regional Market Shares, 2022
Figure 201 LyondellBasell Industries N.V.: Segmental Market Shares, 2022
Figure 202 Dow Inc.: Net Revenue, 2018-2022 (US$ Million, AGR%)
Figure 203 Dow Inc.: R&D, 2018-2022 (US$ Million, AGR%)
Figure 204 Dow Inc.: Regional Market Shares, 2022
Figure 205 Dow Inc.: Segmental Market Shares, 2022
Figure 206 Archer Daniels Midland (ADM): Net Revenue, 2017-2022 (US$ Million, AGR%)
Figure 207 Archer Daniels Midland (ADM): R&D, 2017-2022 (US$ Million, AGR%)
Figure 208 Archer Daniels Midland (ADM): Regional Market Shares, 2022
Figure 209 Archer Daniels Midland (ADM): Segmental Market Shares, 2022
Figure 210 Indorama Ventures Public Company Limited: Net Revenue, 2017-2022 (US$ Million, AGR%)
Figure 211 Indorama Ventures Public Company Limited: R&D, 2017-2022 (US$ Million, AGR%)
Figure 212 Indorama Ventures Public Company Limited: Regional Market Shares, 2022
Figure 213 Indorama Ventures Public Company Limited: Segmental Market Shares, 2022
Figure 214 BASF SE: Net Revenue, 2017-2022 (US$ Million, AGR%)
Figure 215 BASF SE: R&D, 2017-2022 (US$ Million, AGR%)
Figure 216 BASF SE: Regional Market Shares, 2022
Figure 217 BASF SE: Segmental Market Shares, 2022
Figure 218 Shell plc: Net Revenue, 2017-2022 (US$ Million, AGR%)
Figure 219 Shell plc: R&D, 2017-2022 (US$ Million, AGR%)
Figure 220 Shell plc: Regional Market Shares, 2022
Figure 221 Shell plc: Segmental Market Shares, 2022
Figure 222 SKC Co., Ltd.: Net Revenue, 2019-2022 (US$ Million, AGR%)
Figure 223 SKC Co., Ltd.: Segmental Market Shares, 2022
Figure 224 INEOS Group Holdings S.A.: Net Revenue, 2017-2022 (US$ Million, AGR%)
Figure 225 INEOS Group Holdings S.A.: R&D, 2017-2022 (US$ Million, AGR%)
Figure 226 INEOS Group Holdings S.A.: Regional Market Shares, 2022
Figure 227 INEOS Group Holdings S.A.: Segmental Market Shares, 2022
Figure 228 Repsol S.A.: Net Revenue, 2020-2022 (US$ Million, AGR%)
Figure 229 Repsol S.A.: R&D, 2019-2022 (US$ Million, AGR%)
Figure 230 ADEKA Corporation: Net Revenue, 2017-2022 (US$ Million, AGR%)
Figure 231 ADEKA Corporation: R&D, 2017-2021 (US$ Million, AGR%)
Figure 232 ADEKA Corporation: Regional Market Shares, 2021
Figure 233 ADEKA Corporation: Segmental Market Shares, 2022
Figure 234 Manali Petrochemicals Limited: Net Revenue, 2017-2022 (US$ Million, AGR%)
Figure 235 Manali Petrochemicals Limited: R&D, 2019-2022 (US$ Million, AGR%)
Figure 236 Manali Petrochemicals Limited: Segmental Market Shares, 2022
Figure 237 Global Bio-chem Technology Group Company Limited: Net Revenue, 2017-2022 (US$ Million, AGR%)
Figure 238 Global Bio-chem Technology Group Company Limited: R&D, 2017-2022 (US$ Million, AGR%)
Figure 239 Global Bio-chem Technology Group Company Limited: Regional Market Shares, 2022
Figure 240 Global Bio-chem Technology Group Company Limited: Segmental Market Shares, 2022
ページTOPに戻る
Summary
Report Details
The Propylene Glycol Market Report 2023-2033: This report will prove invaluable to leading firms striving for new revenue pockets if they wish to better understand the industry and its underlying dynamics. It will be useful for companies that would like to expand into different industries or to expand their existing operations in a new region.
Increasing Demand Unsaturated Polyester Resin is Expected to Fuel Propylene Glycol Market Growth
The propylene glycol market is anticipated to witness significant growth due to the growing demand for unsaturated polyester resin (UPR). UPR is a key end-use application of propylene glycol, predominantly used in the production of composite materials, such as fiberglass-reinforced plastics. The increasing adoption of UPR in various industries, including construction, automotive, marine, and electrical, is expected to fuel the demand for propylene glycol. Moreover, the automotive industry’s growing emphasis on lightweight materials and fuel efficiency is boosting the demand for UPR in the production of automotive parts, such as body panels, interior components, and structural reinforcements. Propylene glycol acts as a crucial component in UPR formulations, providing enhanced stability, viscosity control, and curing properties. As the automotive industry continues to witness technological advancements and increasing demand for lightweight materials, the propylene glycol market is expected to experience sustained growth.
Additionally, the marine and electrical industries are significant consumers of UPR, further driving the demand for propylene glycol. UPR-based composites find extensive applications in boat manufacturing, wind turbine blades, and electrical insulation, among others. The rising focus on renewable energy sources, such as wind power, is driving the demand for UPR-based materials, consequently bolstering the propylene glycol market.
Availability & Price of Raw Materials Hampering the Industry Growth
The price and profitability of propylene glycol producers are significantly influenced by the availability and cost of raw materials derived from petroleum. These raw materials, obtained from petroleum feedstocks through refining and petrochemical processes, serve as the primary source for propylene, the key precursor in propylene glycol production. The propylene oxide is the primary source of petroleum-based propylene glycol and changing price dynamics affects the overall market prices. Fluctuations in the availability and cost of petroleum feedstocks directly impact the production costs of propylene glycol. High or volatile petroleum prices increase the procurement costs of propylene feedstock, thereby exerting upward pressure on the production costs of propylene glycol. Consequently, propylene glycol producers may encounter challenges in maintaining profitability and competitiveness.
Additionally, the availability of petroleum feedstocks can affect the supply of propylene, thereby impacting the production capacity and availability of propylene glycol. Supply disruptions or constraints in the petroleum industry can lead to propylene shortages, further exacerbating the challenges faced by propylene glycol producers.
What Questions Should You Ask before Buying a Market Research Report?
• How is the propylene glycol market evolving?
• What is driving and restraining the propylene glycol market?
• How will each propylene glycol submarket segment grow over the forecast period and how much revenue will these submarkets account for in 2033?
• How will the market shares for each propylene glycol submarket develop from 2023 to 2033?
• What will be the main driver for the overall market from 2023 to 2033?
• Will leading propylene glycol markets broadly follow the macroeconomic dynamics, or will individual national markets outperform others?
• How will the market shares of the national markets change by 2033 and which geographical region will lead the market in 2033?
• Who are the leading players and what are their prospects over the forecast period?
• What are the propylene glycol projects for these leading companies?
• How will the industry evolve during the period between 2023 and 2033? What are the implications of propylene glycol projects taking place now and over the next 10 years?
• Is there a greater need for product commercialisation to further scale the propylene glycol market?
• Where is the propylene glycol market heading and how can you ensure you are at the forefront of the market?
• What are the best investment options for new product and service lines?
• What are the key prospects for moving companies into a new growth path and C-suite?
You need to discover how this will impact the propylene glycol market today, and over the next 10 years:
• Our 366-page report provides 144 tables and 240 charts/graphs exclusively to you.
• The report highlights key lucrative areas in the industry so you can target them – NOW.
• It contains in-depth analysis of global, regional and national sales and growth.
• It highlights for you the key successful trends, changes and revenue projections made by your competitors.
This report tells you TODAY how the propylene glycol market will develop in the next 10 years, and in line with the variations in COVID-19 economic recession and bounce. This market is more critical now than at any point over the last 10 years.
Forecasts to 2033 and other analyses reveal commercial prospects
• In addition to revenue forecasting to 2033, our new study provides you with recent results, growth rates, and market shares.
• You will find original analyses, with business outlooks and developments.
• Discover qualitative analyses (including market dynamics, drivers, opportunities, restraints and challenges), cost structure, impact of rising propylene glycol prices and recent developments.
This report includes data analysis and invaluable insight into how COVID-19 will affect the industry and your company. Four COVID-19 recovery patterns and their impact, namely, “V”, “L”, “W” and “U” are discussed in this report.
Segments Covered in the Report
Source
• Petroleum-derived
• Bio-derived
Grade
• Industrial Grade
• Pharmaceutical Grade
Application
• Unsaturated Polyester Resin
• Paints and Coatings
• Antifreeze & Functional Fluids
• Liquid Detergents
• Plasticizers
• Food & Beverage
• Pharmaceuticals
• Cosmetics & Personal Care
• Others
In addition to the revenue predictions for the overall world market and segments, you will also find revenue forecasts for five regional and 16 leading national markets:
North America
• U.S.
• Canada
Europe
• Germany
• UK
• France
• Italy
• Spain
• Russia
• Rest of Europe
Asia Pacific
• China
• Japan
• India
• South Korea
• Australia
• Rest of APAC
Latin America
• Brazil
• Mexico
• Rest of Latin America
MEA
• GCC
• South Africa
• Rest of MEA
The report also includes profiles and for some of the leading companies in the Propylene Glycol Market, 2023 to 2033, with a focus on this segment of these companies’ operations.
Leading companies and the potential for market growth
• ADEKA Corporation
• Archer Daniels Midland (ADM)
• BASF SE
• Dow Inc.
• Global Bio-chem Technology Group Company Limited
• Indorama Ventures Public Company Limited
• Ineos Group Holdings S.A.
• LyondellBasell Industries N.V.
• Manali Petrochemicals Limited
• Monument Chemical
• Repsol S.A.
• Sadara Chemical Company (Sadara)
• Shell plc
• SKC Co., Ltd.
Overall world revenue for Propylene Glycol Market, 2023 to 2033 in terms of value the market will surpass US$5,022.9 million in 2023, our work calculates. We predict strong revenue growth through to 2033. Our work identifies which organizations hold the greatest potential. Discover their capabilities, progress, and commercial prospects, helping you stay ahead.
How will the Propylene Glycol Market, 2023 to 2033 report help you?
In summary, our 360+ page report provides you with the following knowledge:
• Revenue forecasts to 2033 for Propylene Glycol Market, 2023 to 2033 Market, with forecasts for source, grade and application, each forecast at a global and regional level – discover the industry’s prospects, finding the most lucrative places for investments and revenues.
• Revenue forecasts to 2033 for five regional and 16 key national markets – See forecasts for the Propylene Glycol Market, 2023 to 2033 market in North America, Europe, Asia-Pacific, Latin America, and MEA. Also forecasted is the market in the US, Canada, Mexico, Brazil, Germany, France, UK, Italy, China, India, Japan, and Australia among other prominent economies.
• Prospects for established firms and those seeking to enter the market – including company profiles for 14 of the major companies involved in the Propylene Glycol Market, 2023 to 2033.
Find quantitative and qualitative analyses with independent predictions. Receive information that only our report contains, staying informed with invaluable business intelligence.
Information found nowhere else
With our new report, you are less likely to fall behind in knowledge or miss out on opportunities. See how our work could benefit your research, analyses, and decisions. Visiongain’s study is for everybody needing commercial analyses for the Propylene Glycol Market, 2023 to 2033, market-leading companies. You will find data, trends and predictions.
ページTOPに戻る
Table of Contents
Table of Contents
1 Report Overview
1.1 Objectives of the Study
1.2 Introduction to Propylene Glycol Market
1.3 What This Report Delivers
1.4 Why You Should Read This Report
1.5 Key Questions Answered by This Analytical Report
1.6 Who is This Report for?
1.7 Methodology
1.7.1 Market Definitions
1.7.2 Market Evaluation & Forecasting Methodology
1.7.3 Data Validation
1.7.3.1 Primary Research
1.7.3.2 Secondary Research
1.8 Frequently Asked Questions (FAQs)
1.9 Associated Visiongain Reports
1.10 About Visiongain
2 Executive Summary
3 Market Overview
3.1 Key Findings
3.2 Market Dynamics
3.2.1 Market Driving Factors
3.2.1.1 Increasing Demand Unsaturated Polyester Resin is Expected to Fuel Propylene Glycol Market Growth
3.2.1.2 Growing Demand from Pharmaceutical and Food & Beverage Industry
3.2.1.3 Rising Automotive Industry in APAC and the Middle East & Africa
3.2.1.4 Growing Demand for Petroleum-based Propylene Glycol in APAC & the Middle East & Africa
3.2.2 Market Restraining Factors
3.2.2.1 Strict Government Regulations and the Health Concerns Related to Propylene Glycol
3.2.2.2 The Availability & Price of Raw Materials
3.2.2.3 Tough Competition from the Substitutes
3.2.3 Market Opportunities
3.2.3.1 Growing Demand for Bio-based Propylene Glycol
3.2.3.2 Development of New Applications for Propylene Glycol
3.2.3.3 Growing Demand for Antifreeze and Coolant Applications
3.3 COVID-19 Impact Analysis
3.4 Porter’s Five Forces Analysis
3.4.1 Bargaining Power of Suppliers
3.4.2 Bargaining Power of Buyers
3.4.3 Competitive Rivalry
3.4.4 Threat from Substitutes
3.4.5 Threat of New Entrants
3.5 PEST Analysis
4 Propylene Glycol Market Analysis by Source
4.1 Key Findings
4.2 Source Segment: Market Attractiveness Index
4.3 Propylene Glycol Market Size Estimation and Forecast by Source
4.4 Petroleum-derived Propylene Glycol
4.4.1 Market Size by Region, 2023-2033 (US$ Million)
4.4.2 Market Share by Region, 2023 & 2033 (%)
4.5 Bio-derived Propylene Glycol
4.5.1 Market Size by Region, 2023-2033 (US$ Million)
4.5.2 Market Share by Region, 2023 & 2033 (%)
5 Propylene Glycol Market Analysis by Grade
5.1 Key Findings
5.2 Grade Segment: Market Attractiveness Index
5.3 Propylene Glycol Market Size Estimation and Forecast by Grade
5.4 Industrial Grade Propylene Glycol
5.4.1 Market Size by Region, 2023-2033 (US$ Million)
5.4.2 Market Share by Region, 2023 & 2033 (%)
5.5 Pharmaceutical Grade Propylene Glycol
5.5.1 Market Size by Region, 2023-2033 (US$ Million)
5.5.2 Market Share by Region, 2023 & 2033 (%)
6 Propylene Glycol Market Analysis by Application
6.1 Key Findings
6.2 Application Segment: Market Attractiveness Index
6.3 Propylene Glycol Market Size Estimation and Forecast by Application
6.4 Unsaturated Polyester Resin
6.4.1 Market Size by Region, 2023-2033 (US$ Million)
6.4.2 Market Share by Region, 2023 & 2033 (%)
6.5 Paints and Coatings
6.5.1 Market Size by Region, 2023-2033 (US$ Million)
6.5.2 Market Share by Region, 2023 & 2033 (%)
6.6 Antifreeze & Functional Fluids
6.6.1 Market Size by Region, 2023-2033 (US$ Million)
6.6.2 Market Share by Region, 2023 & 2033 (%)
6.7 Liquid Detergents
6.7.1 Market Size by Region, 2023-2033 (US$ Million)
6.7.2 Market Share by Region, 2023 & 2033 (%)
6.8 Plasticizers
6.8.1 Market Size by Region, 2023-2033 (US$ Million)
6.8.2 Market Share by Region, 2023 & 2033 (%)
6.9 Food & Beverage
6.9.1 Market Size by Region, 2023-2033 (US$ Million)
6.9.2 Market Share by Region, 2023 & 2033 (%)
6.10 Pharmaceuticals
6.10.1 Market Size by Region, 2023-2033 (US$ Million)
6.10.2 Market Share by Region, 2023 & 2033 (%)
6.11 Cosmetics & Personal Care
6.11.1 Market Size by Region, 2023-2033 (US$ Million)
6.11.2 Market Share by Region, 2023 & 2033 (%)
6.12 Others
6.12.1 Market Size by Region, 2023-2033 (US$ Million)
6.12.2 Market Share by Region, 2023 & 2033 (%)
7 Propylene Glycol Market Analysis by Region
7.1 Key Findings
7.2 Regional Market Size Estimation and Forecast
8 North America Propylene Glycol Market Analysis
8.1 Key Findings
8.2 North America Propylene Glycol Market Attractiveness Index
8.3 North America Propylene Glycol Market by Country, 2023, 2028 & 2033 (US$ Million and Kilo Tons)
8.4 North America Propylene Glycol Market Size Estimation and Forecast by Country
8.5 North America Propylene Glycol Market Size Estimation and Forecast by Source
8.6 North America Propylene Glycol Market Size Estimation and Forecast by Grade
8.7 North America Propylene Glycol Market Size Estimation and Forecast by Application
8.8 U.S. Propylene Glycol Market Analysis
8.9 Canada Propylene Glycol Market Analysis
9 Europe Propylene Glycol Market Analysis
9.1 Key Findings
9.2 Europe Propylene Glycol Market Attractiveness Index
9.3 Europe Propylene Glycol Market by Country, 2023, 2028 & 2033 (US$ Million and Kilo Tons)
9.4 Europe Propylene Glycol Market Size Estimation and Forecast by Country
9.5 Europe Propylene Glycol Market Size Estimation and Forecast by Source
9.6 Europe Propylene Glycol Market Size Estimation and Forecast by Grade
9.7 Europe Propylene Glycol Market Size Estimation and Forecast by Application
9.8 Germany Propylene Glycol Market Analysis
9.9 UK Propylene Glycol Market Analysis
9.10 France Propylene Glycol Market Analysis
9.11 Italy Propylene Glycol Market Analysis
9.12 Spain Propylene Glycol Market Analysis
9.13 Russia Propylene Glycol Market Analysis
9.14 Rest of Europe Propylene Glycol Market Analysis
10 Asia Pacific Propylene Glycol Market Analysis
10.1 Key Findings
10.2 Asia Pacific Propylene Glycol Market Attractiveness Index
10.3 Asia Pacific Propylene Glycol Market by Country, 2023, 2028 & 2033 (US$ Million and Kilo Tons)
10.4 Asia Pacific Propylene Glycol Market Size Estimation and Forecast by Country
10.5 Asia Pacific Propylene Glycol Market Size Estimation and Forecast by Source
10.6 Asia Pacific Propylene Glycol Market Size Estimation and Forecast by Grade
10.7 Asia Pacific Propylene Glycol Market Size Estimation and Forecast by Application
10.8 China Propylene Glycol Market Analysis
10.9 Japan Propylene Glycol Market Analysis
10.10 India Propylene Glycol Market Analysis
10.11 South Korea Propylene Glycol Market Analysis
10.12 Australia Propylene Glycol Market Analysis
10.13 Rest of Asia Pacific Propylene Glycol Market Analysis
11 Latin America Propylene Glycol Market Analysis
11.1 Key Findings
11.2 Latin America Propylene Glycol Market Attractiveness Index
11.3 Latin America Propylene Glycol Market by Country, 2023, 2028 & 2033 (US$ Million and Kilo Tons)
11.4 Latin America Propylene Glycol Market Size Estimation and Forecast by Country
11.5 Latin America Propylene Glycol Market Size Estimation and Forecast by Source
11.6 Latin America Propylene Glycol Market Size Estimation and Forecast by Grade
11.7 Latin America Propylene Glycol Market Size Estimation and Forecast by Application
11.8 Mexico Propylene Glycol Market Analysis
11.9 Brazil Propylene Glycol Market Analysis
11.10 Rest of Latin America Propylene Glycol Market Analysis
12 Middle East & Africa Propylene Glycol Market Analysis
12.1 Key Findings
12.2 Middle East & Africa Propylene Glycol Market Attractiveness Index
12.3 Middle East & Africa Propylene Glycol Market by Country, 2023, 2028 & 2033 (US$ Million and Kilo Tons)
12.4 Middle East & Africa Propylene Glycol Market Size Estimation and Forecast by Country
12.5 Middle East & Africa Propylene Glycol Market Size Estimation and Forecast by Source
12.6 Middle East & Africa Propylene Glycol Market Size Estimation and Forecast by Grade
12.7 Middle East & Africa Propylene Glycol Market Size Estimation and Forecast by Application
12.8 GCC Propylene Glycol Market Analysis
12.9 South Africa Propylene Glycol Market Analysis
12.10 Rest of Middle East & Africa Propylene Glycol Market Analysis
13 Company Profiles
13.1 Competitive Landscape, 2022
13.2 Strategic Outlook
13.3 LyondellBasell Industries N.V.
13.3.1 Company Snapshot
13.3.2 Company Overview
13.3.3 Financial Analysis
13.3.3.1 Net Revenue, 2017-2022
13.3.3.2 R&D, 2017-2022
13.3.3.3 Regional Market Shares, 2022
13.3.3.4 Segmental Market Shares, 2022
13.3.4 Product Benchmarking
13.3.5 Strategic Outlook
13.4 Dow Inc.
13.4.1 Company Snapshot
13.4.2 Company Overview
13.4.3 Financial Analysis
13.4.3.1 Net Revenue, 2018-2022
13.4.3.2 R&D, 2018-2022
13.4.3.3 Regional Market Shares, 2022
13.4.3.4 Segmental Market Shares, 2022
13.4.4 Product Benchmarking
13.4.5 Strategic Outlook
13.5 Archer Daniels Midland (ADM)
13.5.1 Company Snapshot
13.5.2 Company Overview
13.5.3 Financial Analysis
13.5.3.1 Net Revenue, 2017-2022
13.5.3.2 R&D, 2017-2022
13.5.3.3 Regional Market Shares, 2022
13.5.3.4 Segmental Market Shares, 2022
13.5.4 Product Benchmarking
13.6 Indorama Ventures Public Company Limited
13.6.1 Company Snapshot
13.6.2 Company Overview
13.6.3 Financial Analysis
13.6.3.1 Net Revenue, 2017-2022
13.6.3.2 R&D, 2017-2022
13.6.3.3 Regional Market Shares, 2022
13.6.3.4 Segmental Market Shares, 2022
13.6.4 Product Benchmarking
13.7 Sadara Chemical Company (Sadara)
13.7.1 Company Snapshot
13.7.2 Company Overview
13.7.3 Product Benchmarking
13.7.4 Strategic Outlook
13.9 BASF SE
13.9.1 Company Snapshot
13.9.2 Company Overview
13.9.3 Financial Analysis
13.9.3.1 Net Revenue, 2017-2022
13.9.3.2 R&D, 2017-2022
13.9.3.3 Regional Market Shares, 2022
13.9.3.4 Segmental Market Shares, 2022
13.9.4 Product Benchmarking
13.9.5 Strategic Outlook
13.10 Shell plc
13.10.1 Company Snapshot
13.10.2 Company Overview
13.10.3 Financial Analysis
13.10.3.1 Net Revenue, 2017-2022
13.10.3.2 R&D, 2017-2022
13.10.3.3 Regional Market Shares, 2022
13.10.3.4 Segmental Market Shares, 2022
13.10.4 Product Benchmarking
13.11 SKC Co., Ltd.
13.11.1 Company Snapshot
13.11.2 Company Overview
13.11.3 Financial Analysis
13.11.3.1 Net Revenue, 2019-2022
13.11.3.2 Segmental Market Shares, 2022
13.11.4 Product Benchmarking
13.12 INEOS Group Holdings S.A.
13.12.1 Company Snapshot
13.12.2 Company Overview
13.12.3 Financial Analysis
13.12.3.1 Net Revenue, 2017-2022
13.12.3.2 R&D, 2017-2022
13.12.3.3 Regional Market Shares, 2022
13.12.3.4 Segmental Market Shares, 2022
13.12.4 Product Benchmarking
13.12.5 Strategic Outlook
13.13 Repsol S.A.
13.13.1 Company Snapshot
13.13.2 Company Overview
13.13.3 Financial Analysis
13.13.3.1 Net Revenue, 2020-2022
13.13.3.2 R&D, 2019-2022
13.13.4 Product Benchmarking
13.13.5 Strategic Outlook
13.14 ADEKA Corporation
13.14.1 Company Snapshot
13.14.2 Company Overview
13.14.3 Financial Analysis
13.14.3.1 Net Revenue, 2017-2022
13.14.3.2 R&D, 2017-2021
13.14.3.3 Regional Market Shares, 2021
13.14.3.4 Segmental Market Shares, 2022
13.14.4 Product Benchmarking
13.15 Manali Petrochemicals Limited
13.15.1 Company Snapshot
13.15.2 Company Overview
13.15.3 Financial Analysis
13.15.3.1 Net Revenue, 2017-2022
13.15.3.2 R&D, 2019-2022
13.15.3.3 Segmental Market Shares, 2022
13.15.4 Product Benchmarking
13.15.5 Strategic Outlook
13.16 Monument Chemical
13.16.1 Company Snapshot
13.16.2 Company Overview
13.16.3 Product Benchmarking
13.17 Global Bio-chem Technology Group Company Limited
13.17.1 Company Snapshot
13.17.2 Company Overview
13.17.3 Financial Analysis
13.17.3.1 Net Revenue, 2017-2022
13.17.3.2 R&D, 2017-2022
13.17.3.3 Regional Market Shares, 2022
13.17.3.4 Segmental Market Shares, 2022
13.17.4 Product Benchmarking
14 Conclusion and Recommendations
14.1 Concluding Remarks from Visiongain
14.2 Recommendations for Market Players
ページTOPに戻る
List of Tables/Graphs
List of Tables
Table 1 Propylene Glycol Market Snapshot, 2023 & 2033 (US$ Million and Kilo Tons, CAGR %)
Table 2 Propylene Glycol Market Volume Forecast by Country, 2023-2033 (Kilo Tons, AGR%, CAGR%): “V” Shaped Recovery Scenario
Table 3 Propylene Glycol Market Volume Forecast by Country, 2023-2033 (Kilo Tons, AGR%, CAGR%): “U” Shaped Recovery Scenario
Table 4 Propylene Glycol Market Forecast by Country, 2023-2033 (Kilo Tons, AGR%, CAGR%): “W” Shaped Recovery Scenario
Table 5 Propylene Glycol Market Volume Forecast by Country, 2023-2033 (Kilo Tons, AGR%, CAGR%): “L” Shaped Recovery Scenario
Table 6 Propylene Glycol Market Revenue Forecast by Source, 2023-2033 (US$ Million, AGR%, CAGR%)
Table 7 Propylene Glycol Market Volume Forecast by Source, 2023-2033 (Kilo Tons, AGR%, CAGR%)
Table 8 Petroleum-derived Propylene Glycol Market Revenue Forecast by Geography, 2023-2033 (US$ Million, AGR%, CAGR%)
Table 9 Bio-derived Propylene Glycol Market Revenue Forecast by Geography, 2023-2033 (US$ Million, AGR%, CAGR%)
Table 10 Propylene Glycol Market Revenue Forecast by Grade, 2023-2033 (US$ Million, AGR%, CAGR%)
Table 11 Propylene Glycol Market Volume Forecast by Grade, 2023-2033 (Kilo Tons, AGR%, CAGR%)
Table 12 Industrial Grade Propylene Glycol Market Revenue Forecast by Geography, 2023-2033 (US$ Million, AGR%, CAGR%)
Table 13 Pharmaceutical Grade Propylene Glycol Market Revenue Forecast by Geography, 2023-2033 (US$ Million, AGR%, CAGR%)
Table 14 Propylene Glycol Market Revenue Forecast by Application, 2023-2033 (US$ Million, AGR%, CAGR%)
Table 15 Propylene Glycol Market Volume Forecast by Application, 2023-2033 (Kilo Tons, AGR%, CAGR%)
Table 16 Unsaturated Polyester Resin Propylene Glycol Market Revenue Forecast by Geography, 2023-2033 (US$ Million, AGR%, CAGR%)
Table 17 Paints and Coatings Propylene Glycol Market Revenue Forecast by Geography, 2023-2033 (US$ Million, AGR%, CAGR%)
Table 18 Antifreeze & Functional Fluids Propylene Glycol Market Revenue Forecast by Geography, 2023-2033 (US$ Million, AGR%, CAGR%)
Table 19 Liquid Detergents Propylene Glycol Market Revenue Forecast by Geography, 2023-2033 (US$ Million, AGR%, CAGR%)
Table 20 Plasticizers Propylene Glycol Market Revenue Forecast by Geography, 2023-2033 (US$ Million, AGR%, CAGR%)
Table 21 Food & Beverage Propylene Glycol Market Revenue Forecast by Geography, 2023-2033 (US$ Million, AGR%, CAGR%)
Table 22 Pharmaceuticals Propylene Glycol Market Revenue Forecast by Geography, 2023-2033 (US$ Million, AGR%, CAGR%)
Table 23 Cosmetics & Personal Care Propylene Glycol Market Revenue Forecast by Geography, 2023-2033 (US$ Million, AGR%, CAGR%)
Table 24 Other Applications Propylene Glycol Market Revenue Forecast by Geography, 2023-2033 (US$ Million, AGR%, CAGR%)
Table 25 Propylene Glycol Market Revenue Forecast by Geography, 2023-2033 (US$ Million, AGR%, CAGR%)
Table 26 Propylene Glycol Market Volume Forecast by Geography, 2023-2033 (Kilo Tons, AGR%, CAGR%)
Table 27 North America Propylene Glycol Market Revenue Forecast by Country, 2023-2033 (US$ Million, AGR%, CAGR%)
Table 28 North America Propylene Glycol Market Volume Forecast by Country, 2023-2033 (Kilo Tons, AGR%, CAGR%)
Table 29 North America Propylene Glycol Market Revenue Forecast by Source, 2023-2033 (US$ Million, AGR%, CAGR%)
Table 30 North America Propylene Glycol Market Volume Forecast by Source, 2023-2033 (Kilo Tons, AGR%, CAGR%)
Table 31 North America Propylene Glycol Market Revenue Forecast by Grade, 2023-2033 (US$ Million, AGR%, CAGR%)
Table 32 North America Propylene Glycol Market Volume Forecast by Grade, 2023-2033 (Kilo Tons, AGR%, CAGR%)
Table 33 North America Propylene Glycol Market Revenue Forecast by Application, 2023-2033 (US$ Million, AGR%, CAGR%)
Table 34 North America Propylene Glycol Market Volume Forecast by Application, 2023-2033 (Kilo Tons, AGR%, CAGR%)
Table 35 U.S. Propylene Glycol Market Revenue Forecast, 2023-2033 (US$ Million, AGR%, CAGR%)
Table 36 U.S. Propylene Glycol Market Volume Forecast, 2023-2033 (Kilo Tons, AGR%, CAGR%)
Table 37 Canada Propylene Glycol Market Revenue Forecast, 2023-2033 (US$ Million, AGR%, CAGR%)
Table 38 Canada Propylene Glycol Market Volume Forecast, 2023-2033 (Kilo Tons, AGR%, CAGR%)
Table 39 Europe Propylene Glycol Market Revenue Forecast by Country, 2023-2033 (US$ Million, AGR%, CAGR%)
Table 40 Europe Propylene Glycol Market Volume Forecast by Country, 2023-2033 (Kilo Tons, AGR%, CAGR%)
Table 41 Europe Propylene Glycol Market Revenue Forecast by Source, 2023-2033 (US$ Million, AGR%, CAGR%)
Table 42 Europe Propylene Glycol Market Volume Forecast by Source, 2023-2033 (Kilo Tons, AGR%, CAGR%)
Table 43 Europe Propylene Glycol Market Revenue Forecast by Grade, 2023-2033 (US$ Million, AGR%, CAGR%)
Table 44 Europe Propylene Glycol Market Volume Forecast by Grade, 2023-2033 (Kilo Tons, AGR%, CAGR%)
Table 45 Europe Propylene Glycol Market Revenue Forecast by Application, 2023-2033 (US$ Million, AGR%, CAGR%)
Table 46 Europe Propylene Glycol Market Volume Forecast by Application, 2023-2033 (Kilo Tons, AGR%, CAGR%)
Table 47 Germany Propylene Glycol Market Revenue Forecast, 2023-2033 (US$ Million, AGR%, CAGR%)
Table 48 Germany Propylene Glycol Market Volume Forecast, 2023-2033 (Kilo Tons, AGR%, CAGR%)
Table 49 UK Propylene Glycol Market Revenue Forecast, 2023-2033 (US$ Million, AGR%, CAGR%)
Table 50 UK Propylene Glycol Market Volume Forecast, 2023-2033 (Kilo Tons, AGR%, CAGR%)
Table 51 France Propylene Glycol Market Revenue Forecast, 2023-2033 (US$ Million, AGR%, CAGR%)
Table 52 France Propylene Glycol Market Volume Forecast, 2023-2033 (Kilo Tons, AGR%, CAGR%)
Table 53 Italy Propylene Glycol Market Revenue Forecast, 2023-2033 (US$ Million, AGR%, CAGR%)
Table 54 Italy Propylene Glycol Market Volume Forecast, 2023-2033 (Kilo Tons, AGR%, CAGR%)
Table 55 Spain Propylene Glycol Market Revenue Forecast, 2023-2033 (US$ Million, AGR%, CAGR%)
Table 56 Spain Propylene Glycol Market Volume Forecast, 2023-2033 (Kilo Tons, AGR%, CAGR%)
Table 57 Russia Propylene Glycol Market Revenue Forecast, 2023-2033 (US$ Million, AGR%, CAGR%)
Table 58 Russia Propylene Glycol Market Volume Forecast, 2023-2033 (Kilo Tons, AGR%, CAGR%)
Table 59 Rest of Europe Propylene Glycol Market Revenue Forecast, 2023-2033 (US$ Million, AGR%, CAGR%)
Table 60 Rest of Europe Propylene Glycol Market Volume Forecast, 2023-2033 (Kilo Tons, AGR%, CAGR%)
Table 61 Asia Pacific Propylene Glycol Market Revenue Forecast by Country, 2023-2033 (US$ Million, AGR%, CAGR%)
Table 62 Asia Pacific Propylene Glycol Market Volume Forecast by Country, 2023-2033 (Kilo Tons, AGR%, CAGR%)1
Table 63 Asia Pacific Propylene Glycol Market Revenue Forecast by Source, 2023-2033 (US$ Million, AGR%, CAGR%)
Table 64 Asia Pacific Propylene Glycol Market Volume Forecast by Source, 2023-2033 (Kilo Tons, AGR%, CAGR%)
Table 65 Asia Pacific Propylene Glycol Market Revenue Forecast by Grade, 2023-2033 (US$ Million, AGR%, CAGR%)
Table 66 Asia Pacific Propylene Glycol Market Volume Forecast by Grade, 2023-2033 (Kilo Tons, AGR%, CAGR%)
Table 67 Asia Pacific Propylene Glycol Market Revenue Forecast by Application, 2023-2033 (US$ Million, AGR%, CAGR%)
Table 68 Asia Pacific Propylene Glycol Market Volume Forecast by Application, 2023-2033 (Kilo Tons, AGR%, CAGR%)
Table 69 China Propylene Glycol Market Revenue Forecast, 2023-2033 (US$ Million, AGR%, CAGR%)
Table 70 China Propylene Glycol Market Volume Forecast, 2023-2033 (Kilo Tons, AGR%, CAGR%)
Table 71 Japan Propylene Glycol Market Revenue Forecast, 2023-2033 (US$ Million, AGR%, CAGR%)
Table 72 Japan Propylene Glycol Market Volume Forecast, 2023-2033 (Kilo Tons, AGR%, CAGR%)
Table 73 India Propylene Glycol Market Revenue Forecast, 2023-2033 (US$ Million, AGR%, CAGR%)
Table 74 India Propylene Glycol Market Volume Forecast, 2023-2033 (Kilo Tons, AGR%, CAGR%)
Table 75 South Korea Propylene Glycol Market Revenue Forecast, 2023-2033 (US$ Million, AGR%, CAGR%)
Table 76 South Korea Propylene Glycol Market Volume Forecast, 2023-2033 (Kilo Tons, AGR%, CAGR%)
Table 77 Australia Propylene Glycol Market Revenue Forecast, 2023-2033 (US$ Million, AGR%, CAGR%)
Table 78 Australia Propylene Glycol Market Volume Forecast, 2023-2033 (Kilo Tons, AGR%, CAGR%)
Table 79 Rest of APAC Propylene Glycol Market Revenue Forecast, 2023-2033 (US$ Million, AGR%, CAGR%)
Table 80 Rest of APAC Propylene Glycol Market Volume Forecast, 2023-2033 (Kilo Tons, AGR%, CAGR%)
Table 81 Latin America Propylene Glycol Market Revenue Forecast by Country, 2023-2033 (US$ Million, AGR%, CAGR%)
Table 82 Latin America Propylene Glycol Market Volume Forecast by Country, 2023-2033 (Kilo Tons, AGR%, CAGR%)
Table 83 Latin America Propylene Glycol Market Revenue Forecast by Source, 2023-2033 (US$ Million, AGR%, CAGR%)
Table 84 Latin America Propylene Glycol Market Volume Forecast by Source, 2023-2033 (Kilo Tons, AGR%, CAGR%)
Table 85 Latin America Propylene Glycol Market Revenue Forecast by Grade, 2023-2033 (US$ Million, AGR%, CAGR%)
Table 86 Latin America Propylene Glycol Market Volume Forecast by Grade, 2023-2033 (Kilo Tons, AGR%, CAGR%)
Table 87 Latin America Propylene Glycol Market Revenue Forecast by Application, 2023-2033 (US$ Million, AGR%, CAGR%)
Table 88 Latin America Propylene Glycol Market Volume Forecast by Application, 2023-2033 (Kilo Tons, AGR%, CAGR%)
Table 89 Mexico Propylene Glycol Market Revenue Forecast, 2023-2033 (US$ Million, AGR%, CAGR%)
Table 90 Mexico Propylene Glycol Market Volume Forecast, 2023-2033 (Kilo Tons, AGR%, CAGR%)
Table 91 Brazil Propylene Glycol Market Revenue Forecast, 2023-2033 (US$ Million, AGR%, CAGR%)
Table 92 Brazil Propylene Glycol Market Volume Forecast, 2023-2033 (Kilo Tons, AGR%, CAGR%)
Table 93 Rest of Latin America Propylene Glycol Market Revenue Forecast, 2023-2033 (US$ Million, AGR%, CAGR%)
Table 94 Rest of Latin America Propylene Glycol Market Volume Forecast, 2023-2033 (Kilo Tons, AGR%, CAGR%)
Table 95 Middle East & Africa Propylene Glycol Market Revenue Forecast by Country, 2023-2033 (US$ Million, AGR%, CAGR%)
Table 96 Middle East & Africa Propylene Glycol Market Volume Forecast by Country, 2023-2033 (Kilo Tons, AGR%, CAGR%)
Table 97 Middle East & Africa Propylene Glycol Market Revenue Forecast by Source, 2023-2033 (US$ Million, AGR%, CAGR%)
Table 98 Middle East & Africa Propylene Glycol Market Volume Forecast by Source, 2023-2033 (Kilo Tons, AGR%, CAGR%)
Table 99 Middle East & Africa Propylene Glycol Market Revenue Forecast by Grade, 2023-2033 (US$ Million, AGR%, CAGR%)
Table 100 Middle East & Africa Propylene Glycol Market Volume Forecast by Grade, 2023-2033 (Kilo Tons, AGR%, CAGR%)
Table 101 Middle East & Africa Propylene Glycol Market Revenue Forecast by Application, 2023-2033 (US$ Million, AGR%, CAGR%)
Table 102 Middle East & Africa Propylene Glycol Market Volume Forecast by Application, 2023-2033 (Kilo Tons, AGR%, CAGR%)
Table 103 GCC Propylene Glycol Market Revenue Forecast, 2023-2033 (US$ Million, AGR%, CAGR%)
Table 104 GCC Propylene Glycol Market Volume Forecast, 2023-2033 (Kilo Tons, AGR%, CAGR%)
Table 105 South Africa Propylene Glycol Market Revenue Forecast, 2023-2033 (US$ Million, AGR%, CAGR%)
Table 106 South Africa Propylene Glycol Market Volume Forecast, 2023-2033 (Kilo Tons, AGR%, CAGR%)
Table 107 Rest of Middle East & Africa Propylene Glycol Market Revenue Forecast, 2023-2033 (US$ Million, AGR%, CAGR%)
Table 108 Rest of Middle East & Africa Propylene Glycol Market Volume Forecast, 2023-2033 (Kilo Tons, AGR%, CAGR%)
Table 109 Strategic Outlook
Table 110 LyondellBasell Industries N.V.: Key Details, (CEO, HQ, Revenue, Founded, No. of Employees, Company Type, Website, Business Segment)
Table 111 LyondellBasell Industries N.V.: Product Benchmarking
Table 112 LyondellBasell Industries N.V.: Strategic Outlook
Table 113 Dow Inc.: Key Details, (CEO, HQ, Revenue, Founded, No. of Employees, Company Type, Website, Business Segment)
Table 114 Dow Inc.: Product Benchmarking
Table 115 Dow Inc.: Strategic Outlook
Table 116 Archer Daniels Midland (ADM): Key Details, (CEO, HQ, Revenue, Founded, No. of Employees, Company Type, Website, Business Segment)
Table 117 Archer Daniels Midland (ADM): Product Benchmarking
Table 118 Indorama Ventures Public Company Limited: Key Details, (CEO, HQ, Revenue, Founded, No. of Employees, Company Type, Website, Business Segment)
Table 119 Indorama Ventures Public Company Limited: Product Benchmarking
Table 120 Sadara Chemical Company (Sadara): Key Details, (CEO, HQ, Revenue, Founded, No. of Employees, Company Type, Website, Business Segment)
Table 121 Sadara Chemical Company (Sadara): Product Benchmarking
Table 122 Sadara Chemical Company (Sadara): Strategic Outlook
Table 123 BASF SE: Key Details, (CEO, HQ, Revenue, Founded, No. of Employees, Company Type, Website, Business Segment)
Table 124 BASF SE: Product Benchmarking
Table 125 BAS SE: Strategic Outlook
Table 126 Shell plc: Key Details, (CEO, HQ, Revenue, Founded, No. of Employees, Company Type, Website, Business Segment)
Table 127 Shell plc: Product Benchmarking
Table 128 SKC Co., Ltd.: Key Details, (CEO, HQ, Revenue, Founded, No. of Employees, Company Type, Website, Business Segment)
Table 129 SKC Co., Ltd.: Product Benchmarking
Table 130 INEOS Group Holdings S.A.: Key Details, (CEO, HQ, Revenue, Founded, No. of Employees, Company Type, Website, Business Segment)
Table 131 INEOS Group Holdings S.A.: Product Benchmarking
Table 132 INEOS Group Holdings S.A.: Strategic Outlook
Table 133 Repsol S.A.: Key Details, (CEO, HQ, Revenue, Founded, No. of Employees, Company Type, Website, Business Segment)
Table 134 Repsol S.A.: Product Benchmarking
Table 135 Repsol S.A.: Strategic Outlook
Table 136 ADEKA Corporation: Key Details, (CEO, HQ, Revenue, Founded, No. of Employees, Company Type, Website, Business Segment)
Table 137 ADEKA Corporation: Product Benchmarking
Table 138 Manali Petrochemicals Limited: Key Details, (CEO, HQ, Revenue, Founded, No. of Employees, Company Type, Website, Business Segment)
Table 139 Manali Petrochemicals Limited: Product Benchmarking
Table 140 Manali Petrochemicals Limited: Strategic Outlook
Table 141 Monument Chemical: Key Details, (CEO, HQ, Revenue, Founded, No. of Employees, Company Type, Website, Business Segment)
Table 142 Monument Chemical: Product Benchmarking
Table 143 Global Bio-chem Technology Group Company Limited: Key Details, (CEO, HQ, Revenue, Founded, No. of Employees, Company Type, Website, Business Segment)
Table 144 Global Bio-chem Technology Group Company Limited: Product Benchmarking
List of Figures
Figure 1 Propylene Glycol Market Segmentation
Figure 2 Propylene Glycol Market by Source: Market Attractiveness Index
Figure 3 Propylene Glycol Market by Grade: Market Attractiveness Index
Figure 4 Propylene Glycol Market by Application: Market Attractiveness Index
Figure 5 Propylene Glycol Market Attractiveness Index by Region
Figure 6 Propylene Glycol Market: Market Dynamics
Figure 7 Propylene Glycol Market Volume Forecast by Region, 2023-2033 (Kilo Tons, AGR%): “V” Shaped Recovery Scenario
Figure 8 Propylene Glycol Market Volume Forecast by Region, 2023-2033 (Kilo Tons, AGR%): “U” Shaped Recovery Scenario
Figure 9 Propylene Glycol Market Volume Forecast by Region, 2023-2033 (Kilo Tons, AGR%): “W” Shaped Recovery Scenario
Figure 10 Propylene Glycol Market Volume Forecast by Region, 2023-2033 (Kilo Tons, AGR%): “L” Shaped Recovery Scenario
Figure 11 Propylene Glycol Market: Porter’s Five Forces Analysis
Figure 12 Propylene Glycol Market: PEST Analysis
Figure 13 Propylene Glycol Market by Source: Market Attractiveness Index
Figure 14 Propylene Glycol Market Revenue Forecast by Source, 2023-2033 (US$ Million, AGR %)
Figure 15 Propylene Glycol Market Revenue Share Forecast by Source, 2023, 2028, 2033 (%)
Figure 16 Propylene Glycol Market Volume Forecast by Source, 2023-2033 (Kilo Tons, AGR %)
Figure 17 Propylene Glycol Market Volume Share Forecast by Source, 2023, 2028, 2033 (%)
Figure 18 Petroleum-derived Propylene Glycol Market Revenue Forecast by Geography, 2023-2033 (US$ Million, AGR %)
Figure 19 Petroleum-derived Propylene Glycol Market Revenue Share Forecast by Region, 2023 & 2033 (%)
Figure 20 Bio-derived Propylene Glycol Market Revenue Forecast by Geography, 2023-2033 (US$ Million, AGR %)
Figure 21 Bio-derived Propylene Glycol Market Revenue Share Forecast by Region, 2023 & 2033 (%)
Figure 22 Propylene Glycol Market by Grade: Market Attractiveness Index
Figure 23 Propylene Glycol Market Revenue Forecast by Grade, 2023-2033 (US$ Million, AGR %)
Figure 24 Propylene Glycol Market Revenue Share Forecast by Grade, 2023, 2028, 2033 (%)
Figure 25 Propylene Glycol Market Volume Forecast by Grade, 2023-2033 (Kilo Tons, AGR %)
Figure 26 Propylene Glycol Market Volume Share Forecast by Grade, 2023, 2028, 2033 (%)
Figure 27 Industrial Grade Propylene Glycol Market Revenue Forecast by Geography, 2023-2033 (US$ Million, AGR %)
Figure 28 Industrial Grade Propylene Glycol Market Revenue Share Forecast by Region, 2023 & 2033 (%)
Figure 29 Pharmaceutical Grade Propylene Glycol Market Revenue Forecast by Geography, 2023-2033 (US$ Million, AGR %)
Figure 30 Pharmaceutical Grade Propylene Glycol Market Revenue Share Forecast by Region, 2023 & 2033 (%)
Figure 31 Propylene Glycol Market by Application: Market Attractiveness Index
Figure 32 Propylene Glycol Market Revenue Forecast by Application, 2023-2033 (US$ Million, AGR %)
Figure 33 Propylene Glycol Market Revenue Share Forecast by Application, 2023, 2028, 2033 (%)
Figure 34 Propylene Glycol Market Volume Forecast by Application, 2023-2033 (Kilo Tons, AGR %)
Figure 35 Propylene Glycol Market Volume Share Forecast by Application, 2023, 2028, 2033 (%)
Figure 36 Unsaturated Polyester Resin Propylene Glycol Market Revenue Forecast by Geography, 2023-2033 (US$ Million, AGR %)
Figure 37 Unsaturated Polyester Resin Propylene Glycol Market Revenue Share Forecast by Region, 2023 & 2033 (%)
Figure 38 Paints and Coatings Propylene Glycol Market Revenue Forecast by Geography, 2023-2033 (US$ Million, AGR %)
Figure 39 Paints and Coatings Propylene Glycol Market Revenue Share Forecast by Region, 2023 & 2033 (%)
Figure 40 Antifreeze & Functional Fluids Propylene Glycol Market Revenue Forecast by Geography, 2023-2033 (US$ Million, AGR %)
Figure 41 Antifreeze & Functional Fluids Propylene Glycol Market Revenue Share Forecast by Region, 2023 & 2033 (%)
Figure 42 Liquid Detergents Propylene Glycol Market Revenue Forecast by Geography, 2023-2033 (US$ Million, AGR %)
Figure 43 Liquid Detergents Propylene Glycol Market Revenue Share Forecast by Region, 2023 & 2033 (%)
Figure 44 Plasticizers Propylene Glycol Market Revenue Forecast by Geography, 2023-2033 (US$ Million, AGR %)
Figure 45 Plasticizers Propylene Glycol Market Revenue Share Forecast by Region, 2023 & 2033 (%)
Figure 46 Food & Beverage Propylene Glycol Market Revenue Forecast by Geography, 2023-2033 (US$ Million, AGR %)
Figure 47 Food & Beverage Propylene Glycol Market Revenue Share Forecast by Region, 2023 & 2033 (%)
Figure 48 Pharmaceutical Propylene Glycol Market Revenue Forecast by Geography, 2023-2033 (US$ Million, AGR %)
Figure 49 Pharmaceutical Propylene Glycol Market Revenue Share Forecast by Region, 2023 & 2033 (%)
Figure 50 Cosmetics & Personal Care Propylene Glycol Market Revenue Forecast by Geography, 2023-2033 (US$ Million, AGR %)
Figure 51 Cosmetics & Personal Care Propylene Glycol Market Revenue Share Forecast by Region, 2023 & 2033 (%)
Figure 52 Other Applications Propylene Glycol Market Revenue Forecast by Geography, 2023-2033 (US$ Million, AGR %)
Figure 53 Other Applications Propylene Glycol Market Revenue Share Forecast by Region, 2023 & 2033 (%)
Figure 54 Propylene Glycol Market Revenue Forecast by Region 2023 and 2033 (US$ Million, CAGR%)
Figure 55 Propylene Glycol Market Volume Forecast by Region 2023 and 2033 (Kilo Tons, CAGR%)
Figure 56 Propylene Glycol Market Revenue Share Forecast by Region 2023, 2028, 2033 (%)
Figure 57 Propylene Glycol Market Volume Share Forecast by Region 2023, 2028, 2033 (%)
Figure 58 Propylene Glycol Market Revenue by Region, 2023-2033 (US$ Million, AGR %)
Figure 59 Propylene Glycol Market Volume by Region, 2023-2033 (Kilo Tons, AGR %)
Figure 60 North America Propylene Glycol Market Attractiveness Index
Figure 61 North America Propylene Glycol Market Revenue by Country, 2023, 2028 & 2033 (US$ Million)
Figure 62 North America Propylene Glycol Market Volume by Country, 2023, 2028 & 2033 (Kilo Tons)
Figure 63 North America Propylene Glycol Market Revenue Forecast by Country, 2023-2033 (US$ Million, AGR %)
Figure 64 North America Propylene Glycol Market Revenue Share Forecast by Country, 2023 & 2033 (%)
Figure 65 North America Propylene Glycol Market Volume Forecast by Country, 2023-2033 (Kilo Tons, AGR %)
Figure 66 North America Propylene Glycol Market Volume Share Forecast by Country, 2023 & 2033 (%)
Figure 67 North America Propylene Glycol Market Revenue Forecast by Source, 2023-2033 (US$ Million, AGR %)
Figure 68 North America Propylene Glycol Market Revenue Share Forecast by Source, 2023 & 2033 (%)
Figure 69 North America Propylene Glycol Market Volume Forecast by Source, 2023-2033 (Kilo Tons, AGR %)
Figure 70 North America Propylene Glycol Market Volume Share Forecast by Source, 2023 & 2033 (%)
Figure 71 North America Propylene Glycol Market Revenue Forecast by Grade, 2023-2033 (US$ Million, AGR %)
Figure 72 North America Propylene Glycol Market Revenue Share Forecast by Grade, 2023 & 2033 (%)
Figure 73 North America Propylene Glycol Market Volume Forecast by Grade, 2023-2033 (Kilo Tons, AGR %)
Figure 74 North America Propylene Glycol Market Volume Share Forecast by Grade, 2023 & 2033 (%)
Figure 75 North America Propylene Glycol Market Revenue Forecast by Application, 2023-2033 (US$ Million, AGR %)
Figure 76 North America Propylene Glycol Market Revenue Share Forecast by Application, 2023 & 2033 (%)
Figure 77 North America Propylene Glycol Market Volume Forecast by Application, 2023-2033 (Kilo Tons, AGR %)
Figure 78 North America Propylene Glycol Market Volume Share Forecast by Application, 2023 & 2033 (%)
Figure 79 U.S. Propylene Glycol Market Revenue Forecast, 2023-2033 (US$ Million, AGR %)
Figure 80 U.S. Propylene Glycol Market Volume Forecast, 2023-2033 (Kilo Tons, AGR %)
Figure 81 Canada Propylene Glycol Market Revenue Forecast, 2023-2033 (US$ Million, AGR %)
Figure 82 Canada Propylene Glycol Market Volume Forecast, 2023-2033 (Kilo Tons, AGR %)
Figure 83 Europe Propylene Glycol Market Attractiveness Index
Figure 84 Europe Propylene Glycol Market Revenue by Country, 2023, 2028 & 2033 (US$ Million)
Figure 85 Europe Propylene Glycol Market Volume by Country, 2023, 2028 & 2033 (Kilo Tons)
Figure 86 Europe Propylene Glycol Market Revenue Forecast by Country, 2023-2033 (US$ Million, AGR %)
Figure 87 Europe Propylene Glycol Market Revenue Share Forecast by Country, 2023 & 2033 (%)
Figure 88 Europe Propylene Glycol Market Volume Forecast by Country, 2023-2033 (Kilo Tons, AGR %)
Figure 89 Europe Propylene Glycol Market Volume Share Forecast by Country, 2023 & 2033 (%)
Figure 90 Europe Propylene Glycol Market Revenue Forecast by Source, 2023-2033 (US$ Million, AGR %)
Figure 91 Europe Propylene Glycol Market Revenue Share Forecast by Source, 2023 & 2033 (%)
Figure 92 Europe Propylene Glycol Market Volume Forecast by Source, 2023-2033 (Kilo Tons, AGR %)
Figure 93 Europe Propylene Glycol Market Volume Share Forecast by Source, 2023 & 2033 (%)
Figure 94 Europe Propylene Glycol Market Revenue Forecast by Grade, 2023-2033 (US$ Million, AGR %)
Figure 95 Europe Propylene Glycol Market Revenue Share Forecast by Grade, 2023 & 2033 (%)
Figure 96 Europe Propylene Glycol Market Volume Forecast by Grade, 2023-2033 (Kilo Tons, AGR %)
Figure 97 Europe Propylene Glycol Market Volume Share Forecast by Grade, 2023 & 2033 (%)
Figure 98 Europe Propylene Glycol Market Revenue Forecast by Application, 2023-2033 (US$ Million, AGR %)
Figure 99 Europe Propylene Glycol Market Revenue Share Forecast by Application, 2023 & 2033 (%)
Figure 100 Europe Propylene Glycol Market Volume Forecast by Application, 2023-2033 (Kilo Tons, AGR %)
Figure 101 Europe Propylene Glycol Market Volume Share Forecast by Application, 2023 & 2033 (%)
Figure 102 Germany Propylene Glycol Market Revenue Forecast, 2023-2033 (US$ Million, AGR %)
Figure 103 Germany Propylene Glycol Market Volume Forecast, 2023-2033 (Kilo Tons, AGR %)
Figure 104 UK Propylene Glycol Market Revenue Forecast, 2023-2033 (US$ Million, AGR %)
Figure 105 UK Propylene Glycol Market Volume Forecast, 2023-2033 (Kilo Tons, AGR %)
Figure 106 France Propylene Glycol Market Revenue Forecast, 2023-2033 (US$ Million, AGR %)
Figure 107 France Propylene Glycol Market Volume Forecast, 2023-2033 (Kilo Tons, AGR %)
Figure 108 Italy Propylene Glycol Market Revenue Forecast, 2023-2033 (US$ Million, AGR %)
Figure 109 Italy Propylene Glycol Market Volume Forecast, 2023-2033 (Kilo Tons, AGR %)
Figure 110 Spain Propylene Glycol Market Revenue Forecast, 2023-2033 (US$ Million, AGR %)
Figure 111 Spain Propylene Glycol Market Volume Forecast, 2023-2033 (Kilo Tons, AGR %)
Figure 112 Russia Propylene Glycol Market Revenue Forecast, 2023-2033 (US$ Million, AGR %)
Figure 113 Russia Propylene Glycol Market Volume Forecast, 2023-2033 (Kilo Tons, AGR %)
Figure 114 Rest of Europe Propylene Glycol Market Revenue Forecast, 2023-2033 (US$ Million, AGR %)
Figure 115 Rest of Europe Propylene Glycol Market Volume Forecast, 2023-2033 (Kilo Tons, AGR %)
Figure 116 Asia Pacific Propylene Glycol Market Attractiveness Index
Figure 117 Asia Pacific Propylene Glycol Market Revenue by Country, 2023, 2028 & 2033 (US$ Million)
Figure 118 Asia Pacific Propylene Glycol Market Volume by Country, 2023, 2028 & 2033 (Kilo Tons)
Figure 119 Asia Pacific Propylene Glycol Market Revenue Forecast by Country, 2023-2033 (US$ Million, AGR %)
Figure 120 Asia Pacific Propylene Glycol Market Revenue Share Forecast by Country, 2023 & 2033 (%)
Figure 121 Asia Pacific Propylene Glycol Market Volume Forecast by Country, 2023-2033 (Kilo Tons, AGR %)
Figure 122 Asia Pacific Propylene Glycol Market Volume Share Forecast by Country, 2023 & 2033 (%)
Figure 123 Asia Pacific Propylene Glycol Market Revenue Forecast by Source, 2023-2033 (US$ Million, AGR %)
Figure 124 Asia Pacific Propylene Glycol Market Revenue Share Forecast by Source, 2023 & 2033 (%)
Figure 125 Asia Pacific Propylene Glycol Market Volume Forecast by Source, 2023-2033 (Kilo Tons, AGR %)
Figure 126 Asia Pacific Propylene Glycol Market Volume Share Forecast by Source, 2023 & 2033 (%)
Figure 127 Asia Pacific Propylene Glycol Market Revenue Forecast by Grade, 2023-2033 (US$ Million, AGR %)
Figure 128 Asia Pacific Propylene Glycol Market Revenue Share Forecast by Grade, 2023 & 2033 (%)
Figure 129 Asia Pacific Propylene Glycol Market Volume Forecast by Grade, 2023-2033 (Kilo Tons, AGR %)
Figure 130 Asia Pacific Propylene Glycol Market Volume Share Forecast by Grade, 2023 & 2033 (%)
Figure 131 Asia Pacific Propylene Glycol Market Revenue Forecast by Application, 2023-2033 (US$ Million, AGR %)
Figure 132 Asia Pacific Propylene Glycol Market Revenue Share Forecast by Application, 2023 & 2033 (%)
Figure 133 Asia Pacific Propylene Glycol Market Volume Forecast by Application, 2023-2033 (Kilo Tons, AGR %)
Figure 134 Asia Pacific Propylene Glycol Market Volume Share Forecast by Application, 2023 & 2033 (%)
Figure 135 China Propylene Glycol Market Revenue Forecast, 2023-2033 (US$ Million, AGR %)
Figure 136 China Propylene Glycol Market Volume Forecast, 2023-2033 (Kilo Tons, AGR %)
Figure 137 Japan Propylene Glycol Market Revenue Forecast, 2023-2033 (US$ Million, AGR %)
Figure 138 Japan Propylene Glycol Market Volume Forecast, 2023-2033 (Kilo Tons, AGR %)
Figure 139 India Propylene Glycol Market Revenue Forecast, 2023-2033 (US$ Million, AGR %)
Figure 140 India Propylene Glycol Market Volume Forecast, 2023-2033 (Kilo Tons, AGR %)
Figure 141 South Korea Propylene Glycol Market Revenue Forecast, 2023-2033 (US$ Million, AGR %)
Figure 142 South Korea Propylene Glycol Market Volume Forecast, 2023-2033 (Kilo Tons, AGR %)
Figure 143 Australia Propylene Glycol Market Revenue Forecast, 2023-2033 (US$ Million, AGR %)
Figure 144 Australia Propylene Glycol Market Volume Forecast, 2023-2033 (Kilo Tons, AGR %)
Figure 145 Rest of APAC Propylene Glycol Market Revenue Forecast, 2023-2033 (US$ Million, AGR %)
Figure 146 Rest of APAC Propylene Glycol Market Volume Forecast, 2023-2033 (Kilo Tons, AGR %)
Figure 147 Latin America Propylene Glycol Market Attractiveness Index
Figure 148 Latin America Propylene Glycol Market Revenue by Region, 2023, 2028 & 2033 (US$ Million)
Figure 149 Latin America Propylene Glycol Market Volume by Region, 2023, 2028 & 2033 (Kilo Tons)
Figure 150 Latin America Propylene Glycol Market Revenue Forecast by Country, 2023-2033 (US$ Million, AGR %)
Figure 151 Latin America Propylene Glycol Market Revenue Share Forecast by Country, 2023 & 2033 (%)
Figure 152 Latin America Propylene Glycol Market Volume Forecast by Country, 2023-2033 (Kilo Tons, AGR %)
Figure 153 Latin America Propylene Glycol Market Volume Share Forecast by Country, 2023 & 2033 (%)
Figure 154 Latin America Propylene Glycol Market Revenue Forecast by Source, 2023-2033 (US$ Million, AGR %)
Figure 155 Latin America Propylene Glycol Market Revenue Share Forecast by Source, 2023 & 2033 (%)
Figure 156 Latin America Propylene Glycol Market Volume Forecast by Source, 2023-2033 (Kilo Tons, AGR %)
Figure 157 Latin America Propylene Glycol Market Volume Share Forecast by Source, 2023 & 2033 (%)
Figure 158 Latin America Propylene Glycol Market Revenue Forecast by Grade, 2023-2033 (US$ Million, AGR %)
Figure 159 Latin America Propylene Glycol Market Revenue Share Forecast by Grade, 2023 & 2033 (%)
Figure 160 Latin America Propylene Glycol Market Volume Forecast by Grade, 2023-2033 (Kilo Tons, AGR %)
Figure 161 Latin America Propylene Glycol Market Volume Share Forecast by Grade, 2023 & 2033 (%)
Figure 162 Latin America Propylene Glycol Market Revenue Forecast by Application, 2023-2033 (US$ Million, AGR %)
Figure 163 Latin America Propylene Glycol Market Revenue Share Forecast by Application, 2023 & 2033 (%)
Figure 164 Latin America Propylene Glycol Market Volume Forecast by Application, 2023-2033 (Kilo Tons, AGR %)
Figure 165 Latin America Propylene Glycol Market Volume Share Forecast by Application, 2023 & 2033 (%)
Figure 166 Mexico Propylene Glycol Market Revenue Forecast, 2023-2033 (US$ Million, AGR %)
Figure 167 Mexico Propylene Glycol Market Volume Forecast, 2023-2033 (Kilo Tons, AGR %)
Figure 168 Brazil Propylene Glycol Market Revenue Forecast, 2023-2033 (US$ Million, AGR %)
Figure 169 Brazil Propylene Glycol Market Volume Forecast, 2023-2033 (Kilo Tons, AGR %)
Figure 170 Rest of Latin America Propylene Glycol Market Revenue Forecast, 2023-2033 (US$ Million, AGR %)
Figure 171 Rest of Latin America Propylene Glycol Market Volume Forecast, 2023-2033 (Kilo Tons, AGR %)
Figure 172 Middle East & Africa Propylene Glycol Market Attractiveness Index
Figure 173 Middle East & Africa Propylene Glycol Market Revenue by Country, 2023, 2028 & 2033 (US$ Million)
Figure 174 Middle East & Africa Propylene Glycol Market Volume by Country, 2023, 2028 & 2033 (Kilo Tons)
Figure 175 Middle East & Africa Propylene Glycol Market Revenue Forecast by Country, 2023-2033 (US$ Million, AGR %)
Figure 176 Middle East & Africa Propylene Glycol Market Revenue Share Forecast by Country, 2023 & 2033 (%)
Figure 177 Middle East & Africa Propylene Glycol Market Volume Forecast by Country, 2023-2033 (Kilo Tons, AGR %)
Figure 178 Middle East & Africa Propylene Glycol Market Volume Share Forecast by Country, 2023 & 2033 (%)
Figure 179 Middle East & Africa Propylene Glycol Market Revenue Forecast by Source, 2023-2033 (US$ Million, AGR %)
Figure 180 Middle East & Africa Propylene Glycol Market Revenue Share Forecast by Source, 2023 & 2033 (%)
Figure 181 Middle East & Africa Propylene Glycol Market Volume Forecast by Source, 2023-2033 (Kilo Tons, AGR %)
Figure 182 Middle East & Africa Propylene Glycol Market Volume Share Forecast by Source, 2023 & 2033 (%)
Figure 183 Middle East & Africa Propylene Glycol Market Revenue Forecast by Grade, 2023-2033 (US$ Million, AGR %)
Figure 184 Middle East & Africa Propylene Glycol Market Revenue Share Forecast by Grade, 2023 & 2033 (%)
Figure 185 Middle East & Africa Propylene Glycol Market Volume Forecast by Grade, 2023-2033 (Kilo Tons, AGR %)
Figure 186 Middle East & Africa Propylene Glycol Market Volume Share Forecast by Grade, 2023 & 2033 (%)
Figure 187 Middle East & Africa Propylene Glycol Market Revenue Forecast by Application, 2023-2033 (US$ Million, AGR %)
Figure 188 Middle East & Africa Propylene Glycol Market Revenue Share Forecast by Application, 2023 & 2033 (%)
Figure 189 Middle East & Africa Propylene Glycol Market Volume Forecast by Application, 2023-2033 (Kilo Tons, AGR %)
Figure 190 Middle East & Africa Propylene Glycol Market Volume Share Forecast by Application, 2023 & 2033 (%)
Figure 191 GCC Propylene Glycol Market Revenue Forecast, 2023-2033 (US$ Million, AGR %)
Figure 192 GCC Propylene Glycol Market Volume Forecast, 2023-2033 (Kilo Tons, AGR %)
Figure 193 South Africa Propylene Glycol Market Revenue Forecast, 2023-2033 (US$ Million, AGR %)
Figure 194 South Africa Propylene Glycol Market Volume Forecast, 2023-2033 (Kilo Tons, AGR %)
Figure 195 Rest of Middle East & Africa Propylene Glycol Market Revenue Forecast, 2023-2033 (US$ Million, AGR %)
Figure 196 Rest of Middle East & Africa Propylene Glycol Market Volume Forecast, 2023-2033 (Kilo Tons, AGR %)
Figure 197 Propylene Glycol Market: Company Share, 2022
Figure 198 LyondellBasell Industries N.V.: Net Revenue, 2017-2022 (US$ Million, AGR%)
Figure 199 LyondellBasell Industries N.V.: R&D, 2017-2022 (US$ Million, AGR%)
Figure 200 LyondellBasell Industries N.V.: Regional Market Shares, 2022
Figure 201 LyondellBasell Industries N.V.: Segmental Market Shares, 2022
Figure 202 Dow Inc.: Net Revenue, 2018-2022 (US$ Million, AGR%)
Figure 203 Dow Inc.: R&D, 2018-2022 (US$ Million, AGR%)
Figure 204 Dow Inc.: Regional Market Shares, 2022
Figure 205 Dow Inc.: Segmental Market Shares, 2022
Figure 206 Archer Daniels Midland (ADM): Net Revenue, 2017-2022 (US$ Million, AGR%)
Figure 207 Archer Daniels Midland (ADM): R&D, 2017-2022 (US$ Million, AGR%)
Figure 208 Archer Daniels Midland (ADM): Regional Market Shares, 2022
Figure 209 Archer Daniels Midland (ADM): Segmental Market Shares, 2022
Figure 210 Indorama Ventures Public Company Limited: Net Revenue, 2017-2022 (US$ Million, AGR%)
Figure 211 Indorama Ventures Public Company Limited: R&D, 2017-2022 (US$ Million, AGR%)
Figure 212 Indorama Ventures Public Company Limited: Regional Market Shares, 2022
Figure 213 Indorama Ventures Public Company Limited: Segmental Market Shares, 2022
Figure 214 BASF SE: Net Revenue, 2017-2022 (US$ Million, AGR%)
Figure 215 BASF SE: R&D, 2017-2022 (US$ Million, AGR%)
Figure 216 BASF SE: Regional Market Shares, 2022
Figure 217 BASF SE: Segmental Market Shares, 2022
Figure 218 Shell plc: Net Revenue, 2017-2022 (US$ Million, AGR%)
Figure 219 Shell plc: R&D, 2017-2022 (US$ Million, AGR%)
Figure 220 Shell plc: Regional Market Shares, 2022
Figure 221 Shell plc: Segmental Market Shares, 2022
Figure 222 SKC Co., Ltd.: Net Revenue, 2019-2022 (US$ Million, AGR%)
Figure 223 SKC Co., Ltd.: Segmental Market Shares, 2022
Figure 224 INEOS Group Holdings S.A.: Net Revenue, 2017-2022 (US$ Million, AGR%)
Figure 225 INEOS Group Holdings S.A.: R&D, 2017-2022 (US$ Million, AGR%)
Figure 226 INEOS Group Holdings S.A.: Regional Market Shares, 2022
Figure 227 INEOS Group Holdings S.A.: Segmental Market Shares, 2022
Figure 228 Repsol S.A.: Net Revenue, 2020-2022 (US$ Million, AGR%)
Figure 229 Repsol S.A.: R&D, 2019-2022 (US$ Million, AGR%)
Figure 230 ADEKA Corporation: Net Revenue, 2017-2022 (US$ Million, AGR%)
Figure 231 ADEKA Corporation: R&D, 2017-2021 (US$ Million, AGR%)
Figure 232 ADEKA Corporation: Regional Market Shares, 2021
Figure 233 ADEKA Corporation: Segmental Market Shares, 2022
Figure 234 Manali Petrochemicals Limited: Net Revenue, 2017-2022 (US$ Million, AGR%)
Figure 235 Manali Petrochemicals Limited: R&D, 2019-2022 (US$ Million, AGR%)
Figure 236 Manali Petrochemicals Limited: Segmental Market Shares, 2022
Figure 237 Global Bio-chem Technology Group Company Limited: Net Revenue, 2017-2022 (US$ Million, AGR%)
Figure 238 Global Bio-chem Technology Group Company Limited: R&D, 2017-2022 (US$ Million, AGR%)
Figure 239 Global Bio-chem Technology Group Company Limited: Regional Market Shares, 2022
Figure 240 Global Bio-chem Technology Group Company Limited: Segmental Market Shares, 2022
ページTOPに戻る
よくあるご質問
Visiongain社はどのような調査会社ですか?
英国の調査会社ヴィジョンゲイン社(Visiongain)は、通信とエネルギーのほか、自動車や化学・医薬品、金属など、広範な市場を対象に調査を行っています。自動車市場については、市場全般に関する調査のほ... もっと見る
調査レポートの納品までの日数はどの程度ですか?
在庫のあるものは速納となりますが、平均的には 3-4日と見て下さい。
但し、一部の調査レポートでは、発注を受けた段階で内容更新をして納品をする場合もあります。
発注をする前のお問合せをお願いします。
注文の手続きはどのようになっていますか?
1)お客様からの御問い合わせをいただきます。
2)見積書やサンプルの提示をいたします。
3)お客様指定、もしくは弊社の発注書をメール添付にて発送してください。
4)データリソース社からレポート発行元の調査会社へ納品手配します。
5) 調査会社からお客様へ納品されます。最近は、pdfにてのメール納品が大半です。
お支払方法の方法はどのようになっていますか?
納品と同時にデータリソース社よりお客様へ請求書(必要に応じて納品書も)を発送いたします。
お客様よりデータリソース社へ(通常は円払い)の御振り込みをお願いします。
請求書は、納品日の日付で発行しますので、翌月最終営業日までの当社指定口座への振込みをお願いします。振込み手数料は御社負担にてお願いします。
お客様の御支払い条件が60日以上の場合は御相談ください。
尚、初めてのお取引先や個人の場合、前払いをお願いすることもあります。ご了承のほど、お願いします。
データリソース社はどのような会社ですか?
当社は、世界各国の主要調査会社・レポート出版社と提携し、世界各国の市場調査レポートや技術動向レポートなどを日本国内の企業・公官庁及び教育研究機関に提供しております。
世界各国の「市場・技術・法規制などの」実情を調査・収集される時には、データリソース社にご相談ください。
お客様の御要望にあったデータや情報を抽出する為のレポート紹介や調査のアドバイスも致します。
|
|

