石炭ガス化市場レポート:2023-2033
Coal Gasification Market Report 2023-2033
レポート詳細
石炭ガス化市場レポート 2023-2033 :本レポートは、新たな収益源の開拓を目指すリーディングカンパニーにとって、業界とその基礎となる力学をより深く理解する上で、非常に貴重なものと... もっと見る
※上記価格は部署ライセンス(Departmental licence)価格です。
その他の価格についてはデータリソースまでお問合せください。
日本語のページは自動翻訳を利用し作成しています。
実際のレポートは英文のみでご納品いたします。

|

|
サマリー
レポート詳細
石炭ガス化市場レポート 2023-2033:本レポートは、新たな収益源の開拓を目指すリーディングカンパニーにとって、業界とその基礎となる力学をより深く理解する上で、非常に貴重なものとなるでしょう。また、異業種への進出や新地域での既存事業の拡大を目指す企業にとっても有益なレポートです。
世界的なエネルギー需要の高まりが石炭ガス化市場の重要な推進要因に
世界的なエネルギー需要の高まりは、石炭ガス化市場の大きな原動力となっています。各国がエネルギー需要の充足を目指す中、石炭ガス化は石炭をクリーンな合成ガスに変換するための信頼性が高く効率的な方法です。中国やインドなどの新興国における急速な工業化は、エネルギー消費の急増につながっています。石炭ガス化は、エネルギー需要の増加に対応するために、豊富な石炭埋蔵量を活用する機会を提供します。
環境規制の強化と温室効果ガス排出量削減の必要性
環境規制の強化や温室効果ガス排出量削減の必要性から、よりクリーンなエネルギー源の導入が進んでいます。石炭ガス化は、排出される二酸化炭素(CO2)の回収と利用を可能にすることで、環境問題を軽減するのに役立ちます。米国や中国などの国々では、排出量を抑制するための規制を実施しています。石炭ガス化技術は、炭素回収・貯留(CCS)や炭素回収・利用・貯留(CCUS)など、CO2を回収し、環境への影響を低減することができます。
マーケットリサーチレポートを購入する前に、どのような質問をするべきか?
- 石炭ガス化市場はどのように進化しているのか?
- 石炭ガス化市場の推進要因と抑制要因は何か?
- 石炭ガス化サブマーケットの各セグメントは予測期間中にどのように成長し、2033年にこれらのサブマーケットが占める収益はどの程度になるのか?
- 2023年から2033年にかけて、石炭ガス化の各サブマーケットの市場シェアはどのように推移するのか?
- 2023年から2033年にかけて、市場全体の主な牽引役となるのは何か?
- 主要な石炭ガス化市場はマクロ経済ダイナミクスに広く追随するのか、それとも個々の国別市場が他を凌駕するのか?
- 2033年までに各国市場の市場シェアはどのように変化し、2033年に市場をリードするのはどの地域か?
- 主要プレーヤーは誰か、また予測期間中の見通しはどうか?
- これらの主要企業の石炭ガス化プロジェクトは何か?
- 2023年から2033年の間に、業界はどのように進化していくのか?現在および今後10年間に実施される石炭ガス化プロジェクトにはどのような意味があるのか?
- 石炭ガス化市場をさらに拡大するために、製品の商業化の必要性は高いか?
- 石炭ガス化市場はどこに向かっているのか、そしてどのようにすれば市場の最前線に立つことができるのか?
- 新製品やサービスラインに対する最適な投資オプションは何か?
- 企業を新たな成長軌道に乗せ、C-suiteに移行させるための重要な展望とは?
このことが、現在、そして今後10年間の石炭ガス化市場にどのような影響を与えるかを見極める必要があります:
- 333ページにわたる本レポートでは、119の表と191のチャート/グラフを独占的にご提供します。
- 本レポートでは、業界における主要な収益性の高い分野を取り上げており、今すぐその分野をターゲットにすることができます。
- 世界、地域、国の売上と成長を詳細に分析しています。
- 競合他社が成功した主要なトレンド、変化、収益予測をハイライトしています。
本レポートは、石炭ガス化市場が今後10年間にどのように発展していくのか、またCOVID-19の景気後退やバウンスの変動に合わせて、今日あなたにお伝えします。この市場は、過去10年間のどの時点よりも今がより重要です。
2033年までの予測やその他の分析により、商業的な展望を明らかにする。
- 2033年までの収益予測に加え、直近の実績や成長率、市場シェアなど、本調査では
- ビジネスの展望や展開など、独自の分析がご覧いただけます。
- 定性的分析(市場力学、促進要因、機会、阻害要因、課題を含む)、コスト構造、石炭ガス化価格上昇の影響、最近の動向などをご覧いただけます。
本レポートでは、COVID-19が業界や貴社にどのような影響を与えるかについて、データ分析および貴重な知見を提供しています。COVID-19の4つの回収パターン、すなわち「V」、「L」、「W」、「U」の回収パターンとその影響について考察しています。
報告書の対象セグメント
ガス化炉タイプ別市場セグメント
- 移動床式ガス化炉
- 流動床式ガス化炉
- エントレインフローガス化炉
エンドユーザー別市場セグメント
- 化学
- 発電用
- 液体燃料
- その他のエンドユーザー
原料別市場セグメント
- 瀝青炭(れきせいたん)
- 亜瀝青炭
- 石油コークス
- バイオマス
- その他の原料
技術別市場セグメント
- 石炭ガス化複合発電(IGCC)
- 化学ループ式ガス化(CLG)
- 石炭からの水素製造(HyCO)
- 石炭液化(CTL)
- ポリジェネレーション
- その他の技術
世界市場全体およびセグメントの収益予測に加え、4地域および主要20カ国市場の収益予測も掲載しています:
北米
- アメリカ
- カナダ
欧州
- ドイツ
- ロシア
- イギリス
- フランス
- イタリア
- その他の欧州地域
アジア太平洋地域
- 中国
- 日本
- インド
- オーストラリア
- 韓国
- その他のアジア太平洋地域
ラテンアメリカ
- ブラジル
- メキシコ
- その他のラテンアメリカ
中近東・アフリカ
- GCC
- 南アフリカ
- その他の中東・アフリカ地域
石炭ガス化市場の2023年から2033年にかけての主要企業のプロファイルと、これらの企業のこのセグメントに焦点を当てたいくつかの企業についても報告しています。
主要企業と市場成長の可能性
・ Air Liquide
・ CTCI Corporation
・ Foster Wheeler AG
・ General Electric Company
・ KBR, Inc.
・ Linc Energy Ltd.
・ Linde plc
・ Mitsubishi Heavy Industries Ltd
・ Royal Dutch Shell Plc.
・ Sasol Limited
・ Sedin Engineering Co Ltd
・ Shanxi Lu’an Mining Group Co., Ltd.
・ Siemens AG
・ Wison Group
・ Xinwen Mining Group Co. Ltd
石炭ガス化市場の世界全体の収益、金額ベースで2023年から2033年まで、市場は2023年に110.8億米ドルを突破すると、我々の仕事は計算されます。2033年まで収益が大きく伸びることが予測されます。当社の調査では、最も大きな可能性を秘めた企業を特定しています。彼らの能力、進歩、商業的な見通しを知ることで、先を行くことができます。
石炭ガス化市場、2023年から2033年までのレポートはどのように役立つのでしょうか?
要約すると、330ページ以上のレポートでは、以下のような知識を得ることができます:
- 石炭ガス化市場の2023年から2033年までの収益予測 ガス化炉のタイプ、エンドユーザー、原料、技術の各予測を世界および地域レベルで掲載 - 業界の展望を発見し、投資と収益に最も有利な場所を見つけます。
- 4つの地域と20の主要国市場の2033年までの収益予測 - 石炭ガス化市場、2023年から2033年までの北米、欧州、アジア太平洋、ラテンアメリカ、中東&アフリカの市場予測をご覧いただけます。また、米国、カナダ、ブラジル、ドイツ、フランス、英国、イタリア、中国、インド、日本、オーストラリアなど、著名な経済圏の市場も予測しています。
- 既存企業および市場参入を目指す企業の展望 - 2023年から2033年までの石炭ガス化市場に関わる主要企業15社の企業プロファイルを含む。
独自の予測による定量・定性分析をご覧いただけます。私たちのレポートだけが持つ情報を入手し、貴重なビジネスインテリジェンスとして情報を得ることができます。
他にはない情報
私たちの新しいレポートがあれば、知識に遅れをとったり、チャンスを逃したりする可能性は低くなります。私たちの仕事があなたの調査、分析、意思決定にどのように役立つかをご覧ください。Visiongainの研究は、石炭ガス化市場、2023年から2033年、市場をリードする企業のための商業分析を必要とするすべての人のためのものです。データ、トレンド、予測を見つけることができます。
ページTOPに戻る
目次
目次
1 レポートの概要
1.1 調査の目的
1.2 石炭ガス化市場の紹介
1.3 本レポートが提供するもの
1.4 本レポートを読むべき理由
1.5 本分析レポートが回答する主な質問事項
1.6 本レポートは誰のためのものか?
1.7 方法論
1.7.1 市場の定義
1.7.2 市場評価・予測手法
1.7.3 データの検証
1.7.3.1 プライマリーリサーチ
1.7.3.2 セカンダリーリサーチ
1.8 よくある質問(FAQ)
1.9 関連するVisiongainのレポート
1.10 Visiongainについて
2 エグゼクティブサマリー
3 市場の概要
3.1 主要な調査結果
3.2 マーケットダイナミクス
3.2.1 市場促進要因
3.2.1.1 クリーンエネルギーへの高い需要がガス化市場の成長を促進する
3.2.1.2 石炭産業の拡大が成長を促進する
3.2.1.3 USGの利用拡大および原料の柔軟性が市場成長を促進する
3.2.2 市場抑制要因
3.2.2.1 高い設置コストが市場成長の妨げとなる
3.2.2.2 石炭ガス化における坑内掘削が環境に与える悪影響
3.2.2.3 石油化学セクターからの強い石油需要により、世界の石炭ガス化市場の拡大が妨げられると予測される。
3.2.3 市場の可能性
3.2.3.1 水素ガス製造のための石炭ガス化の利用は、石炭ガス化市場に有望な機会を提供する
3.2.3.2 既存の石炭火力発電所をガス化技術で改修することが機会を提供する
3.2.3.3 石炭ガス化プロジェクトの設立により、市場関係者は新興国のエネルギー需要の増加に対応できる
3.3 ポーターのファイブフォース分析
3.3.1 サプライヤーのバーゲニングパワー(低〜中)
3.3.2 買い手のバーゲニングパワー(中〜高)
3.3.3 競争上のライバル関係(中程度から高程度)
3.3.4 代替品からの脅威(高)
3.3.5 新規参入の脅威(低い)
3.4 COVID-19影響度分析
3.5 PEST分析
4 石炭ガス化市場分析:ガス化炉タイプ別
4.1 主要な調査結果
4.2 ガス化炉のタイプ別セグメント 市場魅力度指数
4.3 ガス化炉タイプ別の石炭ガス化市場規模の推定と予測
4.4 移動床式ガス化炉
4.4.1 2023-2033年の地域別市場規模(US$ Billion)
4.4.2 2023年・2033年地域別市場シェア(%)
4.5 流動床式ガス化炉
4.5.1 2023年~2033年、地域別市場規模(US$ Billion)
4.5.2 2023年・2033年地域別市場シェア(%)
4.6 噴流式ガス化炉
4.6.1 2023年〜2033年、地域別市場規模(US$ Billion)
4.6.2 2023年・2033年地域別市場シェア(%)
5 石炭ガス化市場分析:エンドユーザー別
5.1 主要な調査結果
5.2 エンドユーザーセグメントの 市場魅力度指数
5.3 エンドユーザー別石炭ガス化市場規模推定と予測
5.4 化学製品
5.4.1 2023年〜2033年の地域別市場規模(US$ Billion)
5.4.2 2023年・2033年地域別市場シェア(%)
5.5 発電事業
5.5.1 2023-2033年地域別市場規模(US$ Billion)
5.5.2 2023年・2033年地域別市場シェア(%)
5.6 液体燃料
5.6.1 2023-2033年地域別市場規模(US$ Billion)
5.6.2 2023年・2033年地域別市場シェア(%)
5.7 その他のエンドユーザー
5.7.1 2023-2033年地域別市場規模(US$ Billion)
5.7.2 2023年・2033年地域別市場シェア(%)
6 石炭ガス化市場分析:供給原料別
6.1 主要な調査結果
6.2 フィードストックセグメントの 市場魅力度指数
6.3 フィードストック別の石炭ガス化市場規模の推定と予測
6.4 瀝青炭
6.4.1 2023-2033年の地域別市場規模(US$ Billion)
6.4.2 2023年・2033年地域別市場シェア(%)
6.5 亜瀝青炭
6.5.1 2023年~2033年、地域別市場規模(US$ Billion)
6.5.2 2023年・2033年地域別市場シェア(%)
6.6 石油コークス
6.6.1 2023年〜2033年の地域別市場規模(US$ Billion)
6.6.2 2023年・2033年地域別市場シェア(%)
6.7 バイオマス
6.7.1 2023-2033年地域別市場規模(US$ Billion)
6.7.2 2023年・2033年地域別市場シェア(%)
6.8 その他の原料
6.8.1 2023-2033年地域別市場規模(US$ Billion)
6.8.2 2023年・2033年地域別市場シェア(%)
7 石炭ガス化市場分析:技術別
7.1 主要な調査結果
7.2 技術セグメント: 市場魅力度指数
7.3 技術別の石炭ガス化市場規模推定と予測
7.4 統合ガス化複合発電(IGCC)
7.4.1 2023年〜2033年の地域別市場規模(US$ Billion)
7.4.2 2023年・2033年地域別市場シェア(%)
7.5 化学ループ式ガス化(CLG)
7.5.1 2023年~2033年、地域別市場規模(US$ Billion)
7.5.2 2023年・2033年地域別市場シェア(%)
7.6 石炭プロセスからの水素(HyCO)
7.6.1 2023年〜2033年、地域別市場規模(US$ Billion)
7.6.2 2023年・2033年地域別市場シェア(%)
7.7 石炭液化(CTL)
7.7.1 2023年〜2033年、地域別市場規模(US$ Billion)
7.7.2 2023年・2033年地域別市場シェア(%)
7.8 ポリジェネレーション
7.8.1 2023年~2033年の地域別市場規模(US$ Billion)
7.8.2 2023年・2033年地域別市場シェア(%)
7.9 その他の技術
7.9.1 2023年〜2033年、地域別市場規模(US$ Billion)
7.9.2 2023年・2033年地域別市場シェア(%)
8 石炭ガス化市場分析:地域別
8.1 主要な調査結果
8.2 地域別市場規模の推定と予測
9 北米の石炭ガス化市場分析
9.1 主要な調査結果
9.2 北米の石炭ガス化市場の魅力度指数
9.3 北米石炭ガス化市場の国別推移、2023年、2028年、2033年(US$ Billion)
9.4 北米の石炭ガス化市場規模推定と予測
9.5 北米石炭ガス化市場の国別規模推定と予測
9.6 北米石炭ガス化市場のガス化炉タイプ別規模推定と予測
9.7 北米石炭ガス化市場のエンドユーザー別規模推定と予測
9.8 北米石炭ガス化市場の原料別規模推定と予測
9.9 北米石炭ガス化市場の技術別規模推定と予測
9.10 米国石炭ガス化市場分析
9.11 カナダの石炭ガス化市場の分析
10 欧州の石炭ガス化市場分析
10.1 主要な調査結果
10.2 欧州石炭ガス化市場魅力度指数
10.3 欧州石炭ガス化市場の国別推移、2023年、2028年、2033年(US$ Billion)
10.4 欧州石炭ガス化市場規模の推定と予測
10.5 欧州石炭ガス化市場国別規模推定と予測
10.6 欧州石炭ガス化市場のガス化炉タイプ別規模推定と予測
10.7 欧州石炭ガス化市場のエンドユーザー別規模推定と予測
10.8 欧州石炭ガス化市場の原料別規模推定と予測
10.9 欧州石炭ガス化市場の技術別規模推定と予測
10.10 ドイツ石炭ガス化市場分析
10.11 イギリスの石炭ガス化の市場分析
10.12 フランスの石炭ガス化市場の分析
10.13 イタリア石炭ガス化市場の分析
10.14 ロシア石炭ガス化市場の分析
10.15 その他の欧州の石炭ガス化市場の分析
11 アジア太平洋地域の石炭ガス化市場分析
11.1 主要な調査結果
11.2 アジア太平洋地域の石炭ガス化市場の魅力度指数
11.3 アジア太平洋地域の石炭ガス化市場国別、2023年、2028年、2033年(US$ Billion)
11.4 アジア太平洋地域の石炭ガス化市場規模の推定と予測
11.5 アジア太平洋地域の石炭ガス化の国別市場規模推定と予測
11.6 アジア太平洋地域の石炭ガス化のガス化炉タイプ別市場規模推定と予測
11.7 アジア太平洋地域の石炭ガス化のエンドユーザー別市場規模推定と予測
11.8 アジア太平洋地域の石炭ガス化の原料別市場規模推定と予測
11.9 アジア太平洋地域の石炭ガス化の技術別市場規模推定と予測
11.10 中国石炭ガス化市場の分析
11.11 インド石炭ガス化市場の分析
11.12 日本の石炭ガス化市場の分析
11.13 韓国石炭ガス化市場の分析
11.14 オーストラリアの石炭ガス化市場の分析
11.15 その他のアジア太平洋地域の石炭ガス化市場の分析
12 中東・アフリカの石炭ガス化市場分析
12.1 主要な調査結果
12.2 中東・アフリカ石炭ガス化市場魅力度指数
12.3 中東・アフリカ石炭ガス化国別市場、2023年、2028年、2033年(US$ Billion)
12.4 中東・アフリカ石炭ガス化市場規模の推定と予測
12.5 中東・アフリカ石炭ガス化国別市場規模推定と予測
12.6 中東・アフリカ石炭ガス化市場のガス化炉タイプ別規模推定と予測
12.7 中東・アフリカ石炭ガス化市場のエンドユーザー別規模推定と予測
12.8 中東・アフリカ石炭ガス化市場の原料別規模推定と予測
12.9 中東・アフリカ石炭ガス化市場の技術別規模推定と予測
12.10 GCC石炭ガス化市場の分析
12.11 南アフリカの石炭ガス化市場の分析
12.12 その他の中東・アフリカの石炭ガス化市場の分析
13 ラテンアメリカの石炭ガス化市場分析
13.1 主要な調査結果
13.2 ラテンアメリカの石炭ガス化市場の魅力度指数
13.3 ラテンアメリカの石炭ガス化市場の国別推移、2023年、2028年、2033年(US$ Billion)
13.4 ラテンアメリカの石炭ガス化市場規模の推定と予測
13.5 ラテンアメリカの石炭ガス化市場の国別規模推定と予測
13.6 ラテンアメリカの石炭ガス化市場ガス化炉タイプ別規模推定と予測
13.7 ラテンアメリカの石炭ガス化市場エンドユーザー別規模推定と予測
13.8 ラテンアメリカの石炭ガス化市場原料別規模推定と予測:
13.9 ラテンアメリカの石炭ガス化市場技術別規模推定と予測
13.10 ブラジル石炭ガス化市場分析
13.11 メキシコ石炭ガス化市場の分析
13.12 その他のラテンアメリカ地域の石炭ガス化の市場分析
14 会社概要
14.1 競争環境、2022年
14.2 戦略的な展望
14.3 General Electric Company
14.3.1 企業スナップショット
14.3.2 会社概要
14.3.3 財務分析
14.3.3.1 純収益、2018年~2022年
14.3.3.2 R&D、2018年~2022年
14.3.3.3 地域別収入シェア、2022年(%)
14.3.3.4 事業セグメント別売上高シェア、2022年(%)
14.3.4 製品ベンチマーキング
14.4 Air Liquide
14.4.1 企業スナップショット
14.4.2 会社概要
14.4.3 財務分析
14.4.3.1 純収益、2018年〜2022年
14.4.3.2 R&D、2018年〜2022年
14.4.3.3 地域別収入シェア、2022年(%)
14.4.3.4 事業セグメント別売上高シェア、2022年(%)
14.4.4 製品のベンチマーキング
14.4.5 戦略的な展望
14.5 Mitsubishi Heavy Industries Ltd
14.5.1 企業スナップショット
14.5.2 会社概要
14.5.3 財務分析
14.5.3.1 純収益、2018年~2022年
14.5.3.2 R&D、2018年〜2022年
14.5.3.3 地域別収入シェア、2022年(%)
14.5.3.4 事業セグメント別売上高シェア、2022年(%)
14.5.4 製品のベンチマーキング
14.5.5 戦略的な展望
14.6 Royal Dutch Shell Plc.
14.6.1 企業スナップショット
14.6.2 会社概要
14.6.3 財務分析
14.6.3.1 純収益、2018年〜2022年
14.6.3.2 R&D、2018年〜2022年
14.6.3.3 地域別収入シェア、2022年(%)
14.6.3.4 事業セグメント別収益シェア、2022年(%)
14.6.4 製品のベンチマーキング
14.6.5 戦略的な展望
14.7 Siemens AG
14.7.1 企業スナップショット
14.7.2 会社概要
14.7.3 財務分析
14.7.3.1 純収益、2018年〜2022年
14.7.3.2 R&D、2018年〜2022年
14.7.3.3 地域別収入シェア、2022年(%)
14.7.3.4 事業セグメント別売上高シェア、2022年(%)
14.7.4 製品のベンチマーキング
14.7.5 戦略的な展望
14.8 Linde plc
14.8.1 企業スナップショット
14.8.2 会社概要
14.8.3 財務分析
14.8.3.1 純収益、2018年〜2022年
14.8.3.2 R&D、2018年〜2022年
14.8.3.3 地域別収入シェア、2022年(%)
14.8.3.4 事業セグメント別売上高シェア、2022年(%)
14.8.4 製品のベンチマーキング
14.8.5 戦略的な展望
14.9 KBR, Inc.
14.9.1 企業スナップショット
14.9.2 会社概要
14.9.3 財務分析
14.9.3.1 純収益、2018年〜2022年
14.9.3.2 地域別収入シェア、2021年(%)
14.9.3.3 事業セグメント別収益シェア、2021年(%)
14.9.4 製品ベンチマーキング
14.10 Sasol Limited
14.10.1 企業スナップショット
14.10.2 会社概要
14.10.3 財務分析
14.10.3.1 純収益、2018年〜2022年
14.10.3.2 R&D、2018年〜2022年
14.10.3.3 地域別収入シェア、2022年(%)
14.10.3.4 事業セグメント別売上高シェア、2022年(%)
14.10.4 製品ベンチマーキング
14.11 Xinwen Mining Group Co.Ltd.
14.11.1 企業スナップショット
14.11.2 会社概要
14.11.3 ベンチマーキング
14.12 Shanxi Lu'an Mining Group Co., Ltd.
14.12.1 企業スナップショット
14.12.2 会社概要
14.12.3 製品ベンチマーク
14.13 Foster Wheeler AG
14.13.1 カンパニースナップショット
14.13.2 会社概要
14.13.3 製品ベンチマーク
14.14 Linc Energy Ltd.
14.14.1 企業スナップショット
14.14.2 会社概要
14.14.3 製品ベンチマーク
14.15 CTCI Corporation
14.15.1 企業スナップショット
14.15.2 会社概要
14.15.3 財務分析
14.15.3.1 純収益、2017-2021年
14.15.3.2 R&D、2017年~2021年
14.15.3.3 地域別収入シェア、2021年(%)
14.15.3.4 事業セグメント別売上高シェア、2021年(%)
14.15.4 製品ベンチマーキング
14.16 Sedin Engineering Co Ltd
14.16.1 企業スナップショット
14.16.2 会社概要
14.16.3 プロダクト・ベンチマーク
14.17 Wison Group
14.17.1 企業スナップショット
14.17.2 会社概要
14.17.3 製品ベンチマーキング
15 結論と提言
15.1 Visiongainからの結びの言葉
15.2 市場関係者への提言
ページTOPに戻る
図表リスト
表の一覧
Table 1 Coal Gasification Market Snapshot, 2023 & 2033 (US$ Billion, CAGR %)
Table 2 Global Coal Gasification Market Forecast, 2023-2033 (US$ Bn, AGR (%), CAGR (%)) (V-Shaped Recovery Scenario)
Table 3 Global Coal Gasification Market by Region, 2023-2033 (US$ Bn, AGR (%), CAGR (%)) (V-Shaped Recovery Scenario)
Table 4 Global Coal Gasification Market Forecast, 2023-2033 (US$ Bn, AGR (%), CAGR (%)) (W-Shaped Recovery Scenario)
Table 5 Global Coal Gasification Market by Region, 2023-2033 (US$ Bn, AGR (%), CAGR (%)) (W-Shaped Recovery Scenario)
Table 6 Global Coal Gasification Market Forecast, 2023-2033 (US$ Bn, AGR (%), CAGR (%)) (U-Shaped Recovery Scenario)
Table 7 Global Coal Gasification Market by Region, 2023-2033 (US$ Bn, AGR (%), CAGR (%)) (U-Shaped Recovery Scenario)
Table 8 Global Coal Gasification Market Forecast, 2023-2033 (US$ Bn, AGR (%), CAGR (%)) (L-Shaped Recovery Scenario)
Table 9 Global Coal Gasification Market by Region, 2023-2033 (US$ Bn, AGR (%), CAGR (%)) (L-Shaped Recovery Scenario)
Table 10 Global Coal Gasification Market by Gasifier Type, 2023-2033 (US$ Bn, AGR (%), CAGR (%))
Table 11 Moving Bed Gasifier Market by Region, 2023-2033 (US$ Bn, AGR (%), CAGR (%))
Table 12 Fluidized Bed Gasifier Market by Region, 2023-2033 (US$ Bn, AGR (%), CAGR (%))
Table 13 Entrained Flow Gasifier Market by Region, 2023-2033 (US$ Bn, AGR (%), CAGR (%))
Table 14 Global Coal Gasification Market by End-User, 2023-2033 (US$ Bn, AGR (%), CAGR (%))
Table 15 Chemicals Market by Region, 2023-2033 (US$ Bn, AGR (%), CAGR (%))
Table 16 Power Generation Market by Region, 2023-2033 (US$ Bn, AGR (%), CAGR (%))
Table 17 Liquid Fuels Market by Region, 2023-2033 (US$ Bn, AGR (%), CAGR (%))
Table 18 Other End-User Market by Region, 2023-2033 (US$ Bn, AGR (%), CAGR (%))
Table 19 Global Coal Gasification Market by Feedstock, 2023-2033 (US$ Bn, AGR (%), CAGR (%))
Table 20 Bituminous Coal Market by Region, 2023-2033 (US$ Bn, AGR (%), CAGR (%))
Table 21 Sub-bituminous Coal Market by Region, 2023-2033 (US$ Bn, AGR (%), CAGR (%))
Table 22 Petroleum Coke Market by Region, 2023-2033 (US$ Bn, AGR (%), CAGR (%))
Table 23 Biomass Market by Region, 2023-2033 (US$ Bn, AGR (%), CAGR (%))
Table 24 Other Feedstock Market by Region, 2023-2033 (US$ Bn, AGR (%), CAGR (%))
Table 25 Global Coal Gasification Market by Technology, 2023-2033 (US$ Bn, AGR (%), CAGR (%))
Table 26 Integrated Gasification Combined Cycle (IGCC) Market by Region, 2023-2033 (US$ Bn, AGR (%), CAGR (%))
Table 27 Chemical Looping Gasification (CLG) Market by Region, 2023-2033 (US$ Bn, AGR (%), CAGR (%))
Table 28 Hydrogen from Coal Process (HyCO) Market by Region, 2023-2033 (US$ Bn, AGR (%), CAGR (%))
Table 29 Coal-to-Liquids (CTL) Market by Region, 2023-2033 (US$ Bn, AGR (%), CAGR (%))
Table 30 Polygeneration Market by Region, 2023-2033 (US$ Bn, AGR (%), CAGR (%))
Table 31 Other Technologies Market by Region, 2023-2033 (US$ Bn, AGR (%), CAGR (%))
Table 32 Global Coal Gasification Market Forecast, 2023-2033 (US$ Bn, AGR (%), CAGR (%))
Table 33 Global Coal Gasification Market by Region, 2023-2033 (US$ Bn, AGR (%), CAGR (%))
Table 34 North America Coal Gasification Market by Value, 2023-2033 (US$ Bn, AGR (%), CAGR (%))
Table 35 North America Coal Gasification Market by Country, 2023-2033 (US$ Bn, AGR (%), CAGR (%))
Table 36 North America Coal Gasification Market by Gasifier Type, 2023-2033 (US$ Bn, AGR (%), CAGR (%))
Table 37 North America Coal Gasification Market by End-User, 2023-2033 (US$ Bn, AGR (%), CAGR (%))
Table 38 North America Coal Gasification Market by Feedstock, 2023-2033 (US$ Bn, AGR (%), CAGR (%))
Table 39 North America Coal Gasification Market by Technology, 2023-2033 (US$ Bn, AGR (%), CAGR (%))
Table 40 US Coal Gasification Market by Value, 2023-2033 (US$ Bn, AGR (%), CAGR (%))
Table 41 Canada Coal Gasification Market by Value, 2023-2033 (US$ Bn, AGR (%), CAGR (%))
Table 42 Europe Coal Gasification Market by Value, 2023-2033 (US$ Bn, AGR (%), CAGR (%))
Table 43 Europe Coal Gasification Market by Country, 2023-2033 (US$ Bn, AGR (%), CAGR (%))
Table 44 Europe Coal Gasification Market by Gasifier Type, 2023-2033 (US$ Bn, AGR (%), CAGR (%))
Table 45 Europe Coal Gasification Market by End-User, 2023-2033 (US$ Bn, AGR (%), CAGR (%))
Table 46 Europe Coal Gasification Market by Feedstock, 2023-2033 (US$ Bn, AGR (%), CAGR (%))
Table 47 Europe Coal Gasification Market by Technology, 2023-2033 (US$ Bn, AGR (%), CAGR (%))
Table 48 Germany Coal Gasification Market by Value, 2023-2033 (US$ Bn, AGR (%), CAGR (%))
Table 49 UK Coal Gasification Market by Value, 2023-2033 (US$ Bn, AGR (%), CAGR (%))
Table 50 France Coal Gasification Market by Value, 2023-2033 (US$ Bn, AGR (%), CAGR (%))
Table 51 Italy Coal Gasification Market by Value, 2023-2033 (US$ Bn, AGR (%), CAGR (%))
Table 52 Russia Coal Gasification Market by Value, 2023-2033 (US$ Bn, AGR (%), CAGR (%))
Table 53 Rest of Europe Coal Gasification Market by Value, 2023-2033 (US$ Bn, AGR (%), CAGR (%))
Table 54 Asia-Pacific Coal Gasification Market by Value, 2023-2033 (US$ Bn, AGR (%), CAGR (%))
Table 55 Asia-Pacific Coal Gasification Market by Country, 2023-2033 (US$ Bn, AGR (%), CAGR (%))
Table 56 Asia-Pacific Coal Gasification Market by Gasifier Type, 2023-2033 (US$ Bn, AGR (%), CAGR (%))
Table 57 Asia-Pacific Coal Gasification Market by End-User, 2023-2033 (US$ Bn, AGR (%), CAGR (%))
Table 58 Asia-Pacific Coal Gasification Market by Feedstock, 2023-2033 (US$ Bn, AGR (%), CAGR (%))
Table 59 Asia-Pacific Coal Gasification Market by Technology, 2023-2033 (US$ Bn, AGR (%), CAGR (%))
Table 60 China Coal Gasification Market by Value, 2023-2033 (US$ Bn, AGR (%), CAGR (%))
Table 61 India Coal Gasification Market by Value, 2023-2033 (US$ Bn, AGR (%), CAGR (%))
Table 62 Japan Coal Gasification Market by Value, 2023-2033 (US$ Bn, AGR (%), CAGR (%))
Table 63 South Korea Coal Gasification Market by Value, 2023-2033 (US$ Bn, AGR (%), CAGR (%))
Table 64 Australia Coal Gasification Market by Value, 2023-2033 (US$ Bn, AGR (%), CAGR (%))
Table 65 Rest of Asia-Pacific Coal Gasification Market by Value, 2023-2033 (US$ Bn, AGR (%), CAGR (%))
Table 66 Middle East & Africa Coal Gasification Market by Value, 2023-2033 (US$ Bn, AGR (%), CAGR (%))
Table 67 Middle East & Africa Coal Gasification Market by Country, 2023-2033 (US$ Bn, AGR (%), CAGR (%))
Table 68 Middle East & Africa Coal Gasification Market by Gasifier Type, 2023-2033 (US$ Bn, AGR (%), CAGR (%))
Table 69 Middle East & Africa Coal Gasification Market by End-User, 2023-2033 (US$ Bn, AGR (%), CAGR (%))
Table 70 Middle East & Africa Coal Gasification Market by Feedstock, 2023-2033 (US$ Bn, AGR (%), CAGR (%))
Table 71 Middle East & Africa Coal Gasification Market by Technology, 2023-2033 (US$ Bn, AGR (%), CAGR (%))
Table 72 GCC Coal Gasification Market by Value, 2023-2033 (US$ Bn, AGR (%), CAGR (%))
Table 73 South Africa Coal Gasification Market by Value, 2023-2033 (US$ Bn, AGR (%), CAGR (%))
Table 74 Rest of Middle East & Africa Coal Gasification Market by Value, 2023-2033 (US$ Bn, AGR (%), CAGR (%))
Table 75 Latin America Coal Gasification Market by Value, 2023-2033 (US$ Bn, AGR (%), CAGR (%))
Table 76 Latin America Coal Gasification Market by Country, 2023-2033 (US$ Bn, AGR (%), CAGR (%))
Table 77 Latin America Coal Gasification Market by Gasifier Type, 2023-2033 (US$ Bn, AGR (%), CAGR (%))
Table 78 Latin America Coal Gasification Market by End-User, 2023-2033 (US$ Bn, AGR (%), CAGR (%))
Table 79 Latin America Coal Gasification Market by Feedstock, 2023-2033 (US$ Bn, AGR (%), CAGR (%))
Table 80 Latin America Coal Gasification Market by Technology, 2023-2033 (US$ Bn, AGR (%), CAGR (%))
Table 81 Brazil Coal Gasification Market by Value, 2023-2033 (US$ Bn, AGR (%), CAGR (%))
Table 82 Mexico Coal Gasification Market by Value, 2023-2033 (US$ Bn, AGR (%), CAGR (%))
Table 83 Rest of Latin America Coal Gasification Market by Value, 2023-2033 (US$ Bn, AGR (%), CAGR (%))
Table 84 Strategic Outlook - Contract
Table 85 General Electric Company: Key Details, (CEO, HQ, Revenue, Founded, No. of Employees, Company Type, Website, Business Segment)
Table 86 General Electric Company: Product Benchmarking
Table 87 Air Liquide: Key Details, (CEO, HQ, Revenue, Founded, No. of Employees, Company Type, Website, Business Segment)
Table 88 Air Liquide: Product Benchmarking
Table 89 Air Liquide: Strategic Outlook
Table 90 Mitsubishi Heavy Industries, Ltd.: Key Details, (CEO, HQ, Revenue, Founded, No. of Employees, Company Type, Website, Business Segment)
Table 91 Mitsubishi Heavy Industries, Ltd.: Product Benchmarking
Table 92 Mitsubishi Heavy Industries, Ltd.: Strategic Outlook
Table 93 Royal Dutch Shell Plc: Key Details, (CEO, HQ, Revenue, Founded, No. of Employees, Company Type, Website, Business Segment)
Table 94 Royal Dutch Shell Plc: Product Benchmarking
Table 95 Royal Dutch Shell Plc: Strategic Outlook
Table 96 Siemens AG: Key Details, (CEO, HQ, Revenue, Founded, No. of Employees, Company Type, Website, Business Segment)
Table 97 Siemens AG: Product Benchmarking
Table 98 Siemens AG: Strategic Outlook
Table 99 Linde plc: Key Details, (CEO, HQ, Revenue, Founded, No. of Employees, Company Type, Website, Business Segment)
Table 100 Linde plc: Product Benchmarking
Table 101 Linde plc: Strategic Outlook
Table 102 KBR, Inc.: Key Details, (CEO, HQ, Revenue, Founded, No. of Employees, Company Type, Website, Business Segment)
Table 103 KBR, Inc.: Product Benchmarking
Table 104 Sasol Limited: Key Details, (CEO, HQ, Revenue, Founded, No. of Employees, Company Type, Website, Business Segment)
Table 105 Sasol Limited: Product Benchmarking
Table 106 Xinwen Mining Group Co., Ltd.: Key Details, (CEO, HQ, Revenue, Founded, No. of Employees, Company Type, Website, Business Segment)
Table 107 Xinwen Mining Group Co.,Ltd: Product Benchmarking
Table 108 Shanxi Lu'an Mining Group Co., Ltd.: Key Details, (CEO, HQ, Revenue, Founded, No. of Employees, Company Type, Website, Business Segment)
Table 109 Shanxi Lu'an Mining Group Co., Ltd.: Product Benchmarking
Table 110 Foster Wheeler AG: Key Details, (CEO, HQ, Revenue, Founded, No. of Employees, Company Type, Website, Business Segment)
Table 111 Foster Wheeler AG: Product Benchmarking
Table 112 Linc Energy Ltd.: Key Details, (CEO, HQ, Revenue, Founded, No. of Employees, Company Type, Website, Business Segment)
Table 113 Linc Energy Ltd.: Product Benchmarking
Table 114 CTCI Corporation: Key Details, (CEO, HQ, Revenue, Founded, No. of Employees, Company Type, Website, Business Segment)
Table 115 CTCI Corporation: Product Benchmarking
Table 116 Sedin Engineering Co Ltd: Key Details, (CEO, HQ, Revenue, Founded, No. of Employees, Company Type, Website, Business Segment)
Table 117 Sedin Engineering Co Ltd: Product Benchmarking
Table 118 Wison Group: Key Details, (CEO, HQ, Revenue, Founded, No. of Employees, Company Type, Website, Business Segment)
Table 119 Wison Group: Product Benchmarking
図の一覧
Figure 1 Coal Gasification Market Segmentation
Figure 2 Coal Gasification Market by Gasifier Type: Market Attractiveness Index
Figure 3 Coal Gasification Market by End-User: Market Attractiveness Index
Figure 4 Coal Gasification Market by Feedstock: Market Attractiveness Index
Figure 5 Coal Gasification Market by Technology: Market Attractiveness Index
Figure 6 Coal Gasification Market Attractiveness Index by Region
Figure 7 Coal Gasification Market: Market Dynamics
Figure 8 Coal Gasification Market: Porter’s Five Forces Analysis
Figure 9 Global Coal Gasification Market Share Forecast by COVID, 2023-2033 (%)
Figure 10 Global Coal Gasification Market Forecast, 2023-2033 (US$ Bn, AGR (%)) (V-Shaped Recovery Scenario)
Figure 11 Global Coal Gasification Market by Region, 2023-2033 (US$ Bn, AGR (%)) (V-Shaped Recovery Scenario)
Figure 12 Global Coal Gasification Market Forecast, 2023-2033 (US$ Bn, AGR (%)) (W-Shaped Recovery Scenario)
Figure 13 Global Coal Gasification Market by Region, 2023-2033 (US$ Bn, AGR (%)) (W-Shaped Recovery Scenario)
Figure 14 Global Coal Gasification Market Forecast, 2023-2033 (US$ Bn, AGR (%)) (U-Shaped Recovery Scenario)
Figure 15 Global Coal Gasification Market by Region, 2023-2033 (US$ Bn, AGR (%)) (U-Shaped Recovery Scenario)
Figure 16 Global Coal Gasification Market Forecast, 2023-2033 (US$ Bn, AGR (%)) (L-Shaped Recovery Scenario)
Figure 17 Global Coal Gasification Market by Region, 2023-2033 (US$ Bn, AGR (%)) (L-Shaped Recovery Scenario)
Figure 18 Coal Gasification Market: PEST Analysis
Figure 19 Coal Gasification Market by Gasifier Type: Market Attractiveness Index
Figure 20 Global Coal Gasification Market by Gasifier Type, 2023-2033 (US$ Bn, AGR (%))
Figure 21 Coal Gasification Market Share Forecast by Gasifier Type, 2023, 2028, 2033 (%)
Figure 22 Moving Bed Gasifier Market by Region, 2023-2033 (US$ Bn, AGR (%))
Figure 23 Moving Bed Gasifier Market Share Forecast by Region, 2023 & 2033 (%)
Figure 24 Fluidized Bed Gasifier Market by Region, 2023-2033 (US$ Bn, AGR (%))
Figure 25 Fluidized Bed Gasifier Market Share Forecast by Region, 2023 & 2033 (%)
Figure 26 Entrained Flow Gasifier Market by Region, 2023-2033 (US$ Bn, AGR (%))
Figure 27 Entrained Flow Gasifier Market Share Forecast by Region, 2023 & 2033 (%)
Figure 28 Coal Gasification Market by End-User: Market Attractiveness Index
Figure 29 Global Coal Gasification Market by End-User, 2023-2033 (US$ Bn, AGR (%))
Figure 30 Coal Gasification Market Share Forecast by End-User, 2023, 2028, 2033 (%)
Figure 31 Chemicals Market by Region, 2023-2033 (US$ Bn, AGR (%))
Figure 32 Chemicals Market Share Forecast by Region, 2023 & 2033 (%)
Figure 33 Power Generation Market by Region, 2023-2033 (US$ Bn, AGR (%))
Figure 34 Power Generation Market Share Forecast by Region, 2023 & 2033 (%)
Figure 35 Liquid Fuels Market by Region, 2023-2033 (US$ Bn, AGR (%))
Figure 36 Liquid Fuels Market Share Forecast by Region, 2023 & 2033 (%)
Figure 37 Other End-User Market by Region, 2023-2033 (US$ Bn, AGR (%))
Figure 38 Other End-User Market Share Forecast by Region, 2023 & 2033 (%)
Figure 39 Coal Gasification Market by Feedstock: Market Attractiveness Index
Figure 40 Global Coal Gasification Market by Feedstock, 2023-2033 (US$ Bn, AGR (%))
Figure 41 Coal Gasification Market Share Forecast by Feedstock, 2023, 2028, 2033 (%)
Figure 42 Bituminous Coal Market by Region, 2023-2033 (US$ Bn, AGR (%))
Figure 43 Bituminous Coal Market Share Forecast by Region, 2023 & 2033 (%)
Figure 44 Sub-bituminous Coal Market by Region, 2023-2033 (US$ Bn, AGR (%))
Figure 45 Sub-bituminous Coal Market Share Forecast by Region, 2023 & 2033 (%)
Figure 46 Petroleum Coke Market by Region, 2023-2033 (US$ Bn, AGR (%))
Figure 47 Petroleum Coke Market Share Forecast by Region, 2023 & 2033 (%)
Figure 48 Biomass Market by Region, 2023-2033 (US$ Bn, AGR (%))
Figure 49 Biomass Market Share Forecast by Region, 2023 & 2033 (%)
Figure 50 Other Feedstock Market by Region, 2023-2033 (US$ Bn, AGR (%))
Figure 51 Other Feedstock Market Share Forecast by Region, 2023 & 2033 (%)
Figure 52 Coal Gasification Market by Technology: Market Attractiveness Index
Figure 53 Global Coal Gasification Market by Technology, 2023-2033 (US$ Bn, AGR (%))
Figure 54 Coal Gasification Market Share Forecast by Technology, 2023, 2028, 2033 (%)
Figure 55 Integrated Gasification Combined Cycle (IGCC) Market by Region, 2023-2033 (US$ Bn, AGR (%))
Figure 56 Integrated Gasification Combined Cycle (IGCC) Market Share Forecast by Region, 2023 & 2033 (%)
Figure 57 Chemical Looping Gasification (CLG) Market by Region, 2023-2033 (US$ Bn, AGR (%))
Figure 58 Chemical Looping Gasification (CLG) Market Share Forecast by Region, 2023 & 2033 (%)
Figure 59 Hydrogen from Coal Process (HyCO) Market by Region, 2023-2033 (US$ Bn, AGR (%))
Figure 60 Hydrogen from Coal Process (HyCO) Market Share Forecast by Region, 2023 & 2033 (%)
Figure 61 Coal-to-Liquids (CTL) Market by Region, 2023-2033 (US$ Bn, AGR (%))
Figure 62 Coal-to-Liquids (CTL) Market Share Forecast by Region, 2023 & 2033 (%)
Figure 63 Polygeneration Market by Region, 2023-2033 (US$ Bn, AGR (%))
Figure 64 Polygeneration Market Share Forecast by Region, 2023 & 2033 (%)
Figure 65 Other Technologies Market by Region, 2023-2033 (US$ Bn, AGR (%))
Figure 66 Other Technologies Market Share Forecast by Region, 2023 & 2033 (%)
Figure 67 Coal Gasification Market Forecast by Region 2023 and 2033 (Revenue, CAGR%)
Figure 68 Coal Gasification Market Share Forecast by Region 2023, 2028, 2033 (%)
Figure 69 Global Coal Gasification Market Forecast, 2023-2033 (US$ Bn, AGR (%))
Figure 70 Global Coal Gasification Market by Region, 2023-2033 (US$ Bn, AGR (%))
Figure 71 North America Coal Gasification Market Attractiveness Index
Figure 72 North America Coal Gasification Market by Region, 2023, 2028 & 2033 (US$ Billion)
Figure 73 North America Coal Gasification Market by Value, 2023-2033 (US$ Bn, AGR (%))
Figure 74 North America Coal Gasification Market by Country, 2023-2033 (US$ Bn, AGR (%))
Figure 75 North America Coal Gasification Market Share Forecast by Country, 2023-2033 (%)
Figure 76 North America Coal Gasification Market by Gasifier Type, 2023-2033 (US$ Bn, AGR (%))
Figure 77 North America Coal Gasification Market Share Forecast Gasifier Type, 2023 & 2033 (%)
Figure 78 North America Coal Gasification Market by End-User, 2023-2033 (US$ Bn, AGR (%))
Figure 79 North America Coal Gasification Market Share Forecast by End-User, 2023 & 2033 (%)
Figure 80 North America Coal Gasification Market by Feedstock, 2023-2033 (US$ Bn, AGR (%))
Figure 81 North America Coal Gasification Market Share Forecast by Feedstock, 2023 & 2033 (%)
Figure 82 North America Coal Gasification Market by Technology, 2023-2033 (US$ Bn, AGR (%))
Figure 83 North America Coal Gasification Market Share Forecast by Technology, 2023 & 2033 (%)
Figure 84 US Coal Gasification Market by Value, 2023-2033 (US$ Bn, AGR (%))
Figure 85 Canada Coal Gasification Market by Value, 2023-2033 (US$ Bn, AGR (%))
Figure 86 Europe Coal Gasification Market Attractiveness Index
Figure 87 Europe Coal Gasification Market by Region, 2023, 2028 & 2033 (US$ Billion)
Figure 88 Europe Coal Gasification Market by Value, 2023-2033 (US$ Bn, AGR (%))
Figure 89 Europe Coal Gasification Market by Country, 2023-2033 (US$ Bn, AGR (%))
Figure 90 Europe Coal Gasification Market Share Forecast by Country, 2023 & 2033 (%)
Figure 91 Europe Coal Gasification Market by Gasifier Type, 2023-2033 (US$ Bn, AGR (%))
Figure 92 Europe Coal Gasification Market Share Forecast Gasifier Type, 2023 & 2033 (%)
Figure 93 Europe Coal Gasification Market by End-User, 2023-2033 (US$ Bn, AGR (%))
Figure 94 Europe Coal Gasification Market Share Forecast by End-User, 2023 & 2033 (%)
Figure 95 Europe Coal Gasification Market by Feedstock, 2023-2033 (US$ Bn, AGR (%))
Figure 96 Europe Coal Gasification Market Share Forecast by Feedstock, 2023 & 2033 (%)
Figure 97 Europe Coal Gasification Market by Technology, 2023-2033 (US$ Bn, AGR (%))
Figure 98 Europe Coal Gasification Market Share Forecast by Technology, 2023 & 2033 (%)
Figure 99 Germany Coal Gasification Market by Value, 2023-2033 (US$ Bn, AGR (%))
Figure 100 UK Coal Gasification Market by Value, 2023-2033 (US$ Bn, AGR (%))
Figure 101 France Coal Gasification Market by Value, 2023-2033 (US$ Bn, AGR (%))
Figure 102 Italy Coal Gasification Market by Value, 2023-2033 (US$ Bn, AGR (%))
Figure 103 Russia Coal Gasification Market by Value, 2023-2033 (US$ Bn, AGR (%))
Figure 104 Rest of Europe Coal Gasification Market by Value, 2023-2033 (US$ Bn, AGR (%))
Figure 105 Asia-Pacific Coal Gasification Market Attractiveness Index
Figure 106 Asia-Pacific Coal Gasification Market by Region, 2023, 2028 & 2033 (US$ Billion)
Figure 107 Asia-Pacific Coal Gasification Market by Value, 2023-2033 (US$ Bn, AGR (%))
Figure 108 Asia-Pacific Coal Gasification Market by Country, 2023-2033 (US$ Bn, AGR (%))
Figure 109 Asia-Pacific Coal Gasification Market Share Forecast by Country, 2023 & 2033 (%)
Figure 110 Asia-Pacific Coal Gasification Market by Gasifier Type, 2023-2033 (US$ Bn, AGR (%))
Figure 111 Asia-Pacific Coal Gasification Market Share Forecast Gasifier Type, 2023 & 2033 (%)
Figure 112 Asia-Pacific Coal Gasification Market by End-User, 2023-2033 (US$ Bn, AGR (%))
Figure 113 Asia-Pacific Coal Gasification Market Share Forecast by End-User, 2023 & 2033 (%)
Figure 114 Asia-Pacific Coal Gasification Market by Feedstock, 2023-2033 (US$ Bn, AGR (%))
Figure 115 Asia-Pacific Coal Gasification Market Share Forecast by Feedstock, 2023 & 2033 (%)
Figure 116 Asia-Pacific Coal Gasification Market by Technology, 2023-2033 (US$ Bn, AGR (%))
Figure 117 Asia-Pacific Coal Gasification Market Share Forecast by Technology, 2023 & 2033 (%)
Figure 118 China Coal Gasification Market by Value, 2023-2033 (US$ Bn, AGR (%))
Figure 119 India Coal Gasification Market by Value, 2023-2033 (US$ Bn, AGR (%))
Figure 120 Japan Coal Gasification Market by Value, 2023-2033 (US$ Bn, AGR (%))
Figure 121 South Korea Coal Gasification Market by Value, 2023-2033 (US$ Bn, AGR (%))
Figure 122 Australia Coal Gasification Market by Value, 2023-2033 (US$ Bn, AGR (%))
Figure 123 Rest of Asia-Pacific Coal Gasification Market by Value, 2023-2033 (US$ Bn, AGR (%))
Figure 124 Middle East and Africa Coal Gasification Market Attractiveness Index
Figure 125 Middle East and Africa Coal Gasification Market by Region, 2023, 2028 & 2033 (US$ Billion)
Figure 126 Middle East & Africa Coal Gasification Market by Value, 2023-2033 (US$ Bn, AGR (%))
Figure 127 Middle East & Africa Coal Gasification Market by Country, 2023-2033 (US$ Bn, AGR (%))
Figure 128 Middle East and Africa Coal Gasification Market Share Forecast by Country, 2023 & 2033 (%)
Figure 129 Middle East & Africa Coal Gasification Market by Gasifier Type, 2023-2033 (US$ Bn, AGR (%))
Figure 130 Middle East and Africa Coal Gasification Market Share Forecast Gasifier Type, 2023 & 2033 (%)
Figure 131 Middle East & Africa Coal Gasification Market by End-User, 2023-2033 (US$ Bn, AGR (%))
Figure 132 Middle East and Africa Coal Gasification Market Share Forecast by End-User, 2023 & 2033 (%)
Figure 133 Middle East & Africa Coal Gasification Market by Feedstock, 2023-2033 (US$ Bn, AGR (%))
Figure 134 Middle East and Africa Coal Gasification Market Share Forecast by Feedstock, 2023 & 2033 (%)
Figure 135 Middle East & Africa Coal Gasification Market by Technology, 2023-2033 (US$ Bn, AGR (%))
Figure 136 Middle East and Africa Coal Gasification Market Share Forecast by Technology, 2023 & 2033 (%)
Figure 137 GCC Coal Gasification Market by Value, 2023-2033 (US$ Bn, AGR (%))
Figure 138 South Africa Coal Gasification Market by Value, 2023-2033 (US$ Bn, AGR (%))
Figure 139 Rest of Middle East & Africa Coal Gasification Market by Value, 2023-2033 (US$ Bn, AGR (%))
Figure 140 Latin America Coal Gasification Market Attractiveness Index
Figure 141 Latin America Coal Gasification Market by Region, 2023, 2028 & 2033 (US$ Billion)
Figure 142 Latin America Coal Gasification Market by Value, 2023-2033 (US$ Bn, AGR (%))
Figure 143 Latin America Coal Gasification Market by Country, 2023-2033 (US$ Bn, AGR (%))
Figure 144 Latin America Coal Gasification Market Share Forecast by Country, 2023 & 2033 (%)
Figure 145 Latin America Coal Gasification Market by Gasifier Type, 2023-2033 (US$ Bn, AGR (%))
Figure 146 Latin America Coal Gasification Market Share Forecast Gasifier Type, 2023 & 2033 (%)
Figure 147 Latin America Coal Gasification Market by End-User, 2023-2033 (US$ Bn, AGR (%))
Figure 148 Latin America Coal Gasification Market Share Forecast by End-User, 2023 & 2033 (%)
Figure 149 Latin America Coal Gasification Market by Feedstock, 2023-2033 (US$ Bn, AGR (%))
Figure 150 Latin America Coal Gasification Market Share Forecast by Feedstock, 2023 & 2033 (%)
Figure 151 Latin America Coal Gasification Market by Technology, 2023-2033 (US$ Bn, AGR (%))
Figure 152 Latin America Coal Gasification Market Share Forecast by Technology, 2023 & 2033 (%)
Figure 153 Brazil Coal Gasification Market by Value, 2023-2033 (US$ Bn, AGR (%))
Figure 154 Mexico Coal Gasification Market by Value, 2023-2033 (US$ Bn, AGR (%))
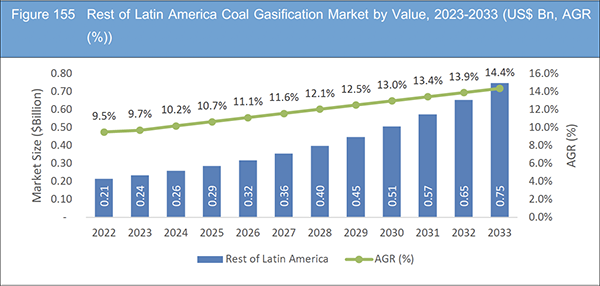
Figure 155 Rest of Latin America Coal Gasification Market by Value, 2023-2033 (US$ Bn, AGR (%))
Figure 156 Coal Gasification Market: Company Revenue Share, 2022
Figure 157 General Electric Company: Net Revenue, 2018-2022 (US$ million, AGR%)
Figure 158 General Electric Company: R&D, 2018-2022 (US$ million, AGR%)
Figure 159 General Electric Company: Regional Revenue Shares, 2022 (%)
Figure 160 General Electric Company: Business Segment Revenue Shares, 2022 (%)
Figure 161 Air Liquide: Net Revenue, 2018-2022 (US$ million, AGR%)
Figure 162 Air Liquide: R&D, 2018-2022 (US$ million, AGR%)
Figure 163 Air Liquide: Regional Revenue Shares, 2022 (%)
Figure 164 Air Liquide: Business Segment Revenue Shares, 2022 (%)
Figure 165 Mitsubishi Heavy Industries, Ltd.: Net Revenue, 2018-2022 (US$ million, AGR%)
Figure 166 Mitsubishi Heavy Industries, Ltd.: R&D, 2018-2022 (US$ million, AGR%)
Figure 167 Mitsubishi Heavy Industries, Ltd.: Regional Revenue Shares, 2022 (%)
Figure 168 Mitsubishi Heavy Industries, Ltd.: Business Segment Revenue Shares, 2022 (%)
Figure 169 Royal Dutch Shell Plc: Net Revenue, 2018-2022 (US$ million, AGR%)
Figure 170 Royal Dutch Shell Plc: R&D, 2018-2022 (US$ million, AGR%)
Figure 171 Royal Dutch Shell Plc: Regional Revenue Shares, 2022 (%)
Figure 172 Royal Dutch Shell Plc: Business Segment Revenue Shares, 2022 (%)
Figure 173 Siemens AG: Net Revenue, 2018-2022 (US$ million, AGR%)
Figure 174 Siemens AG: R&D, 2018-2022 (US$ million, AGR%)
Figure 175 Siemens AG: Regional Revenue Shares, 2022 (%)
Figure 176 Siemens AG: Business Segment Revenue Shares, 2022 (%)
Figure 177 Linde plc: Net Revenue, 2018-2022 (US$ million, AGR%)
Figure 178 Linde plc: R&D, 2018-2022 (US$ million, AGR%)
Figure 179 Linde plc: Regional Revenue Shares, 2022 (%)
Figure 180 Linde plc: Business Segment Revenue Shares, 2022 (%)
Figure 181 KBR, Inc.: Net Revenue, 2018-2022 (US$ million, AGR%)
Figure 182 KBR, Inc.: Regional Revenue Shares, 2021 (%)
Figure 183 KBR, Inc.: Business Segment Revenue Shares, 2021 (%)
Figure 184 Sasol Limited: Net Revenue, 2018-2022 (US$ million, AGR%)
Figure 185 Sasol Limited: R&D, 2018-2022 (US$ million, AGR%)
Figure 186 Sasol Limited: Regional Revenue Shares, 2023 (%)
Figure 187 Sasol Limited: Business Segment Revenue Shares, 2022 (%)
Figure 188 CTCI Corporation: Net Revenue, 2017-2021 (US$ million, AGR%)
Figure 189 CTCI Corporation: R&D, 2017-2021 (US$ million, AGR%)
Figure 190 CTCI Corporation: Regional Revenue Shares, 2021 (%)
Figure 191 CTCI Corporation: Business Segment Revenue Shares, 2021 (%)
ページTOPに戻る
Summary
Report Details
The Coal Gasification Market Report 2023-2033: This report will prove invaluable to leading firms striving for new revenue pockets if they wish to better understand the industry and its underlying dynamics. It will be useful for companies that would like to expand into different industries or to expand their existing operations in a new region.
The Growing Global Demand for Energy Is a Significant Driving Factor for the Coal Gasification Market
he growing global demand for energy is a significant driving factor for the coal gasification market. As countries seek to meet their energy needs, coal gasification offers a reliable and efficient method for converting coal into clean-burning syngas. Rapid industrialization in emerging economies like China and India has led to a surge in energy consumption. Coal gasification provides an opportunity to utilize abundant coal reserves to meet the rising energy demand.
Stricter Environmental Regulations and the Need to Reduce Greenhouse Gas Emissions
Stricter environmental regulations and the need to reduce greenhouse gas emissions are driving the adoption of cleaner energy sources. Coal gasification helps mitigate environmental concerns by enabling the capture and utilization of carbon dioxide (CO2) emissions. Countries like the United States and China have implemented regulations to curb emissions. Coal gasification technologies such as carbon capture and storage (CCS) or carbon capture, utilization, and storage (CCUS) can capture CO2 and reduce its impact on the environment.
What Questions Should You Ask before Buying a Market Research Report?
• How is the coal gasification market evolving?
• What is driving and restraining the coal gasification market?
• How will each coal gasification submarket segment grow over the forecast period and how much revenue will these submarkets account for in 2033?
• How will the market shares for each coal gasification submarket develop from 2023 to 2033?
• What will be the main driver for the overall market from 2023 to 2033?
• Will leading coal gasification markets broadly follow the macroeconomic dynamics, or will individual national markets outperform others?
• How will the market shares of the national markets change by 2033 and which geographical region will lead the market in 2033?
• Who are the leading players and what are their prospects over the forecast period?
• What are the coal gasification projects for these leading companies?
• How will the industry evolve during the period between 2023 and 2033? What are the implications of coal gasification projects taking place now and over the next 10 years?
• Is there a greater need for product commercialisation to further scale the coal gasification market?
• Where is the coal gasification market heading and how can you ensure you are at the forefront of the market?
• What are the best investment options for new product and service lines?
• What are the key prospects for moving companies into a new growth path and C-suite?
You need to discover how this will impact the coal gasification market today, and over the next 10 years:
• Our 333-page report provides 119 tables and 191 charts/graphs exclusively to you.
• The report highlights key lucrative areas in the industry so you can target them – NOW.
• It contains in-depth analysis of global, regional and national sales and growth.
• It highlights for you the key successful trends, changes and revenue projections made by your competitors.
This report tells you TODAY how the coal gasification market will develop in the next 10 years, and in line with the variations in COVID-19 economic recession and bounce. This market is more critical now than at any point over the last 10 years.
Forecasts to 2033 and other analyses reveal commercial prospects
• In addition to revenue forecasting to 2033, our new study provides you with recent results, growth rates, and market shares.
• You will find original analyses, with business outlooks and developments.
• Discover qualitative analyses (including market dynamics, drivers, opportunities, restraints and challenges), cost structure, impact of rising coal gasification prices and recent developments.
This report includes data analysis and invaluable insight into how COVID-19 will affect the industry and your company. Four COVID-19 recovery patterns and their impact, namely, “V”, “L”, “W” and “U” are discussed in this report.
Segments Covered in the Report
Market Segment by Gasifier Type
• Moving Bed Gasifier
• Fluidized Bed Gasifier
• Entrained Flow Gasifier
Market Segment by End-User
• Chemicals
• Power Generation
• Liquid Fuels
• Other End-User
Market Segment by Feedstock
• Bituminous Coal
• Sub-bituminous Coal
• Petroleum Coke
• Biomass
• Other Feedstock
Market Segment by Technology
• Integrated Gasification Combined Cycle (IGCC)
• Chemical Looping Gasification (CLG)
• Hydrogen from Coal Process (HyCO)
• Coal-to-Liquids (CTL)
• Polygeneration
• Other Technologies
In addition to the revenue predictions for the overall world market and segments, you will also find revenue forecasts for four regional and 20 leading national markets:
North America
• U.S.
• Canada
Europe
• Germany
• Russia
• United Kingdom
• France
• Italy
• Rest of Europe
Asia Pacific
• China
• Japan
• India
• Australia
• South Korea
• Rest of Asia Pacific
Latin America
• Brazil
• Mexico
• Rest of Latin America
Middle East & Africa
• GCC
• South Africa
• Rest of Middle East & Africa
The report also includes profiles and for some of the leading companies in the Coal Gasification Market, 2023 to 2033, with a focus on this segment of these companies’ operations.
Leading companies and the potential for market growth
• Air Liquide
• CTCI Corporation
• Foster Wheeler AG
• General Electric Company
• KBR, Inc.
• Linc Energy Ltd.
• Linde plc
• Mitsubishi Heavy Industries Ltd
• Royal Dutch Shell Plc.
• Sasol Limited
• Sedin Engineering Co Ltd
• Shanxi Lu’an Mining Group Co., Ltd.
• Siemens AG
• Wison Group
• Xinwen Mining Group Co. Ltd
Overall world revenue for Coal Gasification Market, 2023 to 2033 in terms of value the market will surpass US$11.08 billion in 2023, our work calculates. We predict strong revenue growth through to 2033. Our work identifies which organisations hold the greatest potential. Discover their capabilities, progress, and commercial prospects, helping you stay ahead.
How will the Coal Gasification Market, 2023 to 2033 report help you?
In summary, our 330+ page report provides you with the following knowledge:
• Revenue forecasts to 2033 for Coal Gasification Market, 2023 to 2033 Market, with forecasts for gasifier type, end-user, feedstock, and technology, each forecast at a global and regional level – discover the industry’s prospects, finding the most lucrative places for investments and revenues.
• Revenue forecasts to 2033 for four regional and 20 key national markets – See forecasts for the Coal Gasification Market, 2023 to 2033 market in North America, Europe, Asia-Pacific, Latin America and Middle East & Africa. Also forecasted is the market in the US, Canada, Brazil, Germany, France, UK, Italy, China, India, Japan, and Australia among other prominent economies.
• Prospects for established firms and those seeking to enter the market – including company profiles for 15 of the major companies involved in the Coal Gasification Market, 2023 to 2033.
Find quantitative and qualitative analyses with independent predictions. Receive information that only our report contains, staying informed with invaluable business intelligence.
Information found nowhere else
With our new report, you are less likely to fall behind in knowledge or miss out on opportunities. See how our work could benefit your research, analyses, and decisions. Visiongain’s study is for everybody needing commercial analyses for the Coal Gasification Market, 2023 to 2033, market-leading companies. You will find data, trends and predictions.
ページTOPに戻る
Table of Contents
Table of Contents
1 Report Overview
1.1 Objectives of the Study
1.2 Introduction to Coal Gasification Market
1.3 What This Report Delivers
1.4 Why You Should Read This Report
1.5 Key Questions Answered by This Analytical Report
1.6 Who Is This Report for?
1.7 Methodology
1.7.1 Market Definitions
1.7.2 Market Evaluation & Forecasting Methodology
1.7.3 Data Validation
1.7.3.1 Primary Research
1.7.3.2 Secondary Research
1.8 Frequently Asked Questions (FAQs)
1.9 Associated Visiongain Reports
1.10 About Visiongain
2 Executive Summary
3 Market Overview
3.1 Key Findings
3.2 Market Dynamics
3.2.1 Market Driving Factors
3.2.1.1 High Demand for Clean Energy to Foster Gasification Market Growth
3.2.1.2 Expansion of the Coal Industry to Boost Growth
3.2.1.3 The Escalated Use of USG and the Flexibility of Feedstock Driving the Market Growth
3.2.2 Market Restraining Factors
3.2.2.1 High Installation Cost to Hinder Market Growth
3.2.2.2 The Negative Impact of Underground Drilling Activities of Coal Gasification on the Environment
3.2.2.3 A Strong Call for Oil from the Petrochemical Sector Is Predicted to Hamper the Expansion of Global Coal Gasification Market
3.2.3 Market Opportunities
3.2.3.1 The Utilization of Coal Gasification to Produce Hydrogen Gas Presents Promising Opportunities for the Coal Gasification Market
3.2.3.2 Retrofitting Existing Coal-Fired Power Plants with Gasification Technology Offers an Opportunity
3.2.3.3 Market Players Can Tap into the Growing Energy Demands of Emerging Economies by Establishing Coal Gasification Projects
3.3 Porter’s Five Forces Analysis
3.3.1 Bargaining Power of Suppliers (Low to Medium)
3.3.2 Bargaining Power of Buyers (Moderate to High)
3.3.3 Competitive Rivalry (Moderate to High)
3.3.4 Threat from Substitutes (High)
3.3.5 Threat of New Entrants (Low)
3.4 COVID-19 Impact Analysis
3.5 PEST Analysis
4 Coal Gasification Market Analysis by Gasifier Type
4.1 Key Findings
4.2 Gasifier Type Segment: Market Attractiveness Index
4.3 Coal Gasification Market Size Estimation and Forecast by Gasifier Type
4.4 Moving Bed Gasifier
4.4.1 Market Size by Region, 2023-2033 (US$ Billion)
4.4.2 Market Share by Region, 2023 & 2033 (%)
4.5 Fluidized Bed Gasifier
4.5.1 Market Size by Region, 2023-2033 (US$ Billion)
4.5.2 Market Share by Region, 2023 & 2033 (%)
4.6 Entrained Flow Gasifier
4.6.1 Market Size by Region, 2023-2033 (US$ Billion)
4.6.2 Market Share by Region, 2023 & 2033 (%)
5 Coal Gasification Market Analysis by End-User
5.1 Key Findings
5.2 End-User Segment: Market Attractiveness Index
5.3 Coal Gasification Market Size Estimation and Forecast by End-User
5.4 Chemicals
5.4.1 Market Size by Region, 2023-2033 (US$ Billion)
5.4.2 Market Share by Region, 2023 & 2033 (%)
5.5 Power Generation
5.5.1 Market Size by Region, 2023-2033 (US$ Billion)
5.5.2 Market Share by Region, 2023 & 2033 (%)
5.6 Liquid Fuels
5.6.1 Market Size by Region, 2023-2033 (US$ Billion)
5.6.2 Market Share by Region, 2023 & 2033 (%)
5.7 Other End-User
5.7.1 Market Size by Region, 2023-2033 (US$ Billion)
5.7.2 Market Share by Region, 2023 & 2033 (%)
6 Coal Gasification Market Analysis by Feedstock
6.1 Key Findings
6.2 Feedstock Segment: Market Attractiveness Index
6.3 Coal Gasification Market Size Estimation and Forecast by Feedstock
6.4 Bituminous Coal
6.4.1 Market Size by Region, 2023-2033 (US$ Billion)
6.4.2 Market Share by Region, 2023 & 2033 (%)
6.5 Sub-bituminous Coal
6.5.1 Market Size by Region, 2023-2033 (US$ Billion)
6.5.2 Market Share by Region, 2023 & 2033 (%)
6.6 Petroleum Coke
6.6.1 Market Size by Region, 2023-2033 (US$ Billion)
6.6.2 Market Share by Region, 2023 & 2033 (%)
6.7 Biomass
6.7.1 Market Size by Region, 2023-2033 (US$ Billion)
6.7.2 Market Share by Region, 2023 & 2033 (%)
6.8 Other Feedstock
6.8.1 Market Size by Region, 2023-2033 (US$ Billion)
6.8.2 Market Share by Region, 2023 & 2033 (%)
7 Coal Gasification Market Analysis by Technology
7.1 Key Findings
7.2 Technology Segment: Market Attractiveness Index
7.3 Coal Gasification Market Size Estimation and Forecast by Technology
7.4 Integrated Gasification Combined Cycle (IGCC)
7.4.1 Market Size by Region, 2023-2033 (US$ Billion)
7.4.2 Market Share by Region, 2023 & 2033 (%)
7.5 Chemical Looping Gasification (CLG)
7.5.1 Market Size by Region, 2023-2033 (US$ Billion)
7.5.2 Market Share by Region, 2023 & 2033 (%)
7.6 Hydrogen from Coal Process (HyCO)
7.6.1 Market Size by Region, 2023-2033 (US$ Billion)
7.6.2 Market Share by Region, 2023 & 2033 (%)
7.7 Coal-to-Liquids (CTL)
7.7.1 Market Size by Region, 2023-2033 (US$ Billion)
7.7.2 Market Share by Region, 2023 & 2033 (%)
7.8 Polygeneration
7.8.1 Market Size by Region, 2023-2033 (US$ Billion)
7.8.2 Market Share by Region, 2023 & 2033 (%)
7.9 Other Technologies
7.9.1 Market Size by Region, 2023-2033 (US$ Billion)
7.9.2 Market Share by Region, 2023 & 2033 (%)
8 Coal Gasification Market Analysis by Region
8.1 Key Findings
8.2 Regional Market Size Estimation and Forecast
9 North America Coal Gasification Market Analysis
9.1 Key Findings
9.2 North America Coal Gasification Market Attractiveness Index
9.3 North America Coal Gasification Market by Country, 2023, 2028 & 2033 (US$ Billion)
9.4 North America Coal Gasification Market Size Estimation and Forecast
9.5 North America Coal Gasification Market Size Estimation and Forecast by Country
9.6 North America Coal Gasification Market Size Estimation and Forecast by Gasifier Type
9.7 North America Coal Gasification Market Size Estimation and Forecast by End-User
9.8 North America Coal Gasification Market Size Estimation and Forecast by Feedstock
9.9 North America Coal Gasification Market Size Estimation and Forecast by Technology
9.10 U.S. Coal Gasification Market Analysis
9.11 Canada Coal Gasification Market Analysis
10 Europe Coal Gasification Market Analysis
10.1 Key Findings
10.2 Europe Coal Gasification Market Attractiveness Index
10.3 Europe Coal Gasification Market by Country, 2023, 2028 & 2033 (US$ Billion)
10.4 Europe Coal Gasification Market Size Estimation and Forecast
10.5 Europe Coal Gasification Market Size Estimation and Forecast by Country
10.6 Europe Coal Gasification Market Size Estimation and Forecast by Gasifier Type
10.7 Europe Coal Gasification Market Size Estimation and Forecast by End-User
10.8 Europe Coal Gasification Market Size Estimation and Forecast by Feedstock
10.9 Europe Coal Gasification Market Size Estimation and Forecast by Technology
10.10 Germany Coal Gasification Market Analysis
10.11 UK Coal Gasification Market Analysis
10.12 France Coal Gasification Market Analysis
10.13 Italy Coal Gasification Market Analysis
10.14 Russia Coal Gasification Market Analysis
10.15 Rest of Europe Coal Gasification Market Analysis
11 Asia-Pacific Coal Gasification Market Analysis
11.1 Key Findings
11.2 Asia-Pacific Coal Gasification Market Attractiveness Index
11.3 Asia-Pacific Coal Gasification Market by Country, 2023, 2028 & 2033 (US$ Billion)
11.4 Asia-Pacific Coal Gasification Market Size Estimation and Forecast
11.5 Asia-Pacific Coal Gasification Market Size Estimation and Forecast by Country
11.6 Asia-Pacific Coal Gasification Market Size Estimation and Forecast by Gasifier Type
11.7 Asia-Pacific Coal Gasification Market Size Estimation and Forecast by End-User
11.8 Asia-Pacific Coal Gasification Market Size Estimation and Forecast by Feedstock
11.9 Asia-Pacific Coal Gasification Market Size Estimation and Forecast by Technology
11.10 China Coal Gasification Market Analysis
11.11 India Coal Gasification Market Analysis
11.12 Japan Coal Gasification Market Analysis
11.13 South Korea Coal Gasification Market Analysis
11.14 Australia Coal Gasification Market Analysis
11.15 Rest of Asia-Pacific Coal Gasification Market Analysis
12 Middle East and Africa Coal Gasification Market Analysis
12.1 Key Findings
12.2 Middle East and Africa Coal Gasification Market Attractiveness Index
12.3 Middle East and Africa Coal Gasification Market by Country, 2023, 2028 & 2033 (US$ Billion)
12.4 Middle East and Africa Coal Gasification Market Size Estimation and Forecast
12.5 Middle East and Africa Coal Gasification Market Size Estimation and Forecast by Country
12.6 Middle East and Africa Coal Gasification Market Size Estimation and Forecast by Gasifier Type
12.7 Middle East and Africa Coal Gasification Market Size Estimation and Forecast by End-User
12.8 Middle East and Africa Coal Gasification Market Size Estimation and Forecast by Feedstock
12.9 Middle East and Africa Coal Gasification Market Size Estimation and Forecast by Technology
12.10 GCC Coal Gasification Market Analysis
12.11 South Africa Coal Gasification Market Analysis
12.12 Rest of Middle East & Africa Coal Gasification Market Analysis
13 Latin America Coal Gasification Market Analysis
13.1 Key Findings
13.2 Latin America Coal Gasification Market Attractiveness Index
13.3 Latin America Coal Gasification Market by Country, 2023, 2028 & 2033 (US$ Billion)
13.4 Latin America Coal Gasification Market Size Estimation and Forecast
13.5 Latin America Coal Gasification Market Size Estimation and Forecast by Country
13.6 Latin America Coal Gasification Market Size Estimation and Forecast by Gasifier Type
13.7 Latin America Coal Gasification Market Size Estimation and Forecast by End-User
13.8 Latin America Coal Gasification Market Size Estimation and Forecast by Feedstock
13.9 Latin America Coal Gasification Market Size Estimation and Forecast by Technology
13.10 Brazil Coal Gasification Market Analysis
13.11 Mexico Coal Gasification Market Analysis
13.12 Rest of Latin America Coal Gasification Market Analysis
14 Company Profiles
14.1 Competitive Landscape, 2022
14.2 Strategic Outlook
14.3 General Electric Company
14.3.1 Company Snapshot
14.3.2 Company Overview
14.3.3 Financial Analysis
14.3.3.1 Net Revenue, 2018-2022
14.3.3.2 R&D, 2018-2022
14.3.3.3 Regional Revenue Shares, 2022 (%)
14.3.3.4 Business Segment Revenue Shares, 2022 (%)
14.3.4 Product Benchmarking
14.4 Air Liquide
14.4.1 Company Snapshot
14.4.2 Company Overview
14.4.3 Financial Analysis
14.4.3.1 Net Revenue, 2018-2022
14.4.3.2 R&D, 2018-2022
14.4.3.3 Regional Revenue Shares, 2022 (%)
14.4.3.4 Business Segment Revenue Shares, 2022 (%)
14.4.4 Product Benchmarking
14.4.5 Strategic Outlook
14.5 Mitsubishi Heavy Industries Ltd
14.5.1 Company Snapshot
14.5.2 Company Overview
14.5.3 Financial Analysis
14.5.3.1 Net Revenue, 2018-2022
14.5.3.2 R&D, 2018-2022
14.5.3.3 Regional Revenue Shares, 2022 (%)
14.5.3.4 Business Segment Revenue Shares, 2022 (%)
14.5.4 Product Benchmarking
14.5.5 Strategic Outlook
14.6 Royal Dutch Shell Plc.
14.6.1 Company Snapshot
14.6.2 Company Overview
14.6.3 Financial Analysis
14.6.3.1 Net Revenue, 2018-2022
14.6.3.2 R&D, 2018-2022
14.6.3.3 Regional Revenue Shares, 2022 (%)
14.6.3.4 Business Segment Revenue Shares, 2022 (%)
14.6.4 Product Benchmarking
14.6.5 Strategic Outlook
14.7 Siemens AG
14.7.1 Company Snapshot
14.7.2 Company Overview
14.7.3 Financial Analysis
14.7.3.1 Net Revenue, 2018-2022
14.7.3.2 R&D, 2018-2022
14.7.3.3 Regional Revenue Shares, 2022 (%)
14.7.3.4 Business Segment Revenue Shares, 2022 (%)
14.7.4 Product Benchmarking
14.7.5 Strategic Outlook
14.8 Linde plc
14.8.1 Company Snapshot
14.8.2 Company Overview
14.8.3 Financial Analysis
14.8.3.1 Net Revenue, 2018-2022
14.8.3.2 R&D, 2018-2022
14.8.3.3 Regional Revenue Shares, 2022 (%)
14.8.3.4 Business Segment Revenue Shares, 2022 (%)
14.8.4 Product Benchmarking
14.8.5 Strategic Outlook
14.9 KBR, Inc.
14.9.1 Company Snapshot
14.9.2 Company Overview
14.9.3 Financial Analysis
14.9.3.1 Net Revenue, 2018-2022
14.9.3.2 Regional Revenue Shares, 2021 (%)
14.9.3.3 Business Segment Revenue Shares, 2021 (%)
14.9.4 Product Benchmarking
14.10 Sasol Limited
14.10.1 Company Snapshot
14.10.2 Company Overview
14.10.3 Financial Analysis
14.10.3.1 Net Revenue, 2018-2022
14.10.3.2 R&D, 2018-2022
14.10.3.3 Regional Revenue Shares, 2022 (%)
14.10.3.4 Business Segment Revenue Shares, 2022 (%)
14.10.4 Product Benchmarking
14.11 Xinwen Mining Group Co. Ltd
14.11.1 Company Snapshot
14.11.2 Company Overview
14.11.3 Product Benchmarking
14.12 Shanxi Lu'an Mining Group Co., Ltd.
14.12.1 Company Snapshot
14.12.2 Company Overview
14.12.3 Product Benchmarking
14.13 Foster Wheeler AG
14.13.1 Company Snapshot
14.13.2 Company Overview
14.13.3 Product Benchmarking
14.14 Linc Energy Ltd.
14.14.1 Company Snapshot
14.14.2 Company Overview
14.14.3 Product Benchmarking
14.15 CTCI Corporation
14.15.1 Company Snapshot
14.15.2 Company Overview
14.15.3 Financial Analysis
14.15.3.1 Net Revenue, 2017-2021
14.15.3.2 R&D, 2017-2021
14.15.3.3 Regional Revenue Shares, 2021 (%)
14.15.3.4 Business Segment Revenue Shares, 2021 (%)
14.15.4 Product Benchmarking
14.16 Sedin Engineering Co Ltd
14.16.1 Company Snapshot
14.16.2 Company Overview
14.16.3 Product Benchmarking
14.17 Wison Group
14.17.1 Company Snapshot
14.17.2 Company Overview
14.17.3 Product Benchmarking
15 Conclusion and Recommendations
15.1 Concluding Remarks from Visiongain
15.2 Recommendations for Market Players
ページTOPに戻る
List of Tables/Graphs
List of Tables
Table 1 Coal Gasification Market Snapshot, 2023 & 2033 (US$ Billion, CAGR %)
Table 2 Global Coal Gasification Market Forecast, 2023-2033 (US$ Bn, AGR (%), CAGR (%)) (V-Shaped Recovery Scenario)
Table 3 Global Coal Gasification Market by Region, 2023-2033 (US$ Bn, AGR (%), CAGR (%)) (V-Shaped Recovery Scenario)
Table 4 Global Coal Gasification Market Forecast, 2023-2033 (US$ Bn, AGR (%), CAGR (%)) (W-Shaped Recovery Scenario)
Table 5 Global Coal Gasification Market by Region, 2023-2033 (US$ Bn, AGR (%), CAGR (%)) (W-Shaped Recovery Scenario)
Table 6 Global Coal Gasification Market Forecast, 2023-2033 (US$ Bn, AGR (%), CAGR (%)) (U-Shaped Recovery Scenario)
Table 7 Global Coal Gasification Market by Region, 2023-2033 (US$ Bn, AGR (%), CAGR (%)) (U-Shaped Recovery Scenario)
Table 8 Global Coal Gasification Market Forecast, 2023-2033 (US$ Bn, AGR (%), CAGR (%)) (L-Shaped Recovery Scenario)
Table 9 Global Coal Gasification Market by Region, 2023-2033 (US$ Bn, AGR (%), CAGR (%)) (L-Shaped Recovery Scenario)
Table 10 Global Coal Gasification Market by Gasifier Type, 2023-2033 (US$ Bn, AGR (%), CAGR (%))
Table 11 Moving Bed Gasifier Market by Region, 2023-2033 (US$ Bn, AGR (%), CAGR (%))
Table 12 Fluidized Bed Gasifier Market by Region, 2023-2033 (US$ Bn, AGR (%), CAGR (%))
Table 13 Entrained Flow Gasifier Market by Region, 2023-2033 (US$ Bn, AGR (%), CAGR (%))
Table 14 Global Coal Gasification Market by End-User, 2023-2033 (US$ Bn, AGR (%), CAGR (%))
Table 15 Chemicals Market by Region, 2023-2033 (US$ Bn, AGR (%), CAGR (%))
Table 16 Power Generation Market by Region, 2023-2033 (US$ Bn, AGR (%), CAGR (%))
Table 17 Liquid Fuels Market by Region, 2023-2033 (US$ Bn, AGR (%), CAGR (%))
Table 18 Other End-User Market by Region, 2023-2033 (US$ Bn, AGR (%), CAGR (%))
Table 19 Global Coal Gasification Market by Feedstock, 2023-2033 (US$ Bn, AGR (%), CAGR (%))
Table 20 Bituminous Coal Market by Region, 2023-2033 (US$ Bn, AGR (%), CAGR (%))
Table 21 Sub-bituminous Coal Market by Region, 2023-2033 (US$ Bn, AGR (%), CAGR (%))
Table 22 Petroleum Coke Market by Region, 2023-2033 (US$ Bn, AGR (%), CAGR (%))
Table 23 Biomass Market by Region, 2023-2033 (US$ Bn, AGR (%), CAGR (%))
Table 24 Other Feedstock Market by Region, 2023-2033 (US$ Bn, AGR (%), CAGR (%))
Table 25 Global Coal Gasification Market by Technology, 2023-2033 (US$ Bn, AGR (%), CAGR (%))
Table 26 Integrated Gasification Combined Cycle (IGCC) Market by Region, 2023-2033 (US$ Bn, AGR (%), CAGR (%))
Table 27 Chemical Looping Gasification (CLG) Market by Region, 2023-2033 (US$ Bn, AGR (%), CAGR (%))
Table 28 Hydrogen from Coal Process (HyCO) Market by Region, 2023-2033 (US$ Bn, AGR (%), CAGR (%))
Table 29 Coal-to-Liquids (CTL) Market by Region, 2023-2033 (US$ Bn, AGR (%), CAGR (%))
Table 30 Polygeneration Market by Region, 2023-2033 (US$ Bn, AGR (%), CAGR (%))
Table 31 Other Technologies Market by Region, 2023-2033 (US$ Bn, AGR (%), CAGR (%))
Table 32 Global Coal Gasification Market Forecast, 2023-2033 (US$ Bn, AGR (%), CAGR (%))
Table 33 Global Coal Gasification Market by Region, 2023-2033 (US$ Bn, AGR (%), CAGR (%))
Table 34 North America Coal Gasification Market by Value, 2023-2033 (US$ Bn, AGR (%), CAGR (%))
Table 35 North America Coal Gasification Market by Country, 2023-2033 (US$ Bn, AGR (%), CAGR (%))
Table 36 North America Coal Gasification Market by Gasifier Type, 2023-2033 (US$ Bn, AGR (%), CAGR (%))
Table 37 North America Coal Gasification Market by End-User, 2023-2033 (US$ Bn, AGR (%), CAGR (%))
Table 38 North America Coal Gasification Market by Feedstock, 2023-2033 (US$ Bn, AGR (%), CAGR (%))
Table 39 North America Coal Gasification Market by Technology, 2023-2033 (US$ Bn, AGR (%), CAGR (%))
Table 40 US Coal Gasification Market by Value, 2023-2033 (US$ Bn, AGR (%), CAGR (%))
Table 41 Canada Coal Gasification Market by Value, 2023-2033 (US$ Bn, AGR (%), CAGR (%))
Table 42 Europe Coal Gasification Market by Value, 2023-2033 (US$ Bn, AGR (%), CAGR (%))
Table 43 Europe Coal Gasification Market by Country, 2023-2033 (US$ Bn, AGR (%), CAGR (%))
Table 44 Europe Coal Gasification Market by Gasifier Type, 2023-2033 (US$ Bn, AGR (%), CAGR (%))
Table 45 Europe Coal Gasification Market by End-User, 2023-2033 (US$ Bn, AGR (%), CAGR (%))
Table 46 Europe Coal Gasification Market by Feedstock, 2023-2033 (US$ Bn, AGR (%), CAGR (%))
Table 47 Europe Coal Gasification Market by Technology, 2023-2033 (US$ Bn, AGR (%), CAGR (%))
Table 48 Germany Coal Gasification Market by Value, 2023-2033 (US$ Bn, AGR (%), CAGR (%))
Table 49 UK Coal Gasification Market by Value, 2023-2033 (US$ Bn, AGR (%), CAGR (%))
Table 50 France Coal Gasification Market by Value, 2023-2033 (US$ Bn, AGR (%), CAGR (%))
Table 51 Italy Coal Gasification Market by Value, 2023-2033 (US$ Bn, AGR (%), CAGR (%))
Table 52 Russia Coal Gasification Market by Value, 2023-2033 (US$ Bn, AGR (%), CAGR (%))
Table 53 Rest of Europe Coal Gasification Market by Value, 2023-2033 (US$ Bn, AGR (%), CAGR (%))
Table 54 Asia-Pacific Coal Gasification Market by Value, 2023-2033 (US$ Bn, AGR (%), CAGR (%))
Table 55 Asia-Pacific Coal Gasification Market by Country, 2023-2033 (US$ Bn, AGR (%), CAGR (%))
Table 56 Asia-Pacific Coal Gasification Market by Gasifier Type, 2023-2033 (US$ Bn, AGR (%), CAGR (%))
Table 57 Asia-Pacific Coal Gasification Market by End-User, 2023-2033 (US$ Bn, AGR (%), CAGR (%))
Table 58 Asia-Pacific Coal Gasification Market by Feedstock, 2023-2033 (US$ Bn, AGR (%), CAGR (%))
Table 59 Asia-Pacific Coal Gasification Market by Technology, 2023-2033 (US$ Bn, AGR (%), CAGR (%))
Table 60 China Coal Gasification Market by Value, 2023-2033 (US$ Bn, AGR (%), CAGR (%))
Table 61 India Coal Gasification Market by Value, 2023-2033 (US$ Bn, AGR (%), CAGR (%))
Table 62 Japan Coal Gasification Market by Value, 2023-2033 (US$ Bn, AGR (%), CAGR (%))
Table 63 South Korea Coal Gasification Market by Value, 2023-2033 (US$ Bn, AGR (%), CAGR (%))
Table 64 Australia Coal Gasification Market by Value, 2023-2033 (US$ Bn, AGR (%), CAGR (%))
Table 65 Rest of Asia-Pacific Coal Gasification Market by Value, 2023-2033 (US$ Bn, AGR (%), CAGR (%))
Table 66 Middle East & Africa Coal Gasification Market by Value, 2023-2033 (US$ Bn, AGR (%), CAGR (%))
Table 67 Middle East & Africa Coal Gasification Market by Country, 2023-2033 (US$ Bn, AGR (%), CAGR (%))
Table 68 Middle East & Africa Coal Gasification Market by Gasifier Type, 2023-2033 (US$ Bn, AGR (%), CAGR (%))
Table 69 Middle East & Africa Coal Gasification Market by End-User, 2023-2033 (US$ Bn, AGR (%), CAGR (%))
Table 70 Middle East & Africa Coal Gasification Market by Feedstock, 2023-2033 (US$ Bn, AGR (%), CAGR (%))
Table 71 Middle East & Africa Coal Gasification Market by Technology, 2023-2033 (US$ Bn, AGR (%), CAGR (%))
Table 72 GCC Coal Gasification Market by Value, 2023-2033 (US$ Bn, AGR (%), CAGR (%))
Table 73 South Africa Coal Gasification Market by Value, 2023-2033 (US$ Bn, AGR (%), CAGR (%))
Table 74 Rest of Middle East & Africa Coal Gasification Market by Value, 2023-2033 (US$ Bn, AGR (%), CAGR (%))
Table 75 Latin America Coal Gasification Market by Value, 2023-2033 (US$ Bn, AGR (%), CAGR (%))
Table 76 Latin America Coal Gasification Market by Country, 2023-2033 (US$ Bn, AGR (%), CAGR (%))
Table 77 Latin America Coal Gasification Market by Gasifier Type, 2023-2033 (US$ Bn, AGR (%), CAGR (%))
Table 78 Latin America Coal Gasification Market by End-User, 2023-2033 (US$ Bn, AGR (%), CAGR (%))
Table 79 Latin America Coal Gasification Market by Feedstock, 2023-2033 (US$ Bn, AGR (%), CAGR (%))
Table 80 Latin America Coal Gasification Market by Technology, 2023-2033 (US$ Bn, AGR (%), CAGR (%))
Table 81 Brazil Coal Gasification Market by Value, 2023-2033 (US$ Bn, AGR (%), CAGR (%))
Table 82 Mexico Coal Gasification Market by Value, 2023-2033 (US$ Bn, AGR (%), CAGR (%))
Table 83 Rest of Latin America Coal Gasification Market by Value, 2023-2033 (US$ Bn, AGR (%), CAGR (%))
Table 84 Strategic Outlook - Contract
Table 85 General Electric Company: Key Details, (CEO, HQ, Revenue, Founded, No. of Employees, Company Type, Website, Business Segment)
Table 86 General Electric Company: Product Benchmarking
Table 87 Air Liquide: Key Details, (CEO, HQ, Revenue, Founded, No. of Employees, Company Type, Website, Business Segment)
Table 88 Air Liquide: Product Benchmarking
Table 89 Air Liquide: Strategic Outlook
Table 90 Mitsubishi Heavy Industries, Ltd.: Key Details, (CEO, HQ, Revenue, Founded, No. of Employees, Company Type, Website, Business Segment)
Table 91 Mitsubishi Heavy Industries, Ltd.: Product Benchmarking
Table 92 Mitsubishi Heavy Industries, Ltd.: Strategic Outlook
Table 93 Royal Dutch Shell Plc: Key Details, (CEO, HQ, Revenue, Founded, No. of Employees, Company Type, Website, Business Segment)
Table 94 Royal Dutch Shell Plc: Product Benchmarking
Table 95 Royal Dutch Shell Plc: Strategic Outlook
Table 96 Siemens AG: Key Details, (CEO, HQ, Revenue, Founded, No. of Employees, Company Type, Website, Business Segment)
Table 97 Siemens AG: Product Benchmarking
Table 98 Siemens AG: Strategic Outlook
Table 99 Linde plc: Key Details, (CEO, HQ, Revenue, Founded, No. of Employees, Company Type, Website, Business Segment)
Table 100 Linde plc: Product Benchmarking
Table 101 Linde plc: Strategic Outlook
Table 102 KBR, Inc.: Key Details, (CEO, HQ, Revenue, Founded, No. of Employees, Company Type, Website, Business Segment)
Table 103 KBR, Inc.: Product Benchmarking
Table 104 Sasol Limited: Key Details, (CEO, HQ, Revenue, Founded, No. of Employees, Company Type, Website, Business Segment)
Table 105 Sasol Limited: Product Benchmarking
Table 106 Xinwen Mining Group Co., Ltd.: Key Details, (CEO, HQ, Revenue, Founded, No. of Employees, Company Type, Website, Business Segment)
Table 107 Xinwen Mining Group Co.,Ltd: Product Benchmarking
Table 108 Shanxi Lu'an Mining Group Co., Ltd.: Key Details, (CEO, HQ, Revenue, Founded, No. of Employees, Company Type, Website, Business Segment)
Table 109 Shanxi Lu'an Mining Group Co., Ltd.: Product Benchmarking
Table 110 Foster Wheeler AG: Key Details, (CEO, HQ, Revenue, Founded, No. of Employees, Company Type, Website, Business Segment)
Table 111 Foster Wheeler AG: Product Benchmarking
Table 112 Linc Energy Ltd.: Key Details, (CEO, HQ, Revenue, Founded, No. of Employees, Company Type, Website, Business Segment)
Table 113 Linc Energy Ltd.: Product Benchmarking
Table 114 CTCI Corporation: Key Details, (CEO, HQ, Revenue, Founded, No. of Employees, Company Type, Website, Business Segment)
Table 115 CTCI Corporation: Product Benchmarking
Table 116 Sedin Engineering Co Ltd: Key Details, (CEO, HQ, Revenue, Founded, No. of Employees, Company Type, Website, Business Segment)
Table 117 Sedin Engineering Co Ltd: Product Benchmarking
Table 118 Wison Group: Key Details, (CEO, HQ, Revenue, Founded, No. of Employees, Company Type, Website, Business Segment)
Table 119 Wison Group: Product Benchmarking
List of Figures
Figure 1 Coal Gasification Market Segmentation
Figure 2 Coal Gasification Market by Gasifier Type: Market Attractiveness Index
Figure 3 Coal Gasification Market by End-User: Market Attractiveness Index
Figure 4 Coal Gasification Market by Feedstock: Market Attractiveness Index
Figure 5 Coal Gasification Market by Technology: Market Attractiveness Index
Figure 6 Coal Gasification Market Attractiveness Index by Region
Figure 7 Coal Gasification Market: Market Dynamics
Figure 8 Coal Gasification Market: Porter’s Five Forces Analysis
Figure 9 Global Coal Gasification Market Share Forecast by COVID, 2023-2033 (%)
Figure 10 Global Coal Gasification Market Forecast, 2023-2033 (US$ Bn, AGR (%)) (V-Shaped Recovery Scenario)
Figure 11 Global Coal Gasification Market by Region, 2023-2033 (US$ Bn, AGR (%)) (V-Shaped Recovery Scenario)
Figure 12 Global Coal Gasification Market Forecast, 2023-2033 (US$ Bn, AGR (%)) (W-Shaped Recovery Scenario)
Figure 13 Global Coal Gasification Market by Region, 2023-2033 (US$ Bn, AGR (%)) (W-Shaped Recovery Scenario)
Figure 14 Global Coal Gasification Market Forecast, 2023-2033 (US$ Bn, AGR (%)) (U-Shaped Recovery Scenario)
Figure 15 Global Coal Gasification Market by Region, 2023-2033 (US$ Bn, AGR (%)) (U-Shaped Recovery Scenario)
Figure 16 Global Coal Gasification Market Forecast, 2023-2033 (US$ Bn, AGR (%)) (L-Shaped Recovery Scenario)
Figure 17 Global Coal Gasification Market by Region, 2023-2033 (US$ Bn, AGR (%)) (L-Shaped Recovery Scenario)
Figure 18 Coal Gasification Market: PEST Analysis
Figure 19 Coal Gasification Market by Gasifier Type: Market Attractiveness Index
Figure 20 Global Coal Gasification Market by Gasifier Type, 2023-2033 (US$ Bn, AGR (%))
Figure 21 Coal Gasification Market Share Forecast by Gasifier Type, 2023, 2028, 2033 (%)
Figure 22 Moving Bed Gasifier Market by Region, 2023-2033 (US$ Bn, AGR (%))
Figure 23 Moving Bed Gasifier Market Share Forecast by Region, 2023 & 2033 (%)
Figure 24 Fluidized Bed Gasifier Market by Region, 2023-2033 (US$ Bn, AGR (%))
Figure 25 Fluidized Bed Gasifier Market Share Forecast by Region, 2023 & 2033 (%)
Figure 26 Entrained Flow Gasifier Market by Region, 2023-2033 (US$ Bn, AGR (%))
Figure 27 Entrained Flow Gasifier Market Share Forecast by Region, 2023 & 2033 (%)
Figure 28 Coal Gasification Market by End-User: Market Attractiveness Index
Figure 29 Global Coal Gasification Market by End-User, 2023-2033 (US$ Bn, AGR (%))
Figure 30 Coal Gasification Market Share Forecast by End-User, 2023, 2028, 2033 (%)
Figure 31 Chemicals Market by Region, 2023-2033 (US$ Bn, AGR (%))
Figure 32 Chemicals Market Share Forecast by Region, 2023 & 2033 (%)
Figure 33 Power Generation Market by Region, 2023-2033 (US$ Bn, AGR (%))
Figure 34 Power Generation Market Share Forecast by Region, 2023 & 2033 (%)
Figure 35 Liquid Fuels Market by Region, 2023-2033 (US$ Bn, AGR (%))
Figure 36 Liquid Fuels Market Share Forecast by Region, 2023 & 2033 (%)
Figure 37 Other End-User Market by Region, 2023-2033 (US$ Bn, AGR (%))
Figure 38 Other End-User Market Share Forecast by Region, 2023 & 2033 (%)
Figure 39 Coal Gasification Market by Feedstock: Market Attractiveness Index
Figure 40 Global Coal Gasification Market by Feedstock, 2023-2033 (US$ Bn, AGR (%))
Figure 41 Coal Gasification Market Share Forecast by Feedstock, 2023, 2028, 2033 (%)
Figure 42 Bituminous Coal Market by Region, 2023-2033 (US$ Bn, AGR (%))
Figure 43 Bituminous Coal Market Share Forecast by Region, 2023 & 2033 (%)
Figure 44 Sub-bituminous Coal Market by Region, 2023-2033 (US$ Bn, AGR (%))
Figure 45 Sub-bituminous Coal Market Share Forecast by Region, 2023 & 2033 (%)
Figure 46 Petroleum Coke Market by Region, 2023-2033 (US$ Bn, AGR (%))
Figure 47 Petroleum Coke Market Share Forecast by Region, 2023 & 2033 (%)
Figure 48 Biomass Market by Region, 2023-2033 (US$ Bn, AGR (%))
Figure 49 Biomass Market Share Forecast by Region, 2023 & 2033 (%)
Figure 50 Other Feedstock Market by Region, 2023-2033 (US$ Bn, AGR (%))
Figure 51 Other Feedstock Market Share Forecast by Region, 2023 & 2033 (%)
Figure 52 Coal Gasification Market by Technology: Market Attractiveness Index
Figure 53 Global Coal Gasification Market by Technology, 2023-2033 (US$ Bn, AGR (%))
Figure 54 Coal Gasification Market Share Forecast by Technology, 2023, 2028, 2033 (%)
Figure 55 Integrated Gasification Combined Cycle (IGCC) Market by Region, 2023-2033 (US$ Bn, AGR (%))
Figure 56 Integrated Gasification Combined Cycle (IGCC) Market Share Forecast by Region, 2023 & 2033 (%)
Figure 57 Chemical Looping Gasification (CLG) Market by Region, 2023-2033 (US$ Bn, AGR (%))
Figure 58 Chemical Looping Gasification (CLG) Market Share Forecast by Region, 2023 & 2033 (%)
Figure 59 Hydrogen from Coal Process (HyCO) Market by Region, 2023-2033 (US$ Bn, AGR (%))
Figure 60 Hydrogen from Coal Process (HyCO) Market Share Forecast by Region, 2023 & 2033 (%)
Figure 61 Coal-to-Liquids (CTL) Market by Region, 2023-2033 (US$ Bn, AGR (%))
Figure 62 Coal-to-Liquids (CTL) Market Share Forecast by Region, 2023 & 2033 (%)
Figure 63 Polygeneration Market by Region, 2023-2033 (US$ Bn, AGR (%))
Figure 64 Polygeneration Market Share Forecast by Region, 2023 & 2033 (%)
Figure 65 Other Technologies Market by Region, 2023-2033 (US$ Bn, AGR (%))
Figure 66 Other Technologies Market Share Forecast by Region, 2023 & 2033 (%)
Figure 67 Coal Gasification Market Forecast by Region 2023 and 2033 (Revenue, CAGR%)
Figure 68 Coal Gasification Market Share Forecast by Region 2023, 2028, 2033 (%)
Figure 69 Global Coal Gasification Market Forecast, 2023-2033 (US$ Bn, AGR (%))
Figure 70 Global Coal Gasification Market by Region, 2023-2033 (US$ Bn, AGR (%))
Figure 71 North America Coal Gasification Market Attractiveness Index
Figure 72 North America Coal Gasification Market by Region, 2023, 2028 & 2033 (US$ Billion)
Figure 73 North America Coal Gasification Market by Value, 2023-2033 (US$ Bn, AGR (%))
Figure 74 North America Coal Gasification Market by Country, 2023-2033 (US$ Bn, AGR (%))
Figure 75 North America Coal Gasification Market Share Forecast by Country, 2023-2033 (%)
Figure 76 North America Coal Gasification Market by Gasifier Type, 2023-2033 (US$ Bn, AGR (%))
Figure 77 North America Coal Gasification Market Share Forecast Gasifier Type, 2023 & 2033 (%)
Figure 78 North America Coal Gasification Market by End-User, 2023-2033 (US$ Bn, AGR (%))
Figure 79 North America Coal Gasification Market Share Forecast by End-User, 2023 & 2033 (%)
Figure 80 North America Coal Gasification Market by Feedstock, 2023-2033 (US$ Bn, AGR (%))
Figure 81 North America Coal Gasification Market Share Forecast by Feedstock, 2023 & 2033 (%)
Figure 82 North America Coal Gasification Market by Technology, 2023-2033 (US$ Bn, AGR (%))
Figure 83 North America Coal Gasification Market Share Forecast by Technology, 2023 & 2033 (%)
Figure 84 US Coal Gasification Market by Value, 2023-2033 (US$ Bn, AGR (%))
Figure 85 Canada Coal Gasification Market by Value, 2023-2033 (US$ Bn, AGR (%))
Figure 86 Europe Coal Gasification Market Attractiveness Index
Figure 87 Europe Coal Gasification Market by Region, 2023, 2028 & 2033 (US$ Billion)
Figure 88 Europe Coal Gasification Market by Value, 2023-2033 (US$ Bn, AGR (%))
Figure 89 Europe Coal Gasification Market by Country, 2023-2033 (US$ Bn, AGR (%))
Figure 90 Europe Coal Gasification Market Share Forecast by Country, 2023 & 2033 (%)
Figure 91 Europe Coal Gasification Market by Gasifier Type, 2023-2033 (US$ Bn, AGR (%))
Figure 92 Europe Coal Gasification Market Share Forecast Gasifier Type, 2023 & 2033 (%)
Figure 93 Europe Coal Gasification Market by End-User, 2023-2033 (US$ Bn, AGR (%))
Figure 94 Europe Coal Gasification Market Share Forecast by End-User, 2023 & 2033 (%)
Figure 95 Europe Coal Gasification Market by Feedstock, 2023-2033 (US$ Bn, AGR (%))
Figure 96 Europe Coal Gasification Market Share Forecast by Feedstock, 2023 & 2033 (%)
Figure 97 Europe Coal Gasification Market by Technology, 2023-2033 (US$ Bn, AGR (%))
Figure 98 Europe Coal Gasification Market Share Forecast by Technology, 2023 & 2033 (%)
Figure 99 Germany Coal Gasification Market by Value, 2023-2033 (US$ Bn, AGR (%))
Figure 100 UK Coal Gasification Market by Value, 2023-2033 (US$ Bn, AGR (%))
Figure 101 France Coal Gasification Market by Value, 2023-2033 (US$ Bn, AGR (%))
Figure 102 Italy Coal Gasification Market by Value, 2023-2033 (US$ Bn, AGR (%))
Figure 103 Russia Coal Gasification Market by Value, 2023-2033 (US$ Bn, AGR (%))
Figure 104 Rest of Europe Coal Gasification Market by Value, 2023-2033 (US$ Bn, AGR (%))
Figure 105 Asia-Pacific Coal Gasification Market Attractiveness Index
Figure 106 Asia-Pacific Coal Gasification Market by Region, 2023, 2028 & 2033 (US$ Billion)
Figure 107 Asia-Pacific Coal Gasification Market by Value, 2023-2033 (US$ Bn, AGR (%))
Figure 108 Asia-Pacific Coal Gasification Market by Country, 2023-2033 (US$ Bn, AGR (%))
Figure 109 Asia-Pacific Coal Gasification Market Share Forecast by Country, 2023 & 2033 (%)
Figure 110 Asia-Pacific Coal Gasification Market by Gasifier Type, 2023-2033 (US$ Bn, AGR (%))
Figure 111 Asia-Pacific Coal Gasification Market Share Forecast Gasifier Type, 2023 & 2033 (%)
Figure 112 Asia-Pacific Coal Gasification Market by End-User, 2023-2033 (US$ Bn, AGR (%))
Figure 113 Asia-Pacific Coal Gasification Market Share Forecast by End-User, 2023 & 2033 (%)
Figure 114 Asia-Pacific Coal Gasification Market by Feedstock, 2023-2033 (US$ Bn, AGR (%))
Figure 115 Asia-Pacific Coal Gasification Market Share Forecast by Feedstock, 2023 & 2033 (%)
Figure 116 Asia-Pacific Coal Gasification Market by Technology, 2023-2033 (US$ Bn, AGR (%))
Figure 117 Asia-Pacific Coal Gasification Market Share Forecast by Technology, 2023 & 2033 (%)
Figure 118 China Coal Gasification Market by Value, 2023-2033 (US$ Bn, AGR (%))
Figure 119 India Coal Gasification Market by Value, 2023-2033 (US$ Bn, AGR (%))
Figure 120 Japan Coal Gasification Market by Value, 2023-2033 (US$ Bn, AGR (%))
Figure 121 South Korea Coal Gasification Market by Value, 2023-2033 (US$ Bn, AGR (%))
Figure 122 Australia Coal Gasification Market by Value, 2023-2033 (US$ Bn, AGR (%))
Figure 123 Rest of Asia-Pacific Coal Gasification Market by Value, 2023-2033 (US$ Bn, AGR (%))
Figure 124 Middle East and Africa Coal Gasification Market Attractiveness Index
Figure 125 Middle East and Africa Coal Gasification Market by Region, 2023, 2028 & 2033 (US$ Billion)
Figure 126 Middle East & Africa Coal Gasification Market by Value, 2023-2033 (US$ Bn, AGR (%))
Figure 127 Middle East & Africa Coal Gasification Market by Country, 2023-2033 (US$ Bn, AGR (%))
Figure 128 Middle East and Africa Coal Gasification Market Share Forecast by Country, 2023 & 2033 (%)
Figure 129 Middle East & Africa Coal Gasification Market by Gasifier Type, 2023-2033 (US$ Bn, AGR (%))
Figure 130 Middle East and Africa Coal Gasification Market Share Forecast Gasifier Type, 2023 & 2033 (%)
Figure 131 Middle East & Africa Coal Gasification Market by End-User, 2023-2033 (US$ Bn, AGR (%))
Figure 132 Middle East and Africa Coal Gasification Market Share Forecast by End-User, 2023 & 2033 (%)
Figure 133 Middle East & Africa Coal Gasification Market by Feedstock, 2023-2033 (US$ Bn, AGR (%))
Figure 134 Middle East and Africa Coal Gasification Market Share Forecast by Feedstock, 2023 & 2033 (%)
Figure 135 Middle East & Africa Coal Gasification Market by Technology, 2023-2033 (US$ Bn, AGR (%))
Figure 136 Middle East and Africa Coal Gasification Market Share Forecast by Technology, 2023 & 2033 (%)
Figure 137 GCC Coal Gasification Market by Value, 2023-2033 (US$ Bn, AGR (%))
Figure 138 South Africa Coal Gasification Market by Value, 2023-2033 (US$ Bn, AGR (%))
Figure 139 Rest of Middle East & Africa Coal Gasification Market by Value, 2023-2033 (US$ Bn, AGR (%))
Figure 140 Latin America Coal Gasification Market Attractiveness Index
Figure 141 Latin America Coal Gasification Market by Region, 2023, 2028 & 2033 (US$ Billion)
Figure 142 Latin America Coal Gasification Market by Value, 2023-2033 (US$ Bn, AGR (%))
Figure 143 Latin America Coal Gasification Market by Country, 2023-2033 (US$ Bn, AGR (%))
Figure 144 Latin America Coal Gasification Market Share Forecast by Country, 2023 & 2033 (%)
Figure 145 Latin America Coal Gasification Market by Gasifier Type, 2023-2033 (US$ Bn, AGR (%))
Figure 146 Latin America Coal Gasification Market Share Forecast Gasifier Type, 2023 & 2033 (%)
Figure 147 Latin America Coal Gasification Market by End-User, 2023-2033 (US$ Bn, AGR (%))
Figure 148 Latin America Coal Gasification Market Share Forecast by End-User, 2023 & 2033 (%)
Figure 149 Latin America Coal Gasification Market by Feedstock, 2023-2033 (US$ Bn, AGR (%))
Figure 150 Latin America Coal Gasification Market Share Forecast by Feedstock, 2023 & 2033 (%)
Figure 151 Latin America Coal Gasification Market by Technology, 2023-2033 (US$ Bn, AGR (%))
Figure 152 Latin America Coal Gasification Market Share Forecast by Technology, 2023 & 2033 (%)
Figure 153 Brazil Coal Gasification Market by Value, 2023-2033 (US$ Bn, AGR (%))
Figure 154 Mexico Coal Gasification Market by Value, 2023-2033 (US$ Bn, AGR (%))
Figure 155 Rest of Latin America Coal Gasification Market by Value, 2023-2033 (US$ Bn, AGR (%))
Figure 156 Coal Gasification Market: Company Revenue Share, 2022
Figure 157 General Electric Company: Net Revenue, 2018-2022 (US$ million, AGR%)
Figure 158 General Electric Company: R&D, 2018-2022 (US$ million, AGR%)
Figure 159 General Electric Company: Regional Revenue Shares, 2022 (%)
Figure 160 General Electric Company: Business Segment Revenue Shares, 2022 (%)
Figure 161 Air Liquide: Net Revenue, 2018-2022 (US$ million, AGR%)
Figure 162 Air Liquide: R&D, 2018-2022 (US$ million, AGR%)
Figure 163 Air Liquide: Regional Revenue Shares, 2022 (%)
Figure 164 Air Liquide: Business Segment Revenue Shares, 2022 (%)
Figure 165 Mitsubishi Heavy Industries, Ltd.: Net Revenue, 2018-2022 (US$ million, AGR%)
Figure 166 Mitsubishi Heavy Industries, Ltd.: R&D, 2018-2022 (US$ million, AGR%)
Figure 167 Mitsubishi Heavy Industries, Ltd.: Regional Revenue Shares, 2022 (%)
Figure 168 Mitsubishi Heavy Industries, Ltd.: Business Segment Revenue Shares, 2022 (%)
Figure 169 Royal Dutch Shell Plc: Net Revenue, 2018-2022 (US$ million, AGR%)
Figure 170 Royal Dutch Shell Plc: R&D, 2018-2022 (US$ million, AGR%)
Figure 171 Royal Dutch Shell Plc: Regional Revenue Shares, 2022 (%)
Figure 172 Royal Dutch Shell Plc: Business Segment Revenue Shares, 2022 (%)
Figure 173 Siemens AG: Net Revenue, 2018-2022 (US$ million, AGR%)
Figure 174 Siemens AG: R&D, 2018-2022 (US$ million, AGR%)
Figure 175 Siemens AG: Regional Revenue Shares, 2022 (%)
Figure 176 Siemens AG: Business Segment Revenue Shares, 2022 (%)
Figure 177 Linde plc: Net Revenue, 2018-2022 (US$ million, AGR%)
Figure 178 Linde plc: R&D, 2018-2022 (US$ million, AGR%)
Figure 179 Linde plc: Regional Revenue Shares, 2022 (%)
Figure 180 Linde plc: Business Segment Revenue Shares, 2022 (%)
Figure 181 KBR, Inc.: Net Revenue, 2018-2022 (US$ million, AGR%)
Figure 182 KBR, Inc.: Regional Revenue Shares, 2021 (%)
Figure 183 KBR, Inc.: Business Segment Revenue Shares, 2021 (%)
Figure 184 Sasol Limited: Net Revenue, 2018-2022 (US$ million, AGR%)
Figure 185 Sasol Limited: R&D, 2018-2022 (US$ million, AGR%)
Figure 186 Sasol Limited: Regional Revenue Shares, 2023 (%)
Figure 187 Sasol Limited: Business Segment Revenue Shares, 2022 (%)
Figure 188 CTCI Corporation: Net Revenue, 2017-2021 (US$ million, AGR%)
Figure 189 CTCI Corporation: R&D, 2017-2021 (US$ million, AGR%)
Figure 190 CTCI Corporation: Regional Revenue Shares, 2021 (%)
Figure 191 CTCI Corporation: Business Segment Revenue Shares, 2021 (%)
ページTOPに戻る
本レポートと同じKEY WORD(coal)の最新刊レポート
よくあるご質問
Visiongain社はどのような調査会社ですか?
英国の調査会社ヴィジョンゲイン社(Visiongain)は、通信とエネルギーのほか、自動車や化学・医薬品、金属など、広範な市場を対象に調査を行っています。自動車市場については、市場全般に関する調査のほ... もっと見る
調査レポートの納品までの日数はどの程度ですか?
在庫のあるものは速納となりますが、平均的には 3-4日と見て下さい。
但し、一部の調査レポートでは、発注を受けた段階で内容更新をして納品をする場合もあります。
発注をする前のお問合せをお願いします。
注文の手続きはどのようになっていますか?
1)お客様からの御問い合わせをいただきます。
2)見積書やサンプルの提示をいたします。
3)お客様指定、もしくは弊社の発注書をメール添付にて発送してください。
4)データリソース社からレポート発行元の調査会社へ納品手配します。
5) 調査会社からお客様へ納品されます。最近は、pdfにてのメール納品が大半です。
お支払方法の方法はどのようになっていますか?
納品と同時にデータリソース社よりお客様へ請求書(必要に応じて納品書も)を発送いたします。
お客様よりデータリソース社へ(通常は円払い)の御振り込みをお願いします。
請求書は、納品日の日付で発行しますので、翌月最終営業日までの当社指定口座への振込みをお願いします。振込み手数料は御社負担にてお願いします。
お客様の御支払い条件が60日以上の場合は御相談ください。
尚、初めてのお取引先や個人の場合、前払いをお願いすることもあります。ご了承のほど、お願いします。
データリソース社はどのような会社ですか?
当社は、世界各国の主要調査会社・レポート出版社と提携し、世界各国の市場調査レポートや技術動向レポートなどを日本国内の企業・公官庁及び教育研究機関に提供しております。
世界各国の「市場・技術・法規制などの」実情を調査・収集される時には、データリソース社にご相談ください。
お客様の御要望にあったデータや情報を抽出する為のレポート紹介や調査のアドバイスも致します。
|
|


