ニューロテックデバイス市場レポート:2023-2033
Neurotech Devices Market Report 2023-2033
レポート詳細
ニューロテックデバイス市場レポート 2023-2033 :本レポートは、新たな収益の柱を目指すリーディングカンパニーが、業界とその背景にあるダイナミクスをより深く理解する上で、非常に有... もっと見る
※上記価格は部署ライセンス(Departmental licence)価格です。
その他の価格についてはデータリソースまでお問合せください。
日本語のページは自動翻訳を利用し作成しています。
実際のレポートは英文のみでご納品いたします。
サマリー
レポート詳細
ニューロテックデバイス市場レポート 2023-2033:本レポートは、新たな収益の柱を目指すリーディングカンパニーが、業界とその背景にあるダイナミクスをより深く理解する上で、非常に有益なものとなるはずです。また、異業種への進出や新地域での既存事業の拡大を目指す企業にとっても有用なレポートです。
神経疾患を患う高齢者の増加
神経疾患を患う高齢者人口の急増は、市場の成長を促進する極めて重要な要因となっています。アルツハイマー病、認知症、パーキンソン病、慢性腰痛・四肢痛などの神経疾患は、65歳以降に最も発症しやすいと言われています。このような疾患では、ニューロテックデバイスによる治療が極めて重要な役割を担っています。例えば、脊髄刺激療法(SCS)は、慢性的な背中や手足の痛みに効果的な治療法です。また、高齢者における背部手術失敗症候群(FBSS)、末梢神経障害性疼痛、関節置換術後の残存痛は、脊髄刺激装置で治療することが可能です。老年人口の増加は、このような市場拡大のシナリオを生み出すでしょう。
神経疾患患者のニーズに対応するリソースの不足
熟練した医療従事者の不足とハイテク機器の利用可能性が、予測期間中の市場成長を妨げると予想されます。さらに、普遍的なメンタルヘルスケアサービスへの不十分なアクセスは、市場拡大の大きな課題として挙げられます。重要なリソースの不足は、新しい治療オプションや改善された技術にアクセスできない低開発地域や無視されたグループにおいて深刻です。低・中所得国の多くでは、熟練した医療スタッフおよび基本的な神経学的診断サービスが不足しています。本格的な情報の欠如や代替治療法への切り替えが治療を遅らせます。
マーケットリサーチレポートを購入する前に、どのような質問をすべきでしょうか?
- ニューロテックデバイスの市場はどのように進化しているのか?
- 神経技術装置市場の推進要因と抑制要因は何か?
- 各ニューロテックデバイスサブマーケットは予測期間中にどのように成長し、2033年にはどの程度の売上を占めるようになるのか?
- 2023年から2033年にかけて、各ニューロテックデバイスサブマーケットの市場シェアはどのように推移するのでしょうか?
- 2023年から2033年にかけて、市場全体の主要なドライバーは何になるのか?
- 主要なニューロテックデバイス市場はマクロ経済のダイナミクスに概ね追随するのか、それとも個々の国内市場が他を凌駕するのか?
- 2033年までに各国市場のシェアはどのように変化し、どの地域が2033年の市場をリードするのか?
- 主要プレイヤーは誰か、また予測期間中の見通しは?
- これらの主要企業のニューロテックデバイス開発プロジェクトは何か?
- 2023年から2033年の間に、業界はどのように進化していくのでしょうか?現在および今後10年間に実施されるニューロテックデバイスの開発プロジェクトはどのような意味を持つのか?
- ニューロテックデバイス市場をさらに拡大するために、製品の商業化の必要性は高まっているのか?
- ニューロテックデバイス市場の方向性と、市場の最前線に立つための方法とは?
- 新製品・新サービスへの最適な投資方法とは?
- 企業を新たな成長軌道に乗せ、C-suiteに移行させるための重要な展望とは?
このことが、現在、そして今後10年間のニューロテックデバイス市場にどのような影響を与えるかを知る必要があります。
- 330ページにわたる本レポートでは、131の表と182のグラフを独占的に提供します。
- このレポートでは、業界における主要な収益性の高い分野をハイライトしているため、今すぐターゲットを絞ることができます。
- 世界、地域、国別の売上高と成長率を詳細に分析しています。
- 競合他社が成功した主なトレンド、変化、収益予測をハイライトしています。
本レポートは、ニューロテックデバイス市場が今後10年間にどのように発展するか、またCOVID-19の景気後退と回復の変動に合わせて、今日あなたにお伝えします。この市場は、過去10年間のどの時点よりも、今がより重要なのです。
2033年までの予測やその他の分析により、商業的な展望が見えてきた
- 2033年までの収益予測に加え、直近の実績、成長率、市場シェアもご覧いただけます。
- ビジネスの展望や展開など、独自の分析もご覧いただけます。
- 定性的分析(市場力学、促進要因、機会、阻害要因、課題など)、コスト構造、ニューロテックデバイスの価格上昇の影響、最近の動向などをご覧いただけます。
本レポートには、COVID-19が業界と貴社にどのような影響を与えるかについてのデータ分析と貴重な洞察が含まれています。COVID-19の4つの回収パターンとその影響、すなわち「V」「L」「W」「U」については本レポートで考察しています。
報告書の対象セグメント
製品別
・神経刺激
- 脳深部刺激装置
- 胃腸電気刺激装置
- 脊髄刺激装置
- 仙骨神経刺激装置
- 迷走神経刺激装置
- 経皮的電気神経刺激装置
・神経義肢
・神経感覚
・神経リハビリテーション
疾患別
- 疼痛管理
- 認知機能障害
- てんかん
- 尿失禁・便失禁
- 聴覚障害
- パーキンソン病
- うつ病
- 睡眠障害
- 本態性振戦
- その他
エンドユーザー別
- 病院
- 外来手術センター
- 在宅医療施設
- その他
世界市場全体とセグメントの収益予測に加え、5つの地域と16の主要国市場の収益予測も掲載しています。
北米
- 米国
- カナダ
欧州
- ドイツ
- 英国
- フランス
- スペイン
- イタリア
- その他の欧州
アジア太平洋
- 中国
- 日本
- インド
- オーストラリア
- 韓国
- その他のアジア太平洋地域
ラテンアメリカ
- ブラジル
- メキシコ
- その他のラテンアメリカ地域
MEA
- GCC
- 南アフリカ
- その他のMEA地域
2023年から2033年までのニューロテックデバイス市場の主要企業のプロファイルと、これらの企業のこのセグメントに焦点を当てたものも含まれています。
主要企業と市場成長の可能性
・ Abbott Laboratories
・ Advanced Bionics AG (Sonova)
・ Boston Scientific Corporation
・ BrainCo, Inc
・ Cochlear Limited
・ ElectroCore Inc
・ Helbling Holding AG
・ Innovative Health Solutions, Inc
・ LivaNova PLC
・ Medtronic
・ MicroTransponder
・ Natus medical Incorporated
・ Neuronetics, Inc.
・ Nihon Kohden Corporation
・ Parasym Ltd.
・ Synapse Biomedical
・ tVNS Technologies GmbH (Cerbomed)
ニューロテックデバイス市場の世界全体収益、2023年から2033年まで(金額ベース)は、2023年に131億200万米ドルを突破すると、当研究所は算出しています。また、2033年までの間に収益が大きく伸びると予測しています。本調査では、最も大きな可能性を秘めた企業を特定しています。彼らの能力、進歩、商業的展望を知ることで、一歩先を行くことができます。
ニューロテックデバイス市場、2023年から2033年までのレポートはどのように役立つのでしょうか?
330ページに及ぶレポートでは、要約して以下のような知識を得ることができます。
- ニューロテックデバイス市場の2023年から2033年までの収益予測 製品、条件、最終用途の各予測を世界と地域レベルで掲載 - 業界の展望を発見し、投資と収益の最も有利な場所を見つけることが可能です。
- 5地域と16主要国市場の2033年までの収益予測 - 北米、欧州、アジア太平洋、中南米、中東アフリカの神経技術装置市場、2023年から2033年までの市場予測をご覧いただけます。また、米国、カナダ、メキシコ、ブラジル、ドイツ、フランス、英国、イタリア、中国、インド、日本、オーストラリアなどの主要経済圏の市場も予測されています。
- 既存企業や市場参入を目指す企業の展望 - ニューロテックデバイス市場に関わる主要企業の企業プロファイルを含む、2023年から2033年までの展望を掲載しています。
定量的・定性的な分析と独自の予測をご覧いただけます。私たちのレポートだけが持つ情報を入手し、貴重なビジネスインテリジェンスを得ることができます。
他にはない情報
私たちの新しいレポートがあれば、知識の遅れを取り戻し、チャンスを逃す可能性が低くなります。私たちの研究が貴社の調査、分析、意思決定にどのように役立つかをご覧ください。Visiongainの調査は、ニューロテックデバイス市場、2023年から2033年、市場の主要企業のための商業分析を必要とするすべての人のためのものです。データ、トレンド、予測をご覧いただけます。
ページTOPに戻る
目次
目次
1.レポートの概要
1.1 調査の目的
1.2 ニューロテックデバイス市場の紹介
1.3 本レポートが提供するもの
1.4 本レポートを読むべき理由
1.5 本分析レポートが回答する主な質問事項
1.6 本レポートは誰のためのものなのか?
1.7 方法論
1.7.1 市場の定義
1.7.2 市場評価・予測手法
1.7.3 データの検証
1.7.3.1 一次調査
1.7.3.2 セカンダリーリサーチ
1.8 よくある質問(FAQ)
1.9 関連するVisiongainのレポート
1.10 Visiongainについて
2 エグゼクティブサマリー
3 市場の概要
3.1 主要な調査結果
3.2 マーケットダイナミクス
3.2.1 市場の推進要因
3.2.1.1 神経疾患の有病率の増加
3.2.1.2 世界的な企業や組織による投資の増加
3.2.1.3 ニューロテックデバイスの技術的進歩
3.2.1.4 ニューロテック産業における認知度向上と資金調達の増加
3.2.2 市場阻害要因
3.2.2.1 熟練した医療従事者の不足
3.2.3 市場機会
3.2.3.1 先進国における低侵襲手術の需要増加
3.2.3.2 神経障害を持つ高齢者患者の増加
3.3 COVID-19影響度分析
3.4 ポーターのファイブフォース分析
3.4.1 供給者のバーゲニングパワー
3.4.2 バイヤーのバーゲニングパワー
3.4.3 競合他社のライバル関係
3.4.4 代替品による脅威
3.4.5 新規参入の脅威
3.5 PEST分析
4 ニューロテックデバイス市場分析:製品別
4.1 主要な調査結果
4.2 製品セグメント市場魅力度指数
4.3 ニューロテックデバイスの製品別市場規模推定・予測
4.4 ニューロスティミュレーション
4.4.1 脳深部刺激装置
4.4.1.1 地域別市場規模、2023-2033 (US$ Mn)
4.4.1.2 地域別市場シェア、2023年&2033年(%)
4.4.2 胃電気刺激装置
4.4.2.1 地域別市場規模、2023年~2033年 (US$ Mn)
4.4.2.2 地域別市場シェア、2023年&2033年(%)
4.4.3 脊髄刺激装置
4.4.3.1 地域別市場規模、2023年~2033年 (US$ Mn)
4.4.3.2 地域別市場シェア、2023年&2033年(%)
4.4.4 仙骨神経刺激装置
4.4.4.1 地域別市場規模、2023年~2033年 (US$ Mn)
4.4.4.2 地域別市場シェア、2023年&2033年(%)
4.4.5 迷走神経刺激装置
4.4.5.1 地域別市場規模、2023年~2033年 (US$ Mn)
4.4.5.2 地域別市場シェア、2023年&2033年(%)
4.4.6 経皮的電気神経刺激(TENS)
4.4.6.1 地域別市場規模、2023年~2033年 (US$ Mn)
4.4.6.2 地域別市場シェア、2023年&2033年(%)
4.4.7 その他
4.4.7.1 地域別市場規模、2023年~2033年 (US$ Mn)
4.4.7.2 地域別市場シェア、2023年&2033年(%)
4.5 神経義肢
4.5.1 地域別市場規模、2023年~2033年 (US$ Mn)
4.5.2 地域別市場シェア、2023年&2033年(%)
4.6 神経感覚
4.6.1 地域別市場規模、2023年~2033年 (US$ Mn)
4.6.2 地域別市場シェア、2023年&2033年(%)
4.7 神経リハビリテーション
4.7.1 地域別市場規模、2023年~2033年 (US$ Mn)
4.7.2 地域別市場シェア、2023年&2033年(%)
5 ニューロテックデバイス市場分析:症状別
5.1 主な調査結果
5.2 コンディション・セグメント市場魅力度指数
5.3 コンディション別ニューロテックデバイス市場規模推定・予測
5.4 ペインマネジメント
5.4.1 地域別市場規模、2023年~2033年 (US$ Mn)
5.4.2 地域別市場シェア、2023年&2033年(%)
5.5 認知障害
5.5.1 地域別市場規模、2023年~2033年 (US$ Mn)
5.5.2 地域別市場シェア、2023年&2033年(%)
5.6 てんかん
5.6.1 地域別市場規模、2023年~2033年 (US$ Mn)
5.6.2 地域別市場シェア、2023年&2033年(%)
5.7 尿失禁と便失禁
5.7.1 地域別市場規模、2023年~2033年 (US$ Mn)
5.7.2 地域別市場シェア、2023年&2033年(%)
5.8 聴覚障害
5.8.1 地域別市場規模、2023年〜2033年 (US$ Mn)
5.8.2 地域別市場シェア、2023年&2033年(%)
5.9 パーキンソン病
5.9.1 地域別市場規模、2023年〜2033年 (US$ Mn)
5.9.2 地域別市場シェア、2023年&2033年(%)
5.10 うつ病
5.10.1 地域別市場規模、2023年〜2033年 (US$ Mn)
5.10.2 地域別市場シェア、2023年&2033年(%)
5.11 睡眠障害
5.11.1 地域別市場規模、2023年〜2033年 (US$ Mn)
5.11.2 地域別市場シェア、2023年&2033年(%)
5.12 本態性振戦
5.12.1 地域別市場規模、2023年〜2033年 (US$ Mn)
5.12.2 地域別市場シェア、2023年&2033年(%)
5.13 その他
5.13.1 地域別市場規模、2023年〜2033年 (US$ Mn)
5.13.2 地域別市場シェア、2023年&2033年(%)
6 ニューロテックデバイス市場分析:エンドユーザー別
6.1 主な調査結果
6.2 エンドユーズセグメンテーション市場魅力度指数
6.3 ニューロテックデバイスのエンドユーザー別市場規模推定・予測
6.4 病院
6.4.1 地域別市場規模、2023年~2033年 (US$ Mn)
6.4.2 地域別市場シェア、2023年&2033年(%)
6.5 外来手術センター
6.5.1 地域別市場規模、2023年~2033年 (US$ Mn)
6.5.2 地域別市場シェア、2023年&2033年(%)
6.6 在宅介護施設
6.6.1 地域別市場規模、2023年~2033年 (US$ Mn)
6.6.2 地域別市場シェア、2023年&2033年(%)
6.7 その他
6.7.1 地域別市場規模、2023年〜2033年 (US$ Mn)
6.7.2 地域別市場シェア、2023年&2033年(%)
7 ニューロテックデバイス市場分析:地域別
7.1 主な調査結果
7.2 地域別セグメント市場魅力度指数
7.3 ニューロテックデバイスの市場規模推定と予測
8 北米のニューロテックデバイス市場分析
8.1 主な調査結果
8.2 北米ニューロテックデバイス市場の魅力度指数
8.3 北米ニューロテックデバイスの国別市場規模予測、2023年、2028年&2033年(US$ Mn)
8.4 北米ニューロテックデバイスの国別市場規模予測・予想
8.5 北米ニューロテックデバイスの製品別市場規模予測・予想
8.6 北米ニューロテックデバイスの症状別市場規模予測・予想
8.7 北米ニューロテックデバイスのエンドユーザー別市場規模予測・予想
8.8 アメリカ神経技術デバイスの市場分析
8.9 カナダの神経系機器の市場分析
9 欧州のニューロテックデバイス市場分析
9.1 主要な調査結果
9.2 欧州のニューロテックデバイス市場の魅力度指数
9.3 欧州のニューロテックデバイスの国別市場規模予測:2023年、2028年&2033年(US$ Mn)
9.4 欧州のニューロテックデバイス市場の国別市場規模予測・予測
9.5 欧州のニューロテックデバイスの製品別市場規模予測・予測
9.6 欧州のニューロテックデバイスの市場規模予測・症状別予測
9.7 欧州のニューロテックデバイスの市場規模予測・エンドユーザー別予測
9.8 ドイツのニューロテックデバイスの市場分析
9.9 フランスのニューロテックデバイスの市場分析
9.10 イギリスのニューロテックデバイス市場の分析
9.11 イタリアのニューロテックデバイスの市場分析
9.12 スペイン・ニューロテックデバイスの市場分析
9.13 ロシア・ニューロテックデバイス市場分析
9.14 その他の欧州のニューロテックデバイス市場分析
10 アジア太平洋地域のニューロテックデバイス市場分析
10.1 主な調査結果
10.2 アジア太平洋地域のニューロテックデバイス市場の魅力度指数
10.3 アジア太平洋地域のニューロテックデバイス市場の国別推移、2023年、2028年&2033年(US$ Mn)
10.4 アジア太平洋地域のニューロテックデバイスの国別市場規模予測・予想
10.5 アジア太平洋地域のニューロテックデバイス市場の製品別市場規模予測・予測
10.6 アジア太平洋地域のニューロテックデバイスの症状別市場分析
10.7 アジア太平洋地域のニューロテックデバイスのエンドユーザー別市場分析
10.8 日本 ニューロテックデバイスの市場分析
10.9 中国ニューロテックデバイスの市場分析
10.10 インドのニューロテックデバイス市場分析
10.11 オーストラリアのニューロテックデバイス市場分析
10.12 韓国ニューロテックデバイス市場の分析
10.13 その他のアジア太平洋地域ニューロテックデバイスの市場分析
11 ラテンアメリカのニューロテックデバイス市場分析
11.1 主要な調査結果
11.2 ラテンアメリカのニューロテックデバイス市場の魅力度指数
11.3 ラテンアメリカのニューロテックデバイス市場の国別推移、2023年、2028年&2033年(US$ Mn)
11.4 ラテンアメリカのニューロテックデバイス国別市場規模予測・予想
11.5 ラテンアメリカのニューロテックデバイスの製品別市場規模予測・予想
11.6 ラテンアメリカのニューロテックデバイスの症状別市場規模予測・予想
11.7 ラテンアメリカのニューロテックデバイス市場のエンドユーザー別市場規模予測・予測
11.8 ブラジルのニューロテックデバイス市場分析
11.9 メキシコのニューロテックデバイス市場分析
11.10 その他のラテンアメリカのニューロテックデバイス市場分析
12 MEAのニューロテックデバイス市場分析
12.1 主な調査結果
12.2 MEAのニューロテックデバイス市場の魅力度指数
12.3 MEAのニューロテックデバイスの国別市場規模予測、2023年、2028年&2033年(US$ Mn)
12.4 MEAのニューロテックデバイスの国別市場規模予測・予想
12.5 MEAのニューロテックデバイスの製品別市場規模予測・予想
12.6 MEAのニューロテックデバイスの症状別市場規模予測・予想
12.7 MEAのニューロテックデバイスの市場規模予測・エンドユース別予測
12.8 GCCニューロテックデバイスの市場分析
12.9 南アフリカのニューロテックデバイス市場分析
12.10 その他のMEAのニューロテックデバイスの市場分析
13社 会社概要
13.1 競合他社の状況
13.1.1 Medtronic
13.1.2 Boston Scientific Corporation
13.1.3 Abbott Laboratories
13.1.4 LivaNova PLC
13.2 Abbott Laboratories
13.2.1 会社概要
13.2.2 会社概要
13.2.3 財務分析
13.2.3.1 純収益、2017-2021年
13.2.3.2 R&D、2017-2021年
13.2.3.3 地域別市場シェア、2021年
13.2.4 製品ベンチマーク
13.2.5 戦略的な展望
13.3 Advanced Bionics AG (Sonova)
13.3.1 企業スナップショット
13.3.2 会社概要
13.3.3 製品ベンチマーク
13.3.4 戦略的展望
13.4 Boston Scientific Corporation
13.4.1 企業スナップショット
13.4.2 会社概要
13.4.3 財務分析
13.4.3.1 純収益、2017-2021年
13.4.3.2 R&D、2017-2021年
13.4.3.3 地域別市場シェア、2021年
13.4.4 製品ベンチマーク
13.4.5 戦略的展望
13.5 BrainCo, Inc.
13.5.1 企業スナップショット
13.5.2 会社概要
13.5.3 製品ベンチマーク
13.5.4 戦略的展望
13.6 Cochlear Limited
13.6.1 企業スナップショット
13.6.2 会社概要
13.6.3 財務分析
13.6.3.1 純収益、2017-2021年
13.6.3.2 R&D、2017年-2021年
13.6.3.3 地域別市場シェア、2021年
13.6.4 製品ベンチマーク
13.6.5 戦略的展望
13.7 ElectroCore Inc.
13.7.1 企業スナップショット
13.7.2 会社概要
13.7.3 財務分析
13.7.3.1 純収益、2017-2021年
13.7.3.2 R&D、2017年-2021年
13.7.3.3 地域別市場シェア、2021年
13.7.4 製品ベンチマーク
13.7.5 戦略的な展望
13.8 Helbling Holding AG
13.8.1 企業スナップショット
13.8.2 会社概要
13.8.3 財務分析
13.8.3.1 純収益、2017-2021年
13.8.4 製品ベンチマーク
13.8.5 戦略的な展望
13.9 Innovative Health Solutions, Inc
13.9.1 企業スナップショット
13.9.2 会社概要
13.9.3 製品ベンチマーク
13.9.4 戦略的展望
13.10 LivaNova PLC
13.10.1 企業スナップショット
13.10.2 会社概要
13.10.3 財務分析
13.10.3.1 純収益、2017-2021年
13.10.3.2 R&D、2017年-2021年
13.10.3.3 地域別市場シェア、2021年
13.10.4 製品ベンチマーク
13.10.5 戦略的な展望
13.11 Medtronic
13.11.1 企業スナップショット
13.11.2 会社概要
13.11.3 財務分析
13.11.3.1 純収益、2017-2021年
13.11.3.2 R&D、2017-2021年
13.11.3.3 地域別市場シェア、2021年
13.11.4 製品ベンチマーク
13.11.5 戦略的な展望
13.12 MicroTransponder
13.12.1 企業スナップショット
13.12.2 会社概要
13.12.3 製品ベンチマーク
13.12.4 戦略的展望
13.13 Neuronetics, Inc.
13.13.1 企業スナップショット
13.13.2 会社概要
13.13.3 財務分析
13.13.3.1 純収益、2017-2021年
13.13.3.2 R&D、2017年-2021年
13.13.3.3 地域別市場シェア、2021年
13.13.4 製品ベンチマーク
13.13.5 戦略的展望
13.14 Nihon Kohden Corporation
13.14.1 企業スナップショット
13.14.2 会社概要
13.14.3 財務分析
13.14.3.1 純収益、2017-2021年
13.14.3.2 R&D、2017年-2021年
13.14.3.3 地域別市場シェア、2021年
13.14.4 製品ベンチマーク
13.14.5 戦略的な展望
13.15 Natus medical Incorporated
13.15.1 企業スナップショット
13.15.2 会社概要
13.15.3 ベンチマーキング
13.15.4 戦略的展望
13.16 Parasym Ltd.
13.16.1 企業スナップショット
13.16.2 会社概要
13.16.3 製品ベンチマーク
13.16.4 戦略的展望
13.17 Synapse Biomedical Inc.
13.17.1 企業スナップショット
13.17.2 会社概要
13.17.3 ベンチマーキング
13.17.4 戦略的展望
13.18 tVNS Technologies GmbH (Cerbomed)
13.18.1 企業スナップショット
13.18.2 会社概要
13.18.3 製品ベンチマーク
13.18.4 戦略的展望
14 結論と提言
14.1 ヴィジョンゲインからの結論
14.2 市場関係者への提言
表の一覧
Table 1 Neurotech devices market Snapshot, 2023 & 2033 (US$ million, CAGR %)
Table 2 Neurotech Devices Market by Region, 2023-2033 (US$ Mn, AGR (%), CAGR (%)): “V” Shaped Recovery Scenario
Table 3 Neurotech Devices Market by Region, 2023-2033 (US$ Mn, AGR (%), CAGR (%)): “U” Shaped Recovery Scenario
Table 4 Neurotech Devices Market by Region, 2023-2033 (US$ Mn, AGR (%), CAGR (%)): “W” Shaped Recovery Scenario
Table 5 Neurotech Devices Market by Region, 2023-2033 (US$ Mn, AGR (%), CAGR (%)): “L” Shaped Recovery Scenario
Table 6 Neurotech Devices Market by Product, 2023-2033 (US$ Mn, AGR (%), CAGR (%))
Table 7 Neurotech Devices Market by Neurostimulation, 2023-2033 (US$ Mn, AGR (%), CAGR (%))
Table 8 Deep Brain Stimulator Market Forecast by Region, 2023-2033 (US$ Mn, AGR%, CAGR%)
Table 9 Gastric Electric Stimulator Market Forecast by Region, 2023-2033 (US$ Mn, AGR%, CAGR%)
Table 10 Spinal Cord Stimulator Market Forecast by Region, 2023-2033 (US$ Mn, AGR%, CAGR%)
Table 11 Sacral Nerve Stimulator Market Forecast by Region, 2023-2033 (US$ Mn, AGR%, CAGR%)
Table 12 Vagus Nerve Stimulator Market Forecast by Region, 2023-2033 (US$ Mn, AGR%, CAGR%)
Table 13 Transcutaneous Electrical Nerve Stimulation (TENS)Market Forecast by Region, 2023-2033 (US$ Mn, AGR%, CAGR%)
Table 14 Others Market Forecast by Region, 2023-2033 (US$ Mn, AGR%, CAGR%)
Table 15 Neuroprostheses Market Forecast by Region, 2023-2033 (US$ Mn, AGR%, CAGR%)
Table 16 Neurosensing Market Forecast by Region, 2023-2033 (US$ Mn, AGR%, CAGR%)
Table 17 Neurorehabilitation Market Forecast by Region, 2023-2033 (US$ Mn, AGR%, CAGR%)
Table 18 Neurotech Devices Market by Conditions, 2023-2033 (US$ Mn, AGR (%), CAGR (%))
Table 19 Pain Management Market Forecast by Region, 2023-2033 (US$ Mn, AGR%, CAGR%)
Table 20 Cognitive Disorders Market Forecast by Region, 2023-2033 (US$ Mn, AGR%, CAGR%)
Table 21 Epilepsy Market Forecast by Region, 2023-2033 (US$ Mn, AGR%, CAGR%)
Table 22 Urinary and Fecal Incontinence Market Forecast by Region, 2023-2033 (US$ Mn, AGR%, CAGR%
Table 23 Hearing Conditions Market Forecast by Region, 2023-2033 (US$ Mn, AGR%, CAGR%)
Table 24 Parkinson’s Diseases Market Forecast by Region, 2023-2033 (US$ Mn, AGR%, CAGR%)
Table 25 Depression Market Forecast by Region, 2023-2033 (US$ Mn, AGR%, CAGR%)
Table 26 Sleep Disorders Market Forecast by Region, 2023-2033 (US$ Mn, AGR%, CAGR%)
Table 27 Essential Tremor Market Forecast by Region, 2023-2033 (US$ Mn, AGR%, CAGR%)
Table 28 Others Market Forecast by Region, 2023-2033 (US$ Mn, AGR%, CAGR%)
Table 29 Neurotech Devices Market by End Use, 2023-2033 (US$ Mn, AGR (%), CAGR (%))
Table 30 Hospitals Neurotech Devices Market Forecast by Region, 2023-2033 (US$ Mn, AGR%, CAGR%)
Table 31 Ambulatory Surgical Centers Market Forecast by Region, 2023-2033 (US$ Mn, AGR%, CAGR%)
Table 32 Homecare Facilities Market Forecast by Region, 2023-2033 (US$ Mn, AGR%, CAGR%)
Table 33 Others Market Forecast by Region, 2023-2033 (US$ Mn, AGR%, CAGR%)
Table 34 Neurotech Devices Market by Region, 2023-2033 (US$ Mn, AGR (%), CAGR (%))
Table 35 North America Neurotech Devices Market Size Estimation and Forecast by Country
Table 36 North America Neurotech Devices Market by Product, 2023-2033 (US$ Mn, AGR (%), CAGR (%))
Table 37 North America Neurotech Devices Market by Neurostimulation, 2023-2033 (US$ Mn, AGR (%), CAGR (%))
Table 38 North America Neurotech Devices Market by Conditions, 2023-2033 (US$ Mn, AGR (%), CAGR (%))
Table 39 Neurotech Devices Market by End use, 2023-2033 (US$ Mn, AGR (%), CAGR (%))
Table 40 U.S. Neurotech Devices Market Forecast, 2023-2033 (US$ Mn, AGR %, CAGR %)
Table 41 Canada Neurotech Devices Market Forecast, 2023-2033 (US$ Mn, AGR %, CAGR %)
Table 42 Europe Neurotech devices market Forecast by Country, 2023-2033 (US$ Mn, AGR%, CAGR%)
Table 43 Europe Neurotech Devices Market by Product, 2023-2033 (US$ Mn, AGR (%), CAGR (%))
Table 44 Europe Neurotech Devices Market by Neurostimulation, 2023-2033 (US$ Mn, AGR (%), CAGR (%))
Table 45 Europe Neurotech Devices Market by Conditions, 2023-2033 (US$ Mn, AGR (%), CAGR (%))
Table 46 Neurotech Devices Market by End use, 2023-2033 (US$ Mn, AGR (%), CAGR (%))
Table 47 Germany Neurotech Devices Market Forecast, 2023-2033 (US$ Mn, AGR (%), CAGR (%)):
Table 48 France Neurotech Devices Market Forecast: 2023-2033 (US$ Mn, AGR (%), CAGR (%)):
Table 49 UK Neurotech Devices Market Forecast: 2023-2033 (US$ Mn, AGR (%), CAGR (%))
Table 50 Italy Neurotech Devices Market Forecast: 2023-2033 (US$ Mn, AGR (%), CAGR (%)):
Table 51 Spain Neurotech Devices Market Forecast: 2023-2033 (US$ Mn, AGR (%), CAGR (%)):
Table 52 Russia Neurotech Devices Market Forecast: 2023-2033 (US$ Mn, AGR (%), CAGR (%)):
Table 53 Rest of Europe Neurotech Devices Market Forecast: 2023-2033 (US$ Mn, AGR (%), CAGR (%)):
Table 54 Asia Pacific Neurotech Market Forecast by Country, 2023-2033 (US$ Mn, AGR%, CAGR%)
Table 55 Asia Pacific Neurotech Devices Market by Product, 2023-2033 (US$ Mn, AGR (%), CAGR (%))
Table 56 Asia Pacific Neurotech Devices Market by Neurostimulation, 2023-2033 (US$ Mn, AGR (%), CAGR (%))
Table 57 Asia Pacific Neurotech Devices Market by Conditions, 2023-2033 (US$ Mn, AGR (%), CAGR (%))
Table 58 Asia Pacific Neurotech Devices Market by End Use, 2023-2033 (US$ Mn, AGR (%), CAGR (%))
Table 59 Japan Neurotech Devices Market Forecast: 2023-2033 (US$ Mn, AGR (%), CAGR (%)):
Table 60 China Neurotech Devices Market Forecast, 2023-2033 (US$ Mn, AGR%, CAGR%)
Table 61 India Neurotech Devices Market Forecast, 2023-2033 (US$ Mn, AGR%, CAGR%)
Table 62 Australia Neurotech Devices Market Forecast, 2023-2033 (US$ Mn, AGR%, CAGR%)
Table 63 South Korea Neurotech Devices Market Forecast: 2023-2033 (US$ Mn, AGR (%), CAGR(%)):
Table 64 Rest of Asia Pacific Neurotech Devices Market Forecast, 2023-2033 (US$ Mn, AGR%, CAGR%)
Table 65 Latin America Neurotech Market Forecast by Country, 2023-2033 (US$ Mn, AGR%, CAGR%)
Table 66 Latin America Neurotech Devices Market by Product, 2023-2033 (US$ Mn, AGR (%), CAGR (%))
Table 67 Latin America Neurotech Devices Market by Neurostimulation, 2023-2033 (US$ Mn, AGR (%), CAGR (%))
Table 68 Latin America Neurotech Devices Market by Conditions, 2023-2033 (US$ Mn, AGR (%), CAGR (%))
Table 69 Latin America Neurotech Devices Market by End Use, 2023-2033 (US$ Mn, AGR (%), CAGR (%))
Table 70 Brazil Neurotech Devices Market Forecast, 2023-2033 (US$ Mn, AGR%, CAGR%)
Table 71 Mexico Neurotech Devices Market Forecast, 2023-2033 (US$ Mn, AGR%, CAGR%)
Table 72 Rest of Latin America Neurotech Devices Forecast, 2023-2033 (US$ Mn, AGR%, CAGR%)
Table 73 MEA Neurotech Devices Forecast by Country, 2023-2033 (US$ Mn, AGR%, CAGR%)
Table 74 MEA Neurotech Devices Market by Product, 2023-2033 (US$ Mn, AGR (%), CAGR (%))
Table 75 MEA Neurotech Devices Market by Neurostimulation, 2023-2033 (US$ Mn, AGR (%), CAGR (%))
Table 76 MEA Neurotech Devices Market by Conditions, 2023-2033 (US$ Mn, AGR (%), CAGR (%))
Table 77 MEA Neurotech Devices Market by End Use, 2023-2033 (US$ Mn, AGR (%), CAGR (%))
Table 78 GCC Neurotech devices market Forecast, 2023-2033 (US$ Mn, AGR%, CAGR%)
Table 79 South Africa Neurotech Devices Market Forecast, 2023-2033 (US$ Mn, AGR%, CAGR%)
Table 80 Rest of MEA Neurotech Devices Market Forecast, 2023-2033 (US$ Mn, AGR%, CAGR%)
Table 81 Abbott Laboratories: Key Details, (CEO, HQ, Revenue, Founded, No. of Employees, Company Type, Website, Business Segment)
Table 82 Abbott Laboratories: Product Benchmarking
Table 83 Abbott Laboratories: Strategic Outlook
Table 84 Advanced Bionics AG (Sonova): Key Details, (CEO, HQ, Revenue, Founded, No. of Employees, Company Type, Website, Business Segment)
Table 85 Advanced Bionics AG (Sonova).: Product Benchmarking
Table 86 Advanced Bionics AG (Sonova).: Strategic Outlook
Table 87 Boston Scientific Corporation, Inc.: Key Details, (CEO, HQ, Revenue, Founded, No. of Employees, Company Type, Website, Business Segment)
Table 88 Boston Scientific Corporation.: Product Benchmarking
Table 89 Boston Scientific Corporation.: Strategic Outlook
Table 90 BrainCo, Inc: Key Details, (CEO, HQ, Revenue, Founded, No. of Employees, Company Type, Website, Business Segment)
Table 91 BrainCo, Inc.: Product Benchmarking
Table 92 BrainCo, Inc.: Strategic Outlook
Table 93 Cochlear Limited: Key Details, (CEO, HQ, Revenue, Founded, No. of Employees, Company Type, Website, Business Segment)
Table 94 Cochlear Limited.: Product Benchmarking
Table 95 Cochlear Limited.: Strategic Outlook
Table 96 ElectroCore Inc: Key Details, (CEO, HQ, Revenue, Founded, No. of Employees, Company Type, Website, Business Segment)
Table 97 ElectroCore Inc.: Product Benchmarking
Table 98 ElectroCore Inc.: Strategic Outlook
Table 99 Helbling Holding AG: Key Details, (CEO, HQ, Revenue, Founded, No. of Employees, Company Type, Website, Business Segment)
Table 100 Helbling Holding AG.: Product Benchmarking
Table 101 Helbling Holding AG.: Strategic Outlook
Table 102 Innovative Health Solutions: Key Details, (CEO, HQ, Revenue, Founded, No. of Employees, Company Type, Website, Business Segment)
Table 103 Innovative Health Solutions.: Product Benchmarking
Table 104 Innovative Health Solutions: Strategic Outlook
Table 105 LivaNova PLC: Key Details, CEO, HQ, Revenue, Founded, No. of Employees, Company Type, Website, Business Segment
Table 106 LivaNova PLC.: Product Benchmarking
Table 107 LivaNova PLC: Strategic Outlook
Table 108 Medtronic, (CEO, HQ, Revenue, Founded, No. of Employees, Company Type, Website, Business Segment)
Table 109 Medtronic.: Product Benchmarking
Table 110 Medtronic.: Strategic Outlook
Table 111 MicroTransponder: Key Details, (CEO, HQ, Revenue, Founded, No. of Employees, Company Type, Website, Business Segment)
Table 112 MicroTransponder.: Product Benchmarking
Table 113 MicroTransponder.: Strategic Outlook
Table 114 Neuronetics, Inc: Key Details, (CEO, HQ, Revenue, Founded, No. of Employees, Company Type, Website, Business Segment)
Table 115 Neuronetics, Inc.: Product Benchmarking
Table 116 Neuronetics, Inc.: Strategic Outlook
Table 117 Nihon Kohden Corporation: Key Details, (CEO, HQ, Revenue, Founded, No. of Employees, Company Type, Website, Business Segment)
Table 118 Nihon Kohden Corporation.: Product Benchmarking
Table 119 Nihon Kohden Corporation.: Strategic Outlook
Table 120 Natus medical Incorporated: Key Details, (CEO, HQ, Revenue, Founded, No. of Employees, Company Type, Website, Business Segment)
Table 121 Natus medical Incorporated.: Product Benchmarking
Table 122 Natus medical Incorporated.: Strategic Outlook
Table 123 Parasym Ltd: Key Details, (CEO, HQ, Revenue, Founded, No. of Employees, Company Type, Website, Business Segment)
Table 124 Parasym Ltd.: Product Benchmarking
Table 125 Parasym Ltd.: Strategic Outlook
Table 126 Synapse Biomedical Inc: Key Details, (CEO, HQ, Revenue, Founded, No. of Employees, Company Type, Website, Business Segment)
Table 127 Synapse Biomedical Inc.: Product Benchmarking
Table 128 Synapse Biomedical Inc.: Strategic Outlook
Table 129 tVNS Technologies GmbH (Cerbomed): Key Details, (CEO, HQ, Revenue, Founded, No. of Employees, Company Type, Website, Business Segment)
Table 130 tVNS Technologies GmbH (Cerbomed).: Product Benchmarking
Table 131 tVNS Technologies GmbH (Cerbomed).: Strategic Outlook
図の一覧
Figure 1 Neurotech Devices Market Segmentation
Figure 2 Neurotech Devices Market by Product: Market Attractiveness Index
Figure 3 Neurotech Devices Market by Conditions: Market Attractiveness Index
Figure 4 Neurotech Devices Market by End Use: Market Attractiveness Index
Figure 5 Neurotech Devices Market Attractiveness Index by Region
Figure 6 Neurotech devices market: Market Dynamics
Figure 7 Neurotech Devices Market by Region, 2023-2033 (US$ Mn, AGR (%), CAGR (%)): “V” Shaped Recovery
Figure 8 Neurotech Devices Market by Region, 2023-2033 (US$ Mn, AGR (%), CAGR (%)): “U” Shaped Recovery
Figure 9 Neurotech Devices Market by Region, 2023-2033 (US$ Mn, AGR (%), CAGR (%)): “W” Shaped Recovery
Figure 10 Neurotech Devices Market by Region, 2023-2033 (US$ Mn, AGR (%), CAGR (%)): “L” Shaped Recovery
Figure 11 Neurotech Devices Market: Porter’s Five Forces Analysis
Figure 12 Neurotech Devices Market: PEST Analysis
Figure 13 Neurotech Devices Market by Product: Market Attractiveness Index
Figure 14 Neurotech Devices Market by Neurostimulation: Market Attractiveness Index
Figure 15 Neurotech Devices Market Forecast by Product, 2023-2033 (US$ million)
Figure 16 Neurotech Devices Market Forecast by Neurostimulation, 2023-2033 (US$ million)
Figure 17 Neurotech Devices Market Share Forecast by Product, 2023, 2033 (%)
Figure 18 Neurotech Devices Market Share Forecast by Neurostimulation, 2023, 2033 (%)
Figure 19 Deep Brain Stimulator Market Forecast by Region, 2023-2033 (US$ million)
Figure 20 Deep Brain Stimulator Market Share Forecast by Region, 2023 & 2033 (%)
Figure 21 Gastric Electric Stimulator Market Forecast by Region, 2023-2033 (US$ million)
Figure 22 Gastric Electric Stimulator Market Share Forecast by Region, 2023 & 2033 (%)
Figure 23 Spinal Cord Stimulator Market Forecast by Region, 2023-2033 (US$ million)
Figure 24 Spinal Cord Stimulator Market Share Forecast by Region, 2023 & 2033 (%)
Figure 25 Sacral Nerve Stimulator Market Forecast by Region, 2023-2033 (US$ million)
Figure 26 Sacral Nerve Stimulator Market Share Forecast by Region, 2023 & 2033 (%)
Figure 27 Vagus Nerve Stimulator Market Forecast by Region, 2023-2033 (US$ million)
Figure 28 Vagus Nerve Stimulator Market Share Forecast by Region, 2023 & 2033 (%)
Figure 29 Transcutaneous Electrical Nerve Stimulation (TENS) Market Forecast by Region, 2023-2033 (US$ million)
Figure 30 Transcutaneous Electrical Nerve Stimulation (TENS) Market Share Forecast by Region, 2023 & 2033 (%)
Figure 31 Others Market Forecast by Region, 2023-2033 (US$ million)
Figure 32 Others Market Share Forecast by Region, 2023 & 2033 (%)
Figure 33 Neuroprostheses Market Forecast by Region, 2023-2033 (US$ million)
Figure 34 Neuroprostheses Market Share Forecast by Region, 2023 & 2033 (%)
Figure 35 Neurosensing Market Forecast by Region, 2023-2033 (US$ million)
Figure 36 Neurosensing Market Share Forecast by Region, 2023 & 2033 (%)
Figure 37 Neurorehabilitation Market Forecast by Region, 2023-2033 (US$ million)
Figure 38 Neurorehabilitation Market Share Forecast by Region, 2023 & 2033 (%)
Figure 39 Neurotech Devices Market by Conditions: Market Attractiveness Index
Figure 40 Neurotech Devices Market Forecast by Conditions, 2023-2033 (US$ million)
Figure 41 Neurotech Devices Market Share Forecast by Conditions, 2023 & 2033 (%)
Figure 42 Pain Management Market Forecast by Region, 2023-2033 (US$ million)
Figure 43 Pain Management Market Share Forecast by Region, 2023 & 2033 (%)
Figure 44 Cognitive Disorders Market Forecast by Region, 2023-2033 (US$ million)
Figure 45 Cognitive Disorders Market Share Forecast by Region, 2023 & 2033 (%)
Figure 46 Epilepsy Market Forecast by Region, 2023-2033 (US$ million)
Figure 47 Epilepsy Market Share Forecast by Region, 2023 & 2033 (%)
Figure 48 Urinary and Fecal Incontinence Market Forecast by Region, 2023-2033 (US$ million)
Figure 49 Urinary and Fecal Incontinence Market Share Forecast by Region, 2023 & 2033 (%)
Figure 50 Hearing Conditions Market Forecast by Region, 2023-2033 (US$ million)
Figure 51 Hearing Conditions Market Share Forecast by Region, 2023 & 2033 (%)
Figure 52 Parkinson’s Diseases Market Forecast by Region, 2023-2033 (US$ million)
Figure 53 Parkinson’s Diseases Market Share Forecast by Region, 2023 & 2033 (%)
Figure 54 Depression Market Forecast by Region, 2023-2033 (US$ million)
Figure 55 Depression Market Share Forecast by Region, 2023 & 2033 (%)
Figure 56 Sleep Disorders Market Forecast by Region, 2023-2033 (US$ million)
Figure 57 Sleep Disorders Market Share Forecast by Region, 2023 & 2033 (%)
Figure 58 Essential Tremor Market Forecast by Region, 2023-2033 (US$ million)
Figure 59 Essential Tremor Market Share Forecast by Region, 2023 & 2033 (%)
Figure 60 Others Market Forecast by Region, 2023-2033 (US$ million)
Figure 61 Others Market Share Forecast by Region, 2023 & 2033 (%)
Figure 62 Neurotech devices market by Application: Market Attractiveness Index
Figure 63 Neurotech Devices Market Forecast by End use, 2023-2033 (US$ million)
Figure 64 Neurotech Devices Market Share Forecast by End use, 2023 & 2033 (%)
Figure 65 Hospitals Neurotech Devices Market Forecast by Region, 2023-2033 (US$ million)
Figure 66 Hospitals Neurotech Market Share Forecast by Region, 2023 & 2033 (%)
Figure 67 Ambulatory Surgical Centers Market Forecast by Region, 2023-2033 (US$ million)
Figure 68 Ambulatory Surgical Centers Market Share Forecast by Region, 2023 & 2033 (%)
Figure 69 Homecare Facilities Market Forecast by Region, 2023-2033 (US$ million)
Figure 70 Homecare Facilities Market Share Forecast by Region, 2023 & 2033 (%)
Figure 71 Others Market Forecast by Region, 2023-2033 (US$ million)
Figure 72 Others Market Share Forecast by Region, 2023 & 2033 (%)
Figure 73 Neurotech Devices Market by Region: Market Attractiveness Index
Figure 74 Neurotech Devices Market by Region, 2023-2033 (US$ Mn)
Figure 75 Neurotech Devices Market Share Forecast by Region 2023, 2033(%)
Figure 76 North America Neurotech Devices Market Attractiveness Index
Figure 77 North America Neurotech Devices Market by Region, 2023, 2028 & 2033 (US$ million)
Figure 78 North America Neurotech Devices Market Forecast by Country, 2023-2033 (US$ million)
Figure 79 North America Neurotech Devices Market Share Forecast by Country, 2023 & 2033 (%)
Figure 80 North America Neurotech Devices Market Forecast by Product, 2023-2033 (US$ million)
Figure 81 North America Neurotech Devices Market Forecast by Neurostimulation, 2023-2033 (US$ million)
Figure 82 North America Neurotech Devices Market Share Forecast by Product, 2023 & 2033 (%)
Figure 83 North America Neurotech Devices Market Share Forecast by Neurostimulation, 2023 & 2033 (%)
Figure 84 North America Neurotech Devices Market Forecast by Conditions, 2023-2033 (US$ million)
Figure 85 North America Neurotech Devices Market Share Forecast by Conditions, 2023 & 2033 (%)
Figure 86 North America Neurotech Devices Market Forecast by End Use, 2023-2033 (US$ million)
Figure 87 North America Neurotech Devices Market Share Forecast by End Use, 2023 & 2033 (%)
Figure 88 U.S. Neurotech Devices Market Forecast, 2023-2033 (US$ million, AGR %)
Figure 89 Canada Neurotech Devices Market Forecast, 2023-2033 (US$ million, AGR %)
Figure 90 Europe Neurotech devices market Attractiveness Index
Figure 91 Europe Neurotech Devices Market by Region, 2023, 2028 & 2033 (US$ million)
Figure 92 Europe Neurotech Devices Market Forecast by Country, 2023-2033 (US$ million)
Figure 93 Europe Neurotech Devices Market Share Forecast by Country, 2023 & 2033 (%)
Figure 94 Europe Neurotech Devices Market Forecast by Product, 2023-2033 (US$ million)
Figure 95 Europe Neurotech Devices Market Forecast by Neurostimulation, 2023-2033 (US$ million)
Figure 96 Europe Neurotech Devices Market Share Forecast by Product, 2023 & 2033 (%)
Figure 97 Europe Neurotech Devices Market Share Forecast by Neurostimulation, 2023 & 2033 (%)
Figure 98 Europe Neurotech Devices Market Forecast by Conditions, 2023-2033 (US$ million)
Figure 99 Europe Neurotech Devices Market Share Forecast by Conditions, 2023 & 2033 (%)
Figure 100 Europe Neurotech Devices Market Forecast by End Use, 2023-2033 (US$ million)
Figure 101 Europe Neurotech Devices Market Share Forecast by End Use, 2023 & 2033 (%)
Figure 102 Germany Neurotech Devices Market Forecast, 2023-2033 (US$ million, AGR %)
Figure 103 France Neurotech Devices Market Forecast, 2023-2033 (US$ million, AGR %)
Figure 104 UK Neurotech Devices Market Forecast, 2023-2033 (US$ million, AGR %)
Figure 105 Italy Neurotech Devices Market Forecast, 2023-2033 (US$ million, AGR %)
Figure 106 Spain Neurotech Devices Market Forecast, 2023-2033 (US$ million, AGR %)
Figure 107 Russia Neurotech Devices Market Forecast, 2023-2033 (US$ million, AGR %)
Figure 108 Rest of Europe Neurotech Devices Market Forecast, 2023-2033 (US$ million, AGR %)
Figure 109 Asia Pacific Neurotech Devices Market Attractiveness Index
Figure 110 Asia Pacific Neurotech Devices Market by Region, 2023, 2028 & 2033 (US$ million)
Figure 111 Asia Pacific Neurotech Devices Market Forecast, 2023-2033 (US$ million, AGR %)
Figure 112 Asia Pacific Neurotech Devices Market Share Forecast by Country, 2023 & 2033 (%)
Figure 113 Asia Pacific Neurotech Devices Market Forecast by Product, 2023-2033 (US$ million, AGR %)
Figure 114 Asia Pacific Neurotech Devices Market Forecast by Neurostimulation, 2023-2033 (US$ million, AGR %)
Figure 115 Asia Pacific Neurotech Devices Market Share Forecast by Product, 2023 & 2033 (%)
Figure 116 Asia Pacific Neurotech Devices Market Share Forecast by Neurostimulation, 2023 & 2033 (%)
Figure 117 Asia Pacific Neurotech Devices Market Forecast by Conditions, 2023-2033 (US$ million, AGR %)
Figure 118 Asia Pacific Neurotech Devices Market Share Forecast by Conditions, 2023 & 2033 (%)
Figure 119 Asia Pacific Neurotech Devices Market Forecast by End Use, 2023-2033 (US$ million, AGR %)
Figure 120 Asia Pacific Neurotech Devices Market Share Forecast by End Use, 2023 & 2033 (%)
Figure 121 Japan Neurotech Devices Market Forecast, 2023-2033 (US$ million, AGR %)
Figure 122 China Neurotech Devices Market Forecast, 2023-2033 (US$ million, AGR %)
Figure 123 India Neurotech devices market Forecast, 2023-2033 (US$ million, AGR %)
Figure 124 Australia Neurotech Devices Market Forecast, 2023-2033 (US$ million, AGR %)
Figure 125 South Korea Neurotech devices market Forecast, 2023-2033 (US$ million, AGR %)
Figure 126 Rest of Asia Pacific Neurotech Devices Market Forecast, 2023-2033 (US$ million, AGR %)
Figure 127 Latin America Neurotech Devices Market Attractiveness Index
Figure 128 Latin America Neurotech Devices Market by Country, 2023, 2028 & 2033 (US$ million)
Figure 129 LATIN AMERICA Neurotech Devices Market Forecast by Country, 2023-2033 (US$ million)
Figure 130 LATIN AMERICA Neurotech Devices Market Share Forecast by Country, 2023 & 2033 (%)
Figure 131 Latin America Neurotech Devices Market Forecast by Product, 2023-2033 (US$ million)
Figure 132 Latin America Neurotech Devices Market Forecast by Neurostimulation, 2023-2033 (US$ million)
Figure 133 Latin America Neurotech Devices Market Share Forecast by Product, 2023 & 2033 (%)
Figure 134 Latin America Neurotech Devices Market Share Forecast by Neurostimulation, 2023 & 2033 (%)
Figure 135 Latin America Neurotech Devices Market Forecast by Conditions, 2023-2033 (US$ million)
Figure 136 Latin America Neurotech Devices Market Share Forecast by Conditions, 2023 & 2033 (%)
Figure 137 Latin America Neurotech Devices Market Forecast by End Use, 2023-2033 (US$ million)
Figure 138 Latin America Neurotech Devices Market Share Forecast by End Use, 2023 & 2033 (%)
Figure 139 Brazil Neurotech Devices Market Forecast, 2023-2033 (US$ million, AGR %)
Figure 140 Mexico Neurotech Devices Market Forecast, 2023-2033 (US$ million, AGR %)
Figure 141 Rest of Latin America Neurotech Devices Market Forecast, 2023-2033 (US$ million, AGR %)
Figure 142 MEA Neurotech Devices Market Attractiveness Index
Figure 143 MEA Neurotech Devices Market by Country, 2023, 2028 & 2033 (US$ million)
Figure 144 MEA Neurotech Devices Market Forecast by Country, 2023-2033 (US$ million)
Figure 145 MEA Neurotech Devices Market Share Forecast by Country, 2023 & 2033 (%)
Figure 146 MEA Neurotech Devices Market Forecast by Product, 2023-2033 (US$ million)
Figure 147 MEA Neurotech Devices Market Forecast by Neurostimulation, 2023-2033 (US$ million)
Figure 148 MEA Neurotech Devices Market Share Forecast by Product, 2023 & 2033 (%)
Figure 149 MEA Neurotech Devices Market Share Forecast by Neurostimulation, 2023 & 2033 (%)
Figure 150 MEA Neurotech Devices Market Forecast by Conditions, 2023-2033 (US$ million)
Figure 151 MEA Neurotech Devices Market Share Forecast by Conditions, 2023 & 2033 (%)
Figure 152 MEA Neurotech Devices Market Forecast by End Use, 2023-2033 (US$ million)
Figure 153 MEA Neurotech Devices Market Share Forecast by End Use, 2023 & 2033 (%)
Figure 154 GCC Neurotech Devices Market Forecast, 2023-2033 (US$ million, AGR %)
Figure 155 South Africa Neurotech Devices Market Forecast, 2023-2033 (US$ million, AGR %)
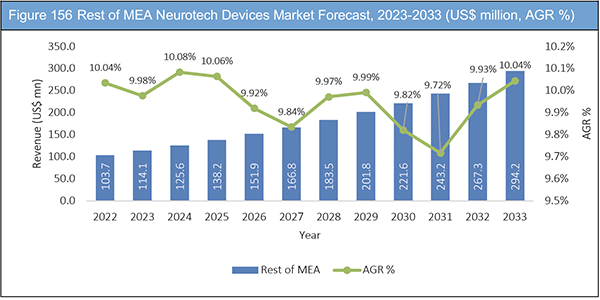
Figure 156 Rest of MEA Neurotech Devices Market Forecast, 2023-2033 (US$ million, AGR %)
Figure 157 Company Share Analysis
Figure 158 Abbott Laboratories: Net Revenue, 2017-2021 (US$ million, AGR%)
Figure 159 Abbott Laboratories: R&D, 2017-2021 (US$ million, AGR%)
Figure 160 Abbott Laboratories: Regional Market Shares, 2021
Figure 161 Boston Scientific Corporation.: Net Revenue, 2017-2021 (US$ million, AGR%)
Figure 162 Boston Scientific Corporation.: R&D, 2017-2021 (US$ million, AGR%)
Figure 163 Boston Scientific Corporation.: Regional Market Shares, 2021
Figure 164 Cochlear Limited: Net Revenue, 2017-2021 (US$ million, AGR%)
Figure 165 Cochlear Limited.: R&D, 2017-2021 (US$ million, AGR%)
Figure 166 Cochlear Limited.: Regional Market Shares, 2021
Figure 167 ElectroCore Inc: Net Revenue, 2017-2021 (US$ million, AGR%)
Figure 168 ElectroCore Inc.: R&D, 2017-2021 (US$ million, AGR%)
Figure 169 ElectroCore Inc.: Regional Market Shares, 2021
Figure 170 Helbling Holding AG: Net Revenue, 2017-2021 (US$ million, AGR%)
Figure 171 LivaNova PLC: Net Revenue, 2017-2021 (US$ million, AGR%)
Figure 172 LivaNova PLC.: R&D, 2017-2021 (US$ million, AGR%)
Figure 173 LivaNova PLC.: Regional Market Shares, 2021
Figure 174 Medtronic: Net Revenue, 2017-2021 (US$ million, AGR%)
Figure 175 Medtronic.: R&D, 2017-2021 (US$ million, AGR%)
Figure 176 Medtronic.: Regional Market Shares, 2021
Figure 177 Neuronetics, Inc: Net Revenue, 2017-2021 (US$ million, AGR%)
Figure 178 Neuronetics, Inc.: R&D, 2017-2021 (US$ million, AGR%)
Figure 179 Neuronetics, Inc.: Regional Market Shares, 2021
Figure 180 Nihon Kohden Corporation: Net Revenue, 2017-2021 (US$ million, AGR%)
Figure 181 Nihon Kohden Corporation.: R&D, 2017-2021 (US$ million, AGR%)
Figure 182 Nihon Kohden Corporation.: Regional Market Shares, 2021
ページTOPに戻る
Summary
Report Details
The Neurotech Devices Market Report 2023-2033: This report will prove invaluable to leading firms striving for new revenue pockets if they wish to better understand the industry and its underlying dynamics. It will be useful for companies that would like to expand into different industries or expand their existing operations in a new region.
Growing Number of Elderly Populations with Neurological Disorders
The rapidly growing ageing population base suffering from neurological diseases will be a pivotal factor driving the market growth. Neurological disorders such as Alzheimer’s, dementia, Parkinson’s disease and chronic back & limb pain are most likely to affect people after 65 years of age. In such conditions using neurotech device therapies plays a pivotal role in treating these disorders. For instance, spinal cord stimulation (SCS) is an effective treatment for chronic back & limb pain. Also, failed back surgery syndrome (FBSS), peripheral neuropathic pain and residual pain after joint replacement in the elderly can be treated with spinal cord stimulators. The rising geriatric population will create such scenarios for market expansion.
Lack of Resources Serving to the Needs of Patients with Neurological Disorders
Lack of skilled healthcare practitioners and availability of high-technology equipment is anticipated to hamper market growth over the forecast period. Furthermore, inadequate access to universal mental healthcare services will pose as a major challenge for market expansion. The shortage of critical resources is grave in underdeveloped regions and neglected groups that do not have access to new treatment options and improved technologies. In most of the low and middle-income countries, there is shortage of skilled healthcare staff and basic neurological diagnostic services. Lack of authentic information and switching to alternative forms of treatment options delay the treatment.
What Questions Should You Ask before Buying a Market Research Report?
• How is the Neurotech Devices Market evolving?
• What is driving and restraining the Neurotech Devices Market?
• How will each Neurotech Devices submarket grow over the forecast period and how much revenue will these submarkets account for in 2033?
• How will the market shares for each Neurotech Devices submarket develop from 2023 to 2033?
• What will be the main driver for the overall market from 2023 to 2033?
• Will leading Neurotech Devices Markets broadly follow the macroeconomic dynamics, or will individual national markets outperform others?
• How will the market shares of the national markets change by 2033 and which geographical region will lead the market in 2033?
• Who are the leading players and what are their prospects over the forecast period?
• What are the Neurotech Devices development projects for these leading companies?
• How will the industry evolve during the period between 2023 and 2033? What are the implications of Neurotech Devices development projects taking place now and over the next 10 years?
• Is there a greater need for product commercialisation to further scale the Neurotech Devices Market?
• Where is the Neurotech Devices Market heading and how can you ensure you are at the forefront of the market?
• What are the best investment options for new product and service lines?
• What are the key prospects for moving companies into a new growth path and C-suite?
You need to discover how this will impact the Neurotech Devices Market today, and over the next 10 years:
• Our 330-page report provides 131 tables and 182 charts/graphs exclusively to you.
• The report highlights key lucrative areas in the industry so you can target them – NOW.
• It contains in-depth analysis of global, regional and national sales and growth.
• It highlights for you the key successful trends, changes and revenue projections made by your competitors.
This report tells you TODAY how the Neurotech Devices Market will develop in the next 10 years, and in line with the variations in COVID-19 economic recession and bounce. This market is more critical now than at any point over the last 10 years.
Forecasts to 2033 and other analyses reveal commercial prospects
• In addition to revenue forecasting to 2033, our new study provides you with recent results, growth rates, and market shares.
• You will find original analyses, with business outlooks and developments.
• Discover qualitative analyses (including market dynamics, drivers, opportunities, restraints and challenges), cost structure, the impact of rising neurotech devices prices and recent developments.
This report includes data analysis and invaluable insight into how COVID-19 will affect the industry and your company. Four COVID-19 recovery patterns and their impact, namely, “V”, “L”, “W” and “U” are discussed in this report.
Segments Covered in the Report
By Product
• Neurostimulation
– Deep Brain Stimulator
– Gastric Electric Stimulator
– Spinal Cord Stimulator
– Sacral Nerve Stimulator
– Vagus Nerve Stimulator
– Transcutaneous Electrical Nerve Stimulation
• Neuroprostheses
• Neurosensing
• Neurorehabilitation
By Conditions
• Pain Management
• Cognitive Disorders
• Epilepsy
• Urinary and Fecal Incontinence
• Hearing Conditions
• Parkinson’s Disease
• Depression
• Sleep Disorders
• Essential Tremor
• Others
By End-use
• Hospitals
• Ambulatory Surgical Centers
• Homecare Facilities
• Others
In addition to the revenue predictions for the overall world market and segments, you will also find revenue forecasts for five regional and 16 leading national markets:
North America
• U.S.
• Canada
Europe
• Germany
• UK
• France
• Spain
• Italy
• Rest of Europe
Asia Pacific
• China
• Japan
• India
• Australia
• South Korea
• Rest of Asia Pacific
Latin America
• Brazil
• Mexico
• Rest of Latin America
MEA
• GCC
• South Africa
• Rest of MEA
The report also includes profiles and for some of the leading companies in the Neurotech Devices Market, 2023 to 2033, with a focus on this segment of these companies’ operations.
Leading companies and the potential for market growth
• Abbott Laboratories
• Advanced Bionics AG (Sonova)
• Boston Scientific Corporation
• BrainCo, Inc
• Cochlear Limited
• ElectroCore Inc
• Helbling Holding AG
• Innovative Health Solutions, Inc
• LivaNova PLC
• Medtronic
• MicroTransponder
• Natus medical Incorporated
• Neuronetics, Inc.
• Nihon Kohden Corporation
• Parasym Ltd.
• Synapse Biomedical
• tVNS Technologies GmbH (Cerbomed)
Overall world revenue for Neurotech Devices Market, 2023 to 2033 in terms of value the market will surpass US$13,102.0 million in 2023, our work calculates. We predict strong revenue growth through to 2033. Our work identifies which organizations hold the greatest potential. Discover their capabilities, progress, and commercial prospects, helping you stay ahead.
How will the Neurotech Devices Market, 2023 to 2033 report help you?
In summary, our 330-page report provides you with the following knowledge:
• Revenue forecasts to 2033 for Neurotech Devices Market, 2023 to 2033 Market, with forecasts for product, conditions, end-use, each forecast at a global and regional level – discover the industry’s prospects, finding the most lucrative places for investments and revenues.
• Revenue forecasts to 2033 for five regional and 16 key national markets – See forecasts for the Neurotech Devices Market, 2023 to 2033 market in North America, Europe, Asia-Pacific and Latin America and Middle East and Africa. Also forecasted is the market in the US, Canada, Mexico, Brazil, Germany, France, UK, Italy, China, India, Japan, and Australia among other prominent economies.
• Prospects for established firms and those seeking to enter the market – including company profiles of the major companies involved in the Neurotech Devices Market, 2023 to 2033.
Find quantitative and qualitative analyses with independent predictions. Receive information that only our report contains, staying informed with invaluable business intelligence.
Information found nowhere else
With our new report, you are less likely to fall behind in knowledge or miss out on opportunities. See how our work could benefit your research, analyses, and decisions. Visiongain’s study is for everybody needing commercial analyses for the Neurotech Devices Market, 2023 to 2033, market-leading companies. You will find data, trends and predictions.
ページTOPに戻る
Table of Contents
Table of Contents
1. Report Overview
1.1 Objectives of the Study
1.2 Introduction to Neurotech Devices Market
1.3 What This Report Delivers
1.4 Why You Should Read This Report
1.5 Key Questions Answered by This Analytical Report
1.6 Who is This Report for?
1.7 Methodology
1.7.1 Market Definitions
1.7.2 Market Evaluation & Forecasting Methodology
1.7.3 Data Validation
1.7.3.1 Primary Research
1.7.3.2 Secondary Research
1.8 Frequently Asked Questions (FAQs)
1.9 Associated Visiongain Reports
1.10 About Visiongain
2 Executive Summary
3 Market Overview
3.1 Key Findings
3.2 Market Dynamics
3.2.1 Market Driving Factors
3.2.1.1 Increasing Prevalence of Neurological Disorders
3.2.1.2 Growing Investments by Companies and Organizations Across the Globe
3.2.1.3 Technological Advancements in Neurotech Devices
3.2.1.4 Increasing awareness and funding in neurotech industry
3.2.2 Market Restraining Factors
3.2.2.1 Lack of Skilled Healthcare Practitioners
3.2.3 Market Opportunities
3.2.3.1 Rising Demand for Minimally Invasive Surgeries in Developed Countries
3.2.3.2 Increasing Number of Elderly Patients with Neurological Disorders
3.3 COVID-19 Impact Analysis
3.4 Porter’s Five Forces Analysis
3.4.1 Bargaining Power of Suppliers
3.4.2 Bargaining Power of Buyers
3.4.3 Competitive Rivalry
3.4.4 Threat from Substitutes
3.4.5 Threat of New Entrants
3.5 PEST Analysis
4 Neurotech Devices Market Analysis by Product
4.1 Key Findings
4.2 Product Segment: Market Attractiveness Index
4.3 Neurotech Devices Market Size Estimation and Forecast by Product
4.4 Neurostimulation
4.4.1 Deep Brain Stimulator
4.4.1.1 Market Size by Region, 2023-2033 (US$ Mn)
4.4.1.2 Market Share by Region, 2023 & 2033 (%)
4.4.2 Gastric Electric Stimulator
4.4.2.1 Market Size by Region, 2023-2033 (US$ Mn)
4.4.2.2 Market Share by Region, 2023 & 2033 (%)
4.4.3 Spinal Cord Stimulator
4.4.3.1 Market Size by Region, 2023-2033 (US$ Mn)
4.4.3.2 Market Share by Region, 2023 & 2033 (%)
4.4.4 Sacral Nerve Stimulator
4.4.4.1 Market Size by Region, 2023-2033 (US$ Mn)
4.4.4.2 Market Share by Region, 2023 & 2033 (%)
4.4.5 Vagus Nerve Stimulator
4.4.5.1 Market Size by Region, 2023-2033 (US$ Mn)
4.4.5.2 Market Share by Region, 2023 & 2033 (%)
4.4.6 Transcutaneous Electrical Nerve Stimulation (TENS)
4.4.6.1 Market Size by Region, 2023-2033 (US$ Mn)
4.4.6.2 Market Share by Region, 2023 & 2033 (%)
4.4.7 Others
4.4.7.1 Market Size by Region, 2023-2033 (US$ Mn)
4.4.7.2 Market Share by Region, 2023 & 2033 (%)
4.5 Neuroprostheses
4.5.1 Market Size by Region, 2023-2033 (US$ Mn)
4.5.2 Market Share by Region, 2023 & 2033 (%)
4.6 Neurosensing
4.6.1 Market Size by Region, 2023-2033 (US$ Mn)
4.6.2 Market Share by Region, 2023 & 2033 (%)
4.7 Neurorehabilitation
4.7.1 Market Size by Region, 2023-2033 (US$ Mn)
4.7.2 Market Share by Region, 2023 & 2033 (%)
5 Neurotech devices market Analysis by Conditions
5.1 Key Findings
5.2 Conditions Segment: Market Attractiveness Index
5.3 Neurotech Devices Market Size Estimation and Forecast by Conditions
5.4 Pain Management
5.4.1 Market Size by Region, 2023-2033 (US$ Mn)
5.4.2 Market Share by Region, 2023 & 2033 (%)
5.5 Cognitive Disorders
5.5.1 Market Size by Region, 2023-2033 (US$ Mn)
5.5.2 Market Share by Region, 2023 & 2033 (%)
5.6 Epilepsy
5.6.1 Market Size by Region, 2023-2033 (US$ Mn)
5.6.2 Market Share by Region, 2023 & 2033 (%)
5.7 Urinary and Fecal Incontinence
5.7.1 Market Size by Region, 2023-2033 (US$ Mn)
5.7.2 Market Share by Region, 2023 & 2033 (%)
5.8 Hearing Conditions
5.8.1 Market Size by Region, 2023-2033 (US$ Mn)
5.8.2 Market Share by Region, 2023 & 2033 (%)
5.9 Parkinson’s Diseases
5.9.1 Market Size by Region, 2023-2033 (US$ Mn)
5.9.2 Market Share by Region, 2023 & 2033 (%)
5.10 Depression
5.10.1 Market Size by Region, 2023-2033 (US$ Mn)
5.10.2 Market Share by Region, 2023 & 2033 (%)
5.11 Sleep Disorders
5.11.1 Market Size by Region, 2023-2033 (US$ Mn)
5.11.2 Market Share by Region, 2023 & 2033 (%)
5.12 Essential Tremor
5.12.1 Market Size by Region, 2023-2033 (US$ Mn)
5.12.2 Market Share by Region, 2023 & 2033 (%)
5.13 Others
5.13.1 Market Size by Region, 2023-2033 (US$ Mn)
5.13.2 Market Share by Region, 2023 & 2033 (%)
6 Neurotech devices market Analysis by End use
6.1 Key Findings
6.2 End use Segment: Market Attractiveness Index
6.3 Neurotech Devices Market Size Estimation and Forecast by End use
6.4 Hospitals
6.4.1 Market Size by Region, 2023-2033 (US$ Mn)
6.4.2 Market Share by Region, 2023 & 2033 (%)
6.5 Ambulatory Surgical Centers
6.5.1 Market Size by Region, 2023-2033 (US$ Mn)
6.5.2 Market Share by Region, 2023 & 2033 (%)
6.6 Homecare Facilities
6.6.1 Market Size by Region, 2023-2033 (US$ Mn)
6.6.2 Market Share by Region, 2023 & 2033 (%)
6.7 Others
6.7.1 Market Size by Region, 2023-2033 (US$ Mn)
6.7.2 Market Share by Region, 2023 & 2033 (%)
7 Neurotech Devices Market Analysis by Region
7.1 Key Findings
7.2 Regional Segment: Market Attractiveness Index
7.3 Neurotech Devices Market Size Estimation and Forecast
8 North America Neurotech Devices Market Analysis
8.1 Key Findings
8.2 North America Neurotech Devices Market Attractiveness Index
8.3 North America Neurotech Devices Market by Country, 2023, 2028 & 2033 (US$ Mn)
8.4 North America Neurotech Devices Market Size Estimation and Forecast by Country
8.5 North America Neurotech Devices Market Size Estimation and Forecast by Product
8.6 North America Neurotech Devices Market Size Estimation and Forecast by Conditions
8.7 North America Neurotech Devices Market Size Estimation and Forecast by End Use
8.8 U.S. Neurotech Devices Market Analysis
8.9 Canada Neurotech Devices Market Analysis
9 Europe Neurotech Devices Market Analysis
9.1 Key Findings
9.2 Europe Neurotech devices market Attractiveness Index
9.3 Europe Neurotech Devices Market by Country, 2023, 2028 & 2033 (US$ Mn)
9.4 Europe Neurotech Devices Market Size Estimation and Forecast by Country
9.5 Europe Neurotech Devices Market Size Estimation and Forecast by Product
9.6 Europe Neurotech Devices Market Size Estimation and Forecast by Conditions
9.7 Europe Neurotech Devices Market Size Estimation and Forecast by End Use
9.8 Germany Neurotech Devices Market Analysis
9.9 France Neurotech Devices Market Analysis
9.10 UK Neurotech Devices Market Analysis
9.11 Italy Neurotech devices market Analysis
9.12 Spain Neurotech Devices Market Analysis
9.13 Russia Neurotech Devices Market Analysis
9.14 Rest of Europe Neurotech Devices Market Analysis
10 Asia Pacific Neurotech Devices Market Analysis
10.1 Key Findings
10.2 Asia Pacific Neurotech Devices Market Attractiveness Index
10.3 Asia Pacific Neurotech Devices Market by Country, 2023, 2028 & 2033 (US$ Mn)
10.4 Asia Pacific Neurotech Devices Market Size Estimation and Forecast by Country
10.5 Asia Pacific Neurotech Devices Market Size Estimation and Forecast by Product
10.6 Asia Pacific Neurotech Devices Market Analysis by Conditions
10.7 Asia Pacific Neurotech Devices Market Analysis by End Use
10.8 Japan Neurotech Devices Market Analysis
10.9 China Neurotech Devices Market Analysis
10.10 India Neurotech Devices Market Analysis
10.11 Australia Neurotech devices market Analysis
10.12 South Korea Neurotech Devices Market Analysis
10.13 Rest of Asia Pacific Neurotech Devices Market Analysis
11 Latin America Neurotech Devices Market Analysis
11.1 Key Findings
11.2 Latin America Neurotech devices market Attractiveness Index
11.3 Latin America Neurotech Devices Market by Country, 2023, 2028 & 2033 (US$ Mn)
11.4 Latin America Neurotech Market Size Estimation and Forecast by Country
11.5 Latin America Neurotech Devices Market Size Estimation and Forecast by Product
11.6 Latin America Neurotech Devices Market Size Estimation and Forecast by Conditions
11.7 Latin America Neurotech Devices Market Size Estimation and Forecast by End Use
11.8 Brazil Neurotech Devices Market Analysis
11.9 Mexico Neurotech Devices Market Analysis
11.10 Rest of Latin America Neurotech Devices Market Analysis
12 MEA Neurotech Devices Market Analysis
12.1 Key Findings
12.2 MEA Neurotech Devices Market Attractiveness Index
12.3 MEA Neurotech Devices Market by Country, 2023, 2028 & 2033 (US$ Mn)
12.4 MEA Neurotech Devices Market Size Estimation and Forecast by Country
12.5 MEA Neurotech Devices Market Size Estimation and Forecast by Product
12.6 MEA Neurotech Devices Market Size Estimation and Forecast by Conditions
12.7 MEA Neurotech Devices Market Size Estimation and Forecast by End Use
12.8 GCC Neurotech devices market Analysis
12.9 South Africa Neurotech Devices Market Analysis
12.10 Rest of MEA Neurotech Devices Market Analysis
13 Company Profiles
13.1 Competitive Landscape
13.1.1 Medtronic
13.1.2 Boston Scientific Corporation
13.1.3 Abbott Laboratories
13.1.4 LivaNova PLC
13.2 Abbott Laboratories
13.2.1 Company Snapshot
13.2.2 Company Overview
13.2.3 Financial Analysis
13.2.3.1 Net Revenue, 2017-2021
13.2.3.2 R&D, 2017-2021
13.2.3.3 Regional Market Shares, 2021
13.2.4 Product Benchmarking
13.2.5 Strategic Outlook
13.3 Advanced Bionics AG (Sonova)
13.3.1 Company Snapshot
13.3.2 Company Overview
13.3.3 Product Benchmarking
13.3.4 Strategic Outlook
13.4 Boston Scientific Corporation
13.4.1 Company Snapshot
13.4.2 Company Overview
13.4.3 Financial Analysis
13.4.3.1 Net Revenue, 2017-2021
13.4.3.2 R&D, 2017-2021
13.4.3.3 Regional Market Shares, 2021
13.4.4 Product Benchmarking
13.4.5 Strategic Outlook
13.5 BrainCo, Inc
13.5.1 Company Snapshot
13.5.2 Company Overview
13.5.3 Product Benchmarking
13.5.4 Strategic Outlook
13.6 Cochlear Limited
13.6.1 Company Snapshot
13.6.2 Company Overview
13.6.3 Financial Analysis
13.6.3.1 Net Revenue, 2017-2021
13.6.3.2 R&D, 2017-2021
13.6.3.3 Regional Market Shares, 2021
13.6.4 Product Benchmarking
13.6.5 Strategic Outlook
13.7 ElectroCore Inc
13.7.1 Company Snapshot
13.7.2 Company Overview
13.7.3 Financial Analysis
13.7.3.1 Net Revenue, 2017-2021
13.7.3.2 R&D, 2017-2021
13.7.3.3 Regional Market Shares, 2021
13.7.4 Product Benchmarking
13.7.5 Strategic Outlook
13.8 Helbling Holding AG
13.8.1 Company Snapshot
13.8.2 Company Overview
13.8.3 Financial Analysis
13.8.3.1 Net Revenue, 2017-2021
13.8.4 Product Benchmarking
13.8.5 Strategic Outlook
13.9 Innovative Health Solutions, Inc
13.9.1 Company Snapshot
13.9.2 Company Overview
13.9.3 Product Benchmarking
13.9.4 Strategic Outlook
13.10 LivaNova PLC
13.10.1 Company Snapshot
13.10.2 Company Overview
13.10.3 Financial Analysis
13.10.3.1 Net Revenue, 2017-2021
13.10.3.2 R&D, 2017-2021
13.10.3.3 Regional Market Shares, 2021
13.10.4 Product Benchmarking
13.10.5 Strategic Outlook
13.11 Medtronic
13.11.1 Company Snapshot
13.11.2 Company Overview
13.11.3 Financial Analysis
13.11.3.1 Net Revenue, 2017-2021
13.11.3.2 R&D, 2017-2021
13.11.3.3 Regional Market Shares, 2021
13.11.4 Product Benchmarking
13.11.5 Strategic Outlook
13.12 MicroTransponder
13.12.1 Company Snapshot
13.12.2 Company Overview
13.12.3 Product Benchmarking
13.12.4 Strategic Outlook
13.13 Neuronetics, Inc.
13.13.1 Company Snapshot
13.13.2 Company Overview
13.13.3 Financial Analysis
13.13.3.1 Net Revenue, 2017-2021
13.13.3.2 R&D, 2017-2021
13.13.3.3 Regional Market Shares, 2021
13.13.4 Product Benchmarking
13.13.5 Strategic Outlook
13.14 Nihon Kohden Corporation
13.14.1 Company Snapshot
13.14.2 Company Overview
13.14.3 Financial Analysis
13.14.3.1 Net Revenue, 2017-2021
13.14.3.2 R&D, 2017-2021
13.14.3.3 Regional Market Shares, 2021
13.14.4 Product Benchmarking
13.14.5 Strategic Outlook
13.15 Natus medical Incorporated
13.15.1 Company Snapshot
13.15.2 Company Overview
13.15.3 Product Benchmarking
13.15.4 Strategic Outlook
13.16 Parasym Ltd.
13.16.1 Company Snapshot
13.16.2 Company Overview
13.16.3 Product Benchmarking
13.16.4 Strategic Outlook
13.17 Synapse Biomedical Inc.
13.17.1 Company Snapshot
13.17.2 Company Overview
13.17.3 Product Benchmarking
13.17.4 Strategic Outlook
13.18 tVNS Technologies GmbH (Cerbomed)
13.18.1 Company Snapshot
13.18.2 Company Overview
13.18.3 Product Benchmarking
13.18.4 Strategic Outlook
14 Conclusion and Recommendations
14.1 Concluding Remarks from Visiongain
14.2 Recommendations for Market Players
List of Tables
Table 1 Neurotech devices market Snapshot, 2023 & 2033 (US$ million, CAGR %)
Table 2 Neurotech Devices Market by Region, 2023-2033 (US$ Mn, AGR (%), CAGR (%)): “V” Shaped Recovery Scenario
Table 3 Neurotech Devices Market by Region, 2023-2033 (US$ Mn, AGR (%), CAGR (%)): “U” Shaped Recovery Scenario
Table 4 Neurotech Devices Market by Region, 2023-2033 (US$ Mn, AGR (%), CAGR (%)): “W” Shaped Recovery Scenario
Table 5 Neurotech Devices Market by Region, 2023-2033 (US$ Mn, AGR (%), CAGR (%)): “L” Shaped Recovery Scenario
Table 6 Neurotech Devices Market by Product, 2023-2033 (US$ Mn, AGR (%), CAGR (%))
Table 7 Neurotech Devices Market by Neurostimulation, 2023-2033 (US$ Mn, AGR (%), CAGR (%))
Table 8 Deep Brain Stimulator Market Forecast by Region, 2023-2033 (US$ Mn, AGR%, CAGR%)
Table 9 Gastric Electric Stimulator Market Forecast by Region, 2023-2033 (US$ Mn, AGR%, CAGR%)
Table 10 Spinal Cord Stimulator Market Forecast by Region, 2023-2033 (US$ Mn, AGR%, CAGR%)
Table 11 Sacral Nerve Stimulator Market Forecast by Region, 2023-2033 (US$ Mn, AGR%, CAGR%)
Table 12 Vagus Nerve Stimulator Market Forecast by Region, 2023-2033 (US$ Mn, AGR%, CAGR%)
Table 13 Transcutaneous Electrical Nerve Stimulation (TENS)Market Forecast by Region, 2023-2033 (US$ Mn, AGR%, CAGR%)
Table 14 Others Market Forecast by Region, 2023-2033 (US$ Mn, AGR%, CAGR%)
Table 15 Neuroprostheses Market Forecast by Region, 2023-2033 (US$ Mn, AGR%, CAGR%)
Table 16 Neurosensing Market Forecast by Region, 2023-2033 (US$ Mn, AGR%, CAGR%)
Table 17 Neurorehabilitation Market Forecast by Region, 2023-2033 (US$ Mn, AGR%, CAGR%)
Table 18 Neurotech Devices Market by Conditions, 2023-2033 (US$ Mn, AGR (%), CAGR (%))
Table 19 Pain Management Market Forecast by Region, 2023-2033 (US$ Mn, AGR%, CAGR%)
Table 20 Cognitive Disorders Market Forecast by Region, 2023-2033 (US$ Mn, AGR%, CAGR%)
Table 21 Epilepsy Market Forecast by Region, 2023-2033 (US$ Mn, AGR%, CAGR%)
Table 22 Urinary and Fecal Incontinence Market Forecast by Region, 2023-2033 (US$ Mn, AGR%, CAGR%
Table 23 Hearing Conditions Market Forecast by Region, 2023-2033 (US$ Mn, AGR%, CAGR%)
Table 24 Parkinson’s Diseases Market Forecast by Region, 2023-2033 (US$ Mn, AGR%, CAGR%)
Table 25 Depression Market Forecast by Region, 2023-2033 (US$ Mn, AGR%, CAGR%)
Table 26 Sleep Disorders Market Forecast by Region, 2023-2033 (US$ Mn, AGR%, CAGR%)
Table 27 Essential Tremor Market Forecast by Region, 2023-2033 (US$ Mn, AGR%, CAGR%)
Table 28 Others Market Forecast by Region, 2023-2033 (US$ Mn, AGR%, CAGR%)
Table 29 Neurotech Devices Market by End Use, 2023-2033 (US$ Mn, AGR (%), CAGR (%))
Table 30 Hospitals Neurotech Devices Market Forecast by Region, 2023-2033 (US$ Mn, AGR%, CAGR%)
Table 31 Ambulatory Surgical Centers Market Forecast by Region, 2023-2033 (US$ Mn, AGR%, CAGR%)
Table 32 Homecare Facilities Market Forecast by Region, 2023-2033 (US$ Mn, AGR%, CAGR%)
Table 33 Others Market Forecast by Region, 2023-2033 (US$ Mn, AGR%, CAGR%)
Table 34 Neurotech Devices Market by Region, 2023-2033 (US$ Mn, AGR (%), CAGR (%))
Table 35 North America Neurotech Devices Market Size Estimation and Forecast by Country
Table 36 North America Neurotech Devices Market by Product, 2023-2033 (US$ Mn, AGR (%), CAGR (%))
Table 37 North America Neurotech Devices Market by Neurostimulation, 2023-2033 (US$ Mn, AGR (%), CAGR (%))
Table 38 North America Neurotech Devices Market by Conditions, 2023-2033 (US$ Mn, AGR (%), CAGR (%))
Table 39 Neurotech Devices Market by End use, 2023-2033 (US$ Mn, AGR (%), CAGR (%))
Table 40 U.S. Neurotech Devices Market Forecast, 2023-2033 (US$ Mn, AGR %, CAGR %)
Table 41 Canada Neurotech Devices Market Forecast, 2023-2033 (US$ Mn, AGR %, CAGR %)
Table 42 Europe Neurotech devices market Forecast by Country, 2023-2033 (US$ Mn, AGR%, CAGR%)
Table 43 Europe Neurotech Devices Market by Product, 2023-2033 (US$ Mn, AGR (%), CAGR (%))
Table 44 Europe Neurotech Devices Market by Neurostimulation, 2023-2033 (US$ Mn, AGR (%), CAGR (%))
Table 45 Europe Neurotech Devices Market by Conditions, 2023-2033 (US$ Mn, AGR (%), CAGR (%))
Table 46 Neurotech Devices Market by End use, 2023-2033 (US$ Mn, AGR (%), CAGR (%))
Table 47 Germany Neurotech Devices Market Forecast, 2023-2033 (US$ Mn, AGR (%), CAGR (%)):
Table 48 France Neurotech Devices Market Forecast: 2023-2033 (US$ Mn, AGR (%), CAGR (%)):
Table 49 UK Neurotech Devices Market Forecast: 2023-2033 (US$ Mn, AGR (%), CAGR (%))
Table 50 Italy Neurotech Devices Market Forecast: 2023-2033 (US$ Mn, AGR (%), CAGR (%)):
Table 51 Spain Neurotech Devices Market Forecast: 2023-2033 (US$ Mn, AGR (%), CAGR (%)):
Table 52 Russia Neurotech Devices Market Forecast: 2023-2033 (US$ Mn, AGR (%), CAGR (%)):
Table 53 Rest of Europe Neurotech Devices Market Forecast: 2023-2033 (US$ Mn, AGR (%), CAGR (%)):
Table 54 Asia Pacific Neurotech Market Forecast by Country, 2023-2033 (US$ Mn, AGR%, CAGR%)
Table 55 Asia Pacific Neurotech Devices Market by Product, 2023-2033 (US$ Mn, AGR (%), CAGR (%))
Table 56 Asia Pacific Neurotech Devices Market by Neurostimulation, 2023-2033 (US$ Mn, AGR (%), CAGR (%))
Table 57 Asia Pacific Neurotech Devices Market by Conditions, 2023-2033 (US$ Mn, AGR (%), CAGR (%))
Table 58 Asia Pacific Neurotech Devices Market by End Use, 2023-2033 (US$ Mn, AGR (%), CAGR (%))
Table 59 Japan Neurotech Devices Market Forecast: 2023-2033 (US$ Mn, AGR (%), CAGR (%)):
Table 60 China Neurotech Devices Market Forecast, 2023-2033 (US$ Mn, AGR%, CAGR%)
Table 61 India Neurotech Devices Market Forecast, 2023-2033 (US$ Mn, AGR%, CAGR%)
Table 62 Australia Neurotech Devices Market Forecast, 2023-2033 (US$ Mn, AGR%, CAGR%)
Table 63 South Korea Neurotech Devices Market Forecast: 2023-2033 (US$ Mn, AGR (%), CAGR(%)):
Table 64 Rest of Asia Pacific Neurotech Devices Market Forecast, 2023-2033 (US$ Mn, AGR%, CAGR%)
Table 65 Latin America Neurotech Market Forecast by Country, 2023-2033 (US$ Mn, AGR%, CAGR%)
Table 66 Latin America Neurotech Devices Market by Product, 2023-2033 (US$ Mn, AGR (%), CAGR (%))
Table 67 Latin America Neurotech Devices Market by Neurostimulation, 2023-2033 (US$ Mn, AGR (%), CAGR (%))
Table 68 Latin America Neurotech Devices Market by Conditions, 2023-2033 (US$ Mn, AGR (%), CAGR (%))
Table 69 Latin America Neurotech Devices Market by End Use, 2023-2033 (US$ Mn, AGR (%), CAGR (%))
Table 70 Brazil Neurotech Devices Market Forecast, 2023-2033 (US$ Mn, AGR%, CAGR%)
Table 71 Mexico Neurotech Devices Market Forecast, 2023-2033 (US$ Mn, AGR%, CAGR%)
Table 72 Rest of Latin America Neurotech Devices Forecast, 2023-2033 (US$ Mn, AGR%, CAGR%)
Table 73 MEA Neurotech Devices Forecast by Country, 2023-2033 (US$ Mn, AGR%, CAGR%)
Table 74 MEA Neurotech Devices Market by Product, 2023-2033 (US$ Mn, AGR (%), CAGR (%))
Table 75 MEA Neurotech Devices Market by Neurostimulation, 2023-2033 (US$ Mn, AGR (%), CAGR (%))
Table 76 MEA Neurotech Devices Market by Conditions, 2023-2033 (US$ Mn, AGR (%), CAGR (%))
Table 77 MEA Neurotech Devices Market by End Use, 2023-2033 (US$ Mn, AGR (%), CAGR (%))
Table 78 GCC Neurotech devices market Forecast, 2023-2033 (US$ Mn, AGR%, CAGR%)
Table 79 South Africa Neurotech Devices Market Forecast, 2023-2033 (US$ Mn, AGR%, CAGR%)
Table 80 Rest of MEA Neurotech Devices Market Forecast, 2023-2033 (US$ Mn, AGR%, CAGR%)
Table 81 Abbott Laboratories: Key Details, (CEO, HQ, Revenue, Founded, No. of Employees, Company Type, Website, Business Segment)
Table 82 Abbott Laboratories: Product Benchmarking
Table 83 Abbott Laboratories: Strategic Outlook
Table 84 Advanced Bionics AG (Sonova): Key Details, (CEO, HQ, Revenue, Founded, No. of Employees, Company Type, Website, Business Segment)
Table 85 Advanced Bionics AG (Sonova).: Product Benchmarking
Table 86 Advanced Bionics AG (Sonova).: Strategic Outlook
Table 87 Boston Scientific Corporation, Inc.: Key Details, (CEO, HQ, Revenue, Founded, No. of Employees, Company Type, Website, Business Segment)
Table 88 Boston Scientific Corporation.: Product Benchmarking
Table 89 Boston Scientific Corporation.: Strategic Outlook
Table 90 BrainCo, Inc: Key Details, (CEO, HQ, Revenue, Founded, No. of Employees, Company Type, Website, Business Segment)
Table 91 BrainCo, Inc.: Product Benchmarking
Table 92 BrainCo, Inc.: Strategic Outlook
Table 93 Cochlear Limited: Key Details, (CEO, HQ, Revenue, Founded, No. of Employees, Company Type, Website, Business Segment)
Table 94 Cochlear Limited.: Product Benchmarking
Table 95 Cochlear Limited.: Strategic Outlook
Table 96 ElectroCore Inc: Key Details, (CEO, HQ, Revenue, Founded, No. of Employees, Company Type, Website, Business Segment)
Table 97 ElectroCore Inc.: Product Benchmarking
Table 98 ElectroCore Inc.: Strategic Outlook
Table 99 Helbling Holding AG: Key Details, (CEO, HQ, Revenue, Founded, No. of Employees, Company Type, Website, Business Segment)
Table 100 Helbling Holding AG.: Product Benchmarking
Table 101 Helbling Holding AG.: Strategic Outlook
Table 102 Innovative Health Solutions: Key Details, (CEO, HQ, Revenue, Founded, No. of Employees, Company Type, Website, Business Segment)
Table 103 Innovative Health Solutions.: Product Benchmarking
Table 104 Innovative Health Solutions: Strategic Outlook
Table 105 LivaNova PLC: Key Details, CEO, HQ, Revenue, Founded, No. of Employees, Company Type, Website, Business Segment
Table 106 LivaNova PLC.: Product Benchmarking
Table 107 LivaNova PLC: Strategic Outlook
Table 108 Medtronic, (CEO, HQ, Revenue, Founded, No. of Employees, Company Type, Website, Business Segment)
Table 109 Medtronic.: Product Benchmarking
Table 110 Medtronic.: Strategic Outlook
Table 111 MicroTransponder: Key Details, (CEO, HQ, Revenue, Founded, No. of Employees, Company Type, Website, Business Segment)
Table 112 MicroTransponder.: Product Benchmarking
Table 113 MicroTransponder.: Strategic Outlook
Table 114 Neuronetics, Inc: Key Details, (CEO, HQ, Revenue, Founded, No. of Employees, Company Type, Website, Business Segment)
Table 115 Neuronetics, Inc.: Product Benchmarking
Table 116 Neuronetics, Inc.: Strategic Outlook
Table 117 Nihon Kohden Corporation: Key Details, (CEO, HQ, Revenue, Founded, No. of Employees, Company Type, Website, Business Segment)
Table 118 Nihon Kohden Corporation.: Product Benchmarking
Table 119 Nihon Kohden Corporation.: Strategic Outlook
Table 120 Natus medical Incorporated: Key Details, (CEO, HQ, Revenue, Founded, No. of Employees, Company Type, Website, Business Segment)
Table 121 Natus medical Incorporated.: Product Benchmarking
Table 122 Natus medical Incorporated.: Strategic Outlook
Table 123 Parasym Ltd: Key Details, (CEO, HQ, Revenue, Founded, No. of Employees, Company Type, Website, Business Segment)
Table 124 Parasym Ltd.: Product Benchmarking
Table 125 Parasym Ltd.: Strategic Outlook
Table 126 Synapse Biomedical Inc: Key Details, (CEO, HQ, Revenue, Founded, No. of Employees, Company Type, Website, Business Segment)
Table 127 Synapse Biomedical Inc.: Product Benchmarking
Table 128 Synapse Biomedical Inc.: Strategic Outlook
Table 129 tVNS Technologies GmbH (Cerbomed): Key Details, (CEO, HQ, Revenue, Founded, No. of Employees, Company Type, Website, Business Segment)
Table 130 tVNS Technologies GmbH (Cerbomed).: Product Benchmarking
Table 131 tVNS Technologies GmbH (Cerbomed).: Strategic Outlook
List of Figures
Figure 1 Neurotech Devices Market Segmentation
Figure 2 Neurotech Devices Market by Product: Market Attractiveness Index
Figure 3 Neurotech Devices Market by Conditions: Market Attractiveness Index
Figure 4 Neurotech Devices Market by End Use: Market Attractiveness Index
Figure 5 Neurotech Devices Market Attractiveness Index by Region
Figure 6 Neurotech devices market: Market Dynamics
Figure 7 Neurotech Devices Market by Region, 2023-2033 (US$ Mn, AGR (%), CAGR (%)): “V” Shaped Recovery
Figure 8 Neurotech Devices Market by Region, 2023-2033 (US$ Mn, AGR (%), CAGR (%)): “U” Shaped Recovery
Figure 9 Neurotech Devices Market by Region, 2023-2033 (US$ Mn, AGR (%), CAGR (%)): “W” Shaped Recovery
Figure 10 Neurotech Devices Market by Region, 2023-2033 (US$ Mn, AGR (%), CAGR (%)): “L” Shaped Recovery
Figure 11 Neurotech Devices Market: Porter’s Five Forces Analysis
Figure 12 Neurotech Devices Market: PEST Analysis
Figure 13 Neurotech Devices Market by Product: Market Attractiveness Index
Figure 14 Neurotech Devices Market by Neurostimulation: Market Attractiveness Index
Figure 15 Neurotech Devices Market Forecast by Product, 2023-2033 (US$ million)
Figure 16 Neurotech Devices Market Forecast by Neurostimulation, 2023-2033 (US$ million)
Figure 17 Neurotech Devices Market Share Forecast by Product, 2023, 2033 (%)
Figure 18 Neurotech Devices Market Share Forecast by Neurostimulation, 2023, 2033 (%)
Figure 19 Deep Brain Stimulator Market Forecast by Region, 2023-2033 (US$ million)
Figure 20 Deep Brain Stimulator Market Share Forecast by Region, 2023 & 2033 (%)
Figure 21 Gastric Electric Stimulator Market Forecast by Region, 2023-2033 (US$ million)
Figure 22 Gastric Electric Stimulator Market Share Forecast by Region, 2023 & 2033 (%)
Figure 23 Spinal Cord Stimulator Market Forecast by Region, 2023-2033 (US$ million)
Figure 24 Spinal Cord Stimulator Market Share Forecast by Region, 2023 & 2033 (%)
Figure 25 Sacral Nerve Stimulator Market Forecast by Region, 2023-2033 (US$ million)
Figure 26 Sacral Nerve Stimulator Market Share Forecast by Region, 2023 & 2033 (%)
Figure 27 Vagus Nerve Stimulator Market Forecast by Region, 2023-2033 (US$ million)
Figure 28 Vagus Nerve Stimulator Market Share Forecast by Region, 2023 & 2033 (%)
Figure 29 Transcutaneous Electrical Nerve Stimulation (TENS) Market Forecast by Region, 2023-2033 (US$ million)
Figure 30 Transcutaneous Electrical Nerve Stimulation (TENS) Market Share Forecast by Region, 2023 & 2033 (%)
Figure 31 Others Market Forecast by Region, 2023-2033 (US$ million)
Figure 32 Others Market Share Forecast by Region, 2023 & 2033 (%)
Figure 33 Neuroprostheses Market Forecast by Region, 2023-2033 (US$ million)
Figure 34 Neuroprostheses Market Share Forecast by Region, 2023 & 2033 (%)
Figure 35 Neurosensing Market Forecast by Region, 2023-2033 (US$ million)
Figure 36 Neurosensing Market Share Forecast by Region, 2023 & 2033 (%)
Figure 37 Neurorehabilitation Market Forecast by Region, 2023-2033 (US$ million)
Figure 38 Neurorehabilitation Market Share Forecast by Region, 2023 & 2033 (%)
Figure 39 Neurotech Devices Market by Conditions: Market Attractiveness Index
Figure 40 Neurotech Devices Market Forecast by Conditions, 2023-2033 (US$ million)
Figure 41 Neurotech Devices Market Share Forecast by Conditions, 2023 & 2033 (%)
Figure 42 Pain Management Market Forecast by Region, 2023-2033 (US$ million)
Figure 43 Pain Management Market Share Forecast by Region, 2023 & 2033 (%)
Figure 44 Cognitive Disorders Market Forecast by Region, 2023-2033 (US$ million)
Figure 45 Cognitive Disorders Market Share Forecast by Region, 2023 & 2033 (%)
Figure 46 Epilepsy Market Forecast by Region, 2023-2033 (US$ million)
Figure 47 Epilepsy Market Share Forecast by Region, 2023 & 2033 (%)
Figure 48 Urinary and Fecal Incontinence Market Forecast by Region, 2023-2033 (US$ million)
Figure 49 Urinary and Fecal Incontinence Market Share Forecast by Region, 2023 & 2033 (%)
Figure 50 Hearing Conditions Market Forecast by Region, 2023-2033 (US$ million)
Figure 51 Hearing Conditions Market Share Forecast by Region, 2023 & 2033 (%)
Figure 52 Parkinson’s Diseases Market Forecast by Region, 2023-2033 (US$ million)
Figure 53 Parkinson’s Diseases Market Share Forecast by Region, 2023 & 2033 (%)
Figure 54 Depression Market Forecast by Region, 2023-2033 (US$ million)
Figure 55 Depression Market Share Forecast by Region, 2023 & 2033 (%)
Figure 56 Sleep Disorders Market Forecast by Region, 2023-2033 (US$ million)
Figure 57 Sleep Disorders Market Share Forecast by Region, 2023 & 2033 (%)
Figure 58 Essential Tremor Market Forecast by Region, 2023-2033 (US$ million)
Figure 59 Essential Tremor Market Share Forecast by Region, 2023 & 2033 (%)
Figure 60 Others Market Forecast by Region, 2023-2033 (US$ million)
Figure 61 Others Market Share Forecast by Region, 2023 & 2033 (%)
Figure 62 Neurotech devices market by Application: Market Attractiveness Index
Figure 63 Neurotech Devices Market Forecast by End use, 2023-2033 (US$ million)
Figure 64 Neurotech Devices Market Share Forecast by End use, 2023 & 2033 (%)
Figure 65 Hospitals Neurotech Devices Market Forecast by Region, 2023-2033 (US$ million)
Figure 66 Hospitals Neurotech Market Share Forecast by Region, 2023 & 2033 (%)
Figure 67 Ambulatory Surgical Centers Market Forecast by Region, 2023-2033 (US$ million)
Figure 68 Ambulatory Surgical Centers Market Share Forecast by Region, 2023 & 2033 (%)
Figure 69 Homecare Facilities Market Forecast by Region, 2023-2033 (US$ million)
Figure 70 Homecare Facilities Market Share Forecast by Region, 2023 & 2033 (%)
Figure 71 Others Market Forecast by Region, 2023-2033 (US$ million)
Figure 72 Others Market Share Forecast by Region, 2023 & 2033 (%)
Figure 73 Neurotech Devices Market by Region: Market Attractiveness Index
Figure 74 Neurotech Devices Market by Region, 2023-2033 (US$ Mn)
Figure 75 Neurotech Devices Market Share Forecast by Region 2023, 2033(%)
Figure 76 North America Neurotech Devices Market Attractiveness Index
Figure 77 North America Neurotech Devices Market by Region, 2023, 2028 & 2033 (US$ million)
Figure 78 North America Neurotech Devices Market Forecast by Country, 2023-2033 (US$ million)
Figure 79 North America Neurotech Devices Market Share Forecast by Country, 2023 & 2033 (%)
Figure 80 North America Neurotech Devices Market Forecast by Product, 2023-2033 (US$ million)
Figure 81 North America Neurotech Devices Market Forecast by Neurostimulation, 2023-2033 (US$ million)
Figure 82 North America Neurotech Devices Market Share Forecast by Product, 2023 & 2033 (%)
Figure 83 North America Neurotech Devices Market Share Forecast by Neurostimulation, 2023 & 2033 (%)
Figure 84 North America Neurotech Devices Market Forecast by Conditions, 2023-2033 (US$ million)
Figure 85 North America Neurotech Devices Market Share Forecast by Conditions, 2023 & 2033 (%)
Figure 86 North America Neurotech Devices Market Forecast by End Use, 2023-2033 (US$ million)
Figure 87 North America Neurotech Devices Market Share Forecast by End Use, 2023 & 2033 (%)
Figure 88 U.S. Neurotech Devices Market Forecast, 2023-2033 (US$ million, AGR %)
Figure 89 Canada Neurotech Devices Market Forecast, 2023-2033 (US$ million, AGR %)
Figure 90 Europe Neurotech devices market Attractiveness Index
Figure 91 Europe Neurotech Devices Market by Region, 2023, 2028 & 2033 (US$ million)
Figure 92 Europe Neurotech Devices Market Forecast by Country, 2023-2033 (US$ million)
Figure 93 Europe Neurotech Devices Market Share Forecast by Country, 2023 & 2033 (%)
Figure 94 Europe Neurotech Devices Market Forecast by Product, 2023-2033 (US$ million)
Figure 95 Europe Neurotech Devices Market Forecast by Neurostimulation, 2023-2033 (US$ million)
Figure 96 Europe Neurotech Devices Market Share Forecast by Product, 2023 & 2033 (%)
Figure 97 Europe Neurotech Devices Market Share Forecast by Neurostimulation, 2023 & 2033 (%)
Figure 98 Europe Neurotech Devices Market Forecast by Conditions, 2023-2033 (US$ million)
Figure 99 Europe Neurotech Devices Market Share Forecast by Conditions, 2023 & 2033 (%)
Figure 100 Europe Neurotech Devices Market Forecast by End Use, 2023-2033 (US$ million)
Figure 101 Europe Neurotech Devices Market Share Forecast by End Use, 2023 & 2033 (%)
Figure 102 Germany Neurotech Devices Market Forecast, 2023-2033 (US$ million, AGR %)
Figure 103 France Neurotech Devices Market Forecast, 2023-2033 (US$ million, AGR %)
Figure 104 UK Neurotech Devices Market Forecast, 2023-2033 (US$ million, AGR %)
Figure 105 Italy Neurotech Devices Market Forecast, 2023-2033 (US$ million, AGR %)
Figure 106 Spain Neurotech Devices Market Forecast, 2023-2033 (US$ million, AGR %)
Figure 107 Russia Neurotech Devices Market Forecast, 2023-2033 (US$ million, AGR %)
Figure 108 Rest of Europe Neurotech Devices Market Forecast, 2023-2033 (US$ million, AGR %)
Figure 109 Asia Pacific Neurotech Devices Market Attractiveness Index
Figure 110 Asia Pacific Neurotech Devices Market by Region, 2023, 2028 & 2033 (US$ million)
Figure 111 Asia Pacific Neurotech Devices Market Forecast, 2023-2033 (US$ million, AGR %)
Figure 112 Asia Pacific Neurotech Devices Market Share Forecast by Country, 2023 & 2033 (%)
Figure 113 Asia Pacific Neurotech Devices Market Forecast by Product, 2023-2033 (US$ million, AGR %)
Figure 114 Asia Pacific Neurotech Devices Market Forecast by Neurostimulation, 2023-2033 (US$ million, AGR %)
Figure 115 Asia Pacific Neurotech Devices Market Share Forecast by Product, 2023 & 2033 (%)
Figure 116 Asia Pacific Neurotech Devices Market Share Forecast by Neurostimulation, 2023 & 2033 (%)
Figure 117 Asia Pacific Neurotech Devices Market Forecast by Conditions, 2023-2033 (US$ million, AGR %)
Figure 118 Asia Pacific Neurotech Devices Market Share Forecast by Conditions, 2023 & 2033 (%)
Figure 119 Asia Pacific Neurotech Devices Market Forecast by End Use, 2023-2033 (US$ million, AGR %)
Figure 120 Asia Pacific Neurotech Devices Market Share Forecast by End Use, 2023 & 2033 (%)
Figure 121 Japan Neurotech Devices Market Forecast, 2023-2033 (US$ million, AGR %)
Figure 122 China Neurotech Devices Market Forecast, 2023-2033 (US$ million, AGR %)
Figure 123 India Neurotech devices market Forecast, 2023-2033 (US$ million, AGR %)
Figure 124 Australia Neurotech Devices Market Forecast, 2023-2033 (US$ million, AGR %)
Figure 125 South Korea Neurotech devices market Forecast, 2023-2033 (US$ million, AGR %)
Figure 126 Rest of Asia Pacific Neurotech Devices Market Forecast, 2023-2033 (US$ million, AGR %)
Figure 127 Latin America Neurotech Devices Market Attractiveness Index
Figure 128 Latin America Neurotech Devices Market by Country, 2023, 2028 & 2033 (US$ million)
Figure 129 LATIN AMERICA Neurotech Devices Market Forecast by Country, 2023-2033 (US$ million)
Figure 130 LATIN AMERICA Neurotech Devices Market Share Forecast by Country, 2023 & 2033 (%)
Figure 131 Latin America Neurotech Devices Market Forecast by Product, 2023-2033 (US$ million)
Figure 132 Latin America Neurotech Devices Market Forecast by Neurostimulation, 2023-2033 (US$ million)
Figure 133 Latin America Neurotech Devices Market Share Forecast by Product, 2023 & 2033 (%)
Figure 134 Latin America Neurotech Devices Market Share Forecast by Neurostimulation, 2023 & 2033 (%)
Figure 135 Latin America Neurotech Devices Market Forecast by Conditions, 2023-2033 (US$ million)
Figure 136 Latin America Neurotech Devices Market Share Forecast by Conditions, 2023 & 2033 (%)
Figure 137 Latin America Neurotech Devices Market Forecast by End Use, 2023-2033 (US$ million)
Figure 138 Latin America Neurotech Devices Market Share Forecast by End Use, 2023 & 2033 (%)
Figure 139 Brazil Neurotech Devices Market Forecast, 2023-2033 (US$ million, AGR %)
Figure 140 Mexico Neurotech Devices Market Forecast, 2023-2033 (US$ million, AGR %)
Figure 141 Rest of Latin America Neurotech Devices Market Forecast, 2023-2033 (US$ million, AGR %)
Figure 142 MEA Neurotech Devices Market Attractiveness Index
Figure 143 MEA Neurotech Devices Market by Country, 2023, 2028 & 2033 (US$ million)
Figure 144 MEA Neurotech Devices Market Forecast by Country, 2023-2033 (US$ million)
Figure 145 MEA Neurotech Devices Market Share Forecast by Country, 2023 & 2033 (%)
Figure 146 MEA Neurotech Devices Market Forecast by Product, 2023-2033 (US$ million)
Figure 147 MEA Neurotech Devices Market Forecast by Neurostimulation, 2023-2033 (US$ million)
Figure 148 MEA Neurotech Devices Market Share Forecast by Product, 2023 & 2033 (%)
Figure 149 MEA Neurotech Devices Market Share Forecast by Neurostimulation, 2023 & 2033 (%)
Figure 150 MEA Neurotech Devices Market Forecast by Conditions, 2023-2033 (US$ million)
Figure 151 MEA Neurotech Devices Market Share Forecast by Conditions, 2023 & 2033 (%)
Figure 152 MEA Neurotech Devices Market Forecast by End Use, 2023-2033 (US$ million)
Figure 153 MEA Neurotech Devices Market Share Forecast by End Use, 2023 & 2033 (%)
Figure 154 GCC Neurotech Devices Market Forecast, 2023-2033 (US$ million, AGR %)
Figure 155 South Africa Neurotech Devices Market Forecast, 2023-2033 (US$ million, AGR %)
Figure 156 Rest of MEA Neurotech Devices Market Forecast, 2023-2033 (US$ million, AGR %)
Figure 157 Company Share Analysis
Figure 158 Abbott Laboratories: Net Revenue, 2017-2021 (US$ million, AGR%)
Figure 159 Abbott Laboratories: R&D, 2017-2021 (US$ million, AGR%)
Figure 160 Abbott Laboratories: Regional Market Shares, 2021
Figure 161 Boston Scientific Corporation.: Net Revenue, 2017-2021 (US$ million, AGR%)
Figure 162 Boston Scientific Corporation.: R&D, 2017-2021 (US$ million, AGR%)
Figure 163 Boston Scientific Corporation.: Regional Market Shares, 2021
Figure 164 Cochlear Limited: Net Revenue, 2017-2021 (US$ million, AGR%)
Figure 165 Cochlear Limited.: R&D, 2017-2021 (US$ million, AGR%)
Figure 166 Cochlear Limited.: Regional Market Shares, 2021
Figure 167 ElectroCore Inc: Net Revenue, 2017-2021 (US$ million, AGR%)
Figure 168 ElectroCore Inc.: R&D, 2017-2021 (US$ million, AGR%)
Figure 169 ElectroCore Inc.: Regional Market Shares, 2021
Figure 170 Helbling Holding AG: Net Revenue, 2017-2021 (US$ million, AGR%)
Figure 171 LivaNova PLC: Net Revenue, 2017-2021 (US$ million, AGR%)
Figure 172 LivaNova PLC.: R&D, 2017-2021 (US$ million, AGR%)
Figure 173 LivaNova PLC.: Regional Market Shares, 2021
Figure 174 Medtronic: Net Revenue, 2017-2021 (US$ million, AGR%)
Figure 175 Medtronic.: R&D, 2017-2021 (US$ million, AGR%)
Figure 176 Medtronic.: Regional Market Shares, 2021
Figure 177 Neuronetics, Inc: Net Revenue, 2017-2021 (US$ million, AGR%)
Figure 178 Neuronetics, Inc.: R&D, 2017-2021 (US$ million, AGR%)
Figure 179 Neuronetics, Inc.: Regional Market Shares, 2021
Figure 180 Nihon Kohden Corporation: Net Revenue, 2017-2021 (US$ million, AGR%)
Figure 181 Nihon Kohden Corporation.: R&D, 2017-2021 (US$ million, AGR%)
Figure 182 Nihon Kohden Corporation.: Regional Market Shares, 2021
ページTOPに戻る
本レポートと同分野(医療/ヘルスケア)の最新刊レポート
Visiongain社のヘルスケアと医薬・化学品分野での最新刊レポート
本レポートと同じKEY WORD(devices)の最新刊レポート
よくあるご質問
Visiongain社はどのような調査会社ですか?
英国の調査会社ヴィジョンゲイン社(Visiongain)は、通信とエネルギーのほか、自動車や化学・医薬品、金属など、広範な市場を対象に調査を行っています。自動車市場については、市場全般に関する調査のほ... もっと見る
調査レポートの納品までの日数はどの程度ですか?
在庫のあるものは速納となりますが、平均的には 3-4日と見て下さい。
但し、一部の調査レポートでは、発注を受けた段階で内容更新をして納品をする場合もあります。
発注をする前のお問合せをお願いします。
注文の手続きはどのようになっていますか?
1)お客様からの御問い合わせをいただきます。
2)見積書やサンプルの提示をいたします。
3)お客様指定、もしくは弊社の発注書をメール添付にて発送してください。
4)データリソース社からレポート発行元の調査会社へ納品手配します。
5) 調査会社からお客様へ納品されます。最近は、pdfにてのメール納品が大半です。
お支払方法の方法はどのようになっていますか?
納品と同時にデータリソース社よりお客様へ請求書(必要に応じて納品書も)を発送いたします。
お客様よりデータリソース社へ(通常は円払い)の御振り込みをお願いします。
請求書は、納品日の日付で発行しますので、翌月最終営業日までの当社指定口座への振込みをお願いします。振込み手数料は御社負担にてお願いします。
お客様の御支払い条件が60日以上の場合は御相談ください。
尚、初めてのお取引先や個人の場合、前払いをお願いすることもあります。ご了承のほど、お願いします。
データリソース社はどのような会社ですか?
当社は、世界各国の主要調査会社・レポート出版社と提携し、世界各国の市場調査レポートや技術動向レポートなどを日本国内の企業・公官庁及び教育研究機関に提供しております。
世界各国の「市場・技術・法規制などの」実情を調査・収集される時には、データリソース社にご相談ください。
お客様の御要望にあったデータや情報を抽出する為のレポート紹介や調査のアドバイスも致します。
|
|

