神経刺激装置市場レポート:2023-2033
Neurostimulation Devices Market Report 2023-2033
レポート詳細
神経刺激装置市場レポート 2023-2033 :本レポートは、新たな収益の柱を目指すリーディングカンパニーが、業界とその背景にあるダイナミクスをより深く理解する上で、非常に有益なものと... もっと見る
※上記価格は部署ライセンス(Departmental licence)価格です。
その他の価格についてはデータリソースまでお問合せください。
日本語のページは自動翻訳を利用し作成しています。
実際のレポートは英文のみでご納品いたします。
サマリー
レポート詳細
神経刺激装置市場レポート 2023-2033:本レポートは、新たな収益の柱を目指すリーディングカンパニーが、業界とその背景にあるダイナミクスをより深く理解する上で、非常に有益なものとなるでしょう。また、異業種への進出や新地域での既存事業の拡大を目指す企業にとっても有用なレポートです。
好ましい規制と償還のシナリオが神経刺激装置市場の成長を加速する
MHRAやNICEといった臨床・安全ガイドラインの規制機関が存在し、クラスIIIの神経刺激装置の規制認可を可能にすることは、今後の業界の成長に有利となります。神経疾患に対する効果的な医薬品開発の必要性に対処するため、規制当局の注目が高まっていることは、事業の成長を加速させます。例えば、スティムウェーブ・テクノロジーは、慢性疼痛管理製品のDRG支払い限度額を超える医療保険者への払い戻しを決定する権限を付与されました。
神経刺激装置の使用に伴う合併症について
神経刺激装置の合併症は、ハードウェアの合併症、生物学的合併症、プログラミングや治療関連の合併症に大別されます。ハードウェア関連の合併症には、電池の消耗、反転、リード線の移動、再充電の困難などがあります。生物学的合併症には、装置の部品に関連する痛み、創傷感染、皮膚浸食、装置除去に関連する合併症、偶発的な硬膜穿刺が含まれます。プログラミングに関連する合併症としては、副麻酔の喪失や痛みを伴う副麻酔がある。プログラミングに関する合併症はそれほど頻繁に起こるものではありませんが、治療がうまくいかず、装置を取り外すことになる可能性があります。これらの前述の合併症は、神経刺激装置の採用における課題として作用し、市場の成長を抑制しています。
技能を持った医療従事者の不足
神経疾患の管理と治療に必要なスキルを持つ医療従事者の数が不十分であることが、今後数年間の業界成長の妨げとなります。診断の裏付けとなる治療と評価が必要なケースはごくわずかです。ほとんどの場合、個々の検査結果を慎重に解釈する必要があるため、熟練した専門知識が必要とされます。中低所得国の多くでは、経済的な制約から医療サービスへのアクセスが難しく、熟練した看護師や医師が不足しており、神経学者はまれで、神経学的診断サービスも存在しません。神経疾患と診断されても、患者への情報提供が不十分であったり、伝統的な医療を利用しているために、治療の開始が遅れています。
マーケットリサーチレポートを購入する前に、どのような質問をすべきでしょうか?
- 神経刺激装置市場はどのように進化しているのか?
- 神経刺激装置市場の推進要因と抑制要因は何か?
- 神経刺激装置市場の各サブマーケットは予測期間中にどのように成長し、2033年にはどの程度の売上を占めるようになるのか?
- 2023年から2033年にかけて、各神経刺激装置サブマーケットの市場シェアはどのように推移するのでしょうか?
- 2023年から2033年にかけて、市場全体の主なドライバーは何でしょうか?
- 主要な神経刺激装置市場はマクロ経済のダイナミクスに概ね追随するのか、それとも個々の国内市場が他を凌駕するのか?
- 2033年までに各国市場のシェアはどのように変化し、どの地域が2033年の市場をリードするのか?
- 主要プレイヤーは誰か、予測期間中の展望は?
- これらの主要企業の神経刺激装置開発プロジェクトはどのようなものですか?
- 2023年から2033年の間に、業界はどのように進化していくのでしょうか?現在および今後10年間に行われる神経刺激装置の開発プロジェクトにはどのような意味があるのでしょうか?
- 神経刺激装置市場をさらに拡大するために、製品の商業化の必要性は高まっていますか?
- 神経刺激装置市場はどこへ向かい、どのようにすれば市場の最前線に立つことができるのか?
- 新製品やサービスラインに対する最適な投資オプションは何か?
- 企業を新たな成長軌道に乗せ、C-suiteに移行させるための重要な展望とは?
このことが、現在、そして今後10年間の神経刺激装置市場にどのような影響を与えるかを知る必要があります。
- 250ページにわたる本レポートでは、111の表と139のグラフを独占的に提供します。
- このレポートでは、業界における主要な収益性の高い分野に焦点を当て、お客様が今すぐターゲットとできるような情報を提供しています。
- 世界、地域、国別の売上高と成長率を詳細に分析しています。
- 競合他社が成功した主なトレンド、変化、収益予測をハイライトしています。
本レポートは、神経刺激装置市場が今後10年間にどのように発展するか、またCOVID-19の景気後退と回復の変動に合わせて、今日あなたにお伝えします。この市場は、過去10年間のどの時点よりも今が重要なのです。
2033年までの予測やその他の分析により、商業的な展望が見えてきた
- 2033年までの収益予測に加え、直近の実績、成長率、市場シェアもご覧いただけます。
- ビジネスの展望や展開など、独自の分析もご覧いただけます。
- 定性的分析(市場力学、促進要因、機会、阻害要因、課題など)、コスト構造、神経刺激装置価格上昇の影響、最近の動向などをご覧いただけます。
本レポートでは、COVID-19が業界と貴社にどのような影響を与えるかについて、データ分析と貴重な洞察を掲載しています。本レポートでは、COVID-19の4つの回収パターンとその影響、すなわち「V」、「L」、「W」、「U」について論じています。
報告書の対象セグメント
製品別
- 胃電気刺激装置
- 脊髄刺激装置
- 仙骨神経刺激装置
- 迷走神経刺激装置
- 経皮的電気神経刺激法
- その他
用途別
- 疼痛管理
- てんかん
- 本態性振戦
- 尿失禁と便失禁
- うつ病
- ジストニア
- 胃不全麻痺
- パーキンソン病
- その他
世界市場全体とセグメントの収益予測に加え、5つの地域と16の主要国市場の収益予測も掲載しています。
北米
- 米国
- カナダ
欧州
- ドイツ
- 英国
- フランス
- スペイン
- イタリア
- その他の欧州
アジア太平洋
- 中国
- 日本
- インド
- オーストラリア
- 韓国
- その他のアジア太平洋地域
ラテンアメリカ
- ブラジル
- メキシコ
- その他のラテンアメリカ地域
MEA
- GCC
- 南アフリカ
- その他のMEA地域
神経刺激装置市場の2023年から2033年にかけての主要企業のプロファイルと、これらの企業のこのセグメントに焦点を当てた情報も掲載しています。
主要企業と市場成長の可能性
・ Abbott Laboratories
・ Advanced Bionics AG (Sonova)
・ Boston Scientific Corporation
・ BrainCo, Inc
・ Cochlear Limited
・ ElectroCore Inc.
・ Helbling Holding AG
・ Innovative Health Solutions, Inc.
・ LivaNova PLC
・ Medtronic
・ MicroTransponder
・ Neuronetics, Inc.
・ Nihon Kohden Corporation
・ Natus medical Incorporated
・ Parasym Ltd.
・ Synapse Biomedical Inc
・ tVNS Technologies GmbH (Cerbomed)
神経刺激装置市場の世界全体収益、2023年から2033年まで金額ベースで2023年に9,000百万米ドルを突破すると、我々の仕事は計算しています。また、2033年まで収益が大きく伸びると予測しています。本調査では、最も大きな可能性を秘めた企業を特定します。彼らの能力、進歩、商業的展望を発見することで、一歩先を行くことができます。
神経刺激装置市場、2023年から2033年までのレポートはどのように役立つのでしょうか?
250ページに及ぶレポートでは、要約して以下のような知識を得ることができます。
- 神経刺激装置市場の2023年から2033年までの収益予測、製品のタイプ、アプリケーションのタイプ、世界と地域レベルの各予測付き - 産業の展望を発見し、投資と収益に最も有利な場所を見つけます。
- 5地域と16主要国市場の2033年までの収益予測 - 神経刺激装置市場、2023年から2033年までの北米、ヨーロッパ、アジア太平洋、ラテンアメリカ、中東アフリカの市場予測をご覧いただけます。また、米国、カナダ、メキシコ、ブラジル、ドイツ、フランス、英国、イタリア、中国、インド、日本、オーストラリアなど、著名な経済圏の市場も予測しています。
- 既存企業や市場参入を目指す企業の展望 - 神経刺激装置市場に関わる主要企業の企業プロファイルを含む、2023年から2033年までの展望を掲載しています。
定量的・定性的な分析と独自の予測をご覧いただけます。私たちのレポートだけが持つ情報を入手し、貴重なビジネスインテリジェンスを得ることができます。
他にはない情報
私たちの新しいレポートがあれば、知識の遅れを取り戻し、チャンスを逃す可能性が低くなります。弊社の調査が貴社の調査、分析、意思決定にどのように役立つかをご覧ください。Visiongainの調査は、神経刺激装置市場、2023年から2033年、市場の主要企業のための商業分析を必要とするすべての人のためのものです。データ、トレンド、予測を見つけることができます。
ページTOPに戻る
目次
目次
1.レポートの概要
1.1 研究の目的
1.2 神経刺激装置市場の紹介
1.3 本レポートが提供するもの
1.4 本レポートを読むべき理由
1.5 本分析レポートが回答する重要な質問
1.6 本レポートは誰のためのものなのか?
1.7 方法論
1.7.1 市場の定義
1.7.2 市場評価・予測手法
1.7.3 データの検証
1.7.3.1 一次調査
1.7.3.2 セカンダリーリサーチ
1.8 よくある質問と回答(FAQ)
1.9 関連するVisiongainのレポート
1.10 Visiongainについて
2 エグゼクティブサマリー
3 市場の概要
3.1 主要な調査結果
3.2 マーケットダイナミクス
3.2.1 市場の推進要因
3.2.1.1 神経疾患の有病率の増加
3.2.1.2 世界的な企業や組織による投資の増加
3.2.1.3 神経刺激デバイスの技術的進歩
3.2.2 市場抑制要因
3.2.2.1 神経刺激デバイスの使用に伴う合併症
3.2.2.2 熟練した医療従事者の不足
3.2.3 市場機会
3.2.3.1 先進国における低侵襲手術の需要増加
3.2.3.2 神経障害を持つ高齢者患者の増加
3.3 COVID-19影響度分析
3.4 ポーターのファイブフォース分析
3.4.1 供給者のバーゲニングパワー
3.4.2 バイヤーのバーゲニングパワー
3.4.3 競合他社のライバル関係
3.4.4 代替品による脅威
3.4.5 新規参入者の脅威
3.5 PEST分析
4 神経刺激装置市場分析:製品別
4.1 主要な調査結果
4.2 製品セグメント市場魅力度指数
4.3 神経刺激装置の製品別市場規模推定・予測
4.4 脳深部刺激装置(DBS)
4.4.1 地域別市場規模、2023-2033 (US$ Mn)
4.4.2 地域別市場シェア、2023年&2033年(%)
4.5 胃電気刺激装置(GES)
4.5.1 地域別市場規模、2023年~2033年 (US$ Mn)
4.5.2 地域別市場シェア、2023年&2033年(%)
4.6 脊髄刺激装置(SCS)
4.6.1 地域別市場規模、2023年~2033年 (US$ Mn)
4.6.2 地域別市場シェア、2023年&2033年(%)
4.7 仙骨神経刺激装置
4.7.1 地域別市場規模、2023年~2033年 (US$ Mn)
4.7.2 地域別市場シェア、2023年&2033年(%)
4.8 迷走神経刺激装置
4.8.1 地域別市場規模、2023年~2033年 (US$ Mn)
4.8.2 地域別市場シェア、2023年&2033年(%)
4.9 経皮的電気神経刺激(TENS)
4.9.1 地域別市場規模、2023年~2033年 (US$ Mn)
4.9.2 地域別市場シェア、2023年&2033年(%)
4.10 その他
4.10.1 地域別市場規模、2023年~2033年 (US$ Mn)
4.10.2 地域別市場シェア、2023年&2033年(%)
5 神経刺激装置市場分析:用途別
5.1 主な調査結果
5.2 用途別セグメント市場魅力度指数
5.3 神経刺激装置の用途別市場規模の推定と予測
5.4 疼痛管理
5.4.1 地域別市場規模、2023年~2033年 (US$ Mn)
5.4.2 地域別市場シェア、2023年&2033年(%)
5.5 てんかん
5.5.1 地域別市場規模、2023年~2033年 (US$ Mn)
5.5.2 地域別市場シェア、2023年&2033年(%)
5.6 本態性振戦
5.6.1 地域別市場規模、2023年~2033年 (US$ Mn)
5.6.2 地域別市場シェア、2023年&2033年(%)
5.7 尿失禁および便失禁
5.7.1 地域別市場規模、2023年~2033年 (US$ Mn)
5.7.2 地域別市場シェア、2023年&2033年(%)
5.8 拘束
5.8.1 地域別市場規模、2023年〜2033年 (US$ Mn)
5.8.2 地域別市場シェア、2023年&2033年(%)
5.9 ジストニア
5.9.1 地域別市場規模、2023年〜2033年 (US$ Mn)
5.9.2 地域別市場シェア、2023年&2033年(%)
5.10 胃不全麻痺
5.10.1 地域別市場規模、2023年~2033年 (US$ Mn)
5.10.2 地域別市場シェア、2023年&2033年(%)
5.11 パーキンソン病
5.11.1 地域別市場規模、2023年〜2033年 (US$ Mn)
5.11.2 地域別市場シェア、2023年&2033年(%)
5.12 その他
5.12.1 地域別市場規模、2023年〜2033年 (US$ Mn)
5.12.2 地域別市場シェア、2023年&2033年(%)
6 神経刺激装置市場分析:地域別
6.1 主な調査結果
6.2 地域別セグメント市場魅力度指数
6.3 神経刺激装置の市場規模推定と予測
7 北米の神経刺激装置市場分析
7.1 主な調査結果
7.2 北米神経刺激装置市場の魅力度指数
7.3 北米神経刺激装置国別市場、2022年、2027年&2032年(US$ Mn)
7.4 北米神経刺激装置国別市場規模予測・予測
7.5 北米神経刺激装置の製品別市場規模予測・予測
7.6 北米神経刺激装置の用途別市場規模予測・予想
7.7 アメリカ神経刺激装置市場分析
7.8 カナダの神経刺激装置市場分析
8 欧州の神経刺激装置市場分析
8.1 主な調査結果
8.2 欧州神経刺激装置市場の魅力度指数
8.3 欧州神経刺激装置国別市場 2022年、2027年&2032年 (US$ Mn)
8.4 欧州神経刺激装置国別市場規模予測・予測
8.5 欧州神経刺激装置市場の製品別市場規模予測・予測
8.6 欧州の神経刺激装置の市場規模予測・用途別予測
8.7 ドイツの神経刺激装置市場分析
8.8 フランス神経刺激装置市場分析
8.9 イギリスの神経刺激装置の市場分析
8.10 イタリア神経刺激装置の市場分析
8.11 スペイン神経刺激装置市場の分析
8.12 ロシア神経刺激装置市場の分析
8.13 その他の欧州神経刺激装置市場の分析
9 アジア太平洋地域の神経刺激装置市場分析
9.1 主な調査結果
9.2 アジア太平洋地域の神経刺激装置市場の魅力度指数
9.3 アジア太平洋地域の神経刺激装置市場の国別推移、2022年、2027年、2032年(US$ Mn)
9.4 アジア太平洋地域の神経刺激装置国別市場規模予測・予測
9.5 アジア太平洋地域の神経刺激装置市場の製品別市場規模予測・予測
9.6 アジア太平洋地域の神経刺激装置市場の用途別分析
9.7 日本 神経刺激装置市場分析
9.8 中国神経刺激装置市場分析
9.9 インドの神経刺激装置市場の分析
9.10 オーストラリア神経刺激装置市場分析
9.11 韓国神経刺激装置市場の分析
9.12 その他のアジア太平洋地域の神経刺激装置市場の分析
10 ラテンアメリカの神経刺激装置市場分析
10.1 主な調査結果
10.2 ラテンアメリカの神経刺激装置市場の魅力度指数
10.3 ラテンアメリカの神経刺激装置国別市場、2022年、2027年&2032年(US$ Mn)
10.4 ラテンアメリカの神経刺激装置国別市場規模予測・予測
10.5 ラテンアメリカの神経刺激装置市場規模予測・製品別予測
10.6 ラテンアメリカの神経刺激装置市場規模予測・用途別予測
10.7 ブラジル神経刺激装置市場分析
10.8 メキシコの神経刺激装置市場分析
10.9 その他のラテンアメリカの神経刺激装置市場分析
11 MEAの神経刺激装置市場分析
11.1 主な調査結果
11.2 MEA神経刺激装置市場の魅力度指数
11.3 MEA神経刺激装置市場の国別推移、2022年、2027年&2032年、(US$ Mn)
11.4 MEA神経刺激デバイスの国別市場規模予測・予想
11.5 MEA神経刺激装置の製品別市場規模予測・予測
11.6 MEA神経刺激装置の用途別市場規模予測・予想
11.7 GCC神経刺激装置の市場分析
11.8 南アフリカの神経刺激装置市場分析
11.9 その他のMEA神経刺激装置の市場分析
12 主要企業のプロフィール
12.1 競合他社の状況、2021年
12.1.1 Medtronic
12.1.2 Boston Scientific Corporation
12.1.3 Abbott Laboratories
12.1.4 LivaNova PLC
12.2 Abbott Laboratories
12.2.1 会社概要
12.2.2 会社概要
12.2.3 財務分析
12.2.3.1 純収益、2017-2021年
12.2.3.2 R&D、2017-2021年
12.2.3.3 地域別市場シェア、2021年
12.2.4 製品ベンチマーク
12.2.5 戦略的な展望
12.3 Advanced Bionics AG (Sonova)
12.3.1 企業スナップショット
12.3.2 会社概要
12.3.3 製品ベンチマーク
12.3.4 戦略的展望
12.4 Boston Scientific Corporation
12.4.1 企業スナップショット
12.4.2 会社概要
12.4.3 財務分析
12.4.3.1 純収益、2017-2021年
12.4.3.2 R&D、2017-2021年
12.4.3.3 地域別市場シェア、2021年
12.4.4 製品ベンチマーク
12.4.5 戦略的展望
12.5 BrainCo, Inc.
12.5.1 企業スナップショット
12.5.2 会社概要
12.5.3 製品ベンチマーク
12.5.4 戦略的展望
12.6 Cochlear Limited
12.6.1 企業スナップショット
12.6.2 会社概要
12.6.3 財務分析
12.6.3.1 純収益、2017-2021年
12.6.3.2 R&D、2017年-2021年
12.6.3.3 地域別市場シェア、2021年
12.6.4 製品ベンチマーク
12.6.5 戦略的展望
12.7 ElectroCore Inc.
12.7.1 企業スナップショット
12.7.2 会社概要
12.7.3 財務分析
12.7.3.1 純収益、2017-2021年
12.7.3.2 R&D、2017年-2021年
12.7.3.3 地域別市場シェア、2021年
12.7.4 製品ベンチマーク
12.7.5 戦略的な展望
12.8 Helbling Holding AG
12.8.1 企業スナップショット
12.8.2 会社概要
12.8.3 財務分析
12.8.3.1 純収益、2017-2021年
12.8.4 製品ベンチマーク
12.8.5 戦略的な展望
12.9 Innovative Health Solutions, Inc
12.9.1 企業スナップショット
12.9.2 会社概要
12.9.3 製品ベンチマーク
12.9.4 戦略的展望
12.10 LivaNova PLC
12.10.1 企業スナップショット
12.10.2 会社概要
12.10.3 財務分析
12.10.3.1 純収益、2017-2021年
12.10.3.2 R&D、2017年-2021年
12.10.3.3 地域別市場シェア、2021年
12.10.4 製品ベンチマーク
12.10.5 戦略的な展望
12.11 Medtronic
12.11.1 企業スナップショット
12.11.2 会社概要
12.11.3 財務分析
12.11.3.1 純収益、2017-2021年
12.11.3.2 R&D、2017-2021年
12.11.3.3 地域別市場シェア、2021年
12.11.4 製品ベンチマーク
12.11.5 戦略的な展望
12.12 MicroTransponder
12.12.1 企業スナップショット
12.12.2 会社概要
12.12.3 製品ベンチマーク
12.12.4 戦略的展望
12.13 Neuronetics, Inc
12.13.1 企業スナップショット
12.13.2 会社概要
12.13.3 財務分析
12.13.3.1 純収益、2017-2021年
12.13.3.2 R&D、2017年-2021年
12.13.3.3 地域別市場シェア、2021年
12.13.4 製品ベンチマーク
12.13.5 戦略的展望
12.14 Nihon Kohden Corporation
12.14.1 企業スナップショット
12.14.2 会社概要
12.14.3 財務分析
12.14.3.1 純収益、2017-2021年
12.14.3.2 R&D、2017年-2021年
12.14.3.3 地域別市場シェア、2021年
12.14.4 製品ベンチマーク
12.14.5 戦略的な展望
12.15 Natus Medical Incorporated
12.15.1 企業スナップショット
12.15.2 会社概要
12.15.3 ベンチマーキング
12.15.4 戦略的展望
12.16 Parasym Ltd.
12.16.1 企業スナップショット
12.16.2 会社概要
12.16.3 製品ベンチマーク
12.16.4 戦略的展望
12.17 Synapse Biomedical Inc
12.17.1 企業スナップショット
12.17.2 会社概要
12.17.3 製品ベンチマーク
12.17.4 戦略的展望
12.18 tVNS Technologies GmbH (Cerbomed)
12.18.1 企業スナップショット
12.18.2 会社概要
12.18.3 製品ベンチマーク
12.18.4 戦略的展望
13 結論と提言
13.1 ヴィジョンゲインからの結論
13.2 市場関係者への提言
表の一覧
Table 1 Neurostimulation Devices Market Snapshot, 2023 & 2033 (US$ million, CAGR %)
Table 2 Neurostimulation Devices Market by Region, 2023-2033 (US$ Mn, AGR (%), CAGR (%)): “V” Shaped Recovery Scenario
Table 3 Neurostimulation Devices Market by Region, 2023-2033 (US$ Mn, AGR (%), CAGR (%)): “U” Shaped Recovery Scenario
Table 4 Neurostimulation Devices Market by Region, 2023-2033 (US$ Mn, AGR (%), CAGR (%)): “W” Shaped Recovery Scenario
Table 5 Neurostimulation Devices Market by Region, 2023-2033 (US$ Mn, AGR (%), CAGR (%)): “L” Shaped Recovery Scenario
Table 6 Neurostimulation Devices Market by Product, 2023-2033 (US$ Mn, AGR (%), CAGR (%))
Table 7 Deep Brain Stimulator Market Forecast by Region, 2023-2033 (US$ Mn, AGR%, CAGR%)
Table 8 Gastric Electric Stimulator Market Forecast by Region, 2023-2033 (US$ Mn, AGR%, CAGR%)
Table 9 Spinal Cord Stimulator Market Forecast by Region, 2023-2033 (US$ Mn, AGR%, CAGR%)
Table 10 Sacral Nerve Stimulator Market Forecast by Region, 2023-2033 (US$ Mn, AGR%, CAGR%)
Table 11 Vagus Nerve Stimulator Market Forecast by Region, 2023-2033 (US$ Mn, AGR%, CAGR%)
Table 12 Transcutaneous Electrical Nerve Stimulation (TENS)Market Forecast by Region, 2023-2033 (US$ Mn, AGR%, CAGR%)
Table 13 Others Market Forecast by Region, 2023-2033 (US$ Mn, AGR%, CAGR%)
Table 14 Neurostimulation Devices Market by Application, 2023-2033 (US$ Mn, AGR (%), CAGR (%))
Table 15 Pain Management Market Forecast by Region, 2023-2033 (US$ Mn, AGR%, CAGR%)
Table 16 Epilepsy Market Forecast by Region, 2023-2033 (US$ Mn, AGR%, CAGR%)
Table 17 Essential Tremor Market Forecast by Region, 2023-2033 (US$ Mn, AGR%, CAGR%)
Table 18 Urinary and Fecal Incontinence Market Forecast by Region, 2023-2033 (US$ Mn, AGR%, CAGR%)
Table 19 Depression Market Forecast by Region, 2023-2033 (US$ Mn, AGR%, CAGR%)
Table 20 Dystonia Market Forecast by Region, 2023-2033 (US$ Mn, AGR%, CAGR%)
Table 21 Gastroparesis Market Forecast by Region, 2023-2033 (US$ Mn, AGR%, CAGR%)
Table 22 Parkinson’s Disease Market Forecast by Region, 2023-2033 (US$ Mn, AGR%, CAGR%)
Table 23 Others Market Forecast by Region, 2023-2033 (US$ Mn, AGR%, CAGR%)
Table 24 Neurostimulation Devices Market by Region, 2023-2033 (US$ Mn, AGR (%), CAGR (%))
Table 25 North America Neurostimulation Devices Market Forecast by Country
Table 26 North America Neurostimulation Devices Market by Product, 2023-2033 (US$ Mn, AGR (%), CAGR (%))
Table 27 Neurostimulation Devices Market by Application, 2023-2033 (US$ Mn, AGR (%), CAGR (%))
Table 28 U.S. Neurostimulation Devices Market Forecast, 2023-2033 (US$ Mn, AGR %, CAGR %)
Table 29 Canada Neurostimulation Devices Market Forecast, 2023-2033 (US$ Mn, AGR %, CAGR %)
Table 30 Europe Neurostimulation Devices Market Forecast by Country, 2023-2033 (US$ Mn, AGR%, CAGR%)
Table 31 Europe Neurostimulation Devices Market by Product, 2023-2033 (US$ Mn, AGR (%), CAGR (%))
Table 32 Neurostimulation Devices Market by Application, 2023-2033 (US$ Mn, AGR (%), CAGR (%))
Table 33 Germany Neurostimulation Devices Market Forecast, 2023-2033 (US$ Mn, AGR (%), CAGR (%))
Table 34 France Neurostimulation Devices Market Forecast, 2023-2033 (US$ Mn, AGR (%), CAGR (%))
Table 35 UK Neurostimulation Devices Market Forecast, 2023-2033 (US$ Mn, AGR (%), CAGR (%))
Table 36 Italy Neurostimulation Devices Market Forecast, 2023-2033 (US$ Mn, AGR (%), CAGR (%))
Table 37 Spain Neurostimulation Devices Market Forecast, 2023-2033 (US$ Mn, AGR (%), CAGR (%))
Table 38 Russia Neurostimulation Devices Market Forecast, 2023-2033 (US$ Mn, AGR (%), CAGR (%))
Table 39 Rest of Europe Neurostimulation Devices Market Forecast, 2023-2033 (US$ Mn, AGR (%), CAGR (%))
Table 40 Asia Pacific Neurostimulation Devices Market forecast by Country 2023-2033 (US$ Mn, AGR%, CAGR%)
Table 41 Asia Pacific Neurostimulation Devices Market by Product, 2023-2033 (US$ Mn, AGR (%), CAGR (%))
Table 42 Neurostimulation Devices Market by Application, 2023-2033 (US$ Mn, AGR (%), CAGR (%))
Table 43 Japan Neurostimulation Devices Market Forecast, 2023-2033 (US$ Mn, AGR (%), CAGR (%))
Table 44 China Neurostimulation Devices Market Forecast, 2023-2033 (US$ Mn, AGR (%), CAGR (%))
Table 45 India Neurostimulation Devices Market Forecast, 2023-2033 (US$ Mn, AGR (%), CAGR (%))
Table 46 Australia Neurostimulation Devices Market Forecast, 2023-2033 (US$ Mn, AGR (%), CAGR (%))
Table 47 South Korea Neurostimulation Devices Market Forecast, 2023-2033 (US$ Mn, AGR (%), CAGR (%))
Table 48 Rest of Asia Pacific Neurostimulation Devices Market Forecast, 2023-2033 (US$ Mn, AGR (%), CAGR (%))
Table 49 Latin America Neurostimulation Devices Market Forecast by Country 2023-2033 (US$ Mn, AGR%, CAGR%)
Table 50 Latin America Neurostimulation Devices Market by Product, 2023-2033 (US$ Mn, AGR (%), CAGR (%))
Table 51 Latin America Neurostimulation Devices Market by Application, 2023-2033 (US$ Mn, AGR (%), CAGR (%))
Table 52 Brazil Neurostimulation Devices Market Forecast, 2023-2033 (US$ Mn, AGR (%), CAGR (%))
Table 53 Mexico Neurostimulation Devices Market Forecast, 2023-2033 (US$ Mn, AGR (%), CAGR (%))
Table 54 Rest of Latin America Neurostimulation Devices Market Forecast, 2023-2033 (US$ Mn, AGR (%), CAGR (%))
Table 55 MEA Neurostimulation Devices forecast by Country 2023-2033 (US$ Mn, AGR%, CAGR%)
Table 56 MEA Neurostimulation Devices Market by Product, 2023-2033 (US$ Mn, AGR (%), CAGR (%))
Table 57 MEA Neurostimulation Devices Market by Application, 2023-2033 (US$ Mn, AGR (%), CAGR (%))
Table 58 GCC Neurostimulation Devices Market Forecast, 2023-2033 (US$ Mn, AGR (%), CAGR (%))
Table 59 South Africa Neurostimulation Devices Market Forecast, 2023-2033 (US$ Mn, AGR (%), CAGR (%))
Table 60 Rest of MEA Neurostimulation Devices Market Forecast, 2023-2033 (US$ Mn, AGR (%), CAGR (%))
Table 61 Abbott Laboratories: Key Details, (CEO, HQ, Revenue, Founded, No. of Employees, Company Type, Website, Business Segment)
Table 62 Abbott Laboratories: Product Benchmarking
Table 63 Abbott Laboratories: Strategic Outlook
Table 64 Advanced Bionics AG (Sonova): Key Details, (CEO, HQ, Revenue, Founded, No. of Employees, Company Type, Website, Business Segment)
Table 65 Advanced Bionics AG (Sonova).: Product Benchmarking
Table 66 Advanced Bionics AG (Sonova).: Strategic Outlook
Table 67 Boston Scientific Corporation, Inc.: Key Details, (CEO, HQ, Revenue, Founded, No. of Employees, Company Type, Website, Business Segment)
Table 68 Boston Scientific Corporation: Product Benchmarking
Table 69 Boston Scientific Corporation: Strategic Outlook
Table 70 BrainCo, Inc: Key Details, (CEO, HQ, Revenue, Founded, No. of Employees, Company Type, Website, Business Segment)
Table 71 BrainCo, Inc.: Product Benchmarking
Table 72 BrainCo, Inc.: Strategic Outlook
Table 73 Cochlear Limited: Key Details, (CEO, HQ, Revenue, Founded, No. of Employees, Company Type, Website, Business Segment)
Table 74 Cochlear Limited: Product Benchmarking
Table 75 Cochlear Limited: Strategic Outlook
Table 76 ElectroCore Inc.: Key Details, (CEO, HQ, Revenue, Founded, No. of Employees, Company Type, Website, Business Segment)
Table 77 ElectroCore Inc.: Product Benchmarking
Table 78 ElectroCore Inc.: Strategic Outlook
Table 79 Helbling Holding AG: Key Details, (CEO, HQ, Revenue, Founded, No. of Employees, Company Type, Website, Business Segment)
Table 80 Helbling Holding AG: Product Benchmarking
Table 81 Helbling Holding AG: Strategic Outlook
Table 82 Innovative Health Solutions: Key Details, (CEO, HQ, Revenue, Founded, No. of Employees, Company Type, Website, Business Segment)
Table 83 Innovative Health Solutions: Product Benchmarking
Table 84 Innovative Health Solutions: Strategic Outlook
Table 85 LivaNova PLC: Key Details, (CEO, HQ, Revenue, Founded, No. of Employees, Company Type, Website, Business Segment)
Table 86 LivaNova PLC: Product Benchmarking
Table 87 LivaNova PLC: Strategic Outlook
Table 88 Medtronic: (CEO, HQ, Revenue, Founded, No. of Employees, Company Type, Website, Business Segment)
Table 89 Medtronic: Product Benchmarking
Table 90 Medtronic: Strategic Outlook
Table 91 MicroTransponder: Key Details, (CEO, HQ, Revenue, Founded, No. of Employees, Company Type, Website, Business Segment)
Table 92 MicroTransponder: Product Benchmarking
Table 93 MicroTransponder: Strategic Outlook
Table 94 Neuronetics, Inc: Key Details, (CEO, HQ, Revenue, Founded, No. of Employees, Company Type, Website, Business Segment)
Table 95 Neuronetics, Inc.: Product Benchmarking
Table 96 Neuronetics, Inc.: Strategic Outlook
Table 97 Nihon Kohden Corporation: Key Details, (CEO, HQ, Revenue, Founded, No. of Employees, Company Type, Website, Business Segment)
Table 98 Nihon Kohden Corporation: Product Benchmarking
Table 99 Nihon Kohden Corporation: Strategic Outlook
Table 100 Natus Medical Incorporated: Key Details, (CEO, HQ, Revenue, Founded, No. of Employees, Company Type, Website, Business Segment)
Table 101 Natus Medical Incorporated: Product Benchmarking
Table 102 Natus Medical Incorporated: Strategic Outlook
Table 103 Parasym Ltd: Key Details, (CEO, HQ, Revenue, Founded, No. of Employees, Company Type, Website, Business Segment)
Table 104 Parasym Ltd.: Product Benchmarking
Table 105 Parasym Ltd.: Strategic Outlook
Table 106 Synapse Biomedical Inc: Key Details, (CEO, HQ, Revenue, Founded, No. of Employees, Company Type, Website, Business Segment)
Table 107 Synapse Biomedical Inc.: Product Benchmarking
Table 108 Synapse Biomedical Inc.: Strategic Outlook
Table 109 tVNS Technologies GmbH (Cerbomed): Key Details, (CEO, HQ, Revenue, Founded, No. of Employees, Company Type, Website, Business Segment)
Table 110 tVNS Technologies GmbH (Cerbomed).: Product Benchmarking
Table 111 tVNS Technologies GmbH (Cerbomed).: Strategic Outlook
図の一覧
Figure 1 Neurostimulation Devices Market Segmentation
Figure 2 Neurostimulation Devices Market by Product: Market Attractiveness Index
Figure 3 Neurostimulation Devices Market by Application: Market Attractiveness Index
Figure 4 Neurostimulation Devices Market Attractiveness Index by Region
Figure 5 Neurostimulation Devices Market: Market Dynamics
Figure 6 Neurostimulation Devices Market by Region, 2023-2033 (US$ Mn, AGR (%), CAGR (%)): “V” Shaped Recovery
Figure 7 Neurostimulation Devices Market by Region, 2023-2033 (US$ Mn, AGR (%), CAGR (%)): “U” Shaped Recovery
Figure 8 Neurostimulation Devices Market by Region, 2023-2033 (US$ Mn, AGR (%), CAGR (%)): “W” Shaped Recovery
Figure 9 Neurostimulation Devices Market by Region, 2023-2033 (US$ Mn, AGR (%), CAGR (%)): “L” Shaped Recovery
Figure 10 Neurostimulation Devices Market: Porter’s Five Forces Analysis
Figure 11 Neurostimulation Devices Market: PEST Analysis
Figure 12 Neurostimulation Devices Market by Product: Market Attractiveness Index
Figure 13 Neurostimulation Devices Market Forecast by Product, 2023-2033 (US$ million)
Figure 14 Neurostimulation Devices Market Share Forecast by Product, 2023, 2033 (%)
Figure 15 Deep Brain Stimulator Market Forecast by Region, 2023-2033 (US$ million)
Figure 16 Deep Brain Stimulator Market Share Forecast by Region, 2023 & 2033 (%)
Figure 17 Gastric Electric Stimulator Market Forecast by Region, 2023-2033 (US$ million)
Figure 18 Gastric Electric Stimulator Market Share Forecast by Region, 2023 & 2033 (%)
Figure 19 Spinal Cord Stimulator Market Forecast by Region, 2023-2033 (US$ million)
Figure 20 Spinal Cord Stimulator Market Share Forecast by Region, 2023 & 2033 (%)
Figure 21 Sacral Nerve Stimulator Market Forecast by Region, 2023-2033 (US$ million)
Figure 22 Sacral Nerve Stimulator Market Share Forecast by Region, 2023 & 2033 (%)
Figure 23 Vagus Nerve Stimulator Market Forecast by Region, 2023-2033 (US$ million)
Figure 24 Vagus Nerve Stimulator Market Share Forecast by Region, 2023 & 2033 (%)
Figure 25 Transcutaneous Electrical Nerve Stimulation (TENS) Market Forecast by Region, 2023-2033 (US$ million)
Figure 26 Transcutaneous Electrical Nerve Stimulation (TENS) Market Share Forecast by Region, 2023 & 2033 (%)
Figure 27 Others Market Forecast by Region, 2023-2033 (US$ million)
Figure 28 Others Market Share Forecast by Region, 2023 & 2033 (%)
Figure 29 Neurostimulation Devices Market by Application: Market Attractiveness Index
Figure 30 Neurostimulation Devices Market Forecast by Application, 2023-2033 (US$ million)
Figure 31 Neurostimulation Devices Market Share Forecast by Application, 2023 & 2033 (%)
Figure 32 Pain Management Market Forecast by Region, 2023-2033 (US$ million)
Figure 33 Pain Management Market Share Forecast by Region, 2023 & 2033 (%)
Figure 34 Epilepsy Market Forecast by Region, 2023-2033 (US$ million)
Figure 35 Epilepsy Market Share Forecast by Region, 2023 & 2033 (%)
Figure 36 Essential Tremor Market Forecast by Region, 2023-2033 (US$ million)
Figure 37 Essential Tremor Market Share Forecast by Region, 2023 & 2033 (%)
Figure 38 Urinary and Fecal Incontinence Market Forecast by Region, 2023-2033 (US$ million)
Figure 39 Urinary and Fecal Incontinence Market Share Forecast by Region, 2023 & 2033 (%)
Figure 40 Depression Market Forecast by Region, 2023-2033 (US$ million)
Figure 41 Depression Market Share Forecast by Region, 2023 & 2033 (%)
Figure 42 Dystonia Market Forecast by Region, 2023-2033 (US$ million)
Figure 43 Dystonia Market Share Forecast by Region, 2023 & 2033 (%)
Figure 44 Gastroparesis Market Forecast by Region, 2023-2033 (US$ million)
Figure 45 Gastroparesis Market Share Forecast by Region, 2023 & 2033 (%)
Figure 46 Parkinson’s Disease Market Forecast by Region, 2023-2033 (US$ million)
Figure 47 Parkinson’s Disease Market Share Forecast by Region, 2023 & 2033 (%)
Figure 48 Others Market Forecast by Region, 2023-2033 (US$ million)
Figure 49 Others Market Share Forecast by Region, 2023 & 2033 (%)
Figure 50 Neurostimulation Devices Market by Region: Market Attractiveness Index
Figure 51 Neurostimulation Devices Market by Region, 2023-2033 (US$ Mn)
Figure 52 Neurostimulation Devices Market Share Forecast by Region 2023, 2033(%)
Figure 53 North America Neurostimulation Devices Market Attractiveness Index
Figure 54 North America Neurostimulation Devices Market by Region, 2022, 2027 & 2032 (US$ million)
Figure 55 North America Neurostimulation Devices Market Forecast by Country, 2023-2033 (US$ million)
Figure 56 North America Neurostimulation Devices Market Share Forecast by Country, 2023 & 2033 (%)
Figure 57 North America Neurostimulation Devices Market Forecast by Product, 2023-2033 (US$ million)
Figure 58 North America Neurostimulation Devices Market Share Forecast by Product, 2023 & 2033 (%)
Figure 59 North America Neurostimulation Devices Market Forecast by Application, 2023-2033 (US$ million)
Figure 60 North America Neurostimulation Devices Market Share Forecast by Application, 2023 & 2033 (%)
Figure 61 U.S. Neurostimulation Devices Market Forecast, 2023-2033 (US$ million, AGR %)
Figure 62 Canada Neurostimulation Devices Market Forecast, 2023-2033 (US$ million, AGR %)
Figure 63 Europe Neurostimulation Devices Market Attractiveness Index
Figure 64 Europe Neurostimulation Devices Market by Region, 2022, 2027 & 2032 (US$ million)
Figure 65 Europe Neurostimulation Devices Market Forecast by Country, 2023-2033 (US$ million)
Figure 66 Europe Neurostimulation Devices Market Share Forecast by Country, 2023 & 2033 (%)
Figure 67 Europe Neurostimulation Devices Market Forecast by Product, 2023-2033 (US$ million)
Figure 68 Europe Neurostimulation Devices Market Share Forecast by Product, 2023 & 2033 (%)
Figure 69 Europe Neurostimulation Devices Market Forecast by Application, 2023-2033 (US$ million)
Figure 70 Europe Neurostimulation Devices Market Share Forecast by Application, 2023 & 2033 (%)
Figure 71 Germany Neurostimulation Devices Market Forecast, 2023-2033 (US$ million, AGR %)
Figure 72 France Neurostimulation Devices Market Forecast, 2023-2033 (US$ million, AGR %)
Figure 73 UK Neurostimulation Devices Market Forecast, 2023-2033 (US$ million, AGR %)
Figure 74 Italy Neurostimulation Devices Market Forecast, 2023-2033 (US$ million, AGR %)
Figure 75 Spain Neurostimulation Devices Market Forecast, 2023-2033 (US$ million, AGR %)
Figure 76 Russia Neurostimulation Devices Market Forecast, 2023-2033 (US$ million, AGR %)
Figure 77 Rest of Europe Neurostimulation Devices Market Forecast, 2023-2033 (US$ million, AGR %)
Figure 78 Asia Pacific Neurostimulation Devices Market Attractiveness Index
Figure 79 Asia Pacific Neurostimulation Devices Market by Region, 2022, 2027 & 2032 (US$ million)
Figure 80 Asia Pacific Neurostimulation Devices Market Forecast, 2023-2033 (US$ million, AGR %)
Figure 81 Asia Pacific Neurostimulation Devices Market Share Forecast by Country, 2023 & 2033 (%)
Figure 82 Asia Pacific Neurostimulation Devices Market Forecast by Product, 2023-2033 (US$ million, AGR %)
Figure 83 Asia Pacific Neurostimulation Devices Market Share Forecast by Product, 2023 & 2033 (%)
Figure 84 Asia Pacific Neurostimulation Devices Market Forecast by Application, 2023-2033 (US$ million, AGR %)
Figure 85 Asia Pacific Neurostimulation Devices Market Share Forecast by Application, 2023 & 2033 (%)
Figure 86 Japan Neurostimulation Devices Market Forecast, 2023-2033 (US$ million, AGR %)
Figure 87 China Neurostimulation Devices Market Forecast, 2023-2033 (US$ million, AGR %)
Figure 88 India Neurostimulation Devices Market Forecast, 2023-2033 (US$ million, AGR %)
Figure 89 Australia Neurostimulation Devices Market Forecast, 2023-2033 (US$ million, AGR %)
Figure 90 South Korea Neurostimulation Devices Market Forecast, 2023-2033 (US$ million, AGR %)
Figure 91 Rest of Asia Pacific Neurostimulation Devices Market Forecast, 2023-2033 (US$ million, AGR %)
Figure 92 Latin America Neurostimulation Devices Market Attractiveness Index
Figure 93 Latin America Neurostimulation Devices Market by Country, 2022, 2027 & 2032 (US$ million)
Figure 94 Latin America Neurostimulation Devices Market Forecast by Country, 2023-2033 (US$ million)
Figure 95 Latin America Neurostimulation Devices Market Share Forecast by Country, 2023 & 2033 (%)
Figure 96 Latin America Neurostimulation Devices Market Forecast by Product, 2023-2033 (US$ million)
Figure 97 Latin America Neurostimulation Devices Market Share Forecast by Product, 2023 & 2033 (%)
Figure 98 Latin America Neurostimulation Devices Market Forecast by Application, 2023-2033 (US$ million)
Figure 99 Latin America Neurostimulation Devices Market Share Forecast by Application, 2023 & 2033 (%)
Figure 100 Brazil Neurostimulation Devices Market Forecast, 2023-2033 (US$ million, AGR %)
Figure 101 Mexico Neurostimulation Devices Market Forecast, 2023-2033 (US$ million, AGR %)
Figure 102 Rest of Latin America Neurostimulation Devices Market Forecast, 2023-2033 (US$ million, AGR %)
Figure 103 MEA Neurostimulation Devices Market Attractiveness Index
Figure 104 MEA Neurostimulation Devices Market by Country, 2022, 2027 & 2032 (US$ million)
Figure 105 MEA Neurostimulation Devices Market Forecast by Country, 2023-2033 (US$ million)
Figure 106 MEA Neurostimulation Devices Market Share Forecast by Country, 2023 & 2033 (%)
Figure 107 MEA Neurostimulation Devices Market Forecast by Product, 2023-2033 (US$ million)
Figure 108 MEA Neurostimulation Devices Market Share Forecast by Product, 2023 & 2033 (%)
Figure 109 MEA Neurostimulation Devices Market Forecast by Application, 2023-2033 (US$ million)
Figure 110 MEA Neurostimulation Devices Market Share Forecast by Application, 2023 & 2033 (%)
Figure 111 GCC Neurostimulation Devices Market Forecast, 2023-2033 (US$ million, AGR %)
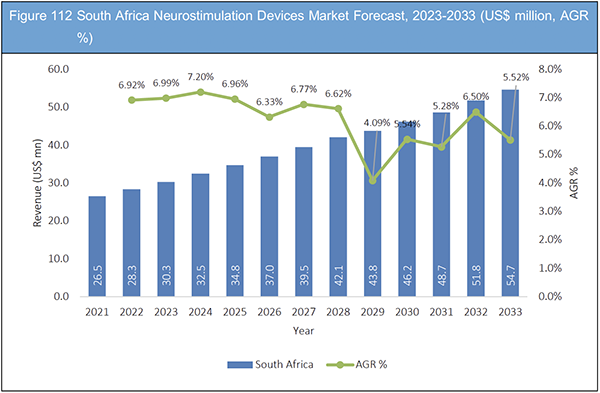
Figure 112 South Africa Neurostimulation Devices Market Forecast, 2023-2033 (US$ million, AGR %)
Figure 113 Rest of MEA Neurostimulation Devices Market Forecast, 2023-2033 (US$ million, AGR %)
Figure 114 Company Share Analysis, 2021
Figure 115 Abbott Laboratories: Net Revenue, 2017-2021 (US$ million, AGR%)
Figure 116 Abbott Laboratories: R&D, 2017-2021 (US$ million, AGR%)
Figure 117 Abbott Laboratories: Regional Market Shares, 2021
Figure 118 Boston Scientific Corporation.: Net Revenue, 2017-2021 (US$ million, AGR%)
Figure 119 Boston Scientific Corporation.: R&D, 2017-2021 (US$ million, AGR%)
Figure 120 Boston Scientific Corporation: Regional Market Shares, 2021
Figure 121 Cochlear Limited: Net Revenue, 2017-2021 (US$ million, AGR%)
Figure 122 Cochlear Limited.: R&D, 2017-2021 (US$ million, AGR%)
Figure 123 Cochlear Limited.: Regional Market Shares, 2021
Figure 124 ElectroCore Inc.: Net Revenue, 2017-2021 (US$ million, AGR%)
Figure 125 ElectroCore Inc.: R&D, 2017-2021 (US$ million, AGR%)
Figure 126 ElectroCore Inc.: Regional Market Shares, 2021
Figure 127 Helbling Holding AG: Net Revenue, 2017-2021 (US$ million, AGR%)
Figure 128 LivaNova PLC: Net Revenue, 2017-2021 (US$ million, AGR%)
Figure 129 LivaNova PLC.: R&D, 2017-2021 (US$ million, AGR%)
Figure 130 LivaNova PLC.: Regional Market Shares, 2021
Figure 131 Medtronic: Net Revenue, 2017-2021 (US$ million, AGR%)
Figure 132 Medtronic.: R&D, 2017-2021 (US$ million, AGR%)
Figure 133 Medtronic.: Regional Market Shares, 2021
Figure 134 Neuronetics, Inc: Net Revenue, 2017-2021 (US$ million, AGR%)
Figure 135 Neuronetics, Inc.: R&D, 2017-2021 (US$ million, AGR%)
Figure 136 Neuronetics, Inc.: Regional Market Shares, 2021
Figure 137 Nihon Kohden Corporation: Net Revenue, 2017-2021 (US$ million, AGR%)
Figure 138 Nihon Kohden Corporation: R&D, 2017-2021 (US$ million, AGR%)
Figure 139 Nihon Kohden Corporation: Regional Market Shares, 2021
ページTOPに戻る
Summary
Report Details
The Neurostimulation Devices Market Report 2023-2033: This report will prove invaluable to leading firms striving for new revenue pockets if they wish to better understand the industry and its underlying dynamics. It will be useful for companies that would like to expand into different industries or to expand their existing operations in a new region.
Favourable Regulatory and Reimbursement Scenario will Accelerate Neurostimulation Devices Market Growth
Presence of regulatory bodies such as MHRA and NICE for clinical and safety guidelines and enabling regulatory approval of neurostimulation devices under Class III devices will favour industry growth in the future. Growing focus of regulatory authorities in addressing the need for effective drug development for neurological disorders will accelerate business growth. For instance, Stimwave Technologies was granted the authorization to decide on the reimbursement with healthcare insurers over and above of the DRG payment limits for its chronic pain management products.
Complications Associated with Usage of Neurostimulation Devices
The complications in neurostimulation devices are majorly categorized into hardware complications, biological complications, and programming or therapy-related complications. Some of the hardware-related complications include battery depletion, flipping, lead migration, and recharging difficulties. Biological complications include the pain related to device components, wound infections, skin erosion, complications related to device removal, and accidental dural puncture. Programming related complications include loss of paranesthesia or painful paranesthesia. Complications related to programming are not very frequent, however it could result in device removal due to therapy failure. These aforementioned complications act as challenges in the adoption of neurostimulation devices, thereby restraining the growth of the market.
Lack of Skilled Healthcare Practitioners
The inadequate number of healthcare practitioners with the required skills to manage and treat neurological diseases will hamper industry growth over the coming years. Treatment and assessment are required to support diagnosis in a few cases. In most of cases, individual test results need to be interpreted carefully that requires skilled expertise. In most of the low and middle-income countries, access to healthcare services is challenging due to financial constraints, there is a shortage of skilled nurses and doctors, neurologists are rare, and neurological diagnostic services are not present. Even when neurological diseases are diagnosed, lack of patient information, and usage of traditional medicine delay the initiation of treatment.
What Questions Should You Ask before Buying a Market Research Report?
• How is the Neurostimulation Devices Market evolving?
• What is driving and restraining the Neurostimulation Devices Market?
• How will each Neurostimulation Devices submarket grow over the forecast period and how much revenue will these submarkets account for in 2033?
• How will the market shares for each Neurostimulation Devices submarket develop from 2023 to 2033?
• What will be the main driver for the overall market from 2023 to 2033?
• Will leading Neurostimulation Devices Markets broadly follow the macroeconomic dynamics, or will individual national markets outperform others?
• How will the market shares of the national markets change by 2033 and which geographical region will lead the market in 2033?
• Who are the leading players and what are their prospects over the forecast period?
• What are the neurostimulation devices development projects for these leading companies?
• How will the industry evolve during the period between 2023 and 2033? What are the implications of neurostimulation devices development projects taking place now and over the next 10 years?
• Is there a greater need for product commercialisation to further scale the Neurostimulation Devices Market?
• Where is the Neurostimulation Devices Market heading and how can you ensure you are at the forefront of the market?
• What are the best investment options for new product and service lines?
• What are the key prospects for moving companies into a new growth path and C-suite?
You need to discover how this will impact the Neurostimulation Devices Market today, and over the next 10 years:
• Our 250-page report provides 111 tables and 139 charts/graphs exclusively to you.
• The report highlights key lucrative areas in the industry so you can target them – NOW.
• It contains in-depth analysis of global, regional and national sales and growth.
• It highlights for you the key successful trends, changes and revenue projections made by your competitors.
This report tells you TODAY how the Neurostimulation Devices Market will develop in the next 10 years, and in line with the variations in COVID-19 economic recession and bounce. This market is more critical now than at any point over the last 10 years.
Forecasts to 2033 and other analyses reveal commercial prospects
• In addition to revenue forecasting to 2033, our new study provides you with recent results, growth rates, and market shares.
• You will find original analyses, with business outlooks and developments.
• Discover qualitative analyses (including market dynamics, drivers, opportunities, restraints and challenges), cost structure, impact of rising neurostimulation devices prices and recent developments.
This report includes data analysis and invaluable insight into how COVID-19 will affect the industry and your company. Four COVID-19 recovery patterns and their impact, namely, “V”, “L”, “W” and “U” are discussed in this report.
Segments Covered in the Report
By Product
• Deep Brain Stimulator
• Gastric Electric Stimulator
• Spinal Cord Stimulator
• Sacral Nerve Stimulator
• Vagus Nerve Stimulator
• Transcutaneous Electrical Nerve Stimulation
• Others
By Application
• Pain Management
• Epilepsy
• Essential Tremor
• Urinary and Fecal Incontinence
• Depression
• Dystonia
• Gastroparesis
• Parkinson’s Disease
• Others
In addition to the revenue predictions for the overall world market and segments, you will also find revenue forecasts for five regional and 16 leading national markets:
North America
• U.S.
• Canada
Europe
• Germany
• UK
• France
• Spain
• Italy
• Rest of Europe
Asia Pacific
• China
• Japan
• India
• Australia
• South Korea
• Rest of Asia Pacific
Latin America
• Brazil
• Mexico
• Rest of Latin America
MEA
• GCC
• South Africa
• Rest of MEA
The report also includes profiles and for some of the leading companies in the Neurostimulation Devices Market, 2023 to 2033, with a focus on this segment of these companies’ operations.
Leading companies and the potential for market growth
• Abbott Laboratories
• Advanced Bionics AG (Sonova)
• Boston Scientific Corporation
• BrainCo, Inc
• Cochlear Limited
• ElectroCore Inc.
• Helbling Holding AG
• Innovative Health Solutions, Inc.
• LivaNova PLC
• Medtronic
• MicroTransponder
• Neuronetics, Inc.
• Nihon Kohden Corporation
• Natus medical Incorporated
• Parasym Ltd.
• Synapse Biomedical Inc
• tVNS Technologies GmbH (Cerbomed)
Overall world revenue for Neurostimulation Devices Market, 2023 to 2033 in terms of value the market will surpass US$9,000 million in 2023, our work calculates. We predict strong revenue growth through to 2033. Our work identifies which organizations hold the greatest potential. Discover their capabilities, progress, and commercial prospects, helping you stay ahead.
How will the Neurostimulation Devices Market, 2023 to 2033 report help you?
In summary, our 250-page report provides you with the following knowledge:
• Revenue forecasts to 2033 for Neurostimulation Devices Market, 2023 to 2033 Market, with forecasts for Type of Product, Type of Application, each forecast at a global and regional level – discover the industry’s prospects, finding the most lucrative places for investments and revenues.
• Revenue forecasts to 2033 for five regional and 16 key national markets – See forecasts for the Neurostimulation Devices Market, 2023 to 2033 market in North America, Europe, Asia-Pacific and Latin America and Middle East and Africa. Also forecasted is the market in the US, Canada, Mexico, Brazil, Germany, France, UK, Italy, China, India, Japan, and Australia among other prominent economies.
• Prospects for established firms and those seeking to enter the market – including company profiles of the major companies involved in the Neurostimulation Devices Market, 2023 to 2033.
Find quantitative and qualitative analyses with independent predictions. Receive information that only our report contains, staying informed with invaluable business intelligence.
Information found nowhere else
With our new report, you are less likely to fall behind in knowledge or miss out on opportunities. See how our work could benefit your research, analyses, and decisions. Visiongain’s study is for everybody needing commercial analyses for the Neurostimulation Devices Market, 2023 to 2033, market-leading companies. You will find data, trends and predictions.
ページTOPに戻る
Table of Contents
Table of Contents
1. Report Overview
1.1 Objectives of the Study
1.2 Introduction to Neurostimulation Devices Market
1.3 What This Report Delivers
1.4 Why You Should Read This Report
1.5 Key Questions Answered by This Analytical Report
1.6 Who is This Report for?
1.7 Methodology
1.7.1 Market Definitions
1.7.2 Market Evaluation & Forecasting Methodology
1.7.3 Data Validation
1.7.3.1 Primary Research
1.7.3.2 Secondary Research
1.8 Frequently Asked Questions (FAQs)
1.9 Associated Visiongain Reports
1.10 About Visiongain
2 Executive Summary
3 Market Overview
3.1 Key Findings
3.2 Market Dynamics
3.2.1 Market Driving Factors
3.2.1.1 Increasing Prevalence of Neurological Disorders
3.2.1.2 Growing Investments by Companies and Organizations Across the Globe
3.2.1.3 Technological Advancements in Neurostimulation Devices
3.2.2 Market Restraining Factors
3.2.2.1 Complications Associated with Usage of Neurostimulation Devices
3.2.2.2 Lack of Skilled Healthcare Practitioners
3.2.3 Market Opportunities
3.2.3.1 Rising Demand for Minimally Invasive Surgeries in Developed Countries
3.2.3.2 Increasing Number of Elderly Patients with Neurological Disorders
3.3 COVID-19 Impact Analysis
3.4 Porter’s Five Forces Analysis
3.4.1 Bargaining Power of Suppliers
3.4.2 Bargaining Power of Buyers
3.4.3 Competitive Rivalry
3.4.4 Threat from Substitutes
3.4.5 Threat of New Entrants
3.5 PEST Analysis
4 Neurostimulation Devices Market Analysis by Product
4.1 Key Findings
4.2 Product Segment: Market Attractiveness Index
4.3 Neurostimulation Devices Market Size Estimation and Forecast by Product
4.4 Deep Brain Stimulator(DBS)
4.4.1 Market Size by Region, 2023-2033 (US$ Mn)
4.4.2 Market Share by Region, 2023 & 2033 (%)
4.5 Gastric Electric Stimulator(GES)
4.5.1 Market Size by Region, 2023-2033 (US$ Mn)
4.5.2 Market Share by Region, 2023 & 2033 (%)
4.6 Spinal Cord Stimulator(SCS)
4.6.1 Market Size by Region, 2023-2033 (US$ Mn)
4.6.2 Market Share by Region, 2023 & 2033 (%)
4.7 Sacral Nerve Stimulator
4.7.1 Market Size by Region, 2023-2033 (US$ Mn)
4.7.2 Market Share by Region, 2023 & 2033 (%)
4.8 Vagus Nerve Stimulator
4.8.1 Market Size by Region, 2023-2033 (US$ Mn)
4.8.2 Market Share by Region, 2023 & 2033 (%)
4.9 Transcutaneous Electrical Nerve Stimulation (TENS)
4.9.1 Market Size by Region, 2023-2033 (US$ Mn)
4.9.2 Market Share by Region, 2023 & 2033 (%)
4.10 Others
4.10.1 Market Size by Region, 2023-2033 (US$ Mn)
4.10.2 Market Share by Region, 2023 & 2033 (%)
5 Neurostimulation Devices Market Analysis by Application
5.1 Key Findings
5.2 Application Segment: Market Attractiveness Index
5.3 Neurostimulation Devices Market Size Estimation and Forecast by Application
5.4 Pain Management
5.4.1 Market Size by Region, 2023-2033 (US$ Mn)
5.4.2 Market Share by Region, 2023 & 2033 (%)
5.5 Epilepsy
5.5.1 Market Size by Region, 2023-2033 (US$ Mn)
5.5.2 Market Share by Region, 2023 & 2033 (%)
5.6 Essential Tremor
5.6.1 Market Size by Region, 2023-2033 (US$ Mn)
5.6.2 Market Share by Region, 2023 & 2033 (%)
5.7 Urinary and Fecal Incontinence
5.7.1 Market Size by Region, 2023-2033 (US$ Mn)
5.7.2 Market Share by Region, 2023 & 2033 (%)
5.8 Depression
5.8.1 Market Size by Region, 2023-2033 (US$ Mn)
5.8.2 Market Share by Region, 2023 & 2033 (%)
5.9 Dystonia
5.9.1 Market Size by Region, 2023-2033 (US$ Mn)
5.9.2 Market Share by Region, 2023 & 2033 (%)
5.10 Gastroparesis
5.10.1 Market Size by Region, 2023-2033 (US$ Mn)
5.10.2 Market Share by Region, 2023 & 2033 (%)
5.11 Parkinson’s Disease
5.11.1 Market Size by Region, 2023-2033 (US$ Mn)
5.11.2 Market Share by Region, 2023 & 2033 (%)
5.12 Others
5.12.1 Market Size by Region, 2023-2033 (US$ Mn)
5.12.2 Market Share by Region, 2023 & 2033 (%)
6 Neurostimulation Devices Market Analysis by Region
6.1 Key Findings
6.2 Regional Segment: Market Attractiveness Index
6.3 Neurostimulation Devices Market Size Estimation and Forecast
7 North America Neurostimulation Devices Market Analysis
7.1 Key Findings
7.2 North America Neurostimulation Devices Market Attractiveness Index
7.3 North America Neurostimulation Devices Market by Country, 2022, 2027 & 2032 (US$ Mn)
7.4 North America Neurostimulation Devices Market Size Estimation and Forecast by Country
7.5 North America Neurostimulation Devices Market Size Estimation and Forecast by Product
7.6 North America Neurostimulation Devices Market Size Estimation and Forecast by Application
7.7 U.S. Neurostimulation Devices Market Analysis
7.8 Canada Neurostimulation Devices Market Analysis
8 Europe Neurostimulation Devices Market Analysis
8.1 Key Findings
8.2 Europe Neurostimulation Devices Market Attractiveness Index
8.3 Europe Neurostimulation Devices Market by Country, 2022, 2027 & 2032 (US$ Mn)
8.4 Europe Neurostimulation Devices Market Size Estimation and Forecast by Country
8.5 Europe Neurostimulation Devices Market Size Estimation and Forecast by Product
8.6 Europe Neurostimulation Devices Market Size Estimation and Forecast by Application
8.7 Germany Neurostimulation Devices Market Analysis
8.8 France Neurostimulation Devices Market Analysis
8.9 UK Neurostimulation Devices Market Analysis
8.10 Italy Neurostimulation Devices Market Analysis
8.11 Spain Neurostimulation Devices Market Analysis
8.12 Russia Neurostimulation Devices Market Analysis
8.13 Rest of Europe Neurostimulation Devices Market Analysis
9 Asia Pacific Neurostimulation Devices Market Analysis
9.1 Key Findings
9.2 Asia Pacific Neurostimulation Devices Market Attractiveness Index
9.3 Asia Pacific Neurostimulation Devices Market by Country, 2022, 2027 & 2032 (US$ Mn)
9.4 Asia Pacific Neurostimulation Devices Market Size Estimation and Forecast by Country
9.5 Asia Pacific Neurostimulation Devices Market Size Estimation and Forecast by Product
9.6 Asia Pacific Neurostimulation Devices Market Analysis by Application
9.7 Japan Neurostimulation Devices Market Analysis
9.8 China Neurostimulation Devices Market Analysis
9.9 India Neurostimulation Devices Market Analysis
9.10 Australia Neurostimulation Devices Market Analysis
9.11 South Korea Neurostimulation Devices Market Analysis
9.12 Rest of Asia Pacific Neurostimulation Devices Market Analysis
10 Latin America Neurostimulation Devices Market Analysis
10.1 Key Findings
10.2 Latin America Neurostimulation Devices Market Attractiveness Index
10.3 Latin America Neurostimulation Devices Market by Country, 2022, 2027 & 2032 (US$ Mn)
10.4 Latin America Neurostimulation Devices Market Size Estimation and Forecast by Country
10.5 Latin America Neurostimulation Devices Market Size Estimation and Forecast by Product
10.6 Latin America Neurostimulation Devices Market Size Estimation and Forecast by Application
10.7 Brazil Neurostimulation Devices Market Analysis
10.8 Mexico Neurostimulation Devices Market Analysis
10.9 Rest of Latin America Neurostimulation Devices Market Analysis
11 MEA Neurostimulation Devices Market Analysis
11.1 Key Findings
11.2 MEA Neurostimulation Devices Market Attractiveness Index
11.3 MEA Neurostimulation Devices Market by Country, 2022, 2027 & 2032 (US$ Mn)
11.4 MEA Neurostimulation Devices Market Size Estimation and Forecast by Country
11.5 MEA Neurostimulation Devices Market Size Estimation and Forecast by Product
11.6 MEA Neurostimulation Devices Market Size Estimation and Forecast by Application
11.7 GCC Neurostimulation Devices Market Analysis
11.8 South Africa Neurostimulation Devices Market Analysis
11.9 Rest of MEA Neurostimulation Devices Market Analysis
12 Company Profiles
12.1 Competitive Landscape, 2021
12.1.1 Medtronic
12.1.2 Boston Scientific Corporation
12.1.3 Abbott Laboratories
12.1.4 LivaNova PLC
12.2 Abbott Laboratories
12.2.1 Company Snapshot
12.2.2 Company Overview
12.2.3 Financial Analysis
12.2.3.1 Net Revenue, 2017-2021
12.2.3.2 R&D, 2017-2021
12.2.3.3 Regional Market Shares, 2021
12.2.4 Product Benchmarking
12.2.5 Strategic Outlook
12.3 Advanced Bionics AG (Sonova)
12.3.1 Company Snapshot
12.3.2 Company Overview
12.3.3 Product Benchmarking
12.3.4 Strategic Outlook
12.4 Boston Scientific Corporation
12.4.1 Company Snapshot
12.4.2 Company Overview
12.4.3 Financial Analysis
12.4.3.1 Net Revenue, 2017-2021
12.4.3.2 R&D, 2017-2021
12.4.3.3 Regional Market Shares, 2021
12.4.4 Product Benchmarking
12.4.5 Strategic Outlook
12.5 BrainCo, Inc
12.5.1 Company Snapshot
12.5.2 Company Overview
12.5.3 Product Benchmarking
12.5.4 Strategic Outlook
12.6 Cochlear Limited
12.6.1 Company Snapshot
12.6.2 Company Overview
12.6.3 Financial Analysis
12.6.3.1 Net Revenue, 2017-2021
12.6.3.2 R&D, 2017-2021
12.6.3.3 Regional Market Shares, 2021
12.6.4 Product Benchmarking
12.6.5 Strategic Outlook
12.7 ElectroCore Inc
12.7.1 Company Snapshot
12.7.2 Company Overview
12.7.3 Financial Analysis
12.7.3.1 Net Revenue, 2017-2021
12.7.3.2 R&D, 2017-2021
12.7.3.3 Regional Market Shares, 2021
12.7.4 Product Benchmarking
12.7.5 Strategic Outlook
12.8 Helbling Holding AG
12.8.1 Company Snapshot
12.8.2 Company Overview
12.8.3 Financial Analysis
12.8.3.1 Net Revenue, 2017-2021
12.8.4 Product Benchmarking
12.8.5 Strategic Outlook
12.9 Innovative Health Solutions, Inc
12.9.1 Company Snapshot
12.9.2 Company Overview
12.9.3 Product Benchmarking
12.9.4 Strategic Outlook
12.10 LivaNova PLC
12.10.1 Company Snapshot
12.10.2 Company Overview
12.10.3 Financial Analysis
12.10.3.1 Net Revenue, 2017-2021
12.10.3.2 R&D, 2017-2021
12.10.3.3 Regional Market Shares, 2021
12.10.4 Product Benchmarking
12.10.5 Strategic Outlook
12.11 Medtronic
12.11.1 Company Snapshot
12.11.2 Company Overview
12.11.3 Financial Analysis
12.11.3.1 Net Revenue, 2017-2021
12.11.3.2 R&D, 2017-2021
12.11.3.3 Regional Market Shares, 2021
12.11.4 Product Benchmarking
12.11.5 Strategic Outlook
12.12 MicroTransponder
12.12.1 Company Snapshot
12.12.2 Company Overview
12.12.3 Product Benchmarking
12.12.4 Strategic Outlook
12.13 Neuronetics, Inc
12.13.1 Company Snapshot
12.13.2 Company Overview
12.13.3 Financial Analysis
12.13.3.1 Net Revenue, 2017-2021
12.13.3.2 R&D, 2017-2021
12.13.3.3 Regional Market Shares, 2021
12.13.4 Product Benchmarking
12.13.5 Strategic Outlook
12.14 Nihon Kohden Corporation
12.14.1 Company Snapshot
12.14.2 Company Overview
12.14.3 Financial Analysis
12.14.3.1 Net Revenue, 2017-2021
12.14.3.2 R&D, 2017-2021
12.14.3.3 Regional Market Shares, 2021
12.14.4 Product Benchmarking
12.14.5 Strategic Outlook
12.15 Natus Medical Incorporated
12.15.1 Company Snapshot
12.15.2 Company Overview
12.15.3 Product Benchmarking
12.15.4 Strategic Outlook
12.16 Parasym Ltd.
12.16.1 Company Snapshot
12.16.2 Company Overview
12.16.3 Product Benchmarking
12.16.4 Strategic Outlook
12.17 Synapse Biomedical Inc
12.17.1 Company Snapshot
12.17.2 Company Overview
12.17.3 Product Benchmarking
12.17.4 Strategic Outlook
12.18 tVNS Technologies GmbH (Cerbomed)
12.18.1 Company Snapshot
12.18.2 Company Overview
12.18.3 Product Benchmarking
12.18.4 Strategic Outlook
13 Conclusion and Recommendations
13.1 Concluding Remarks from Visiongain
13.2 Recommendations for Market Players
ページTOPに戻る
Visiongain社のヘルスケアと医薬・化学品分野での最新刊レポート
本レポートと同じKEY WORD(devices)の最新刊レポート
よくあるご質問
Visiongain社はどのような調査会社ですか?
英国の調査会社ヴィジョンゲイン社(Visiongain)は、通信とエネルギーのほか、自動車や化学・医薬品、金属など、広範な市場を対象に調査を行っています。自動車市場については、市場全般に関する調査のほ... もっと見る
調査レポートの納品までの日数はどの程度ですか?
在庫のあるものは速納となりますが、平均的には 3-4日と見て下さい。
但し、一部の調査レポートでは、発注を受けた段階で内容更新をして納品をする場合もあります。
発注をする前のお問合せをお願いします。
注文の手続きはどのようになっていますか?
1)お客様からの御問い合わせをいただきます。
2)見積書やサンプルの提示をいたします。
3)お客様指定、もしくは弊社の発注書をメール添付にて発送してください。
4)データリソース社からレポート発行元の調査会社へ納品手配します。
5) 調査会社からお客様へ納品されます。最近は、pdfにてのメール納品が大半です。
お支払方法の方法はどのようになっていますか?
納品と同時にデータリソース社よりお客様へ請求書(必要に応じて納品書も)を発送いたします。
お客様よりデータリソース社へ(通常は円払い)の御振り込みをお願いします。
請求書は、納品日の日付で発行しますので、翌月最終営業日までの当社指定口座への振込みをお願いします。振込み手数料は御社負担にてお願いします。
お客様の御支払い条件が60日以上の場合は御相談ください。
尚、初めてのお取引先や個人の場合、前払いをお願いすることもあります。ご了承のほど、お願いします。
データリソース社はどのような会社ですか?
当社は、世界各国の主要調査会社・レポート出版社と提携し、世界各国の市場調査レポートや技術動向レポートなどを日本国内の企業・公官庁及び教育研究機関に提供しております。
世界各国の「市場・技術・法規制などの」実情を調査・収集される時には、データリソース社にご相談ください。
お客様の御要望にあったデータや情報を抽出する為のレポート紹介や調査のアドバイスも致します。
|
|

