HIV/HBV治療薬市場レポート:2022-2032
HIV and HBV Therapies Market Report 2022-2032
レポート詳細
HIV/HBV治療薬市場レポート 2022-2032 :本レポートは、新たな収益の柱を目指すリーディングカンパニーが、業界とその背景にあるダイナミクスをより深く理解する上で有用なものとなるは... もっと見る
※上記価格は部署ライセンス(Departmental licence)価格です。
その他の価格についてはデータリソースまでお問合せください。
日本語のページは自動翻訳を利用し作成しています。
実際のレポートは英文のみでご納品いたします。

|

|
サマリー
レポート詳細
HIV/HBV治療薬市場レポート 2022-2032:本レポートは、新たな収益の柱を目指すリーディングカンパニーが、業界とその背景にあるダイナミクスをより深く理解する上で有用なものとなるはずです。また、異業種への進出や新地域での既存事業の拡大を目指す企業にとっても有用なレポートです。
HIVやHBVの感染率の上昇、研究開発への高い投資、政府支援の拡大などが市場成長の要因に
HIV/HBV治療薬の世界市場を推進する主な要因には、HIV/HBVの有病率の上昇、R&Dへの高い投資、政府支援の拡大などがあります。HIV/HBV治療薬の研究に対する政府の強固な支援は、市場成長を推進する主要な要因の1つです。製薬業界、財団、患者支援団体、学術・公的研究者、融資プログラム、規制研究者、償還機関などが、満たされていない診断・治療要件に対するソリューションを特定・開発するための重要な協力体制が必要となっているのです。HIVと肝炎の蔓延は、新たな治療オプションの必要性を促しています。そのため、政府機関はアンメットニーズに対応し、高度なケアを提供するための取り組みを行っています。R&DにおけるHIV/HBV治療の主な課題は、多くの投資と研究が必要なこと、そしてこれらの生物と疾患に関する膨大な臨床的側面があることです。また、抗ウイルス剤の性質が変化するため、長期的なフォローアップの必要性が不可欠です。この側面は、予測期間中、市場の妨げになると予測されます。
規制の課題
FDAの医薬品認可は、通常、最終的に製品が商品化されるまでに長く退屈なプロセスを伴います。これは、新製品を市場に送り出すために激しいR&Dを行っている企業にとって、通常、課題となっています。製品の安全性や使用方法などを当局に確認した上で、一般消費者向けに製品化する。そのためには、多額の投資が必要となる。
マーケットリサーチレポートを購入する前に、どのような質問をすべきでしょうか?
- HIV/HBV治療薬市場はどのように進化しているのか?
- HIV/HBV治療薬市場の推進要因と抑制要因は何か?
- HIV/HBV治療薬の各サブマーケット区分は予測期間中にどのように成長し、2032年にこれらのサブマーケットが占める売上はどの程度になるのでしょうか?
- 2022年から2032年にかけて、各HIV/HBV Therapiesのサブマーケットの市場シェアはどのように推移するのか?
- 2022年から2032年にかけて、市場全体の主な推進力は何になるのか?
- HIV/HBV治療薬の主要市場はマクロ経済のダイナミクスに概ね追随するのか、それとも個々の国内市場が他を凌駕するのか?
- 2032年までに各国市場のシェアはどのように変化し、どの地域が2032年に市場をリードするのか?
- リーディングプレイヤーは誰か、また予測期間中の見通しは?
- これらの主要企業のHIV/HBV治療薬プロジェクトはどのようなものでしょうか?
- 2020年から2032年の間に、業界はどのように進化していくのでしょうか?現在および今後10年間に実施されるHIV/HBV治療薬のプロジェクトはどのような意味を持つのか?
- HIV/HBV治療薬市場をさらに拡大するために、製品の商業化の必要性は高いか?
- HIV/HBV治療薬市場はどこへ向かい、どのようにすれば市場の最前線に立つことができるか?
- 新製品群に対する最適な投資オプションは何か?
- 企業を新たな成長軌道に乗せ、C-suiteに移行させるための重要な展望とは?
HIV/HBV治療薬市場に現在、そして今後10年間、どのような影響を与えるかを知る必要があります。- 353ページにわたる本レポートでは、137の表、225のグラフ、そしてあなただけに提供されるグラフを掲載しています。
- このレポートでは、業界における主要な収益性の高い分野をハイライトしているため、今すぐその分野をターゲットにすることができます。
- 世界、地域、国別の売上高と成長率を詳細に分析しています。
- 競合他社が成功した主要なトレンド、変化、収益予測をハイライトしています。
本レポートは、HIV/HBV治療薬市場が今後10年間にどのように発展し、COVID-19の景気後退と回復の変動に伴ってどのように変化するかを教えてくれるものです。この市場は、過去10年間のどの時点よりも、今がより重要なのです。
2032年までの予測やその他の分析により、商業的な展望が見えてくる
- 2032年までの収益予測に加え、直近の実績、成長率、市場シェアもご覧いただけます。
- ビジネスの展望や展開など、独自の分析もご覧いただけます。
- 定性的分析(市場力学、推進要因、機会、阻害要因、課題など)、コスト構造、HIV/HBV治療薬の価格上昇の影響、最近の動向などをご覧いただけます。
本レポートでは、COVID-19が業界と貴社にどのような影響を与えるかについて、データ分析と貴重な洞察を掲載しています。本レポートでは、COVID-19の4つの回収パターンとその影響、すなわち「V」、「L」、「W」、「U」について論じています。
報告書の対象セグメント
薬効分類の見通し
- 併用療法
- ヌクレオシド系および非ヌクレオシド系RTI
- インテグラーゼ阻害剤
- プロテアーゼ阻害剤
- その他
流通チャネル
- 病院薬局
- 小売薬局
- オンライン薬局
世界市場全体とセグメントの収益予測に加え、4地域と20以上の主要国市場の収益予測も掲載しています。
北米
- 米国
- カナダ
欧州
- ドイツ
- スペイン
- イギリス
- フランス
- イタリア
- ロシア
- その他の欧州
アジア太平洋
- 中国
- 日本
- インド
- オーストラリア
- 韓国
- その他のアジア太平洋地域
LATAM
- ブラジル
- メキシコ
- その他のラテンアメリカ地域
MEA
- 南アフリカ
- GCC
- その他のMEA
HIV/HBV治療薬市場の2022年から2032年にかけての主要企業のプロフィールを掲載し、これらの企業のこのセグメントに焦点を当てます。
主要企業と市場成長の可能性
・ Pfizer
・ Merck
・ GSK
・ AbbVie
・ Boehringer Ingelheim
・ Gilead Sciences
・ Janssen Pharmaceutical
・ Teva
・ BMS
・ Arbustus Biopharma
HIV/HBV治療薬の世界全体の収益、2022年から2032年まで 金額ベースで、市場は2022年に362億米ドルを超えると、我々の仕事は計算します。また、2032年までの間に売上が大きく伸びると予測しています。本調査では、最も大きな可能性を秘めた企業を特定しました。彼らの能力、進歩、商業的展望を知ることで、一歩先を行くことができます。
HIV/HBV治療薬市場、2022年から2032年までのレポートはどのように役立つのでしょうか?
350ページを超えるレポートでは、要約すると以下のような知識を得ることができます。
- HIV/HBV治療薬市場の2032年までの収益予測、薬剤クラス、流通チャネル、企業規模の各予測を世界および地域レベルで掲載 - 業界の展望を見出し、投資および収益に最も有利な場所を見つけることが可能です。
- 4つの地域と20の主要国市場の2032年までの収益予測 - 北米、欧州、アジア太平洋、LAMEAのHIV/HBV治療薬市場、2022年から2032年の市場予測をご覧ください。また、米国、カナダ、メキシコ、ブラジル、ドイツ、フランス、英国、イタリア、スペイン、ロシア、中国、インド、日本、オーストラリアなどの主要経済圏の市場も予測されています。
- HIV/HBV治療薬市場に関与する主要企業10社の企業プロファイルを含む、既存企業および市場参入を目指す企業の展望(2022年から2032年まで)。
定量的・定性的な分析と独自の予測をご覧いただけます。私たちのレポートだけが持つ情報を入手し、貴重なビジネスインテリジェンスを得ることができます。
他にはない情報
私たちの新しいレポートがあれば、知識の遅れを取り戻し、チャンスを逃す可能性が低くなります。私たちの研究が貴社の研究、分析、意思決定にどのように役立つかをご覧ください。Visiongainの研究は、HIV/HBV治療薬市場、2022年から2032年、市場をリードする企業のための商業分析を必要とするすべての人のためのものです。データ、トレンド、予測をご覧いただけます。
ページTOPに戻る
目次
目次
1.レポートの概要
1.1 調査の目的
1.2 HIV/HBV治療薬市場の紹介
1.3 本レポートが提供するもの
1.4 本レポートを読むべき理由
1.5 本分析レポートが回答する主な質問には以下が含まれます。
1.6 本レポートは誰のためのものなのか?
1.7 方法論
1.7.1 市場の定義
1.7.2 市場評価・予測手法
1.8 よくある質問(FAQ)
1.9 関連するVisiongainレポート
1.10 Visiongainについて
2 エグゼクティブサマリー
2.1 地域別スナップショットHIV/HBV治療薬の世界市場
2.2 薬剤クラス別セグメント市場魅力度指数
2.3 流通チャネルセグメント3 流通チャネルセグメント:市場魅力度指標
3 市場の概要
3.1 主要な調査結果
3.2 マーケットダイナミクス
3.2.1 市場の推進要因
3.2.2 市場の抑制要因
3.2.3 市場機会
3.3 COVID-19影響度分析
3.4 ポーターのファイブフォース分析
3.4.1 サプライヤーパワー
3.4.2 バイヤーパワー
3.4.3 競争相手との競合
3.4.4 代替品による脅威
3.4.5 新規参入者の脅威
4 世界のHIV/HBV治療薬市場分析:薬効分類別
4.2 ドラッグクラスセグメントの成長展望
4.3 HIV/HBV治療薬の薬効別世界市場規模推定・予測
4.4 組み合わせ療法
4.4.1 組合せ療法の地域別市場予測、2022年〜2032年(10億米ドル)
4.4.2 組合せ療法の地域別市場シェア、2022-2032年(%)
4.5 ヌクレオシド系及び非ヌクレオシド系RTI
4.5.1 ヌクレオシド系及び非ヌクレオシド系RTIの地域別市場予測、2022年~2032年 (Bn米ドル)
4.5.2 ヌクレオシド及び非ヌクレオシド系RTIの地域別市場シェア、2022-2032年(%)
4.6 インテグラーゼ阻害剤
4.6.1 インテグラーゼ阻害剤の地域別市場予測、2022年~2032年 (Bn米ドル)
4.6.2 インテグラーゼ阻害剤の地域別市場シェア、2022-2032年(%)
4.7 プロテアーゼ阻害剤
4.7.1 プロテアーゼ阻害剤の地域別市場予測、2022-2032年 (Bn米ドル)
4.7.2 プロテアーゼ阻害剤の地域別市場シェア、2022-2032年(%)
4.8 その他の薬物クラス
4.8.1 その他の薬物クラスの地域別市場予測, 2022-2032年 (Bn米ドル)
4.8.2 その他の薬物クラスの地域別市場シェア、2022-2032年(%)
5 世界のHIV/HBV治療薬市場分析:流通チャネル別
5.1 主な調査結果
5.2 流通チャネル別成長展望
5.3 HIV/HBV治療薬の世界における流通チャネル別市場規模の推定・予測
5.4 HIV/HBV治療薬の世界市場 流通チャネル別シェア、2022年&2032年
5.5 病院内薬局
5.5.1 病院内薬局の地域別市場予測、2022年~2032年(10億米ドル)
5.5.2 病院内薬局の地域別市場シェア、2022年~2032年 (%)
5.6 小売薬局
5.6.1 小売薬局の地域別市場予測, 2022-2032年 (Bn米ドル)
5.6.2 小売薬局の地域別市場シェア、2022年〜2032年(%)
5.7 オンライン薬局
5.7.1 オンライン薬局の地域別市場予測、2022年〜2032年(Bn米ドル)
5.7.2 オンライン薬局の地域別市場シェア、2022年〜2032年 (%)
6 世界のHIV/HBV治療薬市場のパイプライン分析
6.1 主な調査結果
6.2 HIVパイプライン
6.3 HBVパイプライン
7 世界のHIV/HBV治療薬市場分析:地域別
7.1 主な調査結果
7.2 地域別市場規模の推定と予測
7.3 COVID-19の影響度分析。回復シナリオ(V, U, W, L)
8 北米のHIV/HBV治療薬市場分析
8.1 主な調査結果
8.2 北米HIV/HBV治療薬市場魅力度指数
8.3 北米HIV/HBV治療薬国別市場 2022年、2027年&2032年(10億米ドル)
8.4 北米HIV/HBV治療薬国別市場規模予測・予想
8.5 北米のHIV/HBV治療薬市場の薬効別市場規模予測・予測
8.6 北米HIV/HBV治療薬市場の流通チャネル別市場規模予測・予想
8.7 米国
8.7.1 米国のHIV/HBV治療薬市場:薬効分類別
8.7.2 米国のHIV/HBV治療薬市場:流通チャネル別
8.8 カナダ
8.8.1 カナダのHIV/HBV治療薬市場:薬効分類別
8.8.2 カナダのHIV/HBV治療薬市場:流通チャネル別
9 欧州のHIV/HBV治療薬市場分析
9.1 主な調査結果
9.2 欧州HIV/HBV治療薬市場魅力度指数
9.3 欧州HIV/HBV治療薬国別市場 2022年、2027年&2032年(10億米ドル)
9.4 欧州HIV/HBV治療薬国別市場規模推定・予測
9.5 欧州HIV/HBV治療薬市場 薬効別市場規模予測・予測
9.6 欧州HIV/HBV治療薬市場の流通チャネル別市場規模予測・予想
9.7 ドイツ
9.7.1 ドイツのHIV/HBV治療薬市場:薬効分類別
9.7.2 ドイツのHIV/HBV治療薬市場:流通チャネル別
9.8 イギリス
9.8.1 イギリスのHIV/HBV治療薬市場:薬効分類別
9.8.2 イギリスのHIV/HBV治療薬市場:流通チャネル別
9.9 フランス
9.9.1 フランスのHIV/HBV治療薬市場:薬効分類別
9.9.2 フランスのHIV/HBV治療薬市場:流通チャネル別
9.10 イタリア
9.10.1 イタリアのHIV/HBV治療薬市場:薬効分類別
9.10.2 イタリアのHIV/HBV治療薬市場:流通チャネル別
9.11 スペイン
9.11.1 スペインのHIV/HBV治療薬市場:薬効分類別
9.11.2 スペインのHIV/HBV治療薬市場:流通チャネル別
9.12 ロシア
9.12.1 ロシアのHIV/HBV治療薬市場:薬効分類別
9.12.2 ロシアHIV/HBV治療薬市場:流通チャネル別
9.13 欧州のその他の地域
9.13.1 欧州のHIV/HBV治療薬市場:薬効分類別
9.13.2 欧州のHIV/HBV治療薬市場:流通チャネル別
10 アジア太平洋地域のHIV/HBV治療薬市場分析
10.1 主な調査結果
10.2 アジア太平洋地域のHIV/HBV治療薬市場の魅力度指数
10.3 アジア太平洋地域のHIV/HBV治療薬の国別市場規模、2022年、2027年&2032年(10億米ドル)
10.4 アジア太平洋地域のHIV/HBV治療薬の国別市場規模の推定と予測
10.5 アジア太平洋地域のHIV/HBV治療薬市場の薬効別市場規模予測・予測
10.6 アジア太平洋地域のHIV/HBV治療薬市場の流通チャネル別市場規模予測・予想
10.7 日本
10.7.1 日本HIV/HBV治療薬市場規模予測:薬効分類別
10.7.2 日本HIV/HBV治療薬市場:流通チャネル別
10.8 中国
10.8.1 中国HIV/HBV治療薬市場:薬効分類別
10.8.2 中国HIV/HBV治療薬市場:流通チャネル別
10.9 インド
10.9.1 インドのHIV/HBV治療薬市場:薬効分類別
10.9.2 インドのHIV/HBV治療薬市場:流通チャネル別
10.10 韓国
10.10.1 韓国のHIV/HBV治療薬市場:薬効分類別
10.10.2 韓国のHIV/HBV治療薬市場:流通チャネル別
10.11 オーストラリア
10.11.1 オーストラリアのHIV/HBV治療薬市場:薬効分類別
10.11.2 オーストラリアのHIV/HBV治療薬市場:流通チャネル別
10.12 その他のアジア太平洋地域
10.12.1 APACのその他の地域:HIV/HBV治療薬市場:薬効分類別
10.12.2 その他のAPAC地域のHIV/HBV治療薬市場:流通チャネル別
11 ラテンアメリカのHIV/HBV治療薬市場分析
11.1 主な調査結果
11.2 ラテンアメリカのHIV/HBV治療薬市場の魅力度指数
11.3 ラテンアメリカのHIV/HBV治療薬市場の国別推移、2022年、2027年、2032年(10億米ドル)
11.4 中南米のHIV/HBV治療薬市場の国別規模予測・予想
11.5 中南米のHIV/HBV治療薬市場 薬効別市場規模予測・予測
11.6 中南米のHIV/HBV治療薬市場の流通チャネル別市場規模予測・予想
11.7 ブラジル
11.7.1 ブラジルHIV/HBV治療薬薬市場:薬効分類別
11.7.2 ブラジルHIV/HBV治療薬市場:流通チャネル別
11.8 メキシコ
11.8.1 メキシコのHIV/HBV治療薬市場:薬効分類別
11.8.2 メキシコのHIV/HBV治療薬市場:流通チャネル別
11.9 ラテンアメリカのその他の地域
11.9.1 ラテンアメリカのその他の地域:HIV/HBV治療薬市場:薬効分類別
11.9.2 ラテンアメリカのその他の地域:HIV/HBV治療薬市場:流通チャネル別
12 MEAのHIV/HBV治療薬市場分析
12.1 主な調査結果
12.2 MEAのHIV/HBV治療薬市場の魅力度指数
12.3 MEAのHIV/HBV治療薬市場の国別推移(2022年、2027年&2032年)(10億米ドル)
12.4 MEAのHIV/HBV治療薬市場の国別規模予測・予想
12.5 MEAのHIV/HBV治療薬市場の薬効別市場規模予測と予測
12.6 MEAのHIV/HBV治療薬市場の流通チャネル別市場規模予測・予想
12.7 南アフリカ
12.7.1 南アフリカのHIV/HBV治療薬市場:薬効分類別
12.7.2 南アフリカのHIV/HBV治療薬市場:流通チャネル別
12.8 GCC
12.8.1 GCCのHIV/HBV治療薬市場:薬効分類別
12.8.2 GCCのHIV/HBV治療薬市場:流通チャネル別
12.9 MEAのその他の地域
12.9.1 MEAのその他の地域:HIV/HBV治療薬市場:薬効分類別
12.9.2 MEAのその他の地域:HIV/HBV治療薬市場:流通チャネル別
13 競合他社の状況
13.1 企業シェア分析
13.2 主要事業戦略分析
14 主要企業のプロフィール
14.1 ファイザー
14.1.1 企業スナップショット
14.1.2 会社概要
14.1.3 財務分析
14.1.4 製品ベンチマーク
14.1.5 戦略的展望
14.2 メルク
14.2.1 会社概要
14.2.2 会社概要
14.2.3 財務分析
14.2.4 製品ベンチマーク
14.2.5 戦略的展望
14.3 GSK
14.3.1 企業スナップショット
14.3.2 会社概要
14.3.3 財務分析
14.3.4 製品ベンチマーク
14.3.5 戦略的展望
14.4 アッヴィ
14.4.1 企業スナップショット
14.4.2 会社概要
14.4.3 財務分析
14.4.4 製品ベンチマーク
14.4.5 戦略的な展望
14.5 ベーリンガーインゲルハイム
14.5.1 企業スナップショット
14.5.2 会社概要
14.5.3 財務分析
14.5.4 製品ベンチマーク
14.5.5 戦略的な展望
14.6 ギリアド・サイエンス
14.6.1 企業スナップショット
14.6.2 会社概要
14.6.3 財務分析
14.6.4 製品ベンチマーク
14.6.5 戦略的展望
14.7 ヤンセンファーマ
14.7.1 企業スナップショット
14.7.2 会社概要
14.7.3 財務分析
14.7.4 製品ベンチマーク
14.7.5 戦略的展望
14.8 テバ
14.8.1 企業スナップショット
14.8.2 会社概要
14.8.3 財務分析
14.8.4 製品ベンチマーク
14.8.5 戦略的展望
14.9 BMS
14.9.1 企業スナップショット
14.9.2 会社概要
14.9.3 財務分析
14.9.4 製品ベンチマーク
14.9.5 戦略的展望
14.10 アービュタス・バイオファーマ
14.10.1 企業スナップショット
14.10.2 会社概要
14.10.3 財務分析
14.10.4 製品ベンチマーク
14.10.5 戦略的展望
15 結論と提言
15.1 ヴィジョンゲインからの結論
15.2 市場関係者への提言
表の一覧
Table 1 Global HIV and HBV Therapies Market Snapshot, 2022 & 2032 (US$ billion, CAGR %)
Table 2 HIV and HBV Therapies Market, By Region, 2022-2032 (US$ Bn, AGR %, CAGR %) (V-shaped Recovery)
Table 3 HIV and HBV Therapies Market, By Region, 2022-2032 (US$ Bn, AGR %, CAGR %) (U-shaped Recovery)
Table 4 HIV and HBV Therapies Market, By Region, 2022-2032 (US$ Bn, AGR %, CAGR %) (W-shaped Recovery)
Table 5 HIV and HBV Therapies Market, By Region, 2022-2032 (US$ Bn, AGR %, CAGR %) (L-shaped Recovery)
Table 6 HIV and HBV Therapies Drug Class Market, 2022-2032 (US$ Bn, AGR (%), CAGR (%))
Table 7 Approved Combination Therapies
Table 8 Combination Therapies Market, by Region, 2022-2032 (US$ Bn, AGR (%), CAGR (%))
Table 9 Approved NRTIs
Table 10 Approved NNRTIs
Table 11 Nucleoside and Non-nucleoside RTIs Market, by Region, 2022-2032 (US$ Bn, AGR (%), CAGR (%))
Table 12 Approved Integrase Inhibitors
Table 13 Integrase Inhibitors Market, by Region, 2022-2032 (US$ Bn, AGR (%), CAGR (%))
Table 14 Approved Protease Inhibitors
Table 15 Protease Inhibitors Market, by Region, 2022-2032 (US$ Bn, AGR (%), CAGR (%))
Table 16 Approved other therapies
Table 17 Other Drug Class Market, by Region, 2022-2032 (US$ Bn, AGR (%), CAGR (%))
Table 18 HIV and HBV Therapies Distribution Channel Market, 2022-2032 (US$ Bn, AGR (%), CAGR (%))
Table 19 Hospital pharmacies Market, by Region, 2022-2032 (US$ Bn, AGR (%), CAGR (%))
Table 20 Retail pharmacies Market, by Region, 2022-2032 (US$ Bn, AGR (%), CAGR (%))
Table 21 Online pharmacies Market, by Region, 2022-2032 (US$ Bn, AGR (%), CAGR (%))
Table 22 HIV Pipeline Products
Table 23 HIV Pipeline Products (bNAbs)
Table 24 HIV Pipeline Products (other compounds)
Table 25 Chronic Hepatitis B pipeline, 2022
Table 26 HIV and HBV Therapies Market, By Region, 2022-2032 (US$ Bn, AGR (%), CAGR (%))
Table 27 HIV and HBV Therapies Market, By Region, 2022-2032 (US$ Bn, AGR %, CAGR %) (V-shaped Recovery)
Table 28 HIV and HBV Therapies Market, By Region, 2022-2032 (US$ Bn, AGR %, CAGR %) (U-shaped Recovery)
Table 29 HIV and HBV Therapies Market, By Region, 2022-2032 (US$ Bn, AGR %, CAGR %) (W-shaped Recovery)
Table 30 HIV and HBV Therapies Market, By Region, 2022-2032 (US$ Bn, AGR %, CAGR %) (L-shaped Recovery)
Table 31 North America HIV and HBV Therapies Market, By Country, 2022-2032 (US$ Bn, AGR (%), CAGR (%))
Table 32 North America HIV and HBV Therapies Drug Class Market, 2022-2032 (US$ Bn, AGR (%), CAGR (%))
Table 33 North America HIV and HBV Therapies Distribution Channel Market, 2022-2032 (US$ Bn, AGR (%), CAGR (%))
Table 34 US HIV and HBV Therapies Market, 2022-2032 (US$ Bn, AGR (%), CAGR (%))
Table 35 US HIV and HBV Therapies Drug Class Market, 2022-2032 (US$ Bn, AGR (%), CAGR (%))
Table 36 US HIV and HBV Therapies Distribution Channel Market, 2022-2032 (US$ Bn, AGR (%), CAGR (%))
Table 37 Canada HIV and HBV Therapies Market, 2022-2032 (US$ Bn, AGR (%), CAGR (%))
Table 38 Canada HIV and HBV Therapies Drug Class Market, 2022-2032 (US$ Bn, AGR (%), CAGR (%))
Table 39 Canada HIV and HBV Therapies Distribution Channel Market, 2022-2032 (US$ Bn, AGR (%), CAGR (%))
Table 40 Europe HIV and HBV Therapies Market, By Country, 2022-2032 (US$ Bn, AGR (%), CAGR (%))
Table 41 Europe HIV and HBV Therapies Drug Class Market, 2022-2032 (US$ Bn, AGR (%), CAGR (%))
Table 42 Europe HIV and HBV Therapies Distribution Channel Market, 2022-2032 (US$ Bn, AGR (%), CAGR (%))
Table 43 Germany HIV and HBV Therapies Market, 2022-2032 (US$ Bn, AGR (%), CAGR (%))
Table 44 Germany HIV and HBV Therapies Drug Class Market, 2022-2032 (US$ Bn, AGR (%), CAGR (%))
Table 45 Germany HIV and HBV Therapies Distribution Channel Market, 2022-2032 (US$ Bn, AGR (%), CAGR (%))
Table 46 UK HIV and HBV Therapies Market, 2022-2032 (US$ Bn, AGR (%), CAGR (%))
Table 47 UK HIV and HBV Therapies Drug Class Market, 2022-2032 (US$ Bn, AGR (%), CAGR (%))
Table 48 UK HIV and HBV Therapies Distribution Channel Market, 2022-2032 (US$ Bn, AGR (%), CAGR (%))
Table 49 France HIV and HBV Therapies Market, 2022-2032 (US$ Bn, AGR (%), CAGR (%))
Table 50 France HIV and HBV Therapies Drug Class Market, 2022-2032 (US$ Bn, AGR (%), CAGR (%))
Table 51 France HIV and HBV Therapies Distribution Channel Market, 2022-2032 (US$ Bn, AGR (%), CAGR (%))
Table 52 Italy HIV and HBV Therapies Market, 2022-2032 (US$ Bn, AGR (%), CAGR (%))
Table 53 Italy HIV and HBV Therapies Drug Class Market, 2022-2032 (US$ Bn, AGR (%), CAGR (%))
Table 54 Italy HIV and HBV Therapies Distribution Channel Market, 2022-2032 (US$ Bn, AGR (%), CAGR (%))
Table 55 Spain HIV and HBV Therapies Market, 2022-2032 (US$ Bn, AGR (%), CAGR (%))
Table 56 Spain HIV and HBV Therapies Drug Class Market, 2022-2032 (US$ Bn, AGR (%), CAGR (%))
Table 57 Spain HIV and HBV Therapies Distribution Channel Market, 2022-2032 (US$ Bn, AGR (%), CAGR (%))
Table 58 Russia HIV and HBV Therapies Market, 2022-2032 (US$ Bn, AGR (%), CAGR (%))
Table 59 Russia HIV and HBV Therapies Drug Class Market, 2022-2032 (US$ Bn, AGR (%), CAGR (%))
Table 60 Russia HIV and HBV Therapies Distribution Channel Market, 2022-2032 (US$ Bn, AGR (%), CAGR (%))
Table 61 Rest of Europe HIV and HBV Therapies Market, 2022-2032 (US$ Bn, AGR (%), CAGR (%))
Table 62 Rest of Europe HIV and HBV Therapies Drug Class Market, 2022-2032 (US$ Bn, AGR (%), CAGR (%))
Table 63 Rest of Europe HIV and HBV Therapies Distribution Channel Market, 2022-2032 (US$ Bn, AGR (%), CAGR (%))
Table 64 Asia Pacific HIV and HBV Therapies Market, By Country, 2022-2032 (US$ Bn, AGR (%), CAGR (%))
Table 65 Asia Pacific HIV and HBV Therapies Drug Class Market, 2022-2032 (US$ Bn, AGR (%), CAGR (%))
Table 66 Asia Pacific HIV and HBV Therapies Distribution Channel Market, 2022-2032 (US$ Bn, AGR (%), CAGR (%))
Table 67 Japan HIV and HBV Therapies Market, 2022-2032 (US$ Bn, AGR (%), CAGR (%))
Table 68 Japan HIV and HBV Therapies Drug Class Market, 2022-2032 (US$ Bn, AGR (%), CAGR (%))
Table 69 Japan HIV and HBV Therapies Distribution Channel Market, 2022-2032 (US$ Bn, AGR (%), CAGR (%))
Table 70 China HIV and HBV Therapies Market, 2022-2032 (US$ Bn, AGR (%), CAGR (%))
Table 71 China HIV and HBV Therapies Drug Class Market, 2022-2032 (US$ Bn, AGR (%), CAGR (%))
Table 72 China HIV and HBV Therapies Distribution Channel Market, 2022-2032 (US$ Bn, AGR (%), CAGR (%))
Table 73 India HIV and HBV Therapies Market, 2022-2032 (US$ Bn, AGR (%), CAGR (%))
Table 74 India HIV and HBV Therapies Drug Class Market, 2022-2032 (US$ Bn, AGR (%), CAGR (%))
Table 75 India HIV and HBV Therapies Distribution Channel Market, 2022-2032 (US$ Bn, AGR (%), CAGR (%))
Table 76 South Korea HIV and HBV Therapies Market, 2022-2032 (US$ Bn, AGR (%), CAGR (%))
Table 77 South Korea HIV and HBV Therapies Drug Class Market, 2022-2032 (US$ Bn, AGR (%), CAGR (%))
Table 78 South Korea HIV and HBV Therapies Distribution Channel Market, 2022-2032 (US$ Bn, AGR (%), CAGR (%))
Table 79 Australia HIV and HBV Therapies Market, 2022-2032 (US$ Bn, AGR (%), CAGR (%))
Table 80 Australia HIV and HBV Therapies Drug Class Market, 2022-2032 (US$ Bn, AGR (%), CAGR (%))
Table 81 Australia HIV and HBV Therapies Distribution Channel Market, 2022-2032 (US$ Bn, AGR (%), CAGR (%))
Table 82 Rest of Asia Pacific HIV and HBV Therapies Market, 2022-2032 (US$ Bn, AGR (%), CAGR (%))
Table 83 Rest of Asia Pacific HIV and HBV Therapies Drug Class Market, 2022-2032 (US$ Bn, AGR (%), CAGR (%))
Table 84 Rest of Asia Pacific HIV and HBV Therapies Distribution Channel Market, 2022-2032 (US$ Bn, AGR (%), CAGR (%))
Table 85 Latin America HIV and HBV Therapies Market, By Country, 2022-2032 (US$ Bn, AGR (%), CAGR (%))
Table 86 Latin America HIV and HBV Therapies Drug Class Market, 2022-2032 (US$ Bn, AGR (%), CAGR (%))
Table 87 Latin America HIV and HBV Therapies Distribution Channel Market, 2022-2032 (US$ Bn, AGR (%), CAGR (%))
Table 88 Brazil HIV and HBV Therapies Market, 2022-2032 (US$ Bn, AGR (%), CAGR (%))
Table 89 Brazil HIV and HBV Therapies Drug Class Market, 2022-2032 (US$ Bn, AGR (%), CAGR (%))
Table 90 Brazil HIV and HBV Therapies Distribution Channel Market, 2022-2032 (US$ Bn, AGR (%), CAGR (%))
Table 91 Mexico HIV and HBV Therapies Market, 2022-2032 (US$ Bn, AGR (%), CAGR (%))
Table 92 Mexico HIV and HBV Therapies Drug Class Market, 2022-2032 (US$ Bn, AGR (%), CAGR (%))
Table 93 Mexico HIV and HBV Therapies Distribution Channel Market, 2022-2032 (US$ Bn, AGR (%), CAGR (%))
Table 94 Rest of Latin America HIV and HBV Therapies Market, 2022-2032 (US$ Bn, AGR (%), CAGR (%))
Table 95 Rest of LATAM HIV and HBV Therapies Drug Class Market, 2022-2032 (US$ Bn, AGR (%), CAGR (%))
Table 96 Rest of LATAM HIV and HBV Therapies Distribution Channel Market, 2022-2032 (US$ Bn, AGR (%), CAGR (%))
Table 97 MEA HIV and HBV Therapies Market, By Country, 2022-2032 (US$ Bn, AGR (%), CAGR (%))
Table 98 MEA HIV and HBV Therapies Drug Class Market, 2022-2032 (US$ Bn, AGR (%), CAGR (%))
Table 99 MEA HIV and HBV Therapies Distribution Channel Market, 2022-2032 (US$ Bn, AGR (%), CAGR (%))
Table 100 South Africa HIV and HBV Therapies Market, 2022-2032 (US$ Bn, AGR (%), CAGR (%))
Table 101 South Africa HIV and HBV Therapies Drug Class Market, 2022-2032 (US$ Bn, AGR (%), CAGR (%))
Table 102 South Africa HIV and HBV Therapies Distribution Channel Market, 2022-2032 (US$ Bn, AGR (%), CAGR (%))
Table 103 GCC HIV and HBV Therapies Market, 2022-2032 (US$ Bn, AGR (%), CAGR (%))
Table 104 GCC HIV and HBV Therapies Drug Class Market, 2022-2032 (US$ Bn, AGR (%), CAGR (%))
Table 105 GCC HIV and HBV Therapies Distribution Channel Market, 2022-2032 (US$ Bn, AGR (%), CAGR (%))
Table 106 Rest of MEA HIV and HBV Therapies Market, 2022-2032 (US$ Bn, AGR (%), CAGR (%))
Table 107 Rest of MEA HIV and HBV Therapies Drug Class Market, 2022-2032 (US$ Bn, AGR (%), CAGR (%))
Table 108 Rest of MEA HIV and HBV Therapies Distribution Channel Market, 2022-2032 (US$ Bn, AGR (%), CAGR (%))
Table 109 Key Business Strategies Adopted by Key Players in Global HIV and HBV Therapies Market
Table 110 Pfizer: Key Details, (CEO, HQ, Revenue, Founded, No. of Employees, Company Type, Website, Business Segment)
Table 111 Pfizer: Product Benchmarking
Table 112 Merck: Key Details, (CEO, HQ, Revenue, Founded, No. of Employees, Company Type, Website, Business Segment)
Table 113 Merck: Product Benchmarking
Table 114 Merck: Strategic Outlook
Table 115 GSK: Key Details, (CEO, HQ, Revenue, Founded, No. of Employees, Company Type, Website, Business Segment)
Table 116 GSK: Product Benchmarking
Table 117 GSK: Strategic Outlook
Table 118 AbbVie: Key Details, (CEO, HQ, Revenue, Founded, No. of Employees, Company Type, Website)
Table 119 AbbVie: Product Benchmarking
Table 120 AbbVie: Strategic Outlook
Table 121 Boehringer Ingelheim: Key Details, (CEO, HQ, Revenue, Founded, No. of Employees, Company Type, Website, Business Segment)
Table 122 Boehringer Ingelheim: Product Benchmarking
Table 123 Gilead Sciences: Key Details, (CEO, HQ, Revenue, Founded, No. of Employees, Company Type, Website, Business Segment)
Table 124 Gilead Sciences: Product Benchmarking
Table 125 Gilead Sciences: Strategic Outlook
Table 126 Janssen Pharma: Key Details, (CEO, HQ, Revenue, Founded, No. of Employees, Company Type, Website, Business Segment)
Table 127 Janssen Pharma: Product Benchmarking
Table 128 Janssen Pharma: Strategic Outlook
Table 129 Teva: Key Details, (CEO, HQ, Revenue, Founded, No. of Employees, Company Type, Website, Business Segment)
Table 130 Teva: Product Benchmarking
Table 131 Teva: Strategic Outlook
Table 132 BMS: Key Details, (CEO, HQ, Revenue, Founded, No. of Employees, Company Type, Website)
Table 133 BMS: Product Benchmarking
Table 134 BMS: Strategic Outlook
Table 135 Arbutus Biopharma: Key Details, (CEO, HQ, Revenue, Founded, No. of Employees, Company Type, Website)
Table 136 ARBUTUS BIOPHARMA: Product Benchmarking
Table 137 ARBUTUS BIOPHARMA: Strategic Outlook
図の一覧
Figure 1 Global HIV and HBV Therapies Market Segmentation
Figure 2 Global HIV and HBV Therapies Market Forecast by Region: Market Attractiveness Index
Figure 3 Global HIV and HBV Therapies Market by Drug Class: Market Attractiveness Index
Figure 4 Global HIV and HBV Therapies Market by Distribution Channel: Market Attractiveness Index
Figure 5 Global HIV and HBV Therapies Market: Market Dynamics
Figure 6 Global COVID Impact Analysis: HIV and HBV Therapies Market Recovery Scenarios
Figure 7 Global HIV and HBV Therapies Market by Region, 2022-2032 (US$ Mn, AGR (%), CAGR (%)): “V” Shaped Recovery
Figure 8 Global HIV and HBV Therapies Market by Region, 2022-2032 (US$ Mn, AGR (%), CAGR (%)): “U” Shaped Recovery
Figure 9 Global HIV and HBV Therapies Market by Region, 2022-2032 (US$ Mn, AGR (%), CAGR (%)): “W” Shaped Recovery
Figure 10 Global HIV and HBV Therapies Market by Region, 2022-2032 (US$ Mn, AGR (%), CAGR (%)): “L” Shaped Recovery
Figure 11 Global HIV and HBV Therapies Market: Porter’s Five Forces Analysis
Figure 12 Global HIV and HBV Therapies Market Forecast by Drug Class 2022, 2027, 2032 (Revenue, CAGR%)
Figure 13 Global HIV and HBV Therapies Market Share Forecast by Drug Class, 2022, 2027, 2032 (%)
Figure 14 Global HIV and HBV Therapies Market Forecast by Drug Class, 2022-2032 (US$ billion, AGR %)
Figure 15 Combination Therapies Market Forecast by Region, 2022-2032 (US$ billion)
Figure 16 Combination Therapies Market Share Forecast by Region, 2022-2032 (%)
Figure 17 Nucleoside and Non-nucleoside RTIs Market Forecast by Region, 2022-2032 (US$ billion)
Figure 18 Nucleoside and Non-nucleoside RTIs Market Share Forecast by Region, 2022-2032 (%)
Figure 19 Integrase inhibitors Market Forecast by Region, 2022-2032 (US$ billion)
Figure 20 Integrase inhibitors Market Share Forecast by Region, 2022-2032 (%)
Figure 21 Protease Inhibitors Market Forecast by Region, 2022-2032 (US$ billion)
Figure 22 Protease Inhibitors Market Share Forecast by Region, 2022-2032 (%)
Figure 23 Other Drug Class Market Forecast by Region, 2022-2032 (US$ billion)
Figure 24 Other Drug Class Market Share Forecast by Region, 2022-2032 (%)
Figure 25 Global HIV and HBV Therapies Market Forecast by Distribution Channel 2022, 2027, 2032 (Revenue, CAGR%)
Figure 26 Global HIV and HBV Therapies Market Forecast by Distribution Channel, 2022-2032 (US$ billion, AGR %)
Figure 27 Global HIV and HBV Therapies Market Share Forecast by Distribution Channel, 2022, 2032 (%)
Figure 28 Hospital pharmacies Market Forecast by Region, 2022-2032 (US$ billion)
Figure 29 Hospital pharmacies Market Share Forecast by Region, 2022-2032 (%)
Figure 30 Retail pharmacies Market Forecast by Region, 2022-2032 (US$ billion)
Figure 31 Retail pharmacies Market Share Forecast by Region, 2022-2032 (%)
Figure 32 Online Pharmacies Market Forecast by Region, 2022-2032 (US$ billion)
Figure 33 Online Pharmacies Market Share Forecast by Region, 2022-2032 (%)
Figure 34 Global HIV and HBV Therapies Market Forecast by Region 2022, 2027, 2032 (Revenue), C
Figure 35 Global HIV and HBV Therapies Market Share Forecast by Region 2022, 2027, 2032(%)
Figure 36 Global HIV and HBV Therapies Market by Region, 2022-2032 (US$ Bn, AGR (%), CAGR (%))
Figure 37 Global HIV and HBV Therapies Market by Region, 2022-2032 (US$ Bn, AGR (%), CAGR (%)): “V” Shaped Recovery
Figure 38 Global HIV and HBV Therapies Market by Region, 2022-2032 (US$ Bn, AGR (%), CAGR (%)): “U” Shaped Recovery
Figure 39 Global HIV and HBV Therapies Market by Region, 2022-2032 (US$ Bn, AGR (%), CAGR (%)): “W” Shaped Recovery
Figure 40 Global HIV and HBV Therapies Market by Region, 2022-2032 (US$ Bn, AGR (%), CAGR (%)): “L” Shaped Recovery
Figure 41 North America HIV and HBV Therapies Market Attractiveness Index
Figure 42 North America HIV and HBV Therapies Market by Region, 2022, 2027 & 2032 (US$ billion)
Figure 43 North America HIV and HBV Therapies Market Forecast by Country, 2022-2032 (US$ billion, AGR %)
Figure 44 North America HIV and HBV Therapies Market Share Forecast by Country, 2022 & 2032 (%)
Figure 45 North America HIV and HBV Therapies Market Forecast by Drug Class, 2022-2032 (US$ billion, AGR %)
Figure 46 North America HIV and HBV Therapies Market Share Forecast by Drug Class, 2022 & 2032 (%)
Figure 47 North America HIV and HBV Therapies Market Forecast by Distribution Channel, 2022-2032 (US$ billion, AGR %)
Figure 48 North America HIV and HBV Therapies Market Share Forecast by Distribution Channel, 2022 & 2032 (%)
Figure 49 U.S. HIV and HBV Therapies Market Forecast, 2022-2032 (US$ billion, AGR %)
Figure 50 U.S. HIV and HBV Therapies Market Forecast by Drug Class, 2022-2032 (US$ billion, AGR %)
Figure 51 U.S. HIV and HBV Therapies Market Share Forecast by Drug Class, 2022 & 2032 (%)
Figure 52 U.S. HIV and HBV Therapies Market Forecast by Distribution Channel, 2022-2032 (US$ billion, AGR %)
Figure 53 U.S. HIV and HBV Therapies Market Share Forecast by Distribution Channel, 2022 & 2032 (%)
Figure 54 Canada HIV and HBV Therapies Market Forecast, 2022-2032 (US$ billion, AGR %)
Figure 55 Canada HIV and HBV Therapies Market Forecast by Drug Class, 2022-2032 (US$ billion, AGR %)
Figure 56 Canada HIV and HBV Therapies Market Share Forecast by Drug Class, 2022 & 2032 (%)
Figure 57 Canada HIV and HBV Therapies Market Forecast by Distribution Channel, 2022-2032 (US$ billion, AGR %)
Figure 58 Canada HIV and HBV Therapies Market Share Forecast by Distribution Channel, 2022 & 2032 (%)
Figure 59 Europe HIV and HBV Therapies Market Attractiveness Index
Figure 60 Europe HIV and HBV Therapies Market by Region, 2022, 2027 & 2032 (US$ billion)
Figure 61 Europe HIV and HBV Therapies Market Forecast by Country, 2022-2032 (US$ billion, AGR %)
Figure 62 Europe HIV and HBV Therapies Market Share Forecast by Country, 2022 & 2032 (%)
Figure 63 Europe HIV and HBV Therapies Market Forecast by Drug Class, 2022-2032 (US$ billion, AGR %)
Figure 64 North America HIV and HBV Therapies Market Share Forecast by Drug Class, 2022 & 2032 (%)
Figure 65 Europe HIV and HBV Therapies Market Forecast by Distribution Channel, 2022-2032 (US$ billion, AGR %)
Figure 66 Europe HIV and HBV Therapies Market Share Forecast by Distribution Channel, 2022 & 2032 (%)
Figure 67 Germany HIV and HBV Therapies Market Forecast, 2022-2032 (US$ billion, AGR %)
Figure 68 Germany HIV and HBV Therapies Market Forecast by Drug Class, 2022-2032 (US$ billion, AGR %)
Figure 69 Germany HIV and HBV Therapies Market Share Forecast by Drug Class, 2022 & 2032 (%)
Figure 70 Germany HIV and HBV Therapies Market Forecast by Distribution Channel, 2022-2032 (US$ billion, AGR %)
Figure 71 Germany HIV and HBV Therapies Market Share Forecast by Distribution Channel, 2022 & 2032 (%)
Figure 72 UK HIV and HBV Therapies Market Forecast, 2022-2032 (US$ billion, AGR %)
Figure 73 U.K. HIV and HBV Therapies Market Forecast by Drug Class, 2022-2032 (US$ billion, AGR %)
Figure 74 U.K. HIV and HBV Therapies Market Share Forecast by Drug Class, 2022 & 2032 (%)
Figure 75 U.K. HIV and HBV Therapies Market Forecast by Distribution Channel, 2022-2032 (US$ billion, AGR %)
Figure 76 U.K. HIV and HBV Therapies Market Share Forecast by Distribution Channel, 2022 & 2032 (%)
Figure 77 France HIV and HBV Therapies Market Forecast, 2022-2032 (US$ billion, AGR %)
Figure 78 France HIV and HBV Therapies Market Forecast by Drug Class, 2022-2032 (US$ billion, AGR %)
Figure 79 France HIV and HBV Therapies Market Share Forecast by Drug Class, 2022 & 2032 (%)
Figure 80 France HIV and HBV Therapies Market Forecast by Distribution Channel, 2022-2032 (US$ billion, AGR %)
Figure 81 France HIV and HBV Therapies Market Share Forecast by Distribution Channel, 2022 & 2032 (%)
Figure 82 Italy HIV and HBV Therapies Market Forecast, 2022-2032 (US$ billion, AGR %)
Figure 83 Italy HIV and HBV Therapies Market Forecast by Drug Class, 2022-2032 (US$ billion, AGR %)
Figure 84 Italy HIV and HBV Therapies Market Share Forecast by Drug Class, 2022 & 2032 (%)
Figure 85 Italy HIV and HBV Therapies Market Forecast by Distribution Channel, 2022-2032 (US$ billion, AGR %)
Figure 86 Italy HIV and HBV Therapies Market Share Forecast by Distribution Channel, 2022 & 2032 (%)
Figure 87 Spain HIV and HBV Therapies Market Forecast, 2022-2032 (US$ billion, AGR %)
Figure 88 Spain HIV and HBV Therapies Market Forecast by Drug Class, 2022-2032 (US$ billion, AGR %)
Figure 89 Spain HIV and HBV Therapies Market Share Forecast by Drug Class, 2022 & 2032 (%)
Figure 90 Spain HIV and HBV Therapies Market Forecast by Distribution Channel, 2022-2032 (US$ billion, AGR %)
Figure 91 Spain HIV and HBV Therapies Market Share Forecast by Distribution Channel, 2022 & 2032 (%)
Figure 92 Russia HIV and HBV Therapies Market Forecast, 2022-2032 (US$ billion, AGR %)
Figure 93 Russia HIV and HBV Therapies Market Forecast by Drug Class, 2022-2032 (US$ billion, AGR %)
Figure 94 Russia HIV and HBV Therapies Market Share Forecast by Drug Class, 2022 & 2032 (%)
Figure 95 Russia HIV and HBV Therapies Market Forecast by Distribution Channel, 2022-2032 (US$ billion, AGR %)
Figure 96 Russia HIV and HBV Therapies Market Share Forecast by Distribution Channel, 2022 & 2032 (%)
Figure 97 Rest of Europe HIV and HBV Therapies Market Forecast, 2022-2032 (US$ billion, AGR %)
Figure 98 Rest of Europe HIV and HBV Therapies Market Forecast by Drug Class, 2022-2032 (US$ billion, AGR %)
Figure 99 Rest of Europe HIV and HBV Therapies Market Share Forecast by Drug Class, 2022 & 2032 (%)
Figure 100 Rest of Europe HIV and HBV Therapies Market Forecast by Distribution Channel, 2022-2032 (US$ billion, AGR %)
Figure 101 Rest of Europe HIV and HBV Therapies Market Share Forecast by Distribution Channel, 2022 & 2032 (%)
Figure 102 Asia Pacific HIV and HBV Therapies Market Attractiveness Index
Figure 103 Asia Pacific HIV and HBV Therapies Market by Region, 2022, 2027 & 2032 (US$ billion)
Figure 104 Asia Pacific HIV and HBV Therapies Market Forecast by Country, 2022-2032 (US$ billion, AGR %)
Figure 105 Asia Pacific HIV and HBV Therapies Market Share Forecast by Country, 2022 & 2032 (%)
Figure 106 Asia Pacific HIV and HBV Therapies Market Forecast by Drug Class, 2022-2032 (US$ billion, AGR %)
Figure 107 Asia Pacific HIV and HBV Therapies Market Share Forecast by Drug Class, 2022 & 2032 (%)
Figure 108 Asia Pacific HIV and HBV Therapies Market Forecast by Distribution Channel, 2022-2032 (US$ billion, AGR %)
Figure 109 Asia Pacific HIV and HBV Therapies Market Share Forecast by Distribution Channel, 2022 & 2032 (%)
Figure 110 Japan HIV and HBV Therapies Market Forecast, 2022-2032 (US$ billion, AGR %)
Figure 111 Japan HIV and HBV Therapies Market Forecast by Drug Class, 2022-2032 (US$ billion, AGR %)
Figure 112 Japan HIV and HBV Therapies Market Share Forecast by Drug Class, 2022 & 2032 (%)
Figure 113 Japan HIV and HBV Therapies Market Forecast by Distribution Channel, 2022-2032 (US$ billion, AGR %)
Figure 114 Japan HIV and HBV Therapies Market Share Forecast by Distribution Channel, 2022 & 2032 (%)
Figure 115 China HIV and HBV Therapies Market Forecast, 2022-2032 (US$ billion, AGR %)
Figure 116 China HIV and HBV Therapies Market Forecast by Drug Class, 2022-2032 (US$ billion, AGR %)
Figure 117 China HIV and HBV Therapies Market Share Forecast by Drug Class, 2022 & 2032 (%)
Figure 118 China HIV and HBV Therapies Market Forecast by Distribution Channel, 2022-2032 (US$ billion, AGR %)
Figure 119 China HIV and HBV Therapies Market Share Forecast by Distribution Channel, 2022 & 2032 (%)
Figure 120 India HIV and HBV Therapies Market Forecast, 2022-2032 (US$ billion, AGR %)
Figure 121 India HIV and HBV Therapies Market Forecast by Drug Class, 2022-2032 (US$ billion, AGR %)
Figure 122 India HIV and HBV Therapies Market Share Forecast by Drug Class, 2022 & 2032 (%)
Figure 123 India HIV and HBV Therapies Market Forecast by Distribution Channel, 2022-2032 (US$ billion, AGR %)
Figure 124 India HIV and HBV Therapies Market Share Forecast by Distribution Channel, 2022 & 2032 (%)
Figure 125 South Korea HIV and HBV Therapies Market Forecast, 2022-2032 (US$ billion, AGR %)
Figure 126 South Korea HIV and HBV Therapies Market Forecast by Drug Class, 2022-2032 (US$ billion, AGR %)
Figure 127 South Korea HIV and HBV Therapies Market Share Forecast by Drug Class, 2022 & 2032 (%)
Figure 128 South Korea HIV and HBV Therapies Market Forecast by Distribution Channel, 2022-2032 (US$ billion, AGR %)
Figure 129 South Korea HIV and HBV Therapies Market Share Forecast by Distribution Channel, 2022 & 2032 (%)
Figure 130 Australia HIV and HBV Therapies Market Forecast, 2022-2032 (US$ billion, AGR %)
Figure 131 Australia HIV and HBV Therapies Market Forecast by Drug Class, 2022-2032 (US$ billion, AGR %)
Figure 132 Australia HIV and HBV Therapies Market Share Forecast by Drug Class, 2022 & 2032 (%)
Figure 133 Australia HIV and HBV Therapies Market Forecast by Distribution Channel, 2022-2032 (US$ billion, AGR %)
Figure 134 Australia HIV and HBV Therapies Market Share Forecast by Distribution Channel, 2022 & 2032 (%)
Figure 135 Rest of Asia Pacific HIV and HBV Therapies Market Forecast, 2022-2032 (US$ billion, AGR %)
Figure 136 Rest of APAC HIV and HBV Therapies Market Forecast by Drug Class, 2022-2032 (US$ billion, AGR %)
Figure 137 Rest of APAC HIV and HBV Therapies Market Share Forecast by Drug Class, 2022 & 2032 (%)
Figure 138 Rest of APAC HIV and HBV Therapies Market Forecast by Distribution Channel, 2022-2032 (US$ billion, AGR %)
Figure 139 Rest of APAC HIV and HBV Therapies Market Share Forecast by Distribution Channel, 2022 & 2032 (%)
Figure 140 Latin America HIV and HBV Therapies Market Attractiveness Index
Figure 141 Latin America HIV and HBV Therapies Market by Region, 2022, 2027 & 2032 (US$ billion)
Figure 142 Latin America HIV and HBV Therapies Market Forecast by Country, 2022-2032 (US$ billion, AGR %)
Figure 143 Latin America HIV and HBV Therapies Market Share Forecast by Country, 2022 & 2032 (%)
Figure 144 Latin America HIV and HBV Therapies Market Forecast by Drug Class, 2022-2032 (US$ billion, AGR %)
Figure 145 Latin America HIV and HBV Therapies Market Share Forecast by Drug Class, 2022 & 2032 (%)
Figure 146 Latin America HIV and HBV Therapies Market Forecast by Distribution Channel, 2022-2032 (US$ billion, AGR %)
Figure 147 Latin America HIV and HBV Therapies Market Share Forecast by Distribution Channel, 2022 & 2032 (%)
Figure 148 Brazil HIV and HBV Therapies Market Forecast, 2022-2032 (US$ billion, AGR %)
Figure 149 Brazil HIV and HBV Therapies Market Forecast by Drug Class, 2022-2032 (US$ billion, AGR %)
Figure 150 Brazil HIV and HBV Therapies Market Share Forecast by Drug Class, 2022 & 2032 (%)
Figure 151 Brazil HIV and HBV Therapies Market Forecast by Distribution Channel, 2022-2032 (US$ billion, AGR %)
Figure 152 Brazil HIV and HBV Therapies Market Share Forecast by Distribution Channel, 2022 & 2032 (%)
Figure 153 Mexico HIV and HBV Therapies Market Forecast, 2022-2032 (US$ billion, AGR %)
Figure 154 Mexico HIV and HBV Therapies Market Forecast by Drug Class, 2022-2032 (US$ billion, AGR %)
Figure 155 Mexico HIV and HBV Therapies Market Share Forecast by Drug Class, 2022 & 2032 (%)
Figure 156 Mexico HIV and HBV Therapies Market Forecast by Distribution Channel, 2022-2032 (US$ billion, AGR %)
Figure 157 Mexico HIV and HBV Therapies Market Share Forecast by Distribution Channel, 2022 & 2032 (%)
Figure 158 Rest of LATAM HIV and HBV Therapies Market Forecast, 2022-2032 (US$ billion, AGR %)
Figure 159 Rest of LATAM HIV and HBV Therapies Market Forecast by Drug Class, 2022-2032 (US$ billion, AGR %)
Figure 160 Rest of LATAM HIV and HBV Therapies Market Share Forecast by Drug Class, 2022 & 2032 (%)
Figure 161 Rest of LATAM HIV and HBV Therapies Market Forecast by Distribution Channel, 2022-2032 (US$ billion, AGR %)
Figure 162 Rest of LATAM HIV and HBV Therapies Market Share Forecast by Distribution Channel, 2022 & 2032 (%)
Figure 163 MEA HIV and HBV Therapies Market Attractiveness Index
Figure 164 MEA HIV and HBV Therapies Market by Region, 2022, 2027 & 2032 (US$ billion)
Figure 165 MEA HIV and HBV Therapies Market Forecast by Country, 2022-2032 (US$ billion, AGR %)
Figure 166 MEA HIV and HBV Therapies Market Share Forecast by Country, 2022 & 2032 (%)
Figure 167 MEA HIV and HBV Therapies Market Forecast by Drug Class, 2022-2032 (US$ billion, AGR %)
Figure 168 MEA HIV and HBV Therapies Market Share Forecast by Drug Class, 2022 & 2032 (%)
Figure 169 MEA HIV and HBV Therapies Market Forecast by Distribution Channel, 2022-2032 (US$ billion, AGR %)
Figure 170 MEA HIV and HBV Therapies Market Share Forecast by Distribution Channel, 2022 & 2032 (%)
Figure 171 South Africa HIV and HBV Therapies Market Forecast, 2022-2032 (US$ billion, AGR %)
Figure 172 South Africa HIV and HBV Therapies Market Forecast by Drug Class, 2022-2032 (US$ billion, AGR %)
Figure 173 South Africa HIV and HBV Therapies Market Share Forecast by Drug Class, 2022 & 2032 (%)
Figure 174 South Africa HIV and HBV Therapies Market Forecast by Distribution Channel, 2022-2032 (US$ billion, AGR %)
Figure 175 South Africa HIV and HBV Therapies Market Share Forecast by Distribution Channel, 2022 & 2032 (%)
Figure 176 GCC HIV and HBV Therapies Market Forecast, 2022-2032 (US$ billion, AGR %)
Figure 177 GCC HIV and HBV Therapies Market Forecast by Drug Class, 2022-2032 (US$ billion, AGR %)
Figure 178 GCC HIV and HBV Therapies Market Share Forecast by Drug Class, 2022 & 2032 (%)
Figure 179 GCC HIV and HBV Therapies Market Forecast by Distribution Channel, 2022-2032 (US$ billion, AGR %)
Figure 180 GCC HIV and HBV Therapies Market Share Forecast by Distribution Channel, 2022 & 2032 (%)
Figure 181 Rest of MEA HIV and HBV Therapies Market Forecast, 2022-2032 (US$ billion, AGR %)
Figure 182 Rest of MEA HIV and HBV Therapies Market Forecast by Drug Class, 2022-2032 (US$ billion, AGR %)
Figure 183 Rest of MEA HIV and HBV Therapies Market Share Forecast by Drug Class, 2022 & 2032 (%)
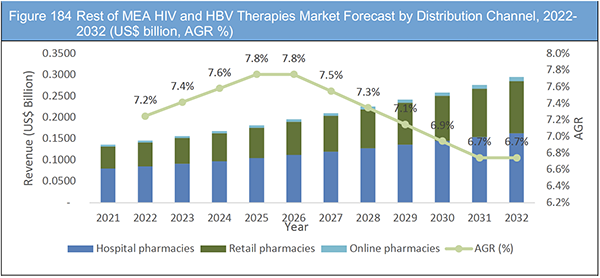
Figure 184 Rest of MEA HIV and HBV Therapies Market Forecast by Distribution Channel, 2022-2032 (US$ billion, AGR %)
Figure 185 Rest of MEA HIV and HBV Therapies Market Share Forecast by Distribution Channel, 2022 & 2032 (%)
Figure 186 Global HIV and HBV Therapies Market: Company Share Analysis, 2021
Figure 187 Pfizer: Net Revenue, 2019-2021 (US$ million, AGR %)
Figure 188 Pfizer: Regional Market Shares, 2021
Figure 189 Pfizer: Gross Profit, 2019-2021 (US$ million, AGR %)
Figure 190 Pfizer: R&D, 2019-2021 (US$ million, AGR %)
Figure 191 Merck: Net Revenue, 2019-2021 (US$ million, AGR %)
Figure 192 Merck: Regional Market Shares, 2021
Figure 193 Merck: Income from Continuing Operations before Taxes, 2019-2021 (US$ million, AGR %)
Figure 194 Merck: R&D, 2019-2021 (US$ million, AGR %)
Figure 195 GSK: Net Revenue, 2019-2021 (US$ million, AGR %)
Figure 196 GSK: Regional Market Shares, 2021
Figure 197 GSK: Gross Profit, 2019-2021 (US$ million, AGR %)
Figure 198 GSK: R&D, 2019-2021 (US$ million, AGR %)
Figure 199 AbbVie: Net Revenue, 2019-2021 (US$ million, AGR %)
Figure 200 AbbVie: Regional Market Shares, 2021
Figure 201 AbbVie: Operating Earnings, 2019-2021 (US$ million, AGR %)
Figure 202 AbbVie: R&D, 2019-2021 (US$ million, AGR %)
Figure 203 Boehringer Ingelheim: Net Revenue, 2019-2021 (US$ million, AGR %)
Figure 204 Boehringer Ingelheim: Regional Market Shares, 2021
Figure 205 Boehringer Ingelheim: Operating Income, 2019-2021 (US$ million, AGR %)
Figure 206 Boehringer Ingelheim: R&D, 2019-2021 (US$ million, AGR %)
Figure 207 Gilead Sciences: Net Revenue, 2019-2021 (US$ million, AGR %)
Figure 208 Gilead Sciences: Regional Market Shares, 2021
Figure 209 Gilead Sciences: Operating Profit, 2019-2021 (US$ million, AGR %)
Figure 210 Gilead Sciences: R&D, 2019-2021 (US$ million, AGR %)
Figure 211 Janssen Pharma: Net Revenue, 2019-2021 (US$ million, AGR %)
Figure 212 Janssen Pharma: Regional Market Shares, 2021
Figure 213 Janssen Pharma: Gross Profit, 2019-2021 (US$ million, AGR %)
Figure 214 Janssen Pharma: R&D, 2019-2021 (US$ million, AGR %)
Figure 215 Teva: Net Revenue, 2019-2021 (US$ million, AGR %)
Figure 216 Teva: Regional Market Shares, 2021
Figure 217 Teva: Gross Profit, 2019-2021 (US$ million, AGR %)
Figure 218 Teva: R&D, 2019-2021 (US$ million, AGR %)
Figure 219 BMS: Net Revenue, 2019-2021 (US$ million, AGR %)
Figure 220 BMS: Regional Market Shares, 2021
Figure 221 BMS: Net Earnings, 2019-2021 (US$ million, AGR %)
Figure 222 BMS: R&D, 2019-2021 (US$ million, AGR %)
Figure 223 Arbutus Biopharma: Net Revenue, 2019-2021 (US$ million, AGR %)
Figure 224 Arbutus Biopharma: Comprehensive Loss, 2019-2021 (US$ million, AGR %)
Figure 225 Arbutus Biopharma: R&D, 2019-2021 (US$ million, AGR %)
ページTOPに戻る
Summary
Report Details
The HIV and HBV Therapies Market Report 2022-2032: This report will prove valuable to leading firms striving for new revenue pockets if they wish to better understand the industry and its underlying dynamics. It will be useful for companies that would like to expand into different industries or to expand their existing operations in a new region.
Factors Such as Rising Prevalence of HIV and HBV, High Investment in R&D, and Growing Government Support Are Driving the Market Growth
Some of the major forces propelling the global HIV and HBV therapies market include rising prevalence of HIV and HBV, high investment in R&D, and growing government support. Robust government support for HIV and HBV therapies research is one of the major factors that propel the market growth. There is a need for significant collaborations among the pharmaceutical industry, foundations, patient advocacy organizations, academic and public researchers and financing programs, regulatory researchers and reimbursement organizations to identify and develop solutions for the unmet diagnostic and therapy requirements. Increasing prevalence of HIV and Hepatitis has urged a need for new treatment options. Hence, government organizations are taking efforts to address the unmet needs and provide advanced care. Major challenge for most of the HIV and HBV therapies in R&D is the large number of investments and research required and the amount of vast clinical aspects of these organisms and diseases. The challenge becomes severed due to the changing nature of antivirals and hence the need for long-term follow-up is crucial. This aspect is predicted to hinder the market over the forecast period.
Regulation Challenges
FDA drug approvals usually involve long and tedious processes before the product is finally commercialized. This usually proves to be a challenge for companies that are involved in intense R&D bringing new products into the market. Safety and usage of the product are completely verified by authorities before commercializing it to the general masses. This requires large amount of investments.
What Questions Should You Ask before Buying a Market Research Report?
• How is the HIV and HBV Therapies market evolving?
• What is driving and restraining the HIV and HBV Therapies market?
• How will each HIV and HBV Therapies submarket segment grow over the forecast period and how much revenue will these submarkets account for in 2032?
• How will the market shares for each HIV and HBV Therapies submarket develop from 2022 to 2032?
• What will be the main driver for the overall market from 2022 to 2032?
• Will leading HIV and HBV Therapies markets broadly follow the macroeconomic dynamics, or will individual national markets outperform others?
• How will the market shares of the national markets change by 2032 and which geographical region will lead the market in 2032?
• Who are the leading players and what are their prospects over the forecast period?
• What are the HIV and HBV Therapies projects for these leading companies?
• How will the industry evolve during the period between 2020 and 2032? What are the implications of HIV and HBV Therapies projects taking place now and over the next 10 years?
• Is there a greater need for product commercialisation to further scale the HIV and HBV Therapies market?
• Where is the HIV and HBV Therapies market heading and how can you ensure you are at the forefront of the market?
• What are the best investment options for new product lines?
• What are the key prospects for moving companies into a new growth path and C-suite?
You need to discover how this will impact the HIV and HBV Therapies market today, and over the next 10 years:
• Our 353-page report provides 137 tables, 225 charts, and graphs exclusively to you.
• The report highlights key lucrative areas in the industry so you can target them – NOW.
• It contains in-depth analysis of global, regional and national sales and growth.
• It highlights for you the key successful trends, changes and revenue projections made by your competitors.
This report tells you TODAY how the HIV and HBV Therapies market will develop in the next 10 years, and in line with the variations in COVID-19 economic recession and bounce. This market is more critical now than at any point over the last 10 years.
Forecasts to 2032 and other analyses reveal commercial prospects
• In addition to revenue forecasting to 2032, our new study provides you with recent results, growth rates, and market shares.
• You will find original analyses, with business outlooks and developments.
• Discover qualitative analyses (including market dynamics, drivers, opportunities, restraints and challenges), cost structure, impact of rising HIV and HBV Therapies prices and recent developments.
This report includes data analysis and invaluable insight into how COVID-19 will affect the industry and your company. Four COVID-19 recovery patterns and their impact, namely, “V”, “L”, “W” and “U” are discussed in this report.
Segments Covered in the Report
Drug Class Outlook
• Combination Therapies
• Nucleoside and Non-nucleoside RTIs
• Integrase Inhibitors
• Protease Inhibitors
• Others
Distribution Channel
• Hospital pharmacies
• Retail pharmacies
• Online pharmacies
In addition to the revenue predictions for the overall world market and segments, you will also find revenue forecasts for four regional and 20+ leading national markets:
North America
• U.S.
• Canada
Europe
• Germany
• Spain
• United Kingdom
• France
• Italy
• Russia
• Rest of Europe
Asia Pacific
• China
• Japan
• India
• Australia
• South Korea
• Rest of Asia Pacific
LATAM
• Brazil
• Mexico
• Rest of Latin America
MEA
• South Africa
• GCC
• Rest of MEA
The report also includes profiles for some of the leading companies in the HIV and HBV Therapies Market, 2022 to 2032, with a focus on this segment of these companies’ operations.
Leading companies and the potential for market growth
• Pfizer
• Merck
• GSK
• AbbVie
• Boehringer Ingelheim
• Gilead Sciences
• Janssen Pharmaceutical
• Teva
• BMS
• Arbustus Biopharma
Overall world revenue for HIV and HBV Therapies Market, 2022 to 2032 in terms of value the market will surpass US$36.2 billion in 2022, our work calculates. We predict strong revenue growth through to 2032. Our work identifies which organizations hold the greatest potential. Discover their capabilities, progress, and commercial prospects, helping you stay ahead.
How will the HIV and HBV Therapies Market, 2022 to 2032 report help you?
In summary, our 350+ page report provides you with the following knowledge:
• Revenue forecasts to 2032 for HIV and HBV Therapies Market, 2022 to 2032 Market, with forecasts for drug class, distribution channel, and company size, each forecast at a global and regional level – discover the industry’s prospects, finding the most lucrative places for investments and revenues.
• Revenue forecasts to 2032 for four regional and 20 key national markets – See forecasts for the HIV and HBV Therapies Market, 2022 to 2032 market in North America, Europe, Asia-Pacific and LAMEA. Also forecasted is the market in the US, Canada, Mexico, Brazil, Germany, France, UK, Italy, Spain, Russia, China, India, Japan, and Australia among other prominent economies.
• Prospects for established firms and those seeking to enter the market – including company profiles for 10 of the major companies involved in the HIV and HBV Therapies Market, 2022 to 2032.
Find quantitative and qualitative analyses with independent predictions. Receive information that only our report contains, staying informed with invaluable business intelligence.
Information found nowhere else
With our new report, you are less likely to fall behind in knowledge or miss out on opportunities. See how our work could benefit your research, analyses, and decisions. Visiongain’s study is for everybody needing commercial analyses for the HIV and HBV Therapies Market, 2022 to 2032, market-leading companies. You will find data, trends and predictions.
ページTOPに戻る
Table of Contents
Table of Contents
1. Report Overview
1.1 Objectives of the Study
1.2 Introduction to HIV and HBV Therapies Market
1.3 What This Report Delivers
1.4 Why You Should Read This Report
1.5 Key Questions Answered By This Analytical Report Include:
1.6 Who is This Report For?
1.7 Methodology
1.7.1 Market Definitions
1.7.2 Market Evaluation & Forecasting Methodology
1.8 Frequently Asked Questions (FAQs)
1.9 Associated Visiongain Reports
1.10 About Visiongain
2 Executive Summary
2.1 Geographical Snapshot: Global HIV and HBV Therapies Market
2.2 Drug Class Segment: Market Attractiveness Index
2.3 Distribution Channel Segment: Market Attractiveness Index
3 Market Overview
3.1 Key Findings
3.2 Market Dynamics
3.2.1 Market Driving Factors
3.2.2 Market Restraining Factors
3.2.3 Market Opportunities
3.3 COVID-19 Impact Analysis
3.4 Porter’s Five Forces Analysis
3.4.1 Supplier Power
3.4.2 Buyer Power
3.4.3 Competitive Rivalry
3.4.4 Threat from Substitutes
3.4.5 Threat of New Entrants
4 Global HIV and HBV Therapies Market Analysis by Drug Class
4.1 Key Findings
4.2 Drug Class Segment Growth Prospects
4.3 Global HIV and HBV Therapies Market Size Estimation and Forecast by Drug Class
4.4 Combination Therapies
4.4.1 Combination Therapies Market Forecast by Region, 2022-2032 (US$ Bn)
4.4.2 Combination Therapies Market Share by Region, 2022-2032 (%)
4.5 Nucleoside and Non-nucleoside RTIs
4.5.1 Nucleoside and Non-nucleoside RTIs Market Forecast by Region, 2022-2032 (US$ Bn)
4.5.2 Nucleoside and Non-nucleoside RTIs Market Share by Region, 2022-2032 (%)
4.6 Integrase Inhibitors
4.6.1 Integrase inhibitors Market Forecast by Region, 2022-2032 (US$ Bn)
4.6.2 Integrase inhibitors Market Share by Region, 2022-2032 (%)
4.7 Protease Inhibitors
4.7.1 Protease Inhibitors Market Forecast by Region, 2022-2032 (US$ Bn)
4.7.2 Protease Inhibitors Market Share by Region, 2022-2032 (%)
4.8 Other Drug class
4.8.1 Other Drug Class Market Forecast by Region, 2022-2032 (US$ Bn)
4.8.2 Other Drug Class Market Share by Region, 2022-2032 (%)
5 Global HIV and HBV Therapies Market Analysis by Distribution Channel
5.1 Key Findings
5.2 Distribution Channel Segment Growth Prospects
5.3 Global HIV and HBV Therapies Market Size Estimation and Forecast by Distribution Channel
5.4 Global HIV and HBV Therapies Market Share by Distribution Channel, 2022 & 2032
5.5 Hospital Pharmacies
5.5.1 Hospital pharmacies Market Forecast by Region, 2022-2032 (US$ Bn)
5.5.2 Hospital pharmacies Market Share by Region, 2022-2032 (%)
5.6 Retail Pharmacies
5.6.1 Retail pharmacies Market Forecast by Region, 2022-2032 (US$ Bn)
5.6.2 Retail pharmacies Market Share by Region, 2022-2032 (%)
5.7 Online Pharmacies
5.7.1 Online Pharmacies Market Forecast by Region, 2022-2032 (US$ Bn)
5.7.2 Online Pharmacies Market Share by Region, 2022-2032 (%)
6 Global HIV and HBV Therapies Market Pipeline Analysis
6.1 Key Findings
6.2 HIV Pipeline
6.3 HBV Pipeline
7 Global HIV and HBV Therapies Market Analysis by Region
7.1 Key Findings
7.2 Regional Market Size Estimation and Forecast
7.3 COVID-19 Impact Analysis: Recovery Scenarios (V, U, W, L)
8 North America HIV and HBV Therapies Market Analysis
8.1 Key Findings
8.2 North America HIV and HBV Therapies Market Attractiveness Index
8.3 North America HIV and HBV Therapies Market by Country, 2022, 2027 & 2032 (US$ bn)
8.4 North America HIV and HBV Therapies Market Size Estimation and Forecast by Country
8.5 North America HIV and HBV Therapies Market Size Estimation and Forecast by Drug Class
8.6 North America HIV and HBV Therapies Market Size Estimation and Forecast by Distribution Channel
8.7 U.S.
8.7.1 U.S. HIV and HBV Therapies Market by Drug Class
8.7.2 U.S. HIV and HBV Therapies Market by Distribution Channel
8.8 Canada
8.8.1 Canada HIV and HBV Therapies Market by Drug Class
8.8.2 Canada HIV and HBV Therapies Market by Distribution Channel
9 Europe HIV and HBV Therapies Market Analysis
9.1 Key Findings
9.2 Europe HIV and HBV Therapies Market Attractiveness Index
9.3 Europe HIV and HBV Therapies Market by Country, 2022, 2027 & 2032 (US$ bn)
9.4 Europe HIV and HBV Therapies Market Size Estimation and Forecast by Country
9.5 Europe HIV and HBV Therapies Market Size Estimation and Forecast by Drug Class
9.6 Europe HIV and HBV Therapies Market Size Estimation and Forecast by Distribution Channel
9.7 Germany
9.7.1 Germany HIV and HBV Therapies Market by Drug Class
9.7.2 Germany HIV and HBV Therapies Market by Distribution Channel
9.8 U.K.
9.8.1 U.K. HIV and HBV Therapies Market by Drug Class
9.8.2 U.K. HIV and HBV Therapies Market by Distribution Channel
9.9 France
9.9.1 France HIV and HBV Therapies Market by Drug Class
9.9.2 France HIV and HBV Therapies Market by Distribution Channel
9.10 Italy
9.10.1 Italy HIV and HBV Therapies Market by Drug Class
9.10.2 Italy HIV and HBV Therapies Market by Distribution Channel
9.11 Spain
9.11.1 Spain HIV and HBV Therapies Market by Drug Class
9.11.2 Spain HIV and HBV Therapies Market by Distribution Channel
9.12 Russia
9.12.1 Russia HIV and HBV Therapies Market by Drug Class
9.12.2 Russia HIV and HBV Therapies Market by Distribution Channel
9.13 Rest of Europe
9.13.1 Rest of Europe HIV and HBV Therapies Market by Drug Class
9.13.2 Rest of Europe HIV and HBV Therapies Market by Distribution Channel
10 Asia Pacific HIV and HBV Therapies Market Analysis
10.1 Key Findings
10.2 Asia Pacific HIV and HBV Therapies Market Attractiveness Index
10.3 Asia Pacific HIV and HBV Therapies Market by Country, 2022, 2027 & 2032 (US$ bn)
10.4 Asia Pacific HIV and HBV Therapies Market Size Estimation and Forecast by Country
10.5 Asia Pacific HIV and HBV Therapies Market Size Estimation and Forecast by Drug Class
10.6 Asia Pacific HIV and HBV Therapies Market Size Estimation and Forecast by Distribution Channel
10.7 Japan
10.7.1 Japan HIV and HBV Therapies Market by Drug Class
10.7.2 Japan HIV and HBV Therapies Market by Distribution Channel
10.8 China
10.8.1 China HIV and HBV Therapies Market by Drug Class
10.8.2 China HIV and HBV Therapies Market by Distribution Channel
10.9 India
10.9.1 India HIV and HBV Therapies Market by Drug Class
10.9.2 India HIV and HBV Therapies Market by Distribution Channel
10.10 South Korea
10.10.1 South Korea HIV and HBV Therapies Market by Drug Class
10.10.2 South Korea HIV and HBV Therapies Market by Distribution Channel
10.11 Australia
10.11.1 Australia HIV and HBV Therapies Market by Drug Class
10.11.2 Australia HIV and HBV Therapies Market by Distribution Channel
10.12 Rest of APAC
10.12.1 Rest of APAC HIV and HBV Therapies Market by Drug Class
10.12.2 Rest of APAC HIV and HBV Therapies Market by Distribution Channel
11 Latin America HIV and HBV Therapies Market Analysis
11.1 Key Findings
11.2 Latin America HIV and HBV Therapies Market Attractiveness Index
11.3 Latin America HIV and HBV Therapies Market by Country, 2022, 2027 & 2032 (US$ bn)
11.4 Latin America HIV and HBV Therapies Market Size Estimation and Forecast by Country
11.5 Latin America HIV and HBV Therapies Market Size Estimation and Forecast by Drug Class
11.6 Latin America HIV and HBV Therapies Market Size Estimation and Forecast by Distribution Channel
11.7 Brazil
11.7.1 Brazil HIV and HBV Therapies Market by Drug Class
11.7.2 Brazil HIV and HBV Therapies Market by Distribution Channel
11.8 Mexico
11.8.1 Mexico HIV and HBV Therapies Market by Drug Class
11.8.2 Mexico HIV and HBV Therapies Market by Distribution Channel
11.9 Rest of Latin America
11.9.1 Rest of LATAM HIV and HBV Therapies Market by Drug Class
11.9.2 Rest of LATAM HIV and HBV Therapies Market by Distribution Channel
12 MEA HIV and HBV Therapies Market Analysis
12.1 Key Findings
12.2 MEA HIV and HBV Therapies Market Attractiveness Index
12.3 MEA HIV and HBV Therapies Market by Country, 2022, 2027 & 2032 (US$ bn)
12.4 MEA HIV and HBV Therapies Market Size Estimation and Forecast by Country
12.5 MEA HIV and HBV Therapies Market Size Estimation and Forecast by Drug Class
12.6 MEA HIV and HBV Therapies Market Size Estimation and Forecast by Distribution Channel
12.7 South Africa
12.7.1 South Africa HIV and HBV Therapies Market by Drug Class
12.7.2 South Africa HIV and HBV Therapies Market by Distribution Channel
12.8 GCC
12.8.1 GCC HIV and HBV Therapies Market by Drug Class
12.8.2 GCC HIV and HBV Therapies Market by Distribution Channel
12.9 Rest of MEA
12.9.1 Rest of MEA HIV and HBV Therapies Market by Drug Class
12.9.2 Rest of MEA HIV and HBV Therapies Market by Distribution Channel
13 Competitive Landscape
13.1 Company Share Analysis
13.2 Key Business Strategy Analysis
14 Company Profiles
14.1 Pfizer
14.1.1 Company Snapshot
14.1.2 Company Overview
14.1.3 Financial Analysis
14.1.4 Product Benchmarking
14.1.5 Strategic Outlook
14.2 Merck
14.2.1 Company Snapshot
14.2.2 Company Overview
14.2.3 Financial Analysis
14.2.4 Product Benchmarking
14.2.5 Strategic Outlook
14.3 GSK
14.3.1 Company Snapshot
14.3.2 Company Overview
14.3.3 Financial Analysis
14.3.4 Product Benchmarking
14.3.5 Strategic Outlook
14.4 AbbVie
14.4.1 Company Snapshot
14.4.2 Company Overview
14.4.3 Financial Analysis
14.4.4 Product Benchmarking
14.4.5 Strategic Outlook
14.5 Boehringer Ingelheim
14.5.1 Company Snapshot
14.5.2 Company Overview
14.5.3 Financial Analysis
14.5.4 Product Benchmarking
14.5.5 Strategic Outlook
14.6 Gilead Sciences
14.6.1 Company Snapshot
14.6.2 Company Overview
14.6.3 Financial Analysis
14.6.4 Product Benchmarking
14.6.5 Strategic Outlook
14.7 Janssen Pharma
14.7.1 Company Snapshot
14.7.2 Company Overview
14.7.3 Financial Analysis
14.7.4 Product Benchmarking
14.7.5 Strategic Outlook
14.8 Teva
14.8.1 Company Snapshot
14.8.2 Company Overview
14.8.3 Financial Analysis
14.8.4 Product Benchmarking
14.8.5 Strategic Outlook
14.9 BMS
14.9.1 Company Snapshot
14.9.2 Company Overview
14.9.3 Financial Analysis
14.9.4 Product Benchmarking
14.9.5 Strategic Outlook
14.10 Arbutus Biopharma
14.10.1 Company Snapshot
14.10.2 Company Overview
14.10.3 Financial Analysis
14.10.4 Product Benchmarking
14.10.5 Strategic Outlook
15 Conclusion and Recommendations
15.1 Concluding Remarks from Visiongain
15.2 Recommendations for Market Players
List of Tables
Table 1 Global HIV and HBV Therapies Market Snapshot, 2022 & 2032 (US$ billion, CAGR %)
Table 2 HIV and HBV Therapies Market, By Region, 2022-2032 (US$ Bn, AGR %, CAGR %) (V-shaped Recovery)
Table 3 HIV and HBV Therapies Market, By Region, 2022-2032 (US$ Bn, AGR %, CAGR %) (U-shaped Recovery)
Table 4 HIV and HBV Therapies Market, By Region, 2022-2032 (US$ Bn, AGR %, CAGR %) (W-shaped Recovery)
Table 5 HIV and HBV Therapies Market, By Region, 2022-2032 (US$ Bn, AGR %, CAGR %) (L-shaped Recovery)
Table 6 HIV and HBV Therapies Drug Class Market, 2022-2032 (US$ Bn, AGR (%), CAGR (%))
Table 7 Approved Combination Therapies
Table 8 Combination Therapies Market, by Region, 2022-2032 (US$ Bn, AGR (%), CAGR (%))
Table 9 Approved NRTIs
Table 10 Approved NNRTIs
Table 11 Nucleoside and Non-nucleoside RTIs Market, by Region, 2022-2032 (US$ Bn, AGR (%), CAGR (%))
Table 12 Approved Integrase Inhibitors
Table 13 Integrase Inhibitors Market, by Region, 2022-2032 (US$ Bn, AGR (%), CAGR (%))
Table 14 Approved Protease Inhibitors
Table 15 Protease Inhibitors Market, by Region, 2022-2032 (US$ Bn, AGR (%), CAGR (%))
Table 16 Approved other therapies
Table 17 Other Drug Class Market, by Region, 2022-2032 (US$ Bn, AGR (%), CAGR (%))
Table 18 HIV and HBV Therapies Distribution Channel Market, 2022-2032 (US$ Bn, AGR (%), CAGR (%))
Table 19 Hospital pharmacies Market, by Region, 2022-2032 (US$ Bn, AGR (%), CAGR (%))
Table 20 Retail pharmacies Market, by Region, 2022-2032 (US$ Bn, AGR (%), CAGR (%))
Table 21 Online pharmacies Market, by Region, 2022-2032 (US$ Bn, AGR (%), CAGR (%))
Table 22 HIV Pipeline Products
Table 23 HIV Pipeline Products (bNAbs)
Table 24 HIV Pipeline Products (other compounds)
Table 25 Chronic Hepatitis B pipeline, 2022
Table 26 HIV and HBV Therapies Market, By Region, 2022-2032 (US$ Bn, AGR (%), CAGR (%))
Table 27 HIV and HBV Therapies Market, By Region, 2022-2032 (US$ Bn, AGR %, CAGR %) (V-shaped Recovery)
Table 28 HIV and HBV Therapies Market, By Region, 2022-2032 (US$ Bn, AGR %, CAGR %) (U-shaped Recovery)
Table 29 HIV and HBV Therapies Market, By Region, 2022-2032 (US$ Bn, AGR %, CAGR %) (W-shaped Recovery)
Table 30 HIV and HBV Therapies Market, By Region, 2022-2032 (US$ Bn, AGR %, CAGR %) (L-shaped Recovery)
Table 31 North America HIV and HBV Therapies Market, By Country, 2022-2032 (US$ Bn, AGR (%), CAGR (%))
Table 32 North America HIV and HBV Therapies Drug Class Market, 2022-2032 (US$ Bn, AGR (%), CAGR (%))
Table 33 North America HIV and HBV Therapies Distribution Channel Market, 2022-2032 (US$ Bn, AGR (%), CAGR (%))
Table 34 US HIV and HBV Therapies Market, 2022-2032 (US$ Bn, AGR (%), CAGR (%))
Table 35 US HIV and HBV Therapies Drug Class Market, 2022-2032 (US$ Bn, AGR (%), CAGR (%))
Table 36 US HIV and HBV Therapies Distribution Channel Market, 2022-2032 (US$ Bn, AGR (%), CAGR (%))
Table 37 Canada HIV and HBV Therapies Market, 2022-2032 (US$ Bn, AGR (%), CAGR (%))
Table 38 Canada HIV and HBV Therapies Drug Class Market, 2022-2032 (US$ Bn, AGR (%), CAGR (%))
Table 39 Canada HIV and HBV Therapies Distribution Channel Market, 2022-2032 (US$ Bn, AGR (%), CAGR (%))
Table 40 Europe HIV and HBV Therapies Market, By Country, 2022-2032 (US$ Bn, AGR (%), CAGR (%))
Table 41 Europe HIV and HBV Therapies Drug Class Market, 2022-2032 (US$ Bn, AGR (%), CAGR (%))
Table 42 Europe HIV and HBV Therapies Distribution Channel Market, 2022-2032 (US$ Bn, AGR (%), CAGR (%))
Table 43 Germany HIV and HBV Therapies Market, 2022-2032 (US$ Bn, AGR (%), CAGR (%))
Table 44 Germany HIV and HBV Therapies Drug Class Market, 2022-2032 (US$ Bn, AGR (%), CAGR (%))
Table 45 Germany HIV and HBV Therapies Distribution Channel Market, 2022-2032 (US$ Bn, AGR (%), CAGR (%))
Table 46 UK HIV and HBV Therapies Market, 2022-2032 (US$ Bn, AGR (%), CAGR (%))
Table 47 UK HIV and HBV Therapies Drug Class Market, 2022-2032 (US$ Bn, AGR (%), CAGR (%))
Table 48 UK HIV and HBV Therapies Distribution Channel Market, 2022-2032 (US$ Bn, AGR (%), CAGR (%))
Table 49 France HIV and HBV Therapies Market, 2022-2032 (US$ Bn, AGR (%), CAGR (%))
Table 50 France HIV and HBV Therapies Drug Class Market, 2022-2032 (US$ Bn, AGR (%), CAGR (%))
Table 51 France HIV and HBV Therapies Distribution Channel Market, 2022-2032 (US$ Bn, AGR (%), CAGR (%))
Table 52 Italy HIV and HBV Therapies Market, 2022-2032 (US$ Bn, AGR (%), CAGR (%))
Table 53 Italy HIV and HBV Therapies Drug Class Market, 2022-2032 (US$ Bn, AGR (%), CAGR (%))
Table 54 Italy HIV and HBV Therapies Distribution Channel Market, 2022-2032 (US$ Bn, AGR (%), CAGR (%))
Table 55 Spain HIV and HBV Therapies Market, 2022-2032 (US$ Bn, AGR (%), CAGR (%))
Table 56 Spain HIV and HBV Therapies Drug Class Market, 2022-2032 (US$ Bn, AGR (%), CAGR (%))
Table 57 Spain HIV and HBV Therapies Distribution Channel Market, 2022-2032 (US$ Bn, AGR (%), CAGR (%))
Table 58 Russia HIV and HBV Therapies Market, 2022-2032 (US$ Bn, AGR (%), CAGR (%))
Table 59 Russia HIV and HBV Therapies Drug Class Market, 2022-2032 (US$ Bn, AGR (%), CAGR (%))
Table 60 Russia HIV and HBV Therapies Distribution Channel Market, 2022-2032 (US$ Bn, AGR (%), CAGR (%))
Table 61 Rest of Europe HIV and HBV Therapies Market, 2022-2032 (US$ Bn, AGR (%), CAGR (%))
Table 62 Rest of Europe HIV and HBV Therapies Drug Class Market, 2022-2032 (US$ Bn, AGR (%), CAGR (%))
Table 63 Rest of Europe HIV and HBV Therapies Distribution Channel Market, 2022-2032 (US$ Bn, AGR (%), CAGR (%))
Table 64 Asia Pacific HIV and HBV Therapies Market, By Country, 2022-2032 (US$ Bn, AGR (%), CAGR (%))
Table 65 Asia Pacific HIV and HBV Therapies Drug Class Market, 2022-2032 (US$ Bn, AGR (%), CAGR (%))
Table 66 Asia Pacific HIV and HBV Therapies Distribution Channel Market, 2022-2032 (US$ Bn, AGR (%), CAGR (%))
Table 67 Japan HIV and HBV Therapies Market, 2022-2032 (US$ Bn, AGR (%), CAGR (%))
Table 68 Japan HIV and HBV Therapies Drug Class Market, 2022-2032 (US$ Bn, AGR (%), CAGR (%))
Table 69 Japan HIV and HBV Therapies Distribution Channel Market, 2022-2032 (US$ Bn, AGR (%), CAGR (%))
Table 70 China HIV and HBV Therapies Market, 2022-2032 (US$ Bn, AGR (%), CAGR (%))
Table 71 China HIV and HBV Therapies Drug Class Market, 2022-2032 (US$ Bn, AGR (%), CAGR (%))
Table 72 China HIV and HBV Therapies Distribution Channel Market, 2022-2032 (US$ Bn, AGR (%), CAGR (%))
Table 73 India HIV and HBV Therapies Market, 2022-2032 (US$ Bn, AGR (%), CAGR (%))
Table 74 India HIV and HBV Therapies Drug Class Market, 2022-2032 (US$ Bn, AGR (%), CAGR (%))
Table 75 India HIV and HBV Therapies Distribution Channel Market, 2022-2032 (US$ Bn, AGR (%), CAGR (%))
Table 76 South Korea HIV and HBV Therapies Market, 2022-2032 (US$ Bn, AGR (%), CAGR (%))
Table 77 South Korea HIV and HBV Therapies Drug Class Market, 2022-2032 (US$ Bn, AGR (%), CAGR (%))
Table 78 South Korea HIV and HBV Therapies Distribution Channel Market, 2022-2032 (US$ Bn, AGR (%), CAGR (%))
Table 79 Australia HIV and HBV Therapies Market, 2022-2032 (US$ Bn, AGR (%), CAGR (%))
Table 80 Australia HIV and HBV Therapies Drug Class Market, 2022-2032 (US$ Bn, AGR (%), CAGR (%))
Table 81 Australia HIV and HBV Therapies Distribution Channel Market, 2022-2032 (US$ Bn, AGR (%), CAGR (%))
Table 82 Rest of Asia Pacific HIV and HBV Therapies Market, 2022-2032 (US$ Bn, AGR (%), CAGR (%))
Table 83 Rest of Asia Pacific HIV and HBV Therapies Drug Class Market, 2022-2032 (US$ Bn, AGR (%), CAGR (%))
Table 84 Rest of Asia Pacific HIV and HBV Therapies Distribution Channel Market, 2022-2032 (US$ Bn, AGR (%), CAGR (%))
Table 85 Latin America HIV and HBV Therapies Market, By Country, 2022-2032 (US$ Bn, AGR (%), CAGR (%))
Table 86 Latin America HIV and HBV Therapies Drug Class Market, 2022-2032 (US$ Bn, AGR (%), CAGR (%))
Table 87 Latin America HIV and HBV Therapies Distribution Channel Market, 2022-2032 (US$ Bn, AGR (%), CAGR (%))
Table 88 Brazil HIV and HBV Therapies Market, 2022-2032 (US$ Bn, AGR (%), CAGR (%))
Table 89 Brazil HIV and HBV Therapies Drug Class Market, 2022-2032 (US$ Bn, AGR (%), CAGR (%))
Table 90 Brazil HIV and HBV Therapies Distribution Channel Market, 2022-2032 (US$ Bn, AGR (%), CAGR (%))
Table 91 Mexico HIV and HBV Therapies Market, 2022-2032 (US$ Bn, AGR (%), CAGR (%))
Table 92 Mexico HIV and HBV Therapies Drug Class Market, 2022-2032 (US$ Bn, AGR (%), CAGR (%))
Table 93 Mexico HIV and HBV Therapies Distribution Channel Market, 2022-2032 (US$ Bn, AGR (%), CAGR (%))
Table 94 Rest of Latin America HIV and HBV Therapies Market, 2022-2032 (US$ Bn, AGR (%), CAGR (%))
Table 95 Rest of LATAM HIV and HBV Therapies Drug Class Market, 2022-2032 (US$ Bn, AGR (%), CAGR (%))
Table 96 Rest of LATAM HIV and HBV Therapies Distribution Channel Market, 2022-2032 (US$ Bn, AGR (%), CAGR (%))
Table 97 MEA HIV and HBV Therapies Market, By Country, 2022-2032 (US$ Bn, AGR (%), CAGR (%))
Table 98 MEA HIV and HBV Therapies Drug Class Market, 2022-2032 (US$ Bn, AGR (%), CAGR (%))
Table 99 MEA HIV and HBV Therapies Distribution Channel Market, 2022-2032 (US$ Bn, AGR (%), CAGR (%))
Table 100 South Africa HIV and HBV Therapies Market, 2022-2032 (US$ Bn, AGR (%), CAGR (%))
Table 101 South Africa HIV and HBV Therapies Drug Class Market, 2022-2032 (US$ Bn, AGR (%), CAGR (%))
Table 102 South Africa HIV and HBV Therapies Distribution Channel Market, 2022-2032 (US$ Bn, AGR (%), CAGR (%))
Table 103 GCC HIV and HBV Therapies Market, 2022-2032 (US$ Bn, AGR (%), CAGR (%))
Table 104 GCC HIV and HBV Therapies Drug Class Market, 2022-2032 (US$ Bn, AGR (%), CAGR (%))
Table 105 GCC HIV and HBV Therapies Distribution Channel Market, 2022-2032 (US$ Bn, AGR (%), CAGR (%))
Table 106 Rest of MEA HIV and HBV Therapies Market, 2022-2032 (US$ Bn, AGR (%), CAGR (%))
Table 107 Rest of MEA HIV and HBV Therapies Drug Class Market, 2022-2032 (US$ Bn, AGR (%), CAGR (%))
Table 108 Rest of MEA HIV and HBV Therapies Distribution Channel Market, 2022-2032 (US$ Bn, AGR (%), CAGR (%))
Table 109 Key Business Strategies Adopted by Key Players in Global HIV and HBV Therapies Market
Table 110 Pfizer: Key Details, (CEO, HQ, Revenue, Founded, No. of Employees, Company Type, Website, Business Segment)
Table 111 Pfizer: Product Benchmarking
Table 112 Merck: Key Details, (CEO, HQ, Revenue, Founded, No. of Employees, Company Type, Website, Business Segment)
Table 113 Merck: Product Benchmarking
Table 114 Merck: Strategic Outlook
Table 115 GSK: Key Details, (CEO, HQ, Revenue, Founded, No. of Employees, Company Type, Website, Business Segment)
Table 116 GSK: Product Benchmarking
Table 117 GSK: Strategic Outlook
Table 118 AbbVie: Key Details, (CEO, HQ, Revenue, Founded, No. of Employees, Company Type, Website)
Table 119 AbbVie: Product Benchmarking
Table 120 AbbVie: Strategic Outlook
Table 121 Boehringer Ingelheim: Key Details, (CEO, HQ, Revenue, Founded, No. of Employees, Company Type, Website, Business Segment)
Table 122 Boehringer Ingelheim: Product Benchmarking
Table 123 Gilead Sciences: Key Details, (CEO, HQ, Revenue, Founded, No. of Employees, Company Type, Website, Business Segment)
Table 124 Gilead Sciences: Product Benchmarking
Table 125 Gilead Sciences: Strategic Outlook
Table 126 Janssen Pharma: Key Details, (CEO, HQ, Revenue, Founded, No. of Employees, Company Type, Website, Business Segment)
Table 127 Janssen Pharma: Product Benchmarking
Table 128 Janssen Pharma: Strategic Outlook
Table 129 Teva: Key Details, (CEO, HQ, Revenue, Founded, No. of Employees, Company Type, Website, Business Segment)
Table 130 Teva: Product Benchmarking
Table 131 Teva: Strategic Outlook
Table 132 BMS: Key Details, (CEO, HQ, Revenue, Founded, No. of Employees, Company Type, Website)
Table 133 BMS: Product Benchmarking
Table 134 BMS: Strategic Outlook
Table 135 Arbutus Biopharma: Key Details, (CEO, HQ, Revenue, Founded, No. of Employees, Company Type, Website)
Table 136 ARBUTUS BIOPHARMA: Product Benchmarking
Table 137 ARBUTUS BIOPHARMA: Strategic Outlook
List of Figures
Figure 1 Global HIV and HBV Therapies Market Segmentation
Figure 2 Global HIV and HBV Therapies Market Forecast by Region: Market Attractiveness Index
Figure 3 Global HIV and HBV Therapies Market by Drug Class: Market Attractiveness Index
Figure 4 Global HIV and HBV Therapies Market by Distribution Channel: Market Attractiveness Index
Figure 5 Global HIV and HBV Therapies Market: Market Dynamics
Figure 6 Global COVID Impact Analysis: HIV and HBV Therapies Market Recovery Scenarios
Figure 7 Global HIV and HBV Therapies Market by Region, 2022-2032 (US$ Mn, AGR (%), CAGR (%)): “V” Shaped Recovery
Figure 8 Global HIV and HBV Therapies Market by Region, 2022-2032 (US$ Mn, AGR (%), CAGR (%)): “U” Shaped Recovery
Figure 9 Global HIV and HBV Therapies Market by Region, 2022-2032 (US$ Mn, AGR (%), CAGR (%)): “W” Shaped Recovery
Figure 10 Global HIV and HBV Therapies Market by Region, 2022-2032 (US$ Mn, AGR (%), CAGR (%)): “L” Shaped Recovery
Figure 11 Global HIV and HBV Therapies Market: Porter’s Five Forces Analysis
Figure 12 Global HIV and HBV Therapies Market Forecast by Drug Class 2022, 2027, 2032 (Revenue, CAGR%)
Figure 13 Global HIV and HBV Therapies Market Share Forecast by Drug Class, 2022, 2027, 2032 (%)
Figure 14 Global HIV and HBV Therapies Market Forecast by Drug Class, 2022-2032 (US$ billion, AGR %)
Figure 15 Combination Therapies Market Forecast by Region, 2022-2032 (US$ billion)
Figure 16 Combination Therapies Market Share Forecast by Region, 2022-2032 (%)
Figure 17 Nucleoside and Non-nucleoside RTIs Market Forecast by Region, 2022-2032 (US$ billion)
Figure 18 Nucleoside and Non-nucleoside RTIs Market Share Forecast by Region, 2022-2032 (%)
Figure 19 Integrase inhibitors Market Forecast by Region, 2022-2032 (US$ billion)
Figure 20 Integrase inhibitors Market Share Forecast by Region, 2022-2032 (%)
Figure 21 Protease Inhibitors Market Forecast by Region, 2022-2032 (US$ billion)
Figure 22 Protease Inhibitors Market Share Forecast by Region, 2022-2032 (%)
Figure 23 Other Drug Class Market Forecast by Region, 2022-2032 (US$ billion)
Figure 24 Other Drug Class Market Share Forecast by Region, 2022-2032 (%)
Figure 25 Global HIV and HBV Therapies Market Forecast by Distribution Channel 2022, 2027, 2032 (Revenue, CAGR%)
Figure 26 Global HIV and HBV Therapies Market Forecast by Distribution Channel, 2022-2032 (US$ billion, AGR %)
Figure 27 Global HIV and HBV Therapies Market Share Forecast by Distribution Channel, 2022, 2032 (%)
Figure 28 Hospital pharmacies Market Forecast by Region, 2022-2032 (US$ billion)
Figure 29 Hospital pharmacies Market Share Forecast by Region, 2022-2032 (%)
Figure 30 Retail pharmacies Market Forecast by Region, 2022-2032 (US$ billion)
Figure 31 Retail pharmacies Market Share Forecast by Region, 2022-2032 (%)
Figure 32 Online Pharmacies Market Forecast by Region, 2022-2032 (US$ billion)
Figure 33 Online Pharmacies Market Share Forecast by Region, 2022-2032 (%)
Figure 34 Global HIV and HBV Therapies Market Forecast by Region 2022, 2027, 2032 (Revenue), C
Figure 35 Global HIV and HBV Therapies Market Share Forecast by Region 2022, 2027, 2032(%)
Figure 36 Global HIV and HBV Therapies Market by Region, 2022-2032 (US$ Bn, AGR (%), CAGR (%))
Figure 37 Global HIV and HBV Therapies Market by Region, 2022-2032 (US$ Bn, AGR (%), CAGR (%)): “V” Shaped Recovery
Figure 38 Global HIV and HBV Therapies Market by Region, 2022-2032 (US$ Bn, AGR (%), CAGR (%)): “U” Shaped Recovery
Figure 39 Global HIV and HBV Therapies Market by Region, 2022-2032 (US$ Bn, AGR (%), CAGR (%)): “W” Shaped Recovery
Figure 40 Global HIV and HBV Therapies Market by Region, 2022-2032 (US$ Bn, AGR (%), CAGR (%)): “L” Shaped Recovery
Figure 41 North America HIV and HBV Therapies Market Attractiveness Index
Figure 42 North America HIV and HBV Therapies Market by Region, 2022, 2027 & 2032 (US$ billion)
Figure 43 North America HIV and HBV Therapies Market Forecast by Country, 2022-2032 (US$ billion, AGR %)
Figure 44 North America HIV and HBV Therapies Market Share Forecast by Country, 2022 & 2032 (%)
Figure 45 North America HIV and HBV Therapies Market Forecast by Drug Class, 2022-2032 (US$ billion, AGR %)
Figure 46 North America HIV and HBV Therapies Market Share Forecast by Drug Class, 2022 & 2032 (%)
Figure 47 North America HIV and HBV Therapies Market Forecast by Distribution Channel, 2022-2032 (US$ billion, AGR %)
Figure 48 North America HIV and HBV Therapies Market Share Forecast by Distribution Channel, 2022 & 2032 (%)
Figure 49 U.S. HIV and HBV Therapies Market Forecast, 2022-2032 (US$ billion, AGR %)
Figure 50 U.S. HIV and HBV Therapies Market Forecast by Drug Class, 2022-2032 (US$ billion, AGR %)
Figure 51 U.S. HIV and HBV Therapies Market Share Forecast by Drug Class, 2022 & 2032 (%)
Figure 52 U.S. HIV and HBV Therapies Market Forecast by Distribution Channel, 2022-2032 (US$ billion, AGR %)
Figure 53 U.S. HIV and HBV Therapies Market Share Forecast by Distribution Channel, 2022 & 2032 (%)
Figure 54 Canada HIV and HBV Therapies Market Forecast, 2022-2032 (US$ billion, AGR %)
Figure 55 Canada HIV and HBV Therapies Market Forecast by Drug Class, 2022-2032 (US$ billion, AGR %)
Figure 56 Canada HIV and HBV Therapies Market Share Forecast by Drug Class, 2022 & 2032 (%)
Figure 57 Canada HIV and HBV Therapies Market Forecast by Distribution Channel, 2022-2032 (US$ billion, AGR %)
Figure 58 Canada HIV and HBV Therapies Market Share Forecast by Distribution Channel, 2022 & 2032 (%)
Figure 59 Europe HIV and HBV Therapies Market Attractiveness Index
Figure 60 Europe HIV and HBV Therapies Market by Region, 2022, 2027 & 2032 (US$ billion)
Figure 61 Europe HIV and HBV Therapies Market Forecast by Country, 2022-2032 (US$ billion, AGR %)
Figure 62 Europe HIV and HBV Therapies Market Share Forecast by Country, 2022 & 2032 (%)
Figure 63 Europe HIV and HBV Therapies Market Forecast by Drug Class, 2022-2032 (US$ billion, AGR %)
Figure 64 North America HIV and HBV Therapies Market Share Forecast by Drug Class, 2022 & 2032 (%)
Figure 65 Europe HIV and HBV Therapies Market Forecast by Distribution Channel, 2022-2032 (US$ billion, AGR %)
Figure 66 Europe HIV and HBV Therapies Market Share Forecast by Distribution Channel, 2022 & 2032 (%)
Figure 67 Germany HIV and HBV Therapies Market Forecast, 2022-2032 (US$ billion, AGR %)
Figure 68 Germany HIV and HBV Therapies Market Forecast by Drug Class, 2022-2032 (US$ billion, AGR %)
Figure 69 Germany HIV and HBV Therapies Market Share Forecast by Drug Class, 2022 & 2032 (%)
Figure 70 Germany HIV and HBV Therapies Market Forecast by Distribution Channel, 2022-2032 (US$ billion, AGR %)
Figure 71 Germany HIV and HBV Therapies Market Share Forecast by Distribution Channel, 2022 & 2032 (%)
Figure 72 UK HIV and HBV Therapies Market Forecast, 2022-2032 (US$ billion, AGR %)
Figure 73 U.K. HIV and HBV Therapies Market Forecast by Drug Class, 2022-2032 (US$ billion, AGR %)
Figure 74 U.K. HIV and HBV Therapies Market Share Forecast by Drug Class, 2022 & 2032 (%)
Figure 75 U.K. HIV and HBV Therapies Market Forecast by Distribution Channel, 2022-2032 (US$ billion, AGR %)
Figure 76 U.K. HIV and HBV Therapies Market Share Forecast by Distribution Channel, 2022 & 2032 (%)
Figure 77 France HIV and HBV Therapies Market Forecast, 2022-2032 (US$ billion, AGR %)
Figure 78 France HIV and HBV Therapies Market Forecast by Drug Class, 2022-2032 (US$ billion, AGR %)
Figure 79 France HIV and HBV Therapies Market Share Forecast by Drug Class, 2022 & 2032 (%)
Figure 80 France HIV and HBV Therapies Market Forecast by Distribution Channel, 2022-2032 (US$ billion, AGR %)
Figure 81 France HIV and HBV Therapies Market Share Forecast by Distribution Channel, 2022 & 2032 (%)
Figure 82 Italy HIV and HBV Therapies Market Forecast, 2022-2032 (US$ billion, AGR %)
Figure 83 Italy HIV and HBV Therapies Market Forecast by Drug Class, 2022-2032 (US$ billion, AGR %)
Figure 84 Italy HIV and HBV Therapies Market Share Forecast by Drug Class, 2022 & 2032 (%)
Figure 85 Italy HIV and HBV Therapies Market Forecast by Distribution Channel, 2022-2032 (US$ billion, AGR %)
Figure 86 Italy HIV and HBV Therapies Market Share Forecast by Distribution Channel, 2022 & 2032 (%)
Figure 87 Spain HIV and HBV Therapies Market Forecast, 2022-2032 (US$ billion, AGR %)
Figure 88 Spain HIV and HBV Therapies Market Forecast by Drug Class, 2022-2032 (US$ billion, AGR %)
Figure 89 Spain HIV and HBV Therapies Market Share Forecast by Drug Class, 2022 & 2032 (%)
Figure 90 Spain HIV and HBV Therapies Market Forecast by Distribution Channel, 2022-2032 (US$ billion, AGR %)
Figure 91 Spain HIV and HBV Therapies Market Share Forecast by Distribution Channel, 2022 & 2032 (%)
Figure 92 Russia HIV and HBV Therapies Market Forecast, 2022-2032 (US$ billion, AGR %)
Figure 93 Russia HIV and HBV Therapies Market Forecast by Drug Class, 2022-2032 (US$ billion, AGR %)
Figure 94 Russia HIV and HBV Therapies Market Share Forecast by Drug Class, 2022 & 2032 (%)
Figure 95 Russia HIV and HBV Therapies Market Forecast by Distribution Channel, 2022-2032 (US$ billion, AGR %)
Figure 96 Russia HIV and HBV Therapies Market Share Forecast by Distribution Channel, 2022 & 2032 (%)
Figure 97 Rest of Europe HIV and HBV Therapies Market Forecast, 2022-2032 (US$ billion, AGR %)
Figure 98 Rest of Europe HIV and HBV Therapies Market Forecast by Drug Class, 2022-2032 (US$ billion, AGR %)
Figure 99 Rest of Europe HIV and HBV Therapies Market Share Forecast by Drug Class, 2022 & 2032 (%)
Figure 100 Rest of Europe HIV and HBV Therapies Market Forecast by Distribution Channel, 2022-2032 (US$ billion, AGR %)
Figure 101 Rest of Europe HIV and HBV Therapies Market Share Forecast by Distribution Channel, 2022 & 2032 (%)
Figure 102 Asia Pacific HIV and HBV Therapies Market Attractiveness Index
Figure 103 Asia Pacific HIV and HBV Therapies Market by Region, 2022, 2027 & 2032 (US$ billion)
Figure 104 Asia Pacific HIV and HBV Therapies Market Forecast by Country, 2022-2032 (US$ billion, AGR %)
Figure 105 Asia Pacific HIV and HBV Therapies Market Share Forecast by Country, 2022 & 2032 (%)
Figure 106 Asia Pacific HIV and HBV Therapies Market Forecast by Drug Class, 2022-2032 (US$ billion, AGR %)
Figure 107 Asia Pacific HIV and HBV Therapies Market Share Forecast by Drug Class, 2022 & 2032 (%)
Figure 108 Asia Pacific HIV and HBV Therapies Market Forecast by Distribution Channel, 2022-2032 (US$ billion, AGR %)
Figure 109 Asia Pacific HIV and HBV Therapies Market Share Forecast by Distribution Channel, 2022 & 2032 (%)
Figure 110 Japan HIV and HBV Therapies Market Forecast, 2022-2032 (US$ billion, AGR %)
Figure 111 Japan HIV and HBV Therapies Market Forecast by Drug Class, 2022-2032 (US$ billion, AGR %)
Figure 112 Japan HIV and HBV Therapies Market Share Forecast by Drug Class, 2022 & 2032 (%)
Figure 113 Japan HIV and HBV Therapies Market Forecast by Distribution Channel, 2022-2032 (US$ billion, AGR %)
Figure 114 Japan HIV and HBV Therapies Market Share Forecast by Distribution Channel, 2022 & 2032 (%)
Figure 115 China HIV and HBV Therapies Market Forecast, 2022-2032 (US$ billion, AGR %)
Figure 116 China HIV and HBV Therapies Market Forecast by Drug Class, 2022-2032 (US$ billion, AGR %)
Figure 117 China HIV and HBV Therapies Market Share Forecast by Drug Class, 2022 & 2032 (%)
Figure 118 China HIV and HBV Therapies Market Forecast by Distribution Channel, 2022-2032 (US$ billion, AGR %)
Figure 119 China HIV and HBV Therapies Market Share Forecast by Distribution Channel, 2022 & 2032 (%)
Figure 120 India HIV and HBV Therapies Market Forecast, 2022-2032 (US$ billion, AGR %)
Figure 121 India HIV and HBV Therapies Market Forecast by Drug Class, 2022-2032 (US$ billion, AGR %)
Figure 122 India HIV and HBV Therapies Market Share Forecast by Drug Class, 2022 & 2032 (%)
Figure 123 India HIV and HBV Therapies Market Forecast by Distribution Channel, 2022-2032 (US$ billion, AGR %)
Figure 124 India HIV and HBV Therapies Market Share Forecast by Distribution Channel, 2022 & 2032 (%)
Figure 125 South Korea HIV and HBV Therapies Market Forecast, 2022-2032 (US$ billion, AGR %)
Figure 126 South Korea HIV and HBV Therapies Market Forecast by Drug Class, 2022-2032 (US$ billion, AGR %)
Figure 127 South Korea HIV and HBV Therapies Market Share Forecast by Drug Class, 2022 & 2032 (%)
Figure 128 South Korea HIV and HBV Therapies Market Forecast by Distribution Channel, 2022-2032 (US$ billion, AGR %)
Figure 129 South Korea HIV and HBV Therapies Market Share Forecast by Distribution Channel, 2022 & 2032 (%)
Figure 130 Australia HIV and HBV Therapies Market Forecast, 2022-2032 (US$ billion, AGR %)
Figure 131 Australia HIV and HBV Therapies Market Forecast by Drug Class, 2022-2032 (US$ billion, AGR %)
Figure 132 Australia HIV and HBV Therapies Market Share Forecast by Drug Class, 2022 & 2032 (%)
Figure 133 Australia HIV and HBV Therapies Market Forecast by Distribution Channel, 2022-2032 (US$ billion, AGR %)
Figure 134 Australia HIV and HBV Therapies Market Share Forecast by Distribution Channel, 2022 & 2032 (%)
Figure 135 Rest of Asia Pacific HIV and HBV Therapies Market Forecast, 2022-2032 (US$ billion, AGR %)
Figure 136 Rest of APAC HIV and HBV Therapies Market Forecast by Drug Class, 2022-2032 (US$ billion, AGR %)
Figure 137 Rest of APAC HIV and HBV Therapies Market Share Forecast by Drug Class, 2022 & 2032 (%)
Figure 138 Rest of APAC HIV and HBV Therapies Market Forecast by Distribution Channel, 2022-2032 (US$ billion, AGR %)
Figure 139 Rest of APAC HIV and HBV Therapies Market Share Forecast by Distribution Channel, 2022 & 2032 (%)
Figure 140 Latin America HIV and HBV Therapies Market Attractiveness Index
Figure 141 Latin America HIV and HBV Therapies Market by Region, 2022, 2027 & 2032 (US$ billion)
Figure 142 Latin America HIV and HBV Therapies Market Forecast by Country, 2022-2032 (US$ billion, AGR %)
Figure 143 Latin America HIV and HBV Therapies Market Share Forecast by Country, 2022 & 2032 (%)
Figure 144 Latin America HIV and HBV Therapies Market Forecast by Drug Class, 2022-2032 (US$ billion, AGR %)
Figure 145 Latin America HIV and HBV Therapies Market Share Forecast by Drug Class, 2022 & 2032 (%)
Figure 146 Latin America HIV and HBV Therapies Market Forecast by Distribution Channel, 2022-2032 (US$ billion, AGR %)
Figure 147 Latin America HIV and HBV Therapies Market Share Forecast by Distribution Channel, 2022 & 2032 (%)
Figure 148 Brazil HIV and HBV Therapies Market Forecast, 2022-2032 (US$ billion, AGR %)
Figure 149 Brazil HIV and HBV Therapies Market Forecast by Drug Class, 2022-2032 (US$ billion, AGR %)
Figure 150 Brazil HIV and HBV Therapies Market Share Forecast by Drug Class, 2022 & 2032 (%)
Figure 151 Brazil HIV and HBV Therapies Market Forecast by Distribution Channel, 2022-2032 (US$ billion, AGR %)
Figure 152 Brazil HIV and HBV Therapies Market Share Forecast by Distribution Channel, 2022 & 2032 (%)
Figure 153 Mexico HIV and HBV Therapies Market Forecast, 2022-2032 (US$ billion, AGR %)
Figure 154 Mexico HIV and HBV Therapies Market Forecast by Drug Class, 2022-2032 (US$ billion, AGR %)
Figure 155 Mexico HIV and HBV Therapies Market Share Forecast by Drug Class, 2022 & 2032 (%)
Figure 156 Mexico HIV and HBV Therapies Market Forecast by Distribution Channel, 2022-2032 (US$ billion, AGR %)
Figure 157 Mexico HIV and HBV Therapies Market Share Forecast by Distribution Channel, 2022 & 2032 (%)
Figure 158 Rest of LATAM HIV and HBV Therapies Market Forecast, 2022-2032 (US$ billion, AGR %)
Figure 159 Rest of LATAM HIV and HBV Therapies Market Forecast by Drug Class, 2022-2032 (US$ billion, AGR %)
Figure 160 Rest of LATAM HIV and HBV Therapies Market Share Forecast by Drug Class, 2022 & 2032 (%)
Figure 161 Rest of LATAM HIV and HBV Therapies Market Forecast by Distribution Channel, 2022-2032 (US$ billion, AGR %)
Figure 162 Rest of LATAM HIV and HBV Therapies Market Share Forecast by Distribution Channel, 2022 & 2032 (%)
Figure 163 MEA HIV and HBV Therapies Market Attractiveness Index
Figure 164 MEA HIV and HBV Therapies Market by Region, 2022, 2027 & 2032 (US$ billion)
Figure 165 MEA HIV and HBV Therapies Market Forecast by Country, 2022-2032 (US$ billion, AGR %)
Figure 166 MEA HIV and HBV Therapies Market Share Forecast by Country, 2022 & 2032 (%)
Figure 167 MEA HIV and HBV Therapies Market Forecast by Drug Class, 2022-2032 (US$ billion, AGR %)
Figure 168 MEA HIV and HBV Therapies Market Share Forecast by Drug Class, 2022 & 2032 (%)
Figure 169 MEA HIV and HBV Therapies Market Forecast by Distribution Channel, 2022-2032 (US$ billion, AGR %)
Figure 170 MEA HIV and HBV Therapies Market Share Forecast by Distribution Channel, 2022 & 2032 (%)
Figure 171 South Africa HIV and HBV Therapies Market Forecast, 2022-2032 (US$ billion, AGR %)
Figure 172 South Africa HIV and HBV Therapies Market Forecast by Drug Class, 2022-2032 (US$ billion, AGR %)
Figure 173 South Africa HIV and HBV Therapies Market Share Forecast by Drug Class, 2022 & 2032 (%)
Figure 174 South Africa HIV and HBV Therapies Market Forecast by Distribution Channel, 2022-2032 (US$ billion, AGR %)
Figure 175 South Africa HIV and HBV Therapies Market Share Forecast by Distribution Channel, 2022 & 2032 (%)
Figure 176 GCC HIV and HBV Therapies Market Forecast, 2022-2032 (US$ billion, AGR %)
Figure 177 GCC HIV and HBV Therapies Market Forecast by Drug Class, 2022-2032 (US$ billion, AGR %)
Figure 178 GCC HIV and HBV Therapies Market Share Forecast by Drug Class, 2022 & 2032 (%)
Figure 179 GCC HIV and HBV Therapies Market Forecast by Distribution Channel, 2022-2032 (US$ billion, AGR %)
Figure 180 GCC HIV and HBV Therapies Market Share Forecast by Distribution Channel, 2022 & 2032 (%)
Figure 181 Rest of MEA HIV and HBV Therapies Market Forecast, 2022-2032 (US$ billion, AGR %)
Figure 182 Rest of MEA HIV and HBV Therapies Market Forecast by Drug Class, 2022-2032 (US$ billion, AGR %)
Figure 183 Rest of MEA HIV and HBV Therapies Market Share Forecast by Drug Class, 2022 & 2032 (%)
Figure 184 Rest of MEA HIV and HBV Therapies Market Forecast by Distribution Channel, 2022-2032 (US$ billion, AGR %)
Figure 185 Rest of MEA HIV and HBV Therapies Market Share Forecast by Distribution Channel, 2022 & 2032 (%)
Figure 186 Global HIV and HBV Therapies Market: Company Share Analysis, 2021
Figure 187 Pfizer: Net Revenue, 2019-2021 (US$ million, AGR %)
Figure 188 Pfizer: Regional Market Shares, 2021
Figure 189 Pfizer: Gross Profit, 2019-2021 (US$ million, AGR %)
Figure 190 Pfizer: R&D, 2019-2021 (US$ million, AGR %)
Figure 191 Merck: Net Revenue, 2019-2021 (US$ million, AGR %)
Figure 192 Merck: Regional Market Shares, 2021
Figure 193 Merck: Income from Continuing Operations before Taxes, 2019-2021 (US$ million, AGR %)
Figure 194 Merck: R&D, 2019-2021 (US$ million, AGR %)
Figure 195 GSK: Net Revenue, 2019-2021 (US$ million, AGR %)
Figure 196 GSK: Regional Market Shares, 2021
Figure 197 GSK: Gross Profit, 2019-2021 (US$ million, AGR %)
Figure 198 GSK: R&D, 2019-2021 (US$ million, AGR %)
Figure 199 AbbVie: Net Revenue, 2019-2021 (US$ million, AGR %)
Figure 200 AbbVie: Regional Market Shares, 2021
Figure 201 AbbVie: Operating Earnings, 2019-2021 (US$ million, AGR %)
Figure 202 AbbVie: R&D, 2019-2021 (US$ million, AGR %)
Figure 203 Boehringer Ingelheim: Net Revenue, 2019-2021 (US$ million, AGR %)
Figure 204 Boehringer Ingelheim: Regional Market Shares, 2021
Figure 205 Boehringer Ingelheim: Operating Income, 2019-2021 (US$ million, AGR %)
Figure 206 Boehringer Ingelheim: R&D, 2019-2021 (US$ million, AGR %)
Figure 207 Gilead Sciences: Net Revenue, 2019-2021 (US$ million, AGR %)
Figure 208 Gilead Sciences: Regional Market Shares, 2021
Figure 209 Gilead Sciences: Operating Profit, 2019-2021 (US$ million, AGR %)
Figure 210 Gilead Sciences: R&D, 2019-2021 (US$ million, AGR %)
Figure 211 Janssen Pharma: Net Revenue, 2019-2021 (US$ million, AGR %)
Figure 212 Janssen Pharma: Regional Market Shares, 2021
Figure 213 Janssen Pharma: Gross Profit, 2019-2021 (US$ million, AGR %)
Figure 214 Janssen Pharma: R&D, 2019-2021 (US$ million, AGR %)
Figure 215 Teva: Net Revenue, 2019-2021 (US$ million, AGR %)
Figure 216 Teva: Regional Market Shares, 2021
Figure 217 Teva: Gross Profit, 2019-2021 (US$ million, AGR %)
Figure 218 Teva: R&D, 2019-2021 (US$ million, AGR %)
Figure 219 BMS: Net Revenue, 2019-2021 (US$ million, AGR %)
Figure 220 BMS: Regional Market Shares, 2021
Figure 221 BMS: Net Earnings, 2019-2021 (US$ million, AGR %)
Figure 222 BMS: R&D, 2019-2021 (US$ million, AGR %)
Figure 223 Arbutus Biopharma: Net Revenue, 2019-2021 (US$ million, AGR %)
Figure 224 Arbutus Biopharma: Comprehensive Loss, 2019-2021 (US$ million, AGR %)
Figure 225 Arbutus Biopharma: R&D, 2019-2021 (US$ million, AGR %)
ページTOPに戻る
本レポートと同じKEY WORD(hbv)の最新刊レポート
よくあるご質問
Visiongain社はどのような調査会社ですか?
英国の調査会社ヴィジョンゲイン社(Visiongain)は、通信とエネルギーのほか、自動車や化学・医薬品、金属など、広範な市場を対象に調査を行っています。自動車市場については、市場全般に関する調査のほ... もっと見る
調査レポートの納品までの日数はどの程度ですか?
在庫のあるものは速納となりますが、平均的には 3-4日と見て下さい。
但し、一部の調査レポートでは、発注を受けた段階で内容更新をして納品をする場合もあります。
発注をする前のお問合せをお願いします。
注文の手続きはどのようになっていますか?
1)お客様からの御問い合わせをいただきます。
2)見積書やサンプルの提示をいたします。
3)お客様指定、もしくは弊社の発注書をメール添付にて発送してください。
4)データリソース社からレポート発行元の調査会社へ納品手配します。
5) 調査会社からお客様へ納品されます。最近は、pdfにてのメール納品が大半です。
お支払方法の方法はどのようになっていますか?
納品と同時にデータリソース社よりお客様へ請求書(必要に応じて納品書も)を発送いたします。
お客様よりデータリソース社へ(通常は円払い)の御振り込みをお願いします。
請求書は、納品日の日付で発行しますので、翌月最終営業日までの当社指定口座への振込みをお願いします。振込み手数料は御社負担にてお願いします。
お客様の御支払い条件が60日以上の場合は御相談ください。
尚、初めてのお取引先や個人の場合、前払いをお願いすることもあります。ご了承のほど、お願いします。
データリソース社はどのような会社ですか?
当社は、世界各国の主要調査会社・レポート出版社と提携し、世界各国の市場調査レポートや技術動向レポートなどを日本国内の企業・公官庁及び教育研究機関に提供しております。
世界各国の「市場・技術・法規制などの」実情を調査・収集される時には、データリソース社にご相談ください。
お客様の御要望にあったデータや情報を抽出する為のレポート紹介や調査のアドバイスも致します。
|
|


