ポストコンシューマーリサイクルプラスチック市場レポート:2023-2033
Post-Consumer Recycled Plastic Market Report 2023-2033
レポート詳細
ポストコンシューマーリサイクルプラスチック市場レポート 2023-2033 :本レポートは、新たな収益の柱を目指すリーディングカンパニーが、業界とその背景にあるダイナミクスをより深く理... もっと見る
※上記価格は部署ライセンス(Departmental licence)価格です。
その他の価格についてはデータリソースまでお問合せください。
日本語のページは自動翻訳を利用し作成しています。
実際のレポートは英文のみでご納品いたします。

|

|
サマリー
レポート詳細
ポストコンシューマーリサイクルプラスチック市場レポート 2023-2033:本レポートは、新たな収益の柱を目指すリーディングカンパニーが、業界とその背景にあるダイナミクスをより深く理解する上で、非常に有益なものとなるでしょう。また、異業種への進出や新地域での既存事業の拡大を目指す企業にとっても有用なレポートです。
プラスチックリサイクルは循環型経済の重要な構成要素
プラスチックリサイクルは、循環型経済の重要な構成要素です。なぜなら、消費者製品から得られるメカニカルリサイクル材料は、明確な技術的ステップ(粉砕、洗浄、分離、乾燥、再造粒、コンパウンドなど)を経て、バージンプラスチックの代わりに頻繁に新製品に変換することが可能であるからです。熱可塑性ポリマーは一般に非混和性であるため、さまざまな消費者製品から得られるリサイクルブレンドは常に機械的特性が悪く、機械的リサイクル材料は一見して多くの用途に適さないように思われます。その結果、ポリマーごと、あるいは少なくともポリマーグループごとの良好な分離がなければ、あるいは良好な相溶化ソリューションがなければ、メカニカルリサイクル材料は不可能であり、その可能性からはほど遠いものとなってしまうかもしれない。
革新的なパッケージングで廃プラスチックの削減とサプライチェーンの維持に貢献
プラスチックパッケージには、たくさんの素晴らしい特性があります。食品を新鮮に保ち、液体がぬるぬるするのを防ぎます。また、さまざまな形に成形することができ、ガラスと違って落としても割れることはありません。しかし、このように有用な素材であるにもかかわらず、その耐久性ゆえに生分解に約450年かかるという欠点があります。そのため、プラスチックパッケージが埋立地に埋もれたり、何世紀も先の海を詰まらせたりしないよう、再利用、再設計、リサイクルすることが非常に重要なのです。
マーケットリサーチレポートを購入する前に、どのような質問をすべきでしょうか?
- ポストコンシューマーリサイクルプラスチック市場はどのように進化しているのか?
- ポストコンシューマーリサイクルプラスチック市場の推進要因と抑制要因は何か?
- 予測期間中、各ポストコンシューマーリサイクルプラスチックサブマーケットセグメントはどのように成長し、2033年にはどれくらいの売上を占めるようになるのでしょうか?
- 2023年から2033年にかけて、各ポストコンシューマーリサイクルプラスチックサブマーケットの市場シェアはどのように推移するのか?
- 2023年から2033年にかけて、市場全体の主な牽引役は何でしょうか?
- ポストコンシューマーリサイクルプラスチックの主要市場はマクロ経済のダイナミクスに概ね追随するのか、それとも個々の国別市場が他を凌駕するのか?
- 2033年までに各国市場のシェアはどのように変化し、どの地域が2033年の市場をリードするのか?
- 主要プレイヤーは誰か、また予測期間中の展望は?
- これらの主要企業のポストコンシューマーリサイクルプラスチックプロジェクトはどのようなものですか?
- 2023年から2033年の間に、業界はどのように進化するのか?現在および今後10年間に行われるポストコンシューマーリサイクルプラスチックプロジェクトには、どのような意味があるのでしょうか?
- ポストコンシューマーリサイクルプラスチック市場をさらに拡大するために、製品の商業化の必要性は高いか?
- ポストコンシューマーリサイクルプラスチック市場はどこへ向かい、どうすれば市場の最前線に立つことができるか?
- 新製品や新サービスのための最適な投資オプションは?
- 企業を新たな成長軌道に乗せ、C-suiteに移行させるための重要な展望とは?
このことが、現在、そして今後10年間のポストコンシューマーリサイクルプラスチック市場にどのような影響を与えるかを知る必要があります。
- 385ページにわたる本レポートでは、167の表と215のグラフを独占的に提供します。
- このレポートでは、業界における主要な収益性の高い分野をハイライトしているため、今すぐターゲットを絞ることができます。
- 世界、地域、国別の売上高と成長率を詳細に分析しています。
- 競合他社が成功した主要なトレンド、変化、収益予測をハイライトしています。
このレポートは、ポストコンシューマーリサイクルプラスチック市場が今後10年間にどのように発展していくか、そしてCOVID-19の景気後退とバウンスの変動に即して、今日あなたに伝えています。この市場は、過去10年間のどの時点よりも今が重要なのです。
2033年までの予測やその他の分析により、商業的な展望が見えてきた
- 2033年までの収益予測に加え、直近の実績、成長率、市場シェアもご覧いただけます。
- ビジネスの展望や展開など、独自の分析もご覧いただけます。
- 定性的分析(市場力学、促進要因、機会、阻害要因、課題など)、コスト構造、ポストコンシューマーリサイクルプラスチック価格上昇の影響、最近の動向などをご覧いただけます。
本レポートでは、COVID-19が業界と貴社にどのような影響を及ぼすかについて、データ分析と貴重な洞察を掲載しています。本レポートでは、COVID-19の4つの回収パターンとその影響、すなわち「V」、「L」、「W」、「U」について論じています。
報告書の対象セグメント
カテゴリー別市場セグメント
- ボトル・フィルムプラスチック
- 非ボトル用硬質プラスチック
プロセス別市場セグメント
- 機械加工
- 化学的加工
- バイオ加工
サービス別市場セグメント
- 回収・輸送サービス
- リサイクルサービス
- 焼却サービス
- 埋立サービス
用途別市場セグメント
- パッケージ
- 建築・建設
- 自動車
- エレクトロニクス
- その他の用途
タイプ別市場セグメント
- ポリプロピレン(PP)
- 低密度ポリエチレン(LDPE)
- 高密度ポリエチレン(HDPE)
- ポリ塩化ビニル(PVC)
- ポリエチレンテレフタレート(PET)
- その他ポリマータイプ
世界市場全体とセグメントの収益予測に加え、4地域と主要20カ国市場の収益予測も掲載しています。
北アメリカ
- アメリカ
- カナダ
欧州
- ドイツ
- スペイン
- イギリス
- フランス
- イタリア
- その他の地域
アジア太平洋地域
- 中国
- 日本
- インド
- オーストラリア
- 韓国
- その他のアジア太平洋地域
ラテンアメリカ
- ブラジル
- メキシコ
-その他のラテンアメリカ
中近東・アフリカ
- トルコ
- サウジアラビア
- 南アフリカ
- その他の中東・アフリカ
このレポートでは、ポストコンシューマーリサイクルプラスチック市場の2023年から2033年までの主要企業のプロフ ァイルと、これらの企業のこのセグメントを中心にした情報も掲載しています。
主要企業と市場成長の可能性
・ Amcor PLC
・ Berry Global Group, Inc.
・ Biffa PLC
・ Clean Harbors, Inc.
・ Coveris Group
・ DS Smith plc
・ Eco-Products Inc.
・ Genpak LLC
・ Huhtamaki Oyj
・ Mondi PLC
・ Placon Corporation
・ Republic Services, Inc.
・ Sealed Air Corporation
・ Smurfit Kappa Group Plc
・ Sonoco Products Co.
・ Stericycle Inc.
・ Suez Environnement
・ Veolia Environment SA
・ Waste Connections, Inc.
・ Waste Management, Inc.
ポストコンシューマーリサイクルプラスチック市場の世界全体の収益、2023年から2033年まで金額ベースで2023年に174億5700万米ドルを超えると、我々の仕事は計算しています。2033年まで強い収益成長が予測される。この調査では、どの企業が最も大きな可能性を持っているのかを特定します。彼らの能力、進歩、商業的展望を知ることで、一歩先を行くことができます。
ポストコンシューマーリサイクルプラスチック市場、2023年から2033年のレポートはどのようにあなたのお役に立ちますか?
380ページを超えるレポートをまとめると、以下のような知識を得ることができます。
- ポストコンシューマーリサイクルプラスチック市場の2033年までの収益予測、カテゴリー、加工、サービス、用途、タイプ、企業規模の各予測を世界と地域レベルで掲載 - 業界の展望を発見し、投資と収益に最も有利な場所を見つけます。
- 4つの地域と20の主要国市場の2033年までの収益予測 - 北米、欧州、アジア太平洋、LAMEAのポストコンシューマーリサイクルプラスチック市場、2023年から2033年までの市場予測をご覧ください。また、米国、カナダ、メキシコ、ブラジル、ドイツ、フランス、イギリス、イタリア、中国、インド、日本、オーストラリアなど、著名な経済圏の市場も予測しています。
- 既存企業や市場参入を目指す企業の展望 - ポストコンシューマーリサイクルプラスチック市場に関わる主要企業20社の企業プロフィールを含む、2023年から2033年までの展望を掲載しています。
定量的・定性的な分析と独自の予測をご覧いただけます。私たちのレポートだけが持つ情報を入手し、貴重なビジネスインテリジェンスを得ることができます。
他にはない情報
私たちの新しいレポートがあれば、知識の遅れを取り戻し、チャンスを逃す可能性が低くなります。私たちの研究が貴社の調査、分析、意思決定にどのように役立つかをご覧ください。Visiongainの研究は、ポストコンシューマーリサイクルプラスチック市場、2023年から2033年、市場をリードする企業のための商業分析を必要とするすべての人のためのものです。データ、トレンド、予測を見つけることができます。
ページTOPに戻る
目次
目次
1.レポートの概要
1.1 調査の目的
1.2 ポストコンシューマーリサイクルプラスチック市場の紹介
1.3 本レポートの特徴
1.4 本レポートを読むべき理由
1.5 本分析報告書が回答する主な質問には以下が含まれる。
1.6 本レポートは誰のためのものなのか?
1.7 方法論
1.7.1 市場の定義
1.7.2 市場評価・予測手法
1.7.3 データの検証
1.7.3.1 一次調査
1.7.3.2 セカンダリーリサーチ
1.8 よくある質問と回答(FAQ)
1.9 関連するVisiongainのレポート
1.10 Visiongainについて
2 エグゼクティブサマリー
3 プレミアムインサイト
3.1 ポストコンシューマーリサイクルプラスチックの世界市場:地域別
3.2 ポストコンシューマーリサイクルプラスチックの世界市場:カテゴリー別
3.3 ポストコンシューマーリサイクルプラスチックの世界市場:加工別
3.4 ポストコンシューマーリサイクルプラスチックの世界市場:サービス別
3.5 ポストコンシューマーリサイクルプラスチックの世界市場:用途別
3.6 ポストコンシューマーリサイクルプラスチックの世界市場:タイプ別
4 市場の概要
4.1 主要な調査結果
4.2 マーケットダイナミクス
4.2.1 市場の推進要因
4.2.1.1 革新的なパッケージングが廃プラスチックの削減とサプライチェーンの維持に寄与している
4.2.1.2 ビジネス界では人工知能とロボットによってリサイクルとサステナビリティが促進されている
4.2.1.3 リサイクルされた材料を含むプラスチックは政府によって義務化されつつある
4.2.1.4 カーボンフットプリントの削減
4.2.2 市場の抑制要因
4.2.2.1 プラスチックのリサイクルは環境に有害な場合がある
4.2.2.2 プラスチック製品は無限にリサイクルできるわけではない
4.2.2.3 プラスチック廃棄物の公衆衛生への影響
4.2.2.4 プラスチック廃棄物管理戦略
4.2.3 市場機会
4.2.3.1 プラスチック廃棄物の再利用は、化学会社にとって重要な利益源となり得る
4.2.3.2 ポストパンデミックリサイクルファイバー
4.2.3.3 プラスチックはリサイクルされるより再利用されている
4.2.3.4 プラスチック廃棄物管理計画
4.3 COVID-19の影響度分析
4.4 "V字回復"
4.4.1 ポストコンシューマーリサイクルプラスチックの世界市場予測
4.4.2 消費後再生プラスチックの地域別世界市場
4.5 "U字型回収"
4.5.1 ポストコンシューマーリサイクルプラスチックの世界市場展望
4.5.2 消費後再生プラスチックの地域別世界市場展望
4.6 "W字型回収"
4.6.1 ポストコンシューマーリサイクルプラスチックの世界市場展望
4.6.2 消費後再生プラスチックの世界地域別市場展望
4.7 "L字型回収"
4.7.1 ポストコンシューマーリサイクルプラスチックの世界市場展望
4.7.2 消費後再生プラスチックの地域別世界市場
4.8 PESTLE分析
4.8.1 政治的要因
4.8.2 経済的要因
4.4.3 社会的要因
4.8.3 技術的要因
4.8.4 環境要因
4.9 SWOT分析
4.9.1 市場の強み
4.9.2 市場の弱点
4.9.3 市場の好機
4.9.4 市場の脅威
5 世界のポストコンシューマーリサイクルプラスチック市場分析:カテゴリー別
5.1 主な調査結果
5.2 ポストコンシューマーリサイクルプラスチックの世界市場魅力度指数:カテゴリー別
5.3 ポストコンシューマーリサイクルプラスチックの世界におけるカテゴリー別市場シェア
5.4 ボトル・フィルム系プラスチックセグメント
5.5 ボトル・フィルムプラスチックの世界市場規模予測、2023-2033 (US$Mn)
5.6 ボトル・フィルムプラスチックの世界地域別市場規模推計・予測、2023-2033 (US$Mn)
5.7 非ボトル用硬質プラスチック
5.8 非ボトル用硬質プラスチックの世界市場規模予測,2023-2033 (US$Mn)
5.9 ボトル・フィルム用プラスチックの世界市場規模推計と地域別予測、2023-2033 (US$Mn)
5.10 ポストコンシューマーリサイクルプラスチックの世界市場規模推計とカテゴリー別予測,2023-2033 (US$Mn)
6 世界のポストコンシューマーリサイクルプラスチック市場分析:加工別
6.1 主要な調査結果
6.1.1 ポストコンシューマーリサイクルプラスチックの世界市場規模推計と加工別予測(2023-2033年)(US$Mn)
6.1.2 ポストコンシューマーリサイクルプラスチックの世界市場:加工別
6.1.3 世界のポストコンシューマーリサイクルプラスチック市場加工別シェア
6.2 機械加工セグメント
6.2.1 機械加工プラスチックの世界市場規模予測、2023-2033 (US$Mn)
6.2.2 機械加工用プラスチックの世界市場規模予測・地域別予測、2023-2033 (US$Mn)
6.3 バイオロジカルプロセッシングセグメント
6.3.1 バイオロジカルプロセッシングの世界市場規模推計予測,2023-2033 (US$Mn)
6.3.2 バイオロジカルプロセッシングの世界市場規模推計と地域別予測、2023-2033年 (US$Mn)
6.4 ケミカルプロセッシング分野
6.4.1 化学処理の世界市場規模予測・予測、2023年~2033年 (US$Mn)
6.4.2 化学処理の世界市場規模推計と地域別予測、2023-2033年 (US$Mn)
7 世界のポストコンシューマーリサイクルプラスチック市場分析:サービス別
7.1 主要な調査結果
7.1.1 サービス別ポストコンシューマーリサイクルプラスチックの世界市場
7.1.2 サービス別ポストコンシューマーリサイクルプラスチックの世界市場シェア
7.1.3 2023-2033年におけるポストコンシューマーリサイクルプラスチックのサービス別世界市場規模の推定と予測(US$Mn)
7.2 回収・輸送セグメント
7.2.1 収集・輸送用プラスチックの世界市場規模予測・予測,2023-2033 (US$Mn)
7.2.2 収集・輸送の世界地域別市場規模予測・予測、2023-2033年 (US$Mn)
7.3 リサイクルサービスセグメント
7.3.1 リサイクルサービスの世界市場規模推計予測、2023年〜2033年 (US$Mn)
7.3.2 リサイクルサービスの世界市場規模推計と地域別予測、2023〜2033年(US$Mn)
7.4 焼却サービスセグメント
7.4.1 焼却サービスの世界市場規模予測・予測、2023年~2033年 (US$Mn)
7.4.2 焼却サービスの世界市場規模推計と地域別予測、2023-2033年 (US$Mn)
7.5 埋立処分サービスセグメント
7.5.1 埋立サービスの世界市場規模推計・予測,2023-2033 (US$Mn)
7.5.2 埋立サービスの世界市場規模推計と地域別予測,2023-2033 (US$Mn)
8 世界のポストコンシューマーリサイクルプラスチック市場分析:用途別
8.1 主な調査結果
・ 梱包材には再生材のプラスチックが使用されています。例えば、家庭でリサイクルされたペットボトルは、選別、洗浄、溶解され、ペットボトルや他のアイテムとして再利用される
8.2 ポストコンシューマーリサイクルプラスチックの世界市場魅力度指数:用途別
8.3 世界のポストコンシューマーリサイクルプラスチック市場の用途別シェア
8.4 包装用セグメント
8.4.1 包装用プラスチックの世界市場規模予測、2023-2033 (US$Mn)
8.4.2 包装用プラスチックの世界市場規模推計と地域別予測、2023-2033 (US$Mn)
8.5 建築・建設セグメント
8.5.1 建築・建設の世界市場規模予測・予測,2023-2033 (US$Mn)
8.5.2 建築・建設の世界市場規模推計と地域別予測、2023-2033 (US$Mn)
8.6 車載用セグメント
8.6.1 自動車の世界市場規模予測・予測,2023-2033 (US$Mn)
8.6.2 自動車の世界市場規模推計と地域別予測,2023-2033 (US$Mn)
8.7 エレクトロニクスセグメント
8.7.1 エレクトロニクスの世界市場規模予測・予測,2023-2033 (US$Mn)
8.7.2 エレクトロニクスの世界市場規模予測・地域別予測,2023-2033 (US$Mn)
8.8 その他用途セグメント
8.8.1 その他の用途別の世界市場規模推計と地域別予測,2023-2033 (US$Mn)
9 世界のポストコンシューマーリサイクルプラスチック市場タイプ別分析
9.1 主要な調査結果
9.1.1 ポストコンシューマーリサイクルプラスチックの世界市場魅力度指数:タイプ別
9.1.2 世界のポストコンシューマーリサイクルプラスチック市場のタイプ別魅力度指数
9.1.3 2023-2033年におけるポストコンシューマーリサイクルプラスチックの世界市場規模の推定と予測(US$Mn)
9.2 ポリプロピレン(PP)セグメント
9.2.1 ポリプロピレン(PP)プラスチックの世界市場規模予測・予測,2023-2033 (US$Mn)
9.2.2 ポリプロピレン(PP)の世界市場規模推計と地域別予測、2023-2033 (US$Mn)
9.3 低密度ポリエチレン(LDPE)セグメント
9.3.1 低密度ポリエチレン(LDPE)の世界市場規模推計予測,2023-2033 (US$Mn)
9.3.2 低密度ポリエチレン(LDPE)の世界市場規模予測・地域別予測、2023年~2033年(US$Mn)
9.4 高密度ポリエチレン(HDPE)セグメント
9.4.1 高密度ポリエチレン(HDPE)の世界市場規模推計予測,2023-2033 (US$Mn)
9.4.2 高密度ポリエチレン(HDPE)の世界市場規模推計と地域別予測、2023-2033 (US$Mn)
9.5 ポリ塩化ビニル(PVC)セグメント
9.5.1 ポリ塩化ビニル(PVC)の世界市場規模予測・予測,2023-2033 (US$Mn)
9.5.2 ポリ塩化ビニル(PVC)の世界市場規模推計と地域別予測、2023-2033 (US$Mn)
9.6 ポリエチレンテレフタレート(PET)セグメント
9.6.1 ポリエチレンテレフタレート(PET)の世界市場規模推計と地域別予測,2023-2033 (US$Mn)
9.6.2 世界のポリエチレンテレフタレート(PET)地域別サイズの推定と予測,2023-2033 (US$Mn)
9.7 その他のポリマータイプ
9.7.1 その他のポリマータイプの世界市場規模予測,タイプ別,2023-2033 (US$Mn)
10 世界のポストコンシューマーリサイクルプラスチック市場分析(地域別
10.1 主要な調査結果
10.1.1 世界の消費後再生プラスチック地域別市場
10.1.2 地域別市場規模の推計と予測
11 北米のポストコンシューマーリサイクルプラスチック市場分析
11.1 主な調査結果
11.1.1 北米ポストコンシューマーリサイクルプラスチック市場魅力度指数
11.1.2 北米ポストコンシューマーリサイクルプラスチック国別市場規模予測・予測
11.1.3 北米ポストコンシューマーリサイクルプラスチックのカテゴリー別市場規模予測・予想
11.1.4 北米ポストコンシューマーリサイクルプラスチックの加工別市場規模予測・予想
11.1.5 北米ポストコンシューマーリサイクルプラスチックのサービス別市場規模予測・予測
11.1.6 北米ポストコンシューマーリサイクルプラスチックの用途別市場規模予測・予測
11.1.7 北米ポストコンシューマーリサイクルプラスチックのタイプ別市場規模予測・予想
11.2 アメリカ市場分析
11.3 カナダの市場分析
12 欧州のポストコンシューマーリサイクルプラスチック市場分析
12.1 主要な調査結果
12.1.1 欧州ポストコンシューマーリサイクルプラスチック市場魅力度指数
12.1.2 欧州ポストコンシューマーリサイクルプラスチック国別市場規模予測・予測
12.1.3 欧州ポストコンシューマーリサイクルプラスチック市場規模予測・予測:カテゴリー別
12.1.4 欧州ポストコンシューマーリサイクルプラスチックの加工別市場規模予測・予測
12.1.5 欧州ポストコンシューマーリサイクルプラスチックのサービス別市場規模予測・予測
12.1.6 欧州ポストコンシューマーリサイクルプラスチックの用途別市場規模予測・予測
12.1.7 欧州のポストコンシューマーリサイクルプラスチックの市場規模予測・種類別予測
12.2 ドイツの市場分析
12.3 イギリスの市場分析
12.4 フランスの市場分析
12.5 イタリアの市場分析
12.6 スペインの市場分析
12.7 その他の欧州地域の市場分析
13 アジア太平洋地域のポストコンシューマーリサイクルプラスチック市場分析
13.1 主な調査結果
13.2 アジア太平洋地域のポストコンシューマーリサイクルプラスチック市場の魅力度指数
13.2.1 アジア太平洋地域のポストコンシューマーリサイクルプラスチック市場の国別市場規模予測・予想
13.2.2 アジア太平洋地域のポストコンシューマーリサイクルプラスチック市場のカテゴリー別市場規模予測・予想
13.2.3 アジア太平洋地域のポストコンシューマーリサイクルプラスチック市場の加工別市場規模予測・予想
13.2.4 アジア太平洋地域のポストコンシューマーリサイクルプラスチックのサービス別市場規模予測・予測
13.2.5 アジア太平洋地域のポストコンシューマーリサイクルプラスチック市場の用途別市場規模予測・予測
13.2.6 アジア太平洋地域のポストコンシューマーリサイクルプラスチック市場のタイプ別市場規模予測・予測
13.3 中国市場の分析
13.4 インド市場の分析
13.5 日本の市場分析
13.6 韓国市場の分析
13.7 オーストラリアの市場分析
13.8 その他のアジア太平洋地域の市場分析
14 中東・アフリカのポストコンシューマーリサイクルプラスチック市場分析
14.1 主な調査結果
14.2 中東・アフリカポストコンシューマーリサイクルプラスチック市場の魅力度指数
14.3 中東・アフリカポストコンシューマーリサイクルプラスチック市場の国別市場規模予測・予想
14.3.1 中東・アフリカポストコンシューマーリサイクルプラスチック市場のカテゴリー別市場規模予測・予想
14.3.2 中東・アフリカ:ポストコンシューマーリサイクルプラスチックの加工別市場規模予測・予想
14.3.3 中東・アフリカ:ポストコンシューマーリサイクルプラスチックのサービス別市場規模予測・予想
14.3.4 中東・アフリカ:ポストコンシューマーリサイクルプラスチックの用途別市場規模予測・予測
14.3.5 中東・アフリカのポストコンシューマーリサイクルプラスチックの市場規模予測・タイプ別予測
14.4 南アフリカの市場分析
14.5 サウジアラビアの市場分析
14.6 トルコの市場分析
14.7 その他の中東・アフリカ地域の市場分析
15 ラテンアメリカのポストコンシューマーリサイクルプラスチック市場分析
15.1 主な調査結果
15.2 ラテンアメリカのポストコンシューマーリサイクルプラスチック市場の魅力度指標
15.2.1 ラテンアメリカのポストコンシューマーリサイクルプラスチック市場の国別市場規模予測・予想
15.2.2 ラテンアメリカのポストコンシューマーリサイクルプラスチック市場のカテゴリー別市場規模予測・予想
15.2.3 ラテンアメリカのポストコンシューマーリサイクルプラスチックの市場規模予測・加工別予測
15.2.4 ラテンアメリカのポストコンシューマーリサイクルプラスチック市場のサービス別市場規模予測・予測
15.2.5 ラテンアメリカのポストコンシューマーリサイクルプラスチックの用途別市場規模予測・予想
15.2.6 ラテンアメリカのポストコンシューマーリサイクルプラスチックの市場規模予測・種類別予測
15.3 ブラジル市場の分析
15.4 メキシコの市場分析
15.5 その他のラテンアメリカの市場分析
16 競合他社の状況
16.1 企業シェア分析
16.2 主要な事業戦略分析 - 契約
16.3 主要事業戦略分析 - 協業
16.4 主要事業戦略分析 - 買収
16.5 主要な事業戦略分析 - 契約
16.6 主要事業戦略分析-拡大
16.7 主要事業戦略分析-投資
16.8 主要事業戦略分析-ジョイントベンチャー
16.9 主要事業戦略分析 - 新製品上市
16.10 主要事業戦略分析 - パートナーシップ
17 主要企業のプロフィール
17.1 ヴェオリア・エンバイロメント SA
17.1.1 会社概要
17.1.2 会社概要
17.1.3 財務分析
17.1.3.1 純収益、2017年-2021年
17.1.3.2 売上総利益、2017年-2021年
17.1.3.3 純利益、2017年-2021年
17.1.3.4 ebitda、2017-2021年
17.1.4 製品ベンチマーク
17.1.5 戦略的な展望
17.2 スエズ・エンバイロメント
17.2.1 企業スナップショット
17.2.2 会社概要
17.2.3 財務分析
17.2.3.1 純収益、2017-2021年
17.2.3.2 売上総利益、2017年-2021年
17.2.3.3 純利益、2017年-2021年
17.2.3.4 ebitda、2017-2021年
17.2.4 製品ベンチマーク
17.2.5 戦略的な展望
17.3 廃棄物処理事業者
17.3.1 企業スナップショット
17.3.2 会社概要
17.3.3 財務分析
17.3.3.1 純収益、2017年-2021年
17.3.3.2 売上総利益、2017年-2021年
17.3.3.3 純利益、2017年-2021年
17.3.3.4 ebitda、2017-2021年
17.3.4 戦略的な展望
17.4 1.4 リパブリックサービス社
17.4.1 企業スナップショット
17.4.2 会社概要
17.4.3 財務分析
17.4.3.1 純収益、2017年-2021年
17.4.3.2 売上総利益、2017年-2021年
17.4.3.3 純利益、2017年-2021年
17.4.3.4 ebitda、2017-2021年
17.4.4 戦略的な展望
17.5 ステリサイクル社
17.5.1 企業スナップショット
17.5.2 会社概要
17.5.3 財務分析
17.5.3.1 純収益、2017年-2021年
17.5.3.2 売上総利益、2017年-2021年
17.5.3.3 純利益、2017年-2021年
17.5.3.4 ebitda、2017-2021年
17.5.4 製品ベンチマーク
17.6 Waste Connections, Inc.
17.6.1 企業スナップショット
17.6.2 会社概要
17.6.3 財務分析
17.6.3.1 純収益、2017年-2021年
17.6.3.2 売上総利益、2017年-2021年
17.6.3.3 純利益、2017年-2021年
17.6.3.4 ebitda、2017-2021年
17.6.4 製品ベンチマーク
17.6.5 戦略的な展望
17.7 クリーンハーバーズ社
17.7.1 企業スナップショット
17.7.2 会社概要
17.7.3 財務分析
17.7.3.1 純収益、2017年-2021年
17.7.3.2 売上総利益、2017年-2021年
17.7.3.3 純利益、2017年-2021年
17.7.3.4 ebitda、2017-2021年
17.7.4 製品ベンチマーク
17.7.5 戦略的な展望
17.8 ビファPLC
17.8.1 企業スナップショット
17.8.2 会社概要
17.8.3 製品ベンチマーク
17.8.4 戦略的展望
17.9 DSスミス
17.9.1 企業スナップショット
17.9.2 会社概要
17.9.3 財務分析
17.9.3.1 純収益、2017年-2021年
17.9.3.2 売上総利益、2017年-2021年
17.9.3.3 純利益、2017年-2021年
17.9.3.4 ebitda、2017-2021年
17.9.4 製品ベンチマーク
17.9.5 戦略的な展望
17.10 モンディPLC
17.10.1 企業スナップショット
17.10.2 会社概要
17.10.3 財務分析
17.10.3.1 純収益、2017年-2021年
17.10.3.2 売上総利益、2017年-2021年
17.10.3.3 純利益、2017年-2021年
17.10.3.4 ebitda、2017-2021年
17.10.4 製品ベンチマーク
17.10.5 戦略的な展望
17.11 ベリーグローバルグループ
17.11.1 企業スナップショット
17.11.2 会社概要
17.11.3 財務分析
17.11.3.1 純収益、2017年-2021年
17.11.3.2 売上総利益、2017年-2021年
17.11.3.3 純利益、2017年-2021年
17.11.3.4 ebitda、2017-2021年
17.11.4 戦略的な展望
17.12 ハフタマキ・オイシ
17.12.1 企業スナップショット
17.12.2 会社概要
17.12.3 製品ベンチマーク
17.12.4 戦略的展望
17.13 シールドエアー
17.13.1 企業スナップショット
17.13.2 会社概要
17.13.3 財務分析
17.13.3.1 純収益、2017-2021年
17.13.3.2 売上総利益、2017年-2021年
17.13.3.3 純利益、2017年-2021年
17.13.3.4 ebitda、2017-2021年
17.13.4 製品ベンチマーク
17.13.5 戦略的な展望
17.14 ソノコ・プロダクツ株式会社
17.14.1 企業スナップショット
17.14.2 会社概要
17.14.3 財務分析
17.14.3.1 純収益、2017年-2021年
17.14.3.2 売上総利益、2017年-2021年
17.14.3.3 純利益、2017年-2021年
17.14.3.4 ebitda、2017-2021年
17.14.4 製品ベンチマーク
17.14.5 戦略的な展望
17.15 アムコアPLC
17.15.1 企業スナップショット
17.15.2 会社概要
17.15.3 財務分析
17.15.3.1 純収益、2017年-2021年
17.15.3.2 売上総利益、2017年-2021年
17.15.3.3 純利益、2017年-2021年
17.15.3.4 ebitda、2017-2021年
17.15.4 製品ベンチマーク
17.15.5 戦略的な展望
17.16 スマーフィット・カッパ・グループ・ピーエルシー
17.16.1 企業スナップショット
17.16.2 会社概要
17.16.3 財務分析
17.16.3.1 純収益、2017年-2021年
17.16.3.2 売上総利益、2017年-2021年
17.16.3.3 純利益、2017年-2021年
17.16.3.4 ebitda、2017-2021年
17.16.4 製品ベンチマーク
17.16.5 戦略的な展望
17.17 コベリスグループ
17.17.1 企業スナップショット
17.17.2 会社概要
17.17.3 戦略的展望
17.18 ジェンパック・エルエルシー
17.18.1 企業スナップショット
17.18.2 会社概要
17.18.3 製品ベンチマーク
17.18.4 戦略的展望
17.19 エコ・プロダクツ
17.19.1 企業スナップショット
17.19.2 会社概要
17.19.3 ベンチマーキング
17.19.4 戦略的展望
17.20 プラコン
17.20.1 企業スナップショット
17.20.2 会社概要
17.20.3 製品ベンチマーク
17.20.4 戦略的展望
18 結論と提言
18.1 ビジョンゲインからの結論
18.2 市場関係者への提言
表の一覧
Table 1 Global Post-Consumer Recycled Plastics Market Snapshot, 2023 & 2033 (US$ billion, CAGR %)
Table 2 Global Post-Consumer Recycled Plastic Market Forecast, 2023-2033 (US$ Mn, AGR (%), CAGR (%)) (V-Shaped Recovery Scenario)
Table 3 Global Post-Consumer Recycled Plastic Market by Region, 2023-2033 (US$ Mn, AGR (%), CAGR (%)) (V-Shaped Recovery Scenario)
Table 4 Global Post-Consumer Recycled Plastic Market Forecast, 2023-2033 (US$ Mn, AGR (%), CAGR (%)) (U-Shaped Recovery Scenario)
Table 5 Global Post-Consumer Recycled Plastic Market by Region, 2023-2033 (US$ Mn, AGR (%), CAGR (%)) (U-Shaped Recovery Scenario)
Table 6 Global Post-Consumer Recycled Plastic Market Forecast, 2023-2033 (US$ Mn, AGR (%), CAGR (%)) (W-Shaped Recovery Scenario)
Table 7 Global Post-Consumer Recycled Plastic Market by Region, 2023-2033 (US$ Mn, AGR (%), CAGR (%)) (W-Shaped Recovery Scenario)
Table 8 Global Post-Consumer Recycled Plastic Market Forecast, 2023-2033 (US$ Mn, AGR (%), CAGR (%)) (L-Shaped Recovery Scenario)
Table 9 Global Post-Consumer Recycled Plastic Market by Region, 2023-2033 (US$ Mn, AGR (%), CAGR (%)) (L-Shaped Recovery Scenario)
Table 10 Global Bottles & Films Plastics Market Forecast, 2023-2033 (US$ Mn, AGR (%), CAGR (%))
Table 11 Global Bottles & Films Plastics Market by Region, 2023-2033 (US$ Mn, AGR (%), CAGR (%))
Table 12 Global Non-Bottle Rigid Plastics Market Forecast, 2023-2033 (US$ Mn, AGR (%), CAGR (%))
Table 13 Global Non-Bottle Rigid Plastics Market by Region, 2023-2033 (US$ Mn, AGR (%), CAGR (%))
Table 14 Global Post-Consumer Recycled Plastic Market by Category, 2023-2033 (US$ Mn, AGR (%), CAGR (%))
Table 15 Global Post-Consumer Recycled Plastic Market by Processing, 2023-2033 (US$ Mn, AGR (%), CAGR (%))
Table 16 Global Mechanical Processing Market Forecast, 2023-2033 (US$ Mn, AGR (%), CAGR (%))
Table 17 Global Mechanical Processing Market by Region, 2023-2033 (US$ Mn, AGR (%), CAGR (%))
Table 18 Global Biological Processing Market Forecast, 2023-2033 (US$ Mn, AGR (%), CAGR (%))
Table 19 Global Biological Processing Market by Region, 2023-2033 (US$ Mn, AGR (%), CAGR (%))
Table 20 Global Chemical Processing Market Forecast, 2023-2033 (US$ Mn, AGR (%), CAGR (%))
Table 21 Global Chemical Processing Market by Region, 2023-2033 (US$ Mn, AGR (%), CAGR (%))
Table 22 Global Post-Consumer Recycled Plastic Market by Service, 2023-2033 (US$ Mn, AGR (%), CAGR (%))
Table 23 Global Collection & Transportation Service Market Forecast, 2023-2033 (US$ Mn, AGR (%), CAGR (%))
Table 24 Global Collection & Transportation Service Market by Region, 2023-2033 (US$ Mn, AGR (%), CAGR (%))
Table 25 Global Recycling Service Market Forecast, 2023-2033 (US$ Mn, AGR (%), CAGR (%))
Table 26 Global Recycling Service Market by Region, 2023-2033 (US$ Mn, AGR (%), CAGR (%))
Table 27 Global Incineration Service Market Forecast, 2023-2033 (US$ Mn, AGR (%), CAGR (%))
Table 28 Global Incineration Service Market by Region, 2023-2033 (US$ Mn, AGR (%), CAGR (%))
Table 29 Global Landfill Service Market Forecast, 2023-2033 (US$ Mn, AGR (%), CAGR (%))
Table 30 Global Landfill Service Market by Region, 2023-2033 (US$ Mn, AGR (%), CAGR (%))
Table 31 Global Packaging Market Forecast, 2023-2033 (US$ Mn, AGR (%), CAGR (%))
Table 32 Global Packaging Market by Region, 2023-2033 (US$ Mn, AGR (%), CAGR (%))
Table 33 Global Building & Construction Market Forecast, 2023-2033 (US$ Mn, AGR (%), CAGR (%))
Table 34 Global Building & Construction Market by Region, 2023-2033 (US$ Mn, AGR (%), CAGR (%))
Table 35 Global Automotive Market Forecast, 2023-2033 (US$ Mn, AGR (%), CAGR (%))
Table 36 Global Automotive Market by Region, 2023-2033 (US$ Mn, AGR (%), CAGR (%))
Table 37 Global Electronics Market Forecast, 2023-2033 (US$ Mn, AGR (%), CAGR (%))
Table 38 Global Electronics Market by Region, 2023-2033 (US$ Mn, AGR (%), CAGR (%))
Table 39 Global Other Application Market Forecast, 2023-2033 (US$ Mn, AGR (%), CAGR (%))
Table 40 Global Post-Consumer Recycled Plastic Market by Type, 2023-2033 (US$ Mn, AGR (%), CAGR (%))
Table 41 Global Polypropylene (PP) Market Forecast, 2023-2033 (US$ Mn, AGR (%), CAGR (%))
Table 42 Global Polypropylene (PP) Market by Region, 2023-2033 (US$ Mn, AGR (%), CAGR (%))
Table 43 Global Low-Density Polyethylene (LDPE) Market Forecast, 2023-2033 (US$ Mn, AGR (%), CAGR (%))
Table 44 Global Low-Density Polyethylene (LDPE) Market by Region, 2023-2033 (US$ Mn, AGR (%), CAGR (%))
Table 45 Global High-Density Polyethylene (HDPE) Market Forecast, 2023-2033 (US$ Mn, AGR (%), CAGR (%))
Table 46 Global High-Density Polyethylene (HDPE) Market by Region, 2023-2033 (US$ Mn, AGR (%), CAGR (%))
Table 47 Global Polyvinyl Chloride (PVC) Market Forecast, 2023-2033 (US$ Mn, AGR (%), CAGR (%))
Table 48 Global Polyvinyl Chloride (PVC) Market by Region, 2023-2033 (US$ Mn, AGR (%), CAGR (%))
Table 49 Global Polyethylene Terephthalate (PET) Market Forecast, 2023-2033 (US$ Mn, AGR (%), CAGR (%))
Table 50 Global Polyethylene Terephthalate (PET) Market by Region, 2023-2033 (US$ Mn, AGR (%), CAGR (%))
Table 51 Global Other Polymer Type Market Forecast, 2023-2033 (US$ Mn, AGR (%), CAGR (%))
Table 52 Global Post-Consumer Recycled Plastic Market by Region, 2023-2033 (US$ Mn, AGR (%), CAGR (%))
Table 53 North America Post-Consumer Recycled Plastic Market by Country, 2023-2033 (US$ Mn, AGR (%), CAGR (%))
Table 54 North America Post-Consumer Recycled Plastic Market by Category, 2023-2033 (US$ Mn, AGR (%), CAGR (%))
Table 55 North America Post-Consumer Recycled Plastic Market by Processing, 2023-2033 (US$ Mn, AGR (%), CAGR (%))
Table 56 North America Post-Consumer Recycled Plastic Market by Service, 2023-2033 (US$ Mn, AGR (%), CAGR (%))
Table 57 North America Post-Consumer Recycled Plastic Market by Application, 2023-2033 (US$ Mn, AGR (%), CAGR (%))
Table 58 North America Post-Consumer Recycled Plastic Market by Type, 2023-2033 (US$ Mn, AGR (%), CAGR (%))
Table 59 US Post-Consumer Recycled Plastic Market by Value, 2023-2033 (US$ Mn, AGR (%), CAGR (%))
Table 60 Canada Post-Consumer Recycled Plastic Market by Value, 2023-2033 (US$ Mn, AGR (%), CAGR (%))
Table 61 Europe Post-Consumer Recycled Plastic Market by Country, 2023-2033 (US$ Mn, AGR (%), CAGR (%))
Table 62 Europe Post-Consumer Recycled Plastic Market by Category, 2023-2033 (US$ Mn, AGR (%), CAGR (%))
Table 63 Europe Post-Consumer Recycled Plastic Market by Processing, 2023-2033 (US$ Mn, AGR (%), CAGR (%))
Table 64 Europe Post-Consumer Recycled Plastic Market by Service, 2023-2033 (US$ Mn, AGR (%), CAGR (%))
Table 65 Europe Post-Consumer Recycled Plastic Market by Application, 2023-2033 (US$ Mn, AGR (%), CAGR (%))
Table 66 Europe Post-Consumer Recycled Plastic Market by Type, 2023-2033 (US$ Mn, AGR (%), CAGR (%))
Table 67 Germany Post-Consumer Recycled Plastic Market by Value, 2023-2033 (US$ Mn, AGR (%), CAGR (%))
Table 68 UK Post-Consumer Recycled Plastic Market by Value, 2023-2033 (US$ Mn, AGR (%), CAGR (%))
Table 69 France Post-Consumer Recycled Plastic Market by Value, 2023-2033 (US$ Mn, AGR (%), CAGR (%))
Table 70 Italy Post-Consumer Recycled Plastic Market by Value, 2023-2033 (US$ Mn, AGR (%), CAGR (%))
Table 71 Spain Post-Consumer Recycled Plastic Market by Value, 2023-2033 (US$ Mn, AGR (%), CAGR (%))
Table 72 Rest of Europe Post-Consumer Recycled Plastic Market by Value, 2023-2033 (US$ Mn, AGR (%), CAGR (%))
Table 73 Asia-Pacific Post-Consumer Recycled Plastic Market by Country, 2023-2033 (US$ Mn, AGR (%), CAGR (%))
Table 74 Asia-Pacific Post-Consumer Recycled Plastic Market by Category, 2023-2033 (US$ Mn, AGR (%), CAGR (%))
Table 75 Asia-Pacific Post-Consumer Recycled Plastic Market by Processing, 2023-2033 (US$ Mn, AGR (%), CAGR (%))
Table 76 Asia-Pacific Post-Consumer Recycled Plastic Market by Service, 2023-2033 (US$ Mn, AGR (%), CAGR (%))
Table 77 Asia-Pacific Post-Consumer Recycled Plastic Market by Application, 2023-2033 (US$ Mn, AGR (%), CAGR (%))
Table 78 Asia-Pacific Post-Consumer Recycled Plastic Market by Type, 2023-2033 (US$ Mn, AGR (%), CAGR (%))
Table 79 China Post-Consumer Recycled Plastic Market by Value, 2023-2033 (US$ Mn, AGR (%), CAGR (%))
Table 80 India Post-Consumer Recycled Plastic Market by Value, 2023-2033 (US$ Mn, AGR (%), CAGR (%))
Table 81 Japan Post-Consumer Recycled Plastic Market by Value, 2023-2033 (US$ Mn, AGR (%), CAGR (%))
Table 82 South Korea Post-Consumer Recycled Plastic Market by Value, 2023-2033 (US$ Mn, AGR (%), CAGR (%))
Table 83 Australia Post-Consumer Recycled Plastic Market by Value, 2023-2033 (US$ Mn, AGR (%), CAGR (%))
Table 84 Rest of Asia-Pacific Post-Consumer Recycled Plastic Market by Value, 2023-2033 (US$ Mn, AGR (%), CAGR (%))
Table 85 Middle East & Africa Post-Consumer Recycled Plastic Market by Country, 2023-2033 (US$ Mn, AGR (%), CAGR (%))
Table 86 Middle East & Africa Post-Consumer Recycled Plastic Market by Category, 2023-2033 (US$ Mn, AGR (%), CAGR (%))
Table 87 Middle East & Africa Post-Consumer Recycled Plastic Market by Processing, 2023-2033 (US$ Mn, AGR (%), CAGR (%))
Table 88 Middle East & Africa Post-Consumer Recycled Plastic Market by Service, 2023-2033 (US$ Mn, AGR (%), CAGR (%))
Table 89 Middle East & Africa Post-Consumer Recycled Plastic Market by Application, 2023-2033 (US$ Mn, AGR (%), CAGR (%))
Table 90 Middle East & Africa Post-Consumer Recycled Plastic Market by Type, 2023-2033 (US$ Mn, AGR (%), CAGR (%))
Table 91 South Africa Post-Consumer Recycled Plastic Market by Value, 2023-2033 (US$ Mn, AGR (%), CAGR (%))
Table 92 Saudi Arabia Post-Consumer Recycled Plastic Market by Value, 2023-2033 (US$ Mn, AGR (%), CAGR (%))
Table 93 Turkey Post-Consumer Recycled Plastic Market by Value, 2023-2033 (US$ Mn, AGR (%), CAGR (%))
Table 94 Rest of Middle East & Africa Post-Consumer Recycled Plastic Market by Value, 2023-2033 (US$ Mn, AGR (%), CAGR (%))
Table 95 Latin America Post-Consumer Recycled Plastic Market by Country, 2023-2033 (US$ Mn, AGR (%), CAGR (%))
Table 96 Latin America Post-Consumer Recycled Plastic Market by Category, 2023-2033 (US$ Mn, AGR (%), CAGR (%))
Table 97 Latin America Post-Consumer Recycled Plastic Market by Processing, 2023-2033 (US$ Mn, AGR (%), CAGR (%))
Table 98 Latin America Post-Consumer Recycled Plastic Market by Service, 2023-2033 (US$ Mn, AGR (%), CAGR (%))
Table 99 Latin America Post-Consumer Recycled Plastic Market by Application, 2023-2033 (US$ Mn, AGR (%), CAGR (%))
Table 100 Latin America Post-Consumer Recycled Plastic Market by Type, 2023-2033 (US$ Mn, AGR (%), CAGR (%))
Table 101 Brazil Post-Consumer Recycled Plastic Market by Value, 2023-2033 (US$ Mn, AGR (%), CAGR (%))
Table 102 Mexico Post-Consumer Recycled Plastic Market by Value, 2023-2033 (US$ Mn, AGR (%), CAGR (%))
Table 103 Rest of Latin America Post-Consumer Recycled Plastic Market by Value, 2023-2033 (US$ Mn, AGR (%), CAGR (%))
Table 104 Key Business Strategy Analysis by Agreement
Table 105 Key Business Strategy Analysis by Collaboration
Table 106 Key Business Strategy Analysis by Acquisition
Table 107 Key Business Strategy Analysis by Agreement Contract
Table 108 Key Business Strategy Analysis by Agreement Expansion
Table 109 Key Business Strategy Analysis by Investment
Table 110 Key Business Strategy Analysis by Joint Venture
Table 111 Key Business Strategy Analysis by New Product Launch
Table 112 Key Business Strategy Analysis by Partnership
Table 113 Veolia Environment SA: Key Details, (CEO, HQ, Revenue, Founded, No. of Employees, Company Type, Website, Business Segment)
Table 114 Veolia Environnement SA: Product Benchmarking
Table 115 Veolia Environnement SA: Strategic Outlook
Table 116 Suez Environnement: Key Details, (CEO, HQ, Revenue, Founded, No. of Employees, Company Type, Website, Business Segment)
Table 117 Suez Environnement: Product Benchmarking
Table 118 Suez Environnement: Strategic Outlook
Table 119 Waste Management, Inc: Key Details, (CEO, HQ, Revenue, Founded, No. of Employees, Company Type, Website, Business Segment)
Table 120 Waste Management, Inc: Strategic Outlook
Table 121 Republic Services, Inc: Key Details, (CEO, HQ, Revenue, Founded, No. of Employees, Company Type, Website, Business Segment)
Table 122 Republic Services, Inc: Strategic Outlook
Table 123 Stericycle Inc: Key Details, (CEO, HQ, Revenue, Founded, No. of Employees, Company Type, Website, Business Segment)
Table 124 Stericycle Inc: Product Benchmarking
Table 125 Waste Connections: Key Details, (CEO, HQ, Revenue, Founded, No. of Employees, Company Type, Website, Business Segment)
Table 126 Waste Connections: Product Benchmarking
Table 127 Waste Connections: Strategic Outlook
Table 128 Clean Harbors Inc: Key Details, (CEO, HQ, Revenue, Founded, No. of Employees, Company Type, Website, Business Segment)
Table 129 Clean Harbors Inc: Product Benchmarking
Table 130 Clean Harbors Inc: Strategic Outlook
Table 131 Biffa PLC: Key Details, (CEO, HQ, Revenue, Founded, No. of Employees, Company Type, Website, Business Segment)
Table 132 Biffa PLC: Product Benchmarking
Table 133 Biffa PLC: Strategic Outlook
Table 134 DS Smith plc: Key Details, (CEO, HQ, Revenue, Founded, No. of Employees, Company Type, Website, Business Segment)
Table 135 DS Smith plc: Product Benchmarking
Table 136 DS Smith plc: Strategic Outlook
Table 137 Mondi PLC:: Key Details, (CEO, HQ, Revenue, Founded, No. of Employees, Company Type, Website, Business Segment)
Table 138 Mondi PLC:: Product Benchmarking
Table 139 Mondi PLC:: Strategic Outlook
Table 140 Berry Global Group Inc: Key Details, (CEO, HQ, Revenue, Founded, No. of Employees, Company Type, Website, Business Segment)
Table 141 Berry Global Group Inc: Strategic Outlook
Table 142 Huhtamaki Oyj: Key Details, (CEO, HQ, Revenue, Founded, No. of Employees, Company Type, Website, Business Segment)
Table 143 Huhtamaki Oyj: Product Benchmarking
Table 144 Huhtamaki Oyj: Strategic Outlook
Table 145 Sealed Air Corp: Key Details, (CEO, HQ, Revenue, Founded, No. of Employees, Company Type, Website, Business Segment)
Table 146 Sealed Air Corp: Product Benchmarking
Table 147 Sealed Air Corp: Strategic Outlook
Table 148 Sonoco Products Co: Key Details, (CEO, HQ, Revenue, Founded, No. of Employees, Company Type, Website, Business Segment)
Table 149 Sonoco Products Co: Product Benchmarking
Table 150 Sonoco Products Co: Strategic Outlook
Table 151 Amcor PLC: Key Details, (CEO, HQ, Revenue, Founded, No. of Employees, Company Type, Website, Business Segment)
Table 152 Amcor PLC: Product Benchmarking
Table 153 Amcor PLC: Strategic Outlook
Table 154 Smurfit Kappa Group Plc: Key Details, (CEO, HQ, Revenue, Founded, No. of Employees, Company Type, Website, Business Segment)
Table 155 Smurfit Kappa Group Plc: Product Benchmarking
Table 156 Smurfit Kappa Group Plc: Strategic Outlook
Table 157 Coveris Group: Key Details, (CEO, HQ, Revenue, Founded, No. of Employees, Company Type, Website, Business Segment)
Table 158 Coveris Group: Strategic Outlook
Table 159 Genpak LLC: Key Details, (CEO, HQ, Revenue, Founded, No. of Employees, Company Type, Website, Business Segment)
Table 160 Genpak LLC: Product Benchmarking
Table 161 Genpak LLC: Strategic Outlook
Table 162 Eco-Products Inc: Key Details, (CEO, HQ, Revenue, Founded, No. of Employees, Company Type, Website, Business Segment)
Table 163 Eco-Products Inc: Product Benchmarking
Table 164 Eco-Products Inc: Strategic Outlook
Table 165 Placon Corporation: Key Details, (CEO, HQ, Revenue, Founded, No. of Employees, Company Type, Website, Business Segment)
Table 166 Placon Corporation: Product Benchmarking
Table 167 Placon Corporation: Strategic Outlook
図の一覧
Figure 1 Global Post-Consumer Recycled Plastics Market Segmentation
Figure 2 Breakdown of Primary Interviews: By Company Type, Designation, & Region
Figure 3 Global Post-Consumer Recycled Plastic Market by Region: Market Attractiveness Index
Figure 4 Global Post-Consumer Recycled Plastic Market by Category: Market Attractiveness Index
Figure 5 Global Post-Consumer Recycled Plastic Market by Processing: Market Attractiveness Index
Figure 6 Global Post-Consumer Recycled Plastic Market by Service: Market Attractiveness Index
Figure 7 Global Post-Consumer Recycled Plastic Market by Application: Market Attractiveness Index
Figure 8 Global Post-Consumer Recycled Plastic Market by Type: Market Attractiveness Index
Figure 9 Global Post-Consumer Recycled Plastics Market: Market Dynamics
Figure 10 Global Post-Consumer Recycled Plastic Market Forecast, 2023-2033 (US$ Million) (V-Shaped Recovery Scenario)
Figure 11 Global Post-Consumer Recycled Plastic Market by Region, 2023-2033 (US$ Million) (V-Shaped Recovery Scenario)
Figure 12 Global Post-Consumer Recycled Plastic Market Forecast, 2023-2033 (US$ Million) (U-Shaped Recovery Scenario)
Figure 13 Global Post-Consumer Recycled Plastic Market by Region, 2023-2033 (US$ Million) (U-Shaped Recovery Scenario)
Figure 14 Global Post-Consumer Recycled Plastic Market Forecast, 2023-2033 (US$ Million) (W-Shaped Recovery Scenario)
Figure 15 Global Post-Consumer Recycled Plastic Market by Region, 2023-2033 (US$ Million) (W-Shaped Recovery Scenario)
Figure 16 Global Post-Consumer Recycled Plastic Market Forecast, 2023-2033 (US$ Million) (L-Shaped Recovery Scenario)
Figure 17 Global Post-Consumer Recycled Plastic Market by Region, 2023-2033 (US$ Million) (L-Shaped Recovery Scenario)
Figure 18 PESTLE Analysis
Figure 19 Global Post-Consumer Recycled Plastic Market by Category: Market Attractiveness Index
Figure 20 Global Post-Consumer Recycled Plastic Market by Category: Market Share
Figure 21 Global Bottles & Films Plastics Market Forecast, 2023-2033 (US$ Million)
Figure 22 Global Bottles & Films Plastics Market by Region, 2023-2033 (US$ Million)
Figure 23 Global Non-Bottle Rigid Plastics Market Forecast 2023-2033 (US$ Million)
Figure 24 Global Non-Bottle Rigid Plastics Market by Region 2023-2033 (US$ Million)
Figure 25 Global Post-Consumer Recycled Plastic Market by Category, 2023-2033 (US$ Million)
Figure 26 Global Post-Consumer Recycled Plastic Market by Processing 2023-2033 (US$ Million)
Figure 27 Global Post-Consumer Recycled Plastic Market by Processing: Market Attractiveness Index
Figure 28 Global Post-Consumer Recycled Plastic Market by Processing: Market Share
Figure 29 Global Mechanical Processing Market Forecast 2023-2033 (US$ Million)
Figure 30 Global Mechanical Processing Market by Region, 2023-2033 (US$ Million)
Figure 31 Global Biological Processing Market Forecast, 2023-2033 (US$ Million)
Figure 32 Global Biological Processing Market by Region 2023-2033 (US$ Million)
Figure 33 Global Chemical Processing Market Forecast, 2023-2033 (US$ Million)
Figure 34 Global Chemical Processing Market by Region, 2023-2033 (US$ Million)
Figure 35 Global Post-Consumer Recycled Plastic Market by Service: Market Attractiveness Index
Figure 36 Global Post-Consumer Recycled Plastic Market by Service: Market Share
Figure 37 Global Post-Consumer Recycled Plastic Market by Service, 2023-2033 (US$ Million)
Figure 38 Global Collection & Transportation Service Market Forecast, 2023-2033 (US$ Million)
Figure 39 Global Collection & Transportation Service Market by Region, 2023-2033 (US$ Million)
Figure 40 Global Recycling Service Market Forecast, 2023-2033 (US$ Million)
Figure 41 Global Recycling Service Market by Region, 2023-2033 (US$ Million)
Figure 42 Global Incineration Service Market Forecast, 2023-2033 (US$ Million)
Figure 43 Global Incineration Service Market by Region, 2023-2033 (US$ Million)
Figure 44 Source: Visiongain Reports Ltd., 2022
Figure 45 Global Landfill Service Market Forecast, 2023-2033 (US$ Million)
Figure 46 Global Landfill Service Market by Region, 2023-2033 (US$ Million)
Figure 47 Global Post-Consumer Recycled Plastic Market by Application: Market Attractiveness Index
Figure 48 Global Post-Consumer Recycled Plastic Market by Application: Market Share
Figure 49 Global Packaging Market Forecast, 2023-2033 (US$ Million)
Figure 50 Global Packaging Market by Region, 2023-2033 (US$ Million)
Figure 51 Global Building & Construction Market Forecast, 2023-2033 (US$ Million)
Figure 52 Global Building & Construction Market by Region, 2023-2033 (US$ Million)
Figure 53 Global Automotive Market Forecast, 2023-2033 (US$ Million)
Source: Visiongain Reports Ltd., 2022
Figure 54 Global Automotive Market by Region, 2023-2033 (US$ Million)
Figure 55 Global Electronics Market Forecast, 2023-2033 (US$ Million)
Figure 56 Global Electronics Market by Region, 2023-2033 (US$ Million)
Figure 57 Global Other Application Market Forecast, 2023-2033 (US$ Million)
Figure 58 Global Post-Consumer Recycled Plastic Market by Type: Market Share
Figure 59 Global Post-Consumer Recycled Plastic Market by Type: Market Share
Figure 60 Global Post-Consumer Recycled Plastic Market by Type,, 2023-2033 (US$ Million)
Figure 61 Global Polypropylene (PP) Market Forecast, 2023-2033 (US$ Million)
Figure 62 Global Polypropylene (PP) Market by Region, 2023-2033 (US$ Million)
Figure 63 Global Low-Density Polyethylene (LDPE) Market Forecast, 2023-2033 (US$ Million)
Figure 64 Global Low-Density Polyethylene (LDPE) Market by Region, 2023-2033 (US$ Million)
Figure 65 Global High-Density Polyethylene (HDPE) Market Forecast, 2023-2033 (US$ Million)
Figure 66 Global High-Density Polyethylene (HDPE) Market by Region, 2023-2033 (US$ Million)
Figure 67 Global Polyvinyl Chloride (PVC) Market Forecast, 2023-2033 (US$ Million)
Figure 68 Global Polyvinyl Chloride (PVC) Market by Region, 2023-2033 (US$ Million)
Figure 69 Global Polyethylene Terephthalate (PET) Market Forecast, 2023-2033 (US$ Million)
Figure 70 Global Polyethylene Terephthalate (PET) Market by Region 2023-2033 (US$ Million)
Figure 71 Global Other Polymer Type Market Forecast 2023-2033 (US$ Million)
Figure 72 Global Post-Consumer Recycled Plastic Market by Region: Market Attractiveness Index
Figure 73 Global Post-Consumer Recycled Plastic Market by region: Market Attractiveness Index
Figure 74 Global Post-Consumer Recycled Plastic Market by Region, 2023-2033 (US$ Million)
Figure 75 North America Post-Consumer Recycled Plastic Market: Market Attractiveness Index
Figure 76 North America Post-Consumer Recycled Plastic Market by Country 2023-2033 (US$ Million)
Figure 77 North America Post-Consumer Recycled Plastic Market Share Forecast by Country 2023-2033 (%)
Figure 78 North America Post-Consumer Recycled Plastic Market by Category 2023-2033 (US$ Million)
Figure 79 North America Post-Consumer Recycled Plastic Market Share Forecast by Category 2023-2033 (%)
Figure 80 North America Post-Consumer Recycled Plastic Market by Processing 2023-2033 (US$ Million)
Figure 81 North America Post-Consumer Recycled Plastic Market Share Forecast by Processing 2023-2033 (%)
Figure 82 North America Post-Consumer Recycled Plastic Market by Service 2023-2033 (US$ Million)
Figure 83 North America Post-Consumer Recycled Plastic Market Share Forecast by Service 2023-2033 (%)
Figure 84 North America Post-Consumer Recycled Plastic Market by Application 2023-2033 (US$ Million)
Figure 85 North America Post-Consumer Recycled Plastic Market Share Forecast by Application 2023-2033 (%)
Figure 86 North America Post-Consumer Recycled Plastic Market by Type 2023-2033 (US$ Million)
Figure 87 North America Post-Consumer Recycled Plastic Market Share Forecast by Type 2023-2033 (%)
Figure 88 US Post-Consumer Recycled Plastic Market by Value 2023-2033 (US$ Million)
Figure 89 Canada Post-Consumer Recycled Plastics Market Forecast, 2022-2032 (US$ Million, AGR %)
Figure 90 Europe Post-Consumer Recycled Plastic Market Attractiveness Index
Figure 91 Europe Post-Consumer Recycled Plastic Market by Country 2023-2033 (US$ Million)
Figure 92 Europe Post-Consumer Recycled Plastic Market Share Forecast by Country 2023-2033 (%)
Figure 93 Europe Post-Consumer Recycled Plastic Market by Category 2023-2033 (US$ Million)
Figure 94 Europe Post-Consumer Recycled Plastic Market Share Forecast by Category 2023-2033 (%)
Figure 95 Europe Post-Consumer Recycled Plastic Market by Processing 2023-2033 (US$ Million)
Figure 96 Europe Post-Consumer Recycled Plastic Market Share Forecast by Processing 2023-2033 (%)
Figure 97 Europe Post-Consumer Recycled Plastic Market by Service 2023-2033 (US$ Million)
Figure 98 Europe Post-Consumer Recycled Plastic Market Share Forecast by Service 2023-2033 (%)
Figure 99 Europe Post-Consumer Recycled Plastic Market by Application 2023-2033 (US$ Million)
Figure 100 Europe Post-Consumer Recycled Plastic Market Share Forecast by Application 2023-2033 (%)
Figure 101 Europe Post-Consumer Recycled Plastic Market by Type 2023-2033 (US$ Million)
Figure 102 Europe Post-Consumer Recycled Plastic Market Share Forecast by Type 2023-2033 (%)
Figure 103 Germany Post-Consumer Recycled Plastic Market by Value, 2023-2033 (US$ Million)
Figure 104 UK Post-Consumer Recycled Plastic Market by Value, 2023-2033 (US$ Million)
Figure 105 France Post-Consumer Recycled Plastic Market by Value, 2023-2033 (US$ Million)
Figure 106 Italy Post-Consumer Recycled Plastic Market by Value, 2023-2033 (US$ Million)
Figure 107 Spain Post-Consumer Recycled Plastic Market by Value, 2023-2033 (US$ Million)
Figure 108 Rest of Europe Post-Consumer Recycled Plastic Market by Value, 2023-2033 (US$ Million)
Figure 109 Asia Pacific Post-Consumer Recycled Plastic Market Attractiveness Index
Figure 110 Asia-Pacific Post-Consumer Recycled Plastic Market by Country, 2023-2033 (US$ Million)
Figure 111 Asia Pacific Post-Consumer Recycled Plastic Market Share Forecast by Country 2023-2033 (%)
Figure 112 Asia-Pacific Post-Consumer Recycled Plastic Market by Category, 2023-2033 (US$ Million)
Figure 113 Asia Pacific Post-Consumer Recycled Plastic Market Share Forecast by Category 2023-2033 (%)
Figure 114 Asia-Pacific Post-Consumer Recycled Plastic Market by Processing, 2023-2033 (US$ Million)
Figure 115 Asia Pacific Post-Consumer Recycled Plastic Market Share Forecast by Processing 2023-2033 (%)
Figure 116 Asia-Pacific Post-Consumer Recycled Plastic Market by Service, 2023-2033 (US$ Million)
Figure 117 Asia Pacific Post-Consumer Recycled Plastic Market Share Forecast by Service 2023-2033 (%)
Figure 118 Asia-Pacific Post-Consumer Recycled Plastic Market by Application, 2023-2033 (US$ Million)
Figure 119 Asia Pacific Post-Consumer Recycled Plastic Market Share Forecast by Application 2023-2033 (%)
Figure 120 Asia-Pacific Post-Consumer Recycled Plastic Market by Type, 2023-2033 (US$ Million)
Figure 121 Asia Pacific Post-Consumer Recycled Plastic Market Share Forecast by Type 2023-2033 (%)
Figure 122 China Post-Consumer Recycled Plastic Market by Value, 2023-2033 (US$ Million)
Figure 123 India Post-Consumer Recycled Plastic Market by Value, 2023-2033 (US$ Million)
Figure 124 Japan Post-Consumer Recycled Plastic Market by Value, 2023-2033 (US$ Million)
Figure 125 South Korea Post-Consumer Recycled Plastic Market by Value, 2023-2033 (US$ Million)
Figure 126 Australia Post-Consumer Recycled Plastic Market by Value, 2023-2033 (US$ Million)
Figure 127 Rest of Asia-Pacific Post-Consumer Recycled Plastic Market by Value, 2023-2033 (US$ Million)
Figure 128 MEA Post-Consumer Recycled Plastic Market Attractiveness Index
Figure 129 Middle East & Africa Post-Consumer Recycled Plastic Market by Country, 2023-2033 (US$ Million)
Figure 130 Middle East & Africa Post-Consumer Recycled Plastic Market Share Forecast by Country 2023-2033 (%)
Figure 131 Middle East & Africa Post-Consumer Recycled Plastic Market by Category, 2023-2033 (US$ Million)
Figure 132 Middle East & Africa Post-Consumer Recycled Plastic Market Share Forecast by Category 2023-2033 (%)
Figure 133 Middle East & Africa Post-Consumer Recycled Plastic Market by Processing, 2023-2033 (US$ Million)
Figure 134 Middle East & Africa Post-Consumer Recycled Plastic Market Share Forecast by Processing 2023-2033 (%)
Figure 135 Middle East & Africa Post-Consumer Recycled Plastic Market by Service,, 2023-2033 (US$ Million)
Figure 136 Middle East & Africa Post-Consumer Recycled Plastic Market Share Forecast by Service 2023-2033 (%)
Figure 137 Middle East & Africa Post-Consumer Recycled Plastic Market by Application,, 2023-2033 (US$ Million)
Figure 138 Middle East & Africa Post-Consumer Recycled Plastic Market Share Forecast by Application 2023-2033 (%)
Figure 139 Middle East & Africa Post-Consumer Recycled Plastic Market by Type,, 2023-2033 (US$ Million)
Figure 140 Middle East & Africa Post-Consumer Recycled Plastic Market Share Forecast by Type 2023-2033 (%)
Figure 141 South Africa Post-Consumer Recycled Plastic Market by Value,, 2023-2033 (US$ Million)
Figure 142 Saudi Arabia Post-Consumer Recycled Plastic Market by Value,, 2023-2033 (US$ Million)
Figure 143 Turkey Post-Consumer Recycled Plastic Market by Value,, 2023-2033 (US$ Million)
Figure 144 Rest of Middle East & Africa Post-Consumer Recycled Plastic Market by Value,, 2023-2033 (US$ Million)
Figure 145 Latin America Post-Consumer Recycled Plastic Market Attractiveness Index
Figure 146 Latin America Post-Consumer Recycled Plastic Market by Country,, 2023-2033 (US$ Million)
Figure 147 Latin America Post-Consumer Recycled Plastic Market Share Forecast by Country 2023-2033 (%)
Figure 148 Latin America Post-Consumer Recycled Plastic Market by Category,, 2023-2033 (US$ Million)
Figure 149 Latin America Post-Consumer Recycled Plastic Market Share Forecast by Category 2023-2033 (%)
Figure 150 Latin America Post-Consumer Recycled Plastic Market by Processing,2023-2033 (US$ Million)
Figure 151 Latin America Post-Consumer Recycled Plastic Market Share Forecast by Processing 2023-2033 (%)
Figure 152 Latin America Post-Consumer Recycled Plastic Market by Service,, 2023-2033 (US$ Million)
Figure 153 Latin America Post-Consumer Recycled Plastic Market Share Forecast by Service 2023-2033 (%)
Figure 154 Latin America Post-Consumer Recycled Plastic Market by Application,, 2023-2033 (US$ Million)
Figure 155 Latin America Post-Consumer Recycled Plastic Market Share Forecast by Application 2023-2033 (%)
Figure 156 Latin America Post-Consumer Recycled Plastic Market by Application,, 2023-2033 (US$ Million)
Figure 157 Latin America Post-Consumer Recycled Plastic Market Share Forecast by Type 2023-2033 (%)
Figure 158 Brazil Post-Consumer Recycled Plastic Market by Value,, 2023-2033 (US$ Million)
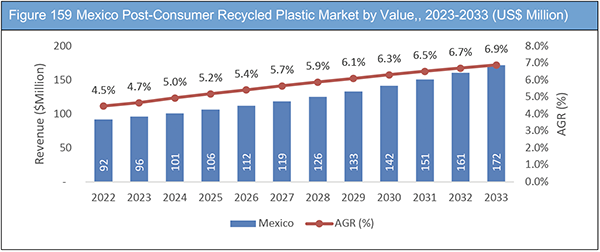
Figure 159 Mexico Post-Consumer Recycled Plastic Market by Value,, 2023-2033 (US$ Million)
Figure 160 Rest of Latin America Post-Consumer Recycled Plastic Market by Value 2023-2033 (US$ Million)
Figure 161 Global Post-Consumer Recycled Plastics Market: Company Share Analysis, 2021
Figure 1 Veolia Environnement SA: Net Revenue, 2017-2021 (US$ Million, AGR%)
Figure 2 Veolia Environnement SA: Gross Profit, 2017-2021 (US$ Million, AGR%)
Figure 162 Veolia Environnement SA: Net Profit 2017-2021 (US$ Million, AGR%)
Figure 163 Veolia Environnement SA: EBITDA, 2017-2021 (US$ Million, AGR%)
Figure 164 Suez Environnement: Net Revenue, 2017-2021 (US$ Million, AGR%)
Figure 165 Suez Environnement: Gross Profit, 2017-2021 (US$ Million, AGR%)
Figure 166 Suez Environnement: Net Profit 2017-2021 (US$ Million, AGR%)
Figure 167 Suez Environnement: EBITDA, 2017-2021 (US$ Million, AGR%)
Figure 168 Waste Management, Inc: Net Revenue, 2017-2021 (US$ Million, AGR%)
Figure 169 Waste Management, Inc: Gross Profit, 2017-2021 (US$ Million, AGR%)
Figure 170 Waste Management, Inc: Net Profit 2017-2021 (US$ Million, AGR%)
Figure 171 Waste Management, Inc: EBITDA, 2017-2021 (US$ Million, AGR%)
Figure 172 Republic Services, Inc: Net Revenue, 2017-2021 (US$ Million, AGR%)
Figure 173 Republic Services, Inc: Gross Profit, 2017-2021 (US$ Million, AGR%)
Figure 174 Republic Services, Inc: Net Profit 2017-2021 (US$ Million, AGR%)
Figure 175 Republic Services, Inc: EBITDA, 2017-2021 (US$ Million, AGR%)
Figure 176 Stericycle Inc: Net Revenue, 2017-2021 (US$ Million, AGR%)
Figure 177 Stericycle Inc: Gross Profit, 2017-2021 (US$ Million, AGR%)
Figure 178 Stericycle Inc: Net Profit 2017-2021 (US$ Million, AGR%)
Figure 179 Stericycle Inc: EBITDA, 2017-2021 (US$ Million, AGR%)
Figure 180 Waste Connections: Net Revenue, 2017-2021 (US$ Million, AGR%)
Figure 181 Waste Connections: Gross Profit, 2017-2021 (US$ Million, AGR%)
Figure 182 Waste Connections: Net Profit 2017-2021 (US$ Million, AGR%)
Figure 183 Waste Connections: EBITDA, 2017-2021 (US$ Million, AGR%)
Figure 184 Clean Harbors Inc: Net Revenue, 2017-2021 (US$ Million, AGR%)
Figure 185 Clean Harbors Inc: Gross Profit, 2017-2021 (US$ Million, AGR%)
Figure 186 Clean Harbors Inc: Net Profit 2017-2021 (US$ Million, AGR%)
Figure 187 Clean Harbors Inc: EBITDA, 2017-2021 (US$ Million, AGR%)
Figure 188 DS Smith plc: Net Revenue, 2017-2021 (US$ Million, AGR%)
Figure 189 DS Smith plc: Gross Profit, 2017-2021 (US$ Million, AGR%)
Figure 190 DS Smith plc: Net Profit 2017-2021 (US$ Million, AGR%)
Figure 191 DS Smith plc: EBITDA, 2017-2021 (US$ Million, AGR%)
Figure 192 Mondi PLC:: Net Revenue, 2017-2021 (US$ Million, AGR%)
Figure 193 Mondi PLC:Gross Profit, 2017-2021 (US$ Million, AGR%)
Figure 194 Mondi PLC:: Net Profit 2017-2021 (US$ Million, AGR%)
Figure 195 Mondi PLC:: EBITDA, 2017-2021 (US$ Million, AGR%)
Figure 196 Berry Global Group Inc: Net Revenue, 2017-2021 (US$ Million, AGR%)
Figure 197 Berry Global Group Inc: Gross Profit, 2017-2021 (US$ Million, AGR%)
Figure 198 Berry Global Group Inc: Net Profit 2017-2021 (US$ Million, AGR%)
Figure 199 Berry Global Group Inc: EBITDA, 2017-2021 (US$ Million, AGR%)
Figure 200 Sealed Air Corp: Net Revenue, 2017-2021 (US$ Million, AGR%)
Figure 201 Sealed Air Corp: Gross Profit, 2017-2021 (US$ Million, AGR%)
Figure 202 Sealed Air Corp: Net Profit 2017-2021 (US$ Million, AGR%)
Figure 203 Sealed Air Corp: EBITDA, 2017-2021 (US$ Million, AGR%)
Figure 204 Sonoco Products Co: Net Revenue, 2017-2021 (US$ Million, AGR%)
Figure 205 Sonoco Products Co: Gross Profit, 2017-2021 (US$ Million, AGR%)
Figure 206 Sonoco Products Co: Net Profit 2017-2021 (US$ Million, AGR%)
Figure 207 Sonoco Products Co: EBITDA, 2017-2021 (US$ Million, AGR%)
Figure 208 Amcor PLC: Net Revenue, 2017-2021 (US$ Million, AGR%)
Figure 209 Amcor PLC: Gross Profit, 2017-2021 (US$ Million, AGR%)
Figure 210 Amcor PLC: Net Profit 2017-2021 (US$ Million, AGR%)
Figure 211 Amcor PLC: EBITDA, 2017-2021 (US$ Million, AGR%)
Figure 212 Smurfit Kappa Group Plc: Net Revenue, 2017-2021 (US$ Million, AGR%)
Figure 213 Smurfit Kappa Group Plc: Gross Profit, 2017-2021 (US$ Million, AGR%)
Figure 214 Smurfit Kappa Group Plc: Net Profit 2017-2021 (US$ Million, AGR%)
Figure 215 Smurfit Kappa Group Plc: EBITDA, 2017-2021 (US$ Million, AGR%)
ページTOPに戻る
Summary
この調査レポートは世界のポストコンシューマーリサイクルプラスチック市場を調査し、カテゴリー別、加工別、サービス別、用途別、タイプ別、地域別に2023年から2033年までの予測結果を掲載しています。また関連企業情報を提供しています。
主な掲載内容(目次より抜粋)
-
レポート概要
-
エグゼクティブサマリー
-
プレミアムインサイト
-
市場概要
-
世界のポストコンシューマーリサイクルプラスチック市場分析:カテゴリー別
-
世界のポストコンシューマーリサイクルプラスチック市場分析:加工別
-
世界のポストコンシューマーリサイクルプラスチック市場分析:サービス別
-
世界のポストコンシューマーリサイクルプラスチック市場分析:用途別
-
世界のポストコンシューマーリサイクルプラスチック市場分析:タイプ別
-
世界のポストコンシューマーリサイクルプラスチック市場分析:地域別
-
北米のポストコンシューマーリサイクルプラスチック市場分析
-
欧州のポストコンシューマーリサイクルプラスチック市場分析
-
アジア太平洋地域のポストコンシューマーリサイクルプラスチック市場分析
-
中東・アフリカのポストコンシューマーリサイクルプラスチック市場分析
-
ラテンアメリカのポストコンシューマーリサイクルプラスチック市場分析
-
競争状況
-
主要企業のプロフィール
Report Details
The Post-Consumer Recycled Plastic Market Report 2023-2033: This report will prove invaluable to leading firms striving for new revenue pockets if they wish to better understand the industry and its underlying dynamics. It will be useful for companies that would like to expand into different industries or to expand their existing operations in a new region.
Plastics Recycling Is an Important Component of the Circular Economy
Plastics recycling is an important component of the circular economy because mechanical recycled materials obtained from post-consumer goods can be converted into new products frequently substituting virgin plastics after explicit technological steps (like grinding, washing, separating, drying, re-granulating and compounding). Because thermoplastic polymers are generally non-miscible, recycled blends derived from various post-consumer polymeric goods will always have poor mechanical properties, rendering mechanical recycled materials unsuitable for many applications at first glance. As a result, without a good separation per polymer or at least per polymer group, or without a good compatibilization solution, mechanical recycled materials may be impossible and far from what they can be.
Innovative Packaging Is Helping to Reduce Waste Plastic and Keep it in the Supply Chain
Plastic packaging has many amazing properties. It keeps our food fresh and liquids from getting soggy. It can also be moulded into a variety of shapes and, unlike glass, does not shatter if dropped. However, one of the qualities that makes it so useful – its durability – also means that it takes approximately 450 years to biodegrade. It is therefore critical that we reuse, redesign, and recycle plastic packaging so that it does not end up buried in landfills or clog our oceans for centuries to come.
What Questions Should You Ask before Buying a Market Research Report?
• How is the post-consumer recycled plastic market evolving?
• What is driving and restraining the post-consumer recycled plastic market?
• How will each post-consumer recycled plastic submarket segment grow over the forecast period and how much revenue will these submarkets account for in 2033?
• How will the market shares for each post-consumer recycled plastic submarket develop from 2023 to 2033?
• What will be the main driver for the overall market from 2023 to 2033?
• Will leading post-consumer recycled plastic markets broadly follow the macroeconomic dynamics, or will individual national markets outperform others?
• How will the market shares of the national markets change by 2033 and which geographical region will lead the market in 2033?
• Who are the leading players and what are their prospects over the forecast period?
• What are the post-consumer recycled plastic projects for these leading companies?
• How will the industry evolve during the period between 2023 and 2033? What are the implications of post-consumer recycled plastic projects taking place now and over the next 10 years?
• Is there a greater need for product commercialisation to further scale the post-consumer recycled plastic market?
• Where is the post-consumer recycled plastic market heading and how can you ensure you are at the forefront of the market?
• What are the best investment options for new product and service lines?
• What are the key prospects for moving companies into a new growth path and C-suite?
You need to discover how this will impact the post-consumer recycled plastic market today, and over the next 10 years:
• Our 385-page report provides 167 tables and 215 charts/graphs exclusively to you.
• The report highlights key lucrative areas in the industry so you can target them – NOW.
• It contains in-depth analysis of global, regional and national sales and growth.
• It highlights for you the key successful trends, changes and revenue projections made by your competitors.
This report tells you TODAY how the post-consumer recycled plastic market will develop in the next 10 years, and in line with the variations in COVID-19 economic recession and bounce. This market is more critical now than at any point over the last 10 years.
Forecasts to 2033 and other analyses reveal commercial prospects
• In addition to revenue forecasting to 2033, our new study provides you with recent results, growth rates, and market shares.
• You will find original analyses, with business outlooks and developments.
• Discover qualitative analyses (including market dynamics, drivers, opportunities, restraints and challenges), cost structure, impact of rising post-consumer recycled plastic prices and recent developments.
This report includes data analysis and invaluable insight into how COVID-19 will affect the industry and your company. Four COVID-19 recovery patterns and their impact, namely, “V”, “L”, “W” and “U” are discussed in this report.
Segments Covered in the Report
Market Segment by Category
• Bottles & Films Plastics
• Non-Bottle Rigid Plastics
Market Segment by Processing
• Mechanical Processing
• Chemical Processing
• Biological Processing
Market Segment by Service
• Collection & Transportation Service
• Recycling Service
• Incineration Service
• Landfill Service
Market Segment by Application
• Packaging
• Building & Construction
• Automotive
• Electronics
• Other Application
Market Segment by Type
• Polypropylene (PP)
• Low-Density Polyethylene (LDPE)
• High-Density Polyethylene (HDPE)
• PolyVinyl Chloride (PVC)
• Polyethylene Terephthalate (PET)
• Other Polymer Type
In addition to the revenue predictions for the overall world market and segments, you will also find revenue forecasts for four regional and 20 leading national markets:
North America
• U.S.
• Canada
Europe
• Germany
• Spain
• United Kingdom
• France
• Italy
• Rest of Europe
Asia Pacific
• China
• Japan
• India
• Australia
• South Korea
• Rest of Asia Pacific
Latin America
• Brazil
• Mexico
• Rest of Latin America
Middle East & Africa
• Turkey
• Saudi Arabia
• South Africa
• Rest of Middle East & Africa
The report also includes profiles and for some of the leading companies in the Post-Consumer Recycled Plastic Market, 2023 to 2033, with a focus on this segment of these companies’ operations.
Leading companies and the potential for market growth
• Amcor PLC
• Berry Global Group, Inc.
• Biffa PLC
• Clean Harbors, Inc.
• Coveris Group
• DS Smith plc
• Eco-Products Inc.
• Genpak LLC
• Huhtamaki Oyj
• Mondi PLC
• Placon Corporation
• Republic Services, Inc.
• Sealed Air Corporation
• Smurfit Kappa Group Plc
• Sonoco Products Co.
• Stericycle Inc.
• Suez Environnement
• Veolia Environment SA
• Waste Connections, Inc.
• Waste Management, Inc.
Overall world revenue for Post-Consumer Recycled Plastic Market, 2023 to 2033 in terms of value the market will surpass US$17,457 million in 2023, our work calculates. We predict strong revenue growth through to 2033. Our work identifies which organizations hold the greatest potential. Discover their capabilities, progress, and commercial prospects, helping you stay ahead.
How will the Post-Consumer Recycled Plastic Market, 2023 to 2033 report help you?
In summary, our 380+ page report provides you with the following knowledge:
• Revenue forecasts to 2033 for Post-Consumer Recycled Plastic Market, 2023 to 2033 Market, with forecasts for category, processing, services, application, type and company size, each forecast at a global and regional level – discover the industry’s prospects, finding the most lucrative places for investments and revenues.
• Revenue forecasts to 2033 for four regional and 20 key national markets – See forecasts for the Post-Consumer Recycled Plastic Market, 2023 to 2033 market in North America, Europe, Asia-Pacific and LAMEA. Also forecasted is the market in the US, Canada, Mexico, Brazil, Germany, France, UK, Italy, China, India, Japan, and Australia among other prominent economies.
• Prospects for established firms and those seeking to enter the market – including company profiles for 20 of the major companies involved in the Post-Consumer Recycled Plastic Market, 2023 to 2033.
Find quantitative and qualitative analyses with independent predictions. Receive information that only our report contains, staying informed with invaluable business intelligence.
Information found nowhere else
With our new report, you are less likely to fall behind in knowledge or miss out on opportunities. See how our work could benefit your research, analyses, and decisions. Visiongain’s study is for everybody needing commercial analyses for the Post-Consumer Recycled Plastic Market, 2023 to 2033, market-leading companies. You will find data, trends and predictions.
ページTOPに戻る
Table of Contents
Table of Contents
1. Report Overview
1.1 Objectives of the Study
1.2 Introduction to Post-Consumer Recycled Plastics Market
1.3 What This Report Delivers
1.4 Why You Should Read This Report
1.5 Key Questions Answered By This Analytical Report Include:
1.6 Who is This Report for?
1.7 Methodology
1.7.1 Market Definitions
1.7.2 Market Evaluation & Forecasting Methodology
1.7.3 Data Validation
1.7.3.1 Primary Research
1.7.3.2 Secondary Research
1.8 Frequently Asked Questions (FAQs)
1.9 Associated Visiongain Reports
1.10 About Visiongain
2 Executive Summary
3 Premium Insights
3.1 Global Post-Consumer Recycled Plastics Market by Region
3.2 Global Post-Consumer Recycled Plastic Market by Category
3.3 Global Post-Consumer Recycled Plastic Market by Processing
3.4 Global Post-Consumer Recycled Plastic Market by Service
3.5 Global Post-Consumer Recycled Plastic Market by Application
3.6 Global Post-Consumer Recycled Plastic Market by Type
4 Market Overview
4.1 Key Findings
4.2 Market Dynamics
4.2.1 Market Driving Factors
4.2.1.1 Innovative Packaging Is Helping to Reduce Waste Plastic and Keep it in the Supply Chain
4.2.1.2 Recycling and Sustainability Are Being Aided by Artificial Intelligence and Robots in the Business World
4.2.1.3 Plastics with Recycled Content Are Being Mandated by Governments
4.2.1.4 Carbon Footprint Reduction
4.2.2 Market Restraining Factors
4.2.2.1 Recycling Plastic Can Be Hazardous to the Environment
4.2.2.2 Plastic Products cannot be Recycled Indefinitely
4.2.2.3 Plastic Waste's Impact on Public Health
4.2.2.4 Plastic Waste Management Strategies
4.2.3 Market Opportunities
4.2.3.1 Reusing Plastic Waste could become a Significant Source of Profit for Chemical Companies
4.2.3.2 Post-Pandemic Recycled Fibre
4.2.3.3 Plastics Are Repurposed Rather than Recycled
4.2.3.4 Plastic Waste Management Plans
4.3 COVID-19 Impact Analysis
4.4 “V-Shaped Recovery”
4.4.1 Global Post-Consumer Recycled Plastic Market Forecast
4.4.2 Global Post-Consumer Recycled Plastic Market by Region
4.5 “U-Shaped Recovery”
4.5.1 Global Post-Consumer Recycled Plastic Market Forecast
4.5.2 Global Post-Consumer Recycled Plastic Market Forecast by Region
4.6 “W-Shaped Recovery”
4.6.1 Global Post-Consumer Recycled Plastic Market Forecast
4.6.2 Global Post-Consumer Recycled Plastic Market by Region
4.7 “L-Shaped Recovery”
4.7.1 Global Post-Consumer Recycled Plastic Market Forecast
4.7.2 Global Post-Consumer Recycled Plastic Market by Region
4.8 PESTLE Analysis
4.8.1 Political Factors
4.8.2 Economic Factors
4.4.3 Social Factors
4.8.3 Technology Factors
4.8.4 Environmental Factors
4.9 SWOT Analysis
4.9.1 Market Strengths
4.9.2 Market Weaknesses
4.9.3 Market Opportunities
4.9.4 Market Threats
5 Global Post-Consumer Recycled Plastics Market Analysis by Category
5.1 Key Findings
5.2 Global Post-Consumer Recycled Plastic Market Attractiveness Index by Category
5.3 Global Post-Consumer Recycled Plastic Market Share by Category
5.4 Bottles and Films Plastics Segment
5.5 Global Bottles & Films Plastics Market Size Estimation Forecast, 2023-2033 (US$Mn)
5.6 Global Bottles & Films Plastics Market Size Estimation and Forecast by Region,2023-2033 (US$Mn)
5.7 Non-Bottles Rigid Plastics
5.8 Global Non-Bottles Rigid Plastics Market Size Estimation Forecast, 2023-2033 (US$Mn)
5.9 Global Bottles & Films Plastics Market Size Estimation and Forecast by Region,2023-2033 (US$Mn)
5.10 Global Post-Consumer Recycled Plastic Market Size Estimation and Forecast by Category,2023-2033 (US$Mn)
6 Global Post-Consumer Recycled Plastics Market Analysis by Processing
6.1 Key Findings
6.1.1 Global Post-Consumer Recycled Plastic Market Size Estimation and Forecast by Processing, 2023-2033 (US$Mn)
6.1.2 Global Post-Consumer Recycled Plastic Market by Processing
6.1.3 Global Post-Consumer Recycled Plastic Market Share by Processing
6.2 Mechanical Processing Segment
6.2.1 Global Mechanical Processing Plastics Market Size Estimation Forecast, 2023-2033 (US$Mn)
6.2.2 Global Mechanical Processing Market Size Estimation and Forecast by Region,2023-2033 (US$Mn)
6.3 Biological Processing Segment
6.3.1 Global Biological Processing Market Size Estimation Forecast, 2023-2033 (US$Mn)
6.3.2 Global Biological Processing Market Size Estimation and Forecast by Region, 2023-2033 (US$Mn)
6.4 Chemical Processing Segment
6.4.1 Global Chemical Processing Market Size Estimation Forecast, 2023-2033 (US$Mn)
6.4.2 Global Chemical Processing Market Size Estimation and Forecast by Region, 2023-2033 (US$Mn)
7 Global Post-Consumer Recycled Plastics Market Analysis by Service
7.1 Key Findings
7.1.1 Global Post-Consumer Recycled Plastic Market by Service
7.1.2 Global Post-Consumer Recycled Plastic Market Share by Service
7.1.3 Global Post-Consumer Recycled Plastic Market Size Estimation and Forecast by Service,2023-2033 (US$Mn)
7.2 Collection & Transportation Segment
7.2.1 Global Collection & Transportation Plastics Market Size Estimation Forecast, 2023-2033 (US$Mn)
7.2.2 Global Collection & Transportation Market Size Estimation and Forecast by Region,2023-2033 (US$Mn)
7.3 Recycling Service Segment
7.3.1 Global Recycling Service Market Size Estimation Forecast, 2023-2033 (US$Mn)
7.3.2 Global Recycling Service Market Size Estimation and Forecast by Region, 2023-2033 (US$Mn)
7.4 Incineration Service Segment
7.4.1 Global Incineration Service Market Size Estimation Forecast, 2023-2033 (US$Mn)
7.4.2 Global Incineration Service Market Size Estimation and Forecast by Region,2023-2033 (US$Mn)
7.5 Landfill Service Segment
7.5.1 Global Landfill Service Market Size Estimation Forecast, 2023-2033 (US$Mn)
7.5.2 Global Landfill Service Market Size Estimation and Forecast by Region,2023-2033 (US$Mn)
8 Global Post-Consumer Recycled Plastics Market Analysis by Application
8.1 Key Findings
• Plastic from recycled materials is used in packaging. Plastic bottles, for example, that are recycled at home are sorted, cleaned, melted, and repurposed as plastic bottles or other items.
8.2 Global Post-Consumer Recycled Plastic Market Attractiveness Index by Application
8.3 Global Post-Consumer Recycled Plastic Market Share by Application
8.4 Packaging Segment
8.4.1 Global Packaging Plastics Market Size Estimation Forecast, 2023-2033 (US$Mn)
8.4.2 Global Packaging Market Size Estimation and Forecast by Region,2023-2033 (US$Mn)
8.5 Building & Construction Segment
8.5.1 Global Building & Construction Market Size Estimation Forecast, 2023-2033 (US$Mn)
8.5.2 Global Building & Construction Market Size Estimation and Forecast by Region,2023-2033 (US$Mn)
8.6 Automotive Segment
8.6.1 Global Automotive Market Size Estimation Forecast, 2023-2033 (US$Mn)
8.6.2 Global Automotive Market Size Estimation and Forecast by Region,2023-2033 (US$Mn)
8.7 Electronics Segment
8.7.1 Global Electronics Market Size Estimation Forecast, 2023-2033 (US$Mn)
8.7.2 Global Electronics Market Size Estimation and Forecast by Region,2023-2033 (US$Mn)
8.8 Other Application Segment
8.8.1 Global Other Application Size Estimation and Forecast by,2023-2033 (US$Mn)
9 Global Post-Consumer Recycled Plastics Market Analysis by Type
9.1 Key Findings
9.1.1 Global Post-Consumer Recycled Plastic Market Attractiveness Index by Type
9.1.2 Global Post-Consumer Recycled Plastic Market Attractiveness Index by Type
9.1.3 Global Post-Consumer Recycled Plastic Market Size Estimation and Forecast by Type,2023-2033 (US$Mn)
9.2 Polypropylene (PP) Segment
9.2.1 Global Polypropylene (PP) Plastics Market Size Estimation Forecast, 2023-2033 (US$Mn)
9.2.2 Global Polypropylene (PP) Market Size Estimation and Forecast by Region,2023-2033 (US$Mn)
9.3 Low-Density Polyethylene (LDPE) Segment
9.3.1 Global Low-Density Polyethylene (LDPE) Market Size Estimation Forecast, 2023-2033 (US$Mn)
9.3.2 Global Low-Density Polyethylene (LDPE) Market Size Estimation and Forecast by Region,2023-2033 (US$Mn)
9.4 High-Density Polyethylene (HDPE) Segment
9.4.1 Global High-Density Polyethylene (HDPE) Market Size Estimation Forecast, 2023-2033 (US$Mn)
9.4.2 Global High-Density Polyethylene (HDPE) Market Size Estimation and Forecast by Region,2023-2033 (US$Mn)
9.5 Polyvinyl Chloride (PVC) Segment
9.5.1 Global Polyvinyl Chloride (PVC) Market Size Estimation Forecast, 2023-2033 (US$Mn)
9.5.2 Global Polyvinyl Chloride (PVC) Market Size Estimation and Forecast by Region,2023-2033 (US$Mn)
9.6 Polyethylene Terephthalate (PET) Segment
9.6.1 Global Polyethylene Terephthalate (PET) Size Estimation and Forecast by,2023-2033 (US$Mn)
9.6.2 Global Polyethylene Terephthalate (PET) Size Estimation and Forecast by Region,2023-2033 (US$Mn)
9.7 Other Polymer Type
9.7.1 Global Other Polymer Type Market Size Estimation Forecast by Type,2023-2033 (US$Mn)
10 Global Post-Consumer Recycled Plastics Market Analysis by Region
10.1 Key Findings
10.1.1 Global Post-Consumer Recycled Plastic Market by Region
10.1.2 Regional Market Size Estimation and Forecast
11 North America Post-Consumer Recycled Plastics Market Analysis
11.1 Key Findings
11.1.1 North America Post-Consumer Recycled Plastics Market Attractiveness Index
11.1.2 North America Post-Consumer Recycled Plastics Market Size Estimation and Forecast by Country
11.1.3 North America Post-Consumer Recycled Plastics Market Size Estimation and Forecast by Category
11.1.4 North America Post-Consumer Recycled Plastics Market Size Estimation and Forecast by Processing
11.1.5 North America Post-Consumer Recycled Plastics Market Size Estimation and Forecast by Service
11.1.6 North America Post-Consumer Recycled Plastics Market Size Estimation and Forecast by Application
11.1.7 North America Post-Consumer Recycled Plastics Market Size Estimation and Forecast by Type
11.2 U.S. Market Analysis
11.3 Canada Market Analysis
12 Europe Post-Consumer Recycled Plastics Market Analysis
12.1 Key Findings
12.1.1 Europe Post-Consumer Recycled Plastics Market Attractiveness Index
12.1.2 Europe Post-Consumer Recycled Plastics Market Size Estimation and Forecast by Country
12.1.3 Europe Post-Consumer Recycled Plastics Market Size Estimation and Forecast by Category
12.1.4 Europe Post-Consumer Recycled Plastics Market Size Estimation and Forecast by Processing
12.1.5 Europe Post-Consumer Recycled Plastics Market Size Estimation and Forecast by Service
12.1.6 Europe Post-Consumer Recycled Plastics Market Size Estimation and Forecast by Application
12.1.7 Europe Post-Consumer Recycled Plastics Market Size Estimation and Forecast by Type
12.2 Germany Market Analysis
12.3 UK Market Analysis
12.4 France Market Analysis
12.5 Italy Market Analysis
12.6 Spain Market Analysis
12.7 Rest of Europe Market Analysis
13 Asia-Pacific Post-Consumer Recycled Plastics Market Analysis
13.1 Key Findings
13.2 Asia-Pacific Post-Consumer Recycled Plastics Market Attractiveness Index
13.2.1 Asia-Pacific Post-Consumer Recycled Plastics Market Size Estimation and Forecast by Country
13.2.2 Asia-Pacific Post-Consumer Recycled Plastics Market Size Estimation and Forecast by Category
13.2.3 Asia-Pacific Post-Consumer Recycled Plastics Market Size Estimation and Forecast by Processing
13.2.4 Asia-Pacific Post-Consumer Recycled Plastics Market Size Estimation and Forecast by Service
13.2.5 Asia-Pacific Post-Consumer Recycled Plastics Market Size Estimation and Forecast by Application
13.2.6 Asia-Pacific Post-Consumer Recycled Plastics Market Size Estimation and Forecast by Type
13.3 China Market Analysis
13.4 India Market Analysis
13.5 Japan Market Analysis
13.6 South Korea Market Analysis
13.7 Australia Market Analysis
13.8 Rest of Asia-Pacific Market Analysis
14 Middle East & Africa Market Post-Consumer Recycled Plastics Market Analysis
14.1 Key Findings
14.2 Middle East & Africa Post-Consumer Recycled Plastics Market Attractiveness Index
14.3 Middle East & Africa Post-Consumer Recycled Plastics Market Size Estimation and Forecast by Country
14.3.1 Middle East & Africa Post-Consumer Recycled Plastics Market Size Estimation and Forecast by Category
14.3.2 Middle East & Africa Post-Consumer Recycled Plastics Market Size Estimation and Forecast by Processing
14.3.3 Middle East & Africa Post-Consumer Recycled Plastics Market Size Estimation and Forecast by Service
14.3.4 Middle East & Africa Post-Consumer Recycled Plastics Market Size Estimation and Forecast by Application
14.3.5 Middle East & Africa Post-Consumer Recycled Plastics Market Size Estimation and Forecast by Type
14.4 South Africa Market Analysis
14.5 Saudi Arabia Market Analysis
14.6 Turkey Market Analysis
14.7 Rest of Middle East & Africa Market Analysis
15 Latin America Post-Consumer Recycled Plastics Market Analysis
15.1 Key Findings
15.2 Latin America Post-Consumer Recycled Plastics Market Attractiveness Index
15.2.1 Latin America Post-Consumer Recycled Plastics Market Size Estimation and Forecast by Country
15.2.2 Latin America Post-Consumer Recycled Plastics Market Size Estimation and Forecast by Category
15.2.3 Latin America Post-Consumer Recycled Plastics Market Size Estimation and Forecast by Processing
15.2.4 Latin America Post-Consumer Recycled Plastics Market Size Estimation and Forecast by Service
15.2.5 Latin America Post-Consumer Recycled Plastics Market Size Estimation and Forecast by Application
15.2.6 Latin America Post-Consumer Recycled Plastics Market Size Estimation and Forecast by Type
15.3 Brazil Market Analysis
15.4 Mexico Market Analysis
15.5 Rest of Latin America Market Analysis
16 Competitive Landscape
16.1 Company Share Analysis
16.2 Key Business Strategy Analysis – Agreement
16.3 Key Business Strategy Analysis – Collaboration
16.4 Key Business Strategy Analysis – Acquisition
16.5 Key Business Strategy Analysis – Contract
16.6 Key Business Strategy Analysis - Expansion
16.7 Key Business Strategy Analysis – Investment
16.8 Key Business Strategy Analysis – Joint Venture
16.9 Key Business Strategy Analysis – New Product Launch
16.10 Key Business Strategy Analysis – Partnership
17 Company Profiles
17.1 Veolia Environment SA
17.1.1 Company Snapshot
17.1.2 Company Overview
17.1.3 Financial Analysis
17.1.3.1 Net Revenue, 2017-2021
17.1.3.2 Gross Profit, 2017-2021
17.1.3.3 Net Profit, 2017-2021
17.1.3.4 EBITDA, 2017-2021
17.1.4 Product Benchmarking
17.1.5 Strategic Outlook
17.2 Suez Environnement
17.2.1 Company Snapshot
17.2.2 Company Overview
17.2.3 Financial Analysis
17.2.3.1 Net Revenue, 2017-2021
17.2.3.2 Gross Profit, 2017-2021
17.2.3.3 Net Profit, 2017-2021
17.2.3.4 EBITDA, 2017-2021
17.2.4 Product Benchmarking
17.2.5 Strategic Outlook
17.3 Waste Management, Inc
17.3.1 Company Snapshot
17.3.2 Company Overview
17.3.3 Financial Analysis
17.3.3.1 Net Revenue, 2017-2021
17.3.3.2 Gross Profit, 2017-2021
17.3.3.3 Net Profit, 2017-2021
17.3.3.4 EBITDA, 2017-2021
17.3.4 Strategic Outlook
17.4 1.4 Republic Services, Inc
17.4.1 Company Snapshot
17.4.2 Company Overview
17.4.3 Financial Analysis
17.4.3.1 Net Revenue, 2017-2021
17.4.3.2 Gross Profit, 2017-2021
17.4.3.3 Net Profit, 2017-2021
17.4.3.4 EBITDA, 2017-2021
17.4.4 Strategic Outlook
17.5 Stericycle Inc.
17.5.1 Company Snapshot
17.5.2 Company Overview
17.5.3 Financial Analysis
17.5.3.1 Net Revenue, 2017-2021
17.5.3.2 Gross Profit, 2017-2021
17.5.3.3 Net Profit, 2017-2021
17.5.3.4 EBITDA, 2017-2021
17.5.4 Product Benchmarking
17.6 Waste Connections, Inc.
17.6.1 Company Snapshot
17.6.2 Company Overview
17.6.3 Financial Analysis
17.6.3.1 Net Revenue, 2017-2021
17.6.3.2 Gross Profit, 2017-2021
17.6.3.3 Net Profit, 2017-2021
17.6.3.4 EBITDA, 2017-2021
17.6.4 Product Benchmarking
17.6.5 Strategic Outlook
17.7 Clean Harbors, Inc.
17.7.1 Company Snapshot
17.7.2 Company Overview
17.7.3 Financial Analysis
17.7.3.1 Net Revenue, 2017-2021
17.7.3.2 Gross Profit, 2017-2021
17.7.3.3 Net Profit, 2017-2021
17.7.3.4 EBITDA, 2017-2021
17.7.4 Product Benchmarking
17.7.5 Strategic Outlook
17.8 Biffa PLC
17.8.1 Company Snapshot
17.8.2 Company Overview
17.8.3 Product Benchmarking
17.8.4 Strategic Outlook
17.9 DS Smith plc
17.9.1 Company Snapshot
17.9.2 Company Overview
17.9.3 Financial Analysis
17.9.3.1 Net Revenue, 2017-2021
17.9.3.2 Gross Profit, 2017-2021
17.9.3.3 Net Profit, 2017-2021
17.9.3.4 EBITDA, 2017-2021
17.9.4 Product Benchmarking
17.9.5 Strategic Outlook
17.10 Mondi PLC
17.10.1 Company Snapshot
17.10.2 Company Overview
17.10.3 Financial Analysis
17.10.3.1 Net Revenue, 2017-2021
17.10.3.2 Gross Profit, 2017-2021
17.10.3.3 Net Profit, 2017-2021
17.10.3.4 EBITDA, 2017-2021
17.10.4 Product Benchmarking
17.10.5 Strategic Outlook
17.11 Berry Global Group, Inc.
17.11.1 Company Snapshot
17.11.2 Company Overview
17.11.3 Financial Analysis
17.11.3.1 Net Revenue, 2017-2021
17.11.3.2 Gross Profit, 2017-2021
17.11.3.3 Net Profit, 2017-2021
17.11.3.4 EBITDA, 2017-2021
17.11.4 Strategic Outlook
17.12 Huhtamaki Oyj
17.12.1 Company Snapshot
17.12.2 Company Overview
17.12.3 Product Benchmarking
17.12.4 Strategic Outlook
17.13 Sealed Air Corp
17.13.1 Company Snapshot
17.13.2 Company Overview
17.13.3 Financial Analysis
17.13.3.1 Net Revenue, 2017-2021
17.13.3.2 Gross Profit, 2017-2021
17.13.3.3 Net Profit, 2017-2021
17.13.3.4 EBITDA, 2017-2021
17.13.4 Product Benchmarking
17.13.5 Strategic Outlook
17.14 Sonoco Products Co.
17.14.1 Company Snapshot
17.14.2 Company Overview
17.14.3 Financial Analysis
17.14.3.1 Net Revenue, 2017-2021
17.14.3.2 Gross Profit, 2017-2021
17.14.3.3 Net Profit, 2017-2021
17.14.3.4 EBITDA, 2017-2021
17.14.4 Product Benchmarking
17.14.5 Strategic Outlook
17.15 Amcor PLC
17.15.1 Company Snapshot
17.15.2 Company Overview
17.15.3 Financial Analysis
17.15.3.1 Net Revenue, 2017-2021
17.15.3.2 Gross Profit, 2017-2021
17.15.3.3 Net Profit, 2017-2021
17.15.3.4 EBITDA, 2017-2021
17.15.4 Product Benchmarking
17.15.5 Strategic Outlook
17.16 Smurfit Kappa Group Plc
17.16.1 Company Snapshot
17.16.2 Company Overview
17.16.3 Financial Analysis
17.16.3.1 Net Revenue, 2017-2021
17.16.3.2 Gross Profit, 2017-2021
17.16.3.3 Net Profit, 2017-2021
17.16.3.4 EBITDA, 2017-2021
17.16.4 Product Benchmarking
17.16.5 Strategic Outlook
17.17 Coveris Group
17.17.1 Company Snapshot
17.17.2 Company Overview
17.17.3 Strategic Outlook
17.18 Genpak LLC
17.18.1 Company Snapshot
17.18.2 Company Overview
17.18.3 Product Benchmarking
17.18.4 Strategic Outlook
17.19 Eco-Products Inc.
17.19.1 Company Snapshot
17.19.2 Company Overview
17.19.3 Product Benchmarking
17.19.4 Strategic Outlook
17.20 Placon Corporation
17.20.1 Company Snapshot
17.20.2 Company Overview
17.20.3 Product Benchmarking
17.20.4 Strategic Outlook
18 Conclusion and Recommendations
18.1 Concluding Remarks from Visiongain
18.2 Recommendations for Market Players
List of Tables
Table 1 Global Post-Consumer Recycled Plastics Market Snapshot, 2023 & 2033 (US$ billion, CAGR %)
Table 2 Global Post-Consumer Recycled Plastic Market Forecast, 2023-2033 (US$ Mn, AGR (%), CAGR (%)) (V-Shaped Recovery Scenario)
Table 3 Global Post-Consumer Recycled Plastic Market by Region, 2023-2033 (US$ Mn, AGR (%), CAGR (%)) (V-Shaped Recovery Scenario)
Table 4 Global Post-Consumer Recycled Plastic Market Forecast, 2023-2033 (US$ Mn, AGR (%), CAGR (%)) (U-Shaped Recovery Scenario)
Table 5 Global Post-Consumer Recycled Plastic Market by Region, 2023-2033 (US$ Mn, AGR (%), CAGR (%)) (U-Shaped Recovery Scenario)
Table 6 Global Post-Consumer Recycled Plastic Market Forecast, 2023-2033 (US$ Mn, AGR (%), CAGR (%)) (W-Shaped Recovery Scenario)
Table 7 Global Post-Consumer Recycled Plastic Market by Region, 2023-2033 (US$ Mn, AGR (%), CAGR (%)) (W-Shaped Recovery Scenario)
Table 8 Global Post-Consumer Recycled Plastic Market Forecast, 2023-2033 (US$ Mn, AGR (%), CAGR (%)) (L-Shaped Recovery Scenario)
Table 9 Global Post-Consumer Recycled Plastic Market by Region, 2023-2033 (US$ Mn, AGR (%), CAGR (%)) (L-Shaped Recovery Scenario)
Table 10 Global Bottles & Films Plastics Market Forecast, 2023-2033 (US$ Mn, AGR (%), CAGR (%))
Table 11 Global Bottles & Films Plastics Market by Region, 2023-2033 (US$ Mn, AGR (%), CAGR (%))
Table 12 Global Non-Bottle Rigid Plastics Market Forecast, 2023-2033 (US$ Mn, AGR (%), CAGR (%))
Table 13 Global Non-Bottle Rigid Plastics Market by Region, 2023-2033 (US$ Mn, AGR (%), CAGR (%))
Table 14 Global Post-Consumer Recycled Plastic Market by Category, 2023-2033 (US$ Mn, AGR (%), CAGR (%))
Table 15 Global Post-Consumer Recycled Plastic Market by Processing, 2023-2033 (US$ Mn, AGR (%), CAGR (%))
Table 16 Global Mechanical Processing Market Forecast, 2023-2033 (US$ Mn, AGR (%), CAGR (%))
Table 17 Global Mechanical Processing Market by Region, 2023-2033 (US$ Mn, AGR (%), CAGR (%))
Table 18 Global Biological Processing Market Forecast, 2023-2033 (US$ Mn, AGR (%), CAGR (%))
Table 19 Global Biological Processing Market by Region, 2023-2033 (US$ Mn, AGR (%), CAGR (%))
Table 20 Global Chemical Processing Market Forecast, 2023-2033 (US$ Mn, AGR (%), CAGR (%))
Table 21 Global Chemical Processing Market by Region, 2023-2033 (US$ Mn, AGR (%), CAGR (%))
Table 22 Global Post-Consumer Recycled Plastic Market by Service, 2023-2033 (US$ Mn, AGR (%), CAGR (%))
Table 23 Global Collection & Transportation Service Market Forecast, 2023-2033 (US$ Mn, AGR (%), CAGR (%))
Table 24 Global Collection & Transportation Service Market by Region, 2023-2033 (US$ Mn, AGR (%), CAGR (%))
Table 25 Global Recycling Service Market Forecast, 2023-2033 (US$ Mn, AGR (%), CAGR (%))
Table 26 Global Recycling Service Market by Region, 2023-2033 (US$ Mn, AGR (%), CAGR (%))
Table 27 Global Incineration Service Market Forecast, 2023-2033 (US$ Mn, AGR (%), CAGR (%))
Table 28 Global Incineration Service Market by Region, 2023-2033 (US$ Mn, AGR (%), CAGR (%))
Table 29 Global Landfill Service Market Forecast, 2023-2033 (US$ Mn, AGR (%), CAGR (%))
Table 30 Global Landfill Service Market by Region, 2023-2033 (US$ Mn, AGR (%), CAGR (%))
Table 31 Global Packaging Market Forecast, 2023-2033 (US$ Mn, AGR (%), CAGR (%))
Table 32 Global Packaging Market by Region, 2023-2033 (US$ Mn, AGR (%), CAGR (%))
Table 33 Global Building & Construction Market Forecast, 2023-2033 (US$ Mn, AGR (%), CAGR (%))
Table 34 Global Building & Construction Market by Region, 2023-2033 (US$ Mn, AGR (%), CAGR (%))
Table 35 Global Automotive Market Forecast, 2023-2033 (US$ Mn, AGR (%), CAGR (%))
Table 36 Global Automotive Market by Region, 2023-2033 (US$ Mn, AGR (%), CAGR (%))
Table 37 Global Electronics Market Forecast, 2023-2033 (US$ Mn, AGR (%), CAGR (%))
Table 38 Global Electronics Market by Region, 2023-2033 (US$ Mn, AGR (%), CAGR (%))
Table 39 Global Other Application Market Forecast, 2023-2033 (US$ Mn, AGR (%), CAGR (%))
Table 40 Global Post-Consumer Recycled Plastic Market by Type, 2023-2033 (US$ Mn, AGR (%), CAGR (%))
Table 41 Global Polypropylene (PP) Market Forecast, 2023-2033 (US$ Mn, AGR (%), CAGR (%))
Table 42 Global Polypropylene (PP) Market by Region, 2023-2033 (US$ Mn, AGR (%), CAGR (%))
Table 43 Global Low-Density Polyethylene (LDPE) Market Forecast, 2023-2033 (US$ Mn, AGR (%), CAGR (%))
Table 44 Global Low-Density Polyethylene (LDPE) Market by Region, 2023-2033 (US$ Mn, AGR (%), CAGR (%))
Table 45 Global High-Density Polyethylene (HDPE) Market Forecast, 2023-2033 (US$ Mn, AGR (%), CAGR (%))
Table 46 Global High-Density Polyethylene (HDPE) Market by Region, 2023-2033 (US$ Mn, AGR (%), CAGR (%))
Table 47 Global Polyvinyl Chloride (PVC) Market Forecast, 2023-2033 (US$ Mn, AGR (%), CAGR (%))
Table 48 Global Polyvinyl Chloride (PVC) Market by Region, 2023-2033 (US$ Mn, AGR (%), CAGR (%))
Table 49 Global Polyethylene Terephthalate (PET) Market Forecast, 2023-2033 (US$ Mn, AGR (%), CAGR (%))
Table 50 Global Polyethylene Terephthalate (PET) Market by Region, 2023-2033 (US$ Mn, AGR (%), CAGR (%))
Table 51 Global Other Polymer Type Market Forecast, 2023-2033 (US$ Mn, AGR (%), CAGR (%))
Table 52 Global Post-Consumer Recycled Plastic Market by Region, 2023-2033 (US$ Mn, AGR (%), CAGR (%))
Table 53 North America Post-Consumer Recycled Plastic Market by Country, 2023-2033 (US$ Mn, AGR (%), CAGR (%))
Table 54 North America Post-Consumer Recycled Plastic Market by Category, 2023-2033 (US$ Mn, AGR (%), CAGR (%))
Table 55 North America Post-Consumer Recycled Plastic Market by Processing, 2023-2033 (US$ Mn, AGR (%), CAGR (%))
Table 56 North America Post-Consumer Recycled Plastic Market by Service, 2023-2033 (US$ Mn, AGR (%), CAGR (%))
Table 57 North America Post-Consumer Recycled Plastic Market by Application, 2023-2033 (US$ Mn, AGR (%), CAGR (%))
Table 58 North America Post-Consumer Recycled Plastic Market by Type, 2023-2033 (US$ Mn, AGR (%), CAGR (%))
Table 59 US Post-Consumer Recycled Plastic Market by Value, 2023-2033 (US$ Mn, AGR (%), CAGR (%))
Table 60 Canada Post-Consumer Recycled Plastic Market by Value, 2023-2033 (US$ Mn, AGR (%), CAGR (%))
Table 61 Europe Post-Consumer Recycled Plastic Market by Country, 2023-2033 (US$ Mn, AGR (%), CAGR (%))
Table 62 Europe Post-Consumer Recycled Plastic Market by Category, 2023-2033 (US$ Mn, AGR (%), CAGR (%))
Table 63 Europe Post-Consumer Recycled Plastic Market by Processing, 2023-2033 (US$ Mn, AGR (%), CAGR (%))
Table 64 Europe Post-Consumer Recycled Plastic Market by Service, 2023-2033 (US$ Mn, AGR (%), CAGR (%))
Table 65 Europe Post-Consumer Recycled Plastic Market by Application, 2023-2033 (US$ Mn, AGR (%), CAGR (%))
Table 66 Europe Post-Consumer Recycled Plastic Market by Type, 2023-2033 (US$ Mn, AGR (%), CAGR (%))
Table 67 Germany Post-Consumer Recycled Plastic Market by Value, 2023-2033 (US$ Mn, AGR (%), CAGR (%))
Table 68 UK Post-Consumer Recycled Plastic Market by Value, 2023-2033 (US$ Mn, AGR (%), CAGR (%))
Table 69 France Post-Consumer Recycled Plastic Market by Value, 2023-2033 (US$ Mn, AGR (%), CAGR (%))
Table 70 Italy Post-Consumer Recycled Plastic Market by Value, 2023-2033 (US$ Mn, AGR (%), CAGR (%))
Table 71 Spain Post-Consumer Recycled Plastic Market by Value, 2023-2033 (US$ Mn, AGR (%), CAGR (%))
Table 72 Rest of Europe Post-Consumer Recycled Plastic Market by Value, 2023-2033 (US$ Mn, AGR (%), CAGR (%))
Table 73 Asia-Pacific Post-Consumer Recycled Plastic Market by Country, 2023-2033 (US$ Mn, AGR (%), CAGR (%))
Table 74 Asia-Pacific Post-Consumer Recycled Plastic Market by Category, 2023-2033 (US$ Mn, AGR (%), CAGR (%))
Table 75 Asia-Pacific Post-Consumer Recycled Plastic Market by Processing, 2023-2033 (US$ Mn, AGR (%), CAGR (%))
Table 76 Asia-Pacific Post-Consumer Recycled Plastic Market by Service, 2023-2033 (US$ Mn, AGR (%), CAGR (%))
Table 77 Asia-Pacific Post-Consumer Recycled Plastic Market by Application, 2023-2033 (US$ Mn, AGR (%), CAGR (%))
Table 78 Asia-Pacific Post-Consumer Recycled Plastic Market by Type, 2023-2033 (US$ Mn, AGR (%), CAGR (%))
Table 79 China Post-Consumer Recycled Plastic Market by Value, 2023-2033 (US$ Mn, AGR (%), CAGR (%))
Table 80 India Post-Consumer Recycled Plastic Market by Value, 2023-2033 (US$ Mn, AGR (%), CAGR (%))
Table 81 Japan Post-Consumer Recycled Plastic Market by Value, 2023-2033 (US$ Mn, AGR (%), CAGR (%))
Table 82 South Korea Post-Consumer Recycled Plastic Market by Value, 2023-2033 (US$ Mn, AGR (%), CAGR (%))
Table 83 Australia Post-Consumer Recycled Plastic Market by Value, 2023-2033 (US$ Mn, AGR (%), CAGR (%))
Table 84 Rest of Asia-Pacific Post-Consumer Recycled Plastic Market by Value, 2023-2033 (US$ Mn, AGR (%), CAGR (%))
Table 85 Middle East & Africa Post-Consumer Recycled Plastic Market by Country, 2023-2033 (US$ Mn, AGR (%), CAGR (%))
Table 86 Middle East & Africa Post-Consumer Recycled Plastic Market by Category, 2023-2033 (US$ Mn, AGR (%), CAGR (%))
Table 87 Middle East & Africa Post-Consumer Recycled Plastic Market by Processing, 2023-2033 (US$ Mn, AGR (%), CAGR (%))
Table 88 Middle East & Africa Post-Consumer Recycled Plastic Market by Service, 2023-2033 (US$ Mn, AGR (%), CAGR (%))
Table 89 Middle East & Africa Post-Consumer Recycled Plastic Market by Application, 2023-2033 (US$ Mn, AGR (%), CAGR (%))
Table 90 Middle East & Africa Post-Consumer Recycled Plastic Market by Type, 2023-2033 (US$ Mn, AGR (%), CAGR (%))
Table 91 South Africa Post-Consumer Recycled Plastic Market by Value, 2023-2033 (US$ Mn, AGR (%), CAGR (%))
Table 92 Saudi Arabia Post-Consumer Recycled Plastic Market by Value, 2023-2033 (US$ Mn, AGR (%), CAGR (%))
Table 93 Turkey Post-Consumer Recycled Plastic Market by Value, 2023-2033 (US$ Mn, AGR (%), CAGR (%))
Table 94 Rest of Middle East & Africa Post-Consumer Recycled Plastic Market by Value, 2023-2033 (US$ Mn, AGR (%), CAGR (%))
Table 95 Latin America Post-Consumer Recycled Plastic Market by Country, 2023-2033 (US$ Mn, AGR (%), CAGR (%))
Table 96 Latin America Post-Consumer Recycled Plastic Market by Category, 2023-2033 (US$ Mn, AGR (%), CAGR (%))
Table 97 Latin America Post-Consumer Recycled Plastic Market by Processing, 2023-2033 (US$ Mn, AGR (%), CAGR (%))
Table 98 Latin America Post-Consumer Recycled Plastic Market by Service, 2023-2033 (US$ Mn, AGR (%), CAGR (%))
Table 99 Latin America Post-Consumer Recycled Plastic Market by Application, 2023-2033 (US$ Mn, AGR (%), CAGR (%))
Table 100 Latin America Post-Consumer Recycled Plastic Market by Type, 2023-2033 (US$ Mn, AGR (%), CAGR (%))
Table 101 Brazil Post-Consumer Recycled Plastic Market by Value, 2023-2033 (US$ Mn, AGR (%), CAGR (%))
Table 102 Mexico Post-Consumer Recycled Plastic Market by Value, 2023-2033 (US$ Mn, AGR (%), CAGR (%))
Table 103 Rest of Latin America Post-Consumer Recycled Plastic Market by Value, 2023-2033 (US$ Mn, AGR (%), CAGR (%))
Table 104 Key Business Strategy Analysis by Agreement
Table 105 Key Business Strategy Analysis by Collaboration
Table 106 Key Business Strategy Analysis by Acquisition
Table 107 Key Business Strategy Analysis by Agreement Contract
Table 108 Key Business Strategy Analysis by Agreement Expansion
Table 109 Key Business Strategy Analysis by Investment
Table 110 Key Business Strategy Analysis by Joint Venture
Table 111 Key Business Strategy Analysis by New Product Launch
Table 112 Key Business Strategy Analysis by Partnership
Table 113 Veolia Environment SA: Key Details, (CEO, HQ, Revenue, Founded, No. of Employees, Company Type, Website, Business Segment)
Table 114 Veolia Environnement SA: Product Benchmarking
Table 115 Veolia Environnement SA: Strategic Outlook
Table 116 Suez Environnement: Key Details, (CEO, HQ, Revenue, Founded, No. of Employees, Company Type, Website, Business Segment)
Table 117 Suez Environnement: Product Benchmarking
Table 118 Suez Environnement: Strategic Outlook
Table 119 Waste Management, Inc: Key Details, (CEO, HQ, Revenue, Founded, No. of Employees, Company Type, Website, Business Segment)
Table 120 Waste Management, Inc: Strategic Outlook
Table 121 Republic Services, Inc: Key Details, (CEO, HQ, Revenue, Founded, No. of Employees, Company Type, Website, Business Segment)
Table 122 Republic Services, Inc: Strategic Outlook
Table 123 Stericycle Inc: Key Details, (CEO, HQ, Revenue, Founded, No. of Employees, Company Type, Website, Business Segment)
Table 124 Stericycle Inc: Product Benchmarking
Table 125 Waste Connections: Key Details, (CEO, HQ, Revenue, Founded, No. of Employees, Company Type, Website, Business Segment)
Table 126 Waste Connections: Product Benchmarking
Table 127 Waste Connections: Strategic Outlook
Table 128 Clean Harbors Inc: Key Details, (CEO, HQ, Revenue, Founded, No. of Employees, Company Type, Website, Business Segment)
Table 129 Clean Harbors Inc: Product Benchmarking
Table 130 Clean Harbors Inc: Strategic Outlook
Table 131 Biffa PLC: Key Details, (CEO, HQ, Revenue, Founded, No. of Employees, Company Type, Website, Business Segment)
Table 132 Biffa PLC: Product Benchmarking
Table 133 Biffa PLC: Strategic Outlook
Table 134 DS Smith plc: Key Details, (CEO, HQ, Revenue, Founded, No. of Employees, Company Type, Website, Business Segment)
Table 135 DS Smith plc: Product Benchmarking
Table 136 DS Smith plc: Strategic Outlook
Table 137 Mondi PLC:: Key Details, (CEO, HQ, Revenue, Founded, No. of Employees, Company Type, Website, Business Segment)
Table 138 Mondi PLC:: Product Benchmarking
Table 139 Mondi PLC:: Strategic Outlook
Table 140 Berry Global Group Inc: Key Details, (CEO, HQ, Revenue, Founded, No. of Employees, Company Type, Website, Business Segment)
Table 141 Berry Global Group Inc: Strategic Outlook
Table 142 Huhtamaki Oyj: Key Details, (CEO, HQ, Revenue, Founded, No. of Employees, Company Type, Website, Business Segment)
Table 143 Huhtamaki Oyj: Product Benchmarking
Table 144 Huhtamaki Oyj: Strategic Outlook
Table 145 Sealed Air Corp: Key Details, (CEO, HQ, Revenue, Founded, No. of Employees, Company Type, Website, Business Segment)
Table 146 Sealed Air Corp: Product Benchmarking
Table 147 Sealed Air Corp: Strategic Outlook
Table 148 Sonoco Products Co: Key Details, (CEO, HQ, Revenue, Founded, No. of Employees, Company Type, Website, Business Segment)
Table 149 Sonoco Products Co: Product Benchmarking
Table 150 Sonoco Products Co: Strategic Outlook
Table 151 Amcor PLC: Key Details, (CEO, HQ, Revenue, Founded, No. of Employees, Company Type, Website, Business Segment)
Table 152 Amcor PLC: Product Benchmarking
Table 153 Amcor PLC: Strategic Outlook
Table 154 Smurfit Kappa Group Plc: Key Details, (CEO, HQ, Revenue, Founded, No. of Employees, Company Type, Website, Business Segment)
Table 155 Smurfit Kappa Group Plc: Product Benchmarking
Table 156 Smurfit Kappa Group Plc: Strategic Outlook
Table 157 Coveris Group: Key Details, (CEO, HQ, Revenue, Founded, No. of Employees, Company Type, Website, Business Segment)
Table 158 Coveris Group: Strategic Outlook
Table 159 Genpak LLC: Key Details, (CEO, HQ, Revenue, Founded, No. of Employees, Company Type, Website, Business Segment)
Table 160 Genpak LLC: Product Benchmarking
Table 161 Genpak LLC: Strategic Outlook
Table 162 Eco-Products Inc: Key Details, (CEO, HQ, Revenue, Founded, No. of Employees, Company Type, Website, Business Segment)
Table 163 Eco-Products Inc: Product Benchmarking
Table 164 Eco-Products Inc: Strategic Outlook
Table 165 Placon Corporation: Key Details, (CEO, HQ, Revenue, Founded, No. of Employees, Company Type, Website, Business Segment)
Table 166 Placon Corporation: Product Benchmarking
Table 167 Placon Corporation: Strategic Outlook
List of Figures
Figure 1 Global Post-Consumer Recycled Plastics Market Segmentation
Figure 2 Breakdown of Primary Interviews: By Company Type, Designation, & Region
Figure 3 Global Post-Consumer Recycled Plastic Market by Region: Market Attractiveness Index
Figure 4 Global Post-Consumer Recycled Plastic Market by Category: Market Attractiveness Index
Figure 5 Global Post-Consumer Recycled Plastic Market by Processing: Market Attractiveness Index
Figure 6 Global Post-Consumer Recycled Plastic Market by Service: Market Attractiveness Index
Figure 7 Global Post-Consumer Recycled Plastic Market by Application: Market Attractiveness Index
Figure 8 Global Post-Consumer Recycled Plastic Market by Type: Market Attractiveness Index
Figure 9 Global Post-Consumer Recycled Plastics Market: Market Dynamics
Figure 10 Global Post-Consumer Recycled Plastic Market Forecast, 2023-2033 (US$ Million) (V-Shaped Recovery Scenario)
Figure 11 Global Post-Consumer Recycled Plastic Market by Region, 2023-2033 (US$ Million) (V-Shaped Recovery Scenario)
Figure 12 Global Post-Consumer Recycled Plastic Market Forecast, 2023-2033 (US$ Million) (U-Shaped Recovery Scenario)
Figure 13 Global Post-Consumer Recycled Plastic Market by Region, 2023-2033 (US$ Million) (U-Shaped Recovery Scenario)
Figure 14 Global Post-Consumer Recycled Plastic Market Forecast, 2023-2033 (US$ Million) (W-Shaped Recovery Scenario)
Figure 15 Global Post-Consumer Recycled Plastic Market by Region, 2023-2033 (US$ Million) (W-Shaped Recovery Scenario)
Figure 16 Global Post-Consumer Recycled Plastic Market Forecast, 2023-2033 (US$ Million) (L-Shaped Recovery Scenario)
Figure 17 Global Post-Consumer Recycled Plastic Market by Region, 2023-2033 (US$ Million) (L-Shaped Recovery Scenario)
Figure 18 PESTLE Analysis
Figure 19 Global Post-Consumer Recycled Plastic Market by Category: Market Attractiveness Index
Figure 20 Global Post-Consumer Recycled Plastic Market by Category: Market Share
Figure 21 Global Bottles & Films Plastics Market Forecast, 2023-2033 (US$ Million)
Figure 22 Global Bottles & Films Plastics Market by Region, 2023-2033 (US$ Million)
Figure 23 Global Non-Bottle Rigid Plastics Market Forecast 2023-2033 (US$ Million)
Figure 24 Global Non-Bottle Rigid Plastics Market by Region 2023-2033 (US$ Million)
Figure 25 Global Post-Consumer Recycled Plastic Market by Category, 2023-2033 (US$ Million)
Figure 26 Global Post-Consumer Recycled Plastic Market by Processing 2023-2033 (US$ Million)
Figure 27 Global Post-Consumer Recycled Plastic Market by Processing: Market Attractiveness Index
Figure 28 Global Post-Consumer Recycled Plastic Market by Processing: Market Share
Figure 29 Global Mechanical Processing Market Forecast 2023-2033 (US$ Million)
Figure 30 Global Mechanical Processing Market by Region, 2023-2033 (US$ Million)
Figure 31 Global Biological Processing Market Forecast, 2023-2033 (US$ Million)
Figure 32 Global Biological Processing Market by Region 2023-2033 (US$ Million)
Figure 33 Global Chemical Processing Market Forecast, 2023-2033 (US$ Million)
Figure 34 Global Chemical Processing Market by Region, 2023-2033 (US$ Million)
Figure 35 Global Post-Consumer Recycled Plastic Market by Service: Market Attractiveness Index
Figure 36 Global Post-Consumer Recycled Plastic Market by Service: Market Share
Figure 37 Global Post-Consumer Recycled Plastic Market by Service, 2023-2033 (US$ Million)
Figure 38 Global Collection & Transportation Service Market Forecast, 2023-2033 (US$ Million)
Figure 39 Global Collection & Transportation Service Market by Region, 2023-2033 (US$ Million)
Figure 40 Global Recycling Service Market Forecast, 2023-2033 (US$ Million)
Figure 41 Global Recycling Service Market by Region, 2023-2033 (US$ Million)
Figure 42 Global Incineration Service Market Forecast, 2023-2033 (US$ Million)
Figure 43 Global Incineration Service Market by Region, 2023-2033 (US$ Million)
Figure 44 Source: Visiongain Reports Ltd., 2022
Figure 45 Global Landfill Service Market Forecast, 2023-2033 (US$ Million)
Figure 46 Global Landfill Service Market by Region, 2023-2033 (US$ Million)
Figure 47 Global Post-Consumer Recycled Plastic Market by Application: Market Attractiveness Index
Figure 48 Global Post-Consumer Recycled Plastic Market by Application: Market Share
Figure 49 Global Packaging Market Forecast, 2023-2033 (US$ Million)
Figure 50 Global Packaging Market by Region, 2023-2033 (US$ Million)
Figure 51 Global Building & Construction Market Forecast, 2023-2033 (US$ Million)
Figure 52 Global Building & Construction Market by Region, 2023-2033 (US$ Million)
Figure 53 Global Automotive Market Forecast, 2023-2033 (US$ Million)
Source: Visiongain Reports Ltd., 2022
Figure 54 Global Automotive Market by Region, 2023-2033 (US$ Million)
Figure 55 Global Electronics Market Forecast, 2023-2033 (US$ Million)
Figure 56 Global Electronics Market by Region, 2023-2033 (US$ Million)
Figure 57 Global Other Application Market Forecast, 2023-2033 (US$ Million)
Figure 58 Global Post-Consumer Recycled Plastic Market by Type: Market Share
Figure 59 Global Post-Consumer Recycled Plastic Market by Type: Market Share
Figure 60 Global Post-Consumer Recycled Plastic Market by Type,, 2023-2033 (US$ Million)
Figure 61 Global Polypropylene (PP) Market Forecast, 2023-2033 (US$ Million)
Figure 62 Global Polypropylene (PP) Market by Region, 2023-2033 (US$ Million)
Figure 63 Global Low-Density Polyethylene (LDPE) Market Forecast, 2023-2033 (US$ Million)
Figure 64 Global Low-Density Polyethylene (LDPE) Market by Region, 2023-2033 (US$ Million)
Figure 65 Global High-Density Polyethylene (HDPE) Market Forecast, 2023-2033 (US$ Million)
Figure 66 Global High-Density Polyethylene (HDPE) Market by Region, 2023-2033 (US$ Million)
Figure 67 Global Polyvinyl Chloride (PVC) Market Forecast, 2023-2033 (US$ Million)
Figure 68 Global Polyvinyl Chloride (PVC) Market by Region, 2023-2033 (US$ Million)
Figure 69 Global Polyethylene Terephthalate (PET) Market Forecast, 2023-2033 (US$ Million)
Figure 70 Global Polyethylene Terephthalate (PET) Market by Region 2023-2033 (US$ Million)
Figure 71 Global Other Polymer Type Market Forecast 2023-2033 (US$ Million)
Figure 72 Global Post-Consumer Recycled Plastic Market by Region: Market Attractiveness Index
Figure 73 Global Post-Consumer Recycled Plastic Market by region: Market Attractiveness Index
Figure 74 Global Post-Consumer Recycled Plastic Market by Region, 2023-2033 (US$ Million)
Figure 75 North America Post-Consumer Recycled Plastic Market: Market Attractiveness Index
Figure 76 North America Post-Consumer Recycled Plastic Market by Country 2023-2033 (US$ Million)
Figure 77 North America Post-Consumer Recycled Plastic Market Share Forecast by Country 2023-2033 (%)
Figure 78 North America Post-Consumer Recycled Plastic Market by Category 2023-2033 (US$ Million)
Figure 79 North America Post-Consumer Recycled Plastic Market Share Forecast by Category 2023-2033 (%)
Figure 80 North America Post-Consumer Recycled Plastic Market by Processing 2023-2033 (US$ Million)
Figure 81 North America Post-Consumer Recycled Plastic Market Share Forecast by Processing 2023-2033 (%)
Figure 82 North America Post-Consumer Recycled Plastic Market by Service 2023-2033 (US$ Million)
Figure 83 North America Post-Consumer Recycled Plastic Market Share Forecast by Service 2023-2033 (%)
Figure 84 North America Post-Consumer Recycled Plastic Market by Application 2023-2033 (US$ Million)
Figure 85 North America Post-Consumer Recycled Plastic Market Share Forecast by Application 2023-2033 (%)
Figure 86 North America Post-Consumer Recycled Plastic Market by Type 2023-2033 (US$ Million)
Figure 87 North America Post-Consumer Recycled Plastic Market Share Forecast by Type 2023-2033 (%)
Figure 88 US Post-Consumer Recycled Plastic Market by Value 2023-2033 (US$ Million)
Figure 89 Canada Post-Consumer Recycled Plastics Market Forecast, 2022-2032 (US$ Million, AGR %)
Figure 90 Europe Post-Consumer Recycled Plastic Market Attractiveness Index
Figure 91 Europe Post-Consumer Recycled Plastic Market by Country 2023-2033 (US$ Million)
Figure 92 Europe Post-Consumer Recycled Plastic Market Share Forecast by Country 2023-2033 (%)
Figure 93 Europe Post-Consumer Recycled Plastic Market by Category 2023-2033 (US$ Million)
Figure 94 Europe Post-Consumer Recycled Plastic Market Share Forecast by Category 2023-2033 (%)
Figure 95 Europe Post-Consumer Recycled Plastic Market by Processing 2023-2033 (US$ Million)
Figure 96 Europe Post-Consumer Recycled Plastic Market Share Forecast by Processing 2023-2033 (%)
Figure 97 Europe Post-Consumer Recycled Plastic Market by Service 2023-2033 (US$ Million)
Figure 98 Europe Post-Consumer Recycled Plastic Market Share Forecast by Service 2023-2033 (%)
Figure 99 Europe Post-Consumer Recycled Plastic Market by Application 2023-2033 (US$ Million)
Figure 100 Europe Post-Consumer Recycled Plastic Market Share Forecast by Application 2023-2033 (%)
Figure 101 Europe Post-Consumer Recycled Plastic Market by Type 2023-2033 (US$ Million)
Figure 102 Europe Post-Consumer Recycled Plastic Market Share Forecast by Type 2023-2033 (%)
Figure 103 Germany Post-Consumer Recycled Plastic Market by Value, 2023-2033 (US$ Million)
Figure 104 UK Post-Consumer Recycled Plastic Market by Value, 2023-2033 (US$ Million)
Figure 105 France Post-Consumer Recycled Plastic Market by Value, 2023-2033 (US$ Million)
Figure 106 Italy Post-Consumer Recycled Plastic Market by Value, 2023-2033 (US$ Million)
Figure 107 Spain Post-Consumer Recycled Plastic Market by Value, 2023-2033 (US$ Million)
Figure 108 Rest of Europe Post-Consumer Recycled Plastic Market by Value, 2023-2033 (US$ Million)
Figure 109 Asia Pacific Post-Consumer Recycled Plastic Market Attractiveness Index
Figure 110 Asia-Pacific Post-Consumer Recycled Plastic Market by Country, 2023-2033 (US$ Million)
Figure 111 Asia Pacific Post-Consumer Recycled Plastic Market Share Forecast by Country 2023-2033 (%)
Figure 112 Asia-Pacific Post-Consumer Recycled Plastic Market by Category, 2023-2033 (US$ Million)
Figure 113 Asia Pacific Post-Consumer Recycled Plastic Market Share Forecast by Category 2023-2033 (%)
Figure 114 Asia-Pacific Post-Consumer Recycled Plastic Market by Processing, 2023-2033 (US$ Million)
Figure 115 Asia Pacific Post-Consumer Recycled Plastic Market Share Forecast by Processing 2023-2033 (%)
Figure 116 Asia-Pacific Post-Consumer Recycled Plastic Market by Service, 2023-2033 (US$ Million)
Figure 117 Asia Pacific Post-Consumer Recycled Plastic Market Share Forecast by Service 2023-2033 (%)
Figure 118 Asia-Pacific Post-Consumer Recycled Plastic Market by Application, 2023-2033 (US$ Million)
Figure 119 Asia Pacific Post-Consumer Recycled Plastic Market Share Forecast by Application 2023-2033 (%)
Figure 120 Asia-Pacific Post-Consumer Recycled Plastic Market by Type, 2023-2033 (US$ Million)
Figure 121 Asia Pacific Post-Consumer Recycled Plastic Market Share Forecast by Type 2023-2033 (%)
Figure 122 China Post-Consumer Recycled Plastic Market by Value, 2023-2033 (US$ Million)
Figure 123 India Post-Consumer Recycled Plastic Market by Value, 2023-2033 (US$ Million)
Figure 124 Japan Post-Consumer Recycled Plastic Market by Value, 2023-2033 (US$ Million)
Figure 125 South Korea Post-Consumer Recycled Plastic Market by Value, 2023-2033 (US$ Million)
Figure 126 Australia Post-Consumer Recycled Plastic Market by Value, 2023-2033 (US$ Million)
Figure 127 Rest of Asia-Pacific Post-Consumer Recycled Plastic Market by Value, 2023-2033 (US$ Million)
Figure 128 MEA Post-Consumer Recycled Plastic Market Attractiveness Index
Figure 129 Middle East & Africa Post-Consumer Recycled Plastic Market by Country, 2023-2033 (US$ Million)
Figure 130 Middle East & Africa Post-Consumer Recycled Plastic Market Share Forecast by Country 2023-2033 (%)
Figure 131 Middle East & Africa Post-Consumer Recycled Plastic Market by Category, 2023-2033 (US$ Million)
Figure 132 Middle East & Africa Post-Consumer Recycled Plastic Market Share Forecast by Category 2023-2033 (%)
Figure 133 Middle East & Africa Post-Consumer Recycled Plastic Market by Processing, 2023-2033 (US$ Million)
Figure 134 Middle East & Africa Post-Consumer Recycled Plastic Market Share Forecast by Processing 2023-2033 (%)
Figure 135 Middle East & Africa Post-Consumer Recycled Plastic Market by Service,, 2023-2033 (US$ Million)
Figure 136 Middle East & Africa Post-Consumer Recycled Plastic Market Share Forecast by Service 2023-2033 (%)
Figure 137 Middle East & Africa Post-Consumer Recycled Plastic Market by Application,, 2023-2033 (US$ Million)
Figure 138 Middle East & Africa Post-Consumer Recycled Plastic Market Share Forecast by Application 2023-2033 (%)
Figure 139 Middle East & Africa Post-Consumer Recycled Plastic Market by Type,, 2023-2033 (US$ Million)
Figure 140 Middle East & Africa Post-Consumer Recycled Plastic Market Share Forecast by Type 2023-2033 (%)
Figure 141 South Africa Post-Consumer Recycled Plastic Market by Value,, 2023-2033 (US$ Million)
Figure 142 Saudi Arabia Post-Consumer Recycled Plastic Market by Value,, 2023-2033 (US$ Million)
Figure 143 Turkey Post-Consumer Recycled Plastic Market by Value,, 2023-2033 (US$ Million)
Figure 144 Rest of Middle East & Africa Post-Consumer Recycled Plastic Market by Value,, 2023-2033 (US$ Million)
Figure 145 Latin America Post-Consumer Recycled Plastic Market Attractiveness Index
Figure 146 Latin America Post-Consumer Recycled Plastic Market by Country,, 2023-2033 (US$ Million)
Figure 147 Latin America Post-Consumer Recycled Plastic Market Share Forecast by Country 2023-2033 (%)
Figure 148 Latin America Post-Consumer Recycled Plastic Market by Category,, 2023-2033 (US$ Million)
Figure 149 Latin America Post-Consumer Recycled Plastic Market Share Forecast by Category 2023-2033 (%)
Figure 150 Latin America Post-Consumer Recycled Plastic Market by Processing,2023-2033 (US$ Million)
Figure 151 Latin America Post-Consumer Recycled Plastic Market Share Forecast by Processing 2023-2033 (%)
Figure 152 Latin America Post-Consumer Recycled Plastic Market by Service,, 2023-2033 (US$ Million)
Figure 153 Latin America Post-Consumer Recycled Plastic Market Share Forecast by Service 2023-2033 (%)
Figure 154 Latin America Post-Consumer Recycled Plastic Market by Application,, 2023-2033 (US$ Million)
Figure 155 Latin America Post-Consumer Recycled Plastic Market Share Forecast by Application 2023-2033 (%)
Figure 156 Latin America Post-Consumer Recycled Plastic Market by Application,, 2023-2033 (US$ Million)
Figure 157 Latin America Post-Consumer Recycled Plastic Market Share Forecast by Type 2023-2033 (%)
Figure 158 Brazil Post-Consumer Recycled Plastic Market by Value,, 2023-2033 (US$ Million)
Figure 159 Mexico Post-Consumer Recycled Plastic Market by Value,, 2023-2033 (US$ Million)
Figure 160 Rest of Latin America Post-Consumer Recycled Plastic Market by Value 2023-2033 (US$ Million)
Figure 161 Global Post-Consumer Recycled Plastics Market: Company Share Analysis, 2021
Figure 1 Veolia Environnement SA: Net Revenue, 2017-2021 (US$ Million, AGR%)
Figure 2 Veolia Environnement SA: Gross Profit, 2017-2021 (US$ Million, AGR%)
Figure 162 Veolia Environnement SA: Net Profit 2017-2021 (US$ Million, AGR%)
Figure 163 Veolia Environnement SA: EBITDA, 2017-2021 (US$ Million, AGR%)
Figure 164 Suez Environnement: Net Revenue, 2017-2021 (US$ Million, AGR%)
Figure 165 Suez Environnement: Gross Profit, 2017-2021 (US$ Million, AGR%)
Figure 166 Suez Environnement: Net Profit 2017-2021 (US$ Million, AGR%)
Figure 167 Suez Environnement: EBITDA, 2017-2021 (US$ Million, AGR%)
Figure 168 Waste Management, Inc: Net Revenue, 2017-2021 (US$ Million, AGR%)
Figure 169 Waste Management, Inc: Gross Profit, 2017-2021 (US$ Million, AGR%)
Figure 170 Waste Management, Inc: Net Profit 2017-2021 (US$ Million, AGR%)
Figure 171 Waste Management, Inc: EBITDA, 2017-2021 (US$ Million, AGR%)
Figure 172 Republic Services, Inc: Net Revenue, 2017-2021 (US$ Million, AGR%)
Figure 173 Republic Services, Inc: Gross Profit, 2017-2021 (US$ Million, AGR%)
Figure 174 Republic Services, Inc: Net Profit 2017-2021 (US$ Million, AGR%)
Figure 175 Republic Services, Inc: EBITDA, 2017-2021 (US$ Million, AGR%)
Figure 176 Stericycle Inc: Net Revenue, 2017-2021 (US$ Million, AGR%)
Figure 177 Stericycle Inc: Gross Profit, 2017-2021 (US$ Million, AGR%)
Figure 178 Stericycle Inc: Net Profit 2017-2021 (US$ Million, AGR%)
Figure 179 Stericycle Inc: EBITDA, 2017-2021 (US$ Million, AGR%)
Figure 180 Waste Connections: Net Revenue, 2017-2021 (US$ Million, AGR%)
Figure 181 Waste Connections: Gross Profit, 2017-2021 (US$ Million, AGR%)
Figure 182 Waste Connections: Net Profit 2017-2021 (US$ Million, AGR%)
Figure 183 Waste Connections: EBITDA, 2017-2021 (US$ Million, AGR%)
Figure 184 Clean Harbors Inc: Net Revenue, 2017-2021 (US$ Million, AGR%)
Figure 185 Clean Harbors Inc: Gross Profit, 2017-2021 (US$ Million, AGR%)
Figure 186 Clean Harbors Inc: Net Profit 2017-2021 (US$ Million, AGR%)
Figure 187 Clean Harbors Inc: EBITDA, 2017-2021 (US$ Million, AGR%)
Figure 188 DS Smith plc: Net Revenue, 2017-2021 (US$ Million, AGR%)
Figure 189 DS Smith plc: Gross Profit, 2017-2021 (US$ Million, AGR%)
Figure 190 DS Smith plc: Net Profit 2017-2021 (US$ Million, AGR%)
Figure 191 DS Smith plc: EBITDA, 2017-2021 (US$ Million, AGR%)
Figure 192 Mondi PLC:: Net Revenue, 2017-2021 (US$ Million, AGR%)
Figure 193 Mondi PLC:Gross Profit, 2017-2021 (US$ Million, AGR%)
Figure 194 Mondi PLC:: Net Profit 2017-2021 (US$ Million, AGR%)
Figure 195 Mondi PLC:: EBITDA, 2017-2021 (US$ Million, AGR%)
Figure 196 Berry Global Group Inc: Net Revenue, 2017-2021 (US$ Million, AGR%)
Figure 197 Berry Global Group Inc: Gross Profit, 2017-2021 (US$ Million, AGR%)
Figure 198 Berry Global Group Inc: Net Profit 2017-2021 (US$ Million, AGR%)
Figure 199 Berry Global Group Inc: EBITDA, 2017-2021 (US$ Million, AGR%)
Figure 200 Sealed Air Corp: Net Revenue, 2017-2021 (US$ Million, AGR%)
Figure 201 Sealed Air Corp: Gross Profit, 2017-2021 (US$ Million, AGR%)
Figure 202 Sealed Air Corp: Net Profit 2017-2021 (US$ Million, AGR%)
Figure 203 Sealed Air Corp: EBITDA, 2017-2021 (US$ Million, AGR%)
Figure 204 Sonoco Products Co: Net Revenue, 2017-2021 (US$ Million, AGR%)
Figure 205 Sonoco Products Co: Gross Profit, 2017-2021 (US$ Million, AGR%)
Figure 206 Sonoco Products Co: Net Profit 2017-2021 (US$ Million, AGR%)
Figure 207 Sonoco Products Co: EBITDA, 2017-2021 (US$ Million, AGR%)
Figure 208 Amcor PLC: Net Revenue, 2017-2021 (US$ Million, AGR%)
Figure 209 Amcor PLC: Gross Profit, 2017-2021 (US$ Million, AGR%)
Figure 210 Amcor PLC: Net Profit 2017-2021 (US$ Million, AGR%)
Figure 211 Amcor PLC: EBITDA, 2017-2021 (US$ Million, AGR%)
Figure 212 Smurfit Kappa Group Plc: Net Revenue, 2017-2021 (US$ Million, AGR%)
Figure 213 Smurfit Kappa Group Plc: Gross Profit, 2017-2021 (US$ Million, AGR%)
Figure 214 Smurfit Kappa Group Plc: Net Profit 2017-2021 (US$ Million, AGR%)
Figure 215 Smurfit Kappa Group Plc: EBITDA, 2017-2021 (US$ Million, AGR%)
ページTOPに戻る
本レポートと同じKEY WORD()の最新刊レポート
- 本レポートと同じKEY WORDの最新刊レポートはありません。
よくあるご質問
Visiongain社はどのような調査会社ですか?
英国の調査会社ヴィジョンゲイン社(Visiongain)は、通信とエネルギーのほか、自動車や化学・医薬品、金属など、広範な市場を対象に調査を行っています。自動車市場については、市場全般に関する調査のほ... もっと見る
調査レポートの納品までの日数はどの程度ですか?
在庫のあるものは速納となりますが、平均的には 3-4日と見て下さい。
但し、一部の調査レポートでは、発注を受けた段階で内容更新をして納品をする場合もあります。
発注をする前のお問合せをお願いします。
注文の手続きはどのようになっていますか?
1)お客様からの御問い合わせをいただきます。
2)見積書やサンプルの提示をいたします。
3)お客様指定、もしくは弊社の発注書をメール添付にて発送してください。
4)データリソース社からレポート発行元の調査会社へ納品手配します。
5) 調査会社からお客様へ納品されます。最近は、pdfにてのメール納品が大半です。
お支払方法の方法はどのようになっていますか?
納品と同時にデータリソース社よりお客様へ請求書(必要に応じて納品書も)を発送いたします。
お客様よりデータリソース社へ(通常は円払い)の御振り込みをお願いします。
請求書は、納品日の日付で発行しますので、翌月最終営業日までの当社指定口座への振込みをお願いします。振込み手数料は御社負担にてお願いします。
お客様の御支払い条件が60日以上の場合は御相談ください。
尚、初めてのお取引先や個人の場合、前払いをお願いすることもあります。ご了承のほど、お願いします。
データリソース社はどのような会社ですか?
当社は、世界各国の主要調査会社・レポート出版社と提携し、世界各国の市場調査レポートや技術動向レポートなどを日本国内の企業・公官庁及び教育研究機関に提供しております。
世界各国の「市場・技術・法規制などの」実情を調査・収集される時には、データリソース社にご相談ください。
お客様の御要望にあったデータや情報を抽出する為のレポート紹介や調査のアドバイスも致します。
|
|

