フレキシブル(コンバーテッド)プラスチック包装市場レポート:2024-2034
Flexible (Converted) Plastic Packaging Market Report 2024-2034
レポート詳細
フレキシブル(コンバーテッド)プラスチック包装市場レポート 2024-2034 :本レポートは、業界とその基礎となる原動力をより良く理解したいと願うならば、新たな収益ポケットを目指す... もっと見る
※上記価格は部署ライセンス(Departmental licence)価格です。
その他の価格についてはデータリソースまでお問合せください。
日本語のページは自動翻訳を利用し作成しています。
実際のレポートは英文のみでご納品いたします。

|

|
サマリー
レポート詳細
フレキシブル(コンバーテッド)プラスチック包装市場レポート 2024-2034:本レポートは、業界とその基礎となる原動力をより良く理解したいと願うならば、新たな収益ポケットを目指す大手企業にとって非常に貴重なものとなるでしょう。異業種への進出や新地域での既存事業の拡大を希望する企業にも有用です。
フレキシブルコンバーテッドプラスチック包装市場の発展における推進要因と機会
フレキシブルコンバーテッドプラスチックパッケージング市場は、多様で説得力のある要因に後押しされ、ダイナミックな急成長を目の当たりにしている。まず、持続可能性が重視されるようになったことで、メーカー各社はリサイクル可能なプラスチックや生分解性プラスチックに代表される、環境に優しい包装材料の開発に先駆けて取り組んでいる。消費者の意識と規制当局からの圧力が環境に配慮した代替品に集中する中、この変革的なシフトは市場に大きな成長機会をもたらしている。第二に、電子商取引分野の飛躍的な成長により、箱詰め後の開封体験を全体的に向上させながら、配送中の製品を保護することに長けた包装ソリューションに対する需要が急増した。耐久性に優れ、視覚に訴える包装材料が求められているため、市場拡大のための新たな道が開けている。
原材料価格の上昇が市場成長を抑制
フレキシブル(コンバーテッド)プラスチック包装市場における原材料価格の高騰は、業界の様々な側面に影響を与える重要な抑制要因となっている。プラスチック包装の基盤である石油由来のプラスチック(ポリエチレンやポリプロピレンなど)などの原材料は、本質的に世界的な原油価格の変動に敏感である。この敏感さは、プラスチック包装の製造業者と消費者の双方に二重の課題を突きつけている。原材料価格の上昇の第一の結果は、プラスチック包装の製造コストの上昇である。メーカーは、原材料を調達し、加工し、最終製品に変換する際に、より高い費用を負担する。こうしたコスト上昇は消費者に転嫁されることが多く、特に利益率の厳しい市場では、プラスチック包装のコスト競争力を低下させている。
市場調査レポートを購入する前にすべき質問とは?
- フレキシブル(コンバーテッド)プラスチック包装市場はどのように進化しているのか?
- 何がフレキシブル(コンバーテッド)プラスチック包装市場を牽引し、抑制しているのか?
- フレキシブル(コンバーテッド)プラスチック包装の各サブマーケットセグメントは予測期間中にどのように成長し、これらのサブマーケットが2034年にどれくらいの収益を占めるのか?
- 2024年から2034年にかけて、フレキシブル(コンバーテッド)プラスチック包装の各サブマーケットの市場シェアはどのように推移するのか?
- 2024年から2034年までの市場全体の主な牽引役は何か?
- 主要なフレキシブル(コンバーテッド)プラスチック包装市場はマクロ経済の動きに概ね追随するか、それとも個々の国市場が他を凌駕するか?
- 2034年までに各国市場のシェアはどう変化し、2034年に市場をリードするのはどの地域か?
- 主要プレーヤーは誰で、予測期間中の見通しは?
- これら主要企業のフレキシブル(コンバーテッド)プラスチック包装プロジェクトとは?
- 2024年から2034年の間に業界はどのように発展するか?フレキシブル(コンバーテッド)プラスチック包装プロジェクトは現在、そして今後10年間でどのような意味を持つのか?
- フレキシブル(コンバーテッド)プラスチック包装市場をさらに拡大するために、製品化の必要性は高まっているか?
- フレキシブル(コンバーテッド)プラスチック包装市場はどこへ向かい、どのようにすれば市場の最前線に立てるか?
- 新製品やサービスラインに対する最適な投資オプションは何か?
- 企業を新たな成長軌道に乗せ、C-suiteに移行させるための重要な展望とは?
このことが、フレキシブル(コンバーテッド)プラスチック包装市場に現在、そして今後10年間でどのような影響を与えるかを見極める必要がある:
- 407ページにわたる本レポートでは、124の表と176の図表を掲載しています。
- 本レポートでは、業界における主要な有利分野を取り上げているため、今すぐターゲットを絞ることができます。
- 本レポートには、世界、地域、国の売上と成長に関する詳細な分析が含まれています。
- 競合他社が成功した主なトレンド、変化、収益予測をハイライトしています。
本レポートは、フレキシブル(コンバーテッド)プラスチック包装市場が今後10年間でどのように発展していくのか、またCOVID-19の景気後退と好転の変動に合わせてどのように発展していくのかをお伝えします。この市場は、過去10年間のどの時点よりも今が重要です。
2034年までの予測やその他の分析から、商業的な展望が明らかになる
- 2034年までの収益予測に加え、直近の実績、成長率、市場シェアを提供します。
- ビジネスの展望と展開に関する独自の分析をご覧いただけます。
- 定性的分析(市場ダイナミクス、促進要因、機会、阻害要因、課題を含む)、コスト構造、フレキシブル(コンバーテッド)プラスチック包装の価格上昇の影響、最近の動向をご覧いただけます。
本レポートには、COVID-19が業界と貴社にどのような影響を与えるかについてのデータ分析と貴重な洞察が含まれている。本レポートでは、COVID-19の4つの回収パターンとその影響、すなわち「V」、「L」、「W」、「U」について論じている。
レポート対象セグメント
印刷技術別市場セグメント
- フレキソ印刷技術
- グラビア印刷技術
- デジタル印刷技術
エンドユーザー産業別市場セグメント
- 食品・飲料産業
- ヘルスケア産業
- パーソナルケア&化粧品業界
- その他産業
素材別市場セグメント
- ポリエチレン(PE)
- ポリプロピレン(PP)
- ポリエチレンテレフタレート(PET)
- ポリ塩化ビニル(PVC)
- その他の素材
タイプ別市場セグメント
- パウチ
- 袋
- ラップ
- フィルム
- 小袋
- その他のタイプ
世界市場全体とセグメント別の収益予測に加え、4つの地域と20の主要国市場の収益予測も掲載しています:
北米
- アメリカ
- カナダ
欧州
- ドイツ
- ロシア
- イギリス
- フランス
- イタリア
- その他の欧州
アジア太平洋
- 中国
- 日本
- インド
- インドネシア
- 韓国
- その他のアジア太平洋地域
ラテンアメリカ
- ブラジル
- メキシコ
- その他のラテンアメリカ
中東・アフリカ
- GCC
- 南アフリカ
- その他の中東・アフリカ
また、フレキシブル(コンバーテッド)プラスチック包装市場の2024年から2034年までの主要企業のプロファイルと、これらの企業の事業のこのセグメントに焦点を当てています。
報告書に掲載されている主要企業
・ Amcor plc
・ AptarGroup, Inc.
・ Berry Global Group, Inc
・ Clondalkin Group Holdings B.V.
・ Constantia Flexibles Group GmbH
・ Coveris Group
・ Huhtamäki Oyj
・ Innovia Films
・ Mondi plc
・ Novolex Holdings Inc.
・ Polytex Environmental Inks
・ Printpack
・ Pro Ampac LLC
・ Sealed Air Corporation
・ Sonoco Products Company
フレキシブル(コンバーテッド)プラスチック包装市場の2024年から2034年までの世界全体の売上高(金額ベース)は、2024年に1,639億米ドルを突破すると弊社では計算している。2034年まで力強い収益成長を予測している。当調査では、最も大きな可能性を秘めた企業を特定しています。彼らの能力、進歩、商業的展望を発見し、一歩先を行くお手伝いをします。
フレキシブル(コンバーテッド)プラスチック包装市場、2024-2034年レポートはどのようにお役に立ちますか?
要約すると、400ページを超えるこのレポートは、以下のような知識を提供する:
- フレキシブル(コンバーテッド)プラスチック包装市場の2024年から2034年までの収益予測 印刷技術、最終用途産業、材料、タイプ別に世界と地域レベルで予測 - 業界の将来性を発見し、投資と収益に最も有利な場所を見つけることができます。
- 4つの地域と20の主要国市場の2034年までの収益予測 - フレキシブル(コンバーテッド)プラスチック包装市場の2024年から2034年までの北米、ヨーロッパ、アジア太平洋、ラテンアメリカ、中東&アフリカ市場の予測をご覧ください。また、米国、カナダ、ブラジル、ドイツ、フランス、英国、イタリア、中国、インド、日本、オーストラリアなどの著名経済圏の市場も予測しています。
- 既存企業や市場参入を目指す企業の展望 - 2024年から2034年までのフレキシブル(コンバーテッド)プラスチック包装市場に関わる主要企業15社の企業プロファイルを含む。
独自の予測による定量的・定性的分析をご覧ください。私たちのレポートだけに含まれる情報を入手し、貴重なビジネスインテリジェンスで情報を得ることができます。
他にはない情報
私たちの新しいレポートがあれば、知識に遅れをとったり、チャンスを逃したりする可能性が低くなります。弊社のレポートが貴社の調査、分析、意思決定にどのように役立つかをご覧ください。Visiongainの調査は、フレキシブル(コンバーテッド)プラスチック包装市場の商業分析、2024年から2034年、市場をリードする企業を必要とするすべての人のためのものです。データ、トレンド、予測をご覧いただけます。
ページTOPに戻る
目次
目次
1 レポート概要
1.1 研究の目的
1.2 フレキシブル(コンバーテッド)プラスチック包装市場の紹介
1.3 本レポートの内容
1.4 本レポートを読むべき理由
1.5 本分析レポートが回答する主な質問
1.6 本レポートは誰のためのものか?
1.7 方法論
1.7.1 市場の定義
1.7.2 市場評価・予測手法
1.7.3 データの検証
1.7.3.1 一次調査
1.7.3.2 セカンダリーリサーチ
1.8 よくある質問(FAQ)
1.9 Visiongainの関連レポート
1.10 Visiongainについて
2 エグゼクティブ・サマリー
3 市場概要
3.1 主要な調査結果
3.2 市場ダイナミクス
3.2.1 市場牽引要因
3.2.1.1 伝統的包装材料のより良い代替品が市場成長を促進する
3.2.1.2 製品の賞味期限延長が市場成長を促進する
3.2.1.3 最終用途産業からの需要増加による市場の成長
3.2.2 市場抑制要因
3.2.2.1 原材料価格の上昇が市場成長を抑制する
3.2.2.2 変換プラスチック包装廃棄物の環境への影響に対する懸念
3.2.2.3 軟包装製品におけるリサイクルの課題
3.2.3 市場機会
3.2.3.1 軟質コンバーテッドプラスチック包装市場における包装革新の機会
3.2.3.2 Eコマース産業からの需要増加
3.2.3.3 政府や規制機関の包装廃棄物削減への注目の高まり
3.3 ポーターのファイブフォース分析
3.3.1 サプライヤーの交渉力(中〜高)
3.3.2 買い手の交渉力(中~高)
3.3.3 競争力(高)
3.3.4 代替品による脅威(中)
3.3.5 新規参入の脅威(低)
3.4 COVID-19の影響分析
3.4.1 "V字型回復"
3.4.2 "U字型回復"
3.4.3 "W字型回復"
3.4.4 "L字型回復"
3.5 PEST分析
4 フレキシブル(コンバーテッド)プラスチック包装市場分析:印刷技術別
4.1 主要な調査結果
4.2 印刷技術セグメント 市場魅力度指数
4.3 印刷技術別フレキシブル(コンバーテッド)プラスチック包装市場規模の推定と予測
4.4 フレキソ印刷技術
4.4.1 2024〜2034年の地域別市場規模(US$ Billion)
4.4.2 地域別市場シェア、2024年・2034年(%)
4.5 グラビア印刷技術
4.5.1 2024~2034年の地域別市場規模(US$ Billion)
4.5.2 地域別市場シェア、2024年・2034年(%)
4.6 デジタル印刷技術
4.6.1 2024〜2034年の地域別市場規模(US$ Billion)
4.6.2 地域別市場シェア、2024年・2034年(%)
5 フレキシブル(コンバーテッド)プラスチック包装市場分析:最終用途産業別
5.1 主要調査結果
5.2 最終用途産業セグメント: 市場魅力度指数
5.3 フレキシブル(コンバーテッド)プラスチック包装の最終用途産業別市場規模推定と予測
5.4 食品・飲料産業
5.4.1 2024〜2034年の地域別市場規模(US$ Billion)
5.4.2 地域別市場シェア、2024年・2034年(%)
5.5 ヘルスケア産業
5.5.1 2024〜2034年の地域別市場規模(US$ Billion)
5.5.2 地域別市場シェア、2024年・2034年(%)
5.6 パーソナルケア・化粧品産業
5.6.1 2024〜2034年の地域別市場規模(US$ Billion)
5.6.2 地域別市場シェア、2024年・2034年(%)
5.7 その他産業
5.7.1 2024〜2034年の地域別市場規模(US$ Billion)
5.7.2 地域別市場シェア、2024年・2034年(%)
6 フレキシブル(コンバーテッド)プラスチック包装市場分析:素材別
6.1 主要な調査結果
6.2 素材セグメント 市場魅力度指数
6.3 フレキシブル(コンバーテッド)プラスチック包装の素材別市場規模推定と予測
6.4 ポリエチレン(PE)
6.4.1 2024〜2034年の地域別市場規模(US$ Billion)
6.4.2 地域別市場シェア、2024年・2034年(%)
6.5 ポリプロピレン(PP)
6.5.1 2024~2034年の地域別市場規模(US$ Billion)
6.5.2 地域別市場シェア、2024年・2034年(%)
6.6 ポリエチレンテレフタレート(PET)
6.6.1 2024~2034年の地域別市場規模(US$ Billion)
6.6.2 地域別市場シェア、2024年・2034年(%)
6.7 ポリ塩化ビニル(PVC)
6.7.1 2024~2034年の地域別市場規模(US$ Billion)
6.7.2 地域別市場シェア、2024年・2034年(%)
6.8 その他の素材
6.8.1 2024〜2034年の地域別市場規模(US$ Billion)
6.8.2 地域別市場シェア、2024年・2034年(%)
7 フレキシブル(コンバーテッド)プラスチック包装市場分析:タイプ別
7.1 主要な調査結果
7.2 タイプ別セグメント 市場魅力度指数
7.3 フレキシブル(コンバーテッド)プラスチック包装のタイプ別市場規模推定と予測
7.4 パウチ
7.4.1 2024〜2034年の地域別市場規模(US$ Billion)
7.4.2 地域別市場シェア、2024年・2034年(%)
7.5 バッグ
7.5.1 2024〜2034年の地域別市場規模(US$ Billion)
7.5.2 地域別市場シェア、2024年・2034年(%)
7.6 ラップ
7.6.1 2024〜2034年の地域別市場規模(US$ Billion)
7.6.2 地域別市場シェア、2024年・2034年(%)
7.7 フィルム
7.7.1 2024〜2034年の地域別市場規模(US$ Billion)
7.7.2 地域別市場シェア、2024年・2034年(%)
7.8 小袋
7.8.1 2024〜2034年の地域別市場規模(US$ Billion)
7.8.2 地域別市場シェア、2024年・2034年(%)
7.9 その他タイプ
7.9.1 2024~2034年の地域別市場規模(US$ Billion)
7.9.2 地域別市場シェア、2024年・2034年(%)
8 フレキシブル(コンバーテッド)プラスチック包装市場分析:地域別
8.1 主要な調査結果
8.2 地域別市場規模の推定と予測
9 北米のフレキシブル(コンバーテッド)プラスチック包装市場分析
9.1 主要な調査結果
9.2 北米のフレキシブル(コンバーテッド)プラスチック包装市場魅力度指数
9.3 北米のフレキシブル(コンバーテッド)プラスチック包装の国別市場:2024年、2029年、2034年 (US$ Billion)
9.4 北米のフレキシブル(コンバーテッド)プラスチック包装市場規模推定と予測
9.5 北米のフレキシブル(コンバーテッド)プラスチック包装市場規模推定と予測:国別
9.6 北米のフレキシブル(コンバーテッド)プラスチック包装市場規模推定と予測:印刷技術別
9.7 北米のフレキシブル(コンバーテッド)プラスチック包装市場規模推定と予測:最終用途産業別
9.8 北米のフレキシブル(コンバーテッド)プラスチック包装市場規模推定と予測:素材別
9.9 北米のフレキシブル(コンバーテッド)プラスチック包装市場規模推定と予測:タイプ別
9.10 アメリカのフレキシブル(コンバーテッド)プラスチック包装市場分析
9.11 カナダのフレキシブル(コンバーテッド)プラスチック包装市場分析
10 欧州のフレキシブル(コンバーテッド)プラスチック包装市場分析
10.1 主要な調査結果
10.2 欧州のフレキシブル(コンバーテッド)プラスチック包装市場魅力度指数
10.3 欧州のフレキシブル(コンバーテッド)プラスチック包装の国別市場:2024年、2029年、2034年 (US$ Billion)
10.4 欧州のフレキシブル(コンバーテッド)プラスチック包装市場規模推定と予測
10.5 欧州のフレキシブル(コンバーテッド)プラスチック包装市場規模推定と予測:国別
10.6 欧州のフレキシブル(コンバーテッド)プラスチック包装市場規模推定と予測:印刷技術別
10.7 欧州のフレキシブル(コンバーテッド)プラスチック包装市場規模推定と予測:最終用途産業別
10.8 欧州のフレキシブル(コンバーテッド)プラスチック包装市場規模推定と予測:素材別
10.9 欧州のフレキシブル(コンバーテッド)プラスチック包装市場規模推定と予測:タイプ別
10.10 ドイツのフレキシブル(コンバーテッド)プラスチック包装市場分析
10.11 イギリスのフレキシブル(コンバーテッド)プラスチック包装市場分析
10.12 フランスのフレキシブル(コンバーテッド)プラスチック包装市場分析
10.13 イタリアのフレキシブル(コンバーテッド)プラスチック包装市場分析
10.14 ロシアのフレキシブル(コンバーテッド)プラスチック包装市場分析
10.15 その他の欧州のフレキシブル(コンバーテッド)プラスチック包装市場分析
11 アジア太平洋地域のフレキシブル(コンバーテッド)プラスチック包装市場分析
11.1 主要な調査結果
11.2 アジア太平洋地域のフレキシブル(コンバーテッド)プラスチック包装市場魅力度指数
11.3 アジア太平洋地域のフレキシブル(コンバーテッド)プラスチック包装国別市場:2024年、2029年、2034年 (US$ Billion)
11.4 アジア太平洋地域のフレキシブル(コンバーテッド)プラスチック包装市場規模推定と予測
11.5 アジア太平洋地域のフレキシブル(コンバーテッド)プラスチック包装市場規模推定と予測:国別
11.6 アジア太平洋地域のフレキシブル(コンバーテッド)プラスチック包装市場規模推定と予測:印刷技術別
11.7 アジア太平洋地域のフレキシブル(コンバーテッド)プラスチック包装市場規模推定と予測:最終用途産業別
11.8 アジア太平洋地域のフレキシブル(コンバーテッド)プラスチック包装市場規模推定と予測:素材別
11.9 アジア太平洋地域のフレキシブル(コンバーテッド)プラスチック包装市場規模推定と予測:タイプ別
11.10 中国のフレキシブル(コンバーテッド)プラスチック包装市場分析
11.11 インドのフレキシブル(コンバーテッド)プラスチック包装市場分析
11.12 日本のフレキシブル(コンバーテッド)プラスチック包装市場分析
11.13 インドネシアのフレキシブル(コンバーテッド)プラスチック包装市場分析
11.14 韓国のフレキシブル(コンバーテッド)プラスチック包装市場分析
11.15 その他のアジア太平洋地域のフレキシブル(コンバーテッド)プラスチック包装市場分析
12 中東とアフリカのフレキシブル(コンバーテッド)プラスチック包装市場分析
12.1 主要な調査結果
12.2 中東・アフリカのフレキシブル(コンバーテッド)プラスチック包装市場魅力度指数
12.3 中東・アフリカのフレキシブル(コンバーテッド)プラスチック包装の国別市場:2024年、2029年、2034年 (US$ Billion)
12.4 中東・アフリカのフレキシブル(コンバーテッド)プラスチック包装市場規模推定と予測
12.5 中東・アフリカのフレキシブル(コンバーテッド)プラスチック包装市場規模推定と予測:国別
12.6 中東・アフリカのフレキシブル(コンバーテッド)プラスチック包装市場規模推定と予測:印刷技術別
12.7 中東・アフリカのフレキシブル(コンバーテッド)プラスチック包装市場規模推定と予測:最終用途産業別
12.8 中東・アフリカのフレキシブル(コンバーテッド)プラスチック包装市場規模推定と予測:材料別
12.9 中東・アフリカのフレキシブル(コンバーテッド)プラスチック包装市場規模推定と予測:タイプ別
12.10 GCCのフレキシブル(コンバーテッド)プラスチック包装市場分析
12.11 南アフリカのフレキシブル(コンバーテッド)プラスチック包装市場分析
12.12 その他の中東・アフリカ地域のフレキシブル(コンバーテッド)プラスチック包装市場分析
13 ラテンアメリカのフレキシブル(コンバーテッド)プラスチック包装市場分析
13.1 主要な調査結果
13.2 ラテンアメリカのフレキシブル(コンバーテッド)プラスチック包装市場魅力度指数
13.3 ラテンアメリカのフレキシブル(コンバーテッド)プラスチック包装の国別市場:2024年、2029年、2034年 (US$ Billion)
13.4 ラテンアメリカのフレキシブル(コンバーテッド)プラスチック包装市場規模推定と予測
13.5 ラテンアメリカのフレキシブル(コンバーテッド)プラスチック包装市場規模推定と予測:国別
13.6 ラテンアメリカのフレキシブル(コンバーテッド)プラスチック包装市場規模推定と予測:印刷技術別
13.7 ラテンアメリカのフレキシブル(コンバーテッド)プラスチック包装市場規模推定と予測:最終用途産業別
13.8 ラテンアメリカのフレキシブル(コンバーテッド)プラスチック包装市場規模推定と予測:予測素材別
13.9 ラテンアメリカのフレキシブル(コンバーテッド)プラスチック包装市場規模推定と予測:タイプ別
13.10 ブラジルのフレキシブル(コンバーテッド)プラスチック包装市場分析
13.11 メキシコのフレキシブル(コンバーテッド)プラスチック包装市場分析
13.12 その他のラテンアメリカのフレキシブル(コンバーテッド)プラスチック包装市場分析
14 主要企業のプロファイル
14.1 競争環境、2022年
14.2 戦略的展望
14.3 Amcor plc
14.3.1 会社概要
14.3.2 会社概要
14.3.3 財務分析
14.3.3.1 純収入、2019-2023年
14.3.3.2 R&D、2019-2023年
14.3.3.3 事業セグメント収益シェア、2023年(%)
14.3.4 製品ベンチマーク
14.3.5 戦略的展望
14.4 Berry Global Group, Inc
14.4.1 会社概要
14.4.2 会社概要
14.4.3 財務分析
14.4.3.1 純収入、2019-2023年
14.4.3.2 R&D、2019-2023年
14.4.3.3 地域別収益シェア、2023年(%)
14.4.3.4 事業セグメント収益シェア、2023年(%)
14.4.4 製品ベンチマーク
14.4.5 戦略的展望
14.5 Sonoco Products Company
14.5.1 会社概要
14.5.2 会社概要
14.5.3 財務分析
14.5.3.1 純収入、2018-2022年
14.5.3.2 R&D、2018-2022年
14.5.3.3 地域別収益シェア、2022年(%)
14.5.3.4 事業セグメント収益シェア、2022年(%)
14.5.4 製品ベンチマーク
14.5.5 戦略的展望
14.6 Huhtamäki Oyj
14.6.1 会社概要
14.6.2 会社概要
14.6.3 財務分析
14.6.3.1 純収入、2018-2022年
14.6.3.2 R&D、2018年〜2022年
14.6.3.3 地域別収益シェア、2022年(%)
14.6.3.4 事業セグメント収益シェア、2022年(%)
14.6.4 製品ベンチマーク
14.6.5 戦略的展望
14.7 Sealed Air Corporation
14.7.1 会社概要
14.7.2 会社概要
14.7.3 財務分析
14.7.3.1 純収入、2018-2022年
14.7.3.2 R&D、2018-2022年
14.7.3.3 地域別収益シェア、2022年(%)
14.7.3.4 事業セグメント収益シェア、2022年(%)
14.7.4 製品ベンチマーク
14.7.5 戦略的展望
14.8 Constantia Flexibles Group GmbH
14.8.1 会社概要
14.8.2 会社概要
14.8.3 製品ベンチマーク
14.8.4 戦略的展望
14.9 Mondi plc
14.9.1 会社概要
14.9.2 会社概要
14.9.3 財務分析
14.9.3.1 純収入、2018-2022年
14.9.3.2 事業セグメント収益シェア、2022年(%)
14.9.4 製品ベンチマーク
14.9.5 戦略的展望
14.10 Coveris Group
14.10.1 会社概要
14.10.2 会社概要
14.10.3 製品ベンチマーク
14.10.4 戦略的展望
14.11 Pro Ampac LLC
14.11.1 会社概要
14.11.2 会社概要
14.11.3 製品ベンチマーク
14.11.4 戦略的展望
14.12 Printpack
14.12.1 会社概要
14.12.2 会社概要
14.12.3 製品ベンチマーク
14.12.4 戦略的展望
14.13 Novolex
14.13.1 会社概要
14.13.2 会社概要
14.13.3 製品ベンチマーク
14.13.4 戦略的展望
14.14 Clondalkin Group Holdings B.V.
14.14.1 会社概要
14.14.2 会社概要
14.14.3 製品ベンチマーク
14.14.4 戦略的展望
14.15 Polytex Environmental Inks
14.15.1 会社概要
14.15.2 会社概要
14.15.3 製品ベンチマーク
14.15.4 戦略的展望
14.16 Innovia Films
14.16.1 会社概要
14.16.2 会社概要
14.16.3 製品ベンチマーク
14.16.4 戦略的展望
14.17 AptarGroup, Inc.
14.17.1 会社概要
14.17.2 会社概要
14.17.3 財務分析
14.17.3.1 純収入、2018-2022年
14.17.3.2 R&D、2018-2022年
14.17.3.3 地域別売上シェア、2022年(%)
14.17.3.4 事業セグメント収益シェア、2022年(%)
14.17.4 製品ベンチマーク
14.17.5 戦略的展望
15 結論と提言
15.1 Visiongainからの結びの言葉
15.2 市場プレイヤーへの提言
ページTOPに戻る
プレスリリース
表の一覧
Table 1 Flexible (Converted) Plastic Packaging Market Snapshot, 2024 & 2034 (US$ Billion, CAGR %)
Table 2 Raw Material Prices for Flexible Packaging
Table 3 Plastic Waste Data
Table 4 Global Flexible (Converted) Plastic Packaging Market by Region, 2024-2034 (US$ Bn, AGR (%), CAGR (%)) (V-Shaped Recovery Scenario)
Table 5 Global Flexible (Converted) Plastic Packaging Market by Region, 2024-2034 (US$ Bn, AGR (%), CAGR (%)) (U-Shaped Recovery Scenario)
Table 6 Global Flexible (Converted) Plastic Packaging Market by Region, 2024-2034 (US$ Bn, AGR (%), CAGR (%)) (W-Shaped Recovery Scenario)
Table 7 Global Flexible (Converted) Plastic Packaging Market by Region, 2024-2034 (US$ Bn, AGR (%), CAGR (%)) (L-Shaped Recovery Scenario)
Table 8 Global Flexible (Converted) Plastic Packaging Market by Printing Technology, 2024-2034 (US$ Bn, AGR (%), CAGR (%))
Table 9 Flexography Technology Market by Region, 2024-2034 (US$ Bn, AGR (%), CAGR (%))
Table 10 Rotogravure Technology Market by Region, 2024-2034 (US$ Bn, AGR (%), CAGR (%))
Table 11 Digital Printing Technology Market by Region, 2024-2034 (US$ Bn, AGR (%), CAGR (%))
Table 12 Global Flexible (Converted) Plastic Packaging Market by End-Use Industry, 2024-2034 (US$ Bn, AGR (%), CAGR (%))
Table 13 Food & Beverage Industry Market by Region, 2024-2034 (US$ Bn, AGR (%), CAGR (%))
Table 14 Healthcare Industry Market by Region, 2024-2034 (US$ Bn, AGR (%), CAGR (%))
Table 15 Personal Care & Cosmetics Industry Market by Region, 2024-2034 (US$ Bn, AGR (%), CAGR (%))
Table 16 Other Industry Market by Region, 2024-2034 (US$ Bn, AGR (%), CAGR (%))
Table 17 Global Flexible (Converted) Plastic Packaging Market by Material, 2024-2034 (US$ Bn, AGR (%), CAGR (%))
Table 18 Polyethylene (PE) Market by Region, 2024-2034 (US$ Bn, AGR (%), CAGR (%))
Table 19 Polypropylene (PP) Market by Region, 2024-2034 (US$ Bn, AGR (%), CAGR (%))
Table 20 Polyethylene Terephthalate (PET) Market by Region, 2024-2034 (US$ Bn, AGR (%), CAGR (%))
Table 21 Polyvinyl Chloride (PVC) Market by Region, 2024-2034 (US$ Bn, AGR (%), CAGR (%))
Table 22 Other Materials Market by Region, 2024-2034 (US$ Bn, AGR (%), CAGR (%))
Table 23 Global Flexible (Converted) Plastic Packaging Market by Type, 2024-2034 (US$ Bn, AGR (%), CAGR (%))
Table 24 Pouches Market by Region, 2024-2034 (US$ Bn, AGR (%), CAGR (%))
Table 25 Bags Market by Region, 2024-2034 (US$ Bn, AGR (%), CAGR (%))
Table 26 Wraps Market by Region, 2024-2034 (US$ Bn, AGR (%), CAGR (%))
Table 27 Films Market by Region, 2024-2034 (US$ Bn, AGR (%), CAGR (%))
Table 28 Sachets Market by Region, 2024-2034 (US$ Bn, AGR (%), CAGR (%))
Table 29 Other Type Market by Region, 2024-2034 (US$ Bn, AGR (%), CAGR (%))
Table 30 Flexible (Converted) Plastic Packaging Market Forecast by Region, 2024-2034 (US$ Billion, AGR%, CAGR%)
Table 31 North America Flexible (Converted) Plastic Packaging Market by Value, 2024-2034 (US$ Bn, AGR (%), CAGR (%))
Table 32 North America Flexible (Converted) Plastic Packaging Market by Country, 2024-2034 (US$ Bn, AGR (%), CAGR (%))
Table 33 North America Flexible (Converted) Plastic Packaging Market by Printing Technology, 2024-2034 (US$ Bn, AGR (%), CAGR (%))
Table 34 North America Flexible (Converted) Plastic Packaging Market by End-Use Industry, 2024-2034 (US$ Bn, AGR (%), CAGR (%))
Table 35 North America Flexible (Converted) Plastic Packaging Market by Material, 2024-2034 (US$ Bn, AGR (%), CAGR (%))
Table 36 North America Flexible (Converted) Plastic Packaging Market by Type, 2024-2034 (US$ Bn, AGR (%), CAGR (%))
Table 37 US Flexible (Converted) Plastic Packaging Market by Value, 2024-2034 (US$ Bn, AGR (%), CAGR (%))
Table 38 Canada Flexible (Converted) Plastic Packaging Market by Value, 2024-2034 (US$ Bn, AGR (%), CAGR (%))
Table 39 Europe Flexible (Converted) Plastic Packaging Market by Value, 2024-2034 (US$ Bn, AGR (%), CAGR (%))
Table 40 Europe Flexible (Converted) Plastic Packaging Market by Country, 2024-2034 (US$ Bn, AGR (%), CAGR (%))
Table 41 Europe Flexible (Converted) Plastic Packaging Market by Printing Technology, 2024-2034 (US$ Bn, AGR (%), CAGR (%))
Table 42 Europe Flexible (Converted) Plastic Packaging Market by End-Use Industry, 2024-2034 (US$ Bn, AGR (%), CAGR (%))
Table 43 Europe Flexible (Converted) Plastic Packaging Market by Material, 2024-2034 (US$ Bn, AGR (%), CAGR (%))
Table 44 Europe Flexible (Converted) Plastic Packaging Market by Type, 2024-2034 (US$ Bn, AGR (%), CAGR (%))
Table 45 Germany Flexible (Converted) Plastic Packaging Market by Value, 2024-2034 (US$ Bn, AGR (%), CAGR (%))
Table 46 UK Flexible (Converted) Plastic Packaging Market by Value, 2024-2034 (US$ Bn, AGR (%), CAGR (%))
Table 47 France Flexible (Converted) Plastic Packaging Market by Value, 2024-2034 (US$ Bn, AGR (%), CAGR (%))
Table 48 Italy Flexible (Converted) Plastic Packaging Market by Value, 2024-2034 (US$ Bn, AGR (%), CAGR (%))
Table 49 Russia Flexible (Converted) Plastic Packaging Market by Value, 2024-2034 (US$ Bn, AGR (%), CAGR (%))
Table 50 Rest of Europe Flexible (Converted) Plastic Packaging Market by Value, 2024-2034 (US$ Bn, AGR (%), CAGR (%))
Table 51 Asia-Pacific Flexible (Converted) Plastic Packaging Market by Value, 2024-2034 (US$ Bn, AGR (%), CAGR (%))
Table 52 Asia-Pacific Flexible (Converted) Plastic Packaging Market by Country, 2024-2034 (US$ Bn, AGR (%), CAGR (%))
Table 53 Asia-Pacific Flexible (Converted) Plastic Packaging Market by Printing Technology, 2024-2034 (US$ Bn, AGR (%), CAGR (%))
Table 54 Asia-Pacific Flexible (Converted) Plastic Packaging Market by End-Use Industry, 2024-2034 (US$ Bn, AGR (%), CAGR (%))
Table 55 Asia-Pacific Flexible (Converted) Plastic Packaging Market by Material, 2024-2034 (US$ Bn, AGR (%), CAGR (%))
Table 56 Asia-Pacific Flexible (Converted) Plastic Packaging Market by Type, 2024-2034 (US$ Bn, AGR (%), CAGR (%))
Table 57 China Flexible (Converted) Plastic Packaging Market by Value, 2024-2034 (US$ Bn, AGR (%), CAGR (%))
Table 58 India Flexible (Converted) Plastic Packaging Market by Value, 2024-2034 (US$ Bn, AGR (%), CAGR (%))
Table 59 Japan Flexible (Converted) Plastic Packaging Market by Value, 2024-2034 (US$ Bn, AGR (%), CAGR (%))
Table 60 Indonesia Flexible (Converted) Plastic Packaging Market by Value, 2024-2034 (US$ Bn, AGR (%), CAGR (%))
Table 61 South Korea Flexible (Converted) Plastic Packaging Market by Value, 2024-2034 (US$ Bn, AGR (%), CAGR (%))
Table 62 Rest of Asia-Pacific Flexible (Converted) Plastic Packaging Market by Value, 2024-2034 (US$ Bn, AGR (%), CAGR (%))
Table 63 Middle East & Africa Flexible (Converted) Plastic Packaging Market by Value, 2024-2034 (US$ Bn, AGR (%), CAGR (%))
Table 64 Middle East & Africa Flexible (Converted) Plastic Packaging Market by Country, 2024-2034 (US$ Bn, AGR (%), CAGR (%))
Table 65 Middle East & Africa Flexible (Converted) Plastic Packaging Market by Printing Technology, 2024-2034 (US$ Bn, AGR (%), CAGR (%))
Table 66 Middle East & Africa Flexible (Converted) Plastic Packaging Market by End-Use Industry, 2024-2034 (US$ Bn, AGR (%), CAGR (%))
Table 67 Middle East & Africa Flexible (Converted) Plastic Packaging Market by Material, 2024-2034 (US$ Bn, AGR (%), CAGR (%))
Table 68 Middle East & Africa Flexible (Converted) Plastic Packaging Market by Type, 2024-2034 (US$ Bn, AGR (%), CAGR (%))
Table 69 GCC Flexible (Converted) Plastic Packaging Market by Value, 2024-2034 (US$ Bn, AGR (%), CAGR (%))
Table 70 South Africa Flexible (Converted) Plastic Packaging Market by Value, 2024-2034 (US$ Bn, AGR (%), CAGR (%))
Table 71 Rest of Middle East & Africa Flexible (Converted) Plastic Packaging Market by Value, 2024-2034 (US$ Bn, AGR (%), CAGR (%))
Table 72 Latin America Flexible (Converted) Plastic Packaging Market by Value, 2024-2034 (US$ Bn, AGR (%), CAGR (%))
Table 73 Latin America Flexible (Converted) Plastic Packaging Market by Country, 2024-2034 (US$ Bn, AGR (%), CAGR (%))
Table 74 Latin America Flexible (Converted) Plastic Packaging Market by Printing Technology, 2024-2034 (US$ Bn, AGR (%), CAGR (%))
Table 75 Latin America Flexible (Converted) Plastic Packaging Market by End-Use Industry, 2024-2034 (US$ Bn, AGR (%), CAGR (%))
Table 76 Latin America Flexible (Converted) Plastic Packaging Market by Material, 2024-2034 (US$ Bn, AGR (%), CAGR (%))
Table 77 Latin America Flexible (Converted) Plastic Packaging Market by Type, 2024-2034 (US$ Bn, AGR (%), CAGR (%))
Table 78 Brazil Flexible (Converted) Plastic Packaging Market by Value, 2024-2034 (US$ Bn, AGR (%), CAGR (%))
Table 79 Mexico Flexible (Converted) Plastic Packaging Market by Value, 2024-2034 (US$ Bn, AGR (%), CAGR (%))
Table 80 Rest of Latin America Flexible (Converted) Plastic Packaging Market by Value, 2024-2034 (US$ Bn, AGR (%), CAGR (%))
Table 81 Strategic Outlook - Contract
Table 82 Amcor plc: Key Details, (CEO, HQ, Revenue, Founded, No. of Employees, Company Type, Website, Business Segment)
Table 83 Amcor plc: Product Benchmarking
Table 84 Amcor plc: Strategic Outlook
Table 85 Berry Global Group, Inc: Key Details, (CEO, HQ, Revenue, Founded, No. of Employees, Company Type, Website, Business Segment)
Table 86 Berry Global Group, Inc: Product Benchmarking
Table 87 Berry Global Group, Inc: Strategic Outlook
Table 88 Sonoco Products Company: Key Details, (CEO, HQ, Revenue, Founded, No. of Employees, Company Type, Website, Business Segment)
Table 89 Sonoco Products Company: Product Benchmarking
Table 90 Sonoco Products Company: Strategic Outlook
Table 91 Huhtamäki Oyj: Key Details, (CEO, HQ, Revenue, Founded, No. of Employees, Company Type, Website, Business Segment)
Table 92 Huhtamäki Oyj: Product Benchmarking
Table 93 Huhtamäki Oyj: Strategic Outlook
Table 94 Sealed Air Corporation: Key Details, (CEO, HQ, Revenue, Founded, No. of Employees, Company Type, Website, Business Segment)
Table 95 Sealed Air Corporation: Product Benchmarking
Table 96 Sealed Air Corporation: Strategic Outlook
Table 97 Constantia Flexibles Group GmbH: Key Details, (CEO, HQ, Revenue, Founded, No. of Employees, Company Type, Website, Business Segment)
Table 98 Constantia Flexibles Group GmbH: Product Benchmarking
Table 99 Constantia Flexibles Group GmbH: Strategic Outlook
Table 100 Mondi plc: Key Details, (CEO, HQ, Revenue, Founded, No. of Employees, Company Type, Website, Business Segment)
Table 101 Mondi plc: Product Benchmarking
Table 102 Mondi plc: Strategic Outlook
Table 103 Coveris Group: Key Details, (CEO, HQ, Revenue, Founded, No. of Employees, Company Type, Website, Business Segment)
Table 104 Coveris Group: Product Benchmarking
Table 105 Coveris Group: Strategic Outlook
Table 106 ProAmpac LLC: Key Details, (CEO, HQ, Revenue, Founded, No. of Employees, Company Type, Website, Business Segment)
Table 107 ProAmpac LLC: Product Benchmarking
Table 108 ProAmpac LLC: Strategic Outlook
Table 109 Printpack: Key Details, (CEO, HQ, Revenue, Founded, No. of Employees, Company Type, Website, Business Segment)
Table 110 Printpack: Product Benchmarking
Table 111 Printpack: Strategic Outlook
Table 112 Novolex: Key Details, (CEO, HQ, Revenue, Founded, No. of Employees, Company Type, Website, Business Segment)
Table 113 Novolex: Product Benchmarking
Table 114 Novolex: Strategic Outlook
Table 115 Clondalkin Group Holdings B.V.: Key Details, (CEO, HQ, Revenue, Founded, No. of Employees, Company Type, Website, Business Segment)
Table 116 Clondalkin Group Holdings B.V.: Product Benchmarking
Table 117 Clondalkin Group Holdings B.V.: Strategic Outlook
Table 118 Polytex Environmental Inks: Key Details, (CEO, HQ, Revenue, Founded, No. of Employees, Company Type, Website, Business Segment)
Table 119 Polytex Environmental Inks: Product Benchmarking
Table 120 Polytex Environmental Inks: Strategic Outlook
Table 121 Innovia Films: Key Details, (CEO, HQ, Revenue, Founded, No. of Employees, Company Type, Website, Business Segment)
Table 122 Innovia Films: Product Benchmarking
Table 123 Innovia Films: Strategic Outlook
Table 124 AptarGroup, Inc.: Key Details, (CEO, HQ, Revenue, Founded, No. of Employees, Company Type, Website, Business Segment)
Table 125 AptarGroup, Inc.: Product Benchmarking
Table 126 AptarGroup, Inc.: Strategic Outlook
図の一覧
Figure 1 Flexible (Converted) Plastic Packaging Market Segmentation
Figure 2 Flexible (Converted) Plastic Packaging Market by Printing Technology: Market Attractiveness Index
Figure 3 Flexible (Converted) Plastic Packaging Market by End-Use Industry: Market Attractiveness Index
Figure 4 Flexible (Converted) Plastic Packaging Market by Material: Market Attractiveness Index
Figure 5 Flexible (Converted) Plastic Packaging Market by Type: Market Attractiveness Index
Figure 6 Flexible (Converted) Plastic Packaging Market Attractiveness Index by Region
Figure 7 Flexible (Converted) Plastic Packaging Market: Market Dynamics
Figure 8 Wholesale Price of Plastic Raw Material
Figure 9 Flexible (Converted) Plastic Packaging Market: Porter’s Five Forces Analysis
Figure 10 Global Flexible (Converted) Plastic Packaging Market Share Forecast by COVID, 2024-2034 (%)
Figure 11 Global Flexible (Converted) Plastic Packaging Market by Region, 2024-2034 (US$ Bn, AGR (%)) (V-Shaped Recovery Scenario)
Figure 12 Global Flexible (Converted) Plastic Packaging Market by Region, 2024-2034 (US$ Bn, AGR (%)) (U-Shaped Recovery Scenario)
Figure 13 Global Flexible (Converted) Plastic Packaging Market by Region, 2024-2034 (US$ Bn, AGR (%)) (W-Shaped Recovery Scenario)
Figure 14 Global Flexible (Converted) Plastic Packaging Market by Region, 2024-2034 (US$ Bn, AGR (%)) (L-Shaped Recovery Scenario)
Figure 15 Flexible (Converted) Plastic Packaging Market: PEST Analysis
Figure 16 Flexible (Converted) Plastic Packaging Market by Printing Technology: Market Attractiveness Index
Figure 17 Global Flexible (Converted) Plastic Packaging Market by Printing Technology, 2024-2034 (US$ Bn, AGR (%))
Figure 18 Flexible (Converted) Plastic Packaging Market Share Forecast by Printing Technology, 2024, 2029, 2034 (%)
Figure 19 Flexography Technology Market by Region, 2024-2034 (US$ Bn, AGR (%))
Figure 20 Flexography Technology Market Share Forecast by Region, 2024 & 2034 (%)
Figure 21 Rotogravure Technology Market by Region, 2024-2034 (US$ Bn, AGR (%))
Figure 22 Rotogravure Technology Market Share Forecast by Region, 2024 & 2034 (%)
Figure 23 Digital Printing Technology Market by Region, 2024-2034 (US$ Bn, AGR (%))
Figure 24 Digital Printing Technology Market Share Forecast by Region, 2024 & 2034 (%)
Figure 25 Flexible (Converted) Plastic Packaging Market by End-Use Industry: Market Attractiveness Index
Figure 26 Global Flexible (Converted) Plastic Packaging Market by End-Use Industry, 2024-2034 (US$ Bn, AGR (%))
Figure 27 Flexible (Converted) Plastic Packaging Market Share Forecast by End-Use Industry, 2024, 2029, 2034 (%)
Figure 28 Food & Beverage Industry Market by Region, 2024-2034 (US$ Bn, AGR (%))
Figure 29 Food & Beverage Industry Market Share Forecast by Region, 2024 & 2034 (%)
Figure 30 Healthcare Industry Market by Region, 2024-2034 (US$ Bn, AGR (%))
Figure 31 Healthcare Industry Market Share Forecast by Region, 2024 & 2034 (%)
Figure 32 Personal Care & Cosmetics Industry Market by Region, 2024-2034 (US$ Bn, AGR (%))
Figure 33 Personal Care & Cosmetics Industry Market Share Forecast by Region, 2024 & 2034 (%)
Figure 34 Other Industry Market by Region, 2024-2034 (US$ Bn, AGR (%))
Figure 35 Other Industry Market Share Forecast by Region, 2024 & 2034 (%)
Figure 36 Flexible (Converted) Plastic Packaging Market by Material: Market Attractiveness Index
Figure 37 Global Flexible (Converted) Plastic Packaging Market by Material, 2024-2034 (US$ Bn, AGR (%))
Figure 38 Flexible (Converted) Plastic Packaging Market Share Forecast by Material, 2024, 2029, 2034 (%)
Figure 39 Polyethylene (PE) Market by Region, 2024-2034 (US$ Bn, AGR (%))
Figure 40 Polyethylene (PE) Market Share Forecast by Region, 2024 & 2034 (%)
Figure 41 Polypropylene (PP) Market by Region, 2024-2034 (US$ Bn, AGR (%))
Figure 42 Polypropylene (PP) Market Share Forecast by Region, 2024 & 2034 (%)
Figure 43 Polyethylene Terephthalate (PET) Market by Region, 2024-2034 (US$ Bn, AGR (%))
Figure 44 Polyethylene Terephthalate (PET) Market Share Forecast by Region, 2024 & 2034 (%)
Figure 45 Polyvinyl Chloride (PVC) Market by Region, 2024-2034 (US$ Bn, AGR (%))
Figure 46 Polyvinyl Chloride (PVC) Market Share Forecast by Region, 2024 & 2034 (%)
Figure 47 Other Materials Market by Region, 2024-2034 (US$ Bn, AGR (%))
Figure 48 Other Materials Market Share Forecast by Region, 2024 & 2034 (%)
Figure 49 Flexible (Converted) Plastic Packaging Market by Type: Market Attractiveness Index
Figure 50 Global Flexible (Converted) Plastic Packaging Market by Type, 2024-2034 (US$ Bn, AGR (%))
Figure 51 Flexible (Converted) Plastic Packaging Market Share Forecast by Type, 2024, 2029, 2034 (%)
Figure 52 Pouches Market by Region, 2024-2034 (US$ Bn, AGR (%))
Figure 53 Pouches Market Share Forecast by Region, 2024 & 2034 (%)
Figure 54 Bags Market by Region, 2024-2034 (US$ Bn, AGR (%))
Figure 55 Bags Market Share Forecast by Region, 2024 & 2034 (%)
Figure 56 Wraps Market by Region, 2024-2034 (US$ Bn, AGR (%))
Figure 57 Wraps Market Share Forecast by Region, 2024 & 2034 (%)
Figure 58 Films Market by Region, 2024-2034 (US$ Bn, AGR (%))
Figure 59 Films Market Share Forecast by Region, 2024 & 2034 (%)
Figure 60 Sachets Market by Region, 2024-2034 (US$ Bn, AGR (%))
Figure 61 Sachets Market Share Forecast by Region, 2024 & 2034 (%)
Figure 62 Other Type Market by Region, 2024-2034 (US$ Bn, AGR (%))
Figure 63 Other Type Market Share Forecast by Region, 2024 & 2034 (%)
Figure 64 Flexible (Converted) Plastic Packaging Market Forecast by Region 2024 and 2034 (Revenue, CAGR%)
Figure 65 Flexible (Converted) Plastic Packaging Market Share Forecast by Region 2024, 2029, 2034 (%)
Figure 66 Flexible (Converted) Plastic Packaging Market by Region, 2024-2034 (US$ Billion, AGR %)
Figure 67 North America Flexible (Converted) Plastic Packaging Market Attractiveness Index
Figure 68 North America Flexible (Converted) Plastic Packaging Market by Region, 2024, 2029 & 2034 (US$ Billion)
Figure 69 North America Flexible (Converted) Plastic Packaging Market by Value, 2024-2034 (US$ Bn, AGR (%))
Figure 70 North America Flexible (Converted) Plastic Packaging Market by Country, 2024-2034 (US$ Bn, AGR (%))
Figure 71 North America Flexible (Converted) Plastic Packaging Market Share Forecast by Country, 2024 & 2034 (%)
Figure 72 North America Flexible (Converted) Plastic Packaging Market by Printing Technology, 2024-2034 (US$ Bn, AGR (%))
Figure 73 North America Flexible (Converted) Plastic Packaging Market Share Forecast Printing Technology, 2024 & 2034 (%)
Figure 74 North America Flexible (Converted) Plastic Packaging Market by End-Use Industry, 2024-2034 (US$ Bn, AGR (%))
Figure 75 North America Flexible (Converted) Plastic Packaging Market Share Forecast by End-Use Industry, 2024 & 2034 (%)
Figure 76 North America Flexible (Converted) Plastic Packaging Market by Material, 2024-2034 (US$ Bn, AGR (%))
Figure 77 North America Flexible (Converted) Plastic Packaging Market Share Forecast by Material, 2024 & 2034 (%)
Figure 78 North America Flexible (Converted) Plastic Packaging Market by Type, 2024-2034 (US$ Bn, AGR (%))
Figure 79 North America Flexible (Converted) Plastic Packaging Market Share Forecast by Type, 2024 & 2034 (%)
Figure 80 US Flexible (Converted) Plastic Packaging Market by Value, 2024-2034 (US$ Bn, AGR (%))
Figure 81 Canada Flexible (Converted) Plastic Packaging Market by Value, 2024-2034 (US$ Bn, AGR (%))
Figure 82 Europe Flexible (Converted) Plastic Packaging Market Attractiveness Index
Figure 83 Europe Flexible (Converted) Plastic Packaging Market by Region, 2024, 2029 & 2034 (US$ Billion)
Figure 84 Europe Flexible (Converted) Plastic Packaging Market by Value, 2024-2034 (US$ Bn, AGR (%))
Figure 85 Europe Flexible (Converted) Plastic Packaging Market by Country, 2024-2034 (US$ Bn, AGR (%))
Figure 86 Europe Flexible (Converted) Plastic Packaging Market Share Forecast by Country, 2024 & 2034 (%)
Figure 87 Europe Flexible (Converted) Plastic Packaging Market by Printing Technology, 2024-2034 (US$ Bn, AGR (%))
Figure 88 Europe Flexible (Converted) Plastic Packaging Market Share Forecast Printing Technology, 2024 & 2034 (%)
Figure 89 Europe Flexible (Converted) Plastic Packaging Market by End-Use Industry, 2024-2034 (US$ Bn, AGR (%))
Figure 90 Europe Flexible (Converted) Plastic Packaging Market Share Forecast by End-Use Industry, 2024 & 2034 (%)
Figure 91 Europe Flexible (Converted) Plastic Packaging Market by Material, 2024-2034 (US$ Bn, AGR (%))
Figure 92 Europe Flexible (Converted) Plastic Packaging Market Share Forecast by Material, 2024 & 2034 (%)
Figure 93 Europe Flexible (Converted) Plastic Packaging Market by Type, 2024-2034 (US$ Bn, AGR (%))
Figure 94 Europe Flexible (Converted) Plastic Packaging Market Share Forecast by Type, 2024 & 2034 (%)
Figure 95 Germany Flexible (Converted) Plastic Packaging Market by Value, 2024-2034 (US$ Bn, AGR (%))
Figure 96 UK Flexible (Converted) Plastic Packaging Market by Value, 2024-2034 (US$ Bn, AGR (%))
Figure 97 France Flexible (Converted) Plastic Packaging Market by Value, 2024-2034 (US$ Bn, AGR (%))
Figure 98 Italy Flexible (Converted) Plastic Packaging Market by Value, 2024-2034 (US$ Bn, AGR (%))
Figure 99 Russia Flexible (Converted) Plastic Packaging Market by Value, 2024-2034 (US$ Bn, AGR (%))
Figure 100 Rest of Europe Flexible (Converted) Plastic Packaging Market by Value, 2024-2034 (US$ Bn, AGR (%))
Figure 101 Asia-Pacific Flexible (Converted) Plastic Packaging Market Attractiveness Index
Figure 102 Asia-Pacific Flexible (Converted) Plastic Packaging Market by Region, 2024, 2029 & 2034 (US$ Billion)
Figure 103 Asia-Pacific Flexible (Converted) Plastic Packaging Market by Value, 2024-2034 (US$ Bn, AGR (%))
Figure 104 Asia-Pacific Flexible (Converted) Plastic Packaging Market by Country, 2024-2034 (US$ Bn, AGR (%))
Figure 105 Asia-Pacific Flexible (Converted) Plastic Packaging Market Share Forecast by Country, 2024 & 2034 (%)
Figure 106 Asia-Pacific Flexible (Converted) Plastic Packaging Market by Printing Technology, 2024-2034 (US$ Bn, AGR (%))
Figure 107 Asia-Pacific Flexible (Converted) Plastic Packaging Market Share Forecast Printing Technology, 2024 & 2034 (%)
Figure 108 Asia-Pacific Flexible (Converted) Plastic Packaging Market by End-Use Industry, 2024-2034 (US$ Bn, AGR (%))
Figure 109 Asia-Pacific Flexible (Converted) Plastic Packaging Market Share Forecast by End-Use Industry, 2024 & 2034 (%)
Figure 110 Asia-Pacific Flexible (Converted) Plastic Packaging Market by Material, 2024-2034 (US$ Bn, AGR (%))
Figure 111 Asia-Pacific Flexible (Converted) Plastic Packaging Market Share Forecast by Material, 2024 & 2034 (%)
Figure 112 Asia-Pacific Flexible (Converted) Plastic Packaging Market by Type, 2024-2034 (US$ Bn, AGR (%))
Figure 113 Asia-Pacific Flexible (Converted) Plastic Packaging Market Share Forecast by Type, 2024 & 2034 (%)
Figure 114 China Flexible (Converted) Plastic Packaging Market by Value, 2024-2034 (US$ Bn, AGR (%))
Figure 115 India Flexible (Converted) Plastic Packaging Market by Value, 2024-2034 (US$ Bn, AGR (%))
Figure 116 Japan Flexible (Converted) Plastic Packaging Market by Value, 2024-2034 (US$ Bn, AGR (%))
Figure 117 Indonesia Flexible (Converted) Plastic Packaging Market by Value, 2024-2034 (US$ Bn, AGR (%))
Figure 118 South Korea Flexible (Converted) Plastic Packaging Market by Value, 2024-2034 (US$ Bn, AGR (%))
Figure 119 Rest of Asia-Pacific Flexible (Converted) Plastic Packaging Market by Value, 2024-2034 (US$ Bn, AGR (%))
Figure 120 Middle East and Africa Flexible (Converted) Plastic Packaging Market Attractiveness Index
Figure 121 Middle East and Africa Flexible (Converted) Plastic Packaging Market by Region, 2024, 2029 & 2034 (US$ Billion)
Figure 122 Middle East & Africa Flexible (Converted) Plastic Packaging Market by Value, 2024-2034 (US$ Bn, AGR (%))
Figure 123 Middle East & Africa Flexible (Converted) Plastic Packaging Market by Country, 2024-2034 (US$ Bn, AGR (%))
Figure 124 Middle East and Africa Flexible (Converted) Plastic Packaging Market Share Forecast by Country, 2024 & 2034 (%)
Figure 125 Middle East & Africa Flexible (Converted) Plastic Packaging Market by Printing Technology, 2024-2034 (US$ Bn, AGR (%))
Figure 126 Middle East and Africa Flexible (Converted) Plastic Packaging Market Share Forecast Printing Technology, 2024 & 2034 (%)
Figure 127 Middle East & Africa Flexible (Converted) Plastic Packaging Market by End-Use Industry, 2024-2034 (US$ Bn, AGR (%))
Figure 128 Middle East and Africa Flexible (Converted) Plastic Packaging Market Share Forecast by End-Use Industry, 2024 & 2034 (%)
Figure 129 Middle East & Africa Flexible (Converted) Plastic Packaging Market by Material, 2024-2034 (US$ Bn, AGR (%))
Figure 130 Middle East and Africa Flexible (Converted) Plastic Packaging Market Share Forecast by Material, 2024 & 2034 (%)
Figure 131 Middle East & Africa Flexible (Converted) Plastic Packaging Market by Type, 2024-2034 (US$ Bn, AGR (%))
Figure 132 Middle East and Africa Flexible (Converted) Plastic Packaging Market Share Forecast by Type, 2024 & 2034 (%)
Figure 133 GCC Flexible (Converted) Plastic Packaging Market by Value, 2024-2034 (US$ Bn, AGR (%))
Figure 134 South Africa Flexible (Converted) Plastic Packaging Market by Value, 2024-2034 (US$ Bn, AGR (%))
Figure 135 Rest of Middle East & Africa Flexible (Converted) Plastic Packaging Market by Value, 2024-2034 (US$ Bn, AGR (%))
Figure 136 Latin America Flexible (Converted) Plastic Packaging Market Attractiveness Index
Figure 137 Latin America Flexible (Converted) Plastic Packaging Market by Region, 2024, 2029 & 2034 (US$ Billion)
Figure 138 Latin America Flexible (Converted) Plastic Packaging Market by Value, 2024-2034 (US$ Bn, AGR (%))
Figure 139 Latin America Flexible (Converted) Plastic Packaging Market by Country, 2024-2034 (US$ Bn, AGR (%))
Figure 140 Latin America Flexible (Converted) Plastic Packaging Market Share Forecast by Country, 2024 & 2034 (%)
Figure 141 Latin America Flexible (Converted) Plastic Packaging Market by Printing Technology, 2024-2034 (US$ Bn, AGR (%))
Figure 142 Latin America Flexible (Converted) Plastic Packaging Market Share Forecast Printing Technology, 2024 & 2034 (%)
Figure 143 Latin America Flexible (Converted) Plastic Packaging Market by End-Use Industry, 2024-2034 (US$ Bn, AGR (%))
Figure 144 Latin America Flexible (Converted) Plastic Packaging Market Share Forecast by End-Use Industry, 2024 & 2034 (%)
Figure 145 Latin America Flexible (Converted) Plastic Packaging Market by Material, 2024-2034 (US$ Bn, AGR (%))
Figure 146 Latin America Flexible (Converted) Plastic Packaging Market Share Forecast by Material, 2024 & 2034 (%)
Figure 147 Latin America Flexible (Converted) Plastic Packaging Market by Type, 2024-2034 (US$ Bn, AGR (%))
Figure 148 Latin America Flexible (Converted) Plastic Packaging Market Share Forecast by Type, 2024 & 2034 (%)
Figure 149 Brazil Flexible (Converted) Plastic Packaging Market by Value, 2024-2034 (US$ Bn, AGR (%))
Figure 150 Mexico Flexible (Converted) Plastic Packaging Market by Value, 2024-2034 (US$ Bn, AGR (%))
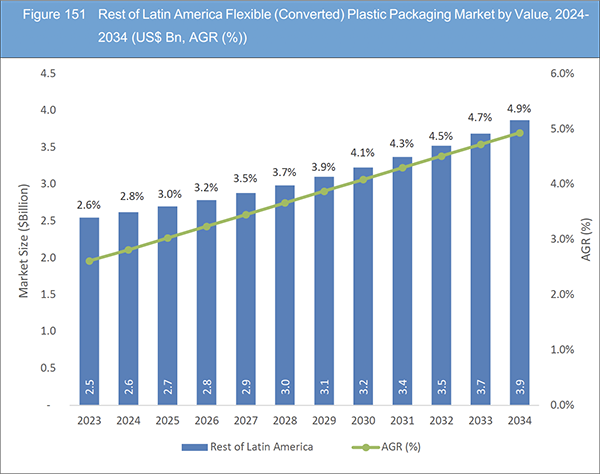
Figure 151 Rest of Latin America Flexible (Converted) Plastic Packaging Market by Value, 2024-2034 (US$ Bn, AGR (%))
Figure 152 Flexible (Converted) Plastic Packaging Market: Company Share, 2022
Figure 153 Amcor plc.: Net Revenue, 2019-2023(US$ Million, AGR%)
Figure 154 Amcor plc.: R&D, 2019-2023 (US$ Million, AGR%)
Figure 155 Amcor plc.: Business Segment Revenue Share, 2023 (%)
Figure 156 Berry Global Group, Inc.: Net Revenue, 2019-2023 (US$ Million, AGR%)
Figure 157 Berry Global Group, Inc.: R&D, 2019-2023 (US$ Million, AGR%)
Figure 158 Berry Global Group, Inc.: Regional Revenue Share, 2023 (%)
Figure 159 Berry Global Group, Inc.: Business Segment Revenue Share, 2023 (%)
Figure 160 Sonoco Products Company.: Net Revenue, 2018-2022 (US$ Million, AGR%)
Figure 161 Sonoco Products Company.: R&D, 2018-2022 (US$ Million, AGR%)
Figure 162 Sonoco Products Company.: Regional Revenue Share, 2022 (%)
Figure 163 Sonoco Products Company.: Business Segment Revenue Share, 2022 (%)
Figure 164 Huhtamäki Oyj.: Net Revenue, 2018-2022 (US$ Million, AGR%)
Figure 165 Huhtamäki Oyj.: R&D, 2018-2022 (US$ Million, AGR%)
Figure 166 Huhtamäki Oyj.: Regional Revenue Share, 2022 (%)
Figure 167 Huhtamäki Oyj.: Business Segment Revenue Share, 2022 (%)
Figure 168 Sealed Air Corporation.: Net Revenue, 2018-2022 (US$ Million, AGR%)
Figure 169 Sealed Air Corporation.: R&D, 2018-2022 (US$ Million, AGR%)
Figure 170 Sealed Air Corporation.: Regional Revenue Share, 2022 (%)
Figure 171 Sealed Air Corporation.: Business Segment Revenue Share, 2022 (%)
Figure 172 Mondi plc.: Net Revenue, 2018-2022 (US$ Million, AGR%)
Figure 173 Mondi plc.: Business Segment Revenue Share, 2022 (%)
Figure 174 AptarGroup, Inc.: Net Revenue, 2018-2022 (US$ Million, AGR%)
Figure 175 AptarGroup, Inc.: R&D, 2018-2022 (US$ Million, AGR%)
Figure 176 AptarGroup, Inc.: Regional Revenue Share, 2022 (%)
Figure 177 AptarGroup, Inc.: Business Segment Revenue Share, 2022 (%)
ページTOPに戻る
Summary
Report Details
The Flexible (Converted) Plastic Packaging Market Report 2024-2034: This report will prove invaluable to leading firms striving for new revenue pockets if they wish to better understand the industry and its underlying dynamics. It will be useful for companies that would like to expand into different industries or to expand their existing operations in a new region.
Drivers and Opportunities in the Evolving Landscape of the Flexible Converted Plastic Packaging Market
The flexible converted plastic packaging market is witnessing a dynamic surge propelled by diverse and compelling factors. Firstly, an escalating emphasis on sustainability is urging manufacturers to pioneer the development of eco-friendly packaging materials, exemplified by recyclable and biodegradable plastics. As consumer awareness and regulatory pressures converge towards eco-conscious alternatives, this transformative shift creates a profound growth opportunity for the market. Secondly, the exponential growth of the e-commerce sector has triggered an upswing in demand for packaging solutions adept at safeguarding products during shipping while enhancing the overall unboxing experience. The imperative for durable and visually appealing packaging materials unfurls novel pathways for market expansion.
Rising Price of Raw Material Restrain Market Growth
The escalating prices of raw materials in the flexible converted plastic packaging market present a significant restraining factor that impacts various facets of the industry. As the foundation of plastic packaging, raw materials such as petroleum-derived plastics (e.g., polyethylene and polypropylene) are inherently sensitive to fluctuations in global oil prices. This sensitivity poses a dual challenge for both manufacturers and consumers of plastic packaging. The first consequence of rising raw material prices is the increased production cost for plastic packaging. Manufacturers incur higher expenses in sourcing, processing, and converting raw materials into finished products. These elevated costs are often passed on to consumers, making plastic packaging less cost-competitive, especially in markets with tight profit margins.
What Questions Should You Ask before Buying a Market Research Report?
• How is the flexible (converted) plastic packaging market evolving?
• What is driving and restraining the flexible (converted) plastic packaging market?
• How will each flexible (converted) plastic packaging submarket segment grow over the forecast period and how much revenue will these submarkets account for in 2034?
• How will the market shares for each flexible (converted) plastic packaging submarket develop from 2024 to 2034?
• What will be the main driver for the overall market from 2024 to 2034?
• Will leading flexible (converted) plastic packaging markets broadly follow the macroeconomic dynamics, or will individual national markets outperform others?
• How will the market shares of the national markets change by 2034 and which geographical region will lead the market in 2034?
• Who are the leading players and what are their prospects over the forecast period?
• What are the flexible (converted) plastic packaging projects for these leading companies?
• How will the industry evolve during the period between 2024 and 2034? What are the implications of flexible (converted) plastic packaging projects taking place now and over the next 10 years?
• Is there a greater need for product commercialisation to further scale the flexible (converted) plastic packaging market?
• Where is the flexible (converted) plastic packaging market heading and how can you ensure you are at the forefront of the market?
• What are the best investment options for new product and service lines?
• What are the key prospects for moving companies into a new growth path and C-suite?
You need to discover how this will impact the flexible (converted) plastic packaging market today, and over the next 10 years:
• Our 407-page report provides 124 tables and 176 charts/graphs exclusively to you.
• The report highlights key lucrative areas in the industry so you can target them – NOW.
• It contains in-depth analysis of global, regional and national sales and growth.
• It highlights for you the key successful trends, changes and revenue projections made by your competitors.
This report tells you TODAY how the flexible (converted) plastic packaging market will develop in the next 10 years, and in line with the variations in COVID-19 economic recession and bounce. This market is more critical now than at any point over the last 10 years.
Forecasts to 2034 and other analyses reveal commercial prospects
• In addition to revenue forecasting to 2034, our new study provides you with recent results, growth rates, and market shares.
• You will find original analyses, with business outlooks and developments.
• Discover qualitative analyses (including market dynamics, drivers, opportunities, restraints and challenges), cost structure, impact of rising flexible (converted) plastic packaging prices and recent developments.
This report includes data analysis and invaluable insight into how COVID-19 will affect the industry and your company. Four COVID-19 recovery patterns and their impact, namely, “V”, “L”, “W” and “U” are discussed in this report.
Segments Covered in the Report
Market Segment by Printing Technology
• Flexography Technology
• Rotogravure Technology
• Digital Printing Technology
Market Segment by End-Use Industry
• Food & Beverage Industry
• Healthcare Industry
• Personal Care & Cosmetics Industry
• Other Industry
Market Segment by Material
• Polyethylene (PE)
• Polypropylene (PP)
• Polyethylene Terephthalate (PET)
• Polyvinyl Chloride (PVC)
• Other Materials
Market Segment by Type
• Pouches
• Bags
• Wraps
• Films
• Sachets
• Other Type
In addition to the revenue predictions for the overall world market and segments, you will also find revenue forecasts for four regional and 20 leading national markets:
North America
• U.S.
• Canada
Europe
• Germany
• Russia
• United Kingdom
• France
• Italy
• Rest of Europe
Asia Pacific
• China
• Japan
• India
• Indonesia
• South Korea
• Rest of Asia Pacific
Latin America
• Brazil
• Mexico
• Rest of Latin America
Middle East & Africa
• GCC
• South Africa
• Rest of Middle East & Africa
The report also includes profiles and for some of the leading companies in the Flexible (Converted) Plastic Packaging Market, 2024 to 2034, with a focus on this segment of these companies’ operations.
Leading companies profiled in the report
• Amcor plc
• AptarGroup, Inc.
• Berry Global Group, Inc
• Clondalkin Group Holdings B.V.
• Constantia Flexibles Group GmbH
• Coveris Group
• Huhtamäki Oyj
• Innovia Films
• Mondi plc
• Novolex Holdings Inc.
• Polytex Environmental Inks
• Printpack
• Pro Ampac LLC
• Sealed Air Corporation
• Sonoco Products Company
Overall world revenue for Flexible (Converted) Plastic Packaging Market, 2024 to 2034 in terms of value the market will surpass US$163.9 billion in 2024, our work calculates. We predict strong revenue growth through to 2034. Our work identifies which organizations hold the greatest potential. Discover their capabilities, progress, and commercial prospects, helping you stay ahead.
How will the Flexible (Converted) Plastic Packaging Market, 2024 to 2034 report help you?
In summary, our 400+ page report provides you with the following knowledge:
• Revenue forecasts to 2034 for Flexible (Converted) Plastic Packaging Market, 2024 to 2034 Market, with forecasts for printing technology, end-use industry, material, and type, each forecast at a global and regional level – discover the industry’s prospects, finding the most lucrative places for investments and revenues.
• Revenue forecasts to 2034 for four regional and 20 key national markets – See forecasts for the Flexible (Converted) Plastic Packaging Market, 2024 to 2034 market in North America, Europe, Asia-Pacific, Latin America and Middle East & Africa. Also forecasted is the market in the US, Canada, Brazil, Germany, France, UK, Italy, China, India, Japan, and Australia among other prominent economies.
• Prospects for established firms and those seeking to enter the market – including company profiles for 15 of the major companies involved in the Flexible (Converted) Plastic Packaging Market, 2024 to 2034.
Find quantitative and qualitative analyses with independent predictions. Receive information that only our report contains, staying informed with invaluable business intelligence.
Information found nowhere else
With our new report, you are less likely to fall behind in knowledge or miss out on opportunities. See how our work could benefit your research, analyses, and decisions. Visiongain’s study is for everybody needing commercial analyses for the Flexible (Converted) Plastic Packaging Market, 2024 to 2034, market-leading companies. You will find data, trends and predictions.
ページTOPに戻る
Table of Contents
Table of Contents
1 Report Overview
1.1 Objectives of the Study
1.2 Introduction to Flexible (Converted) Plastic Packaging Market
1.3 What This Report Delivers
1.4 Why You Should Read This Report
1.5 Key Questions Answered by This Analytical Report
1.6 Who Is This Report for?
1.7 Methodology
1.7.1 Market Definitions
1.7.2 Market Evaluation & Forecasting Methodology
1.7.3 Data Validation
1.7.3.1 Primary Research
1.7.3.2 Secondary Research
1.8 Frequently Asked Questions (FAQs)
1.9 Associated Visiongain Reports
1.10 About Visiongain
2 Executive Summary
3 Market Overview
3.1 Key Findings
3.2 Market Dynamics
3.2.1 Market Driving Factors
3.2.1.1 Better Substitute for Traditional Packaging Material Driving the Market Growth
3.2.1.2 Increase Product Shelf-Life Driving the Market Growth
3.2.1.3 The Market is Experiencing Growth Due to an Upsurge in Demand from End-Use Industries
3.2.2 Market Restraining Factors
3.2.2.1 Rising Price of Raw Material Restrain Market Growth
3.2.2.2 The Concerns Over the Environmental Impacts of Converted Plastic Packaging Waste
3.2.2.3 Recycling Challenges with Flexible Packaging Products
3.2.3 Market Opportunities
3.2.3.1 Innovation in packaging Opportunities for the Flexible Converted Plastic Packaging Market
3.2.3.2 Rising Demand from E commerce Industry
3.2.3.3 Governments and Regulatory Bodies are Increasingly Focusing on Packaging Waste Reduction
3.3 Porter’s Five Forces Analysis
3.3.1 Bargaining Power of Suppliers (Medium to High)
3.3.2 Bargaining Power of Buyers (Medium to High)
3.3.3 Competitive Rivalry (High)
3.3.4 Threat from Substitutes (Medium)
3.3.5 Threat of New Entrants (Low)
3.4 COVID-19 Impact Analysis
3.4.1 “V-Shaped Recovery”
3.4.2 “U-Shaped Recovery”
3.4.3 “W-Shaped Recovery”
3.4.4 “L-Shaped Recovery”
3.5 PEST Analysis
4 Flexible (Converted) Plastic Packaging Market Analysis by Printing Technology
4.1 Key Findings
4.2 Printing Technology Segment: Market Attractiveness Index
4.3 Flexible (Converted) Plastic Packaging Market Size Estimation and Forecast by Printing Technology
4.4 Flexography Technology
4.4.1 Market Size by Region, 2024-2034 (US$ Billion)
4.4.2 Market Share by Region, 2024 & 2034 (%)
4.5 Rotogravure Technology
4.5.1 Market Size by Region, 2024-2034 (US$ Billion)
4.5.2 Market Share by Region, 2024 & 2034 (%)
4.6 Digital Printing Technology
4.6.1 Market Size by Region, 2024-2034 (US$ Billion)
4.6.2 Market Share by Region, 2024 & 2034 (%)
5 Flexible (Converted) Plastic Packaging Market Analysis by End-Use Industry
5.1 Key Findings
5.2 End-Use Industry Segment: Market Attractiveness Index
5.3 Flexible (Converted) Plastic Packaging Market Size Estimation and Forecast by End-Use Industry
5.4 Food & Beverage Industry
5.4.1 Market Size by Region, 2024-2034 (US$ Billion)
5.4.2 Market Share by Region, 2024 & 2034 (%)
5.5 Healthcare Industry
5.5.1 Market Size by Region, 2024-2034 (US$ Billion)
5.5.2 Market Share by Region, 2024 & 2034 (%)
5.6 Personal Care & Cosmetics Industry
5.6.1 Market Size by Region, 2024-2034 (US$ Billion)
5.6.2 Market Share by Region, 2024 & 2034 (%)
5.7 Other Industry
5.7.1 Market Size by Region, 2024-2034 (US$ Billion)
5.7.2 Market Share by Region, 2024 & 2034 (%)
6 Flexible (Converted) Plastic Packaging Market Analysis by Material
6.1 Key Findings
6.2 Material Segment: Market Attractiveness Index
6.3 Flexible (Converted) Plastic Packaging Market Size Estimation and Forecast by Material
6.4 Polyethylene (PE)
6.4.1 Market Size by Region, 2024-2034 (US$ Billion)
6.4.2 Market Share by Region, 2024 & 2034 (%)
6.5 Polypropylene (PP)
6.5.1 Market Size by Region, 2024-2034 (US$ Billion)
6.5.2 Market Share by Region, 2024 & 2034 (%)
6.6 Polyethylene Terephthalate (PET)
6.6.1 Market Size by Region, 2024-2034 (US$ Billion)
6.6.2 Market Share by Region, 2024 & 2034 (%)
6.7 Polyvinyl Chloride (PVC)
6.7.1 Market Size by Region, 2024-2034 (US$ Billion)
6.7.2 Market Share by Region, 2024 & 2034 (%)
6.8 Other Materials
6.8.1 Market Size by Region, 2024-2034 (US$ Billion)
6.8.2 Market Share by Region, 2024 & 2034 (%)
7 Flexible (Converted) Plastic Packaging Market Analysis by Type
7.1 Key Findings
7.2 Type Segment: Market Attractiveness Index
7.3 Flexible (Converted) Plastic Packaging Market Size Estimation and Forecast by Type
7.4 Pouches
7.4.1 Market Size by Region, 2024-2034 (US$ Billion)
7.4.2 Market Share by Region, 2024 & 2034 (%)
7.5 Bags
7.5.1 Market Size by Region, 2024-2034 (US$ Billion)
7.5.2 Market Share by Region, 2024 & 2034 (%)
7.6 Wraps
7.6.1 Market Size by Region, 2024-2034 (US$ Billion)
7.6.2 Market Share by Region, 2024 & 2034 (%)
7.7 Films
7.7.1 Market Size by Region, 2024-2034 (US$ Billion)
7.7.2 Market Share by Region, 2024 & 2034 (%)
7.8 Sachets
7.8.1 Market Size by Region, 2024-2034 (US$ Billion)
7.8.2 Market Share by Region, 2024 & 2034 (%)
7.9 Other Type
7.9.1 Market Size by Region, 2024-2034 (US$ Billion)
7.9.2 Market Share by Region, 2024 & 2034 (%)
8 Flexible (Converted) Plastic Packaging Market Analysis by Region
8.1 Key Findings
8.2 Regional Market Size Estimation and Forecast
9 North America Flexible (Converted) Plastic Packaging Market Analysis
9.1 Key Findings
9.2 North America Flexible (Converted) Plastic Packaging Market Attractiveness Index
9.3 North America Flexible (Converted) Plastic Packaging Market by Country, 2024, 2029 & 2034 (US$ Billion)
9.4 North America Flexible (Converted) Plastic Packaging Market Size Estimation and Forecast
9.5 North America Flexible (Converted) Plastic Packaging Market Size Estimation and Forecast by Country
9.6 North America Flexible (Converted) Plastic Packaging Market Size Estimation and Forecast by Printing Technology
9.7 North America Flexible (Converted) Plastic Packaging Market Size Estimation and Forecast by End-Use Industry
9.8 North America Flexible (Converted) Plastic Packaging Market Size Estimation and Forecast by Material
9.9 North America Flexible (Converted) Plastic Packaging Market Size Estimation and Forecast by Type
9.10 U.S. Flexible (Converted) Plastic Packaging Market Analysis
9.11 Canada Flexible (Converted) Plastic Packaging Market Analysis
10 Europe Flexible (Converted) Plastic Packaging Market Analysis
10.1 Key Findings
10.2 Europe Flexible (Converted) Plastic Packaging Market Attractiveness Index
10.3 Europe Flexible (Converted) Plastic Packaging Market by Country, 2024, 2029 & 2034 (US$ Billion)
10.4 Europe Flexible (Converted) Plastic Packaging Market Size Estimation and Forecast
10.5 Europe Flexible (Converted) Plastic Packaging Market Size Estimation and Forecast by Country
10.6 Europe Flexible (Converted) Plastic Packaging Market Size Estimation and Forecast by Printing Technology
10.7 Europe Flexible (Converted) Plastic Packaging Market Size Estimation and Forecast by End-Use Industry
10.8 Europe Flexible (Converted) Plastic Packaging Market Size Estimation and Forecast by Material
10.9 Europe Flexible (Converted) Plastic Packaging Market Size Estimation and Forecast by Type
10.10 Germany Flexible (Converted) Plastic Packaging Market Analysis
10.11 UK Flexible (Converted) Plastic Packaging Market Analysis
10.12 France Flexible (Converted) Plastic Packaging Market Analysis
10.13 Italy Flexible (Converted) Plastic Packaging Market Analysis
10.14 Russia Flexible (Converted) Plastic Packaging Market Analysis
10.15 Rest of Europe Flexible (Converted) Plastic Packaging Market Analysis
11 Asia-Pacific Flexible (Converted) Plastic Packaging Market Analysis
11.1 Key Findings
11.2 Asia-Pacific Flexible (Converted) Plastic Packaging Market Attractiveness Index
11.3 Asia-Pacific Flexible (Converted) Plastic Packaging Market by Country, 2024, 2029 & 2034 (US$ Billion)
11.4 Asia-Pacific Flexible (Converted) Plastic Packaging Market Size Estimation and Forecast
11.5 Asia-Pacific Flexible (Converted) Plastic Packaging Market Size Estimation and Forecast by Country
11.6 Asia-Pacific Flexible (Converted) Plastic Packaging Market Size Estimation and Forecast by Printing Technology
11.7 Asia-Pacific Flexible (Converted) Plastic Packaging Market Size Estimation and Forecast by End-Use Industry
11.8 Asia-Pacific Flexible (Converted) Plastic Packaging Market Size Estimation and Forecast by Material
11.9 Asia-Pacific Flexible (Converted) Plastic Packaging Market Size Estimation and Forecast by Type
11.10 China Flexible (Converted) Plastic Packaging Market Analysis
11.11 India Flexible (Converted) Plastic Packaging Market Analysis
11.12 Japan Flexible (Converted) Plastic Packaging Market Analysis
11.13 Indonesia Flexible (Converted) Plastic Packaging Market Analysis
11.14 South Korea Flexible (Converted) Plastic Packaging Market Analysis
11.15 Rest of Asia-Pacific Flexible (Converted) Plastic Packaging Market Analysis
12 Middle East and Africa Flexible (Converted) Plastic Packaging Market Analysis
12.1 Key Findings
12.2 Middle East and Africa Flexible (Converted) Plastic Packaging Market Attractiveness Index
12.3 Middle East and Africa Flexible (Converted) Plastic Packaging Market by Country, 2024, 2029 & 2034 (US$ Billion)
12.4 Middle East and Africa Flexible (Converted) Plastic Packaging Market Size Estimation and Forecast
12.5 Middle East and Africa Flexible (Converted) Plastic Packaging Market Size Estimation and Forecast by Country
12.6 Middle East and Africa Flexible (Converted) Plastic Packaging Market Size Estimation and Forecast by Printing Technology
12.7 Middle East and Africa Flexible (Converted) Plastic Packaging Market Size Estimation and Forecast by End-Use Industry
12.8 Middle East and Africa Flexible (Converted) Plastic Packaging Market Size Estimation and Forecast by Material
12.9 Middle East and Africa Flexible (Converted) Plastic Packaging Market Size Estimation and Forecast by Type
12.10 GCC Flexible (Converted) Plastic Packaging Market Analysis
12.11 South Africa Flexible (Converted) Plastic Packaging Market Analysis
12.12 Rest of Middle East & Africa Flexible (Converted) Plastic Packaging Market Analysis
13 Latin America Flexible (Converted) Plastic Packaging Market Analysis
13.1 Key Findings
13.2 Latin America Flexible (Converted) Plastic Packaging Market Attractiveness Index
13.3 Latin America Flexible (Converted) Plastic Packaging Market by Country, 2024, 2029 & 2034 (US$ Billion)
13.4 Latin America Flexible (Converted) Plastic Packaging Market Size Estimation and Forecast
13.5 Latin America Flexible (Converted) Plastic Packaging Market Size Estimation and Forecast by Country
13.6 Latin America Flexible (Converted) Plastic Packaging Market Size Estimation and Forecast by Printing Technology
13.7 Latin America Flexible (Converted) Plastic Packaging Market Size Estimation and Forecast by End-Use Industry
13.8 Latin America Flexible (Converted) Plastic Packaging Market Size Estimation and Forecast by Material
13.9 Latin America Flexible (Converted) Plastic Packaging Market Size Estimation and Forecast by Type
13.10 Brazil Flexible (Converted) Plastic Packaging Market Analysis
13.11 Mexico Flexible (Converted) Plastic Packaging Market Analysis
13.12 Rest of Latin America Flexible (Converted) Plastic Packaging Market Analysis
14 Company Profiles
14.1 Competitive Landscape, 2022
14.2 Strategic Outlook
14.3 Amcor plc
14.3.1 Company Snapshot
14.3.2 Company Overview
14.3.3 Financial Analysis
14.3.3.1 Net Revenue, 2019-2023
14.3.3.2 R&D, 2019-2023
14.3.3.3 Business Segment Revenue Share, 2023 (%)
14.3.4 Product Benchmarking
14.3.5 Strategic Outlook
14.4 Berry Global Group, Inc
14.4.1 Company Snapshot
14.4.2 Company Overview
14.4.3 Financial Analysis
14.4.3.1 Net Revenue, 2019-2023
14.4.3.2 R&D, 2019-2023
14.4.3.3 Regional Revenue Share, 2023 (%)
14.4.3.4 Business Segment Revenue Share, 2023 (%)
14.4.4 Product Benchmarking
14.4.5 Strategic Outlook
14.5 Sonoco Products Company
14.5.1 Company Snapshot
14.5.2 Company Overview
14.5.3 Financial Analysis
14.5.3.1 Net Revenue, 2018-2022
14.5.3.2 R&D, 2018-2022
14.5.3.3 Regional Revenue Share, 2022 (%)
14.5.3.4 Business Segment Revenue Share, 2022 (%)
14.5.4 Product Benchmarking
14.5.5 Strategic Outlook
14.6 Huhtamäki Oyj
14.6.1 Company Snapshot
14.6.2 Company Overview
14.6.3 Financial Analysis
14.6.3.1 Net Revenue, 2018-2022
14.6.3.2 R&D, 2018-2022
14.6.3.3 Regional Revenue Share, 2022 (%)
14.6.3.4 Business Segment Revenue Share, 2022 (%)
14.6.4 Product Benchmarking
14.6.5 Strategic Outlook
14.7 Sealed Air Corporation
14.7.1 Company Snapshot
14.7.2 Company Overview
14.7.3 Financial Analysis
14.7.3.1 Net Revenue, 2018-2022
14.7.3.2 R&D, 2018-2022
14.7.3.3 Regional Revenue Share, 2022 (%)
14.7.3.4 Business Segment Revenue Share, 2022 (%)
14.7.4 Product Benchmarking
14.7.5 Strategic Outlook
14.8 Constantia Flexibles Group GmbH
14.8.1 Company Snapshot
14.8.2 Company Overview
14.8.3 Product Benchmarking
14.8.4 Strategic Outlook
14.9 Mondi plc
14.9.1 Company Snapshot
14.9.2 Company Overview
14.9.3 Financial Analysis
14.9.3.1 Net Revenue, 2018-2022
14.9.3.2 Business Segment Revenue Share, 2022 (%)
14.9.4 Product Benchmarking
14.9.5 Strategic Outlook
14.10 Coveris Group
14.10.1 Company Snapshot
14.10.2 Company Overview
14.10.3 Product Benchmarking
14.10.4 Strategic Outlook
14.11 Pro Ampac LLC
14.11.1 Company Snapshot
14.11.2 Company Overview
14.11.3 Product Benchmarking
14.11.4 Strategic Outlook
14.12 Printpack
14.12.1 Company Snapshot
14.12.2 Company Overview
14.12.3 Product Benchmarking
14.12.4 Strategic Outlook
14.13 Novolex
14.13.1 Company Snapshot
14.13.2 Company Overview
14.13.3 Product Benchmarking
14.13.4 Strategic Outlook
14.14 Clondalkin Group Holdings B.V.
14.14.1 Company Snapshot
14.14.2 Company Overview
14.14.3 Product Benchmarking
14.14.4 Strategic Outlook
14.15 Polytex Environmental Inks
14.15.1 Company Snapshot
14.15.2 Company Overview
14.15.3 Product Benchmarking
14.15.4 Strategic Outlook
14.16 Innovia Films
14.16.1 Company Snapshot
14.16.2 Company Overview
14.16.3 Product Benchmarking
14.16.4 Strategic Outlook
14.17 AptarGroup, Inc.
14.17.1 Company Snapshot
14.17.2 Company Overview
14.17.3 Financial Analysis
14.17.3.1 Net Revenue, 2018-2022
14.17.3.2 R&D, 2018-2022
14.17.3.3 Regional Revenue Share, 2022 (%)
14.17.3.4 Business Segment Revenue Share, 2022 (%)
14.17.4 Product Benchmarking
14.17.5 Strategic Outlook
15 Conclusion and Recommendations
15.1 Concluding Remarks from Visiongain
15.2 Recommendations for Market Players
ページTOPに戻る
Press Release
List of Tables
Table 1 Flexible (Converted) Plastic Packaging Market Snapshot, 2024 & 2034 (US$ Billion, CAGR %)
Table 2 Raw Material Prices for Flexible Packaging
Table 3 Plastic Waste Data
Table 4 Global Flexible (Converted) Plastic Packaging Market by Region, 2024-2034 (US$ Bn, AGR (%), CAGR (%)) (V-Shaped Recovery Scenario)
Table 5 Global Flexible (Converted) Plastic Packaging Market by Region, 2024-2034 (US$ Bn, AGR (%), CAGR (%)) (U-Shaped Recovery Scenario)
Table 6 Global Flexible (Converted) Plastic Packaging Market by Region, 2024-2034 (US$ Bn, AGR (%), CAGR (%)) (W-Shaped Recovery Scenario)
Table 7 Global Flexible (Converted) Plastic Packaging Market by Region, 2024-2034 (US$ Bn, AGR (%), CAGR (%)) (L-Shaped Recovery Scenario)
Table 8 Global Flexible (Converted) Plastic Packaging Market by Printing Technology, 2024-2034 (US$ Bn, AGR (%), CAGR (%))
Table 9 Flexography Technology Market by Region, 2024-2034 (US$ Bn, AGR (%), CAGR (%))
Table 10 Rotogravure Technology Market by Region, 2024-2034 (US$ Bn, AGR (%), CAGR (%))
Table 11 Digital Printing Technology Market by Region, 2024-2034 (US$ Bn, AGR (%), CAGR (%))
Table 12 Global Flexible (Converted) Plastic Packaging Market by End-Use Industry, 2024-2034 (US$ Bn, AGR (%), CAGR (%))
Table 13 Food & Beverage Industry Market by Region, 2024-2034 (US$ Bn, AGR (%), CAGR (%))
Table 14 Healthcare Industry Market by Region, 2024-2034 (US$ Bn, AGR (%), CAGR (%))
Table 15 Personal Care & Cosmetics Industry Market by Region, 2024-2034 (US$ Bn, AGR (%), CAGR (%))
Table 16 Other Industry Market by Region, 2024-2034 (US$ Bn, AGR (%), CAGR (%))
Table 17 Global Flexible (Converted) Plastic Packaging Market by Material, 2024-2034 (US$ Bn, AGR (%), CAGR (%))
Table 18 Polyethylene (PE) Market by Region, 2024-2034 (US$ Bn, AGR (%), CAGR (%))
Table 19 Polypropylene (PP) Market by Region, 2024-2034 (US$ Bn, AGR (%), CAGR (%))
Table 20 Polyethylene Terephthalate (PET) Market by Region, 2024-2034 (US$ Bn, AGR (%), CAGR (%))
Table 21 Polyvinyl Chloride (PVC) Market by Region, 2024-2034 (US$ Bn, AGR (%), CAGR (%))
Table 22 Other Materials Market by Region, 2024-2034 (US$ Bn, AGR (%), CAGR (%))
Table 23 Global Flexible (Converted) Plastic Packaging Market by Type, 2024-2034 (US$ Bn, AGR (%), CAGR (%))
Table 24 Pouches Market by Region, 2024-2034 (US$ Bn, AGR (%), CAGR (%))
Table 25 Bags Market by Region, 2024-2034 (US$ Bn, AGR (%), CAGR (%))
Table 26 Wraps Market by Region, 2024-2034 (US$ Bn, AGR (%), CAGR (%))
Table 27 Films Market by Region, 2024-2034 (US$ Bn, AGR (%), CAGR (%))
Table 28 Sachets Market by Region, 2024-2034 (US$ Bn, AGR (%), CAGR (%))
Table 29 Other Type Market by Region, 2024-2034 (US$ Bn, AGR (%), CAGR (%))
Table 30 Flexible (Converted) Plastic Packaging Market Forecast by Region, 2024-2034 (US$ Billion, AGR%, CAGR%)
Table 31 North America Flexible (Converted) Plastic Packaging Market by Value, 2024-2034 (US$ Bn, AGR (%), CAGR (%))
Table 32 North America Flexible (Converted) Plastic Packaging Market by Country, 2024-2034 (US$ Bn, AGR (%), CAGR (%))
Table 33 North America Flexible (Converted) Plastic Packaging Market by Printing Technology, 2024-2034 (US$ Bn, AGR (%), CAGR (%))
Table 34 North America Flexible (Converted) Plastic Packaging Market by End-Use Industry, 2024-2034 (US$ Bn, AGR (%), CAGR (%))
Table 35 North America Flexible (Converted) Plastic Packaging Market by Material, 2024-2034 (US$ Bn, AGR (%), CAGR (%))
Table 36 North America Flexible (Converted) Plastic Packaging Market by Type, 2024-2034 (US$ Bn, AGR (%), CAGR (%))
Table 37 US Flexible (Converted) Plastic Packaging Market by Value, 2024-2034 (US$ Bn, AGR (%), CAGR (%))
Table 38 Canada Flexible (Converted) Plastic Packaging Market by Value, 2024-2034 (US$ Bn, AGR (%), CAGR (%))
Table 39 Europe Flexible (Converted) Plastic Packaging Market by Value, 2024-2034 (US$ Bn, AGR (%), CAGR (%))
Table 40 Europe Flexible (Converted) Plastic Packaging Market by Country, 2024-2034 (US$ Bn, AGR (%), CAGR (%))
Table 41 Europe Flexible (Converted) Plastic Packaging Market by Printing Technology, 2024-2034 (US$ Bn, AGR (%), CAGR (%))
Table 42 Europe Flexible (Converted) Plastic Packaging Market by End-Use Industry, 2024-2034 (US$ Bn, AGR (%), CAGR (%))
Table 43 Europe Flexible (Converted) Plastic Packaging Market by Material, 2024-2034 (US$ Bn, AGR (%), CAGR (%))
Table 44 Europe Flexible (Converted) Plastic Packaging Market by Type, 2024-2034 (US$ Bn, AGR (%), CAGR (%))
Table 45 Germany Flexible (Converted) Plastic Packaging Market by Value, 2024-2034 (US$ Bn, AGR (%), CAGR (%))
Table 46 UK Flexible (Converted) Plastic Packaging Market by Value, 2024-2034 (US$ Bn, AGR (%), CAGR (%))
Table 47 France Flexible (Converted) Plastic Packaging Market by Value, 2024-2034 (US$ Bn, AGR (%), CAGR (%))
Table 48 Italy Flexible (Converted) Plastic Packaging Market by Value, 2024-2034 (US$ Bn, AGR (%), CAGR (%))
Table 49 Russia Flexible (Converted) Plastic Packaging Market by Value, 2024-2034 (US$ Bn, AGR (%), CAGR (%))
Table 50 Rest of Europe Flexible (Converted) Plastic Packaging Market by Value, 2024-2034 (US$ Bn, AGR (%), CAGR (%))
Table 51 Asia-Pacific Flexible (Converted) Plastic Packaging Market by Value, 2024-2034 (US$ Bn, AGR (%), CAGR (%))
Table 52 Asia-Pacific Flexible (Converted) Plastic Packaging Market by Country, 2024-2034 (US$ Bn, AGR (%), CAGR (%))
Table 53 Asia-Pacific Flexible (Converted) Plastic Packaging Market by Printing Technology, 2024-2034 (US$ Bn, AGR (%), CAGR (%))
Table 54 Asia-Pacific Flexible (Converted) Plastic Packaging Market by End-Use Industry, 2024-2034 (US$ Bn, AGR (%), CAGR (%))
Table 55 Asia-Pacific Flexible (Converted) Plastic Packaging Market by Material, 2024-2034 (US$ Bn, AGR (%), CAGR (%))
Table 56 Asia-Pacific Flexible (Converted) Plastic Packaging Market by Type, 2024-2034 (US$ Bn, AGR (%), CAGR (%))
Table 57 China Flexible (Converted) Plastic Packaging Market by Value, 2024-2034 (US$ Bn, AGR (%), CAGR (%))
Table 58 India Flexible (Converted) Plastic Packaging Market by Value, 2024-2034 (US$ Bn, AGR (%), CAGR (%))
Table 59 Japan Flexible (Converted) Plastic Packaging Market by Value, 2024-2034 (US$ Bn, AGR (%), CAGR (%))
Table 60 Indonesia Flexible (Converted) Plastic Packaging Market by Value, 2024-2034 (US$ Bn, AGR (%), CAGR (%))
Table 61 South Korea Flexible (Converted) Plastic Packaging Market by Value, 2024-2034 (US$ Bn, AGR (%), CAGR (%))
Table 62 Rest of Asia-Pacific Flexible (Converted) Plastic Packaging Market by Value, 2024-2034 (US$ Bn, AGR (%), CAGR (%))
Table 63 Middle East & Africa Flexible (Converted) Plastic Packaging Market by Value, 2024-2034 (US$ Bn, AGR (%), CAGR (%))
Table 64 Middle East & Africa Flexible (Converted) Plastic Packaging Market by Country, 2024-2034 (US$ Bn, AGR (%), CAGR (%))
Table 65 Middle East & Africa Flexible (Converted) Plastic Packaging Market by Printing Technology, 2024-2034 (US$ Bn, AGR (%), CAGR (%))
Table 66 Middle East & Africa Flexible (Converted) Plastic Packaging Market by End-Use Industry, 2024-2034 (US$ Bn, AGR (%), CAGR (%))
Table 67 Middle East & Africa Flexible (Converted) Plastic Packaging Market by Material, 2024-2034 (US$ Bn, AGR (%), CAGR (%))
Table 68 Middle East & Africa Flexible (Converted) Plastic Packaging Market by Type, 2024-2034 (US$ Bn, AGR (%), CAGR (%))
Table 69 GCC Flexible (Converted) Plastic Packaging Market by Value, 2024-2034 (US$ Bn, AGR (%), CAGR (%))
Table 70 South Africa Flexible (Converted) Plastic Packaging Market by Value, 2024-2034 (US$ Bn, AGR (%), CAGR (%))
Table 71 Rest of Middle East & Africa Flexible (Converted) Plastic Packaging Market by Value, 2024-2034 (US$ Bn, AGR (%), CAGR (%))
Table 72 Latin America Flexible (Converted) Plastic Packaging Market by Value, 2024-2034 (US$ Bn, AGR (%), CAGR (%))
Table 73 Latin America Flexible (Converted) Plastic Packaging Market by Country, 2024-2034 (US$ Bn, AGR (%), CAGR (%))
Table 74 Latin America Flexible (Converted) Plastic Packaging Market by Printing Technology, 2024-2034 (US$ Bn, AGR (%), CAGR (%))
Table 75 Latin America Flexible (Converted) Plastic Packaging Market by End-Use Industry, 2024-2034 (US$ Bn, AGR (%), CAGR (%))
Table 76 Latin America Flexible (Converted) Plastic Packaging Market by Material, 2024-2034 (US$ Bn, AGR (%), CAGR (%))
Table 77 Latin America Flexible (Converted) Plastic Packaging Market by Type, 2024-2034 (US$ Bn, AGR (%), CAGR (%))
Table 78 Brazil Flexible (Converted) Plastic Packaging Market by Value, 2024-2034 (US$ Bn, AGR (%), CAGR (%))
Table 79 Mexico Flexible (Converted) Plastic Packaging Market by Value, 2024-2034 (US$ Bn, AGR (%), CAGR (%))
Table 80 Rest of Latin America Flexible (Converted) Plastic Packaging Market by Value, 2024-2034 (US$ Bn, AGR (%), CAGR (%))
Table 81 Strategic Outlook - Contract
Table 82 Amcor plc: Key Details, (CEO, HQ, Revenue, Founded, No. of Employees, Company Type, Website, Business Segment)
Table 83 Amcor plc: Product Benchmarking
Table 84 Amcor plc: Strategic Outlook
Table 85 Berry Global Group, Inc: Key Details, (CEO, HQ, Revenue, Founded, No. of Employees, Company Type, Website, Business Segment)
Table 86 Berry Global Group, Inc: Product Benchmarking
Table 87 Berry Global Group, Inc: Strategic Outlook
Table 88 Sonoco Products Company: Key Details, (CEO, HQ, Revenue, Founded, No. of Employees, Company Type, Website, Business Segment)
Table 89 Sonoco Products Company: Product Benchmarking
Table 90 Sonoco Products Company: Strategic Outlook
Table 91 Huhtamäki Oyj: Key Details, (CEO, HQ, Revenue, Founded, No. of Employees, Company Type, Website, Business Segment)
Table 92 Huhtamäki Oyj: Product Benchmarking
Table 93 Huhtamäki Oyj: Strategic Outlook
Table 94 Sealed Air Corporation: Key Details, (CEO, HQ, Revenue, Founded, No. of Employees, Company Type, Website, Business Segment)
Table 95 Sealed Air Corporation: Product Benchmarking
Table 96 Sealed Air Corporation: Strategic Outlook
Table 97 Constantia Flexibles Group GmbH: Key Details, (CEO, HQ, Revenue, Founded, No. of Employees, Company Type, Website, Business Segment)
Table 98 Constantia Flexibles Group GmbH: Product Benchmarking
Table 99 Constantia Flexibles Group GmbH: Strategic Outlook
Table 100 Mondi plc: Key Details, (CEO, HQ, Revenue, Founded, No. of Employees, Company Type, Website, Business Segment)
Table 101 Mondi plc: Product Benchmarking
Table 102 Mondi plc: Strategic Outlook
Table 103 Coveris Group: Key Details, (CEO, HQ, Revenue, Founded, No. of Employees, Company Type, Website, Business Segment)
Table 104 Coveris Group: Product Benchmarking
Table 105 Coveris Group: Strategic Outlook
Table 106 ProAmpac LLC: Key Details, (CEO, HQ, Revenue, Founded, No. of Employees, Company Type, Website, Business Segment)
Table 107 ProAmpac LLC: Product Benchmarking
Table 108 ProAmpac LLC: Strategic Outlook
Table 109 Printpack: Key Details, (CEO, HQ, Revenue, Founded, No. of Employees, Company Type, Website, Business Segment)
Table 110 Printpack: Product Benchmarking
Table 111 Printpack: Strategic Outlook
Table 112 Novolex: Key Details, (CEO, HQ, Revenue, Founded, No. of Employees, Company Type, Website, Business Segment)
Table 113 Novolex: Product Benchmarking
Table 114 Novolex: Strategic Outlook
Table 115 Clondalkin Group Holdings B.V.: Key Details, (CEO, HQ, Revenue, Founded, No. of Employees, Company Type, Website, Business Segment)
Table 116 Clondalkin Group Holdings B.V.: Product Benchmarking
Table 117 Clondalkin Group Holdings B.V.: Strategic Outlook
Table 118 Polytex Environmental Inks: Key Details, (CEO, HQ, Revenue, Founded, No. of Employees, Company Type, Website, Business Segment)
Table 119 Polytex Environmental Inks: Product Benchmarking
Table 120 Polytex Environmental Inks: Strategic Outlook
Table 121 Innovia Films: Key Details, (CEO, HQ, Revenue, Founded, No. of Employees, Company Type, Website, Business Segment)
Table 122 Innovia Films: Product Benchmarking
Table 123 Innovia Films: Strategic Outlook
Table 124 AptarGroup, Inc.: Key Details, (CEO, HQ, Revenue, Founded, No. of Employees, Company Type, Website, Business Segment)
Table 125 AptarGroup, Inc.: Product Benchmarking
Table 126 AptarGroup, Inc.: Strategic Outlook
List of Figures
Figure 1 Flexible (Converted) Plastic Packaging Market Segmentation
Figure 2 Flexible (Converted) Plastic Packaging Market by Printing Technology: Market Attractiveness Index
Figure 3 Flexible (Converted) Plastic Packaging Market by End-Use Industry: Market Attractiveness Index
Figure 4 Flexible (Converted) Plastic Packaging Market by Material: Market Attractiveness Index
Figure 5 Flexible (Converted) Plastic Packaging Market by Type: Market Attractiveness Index
Figure 6 Flexible (Converted) Plastic Packaging Market Attractiveness Index by Region
Figure 7 Flexible (Converted) Plastic Packaging Market: Market Dynamics
Figure 8 Wholesale Price of Plastic Raw Material
Figure 9 Flexible (Converted) Plastic Packaging Market: Porter’s Five Forces Analysis
Figure 10 Global Flexible (Converted) Plastic Packaging Market Share Forecast by COVID, 2024-2034 (%)
Figure 11 Global Flexible (Converted) Plastic Packaging Market by Region, 2024-2034 (US$ Bn, AGR (%)) (V-Shaped Recovery Scenario)
Figure 12 Global Flexible (Converted) Plastic Packaging Market by Region, 2024-2034 (US$ Bn, AGR (%)) (U-Shaped Recovery Scenario)
Figure 13 Global Flexible (Converted) Plastic Packaging Market by Region, 2024-2034 (US$ Bn, AGR (%)) (W-Shaped Recovery Scenario)
Figure 14 Global Flexible (Converted) Plastic Packaging Market by Region, 2024-2034 (US$ Bn, AGR (%)) (L-Shaped Recovery Scenario)
Figure 15 Flexible (Converted) Plastic Packaging Market: PEST Analysis
Figure 16 Flexible (Converted) Plastic Packaging Market by Printing Technology: Market Attractiveness Index
Figure 17 Global Flexible (Converted) Plastic Packaging Market by Printing Technology, 2024-2034 (US$ Bn, AGR (%))
Figure 18 Flexible (Converted) Plastic Packaging Market Share Forecast by Printing Technology, 2024, 2029, 2034 (%)
Figure 19 Flexography Technology Market by Region, 2024-2034 (US$ Bn, AGR (%))
Figure 20 Flexography Technology Market Share Forecast by Region, 2024 & 2034 (%)
Figure 21 Rotogravure Technology Market by Region, 2024-2034 (US$ Bn, AGR (%))
Figure 22 Rotogravure Technology Market Share Forecast by Region, 2024 & 2034 (%)
Figure 23 Digital Printing Technology Market by Region, 2024-2034 (US$ Bn, AGR (%))
Figure 24 Digital Printing Technology Market Share Forecast by Region, 2024 & 2034 (%)
Figure 25 Flexible (Converted) Plastic Packaging Market by End-Use Industry: Market Attractiveness Index
Figure 26 Global Flexible (Converted) Plastic Packaging Market by End-Use Industry, 2024-2034 (US$ Bn, AGR (%))
Figure 27 Flexible (Converted) Plastic Packaging Market Share Forecast by End-Use Industry, 2024, 2029, 2034 (%)
Figure 28 Food & Beverage Industry Market by Region, 2024-2034 (US$ Bn, AGR (%))
Figure 29 Food & Beverage Industry Market Share Forecast by Region, 2024 & 2034 (%)
Figure 30 Healthcare Industry Market by Region, 2024-2034 (US$ Bn, AGR (%))
Figure 31 Healthcare Industry Market Share Forecast by Region, 2024 & 2034 (%)
Figure 32 Personal Care & Cosmetics Industry Market by Region, 2024-2034 (US$ Bn, AGR (%))
Figure 33 Personal Care & Cosmetics Industry Market Share Forecast by Region, 2024 & 2034 (%)
Figure 34 Other Industry Market by Region, 2024-2034 (US$ Bn, AGR (%))
Figure 35 Other Industry Market Share Forecast by Region, 2024 & 2034 (%)
Figure 36 Flexible (Converted) Plastic Packaging Market by Material: Market Attractiveness Index
Figure 37 Global Flexible (Converted) Plastic Packaging Market by Material, 2024-2034 (US$ Bn, AGR (%))
Figure 38 Flexible (Converted) Plastic Packaging Market Share Forecast by Material, 2024, 2029, 2034 (%)
Figure 39 Polyethylene (PE) Market by Region, 2024-2034 (US$ Bn, AGR (%))
Figure 40 Polyethylene (PE) Market Share Forecast by Region, 2024 & 2034 (%)
Figure 41 Polypropylene (PP) Market by Region, 2024-2034 (US$ Bn, AGR (%))
Figure 42 Polypropylene (PP) Market Share Forecast by Region, 2024 & 2034 (%)
Figure 43 Polyethylene Terephthalate (PET) Market by Region, 2024-2034 (US$ Bn, AGR (%))
Figure 44 Polyethylene Terephthalate (PET) Market Share Forecast by Region, 2024 & 2034 (%)
Figure 45 Polyvinyl Chloride (PVC) Market by Region, 2024-2034 (US$ Bn, AGR (%))
Figure 46 Polyvinyl Chloride (PVC) Market Share Forecast by Region, 2024 & 2034 (%)
Figure 47 Other Materials Market by Region, 2024-2034 (US$ Bn, AGR (%))
Figure 48 Other Materials Market Share Forecast by Region, 2024 & 2034 (%)
Figure 49 Flexible (Converted) Plastic Packaging Market by Type: Market Attractiveness Index
Figure 50 Global Flexible (Converted) Plastic Packaging Market by Type, 2024-2034 (US$ Bn, AGR (%))
Figure 51 Flexible (Converted) Plastic Packaging Market Share Forecast by Type, 2024, 2029, 2034 (%)
Figure 52 Pouches Market by Region, 2024-2034 (US$ Bn, AGR (%))
Figure 53 Pouches Market Share Forecast by Region, 2024 & 2034 (%)
Figure 54 Bags Market by Region, 2024-2034 (US$ Bn, AGR (%))
Figure 55 Bags Market Share Forecast by Region, 2024 & 2034 (%)
Figure 56 Wraps Market by Region, 2024-2034 (US$ Bn, AGR (%))
Figure 57 Wraps Market Share Forecast by Region, 2024 & 2034 (%)
Figure 58 Films Market by Region, 2024-2034 (US$ Bn, AGR (%))
Figure 59 Films Market Share Forecast by Region, 2024 & 2034 (%)
Figure 60 Sachets Market by Region, 2024-2034 (US$ Bn, AGR (%))
Figure 61 Sachets Market Share Forecast by Region, 2024 & 2034 (%)
Figure 62 Other Type Market by Region, 2024-2034 (US$ Bn, AGR (%))
Figure 63 Other Type Market Share Forecast by Region, 2024 & 2034 (%)
Figure 64 Flexible (Converted) Plastic Packaging Market Forecast by Region 2024 and 2034 (Revenue, CAGR%)
Figure 65 Flexible (Converted) Plastic Packaging Market Share Forecast by Region 2024, 2029, 2034 (%)
Figure 66 Flexible (Converted) Plastic Packaging Market by Region, 2024-2034 (US$ Billion, AGR %)
Figure 67 North America Flexible (Converted) Plastic Packaging Market Attractiveness Index
Figure 68 North America Flexible (Converted) Plastic Packaging Market by Region, 2024, 2029 & 2034 (US$ Billion)
Figure 69 North America Flexible (Converted) Plastic Packaging Market by Value, 2024-2034 (US$ Bn, AGR (%))
Figure 70 North America Flexible (Converted) Plastic Packaging Market by Country, 2024-2034 (US$ Bn, AGR (%))
Figure 71 North America Flexible (Converted) Plastic Packaging Market Share Forecast by Country, 2024 & 2034 (%)
Figure 72 North America Flexible (Converted) Plastic Packaging Market by Printing Technology, 2024-2034 (US$ Bn, AGR (%))
Figure 73 North America Flexible (Converted) Plastic Packaging Market Share Forecast Printing Technology, 2024 & 2034 (%)
Figure 74 North America Flexible (Converted) Plastic Packaging Market by End-Use Industry, 2024-2034 (US$ Bn, AGR (%))
Figure 75 North America Flexible (Converted) Plastic Packaging Market Share Forecast by End-Use Industry, 2024 & 2034 (%)
Figure 76 North America Flexible (Converted) Plastic Packaging Market by Material, 2024-2034 (US$ Bn, AGR (%))
Figure 77 North America Flexible (Converted) Plastic Packaging Market Share Forecast by Material, 2024 & 2034 (%)
Figure 78 North America Flexible (Converted) Plastic Packaging Market by Type, 2024-2034 (US$ Bn, AGR (%))
Figure 79 North America Flexible (Converted) Plastic Packaging Market Share Forecast by Type, 2024 & 2034 (%)
Figure 80 US Flexible (Converted) Plastic Packaging Market by Value, 2024-2034 (US$ Bn, AGR (%))
Figure 81 Canada Flexible (Converted) Plastic Packaging Market by Value, 2024-2034 (US$ Bn, AGR (%))
Figure 82 Europe Flexible (Converted) Plastic Packaging Market Attractiveness Index
Figure 83 Europe Flexible (Converted) Plastic Packaging Market by Region, 2024, 2029 & 2034 (US$ Billion)
Figure 84 Europe Flexible (Converted) Plastic Packaging Market by Value, 2024-2034 (US$ Bn, AGR (%))
Figure 85 Europe Flexible (Converted) Plastic Packaging Market by Country, 2024-2034 (US$ Bn, AGR (%))
Figure 86 Europe Flexible (Converted) Plastic Packaging Market Share Forecast by Country, 2024 & 2034 (%)
Figure 87 Europe Flexible (Converted) Plastic Packaging Market by Printing Technology, 2024-2034 (US$ Bn, AGR (%))
Figure 88 Europe Flexible (Converted) Plastic Packaging Market Share Forecast Printing Technology, 2024 & 2034 (%)
Figure 89 Europe Flexible (Converted) Plastic Packaging Market by End-Use Industry, 2024-2034 (US$ Bn, AGR (%))
Figure 90 Europe Flexible (Converted) Plastic Packaging Market Share Forecast by End-Use Industry, 2024 & 2034 (%)
Figure 91 Europe Flexible (Converted) Plastic Packaging Market by Material, 2024-2034 (US$ Bn, AGR (%))
Figure 92 Europe Flexible (Converted) Plastic Packaging Market Share Forecast by Material, 2024 & 2034 (%)
Figure 93 Europe Flexible (Converted) Plastic Packaging Market by Type, 2024-2034 (US$ Bn, AGR (%))
Figure 94 Europe Flexible (Converted) Plastic Packaging Market Share Forecast by Type, 2024 & 2034 (%)
Figure 95 Germany Flexible (Converted) Plastic Packaging Market by Value, 2024-2034 (US$ Bn, AGR (%))
Figure 96 UK Flexible (Converted) Plastic Packaging Market by Value, 2024-2034 (US$ Bn, AGR (%))
Figure 97 France Flexible (Converted) Plastic Packaging Market by Value, 2024-2034 (US$ Bn, AGR (%))
Figure 98 Italy Flexible (Converted) Plastic Packaging Market by Value, 2024-2034 (US$ Bn, AGR (%))
Figure 99 Russia Flexible (Converted) Plastic Packaging Market by Value, 2024-2034 (US$ Bn, AGR (%))
Figure 100 Rest of Europe Flexible (Converted) Plastic Packaging Market by Value, 2024-2034 (US$ Bn, AGR (%))
Figure 101 Asia-Pacific Flexible (Converted) Plastic Packaging Market Attractiveness Index
Figure 102 Asia-Pacific Flexible (Converted) Plastic Packaging Market by Region, 2024, 2029 & 2034 (US$ Billion)
Figure 103 Asia-Pacific Flexible (Converted) Plastic Packaging Market by Value, 2024-2034 (US$ Bn, AGR (%))
Figure 104 Asia-Pacific Flexible (Converted) Plastic Packaging Market by Country, 2024-2034 (US$ Bn, AGR (%))
Figure 105 Asia-Pacific Flexible (Converted) Plastic Packaging Market Share Forecast by Country, 2024 & 2034 (%)
Figure 106 Asia-Pacific Flexible (Converted) Plastic Packaging Market by Printing Technology, 2024-2034 (US$ Bn, AGR (%))
Figure 107 Asia-Pacific Flexible (Converted) Plastic Packaging Market Share Forecast Printing Technology, 2024 & 2034 (%)
Figure 108 Asia-Pacific Flexible (Converted) Plastic Packaging Market by End-Use Industry, 2024-2034 (US$ Bn, AGR (%))
Figure 109 Asia-Pacific Flexible (Converted) Plastic Packaging Market Share Forecast by End-Use Industry, 2024 & 2034 (%)
Figure 110 Asia-Pacific Flexible (Converted) Plastic Packaging Market by Material, 2024-2034 (US$ Bn, AGR (%))
Figure 111 Asia-Pacific Flexible (Converted) Plastic Packaging Market Share Forecast by Material, 2024 & 2034 (%)
Figure 112 Asia-Pacific Flexible (Converted) Plastic Packaging Market by Type, 2024-2034 (US$ Bn, AGR (%))
Figure 113 Asia-Pacific Flexible (Converted) Plastic Packaging Market Share Forecast by Type, 2024 & 2034 (%)
Figure 114 China Flexible (Converted) Plastic Packaging Market by Value, 2024-2034 (US$ Bn, AGR (%))
Figure 115 India Flexible (Converted) Plastic Packaging Market by Value, 2024-2034 (US$ Bn, AGR (%))
Figure 116 Japan Flexible (Converted) Plastic Packaging Market by Value, 2024-2034 (US$ Bn, AGR (%))
Figure 117 Indonesia Flexible (Converted) Plastic Packaging Market by Value, 2024-2034 (US$ Bn, AGR (%))
Figure 118 South Korea Flexible (Converted) Plastic Packaging Market by Value, 2024-2034 (US$ Bn, AGR (%))
Figure 119 Rest of Asia-Pacific Flexible (Converted) Plastic Packaging Market by Value, 2024-2034 (US$ Bn, AGR (%))
Figure 120 Middle East and Africa Flexible (Converted) Plastic Packaging Market Attractiveness Index
Figure 121 Middle East and Africa Flexible (Converted) Plastic Packaging Market by Region, 2024, 2029 & 2034 (US$ Billion)
Figure 122 Middle East & Africa Flexible (Converted) Plastic Packaging Market by Value, 2024-2034 (US$ Bn, AGR (%))
Figure 123 Middle East & Africa Flexible (Converted) Plastic Packaging Market by Country, 2024-2034 (US$ Bn, AGR (%))
Figure 124 Middle East and Africa Flexible (Converted) Plastic Packaging Market Share Forecast by Country, 2024 & 2034 (%)
Figure 125 Middle East & Africa Flexible (Converted) Plastic Packaging Market by Printing Technology, 2024-2034 (US$ Bn, AGR (%))
Figure 126 Middle East and Africa Flexible (Converted) Plastic Packaging Market Share Forecast Printing Technology, 2024 & 2034 (%)
Figure 127 Middle East & Africa Flexible (Converted) Plastic Packaging Market by End-Use Industry, 2024-2034 (US$ Bn, AGR (%))
Figure 128 Middle East and Africa Flexible (Converted) Plastic Packaging Market Share Forecast by End-Use Industry, 2024 & 2034 (%)
Figure 129 Middle East & Africa Flexible (Converted) Plastic Packaging Market by Material, 2024-2034 (US$ Bn, AGR (%))
Figure 130 Middle East and Africa Flexible (Converted) Plastic Packaging Market Share Forecast by Material, 2024 & 2034 (%)
Figure 131 Middle East & Africa Flexible (Converted) Plastic Packaging Market by Type, 2024-2034 (US$ Bn, AGR (%))
Figure 132 Middle East and Africa Flexible (Converted) Plastic Packaging Market Share Forecast by Type, 2024 & 2034 (%)
Figure 133 GCC Flexible (Converted) Plastic Packaging Market by Value, 2024-2034 (US$ Bn, AGR (%))
Figure 134 South Africa Flexible (Converted) Plastic Packaging Market by Value, 2024-2034 (US$ Bn, AGR (%))
Figure 135 Rest of Middle East & Africa Flexible (Converted) Plastic Packaging Market by Value, 2024-2034 (US$ Bn, AGR (%))
Figure 136 Latin America Flexible (Converted) Plastic Packaging Market Attractiveness Index
Figure 137 Latin America Flexible (Converted) Plastic Packaging Market by Region, 2024, 2029 & 2034 (US$ Billion)
Figure 138 Latin America Flexible (Converted) Plastic Packaging Market by Value, 2024-2034 (US$ Bn, AGR (%))
Figure 139 Latin America Flexible (Converted) Plastic Packaging Market by Country, 2024-2034 (US$ Bn, AGR (%))
Figure 140 Latin America Flexible (Converted) Plastic Packaging Market Share Forecast by Country, 2024 & 2034 (%)
Figure 141 Latin America Flexible (Converted) Plastic Packaging Market by Printing Technology, 2024-2034 (US$ Bn, AGR (%))
Figure 142 Latin America Flexible (Converted) Plastic Packaging Market Share Forecast Printing Technology, 2024 & 2034 (%)
Figure 143 Latin America Flexible (Converted) Plastic Packaging Market by End-Use Industry, 2024-2034 (US$ Bn, AGR (%))
Figure 144 Latin America Flexible (Converted) Plastic Packaging Market Share Forecast by End-Use Industry, 2024 & 2034 (%)
Figure 145 Latin America Flexible (Converted) Plastic Packaging Market by Material, 2024-2034 (US$ Bn, AGR (%))
Figure 146 Latin America Flexible (Converted) Plastic Packaging Market Share Forecast by Material, 2024 & 2034 (%)
Figure 147 Latin America Flexible (Converted) Plastic Packaging Market by Type, 2024-2034 (US$ Bn, AGR (%))
Figure 148 Latin America Flexible (Converted) Plastic Packaging Market Share Forecast by Type, 2024 & 2034 (%)
Figure 149 Brazil Flexible (Converted) Plastic Packaging Market by Value, 2024-2034 (US$ Bn, AGR (%))
Figure 150 Mexico Flexible (Converted) Plastic Packaging Market by Value, 2024-2034 (US$ Bn, AGR (%))
Figure 151 Rest of Latin America Flexible (Converted) Plastic Packaging Market by Value, 2024-2034 (US$ Bn, AGR (%))
Figure 152 Flexible (Converted) Plastic Packaging Market: Company Share, 2022
Figure 153 Amcor plc.: Net Revenue, 2019-2023(US$ Million, AGR%)
Figure 154 Amcor plc.: R&D, 2019-2023 (US$ Million, AGR%)
Figure 155 Amcor plc.: Business Segment Revenue Share, 2023 (%)
Figure 156 Berry Global Group, Inc.: Net Revenue, 2019-2023 (US$ Million, AGR%)
Figure 157 Berry Global Group, Inc.: R&D, 2019-2023 (US$ Million, AGR%)
Figure 158 Berry Global Group, Inc.: Regional Revenue Share, 2023 (%)
Figure 159 Berry Global Group, Inc.: Business Segment Revenue Share, 2023 (%)
Figure 160 Sonoco Products Company.: Net Revenue, 2018-2022 (US$ Million, AGR%)
Figure 161 Sonoco Products Company.: R&D, 2018-2022 (US$ Million, AGR%)
Figure 162 Sonoco Products Company.: Regional Revenue Share, 2022 (%)
Figure 163 Sonoco Products Company.: Business Segment Revenue Share, 2022 (%)
Figure 164 Huhtamäki Oyj.: Net Revenue, 2018-2022 (US$ Million, AGR%)
Figure 165 Huhtamäki Oyj.: R&D, 2018-2022 (US$ Million, AGR%)
Figure 166 Huhtamäki Oyj.: Regional Revenue Share, 2022 (%)
Figure 167 Huhtamäki Oyj.: Business Segment Revenue Share, 2022 (%)
Figure 168 Sealed Air Corporation.: Net Revenue, 2018-2022 (US$ Million, AGR%)
Figure 169 Sealed Air Corporation.: R&D, 2018-2022 (US$ Million, AGR%)
Figure 170 Sealed Air Corporation.: Regional Revenue Share, 2022 (%)
Figure 171 Sealed Air Corporation.: Business Segment Revenue Share, 2022 (%)
Figure 172 Mondi plc.: Net Revenue, 2018-2022 (US$ Million, AGR%)
Figure 173 Mondi plc.: Business Segment Revenue Share, 2022 (%)
Figure 174 AptarGroup, Inc.: Net Revenue, 2018-2022 (US$ Million, AGR%)
Figure 175 AptarGroup, Inc.: R&D, 2018-2022 (US$ Million, AGR%)
Figure 176 AptarGroup, Inc.: Regional Revenue Share, 2022 (%)
Figure 177 AptarGroup, Inc.: Business Segment Revenue Share, 2022 (%)
ページTOPに戻る
- 本レポートと同じKEY WORDの最新刊レポートはありません。
よくあるご質問
Visiongain社はどのような調査会社ですか?
英国の調査会社ヴィジョンゲイン社(Visiongain)は、通信とエネルギーのほか、自動車や化学・医薬品、金属など、広範な市場を対象に調査を行っています。自動車市場については、市場全般に関する調査のほ... もっと見る
調査レポートの納品までの日数はどの程度ですか?
在庫のあるものは速納となりますが、平均的には 3-4日と見て下さい。
但し、一部の調査レポートでは、発注を受けた段階で内容更新をして納品をする場合もあります。
発注をする前のお問合せをお願いします。
注文の手続きはどのようになっていますか?
1)お客様からの御問い合わせをいただきます。
2)見積書やサンプルの提示をいたします。
3)お客様指定、もしくは弊社の発注書をメール添付にて発送してください。
4)データリソース社からレポート発行元の調査会社へ納品手配します。
5) 調査会社からお客様へ納品されます。最近は、pdfにてのメール納品が大半です。
お支払方法の方法はどのようになっていますか?
納品と同時にデータリソース社よりお客様へ請求書(必要に応じて納品書も)を発送いたします。
お客様よりデータリソース社へ(通常は円払い)の御振り込みをお願いします。
請求書は、納品日の日付で発行しますので、翌月最終営業日までの当社指定口座への振込みをお願いします。振込み手数料は御社負担にてお願いします。
お客様の御支払い条件が60日以上の場合は御相談ください。
尚、初めてのお取引先や個人の場合、前払いをお願いすることもあります。ご了承のほど、お願いします。
データリソース社はどのような会社ですか?
当社は、世界各国の主要調査会社・レポート出版社と提携し、世界各国の市場調査レポートや技術動向レポートなどを日本国内の企業・公官庁及び教育研究機関に提供しております。
世界各国の「市場・技術・法規制などの」実情を調査・収集される時には、データリソース社にご相談ください。
お客様の御要望にあったデータや情報を抽出する為のレポート紹介や調査のアドバイスも致します。
|
|


