キャップ&クロージャー市場レポート:2024-2034
Caps & Closures Market Report 2024-2034
レポート詳細
キャップ&クロージャー市場レポート 2024-2034年 :本レポートは、業界とその基礎となる原動力をより良く理解したいと望むなら、新たな収益ポケットを目指す大手企業にとって貴重なも... もっと見る
※上記価格は部署ライセンス(Departmental licence)価格です。
その他の価格についてはデータリソースまでお問合せください。
日本語のページは自動翻訳を利用し作成しています。
実際のレポートは英文のみでご納品いたします。

|

|
サマリー
レポート詳細
キャップ&クロージャー市場レポート 2024-2034年:本レポートは、業界とその基礎となる原動力をより良く理解したいと望むなら、新たな収益ポケットを目指す大手企業にとって貴重なものとなるでしょう。異業種への進出や新規地域での既存事業の拡大を目指す企業にも有用です。
キャップ&クロージャー市場を推進する主な要因
キャップ&クロージャー市場は、その成長軌道に大きな影響を与えるいくつかの主要なドライバーによって主に推進されている。便利で安全なパッケージング・ソリューションに対する消費者の需要は、製品の安全性と鮮度に対する意識の高まりと相まって、依然として主要な推進要因となっている。市場はさらに、生産効率と精度を高める製造プロセスの技術的進歩によって活性化される。環境に優しい素材やリサイクル可能なクロージャーが重視されるようになり、環境の持続可能性が極めて重要な推進力として浮上している。プラスチック廃棄物削減への世界的なコミットメントを反映し、業界は持続可能な慣行へのパラダイムシフトを目の当たりにしている。メーカー各社は、循環経済の原則に沿った素材を活用し、革新的で環境に優しい代替品で対応している。
課題が山積する中、キャップ&クロージャー市場は、特に市場プレーヤー間の協力とパートナーシップの領域において、有利な機会を提示している。戦略的提携は、専門知識、技術、リソースの交換を促進し、イノベーションを促進し、持続可能な実践の範囲を拡大する。さらに、カスタマイズとスマート・パッケージング・ソリューションのトレンドの高まりは、ニッチ市場と特定の消費者ニーズに対応するテーラーメイドのクロージャーの道を開く。地域的には、新興国が市場浸透の未開拓の機会を提供している。これらの地域が経済成長を遂げるにつれて、先進的なパッケージング・ソリューションに対する需要が高まり、キャップ&クロージャー市場が世界的な足跡を拡大するための肥沃な土壌となっている。
代替品の存在が市場の成長を妨げる キャップ&クロージャー市場
キャップ&クロージャー市場に影響を与える重要な阻害要因の1つは、代替品の存在と入手可能性である。同市場は、包装において同様の目的を果たすものの、素材やメカニズムが異なる代替品による課題に直面している。こうした代替品には、市場シェアを争う代替クロージャー技術、シーラント、パッケージング・ソリューションが含まれる可能性がある。代替品の利用可能性は、消費者や包装ソリューションを求める企業に競争と選択のレベルをもたらす。例えば、飲料業界では、メーカーが従来のキャップの代わりに、ヒートシールやインダクションシールなどの代替閉鎖方法を検討するかもしれない。これらの代替品は、異なる機能を提供しながらも、容器を密封するという基本的な機能は果たしている。
市場調査レポートを購入する前にすべき質問とは?
-
キャップ&クロージャー市場はどのように進化しているのか?
-
キャップ&クロージャー市場の推進要因と阻害要因は何か?
-
キャップ&クロージャーの各サブマーケットセグメントは予測期間中にどのように成長し、2034年にはどれくらいの売上を占めるようになるのか?
-
2024年から2034年にかけて、キャップ&クロージャーの各サブマーケットの市場シェアはどのように推移するのか?
-
2024年から2034年までの市場全体の主な牽引役は何か?
-
キャップ&クロージャーの主要市場はマクロ経済の動きに概ね追随するのか、それとも個々の国別市場が他を凌駕するのか?
-
2034年までに各国市場のシェアはどう変化し、2034年に市場をリードするのはどの地域か?
-
主要プレーヤーは誰で、予測期間中の見通しは?
-
これらの大手企業のキャップ&クロージャー・プロジェクトは?
-
2024年から2034年の間に、業界はどのように進化するのか?現在および今後10年間に行われるキャップ&クロージャー・プロジェクトにはどのような意味があるのか?
-
キャップ&クロージャー市場をさらに拡大するために、製品の商業化の必要性は高まっているか?
-
キャップ&クロージャー市場はどこへ向かい、どのようにすれば市場の最前線に立てるか?
-
新製品やサービスラインへの最適な投資方法とは?
-
企業を新たな成長軌道に乗せ、C-suiteに移行させるための重要な展望とは?
このことがキャップ&クロージャー市場に現在、そして今後10年間でどのような影響を与えるかを見極める必要がある:
-
395ページに及ぶ本レポートでは、124の表と187の図表を掲載している。
-
について本レポートでは、業界の主要な有利分野を取り上げている。今すぐ
-
世界、地域、国の売上高と成長に関する詳細な分析が含まれている。
-
競合他社が成功した主なトレンド、変化、収益予測をハイライトします。
本レポートは、キャップ&クロージャー市場が今後10年間にどのように発展していくかを、COVID-19の景気後退と好転の変動に合わせて今でお伝えするものです。この市場は、過去10年間のどの時点よりも今が重要である。
2034年までの予測やその他の分析から、商業的な展望が明らかになる
-
2034年までの収益予測に加え、最近の実績、成長率、市場シェアも提供している。
-
ビジネスの展望や展開など、独自の分析が掲載されている。
-
定性的分析(市場ダイナミクス、促進要因、機会、阻害要因、課題など)、コスト構造、キャップ&クロージャーの価格上昇の影響、最近の動向などをご覧いただけます。
本レポートには、COVID-19が業界と貴社にどのような影響を与えるかについてのデータ分析と貴重な洞察が含まれている。本レポートでは、COVID-19の4つの回収パターンとその影響、すなわち「V」、「L」、「W」、「U」について論じている。
レポート対象セグメント
飲料タイプ別市場セグメント
サイズ別市場セグメント
-
小型(20mmまで)
-
ミディアム(20~50mm)
-
ラージ(50mm以上)
素材タイプ別市場セグメント
用途別市場セグメント
-
飲料
-
フード
-
医薬品
-
パーソナルケア
-
その他の用途
製品タイプ別市場セグメント
-
スクリューキャップ
-
ディスペンサーキャップ
-
スナップオンキャップ
-
クラウンキャップ
-
いたずら防止キャップ
-
その他の製品タイプ
世界市場全体とセグメント別の収益予測に加え、4つの地域と20の主要国市場の収益予測も掲載しています:
北米
欧州
-
ドイツ
-
スペイン
-
イギリス
-
フランス
-
イタリア
-
その他の欧州
アジア太平洋
-
中国
-
日本
-
インド
-
オーストラリア
-
韓国
-
その他のアジア太平洋
ラテンアメリカ
中東・アフリカ
本レポートでは、キャップ&クロージャー市場の2024年から2034年までの主要企業のプロファイルも掲載している。
報告書に掲載されている主要企業
-
Alcopack Group
-
Amcor plc
-
AptarGroup, Inc
-
BERICAP GmbH & Co KG
-
Berry Global Group, Inc.
-
Caprite Australia Pty Ltd
-
Caps & Closures Pty Ltd
-
Crown Holdings, Inc.
-
Guala Closures S.P.A
-
Herti JSC
-
MJS Packaging
-
Pano Cap Canada Ltd
-
Phoenix Closures
-
Silgan Holdings
-
UNITED CAPS
キャップ&クロージャー市場全体の世界売上高(2024年~2034年)は、金額ベースで2024年に866億米ドルを突破する。2034年まで力強い収益成長を予測。当社の調査では、最も大きな可能性を秘めた企業を特定しています。彼らの能力、進歩、商業的展望を発見し、一歩先を行くお手伝いをします。
キャップ&クロージャー市場、2024-2034年」レポートはどのようにお役に立ちますか?
要約すると、390ページを超えるこのレポートは、以下の知識を提供する:
-
キャップ&クロージャー市場、2024年から2034年までの収益予測 飲料タイプ、サイズ、素材タイプ、用途、製品タイプ別に世界および地域レベルで予測 - 業界の展望を発見し、投資と収益に最も有利な場所を見つけます。
-
4つの地域と20の主要国市場の2034年までの収益予測 - 北米、ヨーロッパ、アジア太平洋、ラテンアメリカ、中東&アフリカのキャップ&クロージャー市場の2024年から2034年までの予測をご覧ください。また、米国、カナダ、ブラジル、ドイツ、フランス、英国、イタリア、中国、インド、日本、オーストラリアなど著名な経済圏の市場も予測しています。
-
2024年から2034年までのキャップ&クロージャー市場に関わる主要企業15社の企業プロファイルを含む。
独自の予測による定量的・定性的分析をご覧ください。私たちのレポートだけに含まれる情報を入手し、貴重なビジネスインテリジェンスで情報を得ることができます。
他にはない情報
私たちの新しいレポートがあれば、知識に遅れをとったり、チャンスを逃したりする可能性が低くなります。Visiongainの調査レポートが貴社の調査、分析、意思決定にどのように役立つかをご覧ください。Visiongainのこの調査レポートは、キャップ&クロージャー市場(2024年~2034年)の商業分析を必要とするすべての人、市場のリーディングカンパニーを対象としています。データ、トレンド、予測をご覧いただけます。
ページTOPに戻る
目次
目次
1 レポート概要
1.1 調査の目的
1.2 キャップ&クロージャー市場の紹介
1.3 本レポートの特徴
1.4 本レポートを読むべき理由
1.5 本分析レポートが回答する主な質問
1.6 本レポートは誰のためのものか?
1.7 方法論
1.7.1 市場の定義
1.7.2 市場評価・予測手法
1.7.3 データの検証
1.7.3.1 一次調査
1.7.3.2 セカンダリーリサーチ
1.8 よくある質問(FAQ)
1.9 Visiongainの関連レポート
1.10 Visiongainについて
2 エグゼクティブ・サマリー
3 市場概要
3.1 主要な調査結果
3.2 市場ダイナミクス
3.2.1 市場牽引要因
3.2.1.1 飲料、包装食品、医薬品業界における需要の増加が市場成長を牽引
3.2.1.2 製品の差別化、ブランド化、パッケージの小型化
3.2.1.3 便利でユニークなパッケージング・ソリューションに対する消費者の嗜好が市場成長を牽引
3.2.2 市場抑制要因
3.2.2.1 市場成長を阻害する代替品の入手可能性 キャップ・クロージャー市場
3.2.2.2 厳しい環境規制が市場成長を妨げる
3.2.2.3 原材料、労働力、サプライチェーンのコスト圧力が市場成長を妨げる
3.2.3 市場機会
3.2.3.1 スマート包装、3Dプリンティング、偽造防止機能などの技術進歩が企業にチャンスをもたらす
3.2.3.2 新興市場を開拓し、多様な地域の包装ニーズに応えることで、市場プレーヤーが世界的プレゼンスを拡大する機会が存在する。
3.2.3.3 市場プレイヤー間のコラボレーションとパートナーシップが機会を生み出す
3.3 ポーターのファイブフォース分析
3.3.1 サプライヤーの交渉力(中~高)
3.3.2 買い手の交渉力(中)
3.3.3 競争上のライバル(高)
3.3.4 代替品による脅威(低)
3.3.5 新規参入の脅威(低)
3.4 COVID-19の影響分析
3.4.1 "V字型回復"
3.4.2 "U字型回復"
3.4.3 "W字型回復"
3.4.4 "L字型回復"
3.5 PEST分析
4 キャップ&クロージャー市場分析:飲料タイプ別
4.1 主要調査結果
4.2 飲料タイプ別セグメント 市場魅力度指数
4.3 飲料タイプ別キャップ&クロージャー市場規模推定と予測
4.4 アルコール飲料
4.4.1 2024〜2034年の地域別市場規模(US$ Billion)
4.4.2 地域別市場シェア、2024年・2034年(%)
4.5 ノンアルコール飲料
4.5.1 2024〜2034年の地域別市場規模(US$ Billion)
4.5.2 地域別市場シェア、2024年・2034年(%)
5 キャップ&クロージャー市場分析:サイズ別
5.1 主要調査結果
5.2 サイズ別セグメント 市場魅力度指数
5.3 キャップ&クロージャー市場規模別推定と予測
5.4 小型(20mmまで)
5.4.1 2024〜2034年の地域別市場規模(US$ Billion)
5.4.2 地域別市場シェア、2024年・2034年(%)
5.5 中型(20~50mm)
5.5.1 2024~2034年の地域別市場規模(US$ Billion)
5.5.2 地域別市場シェア、2024年・2034年(%)
5.6 大型(50mm以上)
5.6.1 2024~2034年の地域別市場規模(US$ Billion)
5.6.2 地域別市場シェア、2024年・2034年(%)
6 キャップ&クロージャー市場分析:素材タイプ別
6.1 主要調査結果
6.2 素材タイプセグメント 市場魅力度指数
6.3 素材タイプ別キャップ&クロージャー市場規模推定と予測
6.4 プラスチック
6.4.1 2024〜2034年の地域別市場規模(US$ Billion)
6.4.2 地域別市場シェア、2024年・2034年(%)
6.5 金属
6.5.1 2024〜2034年の地域別市場規模(US$ Billion)
6.5.2 地域別市場シェア、2024年・2034年(%)
6.6 ゴム
6.6.1 2024〜2034年の地域別市場規模(US$ Billion)
6.6.2 地域別市場シェア、2024年・2034年(%)
6.7 その他
6.7.1 2024〜2034年の地域別市場規模(US$ Billion)
6.7.2 地域別市場シェア、2024年・2034年(%)
7 キャップ&クロージャー市場分析:用途別
7.1 主要調査結果
7.2 用途別セグメント 市場魅力度指数
7.3 用途別キャップ&クロージャー市場規模推定と予測
7.4 飲料
7.4.1 2024〜2034年の地域別市場規模(US$ Billion)
7.4.2 地域別市場シェア、2024年・2034年(%)
7.5 食品
7.5.1 2024〜2034年の地域別市場規模(US$ Billion)
7.5.2 地域別市場シェア、2024年・2034年(%)
7.6 医薬品
7.6.1 2024〜2034年の地域別市場規模(US$ Billion)
7.6.2 地域別市場シェア、2024年・2034年(%)
7.7 パーソナルケア
7.7.1 2024〜2034年の地域別市場規模(US$ Billion)
7.7.2 地域別市場シェア、2024年・2034年(%)
7.8 その他の用途
7.8.1 2024〜2034年の地域別市場規模(US$ Billion)
7.8.2 地域別市場シェア、2024年・2034年(%)
8 キャップ&クロージャー市場分析:製品タイプ別
8.1 主要な調査結果
8.2 製品タイプ別セグメント 市場魅力度指数
8.3 製品タイプ別キャップ&クロージャー市場規模推定と予測
8.4 スクリューキャップ
8.4.1 2024〜2034年の地域別市場規模(US$ Billion)
8.4.2 地域別市場シェア、2024年・2034年(%)
8.5 ディスペンスキャップ
8.5.1 2024〜2034年の地域別市場規模(US$ Billion)
8.5.2 地域別市場シェア、2024年・2034年(%)
8.6 スナップオンキャップ
8.6.1 2024〜2034年の地域別市場規模(US$ Billion)
8.6.2 地域別市場シェア、2024年・2034年(%)
8.7 クラウンキャップ
8.7.1 2024〜2034年の地域別市場規模(US$ Billion)
8.7.2 地域別市場シェア、2024年・2034年(%)
8.8 タンパーエビデントキャップ
8.8.1 2024〜2034年の地域別市場規模(US$ Billion)
8.8.2 地域別市場シェア、2024年・2034年(%)
8.9 その他の製品タイプ
8.9.1 2024〜2034年の地域別市場規模(US$ Billion)
8.9.2 地域別市場シェア、2024年・2034年(%)
9 キャップ&クロージャー市場分析:地域別
9.1 主要な調査結果
9.2 地域別市場規模の推定と予測
10 北米のキャップ&クロージャー市場分析
10.1 主要な調査結果
10.2 北米のキャップ&クロージャー市場魅力度指数
10.3 北米のキャップ&クロージャー国別市場、2024年、2029年、2034年(US$ Billion)
10.4 北米のキャップ&クロージャー市場規模推定と予測
10.5 北米のキャップ&クロージャー市場規模推定と予測:国別
10.6 北米のキャップ&クロージャー市場規模推定と予測:飲料タイプ別
10.7 北米のキャップ&クロージャー市場規模推定と予測:サイズ別
10.8 北米のキャップ&クロージャー市場規模推定と予測:素材タイプ別
10.9 北米のキャップ&クロージャー市場規模推定と予測:用途別
10.10 北米のキャップ&クロージャー市場規模推定と予測:製品タイプ別
10.11 アメリカキャップ&クロージャー市場分析
10.12 カナダのキャップ&クロージャー市場の分析
11 欧州のキャップ&クロージャー市場分析
11.1 主要な調査結果
11.2 欧州のキャップ&クロージャー市場魅力度指数
11.3 欧州のキャップ&クロージャー国別市場、2024年、2029年、2034年(US$ Billion)
11.4 欧州のキャップ&クロージャー市場規模推定と予測
11.5 欧州のキャップ&クロージャー市場規模推定と予測:国別
11.6 欧州のキャップ&クロージャー市場規模推定と予測:飲料タイプ別
11.7 欧州のキャップ&クロージャー市場規模推定と予測:サイズ別
11.8 欧州のキャップ&クロージャー市場規模推定と予測:素材タイプ別
11.9 欧州のキャップ&クロージャー市場規模推定と予測:用途別
11.10 欧州のキャップ&クロージャー市場規模推定と予測:製品タイプ別
11.11 ドイツのキャップ&クロージャー市場分析
11.12 イギリスのキャップ&クロージャー市場分析
11.13 フランスのキャップ&クロージャー市場分析
11.14 イタリアのキャップ&クロージャー市場分析
11.15 スペインのキャップ&クロージャー市場分析
11.16 その他の欧州のキャップ&クロージャー市場分析
12 アジア太平洋地域のキャップ&クロージャー市場分析
12.1 主要な調査結果
12.2 アジア太平洋地域のキャップ&クロージャー市場魅力度指数
12.3 アジア太平洋地域のキャップ&クロージャー国別市場、2024年、2029年、2034年(US$ Billion)
12.4 アジア太平洋地域のキャップ&クロージャー市場規模推定と予測
12.5 アジア太平洋地域のキャップ&クロージャー市場規模推定と予測:国別
12.6 アジア太平洋地域のキャップ&クロージャー市場規模推定と予測:飲料タイプ別
12.7 アジア太平洋地域のキャップ&クロージャー市場規模推定と予測:サイズ別
12.8 アジア太平洋地域のキャップ&クロージャー市場規模推定と予測:素材タイプ別
12.9 アジア太平洋地域のキャップ&クロージャー市場規模推定と予測:用途別
12.10 アジア太平洋地域のキャップ&クロージャー市場規模推定と予測:製品タイプ別
12.11 中国のキャップ&クロージャー市場分析
12.12 インドのキャップ&クロージャー市場分析
12.13 日本のキャップ&クロージャー市場分析
12.14 韓国のキャップ&クロージャー市場分析
12.15 オーストラリアのキャップ&クロージャー市場分析
12.16 その他のアジア太平洋地域のキャップ&クロージャー市場分析
13 中東・アフリカのキャップ&クロージャー市場分析
13.1 主要な調査結果
13.2 中東・アフリカのキャップ&クロージャー市場魅力度指数
13.3 中東・アフリカのキャップ&クロージャー国別市場、2024年、2029年、2034年(US$ Billion)
13.4 中東・アフリカのキャップ&クロージャー市場規模推定と予測
13.5 中東・アフリカのキャップ&クロージャー市場規模推定と予測:国別
13.6 中東・アフリカのキャップ&クロージャー市場規模推定と予測:飲料タイプ別
13.7 中東・アフリカのキャップ&クロージャー市場規模推定と予測:サイズ別
13.8 中東・アフリカのキャップ&クロージャー市場規模推定と予測:素材タイプ別
13.9 中東・アフリのカキャップ&クロージャー市場規模推定と予測:用途別
13.10 中東・アフリのカキャップ&クロージャー市場規模推定と予測:製品タイプ別
13.11 GCCのキャップ&クロージャー市場分析
13.12 南アフリカのキャップ&クロージャー市場分析
13.13 その他の中東・アフリカ地域のキャップ&クロージャー市場分析
14 ラテンアメリカのキャップ&クロージャー市場分析
14.1 主要な調査結果
14.2 中南米のキャップ&クロージャー市場魅力度指数
14.3 ラテンアメリカのキャップ&クロージャー国別市場、2024年、2029年、2034年 (US$ Billion)
14.4 ラテンアメリカのキャップ&クロージャー市場規模推定と予測
14.5 ラテンアメリカのキャップ&クロージャー市場規模推定と予測:国別
14.6 ラテンアメリカのキャップ&クロージャー市場規模推定と予測:飲料タイプ別
14.7 ラテンアメリカのキャップ&クロージャー市場規模推定と予測:サイズ別
14.8 ラテンアメリカのキャップ&クロージャー市場規模推定と予測:素材タイプ別
14.9 ラテンアメリカのキャップ&クロージャー市場規模推定と予測:用途別
14.10 ラテンアメリカのキャップ&クロージャー市場規模推定と予測:製品タイプ別
14.11 ブラジルのキャップ&クロージャー市場分析
14.12 メキシコのキャップ&クロージャー市場分析
14.13 その他のラテンアメリカのキャップ&クロージャー市場分析
15 会社概要
15.1 競争環境、2022年
15.2 戦略的展望
15.3 Amcor plc
15.3.1 会社概要
15.3.2 会社概要
15.3.3 財務分析
15.3.3.1 純収入、2019-2023年
15.3.3.2 R&D、2019-2023年
15.3.3.3 事業セグメント収益シェア、2023年(%)
15.3.4 製品ベンチマーク
15.3.5 戦略的展望
15.4 Berry Global Group, Inc
15.4.1 会社概要
15.4.2 会社概要
15.4.3 財務分析
15.4.3.1 純収入、2018-2022年
15.4.3.2 R&D、2018-2022年
15.4.3.3 地域別収益シェア、2022年(%)
15.4.3.4 事業セグメント収益シェア、2022年(%)
15.4.4 製品ベンチマーク
15.4.5 戦略的展望
15.5 Crown Holdings, Inc
15.5.1 会社概要
15.5.2 会社概要
15.5.3 財務分析
15.5.3.1 純収入、2018-2022年
15.5.3.2 R&D、2018-2022年
15.5.3.3 地域別収益シェア、2022年(%)
15.5.3.4 事業セグメント収益シェア、2022年(%)
15.5.4 製品ベンチマーク
15.5.5 戦略的展望
15.6 Silgan Holdings
15.6.1 会社概要
15.6.2 会社概要
15.6.3 財務分析
15.6.3.1 純収入、2018年~2022年
15.6.3.2 地域別収益シェア、2022年(%)
15.6.3.3 事業セグメント別売上シェア、2022年(%)
15.6.4 製品ベンチマーク
15.7 AptarGroup, Inc
15.7.1 会社概要
15.7.2 会社概要
15.7.3 財務分析
15.7.3.1 純収入、2018-2022年
15.7.3.2 R&D、2018-2022年
15.7.3.3 地域別収益シェア、2022年(%)
15.7.3.4 事業セグメント収益シェア、2022年(%)
15.7.4 製品ベンチマーク
15.7.5 戦略的展望
15.8 BERICAP GmbH & Co KG
15.8.1 会社概要
15.8.2 会社概要
15.8.3 製品ベンチマーク
15.9 Guala Closures S.P.A
15.9.1 会社概要
15.9.2 会社概要
15.9.3 製品ベンチマーク
15.9.4 戦略的展望
15.10 Alcopack Group
15.10.1 会社概要
15.10.2 会社概要
15.10.3 製品ベンチマーク
15.11 Herti JSC
15.11.1 会社概要
15.11.2 会社概要
15.11.3 製品ベンチマーク
15.12 UNITED CAPS
15.12.1 会社概要
15.12.2 会社概要
15.12.3 製品ベンチマーク
15.12.4 戦略的展望
15.13 Caps & Closures Pty Ltd
15.13.1 会社概要
15.13.2 会社概要
15.13.3 製品ベンチマーク
15.14 Caprite Australia Pty Ltd
15.14.1 会社概要
15.14.2 会社概要
15.14.3 製品ベンチマーク
15.15 Pano Cap Canada Ltd
15.15.1 会社概要
15.15.2 会社概要
15.15.3 製品ベンチマーク
15.16 Phoenix Closures
15.16.1 会社概要
15.16.2 会社概要
15.16.3 製品ベンチマーク
15.16.4 戦略的展望
15.17 MJS Packaging
15.17.1 会社概要
15.17.2 会社概要
15.17.3 製品ベンチマーク
16 結論と提言
16.1 Visiongainからの結びの言葉
16.2 市場プレイヤーへの提言
ページTOPに戻る
図表リスト
表の一覧
Table 1 Caps & Closures Market Snapshot, 2024 & 2034 (US$ Billion, CAGR %)
Table 2 Global Caps & Closures Market by Region, 2024-2034 (US$ Bn, AGR (%), CAGR (%)) (V-Shaped Recovery Scenario)
Table 3 Global Caps & Closures Market by Region, 2024-2034 (US$ Bn, AGR (%), CAGR (%)) (U-Shaped Recovery Scenario)
Table 4 Global Caps & Closures Market by Region, 2024-2034 (US$ Bn, AGR (%), CAGR (%)) (W-Shaped Recovery Scenario)
Table 5 Global Caps & Closures Market by Region, 2024-2034 (US$ Bn, AGR (%), CAGR (%)) (L-Shaped Recovery Scenario)
Table 6 Global Caps & Closures Market by Beverage Type, 2024-2034 (US$ Bn, AGR (%), CAGR (%))
Table 7 Alcoholic Beverage Market by Region, 2024-2034 (US$ Bn, AGR (%), CAGR (%))
Table 8 Non-Alcoholic Beverage Market by Region, 2024-2034 (US$ Bn, AGR (%), CAGR (%))
Table 9 Global Caps & Closures Market by Size, 2024-2034 (US$ Bn, AGR (%), CAGR (%))
Table 10 Small (Up to 20 mm) Market by Region, 2024-2034 (US$ Bn, AGR (%), CAGR (%))
Table 11 Medium (20-50 mm) Market by Region, 2024-2034 (US$ Bn, AGR (%), CAGR (%))
Table 12 Large (Above 50 mm) Market by Region, 2024-2034 (US$ Bn, AGR (%), CAGR (%))
Table 13 Global Caps & Closures Market by Material Type, 2024-2034 (US$ Bn, AGR (%), CAGR (%))
Table 14 Plastic Market by Region, 2024-2034 (US$ Bn, AGR (%), CAGR (%))
Table 15 Metal Market by Region, 2024-2034 (US$ Bn, AGR (%), CAGR (%))
Table 16 Rubber Market by Region, 2024-2034 (US$ Bn, AGR (%), CAGR (%))
Table 17 Other Material Type Market by Region, 2024-2034 (US$ Bn, AGR (%), CAGR (%))
Table 18 Global Caps & Closures Market by Application, 2024-2034 (US$ Bn, AGR (%), CAGR (%))
Table 19 Beverages Market by Region, 2024-2034 (US$ Bn, AGR (%), CAGR (%))
Table 20 Food Market by Region, 2024-2034 (US$ Bn, AGR (%), CAGR (%))
Table 21 Pharmaceutical Market by Region, 2024-2034 (US$ Bn, AGR (%), CAGR (%))
Table 22 Personal Care Market by Region, 2024-2034 (US$ Bn, AGR (%), CAGR (%))
Table 23 Other Applications Market by Region, 2024-2034 (US$ Bn, AGR (%), CAGR (%))
Table 24 Global Caps & Closures Market by Product Type, 2024-2034 (US$ Bn, AGR (%), CAGR (%))
Table 25 Screw Caps Market by Region, 2024-2034 (US$ Bn, AGR (%), CAGR (%))
Table 26 Dispensing Caps Market by Region, 2024-2034 (US$ Bn, AGR (%), CAGR (%))
Table 27 Snap-on Caps Market by Region, 2024-2034 (US$ Bn, AGR (%), CAGR (%))
Table 28 Crown Caps Market by Region, 2024-2034 (US$ Bn, AGR (%), CAGR (%))
Table 29 Tamper-Evident Caps Market by Region, 2024-2034 (US$ Bn, AGR (%), CAGR (%))
Table 30 Other Product Type Market by Region, 2024-2034 (US$ Bn, AGR (%), CAGR (%))
Table 31 Global Caps & Closures Market by Region, 2024-2034 (US$ Bn, AGR (%), CAGR (%))
Table 32 North America Caps & Closures Market by Value, 2024-2034 (US$ Bn, AGR (%), CAGR (%))
Table 33 North America Caps & Closures Market by Country, 2024-2034 (US$ Bn, AGR (%), CAGR (%))
Table 34 North America Caps & Closures Market by Beverage Type, 2024-2034 (US$ Bn, AGR (%), CAGR (%))
Table 35 North America Caps & Closures Market by Size, 2024-2034 (US$ Bn, AGR (%), CAGR (%))
Table 36 North America Caps & Closures Market by Material Type, 2024-2034 (US$ Bn, AGR (%), CAGR (%))
Table 37 North America Caps & Closures Market by Application, 2024-2034 (US$ Bn, AGR (%), CAGR (%))
Table 38 North America Caps & Closures Market by Product Type, 2024-2034 (US$ Bn, AGR (%), CAGR (%))
Table 39 US Caps & Closures Market by Value, 2024-2034 (US$ Bn, AGR (%), CAGR (%))
Table 40 Canada Caps & Closures Market by Value, 2024-2034 (US$ Bn, AGR (%), CAGR (%))
Table 41 Europe Caps & Closures Market by Value, 2024-2034 (US$ Bn, AGR (%), CAGR (%))
Table 42 Europe Caps & Closures Market by Country, 2024-2034 (US$ Bn, AGR (%), CAGR (%))
Table 43 Europe Caps & Closures Market by Beverage Type, 2024-2034 (US$ Bn, AGR (%), CAGR (%))
Table 44 Europe Caps & Closures Market by Size, 2024-2034 (US$ Bn, AGR (%), CAGR (%))
Table 45 Europe Caps & Closures Market by Material Type, 2024-2034 (US$ Bn, AGR (%), CAGR (%))
Table 46 Europe Caps & Closures Market by Application, 2024-2034 (US$ Bn, AGR (%), CAGR (%))
Table 47 Europe Caps & Closures Market by Product Type, 2024-2034 (US$ Bn, AGR (%), CAGR (%))
Table 48 Germany Caps & Closures Market by Value, 2024-2034 (US$ Bn, AGR (%), CAGR (%))
Table 49 UK Caps & Closures Market by Value, 2024-2034 (US$ Bn, AGR (%), CAGR (%))
Table 50 France Caps & Closures Market by Value, 2024-2034 (US$ Bn, AGR (%), CAGR (%))
Table 51 Italy Caps & Closures Market by Value, 2024-2034 (US$ Bn, AGR (%), CAGR (%))
Table 52 Spain Caps & Closures Market by Value, 2024-2034 (US$ Bn, AGR (%), CAGR (%))
Table 53 Rest of Europe Caps & Closures Market by Value, 2024-2034 (US$ Bn, AGR (%), CAGR (%))
Table 54 Asia-Pacific Caps & Closures Market by Value, 2024-2034 (US$ Bn, AGR (%), CAGR (%))
Table 55 Asia-Pacific Caps & Closures Market by Country, 2024-2034 (US$ Bn, AGR (%), CAGR (%))
Table 56 Asia-Pacific Caps & Closures Market by Beverage Type, 2024-2034 (US$ Bn, AGR (%), CAGR (%))
Table 57 Asia-Pacific Caps & Closures Market by Size, 2024-2034 (US$ Bn, AGR (%), CAGR (%))
Table 58 Asia-Pacific Caps & Closures Market by Material Type, 2024-2034 (US$ Bn, AGR (%), CAGR (%))
Table 59 Asia-Pacific Caps & Closures Market by Application, 2024-2034 (US$ Bn, AGR (%), CAGR (%))
Table 60 Asia-Pacific Caps & Closures Market by Product Type, 2024-2034 (US$ Bn, AGR (%), CAGR (%))
Table 61 China Caps & Closures Market by Value, 2024-2034 (US$ Bn, AGR (%), CAGR (%))
Table 62 India Caps & Closures Market by Value, 2024-2034 (US$ Bn, AGR (%), CAGR (%))
Table 63 Japan Caps & Closures Market by Value, 2024-2034 (US$ Bn, AGR (%), CAGR (%))
Table 64 South Korea Caps & Closures Market by Value, 2024-2034 (US$ Bn, AGR (%), CAGR (%))
Table 65 Australia Caps & Closures Market by Value, 2024-2034 (US$ Bn, AGR (%), CAGR (%))
Table 66 Rest of Asia-Pacific Caps & Closures Market by Value, 2024-2034 (US$ Bn, AGR (%), CAGR (%))
Table 67 Middle East & Africa Caps & Closures Market by Value, 2024-2034 (US$ Bn, AGR (%), CAGR (%))
Table 68 Middle East & Africa Caps & Closures Market by Country, 2024-2034 (US$ Bn, AGR (%), CAGR (%))
Table 69 Middle East & Africa Caps & Closures Market by Beverage Type, 2024-2034 (US$ Bn, AGR (%), CAGR (%))
Table 70 Middle East & Africa Caps & Closures Market by Size, 2024-2034 (US$ Bn, AGR (%), CAGR (%))
Table 71 Middle East & Africa Caps & Closures Market by Material Type, 2024-2034 (US$ Bn, AGR (%), CAGR (%))
Table 72 Middle East & Africa Caps & Closures Market by Application, 2024-2034 (US$ Bn, AGR (%), CAGR (%))
Table 73 Middle East & Africa Caps & Closures Market by Product Type, 2024-2034 (US$ Bn, AGR (%), CAGR (%))
Table 74 GCC Caps & Closures Market by Value, 2024-2034 (US$ Bn, AGR (%), CAGR (%))
Table 75 South Africa Caps & Closures Market by Value, 2024-2034 (US$ Bn, AGR (%), CAGR (%))
Table 76 Rest of Middle East & Africa Caps & Closures Market by Value, 2024-2034 (US$ Bn, AGR (%), CAGR (%))
Table 77 Latin America Caps & Closures Market by Value, 2024-2034 (US$ Bn, AGR (%), CAGR (%))
Table 78 Latin America Caps & Closures Market by Country, 2024-2034 (US$ Bn, AGR (%), CAGR (%))
Table 79 Latin America Caps & Closures Market by Beverage Type, 2024-2034 (US$ Bn, AGR (%), CAGR (%))
Table 80 Latin America Caps & Closures Market by Size, 2024-2034 (US$ Bn, AGR (%), CAGR (%))
Table 81 Latin America Caps & Closures Market by Material Type, 2024-2034 (US$ Bn, AGR (%), CAGR (%))
Table 82 Latin America Caps & Closures Market by Application, 2024-2034 (US$ Bn, AGR (%), CAGR (%))
Table 83 Latin America Caps & Closures Market by Product Type, 2024-2034 (US$ Bn, AGR (%), CAGR (%))
Table 84 Brazil Caps & Closures Market by Value, 2024-2034 (US$ Bn, AGR (%), CAGR (%))
Table 85 Mexico Caps & Closures Market by Value, 2024-2034 (US$ Bn, AGR (%), CAGR (%))
Table 86 Rest of Latin America Caps & Closures Market by Value, 2024-2034 (US$ Bn, AGR (%), CAGR (%))
Table 87 Strategic Outlook - Contract
Table 88 Amcor plc: Key Details, (CEO, HQ, Revenue, Founded, No. of Employees, Company Type, Website, Business Segment)
Table 89 Amcor plc: Product Benchmarking
Table 90 Amcor plc: Strategic Outlook
Table 91 Berry Global Group, Inc: Key Details, (CEO, HQ, Revenue, Founded, No. of Employees, Company Type, Website, Business Segment)
Table 92 Berry Global Group, Inc: Product Benchmarking
Table 93 Berry Global Group, Inc: Strategic Outlook
Table 94 Crown Holdings, Inc: Key Details, (CEO, HQ, Revenue, Founded, No. of Employees, Company Type, Website, Business Segment)
Table 95 Crown Holdings, Inc: Product Benchmarking
Table 96 Crown Holdings, Inc: Strategic Outlook
Table 97 Silgan Holdings: Key Details, (CEO, HQ, Revenue, Founded, No. of Employees, Company Type, Website, Business Segment)
Table 98 Silgan Holdings: Product Benchmarking
Table 99 AptarGroup, Inc: Key Details, (CEO, HQ, Revenue, Founded, No. of Employees, Company Type, Website, Business Segment)
Table 100 AptarGroup, Inc: Product Benchmarking
Table 101 AptarGroup, Inc: Strategic Outlook
Table 102 BERICAP GmbH & Co KG: Key Details, (CEO, HQ, Revenue, Founded, No. of Employees, Company Type, Website, Business Segment)
Table 103 BERICAP GmbH & Co KG: Product Benchmarking
Table 104 Guala Closures S.P.A: Key Details, (CEO, HQ, Revenue, Founded, No. of Employees, Company Type, Website, Business Segment)
Table 105 Guala Closures S.P.A: Product Benchmarking
Table 106 Guala Closures S.P.A: Strategic Outlook
Table 107 Alcopack Group: Key Details, (CEO, HQ, Revenue, Founded, No. of Employees, Company Type, Website, Business Segment)
Table 108 Alcopack Group: Product Benchmarking
Table 109 Herti JSC: Key Details, (CEO, HQ, Revenue, Founded, No. of Employees, Company Type, Website, Business Segment)
Table 110 Herti JSC: Product Benchmarking
Table 111 UNITED CAPS: Key Details, (CEO, HQ, Revenue, Founded, No. of Employees, Company Type, Website, Business Segment)
Table 112 UNITED CAPS: Product Benchmarking
Table 113 UNITED CAPS: Strategic Outlook
Table 114 Caps & Closures Pty Ltd: Key Details, (CEO, HQ, Revenue, Founded, No. of Employees, Company Type, Website, Business Segment)
Table 115 Caps & Closures Pty Ltd: Product Benchmarking
Table 116 Caprite Australia Pty Ltd: Key Details, (CEO, HQ, Revenue, Founded, No. of Employees, Company Type, Website, Business Segment)
Table 117 Caprite Australia Pty Ltd: Product Benchmarking
Table 118 Pano Cap Canada Ltd: Key Details, (CEO, HQ, Revenue, Founded, No. of Employees, Company Type, Website, Business Segment)
Table 119 Pano Cap Canada Ltd: Product Benchmarking
Table 120 Phoenix Closures: Key Details, (CEO, HQ, Revenue, Founded, No. of Employees, Company Type, Website, Business Segment)
Table 121 Phoenix Closures: Product Benchmarking
Table 122 Phoenix Closures: Strategic Outlook
Table 123 MJS Packaging: Key Details, (CEO, HQ, Revenue, Founded, No. of Employees, Company Type, Website, Business Segment)
Table 124 MJS Packaging: Product Benchmarking
図の一覧
Figure 1 Caps & Closures Market Segmentation
Figure 2 Caps & Closures Market by Beverage Type: Market Attractiveness Index
Figure 3 Caps & Closures Market by Size: Market Attractiveness Index
Figure 4 Caps & Closures Market by Material Type: Market Attractiveness Index
Figure 5 Caps & Closures Market by Application: Market Attractiveness Index
Figure 6 Caps & Closures Market by Product Type: Market Attractiveness Index
Figure 7 Caps & Closures Market Attractiveness Index by Region
Figure 8 Caps & Closures Market: Market Dynamics
Figure 9 Caps & Closures Market: Porter’s Five Forces Analysis
Figure 10 Global Caps & Closures Market Share Forecast by COVID, 2024-2034 (%)
Figure 11 Global Caps & Closures Market by Region, 2024-2034 (US$ Bn, AGR (%)) (V-Shaped Recovery Scenario)
Figure 12 Global Caps & Closures Market by Region, 2024-2034 (US$ Bn, AGR (%)) (U-Shaped Recovery Scenario)
Figure 13 Global Caps & Closures Market by Region, 2024-2034 (US$ Bn, AGR (%)) (W-Shaped Recovery Scenario)
Figure 14 Global Caps & Closures Market by Region, 2024-2034 (US$ Bn, AGR (%)) (L-Shaped Recovery Scenario)
Figure 15 Caps & Closures Market: PEST Analysis
Figure 16 Caps & Closures Market by Beverage Type: Market Attractiveness Index
Figure 17 Global Caps & Closures Market by Beverage Type, 2024-2034 (US$ Bn, AGR (%))
Figure 18 Caps & Closures Market Share Forecast by Beverage Type, 2024, 2029, 2034 (%)
Figure 19 Alcoholic Beverage Market by Region, 2024-2034 (US$ Bn, AGR (%))
Figure 20 Alcoholic Beverage Market Share Forecast by Region, 2024 & 2034 (%)
Figure 21 Non-Alcoholic Beverage Market by Region, 2024-2034 (US$ Bn, AGR (%))
Figure 22 Non-Alcoholic Beverage Market Share Forecast by Region, 2024 & 2034 (%)
Figure 23 Caps & Closures Market by Size: Market Attractiveness Index
Figure 24 Global Caps & Closures Market by Size, 2024-2034 (US$ Bn, AGR (%))
Figure 25 Caps & Closures Market Share Forecast by Size, 2024, 2029, 2034 (%)
Figure 26 Small (Up to 20 mm) Market by Region, 2024-2034 (US$ Bn, AGR (%))
Figure 27 Small (Up to 20 mm) Market Share Forecast by Region, 2024 & 2034 (%)
Figure 28 Medium (20-50 mm) Market by Region, 2024-2034 (US$ Bn, AGR (%))
Figure 29 Medium (20-50 mm) Market Share Forecast by Region, 2024 & 2034 (%)
Figure 30 Large (Above 50 mm) Market by Region, 2024-2034 (US$ Bn, AGR (%))
Figure 31 Large (Above 50 mm) Market Share Forecast by Region, 2024 & 2034 (%)
Figure 32 Caps & Closures Market by Material Type: Market Attractiveness Index
Figure 33 Global Caps & Closures Market by Material Type, 2024-2034 (US$ Bn, AGR (%))
Figure 34 Caps & Closures Market Share Forecast by Material Type, 2024, 2029, 2034 (%)
Figure 35 Plastic Market by Region, 2024-2034 (US$ Bn, AGR (%))
Figure 36 Plastic Market Share Forecast by Region, 2024 & 2034 (%)
Figure 37 Metal Market by Region, 2024-2034 (US$ Bn, AGR (%))
Figure 38 Metal Market Share Forecast by Region, 2024 & 2034 (%)
Figure 39 Rubber Market by Region, 2024-2034 (US$ Bn, AGR (%))
Figure 40 Rubber Market Share Forecast by Region, 2024 & 2034 (%)
Figure 41 Other Material Type Market by Region, 2024-2034 (US$ Bn, AGR (%))
Figure 42 Others Market Share Forecast by Region, 2024 & 2034 (%)
Figure 43 Caps & Closures Market by Application: Market Attractiveness Index
Figure 44 Global Caps & Closures Market by Application, 2024-2034 (US$ Bn, AGR (%))
Figure 45 Caps & Closures Market Share Forecast by Application, 2024, 2029, 2034 (%)
Figure 46 Beverages Market by Region, 2024-2034 (US$ Bn, AGR (%))
Figure 47 Beverages Market Share Forecast by Region, 2024 & 2034 (%)
Figure 48 Food Market by Region, 2024-2034 (US$ Bn, AGR (%))
Figure 49 Food Market Share Forecast by Region, 2024 & 2034 (%)
Figure 50 Pharmaceutical Market by Region, 2024-2034 (US$ Bn, AGR (%))
Figure 51 Pharmaceutical Market Share Forecast by Region, 2024 & 2034 (%)
Figure 52 Personal Care Market by Region, 2024-2034 (US$ Bn, AGR (%))
Figure 53 Personal Care Market Share Forecast by Region, 2024 & 2034 (%)
Figure 54 Other Applications Market by Region, 2024-2034 (US$ Bn, AGR (%))
Figure 55 Other Applications Market Share Forecast by Region, 2024 & 2034 (%)
Figure 56 Caps & Closures Market by Product Type: Market Attractiveness Index
Figure 57 Global Caps & Closures Market by Product Type, 2024-2034 (US$ Bn, AGR (%))
Figure 58 Caps & Closures Market Share Forecast by Product Type, 2024, 2029, 2034 (%)
Figure 59 Screw Caps Market by Region, 2024-2034 (US$ Bn, AGR (%))
Figure 60 Screw Caps Market Share Forecast by Region, 2024 & 2034 (%)
Figure 61 Dispensing Caps Market by Region, 2024-2034 (US$ Bn, AGR (%))
Figure 62 Dispensing Caps Market Share Forecast by Region, 2024 & 2034 (%)
Figure 63 Snap-on Caps Market by Region, 2024-2034 (US$ Bn, AGR (%))
Figure 64 Snap-on Caps Market Share Forecast by Region, 2024 & 2034 (%)
Figure 65 Crown Caps Market by Region, 2024-2034 (US$ Bn, AGR (%))
Figure 66 Crown Caps Market Share Forecast by Region, 2024 & 2034 (%)
Figure 67 Tamper-Evident Caps Market by Region, 2024-2034 (US$ Bn, AGR (%))
Figure 68 Tamper-Evident Caps Market Share Forecast by Region, 2024 & 2034 (%)
Figure 69 Other Product Type Market by Region, 2024-2034 (US$ Bn, AGR (%))
Figure 70 Other Product Type Market Share Forecast by Region, 2024 & 2034 (%)
Figure 71 Caps & Closures Market Forecast by Region 2024 and 2034 (Revenue, CAGR%)
Figure 72 Caps & Closures Market Share Forecast by Region 2024, 2029, 2034 (%)
Figure 73 Global Caps & Closures Market by Region, 2024-2034 (US$ Bn, AGR (%))
Figure 74 North America Caps & Closures Market Attractiveness Index
Figure 75 North America Caps & Closures Market by Region, 2024, 2029 & 2034 (US$ Billion)
Figure 76 North America Caps & Closures Market by Value, 2024-2034 (US$ Bn, AGR (%))
Figure 77 North America Caps & Closures Market by Country, 2024-2034 (US$ Bn, AGR (%))
Figure 78 North America Caps & Closures Market Share Forecast by Country, 2024 & 2034 (%)
Figure 79 North America Caps & Closures Market by Beverage Type, 2024-2034 (US$ Bn, AGR (%))
Figure 80 North America Caps & Closures Market Share Forecast Beverage Type, 2024 & 2034 (%)
Figure 81 North America Caps & Closures Market by Size, 2024-2034 (US$ Bn, AGR (%))
Figure 82 North America Caps & Closures Market Share Forecast by Size, 2024 & 2034 (%)
Figure 83 North America Caps & Closures Market by Material Type, 2024-2034 (US$ Bn, AGR (%))
Figure 84 North America Caps & Closures Market Share Forecast by Material Type, 2024 & 2034 (%)
Figure 85 North America Caps & Closures Market by Application, 2024-2034 (US$ Bn, AGR (%))
Figure 86 North America Caps & Closures Market Share Forecast by Application, 2024 & 2034 (%)
Figure 87 North America Caps & Closures Market by Product Type, 2024-2034 (US$ Bn, AGR (%))
Figure 88 North America Caps & Closures Market Share Forecast by Product Type, 2024 & 2034 (%)
Figure 89 US Caps & Closures Market by Value, 2024-2034 (US$ Bn, AGR (%))
Figure 90 Canada Caps & Closures Market by Value, 2024-2034 (US$ Bn, AGR (%))
Figure 91 Europe Caps & Closures Market Attractiveness Index
Figure 92 Europe Caps & Closures Market by Region, 2024, 2029 & 2034 (US$ Billion)
Figure 93 Europe Caps & Closures Market by Value, 2024-2034 (US$ Bn, AGR (%))
Figure 94 Europe Caps & Closures Market by Country, 2024-2034 (US$ Bn, AGR (%))
Figure 95 Europe Caps & Closures Market Share Forecast by Country, 2024 & 2034 (%)
Figure 96 Europe Caps & Closures Market by Beverage Type, 2024-2034 (US$ Bn, AGR (%),)
Figure 97 Europe Caps & Closures Market Share Forecast Beverage Type, 2024 & 2034 (%)
Figure 98 Europe Caps & Closures Market by Size, 2024-2034 (US$ Bn, AGR (%))
Figure 99 Europe Caps & Closures Market Share Forecast by Size, 2024 & 2034 (%)
Figure 100 Europe Caps & Closures Market by Material Type, 2024-2034 (US$ Bn, AGR (%))
Figure 101 Europe Caps & Closures Market Share Forecast by Material Type, 2024 & 2034 (%)
Figure 102 Europe Caps & Closures Market by Application, 2024-2034 (US$ Bn, AGR (%))
Figure 103 Europe Caps & Closures Market Share Forecast by Application, 2024 & 2034 (%)
Figure 104 Europe Caps & Closures Market by Product Type, 2024-2034 (US$ Bn, AGR (%))
Figure 105 Europe Caps & Closures Market Share Forecast by Product Type, 2024 & 2034 (%)
Figure 106 Germany Caps & Closures Market by Value, 2024-2034 (US$ Bn, AGR (%))
Figure 107 UK Caps & Closures Market by Value, 2024-2034 (US$ Bn, AGR (%))
Figure 108 France Caps & Closures Market by Value, 2024-2034 (US$ Bn, AGR (%))
Figure 109 Italy Caps & Closures Market by Value, 2024-2034 (US$ Bn, AGR (%))
Figure 110 Spain Caps & Closures Market by Value, 2024-2034 (US$ Bn, AGR (%))
Figure 111 Rest of Europe Caps & Closures Market by Value, 2024-2034 (US$ Bn, AGR (%))
Figure 112 Asia-Pacific Caps & Closures Market Attractiveness Index
Figure 113 Asia-Pacific Caps & Closures Market by Region, 2024, 2029 & 2034 (US$ Billion)
Figure 114 Asia-Pacific Caps & Closures Market by Value, 2024-2034 (US$ Bn, AGR (%))
Figure 115 Asia-Pacific Caps & Closures Market by Country, 2024-2034 (US$ Bn, AGR (%))
Figure 116 Asia-Pacific Caps & Closures Market Share Forecast by Country, 2024 & 2034 (%)
Figure 117 Asia-Pacific Caps & Closures Market by Beverage Type, 2024-2034 (US$ Bn, AGR (%))
Figure 118 Asia-Pacific Caps & Closures Market Share Forecast Beverage Type, 2024 & 2034 (%)
Figure 119 Asia-Pacific Caps & Closures Market by Size, 2024-2034 (US$ Bn, AGR (%))
Figure 120 Asia-Pacific Caps & Closures Market Share Forecast by Size, 2024 & 2034 (%)
Figure 121 Asia-Pacific Caps & Closures Market by Material Type, 2024-2034 (US$ Bn, AGR (%))
Figure 122 Asia-Pacific Caps & Closures Market Share Forecast by Material Type, 2024 & 2034 (%)
Figure 123 Asia-Pacific Caps & Closures Market by Application, 2024-2034 (US$ Bn, AGR (%))
Figure 124 Asia-Pacific Caps & Closures Market Share Forecast by Application, 2024 & 2034 (%)
Figure 125 Asia-Pacific Caps & Closures Market by Product Type, 2024-2034 (US$ Bn, AGR (%))
Figure 126 Asia-Pacific Caps & Closures Market Share Forecast by Product Type, 2024 & 2034 (%)
Figure 127 China Caps & Closures Market by Value, 2024-2034 (US$ Bn, AGR (%))
Figure 128 India Caps & Closures Market by Value, 2024-2034 (US$ Bn, AGR (%))
Figure 129 Japan Caps & Closures Market by Value, 2024-2034 (US$ Bn, AGR (%))
Figure 130 South Korea Caps & Closures Market by Value, 2024-2034 (US$ Bn, AGR (%))
Figure 131 Australia Caps & Closures Market by Value, 2024-2034 (US$ Bn, AGR (%))
Figure 132 Rest of Asia-Pacific Caps & Closures Market by Value, 2024-2034 (US$ Bn, AGR (%))
Figure 133 Middle East and Africa Caps & Closures Market Attractiveness Index
Figure 134 Middle East and Africa Caps & Closures Market by Region, 2024, 2029 & 2034 (US$ Billion)
Figure 135 Middle East & Africa Caps & Closures Market by Value, 2024-2034 (US$ Bn, AGR (%))
Figure 136 Middle East & Africa Caps & Closures Market by Country, 2024-2034 (US$ Bn, AGR (%))
Figure 137 Middle East and Africa Caps & Closures Market Share Forecast by Country, 2024 & 2034 (%)
Figure 138 Middle East & Africa Caps & Closures Market by Beverage Type, 2024-2034 (US$ Bn, AGR (%))
Figure 139 Middle East and Africa Caps & Closures Market Share Forecast Beverage Type, 2024 & 2034 (%)
Figure 140 Middle East & Africa Caps & Closures Market by Size, 2024-2034 (US$ Bn, AGR (%))
Figure 141 Middle East and Africa Caps & Closures Market Share Forecast by Size, 2024 & 2034 (%)
Figure 142 Middle East & Africa Caps & Closures Market by Material Type, 2024-2034 (US$ Bn, AGR (%))
Figure 143 Middle East and Africa Caps & Closures Market Share Forecast by Material Type, 2024 & 2034 (%)
Figure 144 Middle East & Africa Caps & Closures Market by Application, 2024-2034 (US$ Bn, AGR (%))
Figure 145 Middle East and Africa Caps & Closures Market Share Forecast by Application, 2024 & 2034 (%)
Figure 146 Middle East & Africa Caps & Closures Market by Product Type, 2024-2034 (US$ Bn, AGR (%))
Figure 147 Middle East and Africa Caps & Closures Market Share Forecast by Product Type, 2024 & 2034 (%)
Figure 148 GCC Caps & Closures Market by Value, 2024-2034 (US$ Bn, AGR (%))
Figure 149 South Africa Caps & Closures Market by Value, 2024-2034 (US$ Bn, AGR (%))
Figure 150 Rest of Middle East & Africa Caps & Closures Market by Value, 2024-2034 (US$ Bn, AGR (%))
Figure 151 Latin America Caps & Closures Market Attractiveness Index
Figure 152 Latin America Caps & Closures Market by Region, 2024, 2029 & 2034 (US$ Billion)
Figure 153 Latin America Caps & Closures Market by Value, 2024-2034 (US$ Bn, AGR (%))
Figure 154 Latin America Caps & Closures Market by Country, 2024-2034 (US$ Bn, AGR (%))
Figure 155 Latin America Caps & Closures Market Share Forecast by Country, 2024 & 2034 (%)
Figure 156 Latin America Caps & Closures Market by Beverage Type, 2024-2034 (US$ Bn, AGR (%))
Figure 157 Latin America Caps & Closures Market Share Forecast Beverage Type, 2024 & 2034 (%)
Figure 158 Latin America Caps & Closures Market by Size, 2024-2034 (US$ Bn, AGR (%))
Figure 159 Latin America Caps & Closures Market Share Forecast by Size, 2024 & 2034 (%)
Figure 160 Latin America Caps & Closures Market by Material Type, 2024-2034 (US$ Bn, AGR (%))
Figure 161 Latin America Caps & Closures Market Share Forecast by Material Type, 2024 & 2034 (%)
Figure 162 Latin America Caps & Closures Market by Application, 2024-2034 (US$ Bn, AGR (%))
Figure 163 Latin America Caps & Closures Market Share Forecast by Application, 2024 & 2034 (%)
Figure 164 Latin America Caps & Closures Market by Product Type, 2024-2034 (US$ Bn, AGR (%))
Figure 165 Latin America Caps & Closures Market Share Forecast by Product Type, 2024 & 2034 (%)
Figure 166 Brazil Caps & Closures Market by Value, 2024-2034 (US$ Bn, AGR (%))
Figure 167 Mexico Caps & Closures Market by Value, 2024-2034 (US$ Bn, AGR (%),
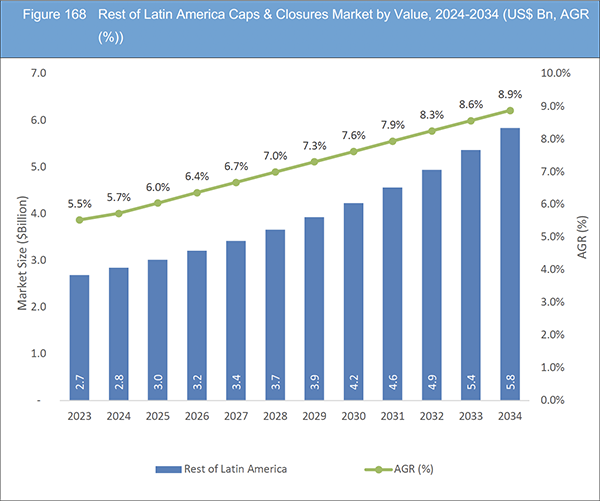
Figure 168 Rest of Latin America Caps & Closures Market by Value, 2024-2034 (US$ Bn, AGR (%))
Figure 169 Caps & Closures Market: Company Share, 2022
Figure 170 Amcor plc.: Net Revenue, 2019-2023 (US$ Million, AGR%)
Figure 171 Amcor plc.: R&D, 2019-2023 (US$ Million, AGR%)
Figure 172 Amcor plc.: Business Segment Revenue Share, 2023 (%)
Figure 173 Berry Global Group, Inc.: Net Revenue, 2018-2022 (US$ Million, AGR%)
Figure 174 Berry Global Group, Inc.: R&D, 2018-2022 (US$ Million, AGR%)
Figure 175 Berry Global Group, Inc.: Regional Revenue Share, 2022 (%)
Figure 176 Berry Global Group, Inc.: Business Segment Revenue Share, 2022 (%)
Figure 177 Crown Holdings, Inc.: Net Revenue, 2018-2022 (US$ Million, AGR%)
Figure 178 Crown Holdings, Inc.: R&D, 2018-2022 (US$ Million, AGR%)
Figure 179 Crown Holdings, Inc.: Regional Revenue Share, 2022 (%)
Figure 180 Crown Holdings, Inc.: Business Segment Revenue Share, 2022 (%)
Figure 181 Silgan Holdings.: Net Revenue, 2018-2022 (US$ Million, AGR%)
Figure 182 Silgan Holdings.: Regional Revenue Share, 2022 (%)
Figure 183 Silgan Holdings.: Business Segment Revenue Share, 2022 (%)
Figure 184 AptarGroup, Inc.: Net Revenue, 2018-2022 (US$ Million, AGR%)
Figure 185 AptarGroup, Inc.: R&D, 2018-2022 (US$ Million, AGR%)
Figure 186 AptarGroup, Inc.: Regional Revenue Share, 2022 (%)
Figure 187 AptarGroup, Inc.: Business Segment Revenue Share, 2022 (%)
ページTOPに戻る
Summary
Report Details
The Caps & Closures Market Report 2024-2034: This report will prove invaluable to leading firms striving for new revenue pockets if they wish to better understand the industry and its underlying dynamics. It will be useful for companies that would like to expand into different industries or to expand their existing operations in a new region.
Several Key Drivers Primarily propel the Caps and Closures Market
The caps and closures market is primarily propelled by several key drivers that significantly influence its growth trajectory. Consumer demand for convenient and secure packaging solutions, coupled with increasing awareness of product safety and freshness, remains a primary driver. The market is further energized by technological advancements in manufacturing processes, enhancing production efficiency and precision. Environmental sustainability emerges as a pivotal driver, with a growing emphasis on eco-friendly materials and recyclable closures. The industry is witnessing a paradigm shift toward sustainable practices, reflecting a broader global commitment to reducing plastic waste. Manufacturers are responding with innovative, green alternatives, leveraging materials that align with circular economy principles.
Amidst the challenges, the caps and closures market present lucrative opportunities, especially in the realm of collaboration and partnerships among market players. Strategic alliances facilitate the exchange of expertise, technology, and resources, fostering innovation and expanding the scope of sustainable practices. Additionally, the rising trend of customization and smart packaging solutions opens avenues for niche markets and tailored closures catering to specific consumer needs. Geographically, emerging economies present untapped opportunities for market penetration. As these regions experience economic growth, there is an increased demand for advanced packaging solutions, providing a fertile ground for the caps and closures market to expand its global footprint.
Availability of Substitutes to Hinder the Market Growth Caps and Closures Market.
One significant restraining factor affecting the caps and closures market is the presence and availability of substitutes. The market faces challenges due to alternatives that serve similar purposes in packaging but differ in terms of materials or mechanisms. These substitutes could include alternative closure technologies, sealants, or packaging solutions that compete for market share. The availability of substitutes introduces a level of competition and choice for consumers and businesses seeking packaging solutions. For instance, in the beverage industry, manufacturers might consider alternative closure methods such as heat sealing or induction sealing instead of traditional caps. These substitutes, while offering different features, still fulfil the basic function of sealing containers.
What Questions Should You Ask before Buying a Market Research Report?
-
How is the caps & closures market evolving?
-
What is driving and restraining the caps & closures market?
-
How will each caps & closures submarket segment grow over the forecast period and how much revenue will these submarkets account for in 2034?
-
How will the market shares for each caps & closures submarket develop from 2024 to 2034?
-
What will be the main driver for the overall market from 2024 to 2034?
-
Will leading caps & closures markets broadly follow the macroeconomic dynamics, or will individual national markets outperform others?
-
How will the market shares of the national markets change by 2034 and which geographical region will lead the market in 2034?
-
Who are the leading players and what are their prospects over the forecast period?
-
What are the caps & closures projects for these leading companies?
-
How will the industry evolve during the period between 2024 and 2034? What are the implications of caps & closures projects taking place now and over the next 10 years?
-
Is there a greater need for product commercialisation to further scale the caps & closures market?
-
Where is the caps & closures market heading and how can you ensure you are at the forefront of the market?
-
What are the best investment options for new product and service lines?
-
What are the key prospects for moving companies into a new growth path and C-suite?
You need to discover how this will impact the caps & closures market today, and over the next 10 years:
-
Our 395-page report provides 124 tables and 187 charts/graphs exclusively to you.
-
The report highlights key lucrative areas in the industry so you can target them – NOW.
-
It contains in-depth analysis of global, regional and national sales and growth.
-
It highlights for you the key successful trends, changes and revenue projections made by your competitors.
This report tells you TODAY how the caps & closures market will develop in the next 10 years, and in line with the variations in COVID-19 economic recession and bounce. This market is more critical now than at any point over the last 10 years.
Forecasts to 2034 and other analyses reveal commercial prospects
-
In addition to revenue forecasting to 2034, our new study provides you with recent results, growth rates, and market shares.
-
You will find original analyses, with business outlooks and developments.
-
Discover qualitative analyses (including market dynamics, drivers, opportunities, restraints and challenges), cost structure, impact of rising caps & closures prices and recent developments.
This report includes data analysis and invaluable insight into how COVID-19 will affect the industry and your company. Four COVID-19 recovery patterns and their impact, namely, “V”, “L”, “W” and “U” are discussed in this report.
Segments Covered in the Report
Market Segment by Beverage Type
-
Alcoholic Beverage
-
Non-Alcoholic Beverage
Market Segment by Size
-
Small (Up to 20 mm)
-
Medium (20-50 mm)
-
Large (Above 50 mm)
Market Segment by Material Type
-
Plastic
-
Metal
-
Rubber
-
Other Material Type
Market Segment by Application
-
Beverages
-
Food
-
Pharmaceutical
-
Personal Care
-
Other Applications
Market Segment by Product Type
-
Screw Caps
-
Dispensing Caps
-
Snap-on Caps
-
Crown Caps
-
Tamper-Evident Caps
-
Other Product Type
In addition to the revenue predictions for the overall world market and segments, you will also find revenue forecasts for four regional and 20 leading national markets:
North America
Europe
-
Germany
-
Spain
-
United Kingdom
-
France
-
Italy
-
Rest of Europe
Asia Pacific
-
China
-
Japan
-
India
-
Australia
-
South Korea
-
Rest of Asia Pacific
Latin America
-
Brazil
-
Mexico
-
Rest of Latin America
Middle East & Africa
-
GCC
-
South Africa
-
Rest of Middle East & Africa
The report also includes profiles and for some of the leading companies in the Caps & Closures Market, 2024 to 2034, with a focus on this segment of these companies’ operations.
Leading companies profiled in the report
-
Alcopack Group
-
Amcor plc
-
AptarGroup, Inc
-
BERICAP GmbH & Co KG
-
Berry Global Group, Inc.
-
Caprite Australia Pty Ltd
-
Caps & Closures Pty Ltd
-
Crown Holdings, Inc.
-
Guala Closures S.P.A
-
Herti JSC
-
MJS Packaging
-
Pano Cap Canada Ltd
-
Phoenix Closures
-
Silgan Holdings
-
UNITED CAPS
Overall world revenue for Caps & Closures Market, 2024 to 2034 in terms of value the market will surpass US$86.6 billion in 2024, our work calculates. We predict strong revenue growth through to 2034. Our work identifies which organizations hold the greatest potential. Discover their capabilities, progress, and commercial prospects, helping you stay ahead.
How will the Caps & Closures Market, 2024 to 2034 report help you?
In summary, our 390+ page report provides you with the following knowledge:
-
Revenue forecasts to 2034 for Caps & Closures Market, 2024 to 2034 Market, with forecasts for beverage type, size, material type, application, and product type, each forecast at a global and regional level – discover the industry’s prospects, finding the most lucrative places for investments and revenues.
-
Revenue forecasts to 2034 for four regional and 20 key national markets – See forecasts for the Caps & Closures Market, 2024 to 2034 market in North America, Europe, Asia-Pacific, Latin America and Middle East & Africa. Also forecasted is the market in the US, Canada, Brazil, Germany, France, UK, Italy, China, India, Japan, and Australia among other prominent economies.
-
Prospects for established firms and those seeking to enter the market – including company profiles for 15 of the major companies involved in the Caps & Closures Market, 2024 to 2034.
Find quantitative and qualitative analyses with independent predictions. Receive information that only our report contains, staying informed with invaluable business intelligence.
Information found nowhere else
With our new report, you are less likely to fall behind in knowledge or miss out on opportunities. See how our work could benefit your research, analyses, and decisions. Visiongain’s study is for everybody needing commercial analyses for the Caps & Closures Market, 2024 to 2034, market-leading companies. You will find data, trends and predictions.
ページTOPに戻る
Table of Contents
Table of Contents
1 Report Overview
1.1 Objectives of the Study
1.2 Introduction to Caps & Closures Market
1.3 What This Report Delivers
1.4 Why You Should Read This Report
1.5 Key Questions Answered by This Analytical Report
1.6 Who Is This Report for?
1.7 Methodology
1.7.1 Market Definitions
1.7.2 Market Evaluation & Forecasting Methodology
1.7.3 Data Validation
1.7.3.1 Primary Research
1.7.3.2 Secondary Research
1.8 Frequently Asked Questions (FAQs)
1.9 Associated Visiongain Reports
1.10 About Visiongain
2 Executive Summary
3 Market Overview
3.1 Key Findings
3.2 Market Dynamics
3.2.1 Market Driving Factors
3.2.1.1 Increasing Demand in the Beverage, Packaged Food and Pharmaceutical Drugs Industry Driving the Market Growth
3.2.1.2 Product Differentiating, Branding and Decreasing Package sizes
3.2.1.3 Consumer Preferences for Convenient and Unique Packaging Solutions Driving the Market Growth
3.2.2 Market Restraining Factors
3.2.2.1 Availability of Substitute to Hinder the Market Growth Caps and Closures Market.
3.2.2.2 Stringent Environmental Regulations Hinder the Market Growth
3.2.2.3 Raw Material, Labour and Supply Chain Cost Pressure Hinder the Market Growth
3.2.3 Market Opportunities
3.2.3.1 Technological Advancements Such as Smart Packaging, 3D Printing, and anti-Counterfeiting Features Present Opportunities for Companies.
3.2.3.2 Opportunities Exist for Market Players to Expand Their Global Presence, Tapping into Emerging Markets and Catering to Diverse Regional Packaging Needs.
3.2.3.3 Collaboration and Partnership Between Market Players Generate Opportunities
3.3 Porter’s Five Forces Analysis
3.3.1 Bargaining Power of Suppliers (Moderate to High)
3.3.2 Bargaining Power of Buyers (Moderate)
3.3.3 Competitive Rivalry (High)
3.3.4 Threat from Substitutes (Low)
3.3.5 Threat of New Entrants (Low)
3.4 COVID-19 Impact Analysis
3.4.1 “V-Shaped Recovery”
3.4.2 “U-Shaped Recovery”
3.4.3 “W-Shaped Recovery”
3.4.4 “L-Shaped Recovery”
3.5 PEST Analysis
4 Caps & Closures Market Analysis by Beverage Type
4.1 Key Findings
4.2 Beverage Type Segment: Market Attractiveness Index
4.3 Caps & Closures Market Size Estimation and Forecast by Beverage Type
4.4 Alcoholic Beverage
4.4.1 Market Size by Region, 2024-2034 (US$ Billion)
4.4.2 Market Share by Region, 2024 & 2034 (%)
4.5 Non-Alcoholic Beverage
4.5.1 Market Size by Region, 2024-2034 (US$ Billion)
4.5.2 Market Share by Region, 2024 & 2034 (%)
5 Caps & Closures Market Analysis by Size
5.1 Key Findings
5.2 Size Segment: Market Attractiveness Index
5.3 Caps & Closures Market Size Estimation and Forecast by Size
5.4 Small (Up to 20 mm)
5.4.1 Market Size by Region, 2024-2034 (US$ Billion)
5.4.2 Market Share by Region, 2024 & 2034 (%)
5.5 Medium (20-50 mm)
5.5.1 Market Size by Region, 2024-2034 (US$ Billion)
5.5.2 Market Share by Region, 2024 & 2034 (%)
5.6 Large (Above 50 mm)
5.6.1 Market Size by Region, 2024-2034 (US$ Billion)
5.6.2 Market Share by Region, 2024 & 2034 (%)
6 Caps & Closures Market Analysis by Material Type
6.1 Key Findings
6.2 Material Type Segment: Market Attractiveness Index
6.3 Caps & Closures Market Size Estimation and Forecast by Material Type
6.4 Plastic
6.4.1 Market Size by Region, 2024-2034 (US$ Billion)
6.4.2 Market Share by Region, 2024 & 2034 (%)
6.5 Metal
6.5.1 Market Size by Region, 2024-2034 (US$ Billion)
6.5.2 Market Share by Region, 2024 & 2034 (%)
6.6 Rubber
6.6.1 Market Size by Region, 2024-2034 (US$ Billion)
6.6.2 Market Share by Region, 2024 & 2034 (%)
6.7 Others
6.7.1 Market Size by Region, 2024-2034 (US$ Billion)
6.7.2 Market Share by Region, 2024 & 2034 (%)
7 Caps & Closures Market Analysis by Application
7.1 Key Findings
7.2 Application Segment: Market Attractiveness Index
7.3 Caps & Closures Market Size Estimation and Forecast by Application
7.4 Beverages
7.4.1 Market Size by Region, 2024-2034 (US$ Billion)
7.4.2 Market Share by Region, 2024 & 2034 (%)
7.5 Food
7.5.1 Market Size by Region, 2024-2034 (US$ Billion)
7.5.2 Market Share by Region, 2024 & 2034 (%)
7.6 Pharmaceutical
7.6.1 Market Size by Region, 2024-2034 (US$ Billion)
7.6.2 Market Share by Region, 2024 & 2034 (%)
7.7 Personal Care
7.7.1 Market Size by Region, 2024-2034 (US$ Billion)
7.7.2 Market Share by Region, 2024 & 2034 (%)
7.8 Other Applications
7.8.1 Market Size by Region, 2024-2034 (US$ Billion)
7.8.2 Market Share by Region, 2024 & 2034 (%)
8 Caps & Closures Market Analysis by Product Type
8.1 Key Findings
8.2 Product Type Segment: Market Attractiveness Index
8.3 Caps & Closures Market Size Estimation and Forecast by Product Type
8.4 Screw Caps
8.4.1 Market Size by Region, 2024-2034 (US$ Billion)
8.4.2 Market Share by Region, 2024 & 2034 (%)
8.5 Dispensing Caps
8.5.1 Market Size by Region, 2024-2034 (US$ Billion)
8.5.2 Market Share by Region, 2024 & 2034 (%)
8.6 Snap-on Caps
8.6.1 Market Size by Region, 2024-2034 (US$ Billion)
8.6.2 Market Share by Region, 2024 & 2034 (%)
8.7 Crown Caps
8.7.1 Market Size by Region, 2024-2034 (US$ Billion)
8.7.2 Market Share by Region, 2024 & 2034 (%)
8.8 Tamper-Evident Caps
8.8.1 Market Size by Region, 2024-2034 (US$ Billion)
8.8.2 Market Share by Region, 2024 & 2034 (%)
8.9 Other Product Type
8.9.1 Market Size by Region, 2024-2034 (US$ Billion)
8.9.2 Market Share by Region, 2024 & 2034 (%)
9 Caps & Closures Market Analysis by Region
9.1 Key Findings
9.2 Regional Market Size Estimation and Forecast
10 North America Caps & Closures Market Analysis
10.1 Key Findings
10.2 North America Caps & Closures Market Attractiveness Index
10.3 North America Caps & Closures Market by Country, 2024, 2029 & 2034 (US$ Billion)
10.4 North America Caps & Closures Market Size Estimation and Forecast
10.5 North America Caps & Closures Market Size Estimation and Forecast by Country
10.6 North America Caps & Closures Market Size Estimation and Forecast by Beverage Type
10.7 North America Caps & Closures Market Size Estimation and Forecast by Size
10.8 North America Caps & Closures Market Size Estimation and Forecast by Material Type
10.9 North America Caps & Closures Market Size Estimation and Forecast by Application
10.10 North America Caps & Closures Market Size Estimation and Forecast by Product Type
10.11 U.S. Caps & Closures Market Analysis
10.12 Canada Caps & Closures Market Analysis
11 Europe Caps & Closures Market Analysis
11.1 Key Findings
11.2 Europe Caps & Closures Market Attractiveness Index
11.3 Europe Caps & Closures Market by Country, 2024, 2029 & 2034 (US$ Billion)
11.4 Europe Caps & Closures Market Size Estimation and Forecast
11.5 Europe Caps & Closures Market Size Estimation and Forecast by Country
11.6 Europe Caps & Closures Market Size Estimation and Forecast by Beverage Type
11.7 Europe Caps & Closures Market Size Estimation and Forecast by Size
11.8 Europe Caps & Closures Market Size Estimation and Forecast by Material Type
11.9 Europe Caps & Closures Market Size Estimation and Forecast by Application
11.10 Europe Caps & Closures Market Size Estimation and Forecast by Product Type
11.11 Germany Caps & Closures Market Analysis
11.12 UK Caps & Closures Market Analysis
11.13 France Caps & Closures Market Analysis
11.14 Italy Caps & Closures Market Analysis
11.15 Spain Caps & Closures Market Analysis
11.16 Rest of Europe Caps & Closures Market Analysis
12 Asia-Pacific Caps & Closures Market Analysis
12.1 Key Findings
12.2 Asia-Pacific Caps & Closures Market Attractiveness Index
12.3 Asia-Pacific Caps & Closures Market by Country, 2024, 2029 & 2034 (US$ Billion)
12.4 Asia-Pacific Caps & Closures Market Size Estimation and Forecast
12.5 Asia-Pacific Caps & Closures Market Size Estimation and Forecast by Country
12.6 Asia-Pacific Caps & Closures Market Size Estimation and Forecast by Beverage Type
12.7 Asia-Pacific Caps & Closures Market Size Estimation and Forecast by Size
12.8 Asia-Pacific Caps & Closures Market Size Estimation and Forecast by Material Type
12.9 Asia-Pacific Caps & Closures Market Size Estimation and Forecast by Application
12.10 Asia-Pacific Caps & Closures Market Size Estimation and Forecast by Product Type
12.11 China Caps & Closures Market Analysis
12.12 India Caps & Closures Market Analysis
12.13 Japan Caps & Closures Market Analysis
12.14 South Korea Caps & Closures Market Analysis
12.15 Australia Caps & Closures Market Analysis
12.16 Rest of Asia-Pacific Caps & Closures Market Analysis
13 Middle East and Africa Caps & Closures Market Analysis
13.1 Key Findings
13.2 Middle East and Africa Caps & Closures Market Attractiveness Index
13.3 Middle East and Africa Caps & Closures Market by Country, 2024, 2029 & 2034 (US$ Billion)
13.4 Middle East and Africa Caps & Closures Market Size Estimation and Forecast
13.5 Middle East and Africa Caps & Closures Market Size Estimation and Forecast by Country
13.6 Middle East and Africa Caps & Closures Market Size Estimation and Forecast by Beverage Type
13.7 Middle East and Africa Caps & Closures Market Size Estimation and Forecast by Size
13.8 Middle East and Africa Caps & Closures Market Size Estimation and Forecast by Material Type
13.9 Middle East and Africa Caps & Closures Market Size Estimation and Forecast by Application
13.10 Middle East and Africa Caps & Closures Market Size Estimation and Forecast by Product Type
13.11 GCC Caps & Closures Market Analysis
13.12 South Africa Caps & Closures Market Analysis
13.13 Rest of Middle East & Africa Caps & Closures Market Analysis
14 Latin America Caps & Closures Market Analysis
14.1 Key Findings
14.2 Latin America Caps & Closures Market Attractiveness Index
14.3 Latin America Caps & Closures Market by Country, 2024, 2029 & 2034 (US$ Billion)
14.4 Latin America Caps & Closures Market Size Estimation and Forecast
14.5 Latin America Caps & Closures Market Size Estimation and Forecast by Country
14.6 Latin America Caps & Closures Market Size Estimation and Forecast by Beverage Type
14.7 Latin America Caps & Closures Market Size Estimation and Forecast by Size
14.8 Latin America Caps & Closures Market Size Estimation and Forecast by Material Type
14.9 Latin America Caps & Closures Market Size Estimation and Forecast by Application
14.10 Latin America Caps & Closures Market Size Estimation and Forecast by Product Type
14.11 Brazil Caps & Closures Market Analysis
14.12 Mexico Caps & Closures Market Analysis
14.13 Rest of Latin America Caps & Closures Market Analysis
15 Company Profiles
15.1 Competitive Landscape, 2022
15.2 Strategic Outlook
15.3 Amcor plc
15.3.1 Company Snapshot
15.3.2 Company Overview
15.3.3 Financial Analysis
15.3.3.1 Net Revenue, 2019-2023
15.3.3.2 R&D, 2019-2023
15.3.3.3 Business Segment Revenue Share, 2023 (%)
15.3.4 Product Benchmarking
15.3.5 Strategic Outlook
15.4 Berry Global Group, Inc
15.4.1 Company Snapshot
15.4.2 Company Overview
15.4.3 Financial Analysis
15.4.3.1 Net Revenue, 2018-2022
15.4.3.2 R&D, 2018-2022
15.4.3.3 Regional Revenue Share, 2022 (%)
15.4.3.4 Business Segment Revenue Share, 2022 (%)
15.4.4 Product Benchmarking
15.4.5 Strategic Outlook
15.5 Crown Holdings, Inc
15.5.1 Company Snapshot
15.5.2 Company Overview
15.5.3 Financial Analysis
15.5.3.1 Net Revenue, 2018-2022
15.5.3.2 R&D, 2018-2022
15.5.3.3 Regional Revenue Share, 2022 (%)
15.5.3.4 Business Segment Revenue Share, 2022 (%)
15.5.4 Product Benchmarking
15.5.5 Strategic Outlook
15.6 Silgan Holdings
15.6.1 Company Snapshot
15.6.2 Company Overview
15.6.3 Financial Analysis
15.6.3.1 Net Revenue, 2018-2022
15.6.3.2 Regional Revenue Share, 2022 (%)
15.6.3.3 Business Segment Revenue Share, 2022 (%)
15.6.4 Product Benchmarking
15.7 AptarGroup, Inc
15.7.1 Company Snapshot
15.7.2 Company Overview
15.7.3 Financial Analysis
15.7.3.1 Net Revenue, 2018-2022
15.7.3.2 R&D, 2018-2022
15.7.3.3 Regional Revenue Share, 2022 (%)
15.7.3.4 Business Segment Revenue Share, 2022 (%)
15.7.4 Product Benchmarking
15.7.5 Strategic Outlook
15.8 BERICAP GmbH & Co KG
15.8.1 Company Snapshot
15.8.2 Company Overview
15.8.3 Product Benchmarking
15.9 Guala Closures S.P.A
15.9.1 Company Snapshot
15.9.2 Company Overview
15.9.3 Product Benchmarking
15.9.4 Strategic Outlook
15.10 Alcopack Group
15.10.1 Company Snapshot
15.10.2 Company Overview
15.10.3 Product Benchmarking
15.11 Herti JSC
15.11.1 Company Snapshot
15.11.2 Company Overview
15.11.3 Product Benchmarking
15.12 UNITED CAPS
15.12.1 Company Snapshot
15.12.2 Company Overview
15.12.3 Product Benchmarking
15.12.4 Strategic Outlook
15.13 Caps & Closures Pty Ltd
15.13.1 Company Snapshot
15.13.2 Company Overview
15.13.3 Product Benchmarking
15.14 Caprite Australia Pty Ltd
15.14.1 Company Snapshot
15.14.2 Company Overview
15.14.3 Product Benchmarking
15.15 Pano Cap Canada Ltd
15.15.1 Company Snapshot
15.15.2 Company Overview
15.15.3 Product Benchmarking
15.16 Phoenix Closures
15.16.1 Company Snapshot
15.16.2 Company Overview
15.16.3 Product Benchmarking
15.16.4 Strategic Outlook
15.17 MJS Packaging
15.17.1 Company Snapshot
15.17.2 Company Overview
15.17.3 Product Benchmarking
16 Conclusion and Recommendations
16.1 Concluding Remarks from Visiongain
16.2 Recommendations for Market Players
ページTOPに戻る
List of Tables/Graphs
List of Tables
Table 1 Caps & Closures Market Snapshot, 2024 & 2034 (US$ Billion, CAGR %)
Table 2 Global Caps & Closures Market by Region, 2024-2034 (US$ Bn, AGR (%), CAGR (%)) (V-Shaped Recovery Scenario)
Table 3 Global Caps & Closures Market by Region, 2024-2034 (US$ Bn, AGR (%), CAGR (%)) (U-Shaped Recovery Scenario)
Table 4 Global Caps & Closures Market by Region, 2024-2034 (US$ Bn, AGR (%), CAGR (%)) (W-Shaped Recovery Scenario)
Table 5 Global Caps & Closures Market by Region, 2024-2034 (US$ Bn, AGR (%), CAGR (%)) (L-Shaped Recovery Scenario)
Table 6 Global Caps & Closures Market by Beverage Type, 2024-2034 (US$ Bn, AGR (%), CAGR (%))
Table 7 Alcoholic Beverage Market by Region, 2024-2034 (US$ Bn, AGR (%), CAGR (%))
Table 8 Non-Alcoholic Beverage Market by Region, 2024-2034 (US$ Bn, AGR (%), CAGR (%))
Table 9 Global Caps & Closures Market by Size, 2024-2034 (US$ Bn, AGR (%), CAGR (%))
Table 10 Small (Up to 20 mm) Market by Region, 2024-2034 (US$ Bn, AGR (%), CAGR (%))
Table 11 Medium (20-50 mm) Market by Region, 2024-2034 (US$ Bn, AGR (%), CAGR (%))
Table 12 Large (Above 50 mm) Market by Region, 2024-2034 (US$ Bn, AGR (%), CAGR (%))
Table 13 Global Caps & Closures Market by Material Type, 2024-2034 (US$ Bn, AGR (%), CAGR (%))
Table 14 Plastic Market by Region, 2024-2034 (US$ Bn, AGR (%), CAGR (%))
Table 15 Metal Market by Region, 2024-2034 (US$ Bn, AGR (%), CAGR (%))
Table 16 Rubber Market by Region, 2024-2034 (US$ Bn, AGR (%), CAGR (%))
Table 17 Other Material Type Market by Region, 2024-2034 (US$ Bn, AGR (%), CAGR (%))
Table 18 Global Caps & Closures Market by Application, 2024-2034 (US$ Bn, AGR (%), CAGR (%))
Table 19 Beverages Market by Region, 2024-2034 (US$ Bn, AGR (%), CAGR (%))
Table 20 Food Market by Region, 2024-2034 (US$ Bn, AGR (%), CAGR (%))
Table 21 Pharmaceutical Market by Region, 2024-2034 (US$ Bn, AGR (%), CAGR (%))
Table 22 Personal Care Market by Region, 2024-2034 (US$ Bn, AGR (%), CAGR (%))
Table 23 Other Applications Market by Region, 2024-2034 (US$ Bn, AGR (%), CAGR (%))
Table 24 Global Caps & Closures Market by Product Type, 2024-2034 (US$ Bn, AGR (%), CAGR (%))
Table 25 Screw Caps Market by Region, 2024-2034 (US$ Bn, AGR (%), CAGR (%))
Table 26 Dispensing Caps Market by Region, 2024-2034 (US$ Bn, AGR (%), CAGR (%))
Table 27 Snap-on Caps Market by Region, 2024-2034 (US$ Bn, AGR (%), CAGR (%))
Table 28 Crown Caps Market by Region, 2024-2034 (US$ Bn, AGR (%), CAGR (%))
Table 29 Tamper-Evident Caps Market by Region, 2024-2034 (US$ Bn, AGR (%), CAGR (%))
Table 30 Other Product Type Market by Region, 2024-2034 (US$ Bn, AGR (%), CAGR (%))
Table 31 Global Caps & Closures Market by Region, 2024-2034 (US$ Bn, AGR (%), CAGR (%))
Table 32 North America Caps & Closures Market by Value, 2024-2034 (US$ Bn, AGR (%), CAGR (%))
Table 33 North America Caps & Closures Market by Country, 2024-2034 (US$ Bn, AGR (%), CAGR (%))
Table 34 North America Caps & Closures Market by Beverage Type, 2024-2034 (US$ Bn, AGR (%), CAGR (%))
Table 35 North America Caps & Closures Market by Size, 2024-2034 (US$ Bn, AGR (%), CAGR (%))
Table 36 North America Caps & Closures Market by Material Type, 2024-2034 (US$ Bn, AGR (%), CAGR (%))
Table 37 North America Caps & Closures Market by Application, 2024-2034 (US$ Bn, AGR (%), CAGR (%))
Table 38 North America Caps & Closures Market by Product Type, 2024-2034 (US$ Bn, AGR (%), CAGR (%))
Table 39 US Caps & Closures Market by Value, 2024-2034 (US$ Bn, AGR (%), CAGR (%))
Table 40 Canada Caps & Closures Market by Value, 2024-2034 (US$ Bn, AGR (%), CAGR (%))
Table 41 Europe Caps & Closures Market by Value, 2024-2034 (US$ Bn, AGR (%), CAGR (%))
Table 42 Europe Caps & Closures Market by Country, 2024-2034 (US$ Bn, AGR (%), CAGR (%))
Table 43 Europe Caps & Closures Market by Beverage Type, 2024-2034 (US$ Bn, AGR (%), CAGR (%))
Table 44 Europe Caps & Closures Market by Size, 2024-2034 (US$ Bn, AGR (%), CAGR (%))
Table 45 Europe Caps & Closures Market by Material Type, 2024-2034 (US$ Bn, AGR (%), CAGR (%))
Table 46 Europe Caps & Closures Market by Application, 2024-2034 (US$ Bn, AGR (%), CAGR (%))
Table 47 Europe Caps & Closures Market by Product Type, 2024-2034 (US$ Bn, AGR (%), CAGR (%))
Table 48 Germany Caps & Closures Market by Value, 2024-2034 (US$ Bn, AGR (%), CAGR (%))
Table 49 UK Caps & Closures Market by Value, 2024-2034 (US$ Bn, AGR (%), CAGR (%))
Table 50 France Caps & Closures Market by Value, 2024-2034 (US$ Bn, AGR (%), CAGR (%))
Table 51 Italy Caps & Closures Market by Value, 2024-2034 (US$ Bn, AGR (%), CAGR (%))
Table 52 Spain Caps & Closures Market by Value, 2024-2034 (US$ Bn, AGR (%), CAGR (%))
Table 53 Rest of Europe Caps & Closures Market by Value, 2024-2034 (US$ Bn, AGR (%), CAGR (%))
Table 54 Asia-Pacific Caps & Closures Market by Value, 2024-2034 (US$ Bn, AGR (%), CAGR (%))
Table 55 Asia-Pacific Caps & Closures Market by Country, 2024-2034 (US$ Bn, AGR (%), CAGR (%))
Table 56 Asia-Pacific Caps & Closures Market by Beverage Type, 2024-2034 (US$ Bn, AGR (%), CAGR (%))
Table 57 Asia-Pacific Caps & Closures Market by Size, 2024-2034 (US$ Bn, AGR (%), CAGR (%))
Table 58 Asia-Pacific Caps & Closures Market by Material Type, 2024-2034 (US$ Bn, AGR (%), CAGR (%))
Table 59 Asia-Pacific Caps & Closures Market by Application, 2024-2034 (US$ Bn, AGR (%), CAGR (%))
Table 60 Asia-Pacific Caps & Closures Market by Product Type, 2024-2034 (US$ Bn, AGR (%), CAGR (%))
Table 61 China Caps & Closures Market by Value, 2024-2034 (US$ Bn, AGR (%), CAGR (%))
Table 62 India Caps & Closures Market by Value, 2024-2034 (US$ Bn, AGR (%), CAGR (%))
Table 63 Japan Caps & Closures Market by Value, 2024-2034 (US$ Bn, AGR (%), CAGR (%))
Table 64 South Korea Caps & Closures Market by Value, 2024-2034 (US$ Bn, AGR (%), CAGR (%))
Table 65 Australia Caps & Closures Market by Value, 2024-2034 (US$ Bn, AGR (%), CAGR (%))
Table 66 Rest of Asia-Pacific Caps & Closures Market by Value, 2024-2034 (US$ Bn, AGR (%), CAGR (%))
Table 67 Middle East & Africa Caps & Closures Market by Value, 2024-2034 (US$ Bn, AGR (%), CAGR (%))
Table 68 Middle East & Africa Caps & Closures Market by Country, 2024-2034 (US$ Bn, AGR (%), CAGR (%))
Table 69 Middle East & Africa Caps & Closures Market by Beverage Type, 2024-2034 (US$ Bn, AGR (%), CAGR (%))
Table 70 Middle East & Africa Caps & Closures Market by Size, 2024-2034 (US$ Bn, AGR (%), CAGR (%))
Table 71 Middle East & Africa Caps & Closures Market by Material Type, 2024-2034 (US$ Bn, AGR (%), CAGR (%))
Table 72 Middle East & Africa Caps & Closures Market by Application, 2024-2034 (US$ Bn, AGR (%), CAGR (%))
Table 73 Middle East & Africa Caps & Closures Market by Product Type, 2024-2034 (US$ Bn, AGR (%), CAGR (%))
Table 74 GCC Caps & Closures Market by Value, 2024-2034 (US$ Bn, AGR (%), CAGR (%))
Table 75 South Africa Caps & Closures Market by Value, 2024-2034 (US$ Bn, AGR (%), CAGR (%))
Table 76 Rest of Middle East & Africa Caps & Closures Market by Value, 2024-2034 (US$ Bn, AGR (%), CAGR (%))
Table 77 Latin America Caps & Closures Market by Value, 2024-2034 (US$ Bn, AGR (%), CAGR (%))
Table 78 Latin America Caps & Closures Market by Country, 2024-2034 (US$ Bn, AGR (%), CAGR (%))
Table 79 Latin America Caps & Closures Market by Beverage Type, 2024-2034 (US$ Bn, AGR (%), CAGR (%))
Table 80 Latin America Caps & Closures Market by Size, 2024-2034 (US$ Bn, AGR (%), CAGR (%))
Table 81 Latin America Caps & Closures Market by Material Type, 2024-2034 (US$ Bn, AGR (%), CAGR (%))
Table 82 Latin America Caps & Closures Market by Application, 2024-2034 (US$ Bn, AGR (%), CAGR (%))
Table 83 Latin America Caps & Closures Market by Product Type, 2024-2034 (US$ Bn, AGR (%), CAGR (%))
Table 84 Brazil Caps & Closures Market by Value, 2024-2034 (US$ Bn, AGR (%), CAGR (%))
Table 85 Mexico Caps & Closures Market by Value, 2024-2034 (US$ Bn, AGR (%), CAGR (%))
Table 86 Rest of Latin America Caps & Closures Market by Value, 2024-2034 (US$ Bn, AGR (%), CAGR (%))
Table 87 Strategic Outlook - Contract
Table 88 Amcor plc: Key Details, (CEO, HQ, Revenue, Founded, No. of Employees, Company Type, Website, Business Segment)
Table 89 Amcor plc: Product Benchmarking
Table 90 Amcor plc: Strategic Outlook
Table 91 Berry Global Group, Inc: Key Details, (CEO, HQ, Revenue, Founded, No. of Employees, Company Type, Website, Business Segment)
Table 92 Berry Global Group, Inc: Product Benchmarking
Table 93 Berry Global Group, Inc: Strategic Outlook
Table 94 Crown Holdings, Inc: Key Details, (CEO, HQ, Revenue, Founded, No. of Employees, Company Type, Website, Business Segment)
Table 95 Crown Holdings, Inc: Product Benchmarking
Table 96 Crown Holdings, Inc: Strategic Outlook
Table 97 Silgan Holdings: Key Details, (CEO, HQ, Revenue, Founded, No. of Employees, Company Type, Website, Business Segment)
Table 98 Silgan Holdings: Product Benchmarking
Table 99 AptarGroup, Inc: Key Details, (CEO, HQ, Revenue, Founded, No. of Employees, Company Type, Website, Business Segment)
Table 100 AptarGroup, Inc: Product Benchmarking
Table 101 AptarGroup, Inc: Strategic Outlook
Table 102 BERICAP GmbH & Co KG: Key Details, (CEO, HQ, Revenue, Founded, No. of Employees, Company Type, Website, Business Segment)
Table 103 BERICAP GmbH & Co KG: Product Benchmarking
Table 104 Guala Closures S.P.A: Key Details, (CEO, HQ, Revenue, Founded, No. of Employees, Company Type, Website, Business Segment)
Table 105 Guala Closures S.P.A: Product Benchmarking
Table 106 Guala Closures S.P.A: Strategic Outlook
Table 107 Alcopack Group: Key Details, (CEO, HQ, Revenue, Founded, No. of Employees, Company Type, Website, Business Segment)
Table 108 Alcopack Group: Product Benchmarking
Table 109 Herti JSC: Key Details, (CEO, HQ, Revenue, Founded, No. of Employees, Company Type, Website, Business Segment)
Table 110 Herti JSC: Product Benchmarking
Table 111 UNITED CAPS: Key Details, (CEO, HQ, Revenue, Founded, No. of Employees, Company Type, Website, Business Segment)
Table 112 UNITED CAPS: Product Benchmarking
Table 113 UNITED CAPS: Strategic Outlook
Table 114 Caps & Closures Pty Ltd: Key Details, (CEO, HQ, Revenue, Founded, No. of Employees, Company Type, Website, Business Segment)
Table 115 Caps & Closures Pty Ltd: Product Benchmarking
Table 116 Caprite Australia Pty Ltd: Key Details, (CEO, HQ, Revenue, Founded, No. of Employees, Company Type, Website, Business Segment)
Table 117 Caprite Australia Pty Ltd: Product Benchmarking
Table 118 Pano Cap Canada Ltd: Key Details, (CEO, HQ, Revenue, Founded, No. of Employees, Company Type, Website, Business Segment)
Table 119 Pano Cap Canada Ltd: Product Benchmarking
Table 120 Phoenix Closures: Key Details, (CEO, HQ, Revenue, Founded, No. of Employees, Company Type, Website, Business Segment)
Table 121 Phoenix Closures: Product Benchmarking
Table 122 Phoenix Closures: Strategic Outlook
Table 123 MJS Packaging: Key Details, (CEO, HQ, Revenue, Founded, No. of Employees, Company Type, Website, Business Segment)
Table 124 MJS Packaging: Product Benchmarking
List of Figures
Figure 1 Caps & Closures Market Segmentation
Figure 2 Caps & Closures Market by Beverage Type: Market Attractiveness Index
Figure 3 Caps & Closures Market by Size: Market Attractiveness Index
Figure 4 Caps & Closures Market by Material Type: Market Attractiveness Index
Figure 5 Caps & Closures Market by Application: Market Attractiveness Index
Figure 6 Caps & Closures Market by Product Type: Market Attractiveness Index
Figure 7 Caps & Closures Market Attractiveness Index by Region
Figure 8 Caps & Closures Market: Market Dynamics
Figure 9 Caps & Closures Market: Porter’s Five Forces Analysis
Figure 10 Global Caps & Closures Market Share Forecast by COVID, 2024-2034 (%)
Figure 11 Global Caps & Closures Market by Region, 2024-2034 (US$ Bn, AGR (%)) (V-Shaped Recovery Scenario)
Figure 12 Global Caps & Closures Market by Region, 2024-2034 (US$ Bn, AGR (%)) (U-Shaped Recovery Scenario)
Figure 13 Global Caps & Closures Market by Region, 2024-2034 (US$ Bn, AGR (%)) (W-Shaped Recovery Scenario)
Figure 14 Global Caps & Closures Market by Region, 2024-2034 (US$ Bn, AGR (%)) (L-Shaped Recovery Scenario)
Figure 15 Caps & Closures Market: PEST Analysis
Figure 16 Caps & Closures Market by Beverage Type: Market Attractiveness Index
Figure 17 Global Caps & Closures Market by Beverage Type, 2024-2034 (US$ Bn, AGR (%))
Figure 18 Caps & Closures Market Share Forecast by Beverage Type, 2024, 2029, 2034 (%)
Figure 19 Alcoholic Beverage Market by Region, 2024-2034 (US$ Bn, AGR (%))
Figure 20 Alcoholic Beverage Market Share Forecast by Region, 2024 & 2034 (%)
Figure 21 Non-Alcoholic Beverage Market by Region, 2024-2034 (US$ Bn, AGR (%))
Figure 22 Non-Alcoholic Beverage Market Share Forecast by Region, 2024 & 2034 (%)
Figure 23 Caps & Closures Market by Size: Market Attractiveness Index
Figure 24 Global Caps & Closures Market by Size, 2024-2034 (US$ Bn, AGR (%))
Figure 25 Caps & Closures Market Share Forecast by Size, 2024, 2029, 2034 (%)
Figure 26 Small (Up to 20 mm) Market by Region, 2024-2034 (US$ Bn, AGR (%))
Figure 27 Small (Up to 20 mm) Market Share Forecast by Region, 2024 & 2034 (%)
Figure 28 Medium (20-50 mm) Market by Region, 2024-2034 (US$ Bn, AGR (%))
Figure 29 Medium (20-50 mm) Market Share Forecast by Region, 2024 & 2034 (%)
Figure 30 Large (Above 50 mm) Market by Region, 2024-2034 (US$ Bn, AGR (%))
Figure 31 Large (Above 50 mm) Market Share Forecast by Region, 2024 & 2034 (%)
Figure 32 Caps & Closures Market by Material Type: Market Attractiveness Index
Figure 33 Global Caps & Closures Market by Material Type, 2024-2034 (US$ Bn, AGR (%))
Figure 34 Caps & Closures Market Share Forecast by Material Type, 2024, 2029, 2034 (%)
Figure 35 Plastic Market by Region, 2024-2034 (US$ Bn, AGR (%))
Figure 36 Plastic Market Share Forecast by Region, 2024 & 2034 (%)
Figure 37 Metal Market by Region, 2024-2034 (US$ Bn, AGR (%))
Figure 38 Metal Market Share Forecast by Region, 2024 & 2034 (%)
Figure 39 Rubber Market by Region, 2024-2034 (US$ Bn, AGR (%))
Figure 40 Rubber Market Share Forecast by Region, 2024 & 2034 (%)
Figure 41 Other Material Type Market by Region, 2024-2034 (US$ Bn, AGR (%))
Figure 42 Others Market Share Forecast by Region, 2024 & 2034 (%)
Figure 43 Caps & Closures Market by Application: Market Attractiveness Index
Figure 44 Global Caps & Closures Market by Application, 2024-2034 (US$ Bn, AGR (%))
Figure 45 Caps & Closures Market Share Forecast by Application, 2024, 2029, 2034 (%)
Figure 46 Beverages Market by Region, 2024-2034 (US$ Bn, AGR (%))
Figure 47 Beverages Market Share Forecast by Region, 2024 & 2034 (%)
Figure 48 Food Market by Region, 2024-2034 (US$ Bn, AGR (%))
Figure 49 Food Market Share Forecast by Region, 2024 & 2034 (%)
Figure 50 Pharmaceutical Market by Region, 2024-2034 (US$ Bn, AGR (%))
Figure 51 Pharmaceutical Market Share Forecast by Region, 2024 & 2034 (%)
Figure 52 Personal Care Market by Region, 2024-2034 (US$ Bn, AGR (%))
Figure 53 Personal Care Market Share Forecast by Region, 2024 & 2034 (%)
Figure 54 Other Applications Market by Region, 2024-2034 (US$ Bn, AGR (%))
Figure 55 Other Applications Market Share Forecast by Region, 2024 & 2034 (%)
Figure 56 Caps & Closures Market by Product Type: Market Attractiveness Index
Figure 57 Global Caps & Closures Market by Product Type, 2024-2034 (US$ Bn, AGR (%))
Figure 58 Caps & Closures Market Share Forecast by Product Type, 2024, 2029, 2034 (%)
Figure 59 Screw Caps Market by Region, 2024-2034 (US$ Bn, AGR (%))
Figure 60 Screw Caps Market Share Forecast by Region, 2024 & 2034 (%)
Figure 61 Dispensing Caps Market by Region, 2024-2034 (US$ Bn, AGR (%))
Figure 62 Dispensing Caps Market Share Forecast by Region, 2024 & 2034 (%)
Figure 63 Snap-on Caps Market by Region, 2024-2034 (US$ Bn, AGR (%))
Figure 64 Snap-on Caps Market Share Forecast by Region, 2024 & 2034 (%)
Figure 65 Crown Caps Market by Region, 2024-2034 (US$ Bn, AGR (%))
Figure 66 Crown Caps Market Share Forecast by Region, 2024 & 2034 (%)
Figure 67 Tamper-Evident Caps Market by Region, 2024-2034 (US$ Bn, AGR (%))
Figure 68 Tamper-Evident Caps Market Share Forecast by Region, 2024 & 2034 (%)
Figure 69 Other Product Type Market by Region, 2024-2034 (US$ Bn, AGR (%))
Figure 70 Other Product Type Market Share Forecast by Region, 2024 & 2034 (%)
Figure 71 Caps & Closures Market Forecast by Region 2024 and 2034 (Revenue, CAGR%)
Figure 72 Caps & Closures Market Share Forecast by Region 2024, 2029, 2034 (%)
Figure 73 Global Caps & Closures Market by Region, 2024-2034 (US$ Bn, AGR (%))
Figure 74 North America Caps & Closures Market Attractiveness Index
Figure 75 North America Caps & Closures Market by Region, 2024, 2029 & 2034 (US$ Billion)
Figure 76 North America Caps & Closures Market by Value, 2024-2034 (US$ Bn, AGR (%))
Figure 77 North America Caps & Closures Market by Country, 2024-2034 (US$ Bn, AGR (%))
Figure 78 North America Caps & Closures Market Share Forecast by Country, 2024 & 2034 (%)
Figure 79 North America Caps & Closures Market by Beverage Type, 2024-2034 (US$ Bn, AGR (%))
Figure 80 North America Caps & Closures Market Share Forecast Beverage Type, 2024 & 2034 (%)
Figure 81 North America Caps & Closures Market by Size, 2024-2034 (US$ Bn, AGR (%))
Figure 82 North America Caps & Closures Market Share Forecast by Size, 2024 & 2034 (%)
Figure 83 North America Caps & Closures Market by Material Type, 2024-2034 (US$ Bn, AGR (%))
Figure 84 North America Caps & Closures Market Share Forecast by Material Type, 2024 & 2034 (%)
Figure 85 North America Caps & Closures Market by Application, 2024-2034 (US$ Bn, AGR (%))
Figure 86 North America Caps & Closures Market Share Forecast by Application, 2024 & 2034 (%)
Figure 87 North America Caps & Closures Market by Product Type, 2024-2034 (US$ Bn, AGR (%))
Figure 88 North America Caps & Closures Market Share Forecast by Product Type, 2024 & 2034 (%)
Figure 89 US Caps & Closures Market by Value, 2024-2034 (US$ Bn, AGR (%))
Figure 90 Canada Caps & Closures Market by Value, 2024-2034 (US$ Bn, AGR (%))
Figure 91 Europe Caps & Closures Market Attractiveness Index
Figure 92 Europe Caps & Closures Market by Region, 2024, 2029 & 2034 (US$ Billion)
Figure 93 Europe Caps & Closures Market by Value, 2024-2034 (US$ Bn, AGR (%))
Figure 94 Europe Caps & Closures Market by Country, 2024-2034 (US$ Bn, AGR (%))
Figure 95 Europe Caps & Closures Market Share Forecast by Country, 2024 & 2034 (%)
Figure 96 Europe Caps & Closures Market by Beverage Type, 2024-2034 (US$ Bn, AGR (%),)
Figure 97 Europe Caps & Closures Market Share Forecast Beverage Type, 2024 & 2034 (%)
Figure 98 Europe Caps & Closures Market by Size, 2024-2034 (US$ Bn, AGR (%))
Figure 99 Europe Caps & Closures Market Share Forecast by Size, 2024 & 2034 (%)
Figure 100 Europe Caps & Closures Market by Material Type, 2024-2034 (US$ Bn, AGR (%))
Figure 101 Europe Caps & Closures Market Share Forecast by Material Type, 2024 & 2034 (%)
Figure 102 Europe Caps & Closures Market by Application, 2024-2034 (US$ Bn, AGR (%))
Figure 103 Europe Caps & Closures Market Share Forecast by Application, 2024 & 2034 (%)
Figure 104 Europe Caps & Closures Market by Product Type, 2024-2034 (US$ Bn, AGR (%))
Figure 105 Europe Caps & Closures Market Share Forecast by Product Type, 2024 & 2034 (%)
Figure 106 Germany Caps & Closures Market by Value, 2024-2034 (US$ Bn, AGR (%))
Figure 107 UK Caps & Closures Market by Value, 2024-2034 (US$ Bn, AGR (%))
Figure 108 France Caps & Closures Market by Value, 2024-2034 (US$ Bn, AGR (%))
Figure 109 Italy Caps & Closures Market by Value, 2024-2034 (US$ Bn, AGR (%))
Figure 110 Spain Caps & Closures Market by Value, 2024-2034 (US$ Bn, AGR (%))
Figure 111 Rest of Europe Caps & Closures Market by Value, 2024-2034 (US$ Bn, AGR (%))
Figure 112 Asia-Pacific Caps & Closures Market Attractiveness Index
Figure 113 Asia-Pacific Caps & Closures Market by Region, 2024, 2029 & 2034 (US$ Billion)
Figure 114 Asia-Pacific Caps & Closures Market by Value, 2024-2034 (US$ Bn, AGR (%))
Figure 115 Asia-Pacific Caps & Closures Market by Country, 2024-2034 (US$ Bn, AGR (%))
Figure 116 Asia-Pacific Caps & Closures Market Share Forecast by Country, 2024 & 2034 (%)
Figure 117 Asia-Pacific Caps & Closures Market by Beverage Type, 2024-2034 (US$ Bn, AGR (%))
Figure 118 Asia-Pacific Caps & Closures Market Share Forecast Beverage Type, 2024 & 2034 (%)
Figure 119 Asia-Pacific Caps & Closures Market by Size, 2024-2034 (US$ Bn, AGR (%))
Figure 120 Asia-Pacific Caps & Closures Market Share Forecast by Size, 2024 & 2034 (%)
Figure 121 Asia-Pacific Caps & Closures Market by Material Type, 2024-2034 (US$ Bn, AGR (%))
Figure 122 Asia-Pacific Caps & Closures Market Share Forecast by Material Type, 2024 & 2034 (%)
Figure 123 Asia-Pacific Caps & Closures Market by Application, 2024-2034 (US$ Bn, AGR (%))
Figure 124 Asia-Pacific Caps & Closures Market Share Forecast by Application, 2024 & 2034 (%)
Figure 125 Asia-Pacific Caps & Closures Market by Product Type, 2024-2034 (US$ Bn, AGR (%))
Figure 126 Asia-Pacific Caps & Closures Market Share Forecast by Product Type, 2024 & 2034 (%)
Figure 127 China Caps & Closures Market by Value, 2024-2034 (US$ Bn, AGR (%))
Figure 128 India Caps & Closures Market by Value, 2024-2034 (US$ Bn, AGR (%))
Figure 129 Japan Caps & Closures Market by Value, 2024-2034 (US$ Bn, AGR (%))
Figure 130 South Korea Caps & Closures Market by Value, 2024-2034 (US$ Bn, AGR (%))
Figure 131 Australia Caps & Closures Market by Value, 2024-2034 (US$ Bn, AGR (%))
Figure 132 Rest of Asia-Pacific Caps & Closures Market by Value, 2024-2034 (US$ Bn, AGR (%))
Figure 133 Middle East and Africa Caps & Closures Market Attractiveness Index
Figure 134 Middle East and Africa Caps & Closures Market by Region, 2024, 2029 & 2034 (US$ Billion)
Figure 135 Middle East & Africa Caps & Closures Market by Value, 2024-2034 (US$ Bn, AGR (%))
Figure 136 Middle East & Africa Caps & Closures Market by Country, 2024-2034 (US$ Bn, AGR (%))
Figure 137 Middle East and Africa Caps & Closures Market Share Forecast by Country, 2024 & 2034 (%)
Figure 138 Middle East & Africa Caps & Closures Market by Beverage Type, 2024-2034 (US$ Bn, AGR (%))
Figure 139 Middle East and Africa Caps & Closures Market Share Forecast Beverage Type, 2024 & 2034 (%)
Figure 140 Middle East & Africa Caps & Closures Market by Size, 2024-2034 (US$ Bn, AGR (%))
Figure 141 Middle East and Africa Caps & Closures Market Share Forecast by Size, 2024 & 2034 (%)
Figure 142 Middle East & Africa Caps & Closures Market by Material Type, 2024-2034 (US$ Bn, AGR (%))
Figure 143 Middle East and Africa Caps & Closures Market Share Forecast by Material Type, 2024 & 2034 (%)
Figure 144 Middle East & Africa Caps & Closures Market by Application, 2024-2034 (US$ Bn, AGR (%))
Figure 145 Middle East and Africa Caps & Closures Market Share Forecast by Application, 2024 & 2034 (%)
Figure 146 Middle East & Africa Caps & Closures Market by Product Type, 2024-2034 (US$ Bn, AGR (%))
Figure 147 Middle East and Africa Caps & Closures Market Share Forecast by Product Type, 2024 & 2034 (%)
Figure 148 GCC Caps & Closures Market by Value, 2024-2034 (US$ Bn, AGR (%))
Figure 149 South Africa Caps & Closures Market by Value, 2024-2034 (US$ Bn, AGR (%))
Figure 150 Rest of Middle East & Africa Caps & Closures Market by Value, 2024-2034 (US$ Bn, AGR (%))
Figure 151 Latin America Caps & Closures Market Attractiveness Index
Figure 152 Latin America Caps & Closures Market by Region, 2024, 2029 & 2034 (US$ Billion)
Figure 153 Latin America Caps & Closures Market by Value, 2024-2034 (US$ Bn, AGR (%))
Figure 154 Latin America Caps & Closures Market by Country, 2024-2034 (US$ Bn, AGR (%))
Figure 155 Latin America Caps & Closures Market Share Forecast by Country, 2024 & 2034 (%)
Figure 156 Latin America Caps & Closures Market by Beverage Type, 2024-2034 (US$ Bn, AGR (%))
Figure 157 Latin America Caps & Closures Market Share Forecast Beverage Type, 2024 & 2034 (%)
Figure 158 Latin America Caps & Closures Market by Size, 2024-2034 (US$ Bn, AGR (%))
Figure 159 Latin America Caps & Closures Market Share Forecast by Size, 2024 & 2034 (%)
Figure 160 Latin America Caps & Closures Market by Material Type, 2024-2034 (US$ Bn, AGR (%))
Figure 161 Latin America Caps & Closures Market Share Forecast by Material Type, 2024 & 2034 (%)
Figure 162 Latin America Caps & Closures Market by Application, 2024-2034 (US$ Bn, AGR (%))
Figure 163 Latin America Caps & Closures Market Share Forecast by Application, 2024 & 2034 (%)
Figure 164 Latin America Caps & Closures Market by Product Type, 2024-2034 (US$ Bn, AGR (%))
Figure 165 Latin America Caps & Closures Market Share Forecast by Product Type, 2024 & 2034 (%)
Figure 166 Brazil Caps & Closures Market by Value, 2024-2034 (US$ Bn, AGR (%))
Figure 167 Mexico Caps & Closures Market by Value, 2024-2034 (US$ Bn, AGR (%),
Figure 168 Rest of Latin America Caps & Closures Market by Value, 2024-2034 (US$ Bn, AGR (%))
Figure 169 Caps & Closures Market: Company Share, 2022
Figure 170 Amcor plc.: Net Revenue, 2019-2023 (US$ Million, AGR%)
Figure 171 Amcor plc.: R&D, 2019-2023 (US$ Million, AGR%)
Figure 172 Amcor plc.: Business Segment Revenue Share, 2023 (%)
Figure 173 Berry Global Group, Inc.: Net Revenue, 2018-2022 (US$ Million, AGR%)
Figure 174 Berry Global Group, Inc.: R&D, 2018-2022 (US$ Million, AGR%)
Figure 175 Berry Global Group, Inc.: Regional Revenue Share, 2022 (%)
Figure 176 Berry Global Group, Inc.: Business Segment Revenue Share, 2022 (%)
Figure 177 Crown Holdings, Inc.: Net Revenue, 2018-2022 (US$ Million, AGR%)
Figure 178 Crown Holdings, Inc.: R&D, 2018-2022 (US$ Million, AGR%)
Figure 179 Crown Holdings, Inc.: Regional Revenue Share, 2022 (%)
Figure 180 Crown Holdings, Inc.: Business Segment Revenue Share, 2022 (%)
Figure 181 Silgan Holdings.: Net Revenue, 2018-2022 (US$ Million, AGR%)
Figure 182 Silgan Holdings.: Regional Revenue Share, 2022 (%)
Figure 183 Silgan Holdings.: Business Segment Revenue Share, 2022 (%)
Figure 184 AptarGroup, Inc.: Net Revenue, 2018-2022 (US$ Million, AGR%)
Figure 185 AptarGroup, Inc.: R&D, 2018-2022 (US$ Million, AGR%)
Figure 186 AptarGroup, Inc.: Regional Revenue Share, 2022 (%)
Figure 187 AptarGroup, Inc.: Business Segment Revenue Share, 2022 (%)
ページTOPに戻る
本レポートと同じKEY WORD(caps)の最新刊レポート
- 本レポートと同じKEY WORDの最新刊レポートはありません。
よくあるご質問
Visiongain社はどのような調査会社ですか?
英国の調査会社ヴィジョンゲイン社(Visiongain)は、通信とエネルギーのほか、自動車や化学・医薬品、金属など、広範な市場を対象に調査を行っています。自動車市場については、市場全般に関する調査のほ... もっと見る
調査レポートの納品までの日数はどの程度ですか?
在庫のあるものは速納となりますが、平均的には 3-4日と見て下さい。
但し、一部の調査レポートでは、発注を受けた段階で内容更新をして納品をする場合もあります。
発注をする前のお問合せをお願いします。
注文の手続きはどのようになっていますか?
1)お客様からの御問い合わせをいただきます。
2)見積書やサンプルの提示をいたします。
3)お客様指定、もしくは弊社の発注書をメール添付にて発送してください。
4)データリソース社からレポート発行元の調査会社へ納品手配します。
5) 調査会社からお客様へ納品されます。最近は、pdfにてのメール納品が大半です。
お支払方法の方法はどのようになっていますか?
納品と同時にデータリソース社よりお客様へ請求書(必要に応じて納品書も)を発送いたします。
お客様よりデータリソース社へ(通常は円払い)の御振り込みをお願いします。
請求書は、納品日の日付で発行しますので、翌月最終営業日までの当社指定口座への振込みをお願いします。振込み手数料は御社負担にてお願いします。
お客様の御支払い条件が60日以上の場合は御相談ください。
尚、初めてのお取引先や個人の場合、前払いをお願いすることもあります。ご了承のほど、お願いします。
データリソース社はどのような会社ですか?
当社は、世界各国の主要調査会社・レポート出版社と提携し、世界各国の市場調査レポートや技術動向レポートなどを日本国内の企業・公官庁及び教育研究機関に提供しております。
世界各国の「市場・技術・法規制などの」実情を調査・収集される時には、データリソース社にご相談ください。
お客様の御要望にあったデータや情報を抽出する為のレポート紹介や調査のアドバイスも致します。
|
|


