高活性医薬品原薬(HPAPI)市場レポート:2024-2034
Highly Potent Active Pharmaceutical Ingredients (HPAPIs) Market Report 2024-2034
レポート詳細
高活性医薬品原薬(HPAPI)市場レポート 2024-2034年 :本レポートは、業界とその基礎となるダイナミクスをより良く理解することを望むなら、新たな収益ポケットを目指す大手企業にとっ... もっと見る
※上記価格は部署ライセンス(Departmental licence)価格です。
その他の価格についてはデータリソースまでお問合せください。
日本語のページは自動翻訳を利用し作成しています。
実際のレポートは英文のみでご納品いたします。

|
サマリー
レポート詳細
高活性医薬品原薬(HPAPI)市場レポート 2024-2034年:本レポートは、業界とその基礎となるダイナミクスをより良く理解することを望むなら、新たな収益ポケットを目指す大手企業にとって非常に貴重なものとなるでしょう。異業種への進出や新規地域での既存事業の拡大を目指す企業にとっても有用なレポートです。
慢性疾患の増加が市場成長を牽引
がん、心血管疾患、糖尿病、自己免疫疾患などの慢性疾患は、長期にわたる治療と継続的な管理を必要とする。これらの疾患を管理するための効果的な薬剤に対する需要は高く、HPAPIは、その効力と特定の疾患経路を標的とする能力により、しばしばこれらの薬剤に不可欠である。HPAPIは、標的治療薬や生物学的製剤のような先進的な治療法の開発において重要な役割を果たしている。例えば腫瘍学の分野では、HPAPIは化学療法薬や標的治療薬に利用され、健康な組織への害を抑えながらがん細胞を破壊することに重点を置いている。このような標的アプローチは、慢性疾患を効果的に管理・治療するために不可欠である。製薬会社は慢性疾患を効果的に管理できる新薬を開発するため、研究開発に絶えず資源を投入している。高活性医薬品成分(HPAPI)はこれらの製剤に不可欠であり、低用量で高い有効性を発揮する。このアプローチは患者の予後を向上させるだけでなく、副作用を最小限に抑え、治療をより管理しやすくする。生涯投薬が必要な慢性疾患患者にとって、HPAPIは治療効果の延長、投与回数の減少、治療レジメンのアドヒアランスの向上をもたらす薬剤の創出を促進する。
非感染性疾患(NCDs)により、毎年4,100万人が亡くなっており、これは世界全体の死因の74%に相当する。毎年、1,700万人が70歳までにNCDで死亡しており、その86%は中低所得国で発生している。
高い製造コストが業界の成長を妨げる可能性が高い
HPAPIの製造には、安全性と規制遵守を確保するために、特殊な施設、設備、封じ込めシステムに多額の資本投資が必要である。このような高い初期コストと継続的な操業コストは、中小企業の市場参入を阻んだり、既存企業が生産能力を拡大することを制限したりする可能性がある。HPAPIの製造には、安全性を確保しながら高い効力と純度を維持するための複雑で精密な工程が含まれる。これらの工程には、高度な技術、熟練した人材、厳格な品質管理措置が必要とされることが多く、これらすべてが製造コスト上昇の一因となっている。
市場調査レポートを購入する前にすべき質問とは?
-
高活性医薬品原薬市場はどのように進化しているのか?
-
高活性医薬品原薬市場の牽引役と阻害要因は何か?
-
高活性医薬品原薬の各サブ市場は予測期間中にどのように成長し、2034年にはどれくらいの売上高を占めるようになるのか?
-
2024年から2034年にかけて、高活性医薬品原薬の各サブマーケットの市場シェアはどのように推移するのか?
-
2024年から2034年にかけて、市場全体を牽引する主な要因は何か?
-
有力な高活性医薬品原薬市場はマクロ経済の動きに幅広く追随するのか、それとも個々の国市場が他を凌駕するのか。
-
2034年までに各国市場のシェアはどのように変化し、どの地域が2034年の市場をリードするのか。
-
主要プレーヤーと予測期間中の見通しは?
-
これらの大手企業にとって、高活性の医薬品原薬プロジェクトとはどのようなものなのだろうか?
-
2024年から2034年の間に、業界はどのように進化するのか?現在、そして今後10年間に行われる高活性医薬品原薬プロジェクトはどのような意味を持つのか?
-
高活性原薬市場をさらに拡大するために、製品化の必要性は高まっているのだろうか?
-
高活性医薬品原薬市場はどこに向かっているのか、また、どのようにすれば市場の最前線に立てるのか。
-
新商品や新サービスに最適な投資方法とは?
-
企業を新たな成長軌道に乗せ、C-suiteに移行させるための重要な展望とは?
高活性医薬品原薬市場が現在、そして今後10年間でどのような影響を受けるかを知る必要がある:
-
335ページにわたるレポートには、124の表と220の図表が掲載されている。
-
本レポートでは、業界における主要な有利分野を取り上げているため、今すぐターゲットを絞ることができる。
-
世界、地域、国の売上高と成長に関する詳細な分析が含まれている。
-
競合他社が成功した主なトレンド、変化、収益予測をハイライトします。
2034年までの予測やその他の分析から、商業的な展望が明らかになる
-
2034年までの収益予測に加え、最近の実績、成長率、市場シェアも提供している。
-
ビジネスの展望や展開など、独自の分析が掲載されている。
-
定性的分析(市場ダイナミクス、促進要因、機会、阻害要因、課題を含む)、コスト構造、高活性医薬品原料の価格上昇の影響、最近の動向をご覧いただけます。
レポート対象セグメント
製品
メーカータイプ
薬剤タイプ
投与形態
アプリケーション
世界市場全体と各分野の売上予測に加え、5つの地域と27の主要国市場の売上予測も掲載しています:
北米
欧州
-
ドイツ
-
英国
-
フランス
-
スペイン
-
イタリア
-
ポーランド
-
ベルギー
-
ロシア
-
その他の欧州地域
アジア太平洋
-
中国
-
日本
-
インド
-
オーストラリア
-
韓国
-
シンガポール
-
台湾
-
その他のアジア太平洋地域
ラテンアメリカ
-
ブラジル
-
メキシコ
-
アルゼンチン
-
コロンビア
-
その他のラテンアメリカ地域
MEA
本レポートには、2024年から2034年までの高活性医薬品原薬市場における主要企業のプロファイルも掲載されており、これらの企業の事業のこのセグメントに焦点を当てている。
報告書に掲載されている主要企業
-
AbbVie Inc.
-
Bayer AG
-
Boehringer Ingelheim International GmbH
-
Bristol Myers Squibb Company
-
Cambrex Corporation
-
Catalent, Inc
-
Cipla Inc.
-
Dr Reddy’s Laboratories
-
Eli Lilly and Company
-
F. Hoffmann-La Roche AG
-
Merck & Co., Inc.
-
Novartis AG
-
Pfizer Inc.
-
Sanofi
-
Teva Pharmaceutical Industries Ltd.
2024年から2034年までの高活性医薬品原薬市場の世界全体の売上高は、金額ベースで2024年に296億米ドルを突破する。2034年まで力強い収益成長を予測。当社の調査では、最も大きな可能性を秘めた企業を特定しています。彼らの能力、進歩、商業的展望を発見し、あなたが一歩先を行くのを支援します。
高活性医薬品原薬市場、2024-2034年レポートはどのようにお役に立ちますか?
要約すると、330ページを超えるこのレポートは、以下のような知識を提供する:
-
高活性医薬品原料市場の2024年から2034年までの収益予測。製品、メーカー、薬剤タイプ、剤形、用途ごとに世界および地域レベルで予測 - 業界の将来性を発見し、投資と収益に最も有利な場所を見つけることができます。
-
5つの地域と27の主要国市場の2034年までの収益予測 - 高活性医薬品原薬市場の2024年から2034年までの北米、欧州、アジア太平洋、ラテンアメリカ、MEAの市場予測をご覧ください。また、米国、カナダ、メキシコ、ブラジル、ドイツ、フランス、英国、イタリア、中国、インド、日本、オーストラリアなどの主要国の市場も予測しています。
-
2024年から2034年までの高活性医薬品成分市場に関与する主要企業15社の企業プロファイルを含む。
独自の予測による定量的・定性的分析をご覧ください。私たちのレポートだけに含まれる情報を入手し、貴重なビジネスインテリジェンスで情報を得ることができます。
他にはない情報
私たちの新しいレポートがあれば、知識に遅れをとったり、チャンスを逃したりする可能性が低くなります。Visiongainのレポートが貴社の調査、分析、意思決定にどのように役立つかをご覧ください。Visiongainのこの調査レポートは、高活性医薬品原薬市場(2024年~2034年)の商業分析を必要とするすべての方、市場をリードする企業を対象としています。データ、トレンド、予測をご覧いただけます。
ページTOPに戻る
目次
1 レポート概要
1.1 研究の目的
1.2 高活性医薬品原薬市場の紹介
1.3 本レポートの内容
1.4 本レポートを読むべき理由
1.5 本分析レポートが回答する主な質問
1.6 本レポートは誰のためのものか?
1.7 方法論
1.7.1 市場の定義
1.7.2 市場評価・予測手法
1.7.3 データの検証
1.7.3.1 一次調査
1.7.3.2 セカンダリーリサーチ
1.8 よくある質問(FAQ)
1.9 Visiongainの関連レポート
1.10 Visiongainについて
2 エグゼクティブ・サマリー
3 市場概要
3.1 主要な調査結果
3.2 市場ダイナミクス
3.3 影響分析
3.3.1 市場促進要因
3.3.1.1 慢性疾患の罹患率の増加
3.3.1.2 腫瘍研究の進歩
3.3.1.3 個別化医療の重視の高まり
3.3.2 市場抑制要因
3.3.2.1 厳しい規制要件
3.3.2.2 HPAPIの高い開発コスト
3.3.2.3 サプライチェーン混乱の影響を受けやすい
3.3.3 市場機会
3.3.3.1 インフラと生産能力拡大への投資の増加
3.3.3.2 新興市場における有利な成長機会
3.3.3.3 業界参加者間の協力とパートナーシップの増加
3.4 新興市場とメガトレンド
3.5 ポーターのファイブフォース分析
3.5.1 サプライヤーの交渉力
3.5.2 買い手の交渉力
3.5.3 競争上のライバル関係
3.5.4 代替品の脅威
3.5.5 新規参入企業の脅威
3.6 PEST分析
4 高活性医薬品原薬市場分析:製品別
4.1 主要な調査結果
4.2 製品セグメント 市場魅力度指数
4.3 高活性医薬品原薬の製品別市場規模推定と予測
4.4 合成
4.4.1 2024〜2034年の地域別市場規模(US$ Million)
4.4.2 地域別市場シェア、2024年・2034年(%)
4.5 バイオテクノロジー
4.5.1 2024~2034年の地域別市場規模(US$ Million)
4.5.2 地域別市場シェア、2024年・2034年(%)
5 高活性医薬品原薬市場分析:メーカータイプ別
5.1 主要な調査結果
5.2 製品セグメント 市場魅力度指数
5.3 高活性医薬品原薬のメーカータイプ別市場規模推定と予測
5.4 インハウス
5.4.1 2024〜2034年の地域別市場規模(US$ Million)
5.4.2 地域別市場シェア、2024年・2034年(%)
5.5 アウトソース
5.5.1 2024-2034年地域別市場規模(US$ Million)
5.5.2 地域別市場シェア、2024年・2034年 (%)
6 高活性医薬品原薬市場分析:薬剤タイプ別
6.1 主要な調査結果
6.2 薬剤タイプ別セグメント 市場魅力度指数
6.3 薬剤タイプ別の高活性医薬品原薬市場規模の推定と予測
6.4 イノベーティブ
6.4.1 2024〜2034年の地域別市場規模(US$ Million)
6.4.2 地域別市場シェア、2024年・2034年(%)
6.5 ジェネリック
6.5.1 2024年~2034年の地域別市場規模(US$ Million)
6.5.2 地域別市場シェア、2024年・2034年(%)
7 高活性医薬品原薬市場分析:剤形別
7.1 主要な調査結果
7.2 剤形セグメント: 市場魅力度指数
7.3 高活性医薬品原薬の剤形別市場規模推定と予測
7.4 固形剤
7.4.1 2024〜2034年の地域別市場規模(US$ Million)
7.4.2 地域別市場シェア、2024年・2034年(%)
7.5 液体
7.5.1 2024~2034年の地域別市場規模(US$ Million)
7.5.2 地域別市場シェア、2024年・2034年 (%)
7.6 注射剤
7.6.1 2024~2034年の地域別市場規模(US$ Million)
7.6.2 地域別市場シェア、2024年・2034年 (%)
7.7 その他
7.7.1 2024〜2034年の地域別市場規模(US$ Million)
7.7.2 地域別市場シェア、2024年・2034年 (%)
8 高活性医薬品原薬市場分析:用途別
8.1 主要な調査結果
8.2 用途セグメント 市場魅力度指数
8.3 用途別の高活性医薬品原薬市場規模の推定と予測
8.4 がん領域
8.4.1 2024〜2034年の地域別市場規模(US$ Million)
8.4.2 地域別市場シェア、2024年・2034年(%)
8.5 ホルモン不均衡
8.5.1 2024〜2034年の地域別市場規模(US$ Million)
8.5.2 地域別市場シェア、2024年・2034年(%)
8.6 緑内障
8.6.1 2024〜2034年の地域別市場規模(US$ Million)
8.6.2 地域別市場シェア、2024年・2034年(%)
8.7 その他
8.7.1 2024〜2034年の地域別市場規模(US$ Million)
8.7.2 地域別市場シェア、2024年・2034年(%)
9 高活性医薬品原薬市場分析:地域別
9.1 主要な調査結果
9.2 地域別市場規模の推定と予測
10 北米の高活性医薬品原薬市場分析
10.1 主要な調査結果
10.2 北米の高活性医薬品原薬市場魅力度指数
10.3 北米の高活性医薬品原薬市場規模推定と予測国別
10.4 北米の高活性医薬品原薬市場規模推定と予測製品別
10.5 北米の高活性医薬品原薬市場規模推定と予測:メーカータイプ別
10.6 北米の高活性医薬品原薬市場規模推定と予測:薬剤タイプ別
10.7 北米の高活性医薬品原薬市場規模推定と予測:剤形別
10.8 北米の高活性医薬品原薬市場規模推定と予測:用途別
10.9 アメリカの高活性医薬品原薬市場分析
10.10 カナダの高活性医薬品原薬市場の分析
11 欧州の高活性医薬品原薬市場分析
11.1 主要な調査結果
11.2 欧州の高活性医薬品原薬市場魅力度指数
11.3 欧州の高活性医薬品原薬国別市場、2024年、2029年、2034年(US$ Million)
11.4 欧州の高活性医薬品原薬市場規模推定と予測:国別
11.5 欧州の高活性医薬品原薬市場規模推定と予測:製品別
11.6 欧州の高活性医薬品原薬市場規模推定と予測:メーカータイプ別
11.7 欧州の高活性医薬品原薬市場規模推定と予測:薬剤タイプ別
11.8 欧州の高活性医薬品原薬市場規模推定と予測:剤形別
11.9 欧州の高活性医薬品原薬市場規模推定と予測:用途別
11.10 ドイツの高活性医薬品原薬市場分析
11.11 イギリスの高活性医薬品原薬市場分析
11.12 フランスの高活性医薬品原薬市場分析
11.13 スペインの高活性医薬品原薬市場分析
11.14 イタリアの高活性医薬品原薬市場分析
11.15 ポーランドの高活性医薬品原薬市場分析
11.16 ベルギーの高活性医薬品原薬市場分析
11.17 ロシアの高活性医薬品原薬市場分析
11.18 その他の欧州の高活性医薬品原薬市場分析
12 アジア太平洋地域の高活性医薬品原薬市場分析
12.1 主要な調査結果
12.2 アジア太平洋地域の高活性医薬品原薬市場魅力度指数
12.3 アジア太平洋地域の高活性医薬品原薬の国別市場、2024年、2029年、2034年 (US$ Million)
12.4 アジア太平洋地域の高活性医薬品原薬市場規模推定と予測:国別
12.5 アジア太平洋地域の高活性医薬品原薬市場規模推定と予測:製品別
12.6 アジア太平洋地域の高活性医薬品原薬市場規模推定と予測:メーカータイプ別
12.7 アジア太平洋地域の高活性医薬品原薬市場規模推定と予測:薬剤タイプ別
12.8 アジア太平洋地域の高活性医薬品原薬市場規模推定と予測:剤形別
12.9 アジア太平洋地域の高活性医薬品原薬市場規模推定と予測:用途別
12.10 日本の高活性医薬品原薬市場分析
12.11 中国の高活性医薬品原薬市場分析
12.12 インドの高活性医薬品原薬市場分析
12.13 オーストラリアの高活性医薬品原薬市場分析
12.14 韓国の高活性医薬品原薬市場分析
12.15 シンガポールの高活性医薬品原薬市場分析
12.16 台湾の高活性医薬品原薬市場分析
12.17 その他のアジア太平洋地域の高活性医薬品原薬市場分析
13 ラテンアメリカの高活性医薬品原薬市場分析
13.1 主要な調査結果
13.2 ラテンアメリカの高活性医薬品原薬市場魅力度指数
13.3 ラテンアメリカの高活性医薬品原薬国別市場:2024年、2029年、2034年(US$ Million)
13.4 ラテンアメリカの高活性医薬品原薬市場規模推定と予測:国別
13.5 ラテンアメリカの高活性医薬品原薬市場規模推定と予測:製品別
13.6 ラテンアメリカの高活性医薬品原薬市場規模推定と予測:メーカータイプ別
13.7 ラテンアメリカの高活性医薬品原薬市場規模推定と予測:医薬品タイプ別
13.8 ラテンアメリカの高活性医薬品原薬市場規模推定と予測:剤形別
13.9 ラテンアメリカの高活性医薬品原薬市場規模推定と予測:用途別
13.10 ブラジルの高活性医薬品原薬市場分析
13.11 メキシコの高活性医薬品原薬市場分析
13.12 アルゼンチンの高活性医薬品原薬市場分析
13.13 コロンビアの高活性医薬品原薬市場分析
13.14 その他のラテンアメリカの高活性医薬品原薬市場分析
14 中東・アフリカの高活性医薬品原薬市場分析
14.1 主要な調査結果
14.2 中東・アフリカの高活性医薬品原薬市場魅力度指数
14.3 中東・アフリカの高活性医薬品原薬国別市場、2024年、2029年、2034年(US$ Million)
14.4 中東・アフリカの高活性医薬品原薬市場規模推定と予測:国別
14.5 中東・アフリカの高活性医薬品原薬市場規模推定と予測:製品別
14.6 中東・アフリカの高活性医薬品原薬市場規模推定と予測:メーカータイプ別
14.7 中東・アフリカの高活性医薬品原薬市場規模推定と予測:薬剤タイプ別
14.8 中東・アフリカの高活性医薬品原薬市場規模推定と予測:剤形別
14.9 中東・アフリカの高活性医薬品原薬市場規模推定と予測:用途別
14.10 GCCの高活性医薬品原薬市場分析
14.11 南アフリカの高活性医薬品原薬市場分析
14.12 その他のMEAの高活性医薬品原薬市場分析
15 会社概要
15.1 競争環境、2023年
15.2 戦略的展望
15.3 AbbVie Inc.
15.3.1 会社概要
15.3.2 会社概要
15.3.3 財務分析
15.3.3.1 純収入、2017-2023年
15.3.3.2 R&D、2017年~2023年
15.3.3.3 地域別市場シェア、2023年
15.3.3.4 事業セグメント別市場シェア(2023年
15.3.4 製品ベンチマーク
15.3.5 戦略的展望
15.3.6 SWOT分析
15.4 Bayer AG
15.4.1 会社概要
15.4.2 会社概要
15.4.3 財務分析
15.4.3.1 純収入(2017-2023年
15.4.3.2 売上高、2017-2023年
15.4.3.3 地域市場シェア、2023年
15.4.4 製品ベンチマーク
15.4.5 戦略的展望
15.4.6 SWOT分析
15.5 Boehringer Ingelheim International GmbH
15.5.1 会社概要
15.5.2 会社概要
15.5.3 財務分析
15.5.3.1 純収入、2017-2023年
15.5.3.2 売上高、2017年〜2023年
15.5.3.3 地域別市場シェア、2023年
15.5.3.4 事業セグメント市場シェア(2023年
15.5.4 製品ベンチマーク
15.5.5 戦略的展望
15.5.6 SWOT分析
15.6 Bristol Myers Squibb Company
15.6.1 会社概要
15.6.2 会社概要
15.6.3 財務分析
15.6.3.1 純収入、2017-2023年
15.6.3.2 R&D、2017年〜2023年
15.6.3.3 地域別市場シェア、2023年
15.6.3.4 事業セグメント市場シェア(2023年
15.6.4 製品ベンチマーク
15.6.5 戦略的展望
15.6.6 SWOT分析
15.7 Cambrex Corporation
15.7.1 会社概要
15.7.2 会社概要
15.7.3 製品ベンチマーク
15.7.4 戦略的展望
15.7.5 SWOT分析
15.8 Catalent, Inc
15.8.1 会社概要
15.8.2 会社概要
15.8.3 財務分析
15.8.3.1 純収入、2017-2023年
15.8.3.2 地域別市場シェア(2023年
15.8.3.3 事業セグメント市場シェア(2023年
15.8.4 製品ベンチマーク
15.8.5 戦略的展望
15.8.6 SWOT分析
15.9 Cipla Inc.
15.9.1 会社概要
15.9.2 会社概要
15.9.3 財務分析
15.9.3.1 純収入、2017-2023年
15.9.3.2 R&D、2017年〜2023年
15.9.3.3 地域別市場シェア、2023年
15.9.3.4 事業セグメント市場シェア(2023年
15.9.4 製品ベンチマーク
15.9.5 戦略的展望
15.9.6 SWOT分析
15.10 Dr. Reddy’s Laboratories
15.10.1 会社概要
15.10.2 会社概要
15.10.3 財務分析
15.10.3.1 純収入、2017-2023年
15.10.3.2 R&D、2017年〜2023年
15.10.3.3 地域別市場シェア、2023年
15.10.3.4 事業セグメント市場シェア(2023年
15.10.4 製品ベンチマーク
15.10.5 戦略的展望
15.10.6 SWOT分析
15.11 Eli Lilly and Company
15.11.1 会社概要
15.11.2 会社概要
15.11.3 財務分析
15.11.3.1 純収入、2017-2023年
15.11.3.2 R&D、2017年〜2023年
15.11.3.3 地域別市場シェア、2023年
15.11.3.4 事業セグメント別市場シェア(2023年
15.11.4 製品ベンチマーク
15.11.5 戦略的展望
15.11.6 SWOT分析
15.12 F. Hoffmann-La Roche AG
15.12.1 会社概要
15.12.2 会社概要
15.12.3 財務分析
15.12.3.1 純収入、2017-2023年
15.12.3.2 R&D、2017年〜2023年
15.12.3.3 事業セグメント市場シェア、2023年
15.12.4 製品ベンチマーク
15.12.5 戦略的展望
15.12.6 SWOT分析
15.13 Merck & Co., Inc.
15.13.1 会社概要
15.13.2 会社概要
15.13.3 財務分析
15.13.3.1 純収入(2017-2023年
15.13.3.2 売上高、2017年-2023年
15.13.3.3 地域市場シェア、2023年
15.13.3.4 事業セグメント市場シェア(2023年
15.13.4 製品ベンチマーク
15.13.5 戦略的展望
15.13.6 SWOT分析
15.14 Novartis AG
15.14.1 会社概要
15.14.2 会社概要
15.14.3 財務分析
15.14.3.1 純収入、2017-2023年
15.14.3.2 R&D、2017年〜2023年
15.14.3.3 地域別市場シェア、2023年
15.14.3.4 事業セグメント別市場シェア(2023年
15.14.4 製品ベンチマーク
15.14.5 戦略的展望
15.14.6 SWOT分析
15.15 Pfizer Inc.
15.15.1 会社概要
15.15.2 会社概要
15.15.3 財務分析
15.15.3.1 純収入、2017-2023年
15.15.3.2 R&D、2017年〜2023年
15.15.3.3 地域市場シェア、2023年
15.15.3.4 事業セグメント市場シェア(2023年
15.15.4 製品ベンチマーク
15.15.5 戦略的展望
15.15.6 SWOT分析
15.16 Sanofi
15.16.1 会社概要
15.16.2 会社概要
15.16.3 財務分析
15.16.3.1 純収入、2017-2023年
15.16.3.2 R&D、2017年〜2023年
15.16.4 製品ベンチマーク
15.16.5 戦略的展望
15.16.6 SWOT分析
15.17 Teva Pharmaceutical Industries Ltd.
15.17.1 会社概要
15.17.2 会社概要
15.17.3 財務分析
15.17.3.1 純収入、2017年~2023年
15.17.3.2 R&D、2017年〜2023年
15.17.3.3 地域市場シェア、2023年
15.17.4 製品ベンチマーク
15.17.5 戦略的展望
15.17.6 SWOT分析
16 結論と提言
16.1 Visiongainからの結びの言葉
16.2 市場プレイヤーへの提言
ページTOPに戻る
図表リスト
表の一覧
表1 高活性医薬品原料市場のスナップショット、2024年〜2034年(百万米ドル、CAGR)
表2 高活性医薬品原料の製品別市場予測、2024〜2034年 (百万米ドル、AGR %、CAGR %)
表3 合成セグメントの地域別市場予測、2024-2034年(百万米ドル、AGR %、CAGR %)
表4 バイオテクノロジーセグメントの地域別市場予測、2024-2034年 (百万米ドル、AGR %、CAGR %)
表5 高活性医薬品原料のメーカータイプ別市場予測、2024-2034年(百万米ドル、AGR %、CAGR %)
表6 インハウスセグメントの地域別市場予測、2024-2034年 (百万米ドル、AGR %、CAGR %)
表7 アウトソースセグメントの地域別市場予測、2024-2034年(百万米ドル、AGR %、CAGR %)
表8 高活性医薬品原料の薬剤タイプ別市場予測、2024〜2034年(百万米ドル、AGR %、CAGR %)
表9 革新的セグメントの地域別市場予測、2024〜2034年(百万米ドル、AGR %、CAGR %)
表10 ジェネリック医薬品セグメントの地域別市場予測、2024-2034年(百万米ドル、AGR %、CAGR %)
表11 高活性医薬品成分の剤形別市場予測、2024〜2034年(百万米ドル、AGR %、CAGR %)
表12 固形物セグメントの地域別市場予測、2024-2034年(百万米ドル、AGR %、CAGR %)
表13 液体セグメントの地域別市場予測、2024-2034年(百万米ドル、AGR %、CAGR %)
表14 注射剤セグメントの地域別市場展望、2024-2034年(百万米ドル、AGR %、CAGR %)
表15 その他セグメントの地域別市場予測、2024-2034年 (百万米ドル、AGR %、CAGR %)
表16 高活性医薬品原料の用途別市場予測、2024〜2034年(百万米ドル、AGR %、CAGR %)
表17 がん領域の地域別市場予測:2024-2034年(百万米ドル、AGR %、CAGR %)
表18 ホルモン不均衡セグメントの地域別市場予測、2024-2034年(百万米ドル、AGR %、CAGR %)
表19 緑内障セグメントの地域別市場予測、2024-2034年(百万米ドル、AGR %、CAGR %)
表20 その他セグメントの地域別市場予測、2024-2034年(百万米ドル、AGR %、CAGR %)
表21 高活性医薬品原料の地域別市場予測、2024-2034年(百万米ドル、AGR %、CAGR %)
表22 北米の高活性医薬品原料の国別市場予測、2024-2034年 (百万米ドル、AGR %、CAGR %)
表23 高活性医薬品原料の製品別市場予測、2024〜2034年 (百万米ドル、AGR %、CAGR %)
表24 高活性医薬品成分のメーカータイプ別市場予測、2024-2034年 (百万米ドル、AGR %、CAGR %)
表25 薬剤タイプ別高活性医薬品成分の市場予測、2024〜2034年(百万米ドル、AGR %、CAGR %)
表26 高活性医薬品成分の剤形別市場予測、2024〜2034年(百万米ドル、AGR %、CAGR %)
表27 高活性医薬品成分の用途別市場予測、2024〜2034年 (百万米ドル、AGR %、CAGR %)
表28 米国の高活性医薬品原料市場の予測、2024〜2034年 (百万米ドル、AGR %、CAGR %)
表29 カナダの高活性医薬品原料市場の予測、2024〜2034年 (百万米ドル、AGR %、CAGR %)
表30 欧州の高活性医薬品原料の国別市場予測、2024〜2034年 (百万米ドル、AGR %、CAGR %)
表31 欧州の高活性医薬品原料の製品別市場予測、2024-2034年 (百万米ドル、AGR %、CAGR %)
表32 欧州の高活性医薬品原料のメーカータイプ別市場予測、2024〜2034年 (百万米ドル、AGR %、CAGR %)
表33 欧州の高活性医薬品原料の薬剤タイプ別市場予測、2024〜2034年 (百万米ドル、AGR %、CAGR %)
表34 欧州の高活性医薬品原料の剤形別市場予測:2024〜2034年(百万米ドル、AGR %、CAGR %)
表35 欧州の高活性医薬品原料の用途別市場予測、2024〜2034年 (百万米ドル、AGR %、CAGR %)
表36 ドイツの高活性原薬市場予測、2024-2034年 (百万米ドル、AGR %、CAGR %)
表37 イギリスの高活性医薬品原料市場の予測、2024〜2034年 (百万米ドル、AGR %、CAGR %)
表38 フランスの高活性医薬品原料の市場予測、2024〜2034年 (百万米ドル、AGR %、CAGR %)
表39 スペインの高活性医薬品原料市場の予測、2024〜2034年 (百万米ドル、AGR %、CAGR %)
表40 イタリアの高活性医薬品原料市場の予測、2024〜2034年 (百万米ドル、AGR %、CAGR %)
表41 ポーランドの高活性医薬品原料市場の予測、2024〜2034年 (百万米ドル、AGR %、CAGR %)
表42 ベルギーの高活性医薬品原料市場の予測、2024〜2034年 (百万米ドル、AGR %、CAGR %)
表43 ロシアの高活性医薬品原料市場の予測、2024〜2034年 (百万米ドル、AGR %、CAGR %)
表44 その他のヨーロッパの高活性医薬品原料市場の予測、2024-2034年 (百万米ドル、AGR %、CAGR %)
表45 アジア太平洋地域の高活性医薬品原料の国別市場予測、2024〜2034年 (百万米ドル、AGR %、CAGR %)
表46 アジア太平洋地域の高活性医薬品原料の製品別市場予測、2024〜2034年 (百万米ドル、AGR %、CAGR %)
表47 アジア太平洋地域の高活性医薬品原料のメーカータイプ別市場予測 2024-2034 (百万米ドル、AGR %、CAGR %)
表48 アジア太平洋地域の高活性医薬品原料の薬剤タイプ別市場予測:2024〜2034年(百万米ドル、AGR %、CAGR %)
表49 アジア太平洋地域の高活性医薬品原料の剤形別市場予測:2024〜2034年 (百万米ドル、AGR %、CAGR %)
表50 アジア太平洋地域の高活性医薬品原料の用途別市場予測、2024〜2034年 (百万米ドル、AGR %、CAGR %)
表51 日本の高活性医薬品原料市場の予測、2024-2034年 (百万米ドル、AGR %、CAGR %)
表52 中国の高活性医薬品原料市場の予測、2024〜2034年 (百万米ドル、AGR %、CAGR %)
表53 インドの高活性医薬品原料市場の予測、2024〜2034年 (百万米ドル、AGR %、CAGR %)
表54 オーストラリアの高活性医薬品原料の市場予測、2024〜2034年 (百万米ドル、AGR %、CAGR %)
表55 韓国の高活性医薬品原料市場の予測、2024〜2034年 (百万米ドル、AGR %、CAGR %)
表56 シンガポールの高活性医薬品原料の市場予測、2024〜2034年 (百万米ドル、AGR %、CAGR %)
表57 台湾の高活性医薬品原料の市場予測、2024〜2034年 (百万米ドル、AGR %、CAGR %)
表58 その他のアジア太平洋地域の高活性医薬品原料市場の予測、2024〜2034年 (百万米ドル、AGR %、CAGR %)
表59 ラテンアメリカの高活性医薬品原料の国別市場予測、2024〜2034年 (百万米ドル、AGR %、CAGR %)
表60 ラテンアメリカの高活性医薬品原料の製品別市場予測、2024〜2034年 (百万米ドル、AGR %、CAGR %)
表61 ラテンアメリカの高活性医薬品原料のメーカータイプ別市場予測、2024〜2034年 (百万米ドル、AGR %、CAGR %)
表62 ラテンアメリカの高活性医薬品原料の薬物タイプ別市場予測、2024〜2034年 (百万米ドル、AGR %、CAGR %)
表63 ラテンアメリカの高活性医薬品原料の剤形別市場予測:2024〜2034年 (百万米ドル、AGR %、CAGR %)
表64 ラテンアメリカの高活性医薬品原料の用途別市場予測、2024〜2034年 (百万米ドル、AGR %、CAGR %)
表65 ブラジルの高活性医薬品原料市場の予測、2024〜2034年 (百万米ドル、AGR %、CAGR %)
表66 メキシコの高活性医薬品原料市場の予測、2024〜2034年 (百万米ドル、AGR %、CAGR %)
表67 アルゼンチンの高活性医薬品原料市場の予測、2024〜2034年 (百万米ドル、AGR %、CAGR %)
表68 コロンビアの高活性医薬品原料市場の予測、2024〜2034年 (百万米ドル、AGR %、CAGR %)
表69 ラテンアメリカのその他の高活性医薬品原料市場の予測、2024〜2034年 (百万米ドル、AGR %、CAGR %)
表70 中東およびアフリカの高活性医薬品原料の国別市場予測、2024〜2034年 (百万米ドル、AGR %、CAGR %)
表71 中東・アフリカの高活性医薬品原料の製品別市場予測 2024-2034 (百万米ドル, AGR %, CAGR %)
表72 中東・アフリカの高活性医薬品原料市場:メーカータイプ別予測 2024-2034 (百万米ドル, AGR %, CAGR %)
表73 中東・アフリカの高活性医薬品原料市場:医薬品タイプ別予測 2024-2034 (百万米ドル, AGR %, CAGR %)
表74 中東およびアフリカの高活性医薬品成分市場:剤形別予測 2024-2034 (百万米ドル, AGR %, CAGR %)
表75 中東・アフリカの高活性医薬品原料の用途別市場予測、2024〜2034年 (百万米ドル、AGR %、CAGR %)
表76 GCCの高活性医薬品原料市場の予測、2024〜2034年 (百万米ドル、AGR %、CAGR %)
表77 南アフリカの高活性医薬品原料の市場予測、2024〜2034年 (百万米ドル、AGR %、CAGR %)
表78 その他のMEAの高活性医薬品原料市場の予測、2024〜2034年 (百万米ドル、AGR %、CAGR %)
表79 戦略的展望
表 80 AbbVie Inc:主な詳細(CEO, 本社, 売上高, 設立, 従業員数, 企業タイプ, ウェブサイト, 事業セグメント)
表 81 アッヴィInc:製品ベンチマーク
表82 アッヴィーInc:戦略的展望
表83 バイエルAG:主な詳細(CEO、本社、売上高、設立、従業員数、企業タイプ、ウェブサイト、事業セグメント)
表84 バイエルAG:製品ベンチマーク
表85 バイエルAG:戦略的展望
表86 ベーリンガーインゲルハイム・インターナショナルGmbH:主な詳細(CEO、本社、売上高、設立、従業員数、企業タイプ、ウェブサイト、事業セグメント)
表87 ベーリンガーインゲルハイム・インターナショナル:製品ベンチマーク
表88 ベーリンガーインゲルハイム:戦略的展望
表89 ブリストル・マイヤーズ スクイブ社:主な詳細(CEO, 本社, 売上高, 設立, 従業員数, 企業タイプ, ウェブサイト, 事業セグメント)
表 90 ブリストル・マイヤーズ スクイブ:製品ベンチマーク
表91 ブリストル・マイヤーズ スクイブ・カンパニー:戦略的展望
表92 Cambrex Corporation:主要詳細(CEO、本社、売上高、設立、従業員数、企業タイプ、ウェブサイト、事業セグメント)
表93 カンブレックス・コーポレーション製品ベンチマーク
表94 カンブレックス・コーポレーション戦略的展望
表95 キャタレント社主な詳細(CEO, 本社, 売上高, 設立, 従業員数, 企業タイプ, ウェブサイト, 事業セグメント)
表 96 キャタレント社 :製品ベンチマーク
表 97 キャタレント戦略的展望
表98 シプラ社主な詳細(CEO, 本社, 売上高, 設立, 従業員数, 企業タイプ, ウェブサイト, 事業セグメント)
表 99 シプラ社製品のベンチマーク
表100 シプラ社戦略的展望
表101 Dr. Reddy's Laboratories:主な詳細(CEO, 本社, 売上高, 設立, 従業員数, 企業タイプ, ウェブサイト, 事業セグメント)
表102 ドクター・レディーズ・ラボラトリーズ:製品ベンチマーク
表103 Dr. Reddy's Laboratories:戦略的展望
表104 イーライリリー・アンド・カンパニー主な詳細(CEO, 本社, 売上高, 設立, 従業員数, 企業タイプ, ウェブサイト, 事業セグメント)
表 105 イーライリリー・アンド・カンパニー製品のベンチマーク
表106 Eli Lilly and Company:戦略的展望
表107 F.ホフマン・ラ・ロシュ: 主要詳細(CEO、本社、売上高、設立、従業員数、企業タイプ、ウェブサイト、事業セグメント)
表108 F.ホフマン・ラ・ロシュAG.:製品ベンチマーク
表109 F.ホフマン・ラ・ロシュ:戦略的展望
表110 Merck & Co:主な詳細(CEO, 本社, 売上高, 設立, 従業員数, 企業タイプ, ウェブサイト, 事業セグメント)
表111 Merck & Co:製品ベンチマーク
表112 Merck & Co:戦略的展望
表113 ノバルティスAG:主な詳細(CEO、本社、売上高、設立、従業員数、企業タイプ、ウェブサイト、事業セグメント)
表114 ノバルティスAG.:製品ベンチマーク
表115 ノバルティスAG.:戦略的展望
表116 ファイザー主な詳細(CEO、本社、売上高、設立、従業員数、企業タイプ、ウェブサイト、事業セグメント)
表 117 ファイザー製品ベンチマーク
表118 ファイザー:戦略的展望
表119 サノフィ主な詳細(CEO, 本社, 売上高, 設立, 従業員数, 企業タイプ, ウェブサイト, 事業セグメント)
表120 サノフィ:製品のベンチマーク
表121 サノフィ:戦略的展望
表122 テバ・ファーマシューティカル・インダストリーズ社: 主要詳細(CEO, 本社, 売上高, 設立, 従業員数, 企業タイプ, ウェブサイト, 事業セグメント)
表 123 テバ・ファーマシューティカル・インダストリーズ社製品のベンチマーク
表124 テバ・ファーマシューティカル・インダストリーズ社:戦略的展望
表124 テバ・ファーマシューティカル・インダストリーズ社:戦略的展望
図の一覧
図1 高活性医薬品原料市場のセグメント化
図2 高活性医薬品原料の製品別市場:市場魅力度指数
図3 高活性医薬品原料市場:メーカータイプ別市場魅力度指数
図4 薬剤タイプ別高活性医薬品原料市場:市場魅力度指数市場魅力度指数
図5 高活性医薬品成分市場:剤形別市場魅力度指数
図6 高活性医薬品原料の用途別市場:市場魅力度指数市場魅力度指数
図7 高活性医薬品成分市場:地域別魅力度指数
図8 高活性医薬品原料市場:市場魅力度指数市場ダイナミクス
図9 高活性医薬品原料市場:影響分析インパクト分析
図 10 高活性医薬品原料市場:影響分析ポーターのファイブフォース分析
図11 高活性医薬品原料市場:PEST分析PEST分析
図12 高活性医薬品原料市場:製品別市場魅力度指数
図13 高活性医薬品原料の製品別市場予測、2024年~2034年(百万米ドル、AGR)
図14 2024年、2029年、2034年の高活性医薬品原料の製品別市場シェア予測(%)
図15 合成セグメントの地域別市場予測、2024-2034年 (百万米ドル、AGR %)
図16 合成セグメントの地域別市場予測、2024年&2034年(%)
図17 2024~2034年バイオセグメント地域別市場展望(百万米ドル、AGR)
図 18 2024-2034 年バイオ医薬品セグメント地域別市場シェア予測 (%)
図 19 高活性医薬品原料のメーカータイプ別市場:市場魅力度指数
図20 高活性医薬品原料のメーカータイプ別市場予測、2024年〜2034年 (百万米ドル、AGR %)
図21 高活性医薬品原料のメーカータイプ別市場予測、2024年、2029年、2034年(%)
図22 自社品セグメントの地域別市場予測、2024~2034年 (百万米ドル、AGR %)
図23 2024年・2034年の自社製品セグメント地域別市場シェア予測(%)
図24 2024-2034年地域別アウトソースセグメント市場予測(百万米ドル、AGR)
図25 2024〜2034年地域別アウトソースセグメント市場シェア予測(%)
図26 薬剤タイプ別高活性医薬品原料市場:市場魅力度指数
図27 高活性医薬品原料の薬剤タイプ別市場予測、2024年〜2034年 (百万米ドル、AGR %)
図28 2024年、2029年、2034年の薬剤タイプ別高活性医薬品成分市場シェア予測(%)
図29 革新的セグメントの地域別市場予測、2024~2034年(百万米ドル、AGR)
図30 革新的セグメントの地域別市場予測、2024年&2034年(%)
図31 ジェネリック医薬品セグメントの地域別市場予測、2024~2034年(百万米ドル、AGR)
図32 地域別ジェネリック医薬品セグメント市場シェア予測、2024年&2034年(%)
図33 高力価原薬の剤形別市場:市場魅力度指数
図34 高活性医薬品成分の剤形別市場予測、2024年〜2034年(百万米ドル、AGR)
図35 高活性医薬品原料の剤形別市場予測、2024年、2029年、2034年(%)
図36 固形物セグメントの地域別市場予測、2024〜2034年(百万米ドル、AGR)
図 37 固形物セグメントの地域別市場予測、2024 年& 2034 年(%)
図 38 2024-2034 年地域別液体セグメント市場予測(百万米ドル、AGR)
図 39 2024-2034 年地域別液体セグメント市場シェア予測 (%)
図40 注射剤セグメントの地域別市場予測、2024~2034年 (百万米ドル, AGR %)
図 41 注射剤セグメントの地域別市場シェア予測、2024 & 2034 (%)
図42 その他セグメントの地域別市場展望、2024~2034年 (百万米ドル、AGR %)
図43 その他セグメントの地域別市場シェア予測、2024年&2034年(%)
図 44 高活性医薬品原料の用途別市場市場魅力度指数
図45 高活性医薬品原料の用途別市場予測、2024年〜2034年 (百万米ドル、AGR %)
図46 2024年、2029年、2034年の高活性医薬品原料の用途別市場シェア予測(%)
図47 がん領域セグメントの地域別市場予測、2024~2034年 (百万米ドル、AGR %)
図 48 地域別がん領域市場シェア予測、2024年&2034年(%)
図49 ホルモン不均衡セグメントの地域別市場予測、2024~2034年 (百万米ドル、AGR %)
図50 ホルモン不均衡セグメントの地域別市場シェア予測、2024年〜2034年 (%)
図51 緑内障セグメントの地域別市場予測、2024~2034年 (百万米ドル、AGR %)
図52 2024〜2034年緑内障セグメント地域別市場シェア予測(%)
図53 その他セグメントの地域別市場展望、2024〜2034年 (百万米ドル、AGR %)
図 54 2024-2034 年地域別その他セグメント市場シェア予測 (%)
図 55 2024年および2034年の高活性医薬品原料の地域別市場予測 (売上高, CAGR%)
図 56 2024年、2029年、2034年の高活性医薬品原料の地域別市場シェア予測(%)
図 57 2024〜2034年の高活性医薬品原料の地域別市場予測 (百万米ドル, AGR %)
図 58 北米の高活性医薬品原料市場魅力度指数
図59 北米の高活性医薬品原料市場:地域別、2024年、2029年&2034年(百万米ドル)
図60 北米の高活性医薬品原料の国別市場予測、2024年〜2034年(百万米ドル、AGR)
図61 北米の高活性医薬品原料の国別市場シェア予測、2024年&2034年(%)
図62 北米の高活性医薬品原料の製品別市場予測、2024~2034年 (百万米ドル、AGR %)
図63 北米の高活性医薬品原料の製品別市場予測、2024年〜2034年 (%)
図64 北米の高活性医薬品原料のメーカータイプ別市場予測、2024~2034年 (百万米ドル、AGR %)
図65 北米の高活性医薬品原料市場メーカータイプ別シェア予測、2024年&2034年(%)
図66 北米の高活性医薬品原料市場の薬剤タイプ別予測、2024〜2034年 (百万米ドル、AGR %)
図67 北米の高活性医薬品原料の薬剤タイプ別市場シェア予測、2024年&2034年(%)
図68 北米の高活性医薬品成分市場予測:剤形、2024〜2034年 (百万米ドル、AGR %)
図69 北米の高活性医薬品成分市場:剤形別シェア予測 2024-2034 (%)
図70 北米の高活性医薬品原料の用途別市場予測、2024~2034年 (百万米ドル、AGR %)
図 71 北米の高活性医薬品原料の用途別市場シェア予測、2024 & 2034 (%)
図 72 米国の高活性原薬市場予測、2024~2034年 (百万米ドル、AGR %)
図 73 カナダの高活性原薬市場予測、2024~2034 年 (百万米ドル、AGR)
図 74 欧州の高活性原薬市場魅力度指数
図75 欧州の高活性医薬品原料の地域別市場規模(2024年、2029年&2034年:百万米ドル)
図 76 欧州の高活性医薬品原料の国別市場予測:2024~2034年(百万米ドル、AGR)
図 77 欧州の高活性原薬市場国別シェア予測、2024 年~2034 年(%)
図78 欧州の高活性医薬品原料の製品別市場予測、2024~2034年 (百万米ドル、AGR %)
図 79 欧州の高活性原薬市場製品別シェア予測、2024 年・2034 年 (%)
図80 欧州の高活性原薬市場メーカータイプ別予測、2024~2034年 (百万米ドル、AGR %)
図 81 欧州の高活性原薬市場メーカータイプ別シェア予測、2024年・2034年 (%)
図82 欧州の高活性原薬市場の薬剤タイプ別予測、2024~2034年 (百万米ドル、AGR %)
図 83 欧州の高活性原薬市場薬剤タイプ別シェア予測、2024 年・2034 年(%)
図84 欧州の高活性原薬市場予測:剤形、2024〜2034年 (百万米ドル、AGR %)
図 85 欧州の高活性原薬市場:剤形別シェア予測 2024-2034 (%)
図86 欧州の高活性医薬品原料の用途別市場予測、2024~2034年 (百万米ドル、AGR %)
図 87 欧州の高活性原薬市場用途別シェア予測、2024 & 2034 (%)
図 88 ドイツの高活性原薬市場予測、2024~2034 年 (100 万米ドル、AGR %)
図 89 イギリスの高活性原薬市場予測、2024~2034 年 (100 万米ドル, AGR %)
図 90 フランスの高活性原薬市場予測、2024~2034 年 (100 万米ドル, AGR %)
図 91 スペインの高活性原薬市場の予測、2024-2034 (百万米ドル、AGR %)
図 92 イタリアの高活性原薬市場の予測、2024-2034 (百万米ドル, AGR %)
図 93 ポーランドの高活性医薬品原料市場の予測、2024~2034 年 (100 万米ドル, AGR %)
図 94 ベルギーの高活性原薬市場予測、2024~2034年 (百万米ドル, AGR %)
図 95 ロシアの高活性原薬市場予測、2024~2034年 (百万米ドル、AGR %)
図 96 その他のヨーロッパの高活性医薬品原料市場の予測、2024-2034 (百万米ドル、AGR %)
図 97 アジア太平洋地域の高活性医薬品原料市場魅力度指数
図98 アジア太平洋地域の高活性医薬品原料の地域別市場規模(2024年、2029年、2034年)(百万米ドル
図99 アジア太平洋地域の高活性医薬品原料の国別市場予測、2024年〜2034年(百万米ドル、AGR)
図100 アジア太平洋地域の高活性医薬品原料の国別市場シェア予測、2024年&2034年(%)
図101 アジア太平洋地域の高活性医薬品原料の製品別市場予測、2024〜2034年 (百万米ドル、AGR %)
図102 アジア太平洋地域の高活性医薬品原料の製品別市場展望、2024年・2034年 (%)
図103 アジア太平洋地域の高活性医薬品原料のメーカータイプ別市場予測、2024年~2034年 (百万米ドル、AGR %)
図104 アジア太平洋地域の高活性医薬品原料のメーカータイプ別市場展望、2024年・2034年 (%)
図105 アジア太平洋地域の高活性医薬品原料の薬剤タイプ別市場予測、2024~2034年 (百万米ドル、AGR %)
図106 アジア太平洋地域の高活性医薬品原料の薬剤タイプ別市場展望、2024年・2034年 (%)
図107 アジア太平洋地域の高活性医薬品成分市場予測:剤形、2024〜2034年 (百万米ドル、AGR %)
図108 アジア太平洋地域の高活性医薬品成分市場:剤形別シェア(2024年〜2034年)
図109 アジア太平洋地域の高活性医薬品原料の用途別市場予測、2024〜2034年 (百万米ドル、AGR %)
図110 アジア太平洋地域の高活性医薬品原料の用途別市場予測、2024年・2034年 (%)
図111 日本の高活性原薬市場予測、2024~2034年 (百万米ドル、AGR %)
図 112 中国の高活性原薬市場予測、2024~2034年 (百万米ドル, AGR %)
図 113 インドの高活性医薬品原料の市場予測、2024~2034 年 (100 万米ドル, AGR %)
図 114 オーストラリアの高活性医薬品原料市場の予測、2024-2034 (百万米ドル, AGR %)
図 115 韓国の高活性医薬品原料市場の予測、2024-2034 (百万米ドル, AGR %)
図 116 シンガポール高活性原薬市場の予測、2024-2034 (百万米ドル, AGR %)
図 117 台湾の高活性医薬品原料市場の予測、2024-2034 (百万米ドル、AGR %)
図 118 その他のアジア太平洋地域の高活性医薬品原料市場の予測、2024-2034 (百万米ドル、AGR %)
図 119 中南米の高活性医薬品原料市場魅力度指数
図120 中南米の高活性医薬品原料の地域別市場規模(2024年、2029年&2034年:百万米ドル)
図121 中南米の高活性医薬品原料の国別市場予測(2024~2034年、百万米ドル、AGR)
図122 ラテンアメリカの高活性医薬品原料の国別市場シェア予測、2024年&2034年 (%)
図123 ラテンアメリカの高活性医薬品原料の製品別市場予測、2024~2034年 (百万米ドル, AGR %)
図124 ラテンアメリカの高活性医薬品原料の製品別市場予測、2024年・2034年 (%)
図125 ラテンアメリカの高活性医薬品原料のメーカータイプ別市場予測、2024~2034年 (百万米ドル, AGR %)
図126 ラテンアメリカの高活性原薬市場メーカータイプ別シェア予測、2024年・2034年 (%)
図127 ラテンアメリカの薬剤タイプ別高活性医薬品原料市場予測、2024~2034年 (百万米ドル, AGR %)
図128 ラテンアメリカの高活性医薬品原料市場薬剤タイプ別シェア予測、2024年・2034年 (%)
図129 ラテンアメリカの高活性医薬品成分市場予測、剤形:2024〜2034年 (百万米ドル, AGR %)
図130 ラテンアメリカの高活性医薬品成分市場:剤形別シェア予測 2024-2034 (%)
図131 ラテンアメリカの高活性医薬品原料の用途別市場予測、2024~2034年 (百万米ドル、AGR %)
図132 ラテンアメリカの高活性原薬市場用途別シェア予測、2024年・2034年 (%)
図 133 ブラジルの高活性医薬品原料市場予測、2024~2034年 (百万米ドル、AGR %)
図 134 メキシコの高活性原薬市場予測、2024~2034年 (百万米ドル、AGR %)
図 135 アルゼンチンの高活性医薬品原料の市場展望、2024~2034 年 (100 万米ドル, AGR %)
図 136 コロンビアの高活性原薬市場予測、2024~2034年 (百万米ドル、AGR %)
図 137 その他のラテンアメリカの高活性医薬品原料市場の予測、2024-2034 (百万米ドル、AGR %)
図 138 中東およびアフリカの高活性医薬品原料市場魅力度指数
図139 中東・アフリカの高活性医薬品原料の地域別市場規模(2024年、2029年&2034年:百万米ドル)
図140 中東・アフリカの高活性医薬品原料の国別市場予測(2024~2034年:百万米ドル、AGR)
図141 中東およびアフリカの高活性医薬品原料の国別市場シェア予測、2024年~2034年(%)
図142 中東およびアフリカの高活性医薬品原料の製品別市場予測、2024~2034年 (百万米ドル、AGR %)
図 143 2024-2034 年における中東・アフリカの高活性医薬品原料の製品別市場シェア予測 (%)
図144 中東・アフリカの高活性医薬品原料市場メーカータイプ別予測(2024~2034年) (百万米ドル, AGR %)
図 145 2024-2034 年における中東・アフリカの高活性医薬品原料市場メーカー別シェア予測 (%)
図 146 中東・アフリカの高活性医薬品原料市場:医薬品タイプ別予測(2024~2034年) (百万米ドル, AGR %)
図 147 中東・アフリカの高活性医薬品成分市場:薬剤タイプ別シェア予測(2024 年/2034 年)
図148 中東およびアフリカの高活性医薬品成分市場予測:剤形、2024年~2034年 (百万米ドル, AGR %)
図149 中東・アフリカの高活性医薬品成分市場:剤形別シェア予測 2024-2034 (%)
図 150 中東・アフリカの高活性医薬品原料の用途別市場予測:2024~2034年 (百万米ドル, AGR %)
図 151 中東・アフリカの高活性医薬品原料市場:用途別シェア予測 2024-2034 (%)
図 152 GCCの高活性医薬品原料市場予測、2024~2034年 (百万米ドル、AGR %)
図 153 南アフリカの高活性原薬市場予測、2024~2034年 (百万米ドル, AGR %)
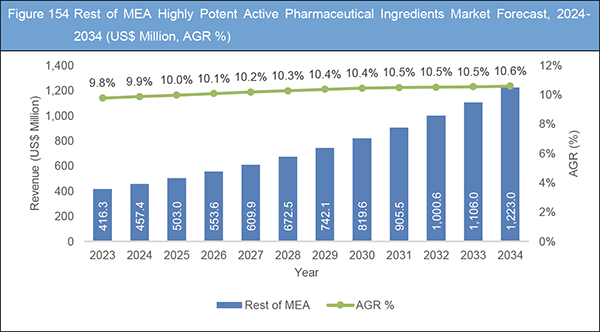
図 154 その他の MEA 高活性医薬品原料市場の予測、2024-2034 年 (100 万米ドル, AGR %)
図 155 高活性医薬品原料市場:企業シェア/ランキング(2023年
図 156 AbbVie Inc:純収入、2017年~2023年(百万米ドル、AGR)
図 157 AbbVie Inc:R&D、2017年~2023年(百万米ドル、AGR)
図 158 アッヴィ・インク:地域別市場シェア、2023年
図 159 アッヴィ・インク:事業セグメント別市場シェア(2023年
図 160 アッヴィ・インク:SWOT分析
図161 バイエルAG:純収入、2017-2023年(百万米ドル、AGR)
図162 バイエルAG:研究開発費、2017-2023年(百万米ドル、AGR)
図163 バイエルAG:地域別市場シェア、2023年
図 164 バイエル:SWOT 分析
図165 ベーリンガーインゲルハイム・インターナショナル:純収入、2017-2023年(百万米ドル、AGR)
図166 ベーリンガーインゲルハイム・インターナショナルGmbH.:R&D、2017-2023年(百万米ドル、AGR)
図167 ベーリンガーインゲルハイム・インターナショナルGmbH.:地域市場シェア、2023年
図168 ベーリンガーインゲルハイム・インターナショナルGmbH.:事業セグメント別市場シェア(2023年
図 169 ベーリンガーインゲルハイム・インターナショナル:SWOT 分析
図170 ブリストル・マイヤーズ スクイブ・カンパニー:純収入、2017年-2023年(百万米ドル、AGR)
図 171 ブリストル・マイヤーズ スクイブ カンパニー:R&D、2017年-2023年(百万米ドル、AGR)
図 172 ブリストル・マイヤーズ スクイブ・カンパニー:地域別市場シェア(2023年
図 173 ブリストル・マイヤーズ スクイブ・カンパニー:事業セグメント別市場シェア(2023年
図 174 Bristol Myers Squibb Company:SWOT分析
図 175 Cambrex Corporation:SWOT分析
図 176 Catalent, Inc:純収入, 2017-2023 (百万米ドル, AGR%)
図 177 Catalent, Inc:地域別市場シェア、2023年
図 178 Catalent, Inc:事業セグメント別市場シェア(2023年
図 179 キャタレント・インク :SWOT 分析
図 180 Cipla Inc:純収入、2017年~2023年(百万米ドル、AGR)
図 181 シプラ・インク:R&D、2017年~2023年(百万米ドル、AGR)
図 182 シプラ・インク:地域別市場シェア、2023年
図 183 シプラ・インク:事業セグメント別市場シェア(2023年
図 184 シプラ・インク:SWOT分析
図 185 Dr. Reddy's Laboratories:純収入、2017年~2023年(百万米ドル、AGR)
図 186 ドクター・レディーズ・ラボラトリーズ:R&D、2017年~2023年(百万米ドル、AGR)
図 187 ドクター・レディーズ・ラボラトリーズ:地域別市場シェア(2023年
図 188 Dr. Reddy's Laboratories:事業セグメント別市場シェア、2023年
図 189 ドクター・レディーズ・ラボラトリーズ:SWOT分析
図 190 イーライリリー・アンド・カンパニー:純収入、2017年-2023年(百万米ドル、AGR)
図 191 イーライリリー・アンド・カンパニー:R&D、2017年-2023年(百万米ドル、AGR)
図192 イーライリリー・アンド・カンパニー:地域別市場シェア、2023年
図 193 Eli Lilly and Company:事業セグメント別市場シェア、2023年
図 194 Eli Lilly and Company:SWOT分析
図195 F.ホフマン・ラ・ロシュ社:純収入、2017-2023年(百万米ドル、AGR)
図 196 F.ホフマン・ラ・ロシュ:研究開発費、2017-2023 年(百万米ドル、AGR)
図 197 F.ホフマン・ラ・ロシュ:事業セグメント別市場シェア(2023 年
図 198 F. ホフマン・ラ・ロシュ:SWOT 分析
図 199 Merck & Co:純収入, 2017-2023 (百万米ドル, AGR%)
図 200 Merck & Co:R&D、2017-2023年(百万米ドル、AGR)
図 201 Merck & Co:地域別市場シェア(2023年
図202 Merck & Co:事業セグメント別市場シェア(2023年
図203 メルク:SWOT分析
図204 ノバルティスAG.:純収入、2017-2023年(百万米ドル、AGR)
図205 ノバルティスAG.:研究開発費、2017-2023年(百万米ドル、AGR)
図206 ノバルティスAG.:地域別市場シェア(2023年
図207 ノバルティスAG.:事業セグメント別市場シェア(2023年
図208 ノバルティスAG.:SWOT分析
図 209 ファイザー純収入、2017年-2023年(百万米ドル、AGR)
図 210 ファイザーR&D、2017年~2023年(百万米ドル、AGR)
図 211 ファイザー社地域別市場シェア、2023年
図 212 ファイザー:事業セグメント別市場シェア(2023年
図 213 ファイザーSWOT分析
図 214 サノフィ:純収入、2017-2023年(百万米ドル、AGR)
図 215 サノフィ:R&D、2017年~2023年(百万米ドル、AGR)
図 216 サノフィ:SWOT分析
図 217 テバ・ファーマシューティカル・インダストリーズ社:純収入、2017年~2023年(百万米ドル、AGR)
図 218 テバ・ファーマシューティカル・インダストリーズ社:R&D、2017年~2023年(百万米ドル、AGR)
図 219 テバ・ファーマシューティカル・インダストリーズ社:地域別市場シェア、2023年
図 220 テバ・ファーマシューティカル・インダストリーズ社:SWOT 分析
ページTOPに戻る
Summary
Report Details
The Highly Potent Active Pharmaceutical Ingredients (HPAPIs) Market Report 2024-2034: This report will prove invaluable to leading firms striving for new revenue pockets if they wish to better understand the industry and its underlying dynamics. It will be useful for companies that would like to expand into different industries or to expand their existing operations in a new region.
Rising Incidence of Chronic Diseases Driving Market Growth
Chronic illnesses, including cancer, cardiovascular conditions, diabetes, and autoimmune disorders, necessitate prolonged treatment and ongoing management. The demand for effective medications to manage these conditions is high, and HPAPIs are often integral to these medications due to their potency and ability to target specific disease pathways. HPAPIs play a vital role in creating advanced treatments, such as targeted therapies and biologics. In the field of oncology, for example, HPAPIs are utilized in chemotherapeutic drugs and targeted treatments that focus on destroying cancer cells while reducing harm to healthy tissue. This targeted approach is essential for effectively managing and treating chronic diseases. Pharmaceutical companies are consistently pouring resources into research and development to develop new medications that can effectively manage chronic diseases. High Potency Active Pharmaceutical Ingredients (HPAPIs) are vital in these formulations, providing high efficacy at lower doses. This approach not only enhances patient outcomes but also minimizes side effects, making treatments more manageable. For patients with chronic illnesses who need lifelong medication, HPAPIs facilitate the creation of drugs that offer prolonged therapeutic effects, decrease dosing frequency, and improve adherence to treatment regimens.
Non-communicable diseases (NCDs) kill 41 million people each year, equivalent to 74% of all deaths globally. Each year, 17 million people die from a NCD before age 70; 86% of these premature deaths occur in low- and middle-income countries.
High Manufacturing Costs Likely to Hamper Industry Growth
Manufacturing HPAPIs requires substantial capital investment in specialized facilities, equipment, and containment systems to ensure safety and regulatory compliance. These high initial and ongoing operational costs can deter smaller companies from entering the market or limit the ability of existing companies to expand their production capacities. The production of HPAPIs involves complex and precise processes to maintain high potency and purity while ensuring safety. These processes often require advanced technology, skilled personnel, and stringent quality control measures, all of which contribute to higher manufacturing costs.
What Questions Should You Ask before Buying a Market Research Report?
-
How is the highly potent active pharmaceutical ingredients market evolving?
-
What is driving and restraining the Highly potent active pharmaceutical ingredients Market?
-
How will each highly potent active pharmaceutical ingredients submarket segment grow over the forecast period and how much revenue will these submarkets account for in 2034?
-
How will the market shares for each highly potent active pharmaceutical ingredients submarket develop from 2024 to 2034?
-
What will be the main driver for the overall market from 2024 to 2034?
-
Will leading highly potent active pharmaceutical ingredients markets broadly follow the macroeconomic dynamics, or will individual national markets outperform others?
-
How will the market shares of the national markets change by 2034 and which geographical region will lead the market in 2034?
-
Who are the leading players and what are their prospects over the forecast period?
-
What are the highly potent active pharmaceutical ingredients projects for these leading companies?
-
How will the industry evolve during the period between 2024 and 2034? What are the implications of highly potent active pharmaceutical ingredients projects taking place now and over the next 10 years?
-
Is there a greater need for product commercialisation to further scale the highly potent active pharmaceutical ingredients market?
-
Where is the highly potent active pharmaceutical ingredients market heading and how can you ensure you are at the forefront of the market?
-
What are the best investment options for new product and service lines?
-
What are the key prospects for moving companies into a new growth path and C-suite?
You need to discover how this will impact the Highly Potent Active Pharmaceutical Ingredients Market today, and over the next 10 years:
-
Our 335-page report provides 124 tables and 220 charts/graphs exclusively to you.
-
The report highlights key lucrative areas in the industry so you can target them – NOW.
-
It contains in-depth analysis of global, regional and national sales and growth.
-
It highlights for you the key successful trends, changes and revenue projections made by your competitors.
Forecasts to 2034 and other analyses reveal commercial prospects
-
In addition to revenue forecasting to 2034, our new study provides you with recent results, growth rates, and market shares.
-
You will find original analyses, with business outlooks and developments.
-
Discover qualitative analyses (including market dynamics, drivers, opportunities, restraints and challenges), cost structure, impact of rising highly potent active pharmaceutical ingredients prices and recent developments.
Segments Covered in the Report
Product
Manufacturer Type
Drug Type
Dosage Form
-
Solids
-
Liquids
-
Injectable
-
Others
Application
-
Oncology
-
Hormonal Imbalance
-
Glaucoma
-
Others
In addition to the revenue predictions for the overall world market and segments, you will also find revenue forecasts for five regional and 27 leading national markets:
North America
Europe
-
Germany
-
UK
-
France
-
Spain
-
Italy
-
Poland
-
Belgium
-
Russia
-
Rest of Europe
Asia Pacific
-
China
-
Japan
-
India
-
Australia
-
South Korea
-
Singapore
-
Taiwan
-
Rest of Asia Pacific
Latin America
-
Brazil
-
Mexico
-
Argentina
-
Colombia
-
Rest of Latin America
MEA
-
GCC
-
South Africa
-
Rest of MEA
The report also includes profiles for some of the leading companies in the Highly Potent Active Pharmaceutical Ingredients Market 2024 to 2034, with a focus on this segment of these companies’ operations.
Leading companies profiled in the report
-
AbbVie Inc.
-
Bayer AG
-
Boehringer Ingelheim International GmbH
-
Bristol Myers Squibb Company
-
Cambrex Corporation
-
Catalent, Inc
-
Cipla Inc.
-
Dr Reddy’s Laboratories
-
Eli Lilly and Company
-
F. Hoffmann-La Roche AG
-
Merck & Co., Inc.
-
Novartis AG
-
Pfizer Inc.
-
Sanofi
-
Teva Pharmaceutical Industries Ltd.
Overall world revenue for Highly Potent Active Pharmaceutical Ingredients Market, 2024 to 2034 in terms of value the market will surpass US$29,600 million in 2024, our work calculates. We predict strong revenue growth through to 2034. Our work identifies which organizations hold the greatest potential. Discover their capabilities, progress, and commercial prospects, helping you stay ahead.
How will the Highly Potent Active Pharmaceutical Ingredients Market, 2024 to 2034 report help you?
In summary, our 330+ page report provides you with the following knowledge:
-
Revenue forecasts to 2034 for Highly Potent Active Pharmaceutical Ingredients Market, 2024 to 2034, with forecasts for product, manufacturer, drug type, dosage form, and application each forecast at a global and regional level – discover the industry’s prospects, finding the most lucrative places for investments and revenues.
-
Revenue forecasts to 2034 for five regional and 27 key national markets – See forecasts for the Highly Potent Active Pharmaceutical Ingredients Market, 2024 to 2034 market in North America, Europe, Asia-Pacific, Latin America, and MEA. Also forecasted is the market in the US, Canada, Mexico, Brazil, Germany, France, UK, Italy, China, India, Japan, and Australia among other prominent economies.
-
Prospects for established firms and those seeking to enter the market – including company profiles for 15 of the major companies involved in the Highly Potent Active Pharmaceutical Ingredients Market, 2024 to 2034.
Find quantitative and qualitative analyses with independent predictions. Receive information that only our report contains, staying informed with invaluable business intelligence.
Information found nowhere else
With our new report, you are less likely to fall behind in knowledge or miss out on opportunities. See how our work could benefit your research, analyses, and decisions. Visiongain’s study is for everybody needing commercial analyses for the Highly Potent Active Pharmaceutical Ingredients Market, 2024 to 2034, market-leading companies. You will find data, trends and predictions.
ページTOPに戻る
Table of Contents
1 Report Overview
1.1 Objectives of the Study
1.2 Introduction to Highly Potent Active Pharmaceutical Ingredients Market
1.3 What This Report Delivers
1.4 Why You Should Read This Report
1.5 Key Questions Answered by This Analytical Report
1.6 Who is This Report for?
1.7 Methodology
1.7.1 Market Definitions
1.7.2 Market Evaluation & Forecasting Methodology
1.7.3 Data Validation
1.7.3.1 Primary Research
1.7.3.2 Secondary Research
1.8 Frequently Asked Questions (FAQs)
1.9 Associated Visiongain Reports
1.10 About Visiongain
2 Executive Summary
3 Market Overview
3.1 Key Findings
3.2 Market Dynamics
3.3 Impact Analysis
3.3.1 Market Driving Factors
3.3.1.1 Increasing Incidence of Chronic Diseases
3.3.1.2 Advancements in Oncology Research
3.3.1.3 Growing Emphasis on Personalized Medicine
3.3.2 Market Restraining Factors
3.3.2.1 Stringent Regulatory Requirements
3.3.2.2 High Developmental Cost for HPAPIs
3.3.2.3 Susceptibility to Supply Chain Disruptions
3.3.3 Market Opportunities
3.3.3.1 Growing Investments in Infrastructure and Capacity Expansion
3.3.3.2 Lucrative Growth Opportunities in Emerging Markets
3.3.3.3 Increasing Collaborations and Partnerships Between Industry Participants
3.4 Emerging Markets and Megatrends
3.5 Porter’s Five Forces Analysis
3.5.1 Bargaining Power of Suppliers
3.5.2 Bargaining Power of Buyers
3.5.3 Competitive Rivalry
3.5.4 Threat of Substitutes
3.5.5 Threat of New Entrants
3.6 PEST Analysis
4 Highly Potent Active Pharmaceutical Ingredients Market Analysis by Product
4.1 Key Findings
4.2 Product Segment: Market Attractiveness Index
4.3 Highly Potent Active Pharmaceutical Ingredients Market Size Estimation and Forecast by Product
4.4 Synthetic
4.4.1 Market Size by Region, 2024-2034 (US$ Million)
4.4.2 Market Share by Region, 2024 & 2034 (%)
4.5 Biotech
4.5.1 Market Size by Region, 2024-2034 (US$ Million)
4.5.2 Market Share by Region, 2024 & 2034 (%)
5 Highly Potent Active Pharmaceutical Ingredients Market Analysis by Manufacturer Type
5.1 Key Findings
5.2 Product Segment: Market Attractiveness Index
5.3 Highly Potent Active Pharmaceutical Ingredients Market Size Estimation and Forecast by Manufacturer Type
5.4 In-house
5.4.1 Market Size by Region, 2024-2034 (US$ Million)
5.4.2 Market Share by Region, 2024 & 2034 (%)
5.5 Outsource
5.5.1 Market Size by Region, 2024-2034 (US$ Million)
5.5.2 Market Share by Region, 2024 & 2034 (%)
6 Highly Potent Active Pharmaceutical Ingredients Market Analysis by Drug Type
6.1 Key Findings
6.2 Drug Type Segment: Market Attractiveness Index
6.3 Highly Potent Active Pharmaceutical Ingredients Market Size Estimation and Forecast by Drug Type
6.4 Innovative
6.4.1 Market Size by Region, 2024-2034 (US$ Million)
6.4.2 Market Share by Region, 2024 & 2034 (%)
6.5 Generic
6.5.1 Market Size by Region, 2024-2034 (US$ Million)
6.5.2 Market Share by Region, 2024 & 2034 (%)
7 Highly Potent Active Pharmaceutical Ingredients Market Analysis by Dosage Form
7.1 Key Findings
7.2 Dosage Form Segment: Market Attractiveness Index
7.3 Highly Potent Active Pharmaceutical Ingredients Market Size Estimation and Forecast by Dosage Form
7.4 Solids
7.4.1 Market Size by Region, 2024-2034 (US$ Million)
7.4.2 Market Share by Region, 2024 & 2034 (%)
7.5 Liquids
7.5.1 Market Size by Region, 2024-2034 (US$ Million)
7.5.2 Market Share by Region, 2024 & 2034 (%)
7.6 Injectable
7.6.1 Market Size by Region, 2024-2034 (US$ Million)
7.6.2 Market Share by Region, 2024 & 2034 (%)
7.7 Others
7.7.1 Market Size by Region, 2024-2034 (US$ Million)
7.7.2 Market Share by Region, 2024 & 2034 (%)
8 Highly Potent Active Pharmaceutical Ingredients Market Analysis by Application
8.1 Key Findings
8.2 Application Segment: Market Attractiveness Index
8.3 Highly Potent Active Pharmaceutical Ingredients Market Size Estimation and Forecast by Application
8.4 Oncology
8.4.1 Market Size by Region, 2024-2034 (US$ Million)
8.4.2 Market Share by Region, 2024 & 2034 (%)
8.5 Hormonal Imbalance
8.5.1 Market Size by Region, 2024-2034 (US$ Million)
8.5.2 Market Share by Region, 2024 & 2034 (%)
8.6 Glaucoma
8.6.1 Market Size by Region, 2024-2034 (US$ Million)
8.6.2 Market Share by Region, 2024 & 2034 (%)
8.7 Others
8.7.1 Market Size by Region, 2024-2034 (US$ Million)
8.7.2 Market Share by Region, 2024 & 2034 (%)
9 Highly Potent Active Pharmaceutical Ingredients Market Analysis by Region
9.1 Key Findings
9.2 Regional Market Size Estimation and Forecast
10 North America Highly Potent Active Pharmaceutical Ingredients Market Analysis
10.1 Key Findings
10.2 North America Highly Potent Active Pharmaceutical Ingredients Market Attractiveness Index
10.3 North America Highly Potent Active Pharmaceutical Ingredients Market Size Estimation and Forecast by Country
10.4 North America Highly Potent Active Pharmaceutical Ingredients Market Size Estimation and Forecast by Product
10.5 North America Highly Potent Active Pharmaceutical Ingredients Market Size Estimation and Forecast by Manufacturer Type
10.6 North America Highly Potent Active Pharmaceutical Ingredients Market Size Estimation and Forecast by Drug Type
10.7 North America Highly Potent Active Pharmaceutical Ingredients Market Size Estimation and Forecast by Dosage Form
10.8 North America Highly Potent Active Pharmaceutical Ingredients Market Size Estimation and Forecast by Application
10.9 U.S. Highly Potent Active Pharmaceutical Ingredients Market Analysis
10.10 Canada Highly Potent Active Pharmaceutical Ingredients Market Analysis
11 Europe Highly Potent Active Pharmaceutical Ingredients Market Analysis
11.1 Key Findings
11.2 Europe Highly Potent Active Pharmaceutical Ingredients Market Attractiveness Index
11.3 Europe Highly Potent Active Pharmaceutical Ingredients Market by Country, 2024, 2029 & 2034 (US$ Million)
11.4 Europe Highly Potent Active Pharmaceutical Ingredients Market Size Estimation and Forecast by Country
11.5 Europe Highly Potent Active Pharmaceutical Ingredients Market Size Estimation and Forecast by Product
11.6 Europe Highly Potent Active Pharmaceutical Ingredients Market Size Estimation and Forecast by Manufacturer Type
11.7 Europe Highly Potent Active Pharmaceutical Ingredients Market Size Estimation and Forecast by Drug Type
11.8 Europe Highly Potent Active Pharmaceutical Ingredients Market Size Estimation and Forecast by Dosage Form
11.9 Europe Highly Potent Active Pharmaceutical Ingredients Market Size Estimation and Forecast by Application
11.10 Germany Highly Potent Active Pharmaceutical Ingredients Market Analysis
11.11 UK Highly Potent Active Pharmaceutical Ingredients Market Analysis
11.12 France Highly Potent Active Pharmaceutical Ingredients Market Analysis
11.13 Spain Highly Potent Active Pharmaceutical Ingredients Market Analysis
11.14 Italy Highly Potent Active Pharmaceutical Ingredients Market Analysis
11.15 Poland Highly Potent Active Pharmaceutical Ingredients Market Analysis
11.16 Belgium Highly Potent Active Pharmaceutical Ingredients Market Analysis
11.17 Russia Highly Potent Active Pharmaceutical Ingredients Market Analysis
11.18 Rest of Europe Highly Potent Active Pharmaceutical Ingredients Market Analysis
12 Asia Pacific Highly Potent Active Pharmaceutical Ingredients Market Analysis
12.1 Key Findings
12.2 Asia Pacific Highly Potent Active Pharmaceutical Ingredients Market Attractiveness Index
12.3 Asia Pacific Highly Potent Active Pharmaceutical Ingredients Market by Country, 2024, 2029 & 2034 (US$ Million)
12.4 Asia Pacific Highly Potent Active Pharmaceutical Ingredients Market Size Estimation and Forecast by Country
12.5 Asia Pacific Highly Potent Active Pharmaceutical Ingredients Market Size Estimation and Forecast by Product
12.6 Asia Pacific Highly Potent Active Pharmaceutical Ingredients Market Size Estimation and Forecast by Manufacturer Type
12.7 Asia Pacific Highly Potent Active Pharmaceutical Ingredients Market Size Estimation and Forecast by Drug Type
12.8 Asia Pacific Highly Potent Active Pharmaceutical Ingredients Market Size Estimation and Forecast by Dosage Form
12.9 Asia Pacific Highly Potent Active Pharmaceutical Ingredients Market Size Estimation and Forecast by Application
12.10 Japan Highly Potent Active Pharmaceutical Ingredients Market Analysis
12.11 China Highly Potent Active Pharmaceutical Ingredients Market Analysis
12.12 India Highly Potent Active Pharmaceutical Ingredients Market Analysis
12.13 Australia Highly Potent Active Pharmaceutical Ingredients Market Analysis
12.14 South Korea Highly Potent Active Pharmaceutical Ingredients Market Analysis
12.15 Singapore Highly Potent Active Pharmaceutical Ingredients Market Analysis
12.16 Taiwan Highly Potent Active Pharmaceutical Ingredients Market Analysis
12.17 Rest of Asia Pacific Highly Potent Active Pharmaceutical Ingredients Market Analysis
13 Latin America Highly Potent Active Pharmaceutical Ingredients Market Analysis
13.1 Key Findings
13.2 Latin America Highly Potent Active Pharmaceutical Ingredients Market Attractiveness Index
13.3 Latin America Highly Potent Active Pharmaceutical Ingredients Market by Country, 2024, 2029 & 2034 (US$ Million)
13.4 Latin America Highly Potent Active Pharmaceutical Ingredients Market Size Estimation and Forecast by Country
13.5 Latin America Highly Potent Active Pharmaceutical Ingredients Market Size Estimation and Forecast by Product
13.6 Latin America Highly Potent Active Pharmaceutical Ingredients Market Size Estimation and Forecast by Manufacturer Type
13.7 Latin America Highly Potent Active Pharmaceutical Ingredients Market Size Estimation and Forecast by Drug Type
13.8 Latin America Highly Potent Active Pharmaceutical Ingredients Market Size Estimation and Forecast by Dosage Form
13.9 Latin America Highly Potent Active Pharmaceutical Ingredients Market Size Estimation and Forecast by Application
13.10 Brazil Highly Potent Active Pharmaceutical Ingredients Market Analysis
13.11 Mexico Highly Potent Active Pharmaceutical Ingredients Market Analysis
13.12 Argentina Highly Potent Active Pharmaceutical Ingredients Market Analysis
13.13 Colombia Highly Potent Active Pharmaceutical Ingredients Market Analysis
13.14 Rest of Latin America Highly Potent Active Pharmaceutical Ingredients Market Analysis
14 Middle East and Africa Highly Potent Active Pharmaceutical Ingredients Market Analysis
14.1 Key Findings
14.2 Middle East and Africa Highly Potent Active Pharmaceutical Ingredients Market Attractiveness Index
14.3 Middle East and Africa Highly Potent Active Pharmaceutical Ingredients Market by Country, 2024, 2029 & 2034 (US$ Million)
14.4 Middle East and Africa Highly Potent Active Pharmaceutical Ingredients Market Size Estimation and Forecast by Country
14.5 Middle East and Africa Highly Potent Active Pharmaceutical Ingredients Market Size Estimation and Forecast by Product
14.6 Middle East and Africa Highly Potent Active Pharmaceutical Ingredients Market Size Estimation and Forecast by Manufacturer Type
14.7 Middle East and Africa Highly Potent Active Pharmaceutical Ingredients Market Size Estimation and Forecast by Drug Type
14.8 Middle East and Africa Highly Potent Active Pharmaceutical Ingredients Market Size Estimation and Forecast by Dosage Form
14.9 Middle East and Africa Highly Potent Active Pharmaceutical Ingredients Market Size Estimation and Forecast by Application
14.10 GCC Highly Potent Active Pharmaceutical Ingredients Market Analysis
14.11 South Africa Highly Potent Active Pharmaceutical Ingredients Market Analysis
14.12 Rest of MEA Highly Potent Active Pharmaceutical Ingredients Market Analysis
15 Company Profiles
15.1 Competitive Landscape, 2023
15.2 Strategic Outlook
15.3 AbbVie Inc.
15.3.1 Company Snapshot
15.3.2 Company Overview
15.3.3 Financial Analysis
15.3.3.1 Net Revenue, 2017-2023
15.3.3.2 R&D, 2017-2023
15.3.3.3 Regional Market Shares, 2023
15.3.3.4 Business Segment Market Shares, 2023
15.3.4 Product Benchmarking
15.3.5 Strategic Outlook
15.3.6 SWOT Analysis
15.4 Bayer AG
15.4.1 Company Snapshot
15.4.2 Company Overview
15.4.3 Financial Analysis
15.4.3.1 Net Revenue, 2017-2023
15.4.3.2 R&D, 2017-2023
15.4.3.3 Regional Market Shares, 2023
15.4.4 Product Benchmarking
15.4.5 Strategic Outlook
15.4.6 SWOT Analysis
15.5 Boehringer Ingelheim International GmbH
15.5.1 Company Snapshot
15.5.2 Company Overview
15.5.3 Financial Analysis
15.5.3.1 Net Revenue, 2017-2023
15.5.3.2 R&D, 2017-2023
15.5.3.3 Regional Market Shares, 2023
15.5.3.4 Business Segment Market Shares, 2023
15.5.4 Product Benchmarking
15.5.5 Strategic Outlook
15.5.6 SWOT Analysis
15.6 Bristol Myers Squibb Company
15.6.1 Company Snapshot
15.6.2 Company Overview
15.6.3 Financial Analysis
15.6.3.1 Net Revenue, 2017-2023
15.6.3.2 R&D, 2017-2023
15.6.3.3 Regional Market Shares, 2023
15.6.3.4 Business Segment Market Shares, 2023
15.6.4 Product Benchmarking
15.6.5 Strategic Outlook
15.6.6 SWOT Analysis
15.7 Cambrex Corporation
15.7.1 Company Snapshot
15.7.2 Company Overview
15.7.3 Product Benchmarking
15.7.4 Strategic Outlook
15.7.5 SWOT Analysis
15.8 Catalent, Inc
15.8.1 Company Snapshot
15.8.2 Company Overview
15.8.3 Financial Analysis
15.8.3.1 Net Revenue, 2017-2023
15.8.3.2 Regional Market Shares, 2023
15.8.3.3 Business Segment Market Shares, 2023
15.8.4 Product Benchmarking
15.8.5 Strategic Outlook
15.8.6 SWOT Analysis
15.9 Cipla Inc.
15.9.1 Company Snapshot
15.9.2 Company Overview
15.9.3 Financial Analysis
15.9.3.1 Net Revenue, 2017-2023
15.9.3.2 R&D, 2017-2023
15.9.3.3 Regional Market Shares, 2023
15.9.3.4 Business Segment Market Shares, 2023
15.9.4 Product Benchmarking
15.9.5 Strategic Outlook
15.9.6 SWOT Analysis
15.10 Dr. Reddy’s Laboratories
15.10.1 Company Snapshot
15.10.2 Company Overview
15.10.3 Financial Analysis
15.10.3.1 Net Revenue, 2017-2023
15.10.3.2 R&D, 2017-2023
15.10.3.3 Regional Market Shares, 2023
15.10.3.4 Business Segment Market Shares, 2023
15.10.4 Product Benchmarking
15.10.5 Strategic Outlook
15.10.6 SWOT Analysis
15.11 Eli Lilly and Company
15.11.1 Company Snapshot
15.11.2 Company Overview
15.11.3 Financial Analysis
15.11.3.1 Net Revenue, 2017-2023
15.11.3.2 R&D, 2017-2023
15.11.3.3 Regional Market Shares, 2023
15.11.3.4 Business Segment Market Shares, 2023
15.11.4 Product Benchmarking
15.11.5 Strategic Outlook
15.11.6 SWOT Analysis
15.12 F. Hoffmann-La Roche AG
15.12.1 Company Snapshot
15.12.2 Company Overview
15.12.3 Financial Analysis
15.12.3.1 Net Revenue, 2017-2023
15.12.3.2 R&D, 2017-2023
15.12.3.3 Business Segment Market Shares, 2023
15.12.4 Product Benchmarking
15.12.5 Strategic Outlook
15.12.6 SWOT Analysis
15.13 Merck & Co., Inc.
15.13.1 Company Snapshot
15.13.2 Company Overview
15.13.3 Financial Analysis
15.13.3.1 Net Revenue, 2017-2023
15.13.3.2 R&D, 2017-2023
15.13.3.3 Regional Market Shares, 2023
15.13.3.4 Business Segment Market Shares, 2023
15.13.4 Product Benchmarking
15.13.5 Strategic Outlook
15.13.6 SWOT Analysis
15.14 Novartis AG
15.14.1 Company Snapshot
15.14.2 Company Overview
15.14.3 Financial Analysis
15.14.3.1 Net Revenue, 2017-2023
15.14.3.2 R&D, 2017-2023
15.14.3.3 Regional Market Shares, 2023
15.14.3.4 Business Segment Market Shares, 2023
15.14.4 Product Benchmarking
15.14.5 Strategic Outlook
15.14.6 SWOT Analysis
15.15 Pfizer Inc.
15.15.1 Company Snapshot
15.15.2 Company Overview
15.15.3 Financial Analysis
15.15.3.1 Net Revenue, 2017-2023
15.15.3.2 R&D, 2017-2023
15.15.3.3 Regional Market Shares, 2023
15.15.3.4 Business Segment Market Shares, 2023
15.15.4 Product Benchmarking
15.15.5 Strategic Outlook
15.15.6 SWOT Analysis
15.16 Sanofi
15.16.1 Company Snapshot
15.16.2 Company Overview
15.16.3 Financial Analysis
15.16.3.1 Net Revenue, 2017-2023
15.16.3.2 R&D, 2017-2023
15.16.4 Product Benchmarking
15.16.5 Strategic Outlook
15.16.6 SWOT Analysis
15.17 Teva Pharmaceutical Industries Ltd.
15.17.1 Company Snapshot
15.17.2 Company Overview
15.17.3 Financial Analysis
15.17.3.1 Net Revenue, 2017-2023
15.17.3.2 R&D, 2017-2023
15.17.3.3 Regional Market Shares, 2023
15.17.4 Product Benchmarking
15.17.5 Strategic Outlook
15.17.6 SWOT Analysis
16 Conclusion and Recommendations
16.1 Concluding Remarks from Visiongain
16.2 Recommendations for Market Players
ページTOPに戻る
List of Tables/Graphs
List of Tables
Table 1 Highly Potent Active Pharmaceutical Ingredients Market Snapshot, 2024 & 2034 (US$ Million, CAGR %)
Table 2 Highly Potent Active Pharmaceutical Ingredients Market Forecast by Product, 2024-2034 (US$ Million, AGR %, CAGR %)
Table 3 Synthetic Segment Market Forecast by Region, 2024-2034 (US$ Million, AGR %, CAGR %)
Table 4 Biotech Segment Market Forecast by Region, 2024-2034 (US$ Million, AGR %, CAGR %)
Table 5 Highly Potent Active Pharmaceutical Ingredients Market Forecast by Manufacturer Type, 2024-2034 (US$ Million, AGR %, CAGR %)
Table 6 In-house Segment Market Forecast by Region, 2024-2034 (US$ Million, AGR %, CAGR %)
Table 7 Outsource Segment Market Forecast by Region, 2024-2034 (US$ Million, AGR %, CAGR %)
Table 8 Highly Potent Active Pharmaceutical Ingredients Market Forecast by Drug Type, 2024-2034 (US$ Million, AGR %, CAGR %)
Table 9 Innovative Segment Market Forecast by Region, 2024-2034 (US$ Million, AGR %, CAGR %)
Table 10 Generic Segment Market Forecast by Region, 2024-2034 (US$ Million, AGR %, CAGR %)
Table 11 Highly Potent Active Pharmaceutical Ingredients Market Forecast by Dosage Form, 2024-2034 (US$ Million, AGR %, CAGR %)
Table 12 Solids Segment Market Forecast by Region, 2024-2034 (US$ Million, AGR %, CAGR %)
Table 13 Liquids Segment Market Forecast by Region, 2024-2034 (US$ Million, AGR %, CAGR %)
Table 14 Injectable Segment Market Forecast by Region, 2024-2034 (US$ Million, AGR %, CAGR %)
Table 15 Others Segment Market Forecast by Region, 2024-2034 (US$ Million, AGR %, CAGR %)
Table 16 Highly Potent Active Pharmaceutical Ingredients Market Forecast by Application, 2024-2034 (US$ Million, AGR %, CAGR %)
Table 17 Oncology Segment Market Forecast by Region, 2024-2034 (US$ Million, AGR %, CAGR %)
Table 18 Hormonal Imbalance Segment Market Forecast by Region, 2024-2034 (US$ Million, AGR %, CAGR %)
Table 19 Glaucoma Segment Market Forecast by Region, 2024-2034 (US$ Million, AGR %, CAGR %)
Table 20 Others Segment Market Forecast by Region, 2024-2034 (US$ Million, AGR %, CAGR %)
Table 21 Highly Potent Active Pharmaceutical Ingredients Market Forecast by Region, 2024-2034 (US$ Million, AGR %, CAGR %)
Table 22 North America Highly Potent Active Pharmaceutical Ingredients Market Forecast by Country, 2024-2034 (US$ Million, AGR %, CAGR %)
Table 23 Highly Potent Active Pharmaceutical Ingredients Market Forecast by Product, 2024-2034 (US$ Million, AGR %, CAGR %)
Table 24 Highly Potent Active Pharmaceutical Ingredients Market Forecast by Manufacturer Type, 2024-2034 (US$ Million, AGR %, CAGR %)
Table 25 Highly Potent Active Pharmaceutical Ingredients Market Forecast by Drug Type, 2024-2034 (US$ Million, AGR %, CAGR %)
Table 26 Highly Potent Active Pharmaceutical Ingredients Market Forecast by Dosage Form, 2024-2034 (US$ Million, AGR %, CAGR %)
Table 27 Highly Potent Active Pharmaceutical Ingredients Market Forecast by Application, 2024-2034 (US$ Million, AGR %, CAGR %)
Table 28 U.S. Highly Potent Active Pharmaceutical Ingredients Market Forecast, 2024-2034 (US$ Million, AGR %, CAGR %)
Table 29 Canada Highly Potent Active Pharmaceutical Ingredients Market Forecast, 2024-2034 (US$ Million, AGR %, CAGR %)
Table 30 Europe Highly Potent Active Pharmaceutical Ingredients Market Forecast by Country, 2024-2034 (US$ Million, AGR %, CAGR %)
Table 31 Europe Highly Potent Active Pharmaceutical Ingredients Market Forecast by Product, 2024-2034 (US$ Million, AGR %, CAGR %)
Table 32 Europe Highly Potent Active Pharmaceutical Ingredients Market Forecast by Manufacturer Type, 2024-2034 (US$ Million, AGR %, CAGR %)
Table 33 Europe Highly Potent Active Pharmaceutical Ingredients Market Forecast by Drug Type, 2024-2034 (US$ Million, AGR %, CAGR %)
Table 34 Europe Highly Potent Active Pharmaceutical Ingredients Market Forecast by Dosage Form, 2024-2034 (US$ Million, AGR %, CAGR %)
Table 35 Europe Highly Potent Active Pharmaceutical Ingredients Market Forecast by Application, 2024-2034 (US$ Million, AGR %, CAGR %)
Table 36 Germany Highly Potent Active Pharmaceutical Ingredients Market Forecast, 2024-2034 (US$ Million, AGR %, CAGR %)
Table 37 UK Highly Potent Active Pharmaceutical Ingredients Market Forecast, 2024-2034 (US$ Million, AGR %, CAGR %)
Table 38 France Highly Potent Active Pharmaceutical Ingredients Market Forecast, 2024-2034 (US$ Million, AGR %, CAGR %)
Table 39 Spain Highly Potent Active Pharmaceutical Ingredients Market Forecast, 2024-2034 (US$ Million, AGR %, CAGR %)
Table 40 Italy Highly Potent Active Pharmaceutical Ingredients Market Forecast, 2024-2034 (US$ Million, AGR %, CAGR %)
Table 41 Poland Highly Potent Active Pharmaceutical Ingredients Market Forecast, 2024-2034 (US$ Million, AGR %, CAGR %)
Table 42 Belgium Highly Potent Active Pharmaceutical Ingredients Market Forecast, 2024-2034 (US$ Million, AGR %, CAGR %)
Table 43 Russia Highly Potent Active Pharmaceutical Ingredients Market Forecast, 2024-2034 (US$ Million, AGR %, CAGR %)
Table 44 Rest of Europe Highly Potent Active Pharmaceutical Ingredients Market Forecast, 2024-2034 (US$ Million, AGR %, CAGR %)
Table 45 Asia Pacific Highly Potent Active Pharmaceutical Ingredients Market Forecast by Country, 2024-2034 (US$ Million, AGR %, CAGR %)
Table 46 Asia Pacific Highly Potent Active Pharmaceutical Ingredients Market Forecast by Product, 2024-2034 (US$ Million, AGR %, CAGR %)
Table 47 Asia Pacific Highly Potent Active Pharmaceutical Ingredients Market Forecast by Manufacturer Type, 2024-2034 (US$ Million, AGR %, CAGR %)
Table 48 Asia Pacific Highly Potent Active Pharmaceutical Ingredients Market Forecast by Drug Type, 2024-2034 (US$ Million, AGR %, CAGR %)
Table 49 Asia Pacific Highly Potent Active Pharmaceutical Ingredients Market Forecast by Dosage Form, 2024-2034 (US$ Million, AGR %, CAGR %)
Table 50 Asia Pacific Highly Potent Active Pharmaceutical Ingredients Market Forecast by Application, 2024-2034 (US$ Million, AGR %, CAGR %)
Table 51 Japan Highly Potent Active Pharmaceutical Ingredients Market Forecast, 2024-2034 (US$ Million, AGR %, CAGR %)
Table 52 China Highly Potent Active Pharmaceutical Ingredients Market Forecast, 2024-2034 (US$ Million, AGR %, CAGR %)
Table 53 India Highly Potent Active Pharmaceutical Ingredients Market Forecast, 2024-2034 (US$ Million, AGR %, CAGR %)
Table 54 Australia Highly Potent Active Pharmaceutical Ingredients Market Forecast, 2024-2034 (US$ Million, AGR %, CAGR %)
Table 55 South Korea Highly Potent Active Pharmaceutical Ingredients Market Forecast, 2024-2034 (US$ Million, AGR %, CAGR %)
Table 56 Singapore Highly Potent Active Pharmaceutical Ingredients Market Forecast, 2024-2034 (US$ Million, AGR %, CAGR %)
Table 57 Taiwan Highly Potent Active Pharmaceutical Ingredients Market Forecast, 2024-2034 (US$ Million, AGR %, CAGR %)
Table 58 Rest of Asia Pacific Highly Potent Active Pharmaceutical Ingredients Market Forecast, 2024-2034 (US$ Million, AGR %, CAGR %)
Table 59 Latin America Highly Potent Active Pharmaceutical Ingredients Market Forecast by Country, 2024-2034 (US$ Million, AGR %, CAGR %)
Table 60 Latin America Highly Potent Active Pharmaceutical Ingredients Market Forecast by Product, 2024-2034 (US$ Million, AGR %, CAGR %)
Table 61 Latin America Highly Potent Active Pharmaceutical Ingredients Market Forecast by Manufacturer Type, 2024-2034 (US$ Million, AGR %, CAGR %)
Table 62 Latin America Highly Potent Active Pharmaceutical Ingredients Market Forecast by Drug Type, 2024-2034 (US$ Million, AGR %, CAGR %)
Table 63 Latin America Highly Potent Active Pharmaceutical Ingredients Market Forecast by Dosage Form, 2024-2034 (US$ Million, AGR %, CAGR %)
Table 64 Latin America Highly Potent Active Pharmaceutical Ingredients Market Forecast by Application, 2024-2034 (US$ Million, AGR %, CAGR %)
Table 65 Brazil Highly Potent Active Pharmaceutical Ingredients Market Forecast, 2024-2034 (US$ Million, AGR %, CAGR %)
Table 66 Mexico Highly Potent Active Pharmaceutical Ingredients Market Forecast, 2024-2034 (US$ Million, AGR %, CAGR %)
Table 67 Argentina Highly Potent Active Pharmaceutical Ingredients Market Forecast, 2024-2034 (US$ Million, AGR %, CAGR %)
Table 68 Colombia Highly Potent Active Pharmaceutical Ingredients Market Forecast, 2024-2034 (US$ Million, AGR %, CAGR %)
Table 69 Rest of Latin America Highly Potent Active Pharmaceutical Ingredients Market Forecast, 2024-2034 (US$ Million, AGR %, CAGR %)
Table 70 Middle East and Africa Highly Potent Active Pharmaceutical Ingredients Market Forecast by Country, 2024-2034 (US$ Million, AGR %, CAGR %)
Table 71 Middle East and Africa Highly Potent Active Pharmaceutical Ingredients Market Forecast by Product, 2024-2034 (US$ Million, AGR %, CAGR %)
Table 72 Middle East and Africa Highly Potent Active Pharmaceutical Ingredients Market Forecast by Manufacturer Type, 2024-2034 (US$ Million, AGR %, CAGR %)
Table 73 Middle East and Africa Highly Potent Active Pharmaceutical Ingredients Market Forecast by Drug Type, 2024-2034 (US$ Million, AGR %, CAGR %)
Table 74 Middle East and Africa Highly Potent Active Pharmaceutical Ingredients Market Forecast by Dosage Form, 2024-2034 (US$ Million, AGR %, CAGR %)
Table 75 Middle East and Africa Highly Potent Active Pharmaceutical Ingredients Market Forecast by Application, 2024-2034 (US$ Million, AGR %, CAGR %)
Table 76 GCC Highly Potent Active Pharmaceutical Ingredients Market Forecast, 2024-2034 (US$ Million, AGR %, CAGR %)
Table 77 South Africa Highly Potent Active Pharmaceutical Ingredients Market Forecast, 2024-2034 (US$ Million, AGR %, CAGR %)
Table 78 Rest of MEA Highly Potent Active Pharmaceutical Ingredients Market Forecast, 2024-2034 (US$ Million, AGR %, CAGR %)
Table 79 Strategic Outlook
Table 80 AbbVie Inc.: Key Details, (CEO, HQ, Revenue, Founded, No. of Employees, Company Type, Website, Business Segment)
Table 81 AbbVie Inc.: Product Benchmarking
Table 82 AbbVie Inc.: Strategic Outlook
Table 83 Bayer AG: Key Details, (CEO, HQ, Revenue, Founded, No. of Employees, Company Type, Website, Business Segment)
Table 84 Bayer AG: Product Benchmarking
Table 85 Bayer AG: Strategic Outlook
Table 86 Boehringer Ingelheim International GmbH.: Key Details, (CEO, HQ, Revenue, Founded, No. of Employees, Company Type, Website, Business Segment)
Table 87 Boehringer Ingelheim International GmbH.: Product Benchmarking
Table 88 Boehringer Ingelheim International GmbH.: Strategic Outlook
Table 89 Bristol Myers Squibb Company.: Key Details, (CEO, HQ, Revenue, Founded, No. of Employees, Company Type, Website, Business Segment)
Table 90 Bristol Myers Squibb Company.: Product Benchmarking
Table 91 Bristol Myers Squibb Company.: Strategic Outlook
Table 92 Cambrex Corporation : Key Details, (CEO, HQ, Revenue, Founded, No. of Employees, Company Type, Website, Business Segment)
Table 93 Cambrex Corporation: Product Benchmarking
Table 94 Cambrex Corporation: Strategic Outlook
Table 95 Catalent, Inc : Key Details, (CEO, HQ, Revenue, Founded, No. of Employees, Company Type, Website, Business Segment)
Table 96 Catalent, Inc : Product Benchmarking
Table 97 Catalent, Inc : Strategic Outlook
Table 98 Cipla Inc.: Key Details, (CEO, HQ, Revenue, Founded, No. of Employees, Company Type, Website, Business Segment)
Table 99 Cipla Inc.: Product Benchmarking
Table 100 Cipla Inc.: Strategic Outlook
Table 101 Dr. Reddy’s Laboratories.: Key Details, (CEO, HQ, Revenue, Founded, No. of Employees, Company Type, Website, Business Segment)
Table 102 Dr. Reddy’s Laboratories.: Product Benchmarking
Table 103 Dr. Reddy’s Laboratories.: Strategic Outlook
Table 104 Eli Lilly and Company.: Key Details, (CEO, HQ, Revenue, Founded, No. of Employees, Company Type, Website, Business Segment)
Table 105 Eli Lilly and Company.: Product Benchmarking
Table 106 Eli Lilly and Company.: Strategic Outlook
Table 107 F. Hoffmann-La Roche AG.: Key Details, (CEO, HQ, Revenue, Founded, No. of Employees, Company Type, Website, Business Segment)
Table 108 F. Hoffmann-La Roche AG.: Product Benchmarking
Table 109 F. Hoffmann-La Roche AG.: Strategic Outlook
Table 110 Merck & Co., Inc.: Key Details, (CEO, HQ, Revenue, Founded, No. of Employees, Company Type, Website, Business Segment)
Table 111 Merck & Co., Inc.: Product Benchmarking
Table 112 Merck & Co., Inc.: Strategic Outlook
Table 113 Novartis AG: Key Details, (CEO, HQ, Revenue, Founded, No. of Employees, Company Type, Website, Business Segment)
Table 114 Novartis AG.: Product Benchmarking
Table 115 Novartis AG.: Strategic Outlook
Table 116 Pfizer Inc.: Key Details, (CEO, HQ, Revenue, Founded, No. of Employees, Company Type, Website, Business Segment)
Table 117 Pfizer Inc.: Product Benchmarking
Table 118 Pfizer Inc.: Strategic Outlook
Table 119 Sanofi.: Key Details, (CEO, HQ, Revenue, Founded, No. of Employees, Company Type, Website, Business Segment)
Table 120 Sanofi.: Product Benchmarking
Table 121 Sanofi.: Strategic Outlook
Table 122 Teva Pharmaceutical Industries Ltd.: Key Details, (CEO, HQ, Revenue, Founded, No. of Employees, Company Type, Website, Business Segment)
Table 123 Teva Pharmaceutical Industries Ltd.: Product Benchmarking
Table 124 Teva Pharmaceutical Industries Ltd.: Strategic Outlook
List of Figures
Figure 1 Highly Potent Active Pharmaceutical Ingredients Market Segmentation
Figure 2 Highly Potent Active Pharmaceutical Ingredients Market by Product: Market Attractiveness Index
Figure 3 Highly Potent Active Pharmaceutical Ingredients Market by Manufacturer Type: Market Attractiveness Index
Figure 4 Highly Potent Active Pharmaceutical Ingredients Market by Drug Type: Market Attractiveness Index
Figure 5 Highly Potent Active Pharmaceutical Ingredients Market by Dosage Form: Market Attractiveness Index
Figure 6 Highly Potent Active Pharmaceutical Ingredients Market by Application: Market Attractiveness Index
Figure 7 Highly Potent Active Pharmaceutical Ingredients Market Attractiveness Index by Region
Figure 8 Highly Potent Active Pharmaceutical Ingredients Market: Market Dynamics
Figure 9 Highly Potent Active Pharmaceutical Ingredients Market: Impact Analysis
Figure 10 Highly Potent Active Pharmaceutical Ingredients Market: Porter’s Five Forces Analysis
Figure 11 Highly Potent Active Pharmaceutical Ingredients Market: PEST Analysis
Figure 12 Highly Potent Active Pharmaceutical Ingredients Market by Product: Market Attractiveness Index
Figure 13 Highly Potent Active Pharmaceutical Ingredients Market Forecast by Product, 2024-2034 (US$ Million, AGR %)
Figure 14 Highly Potent Active Pharmaceutical Ingredients Market Share Forecast by Product, 2024, 2029, 2034 (%)
Figure 15 Synthetic Segment Market Forecast by Region, 2024-2034 (US$ Million, AGR %)
Figure 16 Synthetic Segment Market Share Forecast by Region, 2024 & 2034 (%)
Figure 17 Biotech Segment Market Forecast by Region, 2024-2034 (US$ Million, AGR %)
Figure 18 Biotech Segment Market Share Forecast by Region, 2024 & 2034 (%)
Figure 19 Highly Potent Active Pharmaceutical Ingredients Market by Manufacturer Type: Market Attractiveness Index
Figure 20 Highly Potent Active Pharmaceutical Ingredients Market Forecast by Manufacturer Type, 2024-2034 (US$ Million, AGR %)
Figure 21 Highly Potent Active Pharmaceutical Ingredients Market Share Forecast by Manufacturer Type, 2024, 2029, 2034 (%)
Figure 22 In-house Segment Market Forecast by Region, 2024-2034 (US$ Million, AGR %)
Figure 23 In-house Segment Market Share Forecast by Region, 2024 & 2034 (%)
Figure 24 Outsource Segment Market Forecast by Region, 2024-2034 (US$ Million, AGR %)
Figure 25 Outsource Segment Market Share Forecast by Region, 2024 & 2034 (%)
Figure 26 Highly Potent Active Pharmaceutical Ingredients Market by Drug Type: Market Attractiveness Index
Figure 27 Highly Potent Active Pharmaceutical Ingredients Market Forecast by Drug Type, 2024-2034 (US$ Million, AGR %)
Figure 28 Highly Potent Active Pharmaceutical Ingredients Market Share Forecast by Drug Type, 2024, 2029, 2034 (%)
Figure 29 Innovative Segment Market Forecast by Region, 2024-2034 (US$ Million, AGR %)
Figure 30 Innovative Segment Market Share Forecast by Region, 2024 & 2034 (%)
Figure 31 Generic Segment Market Forecast by Region, 2024-2034 (US$ Million, AGR %)
Figure 32 Generic Segment Market Share Forecast by Region, 2024 & 2034 (%)
Figure 33 Highly Potent Active Pharmaceutical Ingredients Market by Dosage Form: Market Attractiveness Index
Figure 34 Highly Potent Active Pharmaceutical Ingredients Market Forecast by Dosage Form, 2024-2034 (US$ Million, AGR %)
Figure 35 Highly Potent Active Pharmaceutical Ingredients Market Share Forecast by Dosage Form, 2024, 2029, 2034 (%)
Figure 36 Solids Segment Market Forecast by Region, 2024-2034 (US$ Million, AGR %)
Figure 37 Solids Segment Market Share Forecast by Region, 2024 & 2034 (%)
Figure 38 Liquids Segment Market Forecast by Region, 2024-2034 (US$ Million, AGR %)
Figure 39 Liquids Segment Market Share Forecast by Region, 2024 & 2034 (%)
Figure 40 Injectable Segment Market Forecast by Region, 2024-2034 (US$ Million, AGR %)
Figure 41 Injectable Segment Market Share Forecast by Region, 2024 & 2034 (%)
Figure 42 Others Segment Market Forecast by Region, 2024-2034 (US$ Million, AGR %)
Figure 43 Others Segment Market Share Forecast by Region, 2024 & 2034 (%)
Figure 44 Highly Potent Active Pharmaceutical Ingredients Market by Application: Market Attractiveness Index
Figure 45 Highly Potent Active Pharmaceutical Ingredients Market Forecast by Application, 2024-2034 (US$ Million, AGR %)
Figure 46 Highly Potent Active Pharmaceutical Ingredients Market Share Forecast by Application, 2024, 2029, 2034 (%)
Figure 47 Oncology Segment Market Forecast by Region, 2024-2034 (US$ Million, AGR %)
Figure 48 Oncology Segment Market Share Forecast by Region, 2024 & 2034 (%)
Figure 49 Hormonal Imbalance Segment Market Forecast by Region, 2024-2034 (US$ Million, AGR %)
Figure 50 Hormonal Imbalance Segment Market Share Forecast by Region, 2024 & 2034 (%)
Figure 51 Glaucoma Segment Market Forecast by Region, 2024-2034 (US$ Million, AGR %)
Figure 52 Glaucoma Segment Market Share Forecast by Region, 2024 & 2034 (%)
Figure 53 Others Segment Market Forecast by Region, 2024-2034 (US$ Million, AGR %)
Figure 54 Others Segment Market Share Forecast by Region, 2024 & 2034 (%)
Figure 55 Highly Potent Active Pharmaceutical Ingredients Market Forecast by Region 2024 and 2034 (Revenue, CAGR%)
Figure 56 Highly Potent Active Pharmaceutical Ingredients Market Share Forecast by Region 2024, 2029, 2034 (%)
Figure 57 Highly Potent Active Pharmaceutical Ingredients Market by Region, 2024-2034 (US$ Million, AGR %)
Figure 58 North America Highly Potent Active Pharmaceutical Ingredients Market Attractiveness Index
Figure 59 North America Highly Potent Active Pharmaceutical Ingredients Market by Region, 2024, 2029 & 2034 (US$ Million)
Figure 60 North America Highly Potent Active Pharmaceutical Ingredients Market Forecast by Country, 2024-2034 (US$ Million, AGR %)
Figure 61 North America Highly Potent Active Pharmaceutical Ingredients Market Share Forecast by Country, 2024 & 2034 (%)
Figure 62 North America Highly Potent Active Pharmaceutical Ingredients Market Forecast by Product, 2024-2034 (US$ Million, AGR %)
Figure 63 North America Highly Potent Active Pharmaceutical Ingredients Market Share Forecast by Product, 2024 & 2034 (%)
Figure 64 North America Highly Potent Active Pharmaceutical Ingredients Market Forecast by Manufacturer Type, 2024-2034 (US$ Million, AGR %)
Figure 65 North America Highly Potent Active Pharmaceutical Ingredients Market Share Forecast by Manufacturer Type, 2024 & 2034 (%)
Figure 66 North America Highly Potent Active Pharmaceutical Ingredients Market Forecast by Drug Type, 2024-2034 (US$ Million, AGR %)
Figure 67 North America Highly Potent Active Pharmaceutical Ingredients Market Share Forecast by Drug Type, 2024 & 2034 (%)
Figure 68 North America Highly Potent Active Pharmaceutical Ingredients Market Forecast Dosage Form, 2024-2034 (US$ Million, AGR %)
Figure 69 North America Highly Potent Active Pharmaceutical Ingredients Market Share Forecast by Dosage Form, 2024 & 2034 (%)
Figure 70 North America Highly Potent Active Pharmaceutical Ingredients Market Forecast by Application, 2024-2034 (US$ Million, AGR %)
Figure 71 North America Highly Potent Active Pharmaceutical Ingredients Market Share Forecast by Application, 2024 & 2034 (%)
Figure 72 U.S. Highly Potent Active Pharmaceutical Ingredients Market Forecast, 2024-2034 (US$ Million, AGR %)
Figure 73 Canada Highly Potent Active Pharmaceutical Ingredients Market Forecast, 2024-2034 (US$ Million, AGR %)
Figure 74 Europe Highly Potent Active Pharmaceutical Ingredients Market Attractiveness Index
Figure 75 Europe Highly Potent Active Pharmaceutical Ingredients Market by Region, 2024, 2029 & 2034 (US$ Million)
Figure 76 Europe Highly Potent Active Pharmaceutical Ingredients Market Forecast by Country, 2024-2034 (US$ Million, AGR %)
Figure 77 Europe Highly Potent Active Pharmaceutical Ingredients Market Share Forecast by Country, 2024 & 2034 (%)
Figure 78 Europe Highly Potent Active Pharmaceutical Ingredients Market Forecast by Product, 2024-2034 (US$ Million, AGR %)
Figure 79 Europe Highly Potent Active Pharmaceutical Ingredients Market Share Forecast by Product, 2024 & 2034 (%)
Figure 80 Europe Highly Potent Active Pharmaceutical Ingredients Market Forecast by Manufacturer Type, 2024-2034 (US$ Million, AGR %)
Figure 81 Europe Highly Potent Active Pharmaceutical Ingredients Market Share Forecast by Manufacturer Type, 2024 & 2034 (%)
Figure 82 Europe Highly Potent Active Pharmaceutical Ingredients Market Forecast by Drug Type, 2024-2034 (US$ Million, AGR %)
Figure 83 Europe Highly Potent Active Pharmaceutical Ingredients Market Share Forecast by Drug Type, 2024 & 2034 (%)
Figure 84 Europe Highly Potent Active Pharmaceutical Ingredients Market Forecast Dosage Form, 2024-2034 (US$ Million, AGR %)
Figure 85 Europe Highly Potent Active Pharmaceutical Ingredients Market Share Forecast by Dosage Form, 2024 & 2034 (%)
Figure 86 Europe Highly Potent Active Pharmaceutical Ingredients Market Forecast by Application, 2024-2034 (US$ Million, AGR %)
Figure 87 Europe Highly Potent Active Pharmaceutical Ingredients Market Share Forecast by Application, 2024 & 2034 (%)
Figure 88 Germany Highly Potent Active Pharmaceutical Ingredients Market Forecast, 2024-2034 (US$ Million, AGR %)
Figure 89 UK Highly Potent Active Pharmaceutical Ingredients Market Forecast, 2024-2034 (US$ Million, AGR %)
Figure 90 France Highly Potent Active Pharmaceutical Ingredients Market Forecast, 2024-2034 (US$ Million, AGR %)
Figure 91 Spain Highly Potent Active Pharmaceutical Ingredients Market Forecast, 2024-2034 (US$ Million, AGR %)
Figure 92 Italy Highly Potent Active Pharmaceutical Ingredients Market Forecast, 2024-2034 (US$ Million, AGR %)
Figure 93 Poland Highly Potent Active Pharmaceutical Ingredients Market Forecast, 2024-2034 (US$ Million, AGR %)
Figure 94 Belgium Highly Potent Active Pharmaceutical Ingredients Market Forecast, 2024-2034 (US$ Million, AGR %)
Figure 95 Russia Highly Potent Active Pharmaceutical Ingredients Market Forecast, 2024-2034 (US$ Million, AGR %)
Figure 96 Rest of Europe Highly Potent Active Pharmaceutical Ingredients Market Forecast, 2024-2034 (US$ Million, AGR %)
Figure 97 Asia Pacific Highly Potent Active Pharmaceutical Ingredients Market Attractiveness Index
Figure 98 Asia Pacific Highly Potent Active Pharmaceutical Ingredients Market by Region, 2024, 2029 & 2034 (US$ Million)
Figure 99 Asia Pacific Highly Potent Active Pharmaceutical Ingredients Market Forecast by Country, 2024-2034 (US$ Million, AGR %)
Figure 100 Asia Pacific Highly Potent Active Pharmaceutical Ingredients Market Share Forecast by Country, 2024 & 2034 (%)
Figure 101 Asia Pacific Highly Potent Active Pharmaceutical Ingredients Market Forecast by Product, 2024-2034 (US$ Million, AGR %)
Figure 102 Asia Pacific Highly Potent Active Pharmaceutical Ingredients Market Share Forecast by Product, 2024 & 2034 (%)
Figure 103 Asia Pacific Highly Potent Active Pharmaceutical Ingredients Market Forecast by Manufacturer Type, 2024-2034 (US$ Million, AGR %)
Figure 104 Asia Pacific Highly Potent Active Pharmaceutical Ingredients Market Share Forecast by Manufacturer Type, 2024 & 2034 (%)
Figure 105 Asia Pacific Highly Potent Active Pharmaceutical Ingredients Market Forecast by Drug Type, 2024-2034 (US$ Million, AGR %)
Figure 106 Asia Pacific Highly Potent Active Pharmaceutical Ingredients Market Share Forecast by Drug Type, 2024 & 2034 (%)
Figure 107 Asia Pacific Highly Potent Active Pharmaceutical Ingredients Market Forecast Dosage Form, 2024-2034 (US$ Million, AGR %)
Figure 108 Asia Pacific Highly Potent Active Pharmaceutical Ingredients Market Share Forecast by Dosage Form, 2024 & 2034 (%)
Figure 109 Asia Pacific Highly Potent Active Pharmaceutical Ingredients Market Forecast by Application, 2024-2034 (US$ Million, AGR %)
Figure 110 Asia Pacific Highly Potent Active Pharmaceutical Ingredients Market Share Forecast by Application, 2024 & 2034 (%)
Figure 111 Japan Highly Potent Active Pharmaceutical Ingredients Market Forecast, 2024-2034 (US$ Million, AGR %)
Figure 112 China Highly Potent Active Pharmaceutical Ingredients Market Forecast, 2024-2034 (US$ Million, AGR %)
Figure 113 India Highly Potent Active Pharmaceutical Ingredients Market Forecast, 2024-2034 (US$ Million, AGR %)
Figure 114 Australia Highly Potent Active Pharmaceutical Ingredients Market Forecast, 2024-2034 (US$ Million, AGR %)
Figure 115 South Korea Highly Potent Active Pharmaceutical Ingredients Market Forecast, 2024-2034 (US$ Million, AGR %)
Figure 116 Singapore Highly Potent Active Pharmaceutical Ingredients Market Forecast, 2024-2034 (US$ Million, AGR %)
Figure 117 Taiwan Highly Potent Active Pharmaceutical Ingredients Market Forecast, 2024-2034 (US$ Million, AGR %)
Figure 118 Rest of Asia Pacific Highly Potent Active Pharmaceutical Ingredients Market Forecast, 2024-2034 (US$ Million, AGR %)
Figure 119 Latin America Highly Potent Active Pharmaceutical Ingredients Market Attractiveness Index
Figure 120 Latin America Highly Potent Active Pharmaceutical Ingredients Market by Region, 2024, 2029 & 2034 (US$ Million)
Figure 121 Latin America Highly Potent Active Pharmaceutical Ingredients Market Forecast by Country, 2024-2034 (US$ Million, AGR %)
Figure 122 Latin America Highly Potent Active Pharmaceutical Ingredients Market Share Forecast by Country, 2024 & 2034 (%)
Figure 123 Latin America Highly Potent Active Pharmaceutical Ingredients Market Forecast by Product, 2024-2034 (US$ Million, AGR %)
Figure 124 Latin America Highly Potent Active Pharmaceutical Ingredients Market Share Forecast by Product, 2024 & 2034 (%)
Figure 125 Latin America Highly Potent Active Pharmaceutical Ingredients Market Forecast by Manufacturer Type, 2024-2034 (US$ Million, AGR %)
Figure 126 Latin America Highly Potent Active Pharmaceutical Ingredients Market Share Forecast by Manufacturer Type, 2024 & 2034 (%)
Figure 127 Latin America Highly Potent Active Pharmaceutical Ingredients Market Forecast by Drug Type, 2024-2034 (US$ Million, AGR %)
Figure 128 Latin America Highly Potent Active Pharmaceutical Ingredients Market Share Forecast by Drug Type, 2024 & 2034 (%)
Figure 129 Latin America Highly Potent Active Pharmaceutical Ingredients Market Forecast Dosage Form, 2024-2034 (US$ Million, AGR %)
Figure 130 Latin America Highly Potent Active Pharmaceutical Ingredients Market Share Forecast by Dosage Form, 2024 & 2034 (%)
Figure 131 Latin America Highly Potent Active Pharmaceutical Ingredients Market Forecast by Application, 2024-2034 (US$ Million, AGR %)
Figure 132 Latin America Highly Potent Active Pharmaceutical Ingredients Market Share Forecast by Application, 2024 & 2034 (%)
Figure 133 Brazil Highly Potent Active Pharmaceutical Ingredients Market Forecast, 2024-2034 (US$ Million, AGR %)
Figure 134 Mexico Highly Potent Active Pharmaceutical Ingredients Market Forecast, 2024-2034 (US$ Million, AGR %)
Figure 135 Argentina Highly Potent Active Pharmaceutical Ingredients Market Forecast, 2024-2034 (US$ Million, AGR %)
Figure 136 Colombia Highly Potent Active Pharmaceutical Ingredients Market Forecast, 2024-2034 (US$ Million, AGR %)
Figure 137 Rest of Latin America Highly Potent Active Pharmaceutical Ingredients Market Forecast, 2024-2034 (US$ Million, AGR %)
Figure 138 Middle East and Africa Highly Potent Active Pharmaceutical Ingredients Market Attractiveness Index
Figure 139 Middle East and Africa Highly Potent Active Pharmaceutical Ingredients Market by Region, 2024, 2029 & 2034 (US$ Million)
Figure 140 Middle East and Africa Highly Potent Active Pharmaceutical Ingredients Market Forecast by Country, 2024-2034 (US$ Million, AGR %)
Figure 141 Middle East and Africa Highly Potent Active Pharmaceutical Ingredients Market Share Forecast by Country, 2024 & 2034 (%)
Figure 142 Middle East and Africa Highly Potent Active Pharmaceutical Ingredients Market Forecast by Product, 2024-2034 (US$ Million, AGR %)
Figure 143 Middle East and Africa Highly Potent Active Pharmaceutical Ingredients Market Share Forecast by Product, 2024 & 2034 (%)
Figure 144 Middle East and Africa Highly Potent Active Pharmaceutical Ingredients Market Forecast by Manufacturer Type, 2024-2034 (US$ Million, AGR %)
Figure 145 Middle East and Africa Highly Potent Active Pharmaceutical Ingredients Market Share Forecast by Manufacturer Type, 2024 & 2034 (%)
Figure 146 Middle East and Africa Highly Potent Active Pharmaceutical Ingredients Market Forecast by Drug Type, 2024-2034 (US$ Million, AGR %)
Figure 147 Middle East and Africa Highly Potent Active Pharmaceutical Ingredients Market Share Forecast by Drug Type, 2024 & 2034 (%)
Figure 148 Middle East and Africa Highly Potent Active Pharmaceutical Ingredients Market Forecast Dosage Form, 2024-2034 (US$ Million, AGR %)
Figure 149 Middle East and Africa Highly Potent Active Pharmaceutical Ingredients Market Share Forecast by Dosage Form, 2024 & 2034 (%)
Figure 150 Middle East and Africa Highly Potent Active Pharmaceutical Ingredients Market Forecast by Application, 2024-2034 (US$ Million, AGR %)
Figure 151 Middle East and Africa Highly Potent Active Pharmaceutical Ingredients Market Share Forecast by Application, 2024 & 2034 (%)
Figure 152 GCC Highly Potent Active Pharmaceutical Ingredients Market Forecast, 2024-2034 (US$ Million, AGR %)
Figure 153 South Africa Highly Potent Active Pharmaceutical Ingredients Market Forecast, 2024-2034 (US$ Million, AGR %)
Figure 154 Rest of MEA Highly Potent Active Pharmaceutical Ingredients Market Forecast, 2024-2034 (US$ Million, AGR %)
Figure 155 Highly Potent Active Pharmaceutical Ingredients Market: Company Share/Ranking, 2023
Figure 156 AbbVie Inc.: Net Revenue, 2017-2023 (US$ Million, AGR%)
Figure 157 AbbVie Inc.: R&D, 2017-2023 (US$ Million, AGR%)
Figure 158 AbbVie Inc.: Regional Market Shares, 2023
Figure 159 AbbVie Inc.: Business Segment Market Shares, 2023
Figure 160 AbbVie Inc.: SWOT Analysis
Figure 161 Bayer AG: Net Revenue, 2017-2023 (US$ Million, AGR%)
Figure 162 Bayer AG: R&D, 2017-2023 (US$ Million, AGR%)
Figure 163 Bayer AG: Regional Market Shares, 2023
Figure 164 Bayer AG: SWOT Analysis
Figure 165 Boehringer Ingelheim International GmbH.: Net Revenue, 2017-2023 (US$ Million, AGR%)
Figure 166 Boehringer Ingelheim International GmbH.: R&D, 2017-2023 (US$ Million, AGR%)
Figure 167 Boehringer Ingelheim International GmbH.: Regional Market Shares, 2023
Figure 168 Boehringer Ingelheim International GmbH.: Business Segment Market Shares, 2023
Figure 169 Boehringer Ingelheim International GmbH.: SWOT Analysis
Figure 170 Bristol Myers Squibb Company.: Net Revenue, 2017-2023 (US$ Million, AGR%)
Figure 171 Bristol Myers Squibb Company.: R&D, 2017-2023 (US$ Million, AGR%)
Figure 172 Bristol Myers Squibb Company: Regional Market Shares, 2023
Figure 173 Bristol Myers Squibb Company.: Business Segment Market Shares, 2023
Figure 174 Bristol Myers Squibb Company.: SWOT Analysis
Figure 175 Cambrex Corporation.: SWOT Analysis
Figure 176 Catalent, Inc : Net Revenue, 2017-2023 (US$ Million, AGR%)
Figure 177 Catalent, Inc : Regional Market Shares, 2023
Figure 178 Catalent, Inc : Business Segment Market Shares, 2023
Figure 179 Catalent, Inc : SWOT Analysis
Figure 180 Cipla Inc.: Net Revenue, 2017-2023 (US$ Million, AGR%)
Figure 181 Cipla Inc.: R&D, 2017-2023 (US$ Million, AGR%)
Figure 182 Cipla Inc.: Regional Market Shares, 2023
Figure 183 Cipla Inc.: Business Segment Market Shares, 2023
Figure 184 Cipla Inc.: SWOT Analysis
Figure 185 Dr. Reddy’s Laboratories.: Net Revenue, 2017-2023 (US$ Million, AGR%)
Figure 186 Dr. Reddy’s Laboratories.: R&D, 2017-2023 (US$ Million, AGR%)
Figure 187 Dr. Reddy’s Laboratories.: Regional Market Shares, 2023
Figure 188 Dr. Reddy’s Laboratories.: Business Segment Market Shares, 2023
Figure 189 Dr. Reddy’s Laboratories.: SWOT Analysis
Figure 190 Eli Lilly and Company.: Net Revenue, 2017-2023 (US$ Million, AGR%)
Figure 191 Eli Lilly and Company.: R&D, 2017-2023 (US$ Million, AGR%)
Figure 192 Eli Lilly and Company.: Regional Market Shares, 2023
Figure 193 Eli Lilly and Company.: Business Segment Market Shares, 2023
Figure 194 Eli Lilly and Company.: SWOT Analysis
Figure 195 F. Hoffmann-La Roche AG.: Net Revenue, 2017-2023 (US$ Million, AGR%)
Figure 196 F. Hoffmann-La Roche AG.: R&D, 2017-2023 (US$ Million, AGR%)
Figure 197 F. Hoffmann-La Roche AG.: Business Segment Market Shares, 2023
Figure 198 F. Hoffmann-La Roche AG.: SWOT Analysis
Figure 199 Merck & Co., Inc.: Net Revenue, 2017-2023 (US$ Million, AGR%)
Figure 200 Merck & Co., Inc.: R&D, 2017-2023 (US$ Million, AGR%)
Figure 201 Merck & Co., Inc.: Regional Market Shares, 2023
Figure 202 Merck & Co., Inc.: Business Segment Market Shares, 2023
Figure 203 Merck & Co., Inc..: SWOT Analysis
Figure 204 Novartis AG.: Net Revenue, 2017-2023 (US$ Million, AGR%)
Figure 205 Novartis AG.: R&D, 2017-2023 (US$ Million, AGR%)
Figure 206 Novartis AG.: Regional Market Shares, 2023
Figure 207 Novartis AG.: Business Segment Market Shares, 2023
Figure 208 Novartis AG.: SWOT Analysis
Figure 209 Pfizer Inc.: Net Revenue, 2017-2023 (US$ Million, AGR%)
Figure 210 Pfizer Inc.: R&D, 2017-2023 (US$ Million, AGR%)
Figure 211 Pfizer Inc.: Regional Market Shares, 2023
Figure 212 Pfizer Inc.: Business Segment Market Shares, 2023
Figure 213 Pfizer Inc.: SWOT Analysis
Figure 214 Sanofi.: Net Revenue, 2017-2023 (US$ Million, AGR%)
Figure 215 Sanofi.: R&D, 2017-2023 (US$ Million, AGR%)
Figure 216 Sanofi.: SWOT Analysis
Figure 217 Teva Pharmaceutical Industries Ltd.: Net Revenue, 2017-2023 (US$ Million, AGR%)
Figure 218 Teva Pharmaceutical Industries Ltd.: R&D, 2017-2023 (US$ Million, AGR%)
Figure 219 Teva Pharmaceutical Industries Ltd.: Regional Market Shares, 2023
Figure 220 Teva Pharmaceutical Industries Ltd.: SWOT Analysis
ページTOPに戻る
-
オリゴヌクレオチド合成市場(第3版):産業動向と世界予測、2035年まで - 応用分野(研究・診断、治療)、合成される製品の種類(医薬品原薬、最終製剤)、合成されるオリゴヌクレオチドの種類(アンチセンス、DNA、siRNA、その他のオリゴヌクレオチド)、事業規模(臨床、商業)、治療領域(心血管疾患、遺伝性疾患、肝疾患、希少疾患、その他の疾患)、エンドユーザー(製薬/バイオ製薬会社、学術/研究機関、病院)、企業規模(小規模、中規模、大規模/超大規模)、主要地域(北米、欧州、アジア太平洋地域、その他の地域)
-
医薬品有効成分の世界市場 - 2023-2030
-
中東・北アフリカ地域 医薬品原体(API)市場
-
Saudi Arabia Contract Manufacturing Organizations Market, By Type (Active Pharmaceutical Ingredients (API) Manufacturing, Finished Dosage Formulation (FDF) Development & Manufacturing, Secondary Packaging), By End User (Big Pharmaceuticals, Small and Mid-Size Pharmaceuticals, Generic Pharmaceutical Companies, Others), By Region, Competition Forecast & Opportunities, 2027
-
医薬品有効成分市場タイプ別(革新的、ジェネリック)、合成タイプ別(合成、バイオ)、用途別(感染症、腫瘍、循環器疾患、糖尿病、疼痛管理、慢性呼吸器疾患、その他)、地域別に分類 ~2019~2020年の市場規模、シェア&トレンド、2030年までの予測に関する世界規模の分析
-
高性能活性医薬品成分(HPAPI)の世界市場の現状、動向、COVID-19影響レポート2021年版
-
医薬品有効成分(API)の世界市場 - 薬剤タイプ(ジェネリック、革新的)、合成(合成、バイオテクノロジー)、用途別、地域別、国別の分析(2021年版)。COVID-19の影響を考慮した市場インサイトと予測(2021年~2026年)
-
China Sterile Active Pharmaceutical Ingredients Market Report & Forecast 2021-2027
-
世界および日本のDuloxetine原薬(API)市場の洞察、2027年までの予測
-
世界のナプロキセン原薬市場の現状、動向、COVID-19インパクトレポート2021年版
よくあるご質問
Visiongain社はどのような調査会社ですか?
英国の調査会社ヴィジョンゲイン社(Visiongain)は、通信とエネルギーのほか、自動車や化学・医薬品、金属など、広範な市場を対象に調査を行っています。自動車市場については、市場全般に関する調査のほ... もっと見る
調査レポートの納品までの日数はどの程度ですか?
在庫のあるものは速納となりますが、平均的には 3-4日と見て下さい。
但し、一部の調査レポートでは、発注を受けた段階で内容更新をして納品をする場合もあります。
発注をする前のお問合せをお願いします。
注文の手続きはどのようになっていますか?
1)お客様からの御問い合わせをいただきます。
2)見積書やサンプルの提示をいたします。
3)お客様指定、もしくは弊社の発注書をメール添付にて発送してください。
4)データリソース社からレポート発行元の調査会社へ納品手配します。
5) 調査会社からお客様へ納品されます。最近は、pdfにてのメール納品が大半です。
お支払方法の方法はどのようになっていますか?
納品と同時にデータリソース社よりお客様へ請求書(必要に応じて納品書も)を発送いたします。
お客様よりデータリソース社へ(通常は円払い)の御振り込みをお願いします。
請求書は、納品日の日付で発行しますので、翌月最終営業日までの当社指定口座への振込みをお願いします。振込み手数料は御社負担にてお願いします。
お客様の御支払い条件が60日以上の場合は御相談ください。
尚、初めてのお取引先や個人の場合、前払いをお願いすることもあります。ご了承のほど、お願いします。
データリソース社はどのような会社ですか?
当社は、世界各国の主要調査会社・レポート出版社と提携し、世界各国の市場調査レポートや技術動向レポートなどを日本国内の企業・公官庁及び教育研究機関に提供しております。
世界各国の「市場・技術・法規制などの」実情を調査・収集される時には、データリソース社にご相談ください。
お客様の御要望にあったデータや情報を抽出する為のレポート紹介や調査のアドバイスも致します。
|
|

