不妊治療薬&デバイス市場レポート:2024-2034
Infertility Drugs & Devices Market Report 2024-2034
レポート詳細
不妊治療薬&デバイス市場レポート 2024-2034年 :本レポートは、業界とその基礎となるダイナミクスをより良く理解したい場合、新たな収益ポケットを目指す大手企業にとって貴重なもの... もっと見る
※上記価格は部署ライセンス(Departmental licence)価格です。
その他の価格についてはデータリソースまでお問合せください。
日本語のページは自動翻訳を利用し作成しています。
実際のレポートは英文のみでご納品いたします。

|

|
サマリー
レポート詳細
不妊治療薬&デバイス市場レポート 2024-2034年:本レポートは、業界とその基礎となるダイナミクスをより良く理解したい場合、新たな収益ポケットを目指す大手企業にとって貴重なものとなるでしょう。異業種への進出や新規地域での既存事業の拡大を目指す企業にも有用です。
高額な治療費
1回の体外受精サイクルは、センターや患者のニーズにもよるが、15,000米ドルから30,000米ドルである。薬代がこれらの費用の35%を占め、受精卵の遺伝子検査や外科的処置などのその他の追加費用がさらに費用を増加させる。また、費用は実施される周期の数にも左右され、その幅は1~6周期に及び、患者に大きな経済的負担を強いることになる。このような高額な費用は、患者の使用や適切な治療の選択肢を制限し、市場の成長を制限する。一方、特に米国では保険が適用されるかどうかは、雇用主が提供する保険プランに依存する。精液分析は通常保険適用となる。しかし、胚移植、ミニ体外受精の費用、完全体外受精の費用、ドナー卵子を使用する費用など、治療の主要部分は保険で完全にカバーされていない。アメリカでは、雇用主が不妊治療をカバーすることを望む声が高まっています。
支持されない政府規制
資金援助、助成金、政策、補助金、保険といった形での政府の規制は、ARTの導入に大きな影響を与える。こうした支援制度が欠如していると、治療サービスへのアクセスが制限されるため、こうした臨床サービスの導入は限定的なものとなる。例えば日本では、少子化対策の一環として、2022年4月からART治療が健康保険の適用対象となった。それ以前は、日本では低所得者に焦点が当てられていたため、対象となる夫婦のみがART治療の一部助成を受けていた。韓国や台湾でも、ART治療への助成について同様の基準が設けられている。米国では、民間保険会社が不妊治療費の一部または全額を負担することを法律で認めているのは15州のみであるが、その種類は州によって異なり、ARTの払い戻しを認めているのは8州のみである。ヨーロッパのほとんどの国では、卵子と精子を含む配偶子提供を認めている。精子提供はEUの20カ国で認められており、卵子提供はEU27カ国のうち17カ国で認められている。これらの規制はARTの導入を制限しており、それゆえ市場成長の重大な障壁となっている。
市場調査レポートを購入する前にすべき質問とは?
-
不妊治療薬&デバイス市場はどのように進化しているのか?
-
不妊治療薬&デバイス市場の促進要因と抑制要因は何か?
-
不妊治療薬&デバイスの各サブマーケットセグメントは予測期間中にどのように成長し、2034年にどれくらいの収益を占めるようになるのか?
-
2024年から2034年にかけて、不妊治療薬&デバイスの各サブマーケットの市場シェアはどのように推移するのか?
-
2024年から2034年までの市場全体の主な牽引役は何か?
-
主要な不妊治療薬&デバイス市場はマクロ経済の動きに大枠で追随するのか、それとも個々の国市場が他を凌駕するのか?
-
2034年までに各国市場のシェアはどのように変化し、2034年に市場をリードするのはどの地域か?
-
主要プレイヤーは誰で、予測期間中の見通しは?
-
これらの主要企業の不妊治療薬&デバイスプロジェクトは?
-
2024年から2034年の間に、業界はどのように発展していくのか?現在および今後10年間に実施される不妊治療薬&デバイスのプロジェクトにはどのような意味があるのか?
-
不妊治療薬&デバイス市場をさらに拡大するために、製品化の必要性は高まっているのか?
-
不妊治療薬&デバイス市場はどこへ向かっているのか?
-
新製品やサービスラインに対する最適な投資オプションは何か?
-
企業を新たな成長軌道に乗せるための重要な展望とは?
このことが不妊治療薬&デバイス市場に現在、そして今後10年間でどのような影響を与えるかを見極める必要がある:
-
351ページに及ぶレポートには、156の表と245の図表が掲載されている。
-
このレポートでは、業界の主要な収益性の高い分野に焦点を当てているため、今すぐにターゲットにすることができます。
-
世界、地域、国の売上高と成長に関する詳細な分析が含まれている。
-
競合他社が成功した主なトレンド、変化、収益予測をハイライトします。
2034年までの予測やその他の分析から、商業的な展望が明らかになる
-
2034年までの収益予測に加え、最近の実績、成長率、市場シェアも提供している。
-
ビジネスの展望や展開など、独自の分析が掲載されている。
-
質的分析(市場ダイナミクス、促進要因、機会、阻害要因、課題など)、コスト構造、不妊治療薬・デバイスの価格上昇の影響、最近の動向をご覧いただけます。
レポート対象セグメント
製品
・医薬品
- 性腺刺激ホルモン
- アロマターゼ阻害剤
- 選択的エストロゲン受容体モジュレーター(SERMs)
- ドーパミン作動薬
- その他の薬物クラス
・機器
- 顕微鏡
- イメージング・システム
- 精子分析システム
- 卵子吸引ポンプ
- マイクロマニピュレーターシステム
- インキュベーター
- ガス分析装置
- レーザーシステム
- クライオシステム
- 精子分離装置
・メディア&消耗品
・アクセサリー
手順
・生殖補助医療
- 体外受精
- 卵細胞質内精子注入法
- 代理出産
・人工授精
- 子宮内
- 子宮頸管内
- 子宮腔内
・不妊手術
- 腹腔鏡検査
- 子宮鏡検査
- 精巣摘出術
- 腹腔鏡手術
- 卵管結紮術
- マイクロ外科的再建術
・その他の不妊治療
患者
最終用途
-
不妊治療センター
-
病院&外科クリニック
-
クライオバンク
-
研究機関
世界市場全体と各分野の売上予測に加え、5つの地域と16の主要国市場の売上予測も掲載しています:
北米
欧州
-
ドイツ
-
英国
-
フランス
-
スペイン
-
イタリア
-
その他の欧州地域
アジア太平洋
-
中国
-
日本
-
インド
-
オーストラリア
-
韓国
-
その他のアジア太平洋地域
ラテンアメリカ
MEA
また、本レポートでは、不妊治療薬&デバイス市場の2024年から2034年までの主要企業のプロファイルと、これらの企業の事業のこのセグメントに焦点を当てている。
報告書に掲載されている主要企業
-
Abbott Laboratories
-
Esco Micro Pte Ltd
-
Ferring BV
-
FUJIFILM Irvine Scientific
-
Hamilton Thorne
-
Merck KGaA
-
The Baker Company
-
The Cooper Companies, Inc.
-
Thermo Fisher Scientific
-
Vitrolife
2024年から2034年までの不妊治療薬&デバイス市場全体の世界売上高(金額ベース)は、2024年に59億米ドルを突破する。2034年まで力強い収益成長を予測。当調査では、最も大きな可能性を秘めた企業を特定しています。彼らの能力、進歩、商業的展望を発見し、一歩先を行くお手伝いをします。
不妊治療薬&デバイス市場、2024-2034年レポートはどのように役立ちますか?
要約すると、350ページを超えるこのレポートは、以下の知識を提供する:
-
不妊治療薬&デバイス市場の2024年から2034年までの収益予測 製品、手技、患者、最終用途の各予測を世界および地域レベルで掲載 - 業界の将来性を発見し、投資と収益に最も有利な場所を見つけます。
-
5つの地域と16の主要国市場の2034年までの収益予測 - 北米、欧州、アジア太平洋、中南米、MEAの不妊治療薬&デバイス市場の2024年から2034年までの市場予測をご覧ください。また、米国、カナダ、メキシコ、ブラジル、ドイツ、フランス、英国、イタリア、中国、インド、日本、オーストラリアなどの主要国の市場も予測しています。
-
2024年から2034年までの不妊治療薬&デバイス市場に関わる主要企業10社の企業プロファイルを含む。
独自の予測による定量的・定性的分析をご覧ください。私たちのレポートだけに含まれる情報を入手し、貴重なビジネスインテリジェンスで情報を得ることができます。
他にはない情報
私たちの新しいレポートがあれば、知識に遅れをとったり、チャンスを逃したりする可能性が低くなります。Visiongainの調査レポートが貴社の調査、分析、意思決定にどのように役立つかをご覧ください。Visiongainのこの調査レポートは、不妊治療薬&デバイス市場(2024年~2034年)の商業分析を必要とするすべての方、市場のリーディングカンパニーを対象としています。データ、トレンド、予測をご覧いただけます。
ページTOPに戻る
目次
1.レポート概要
1.1 調査の目的
1.2 不妊治療薬・機器市場の紹介
1.3 本レポートの内容
1.4 本レポートを読むべき理由
1.5 本分析レポートが回答する主な質問は以下の通り:
1.6 本レポートの対象者
1.7 方法論
1.7.1 市場の定義
1.7.2 市場評価・予測手法
1.7.3 データの検証
1.8 よくある質問(FAQ)
1.9 関連レポート
1.10 Visiongainについて
2 エグゼクティブ・サマリー
3 市場概要
3.1 主要な調査結果
3.2 市場ダイナミクス
3.3 影響分析
3.3.1 市場促進要因
3.3.2 市場抑制要因
3.3.3 市場機会
3.4 サプライチェーン分析
3.5 規制の枠組み
3.6 新興市場とメガトレンド
3.7 ポーターのファイブフォース分析
3.7.1 供給者パワー
3.7.2 買い手の力
3.7.3 競争力
3.7.4 代替品の脅威
3.7.5 新規参入の脅威
3.8 PEST分析
4 世界の不妊治療薬&デバイス市場分析:製品別
4.1 主要な調査結果
4.2 製品セグメント 市場魅力度指数
4.3 製品別不妊治療薬&デバイス市場規模の推定と予測
4.4 医薬品
4.4.1 2024〜2034年の地域別医薬品市場予測(US$ Mn)
4.4.2 2024年および2034年の地域別医薬品市場シェア(%)
4.4.3 医薬品のタイプ別市場予測、2024〜2034年 (US $ Mn)
4.4.4 医薬品市場タイプ別シェア、2024年および2034年 (%)
4.5 機器
4.5.1 機器の地域別市場予測、2024〜2034年 (US$ Mn)
4.5.2 地域別機器市場シェア、2024年および2034年 (%)
4.5.3 機器のタイプ別市場予測、2024〜2034年 (US$ Mn)
4.5.4 機器のタイプ別市場シェア、2024年および2034年 (%)
4.6 メディアと消耗品
4.6.1 メディア・消耗品市場予測、2024年〜2034年 (US$ Mn)
4.6.2 メディア&消耗品市場地域別シェア、2024年および2034年 (%)
4.7 アクセサリー
4.7.1 アクセサリー市場地域別予測、2024年〜2034年 (US$ Mn)
4.7.2 アクセサリー市場地域別シェア、2024年および2034年 (%)
5 不妊治療薬&デバイス市場分析:手順別
5.1 主要調査結果
5.2 手技セグメント 市場魅力度指数
5.3 手技別不妊治療薬&デバイス市場規模推定と予測
5.4 手技別不妊治療薬&デバイス市場シェア、2024年・2034年
5.5 生殖補助医療技術
5.5.1 生殖補助医療技術の地域別市場予測、2024年〜2034年 (US$ Mn)
5.5.2 生殖補助医療技術の地域別市場シェア、2024年・2034年(%)
5.5.3 生殖補助医療技術のタイプ別市場予測、2024年〜2034年 (US$ Mn)
5.5.4 生殖補助医療技術のタイプ別市場シェア、2024年および2034年 (%)
5.6 人工授精
5.6.1 人工授精の市場予測、2024〜2034年(US$ Mn)
5.6.2 人工授精市場の地域別シェア、2024年および2034年 (%)
5.6.3 人工授精のタイプ別市場予測、2024年~2034年 (US$ Mn)
5.6.4 人工授精のタイプ別市場シェア、2024年および2034年 (%)
5.7 不妊手術
5.7.1 不妊手術の地域別市場予測、2024〜2034年(US$ Mn)
5.7.2 不妊手術の地域別市場シェア、2024年および2034年 (%)
5.7.3 不妊手術のタイプ別市場予測、2024年〜2034年 (US $ Mn)
5.7.4 不妊手術のタイプ別市場シェア、2024年および2034年 (%)
5.8 その他の不妊治療手順
5.8.1 その他の不妊治療手技の地域別市場予測、2024〜2034年 (US$ Mn)
5.8.2 その他の不妊治療手技の地域別市場シェア、2024年および2034年 (%)
6 不妊治療薬&デバイス市場分析:患者別
6.1 主な調査結果
6.2 患者セグメント 市場魅力度指数
6.3 不妊治療薬&デバイスの患者別市場規模推定と予測
6.4 患者別不妊治療薬&デバイス市場シェア、2024年、2029年、2034年
6.5 女性
6.5.1 2024〜2034年の地域別女性市場予測(US$ Mn)
6.5.2 2024年、2034年の地域別女性市場シェア(%)
6.6 男性
6.6.1 2024〜2034年の地域別男性市場予測(US$ Mn)
6.6.2 地域別男性市場シェア、2024年および2034年(%)
7 不妊治療薬&デバイス市場分析:用途別
7.1 主要調査結果
7.2 最終用途セグメント 市場魅力度指数
7.3 不妊治療薬&デバイスのエンドユーザー別市場規模推定と予測
7.4 不妊治療薬&デバイス市場:エンドユーザー別シェア、2024年、2029年、2034年
7.5 不妊治療センター
7.5.1 不妊治療センター市場地域別予測、2024年〜2034年(US$ Mn)
7.5.2 不妊治療センターの地域別市場シェア、2024年、2034年(%)
7.6 病院と外科クリニック
7.6.1 病院・外科クリニックの地域別市場予測、2024〜2034年(US$ Mn)
7.6.2 病院・外科クリニックの地域別市場シェア、2024年および2034年 (%)
7.7 クライオバンク
7.7.1 クライオバンクの地域別市場予測、2024〜2034年(US$ Mn)
7.7.2 クライオバンクの地域別市場シェア、2024年および2034年(%)
7.8 研究機関
7.8.1 研究機関の地域別市場予測、2024-2034年(US$ Mn)
7.8.2 研究機関の地域別市場シェア、2024年および2034年 (%)
8 不妊治療薬&デバイス分析:地域別
8.1 主要な調査結果
8.2 地域別市場規模の推定と予測
9 北米の不妊治療薬&デバイス市場分析
9.1 主要な調査結果
9.2 北米の不妊治療薬&デバイス市場魅力度指数
9.3 北米の不妊治療薬&デバイス国別市場、2024年、2029年、2034年 (US$ Mn)
9.4 北米の不妊治療薬&デバイス市場規模推定と予測:国別
9.5 北米の不妊治療薬&デバイス市場規模推定と予測:製品別
9.6 北米の不妊治療薬&デバイス市場規模推定と予測:医薬品別
9.7 北米の不妊治療薬&デバイス市場規模推定と予測:機器別
9.8 北米の不妊治療薬&デバイス市場規模推定と予測:手順別
9.9 北米の不妊治療薬&デバイス市場規模推定と予測:患者別
9.10 北米の不妊治療薬&デバイス市場規模推定と予測:エンドユーザー別
9.11 米国
9.11.1 米国の不妊治療薬&デバイス市場:製品別
9.12 カナダ
9.12.1 カナダの不妊治療薬&デバイス市場:製品別
10 欧州の不妊治療薬&デバイス市場分析
10.1 主要な調査結果
10.2 欧州不妊治療薬&デバイス市場魅力度指数
10.3 欧州の不妊治療薬&デバイス国別市場、2024年、2029年、2034年 (US$ Mn)
10.4 欧州の不妊治療薬&デバイス市場規模推定と予測:国別
10.5 欧州の不妊治療薬&デバイス市場規模推定と予測:製品別
10.6 欧州の不妊治療薬&デバイス市場規模推定と予測:医薬品別
10.7 欧州の不妊治療薬&デバイス市場規模推定と予測:機器別
10.8 欧州の不妊治療薬&デバイス市場規模推定と予測:手順別
10.9 欧州の不妊治療薬&デバイス市場規模推定と予測:患者別
10.10 欧州の不妊治療薬&デバイス市場規模推定と予測:用途別
10.11 ドイツ
10.11.1 ドイツの不妊治療薬&デバイス市場:製品別
10.12 イギリス
10.12.1 イギリスの不妊治療薬&デバイス市場:製品別
10.13 フランス
10.13.1 フランスの不妊治療薬&デバイス市場:製品別
10.14 イタリア
10.14.1 イタリアの不妊治療薬&デバイス市場:製品別
10.15 スペイン
10.15.1 スペインの不妊治療薬&デバイス市場:製品別
10.16 その他の地域
10.16.1 欧州のその他の地域:不妊治療薬&デバイス市場:製品別
11 アジア太平洋地域の不妊治療薬&デバイス市場分析
11.1 主要な調査結果
11.2 アジア太平洋地域の不妊治療薬&デバイス市場魅力度指数
11.3 アジア太平洋地域の不妊治療薬&デバイス国別市場、2024年、2029年、2034年 (US$ Mn)
11.4 アジア太平洋地域の不妊治療薬&デバイス市場規模推定と予測:国別
11.5 アジア太平洋地域の不妊治療薬&デバイス市場規模推定と予測:製品別
11.6 アジア太平洋地域の不妊治療薬&デバイス市場規模推定と予測:薬剤別
11.7 アジア太平洋地域の不妊治療薬&デバイス市場規模推定と予測:機器別
11.8 アジア太平洋地域の不妊治療薬&デバイス市場規模推定と予測:手順別
11.9 アジア太平洋地域の不妊治療薬&デバイス市場規模推定と予測:患者別
11.10 アジア太平洋地域の不妊治療薬&デバイス市場規模推定と予測:用途別
11.11 日本
11.11.1 日本の不妊治療薬&デバイス市場:製品別
11.12 中国
11.12.1 中国の不妊治療薬&デバイス市場:製品別
11.13 インド
11.13.1 インドの不妊治療薬&デバイス市場:製品別
11.14 韓国
11.14.1 韓国の不妊治療薬&デバイス市場:製品別
11.15 オーストラリア
11.15.1 オーストラリアの不妊治療薬&デバイス市場:製品別
11.16 その他の地域
11.16.1 APACのその他の地域:不妊治療薬&デバイス市場:製品別
12 ラテンアメリカの不妊治療薬&デバイス市場分析
12.1 主要な調査結果
12.2 ラテンアメリカの不妊治療薬&デバイス市場魅力度指数
12.3 ラテンアメリカの不妊治療薬&デバイス国別市場、2024年、2029年、2034年 (US$ Mn)
12.4 ラテンアメリカの不妊治療薬&デバイス市場規模推定と予測:国別
12.5 ラテンアメリカの不妊治療薬&デバイス市場規模推定と予測:製品別
12.6 ラテンアメリカの不妊治療薬&デバイス市場規模推定と予測:医薬品別
12.7 ラテンアメリカの不妊治療薬&デバイス市場規模推定と予測:機器別
12.8 ラテンアメリカの不妊治療薬&デバイス市場規模推定と予測:手技別
12.9 ラテンアメリカの不妊治療薬&デバイス市場規模推定と予測:患者別
12.10 ラテンアメリカの不妊治療薬&デバイス市場規模推定と予測:最終用途別
12.11ブラジル
12.11.1 ブラジルの不妊治療薬&デバイス市場:製品別
12.12メキシコ
12.12.1メキシコの不妊治療薬&デバイス市場:製品別
12.13 その他のラテンアメリカ
12.13.1 その他のラテンアメリカの不妊治療薬&デバイス市場:製品別
13 MEAの不妊治療薬&デバイス市場分析
13.1 主要な調査結果
13.2 MEA不妊治療薬&デバイス市場魅力度指数
13.3 MEAの不妊治療薬&デバイス国別市場、2024年、2029年、2034年(US$ Mn)
13.4 MEAの不妊治療薬&デバイス市場規模推定と予測:国別
13.5 MEAの不妊治療薬&デバイス市場規模推定と予測:製品別
13.6 MEAの不妊治療薬&デバイス市場規模推定と予測:医薬品別
13.7 MEAの不妊治療薬&デバイス市場規模推定と予測:機器別
13.8 MEAの不妊治療薬&デバイス市場規模推定と予測:処置別
13.9 MEAの不妊治療薬&デバイス市場規模推定と予測:患者別
13.10 MEAの不妊治療薬&デバイス市場規模推定と予測:最終用途別
13.11 南アフリカ
13.11.1 南アフリカの不妊治療薬&デバイス市場:製品別
13.12 GCC
13.12.1 GCCの不妊治療薬&デバイス市場:製品別
13.13 その他のMEA
13.13.1 MEAのその他の地域不妊治療薬&デバイス市場:製品別
14 競争環境
14.1 企業ランキング分析
14.2 主要事業戦略分析
15 会社概要
15.1 The Cooper Companies, Inc.
15.1.1 会社概要
15.1.2 会社概要
15.1.3 財務分析
15.1.4 製品ベンチマーク
15.1.5 戦略的展望
15.1.6 SWOT分析
15.2 Vitrolife
15.2.1 会社概要
15.2.2 会社概要
15.2.3 財務分析
15.2.4 製品ベンチマーク
15.2.5 戦略的展望
15.3 Thermo Fisher Scientific
15.3.1 会社概要
15.3.2 会社概要
15.3.3 財務分析
15.3.4 製品ベンチマーク
15.3.5 戦略的展望
15.4 Hamilton Thorne
15.4.1 会社概要
15.4.2 会社概要
15.4.3 財務分析
15.4.4 製品ベンチマーク
15.4.5 戦略的展望
15.5 Esco Micro Pte Ltd
15.5.1 会社概要
15.5.2 会社概要
15.5.3 製品ベンチマーク
15.5.4 戦略的展望
15.6 FUJIFILM Irvine Scientific
15.6.1 会社概要
15.6.2 会社概要
15.6.3 財務分析
15.6.4 製品ベンチマーク
15.6.5 戦略的展望
15.6.6 SWOT分析
15.7 The Baker Company
15.7.1 会社概要
15.7.2 会社概要
15.7.3 製品ベンチマーク
15.7.4 戦略的展望
15.8 Merck KGaA
15.8.1 会社概要
15.8.2 会社概要
15.8.3 財務分析
15.8.4 製品ベンチマーク
15.8.5 戦略的展望
15.9 Ferring BV
15.9.1 会社概要
15.9.2 会社概要
15.9.3 製品ベンチマーク
15.9.4 戦略的展望
15.9.5 SWOT分析
15.10 Abbott
15.10.1 会社概要
15.10.2 会社概要
15.10.3 財務分析
15.10.4 製品ベンチマーク
16 結論と提言
16.1 Visiongainの結論
16.2 市場プレイヤーへの提言
ページTOPに戻る
図表リスト
表の一覧
表1 不妊治療薬・機器市場スナップショット、2024〜2034年(百万米ドル、CAGR)
表2 不妊治療薬・デバイス製品市場、2024〜2034年(百万米ドル、AGR (%)、CAGR (%)
表3 薬剤市場:地域別、2024-2034年(100万米ドル、AGR (%)、CAGR (%)
表4 医薬品市場:タイプ別、2024-2034年(100万米ドル、AGR (%)、CAGR (%)
表5 ゴナドトロピン市場、2024-2034年(100万米ドル、AGR (%)、CAGR (%)
表6 アロマターゼ阻害剤市場、2024-2034年(100万米ドル、AGR (%)、CAGR (%)
表7 選択的エストロゲン受容体モジュレーター市場、2024-2034年(100万米ドル、AGR (%)、CAGR (%)
表8 ドパミン作動薬市場、2024-2034年(100万米ドル、AGR (%)、CAGR (%)
表9 その他の薬物クラス市場、2024-2034年 (US $ Mn, AGR (%), CAGR (%))
表10 機器市場、地域別、2024-2034年 (US$ Mn, AGR (%), CAGR (%))
表11 機器市場:タイプ別、2024-2034年 (US$ Mn, AGR (%), CAGR (%))
表12 顕微鏡市場、2024-2034年 (US$ Mn, AGR (%), CAGR (%))
表13 イメージングシステム市場、2024-2034年 (US$ Mn, AGR (%), CAGR (%))
表14 精子分析システム市場、2024-2034年 (US$ Mn, AGR (%), CAGR (%))
表15 卵子吸引ポンプ市場、2024-2034年(100万米ドル、AGR (%)、CAGR (%)
表16 マイクロマニピュレーターシステム市場、2024-2034年 (US$ Mn, AGR (%), CAGR (%))
表17 インキュベーター市場、2024-2034年 (US$ Mn, AGR (%), CAGR (%))
表18 ガス分析器市場、2024-2034年 (US$ Mn, AGR (%), CAGR (%))
表19 レーザーシステム市場、2024-2034年 (US$ Mn, AGR (%), CAGR (%))
表20 凍結システム市場、2024-2034年(100万米ドル、AGR (%)、CAGR (%)
表21 精子分離装置市場、2024-2034年(100万米ドル、AGR (%)、CAGR (%)
表22 メディア・消耗品市場:地域別、2024-2034年 (US$ Mn, AGR (%), CAGR (%))
表23 アクセサリー市場:地域別 2024-2034 (US$ Mn, AGR (%), CAGR (%))
表24 不妊治療薬・器具市場、2024-2034年 (百万米ドル、AGR (%)、CAGR (%))
表25 生殖補助医療技術市場:地域別、2024-2034年(100万米ドル、AGR (%)、CAGR (%)
表26 生殖補助医療市場:タイプ別、2024-2034年(100万米ドル、AGR (%)、CAGR (%)
表27 体外受精市場、2024-2034年(100万米ドル、AGR (%)、CAGR (%)
表28 卵細胞質内精子注入法市場、2024-2034年(100万米ドル、AGR (%)、CAGR (%)
表29 代理出産市場、2024-2034年(100万米ドル、AGR (%)、CAGR (%)
表30 人工授精市場:地域別、2024-2034年(100万米ドル、AGR (%)、CAGR (%)
表31 人工授精市場:タイプ別、2024-2034年(100万米ドル、AGR (%)、CAGR (%)
表32 子宮内人工授精市場、2024-2034年(100万米ドル、AGR (%)、CAGR (%)
表33 子宮頸管内市場、2024-2034年(100万米ドル、AGR (%)、CAGR (%)
表34 子宮頸管内市場、2024-2034年(100万米ドル、AGR (%)、CAGR (%)
表35 不妊手術市場:地域別、2024-2034年(100万米ドル、AGR (%)、CAGR (%)
表36 不妊手術市場:タイプ別、2024-2034年(100万米ドル、AGR (%)、CAGR (%)
表37 腹腔鏡検査市場:2024-2034年(100万米ドル、AGR (%)、CAGR (%)
表38 子宮鏡検査市場、2024-2034年 (US$ Mn, AGR (%), CAGR (%))
表39 精巣摘出術市場、2024-2034年 (US$ Mn, AGR (%), CAGR (%))
表40 腹腔鏡手術市場、2024-2034年(100万米ドル、AGR (%)、CAGR (%)
表41 卵管結紮逆手術市場、2024-2034年(100万米ドル、AGR (%)、CAGR (%)
表42 マイクロサージェリーによる再建市場、2024-2034年(100万米ドル、AGR (%)、CAGR (%)
表43 その他の不妊治療手技市場:地域別、2024-2034年(100万米ドル、AGR (%)、CAGR (%)
表44 不妊治療薬&デバイス患者市場:2024-2034年(100万米ドル、AGR (%)、CAGR (%)
表45 女性市場:地域別、2024-2034年(100万米ドル、AGR (%)、CAGR (%)
表46 男性市場:地域別、2024-2034年(100万米ドル、AGR (%)、CAGR (%)
表47 不妊治療薬・機器エンドユース市場:2024-2034年(100万米ドル、AGR (%)、CAGR (%)
表48 不妊治療センター市場(地域別):2024-2034年(100万米ドル、AGR (%)、CAGR (%)
表49 病院・外科クリニック市場:地域別、2024-2034年(100万米ドル、AGR (%)、CAGR (%)
表50 クライオバンク市場:地域別、2024-2034年 (US$ Mn, AGR (%), CAGR (%))
表51 研究機関市場:地域別 2024-2034 (US$ Mn, AGR (%), CAGR (%))
表52 不妊治療薬・デバイス市場:地域別 2024-2034 (US$ Mn, AGR (%), CAGR (%))
表53 北米不妊治療薬・デバイス市場:国別、2024-2034年(100万米ドル、AGR (%)、CAGR (%)
表54 北米不妊治療薬・デバイス製品市場:2024-2034年(100万米ドル、AGR (%)、CAGR (%)
表55 北米不妊治療薬市場:2024-2034年(100万米ドル、AGR (%)、CAGR (%)
表56 北米不妊治療機器市場:2024-2034年(100万米ドル、AGR (%)、CAGR (%)
表57 北米不妊治療薬・機器市場:2024-2034年(100万米ドル、AGR (%)、CAGR (%)
表58 北米の患者市場、2024-2034年(100万米ドル、AGR (%)、CAGR (%)
表59 北米不妊治療薬・機器エンドユーザー市場:2024-2034年(100万米ドル、AGR (%)、CAGR (%)
表60 米国不妊治療薬・機器市場:2024-2034年(100万米ドル、AGR (%)、CAGR (%)
表61 米国不妊治療薬・デバイス製品市場:2024-2034年(100万米ドル、AGR (%)、CAGR (%)
表62 カナダの不妊治療薬・デバイス市場:2024-2034年(100万米ドル、AGR (%)、CAGR (%)
表63 カナダの不妊治療薬・デバイス製品市場:2024-2034年(100万米ドル、AGR (%)、CAGR (%)
表64 欧州不妊治療薬・デバイス市場:国別、2024-2034年(100万米ドル、AGR (%)、CAGR (%)
表65 欧州不妊治療薬・デバイス製品市場:2024-2034年(100万米ドル、AGR (%)、CAGR (%)
表66 欧州不妊治療薬市場:2024-2034年(100万米ドル、AGR (%)、CAGR (%)
表67 欧州の不妊治療機器市場、2024-2034年 (US $ Mn, AGR (%), CAGR (%))
表68 欧州の不妊治療薬・機器市場、2024-2034年 (US $ Mn, AGR (%), CAGR (%))
表69 欧州の患者市場、2024-2034年(100万米ドル、AGR (%)、CAGR (%)
表70 欧州不妊治療薬・器具市場、2024-2034年 (単位:百万米ドル、AGR (%)、CAGR (%)
表71 ドイツの不妊治療薬・デバイス市場:2024-2034年(100万米ドル、AGR (%)、CAGR (%)
表72 ドイツの不妊治療薬・デバイス製品市場:2024-2034年(100万米ドル、AGR (%)、CAGR (%)
表73 英国不妊治療薬・デバイス市場:2024-2034年(100万米ドル、AGR(%)、CAGR(%)
表74 英国不妊治療薬・デバイス製品市場:2024-2034年(100万米ドル、AGR (%)、CAGR (%)
表75 フランスの不妊治療薬・デバイス市場:2024-2034年(100万米ドル、AGR (%)、CAGR (%)
表76 フランスの不妊治療薬・デバイス製品市場:2024-2034年(100万米ドル、AGR (%)、CAGR (%)
表77 イタリアの不妊治療薬・デバイス市場:2024-2034年(100万米ドル、AGR (%)、CAGR (%)
表78 イタリアの不妊治療薬・デバイス製品市場:2024-2034年(100万米ドル、AGR (%)、CAGR (%)
表79 スペイン不妊治療薬・デバイス市場:2024-2034年(100万米ドル、AGR (%)、CAGR (%)
表80 スペイン不妊治療薬・デバイス製品市場:2024-2034年(100万米ドル、AGR (%)、CAGR (%)
表81 欧州の不妊治療薬・デバイス市場:2024-2034年(100万米ドル、AGR (%)、CAGR (%)
表82 欧州残りの不妊治療薬・デバイス製品市場:2024-2034年(100万米ドル、AGR (%)、CAGR (%)
表83 アジア太平洋地域の不妊治療薬・デバイス市場:国別、2024-2034年(100万米ドル、AGR (%)、CAGR (%)
表84 アジア太平洋地域の不妊治療薬・デバイス製品市場:2024-2034年(100万米ドル、AGR (%)、CAGR (%)
表85 アジア太平洋地域の不妊治療薬市場:2024-2034年(100万米ドル、AGR (%)、CAGR (%)
表86 アジア太平洋地域の不妊治療機器市場、2024-2034年(100万米ドル、AGR (%)、CAGR (%)
表87 アジア太平洋地域の不妊治療薬・機器市場:2024-2034年(100万米ドル、AGR (%)、CAGR (%)
表88 アジア太平洋地域の患者市場、2024-2034年(100万米ドル、AGR (%)、CAGR (%)
表89 アジア太平洋地域の不妊治療薬・器具市場、2024-2034年 (百万米ドル、AGR (%)、CAGR (%)
表90 日本の不妊治療薬・デバイス市場:2024-2034年(100万米ドル、AGR (%)、CAGR (%)
表91 日本の不妊治療薬・デバイス製品市場:2024-2034年(100万米ドル、AGR (%)、CAGR (%)
表92 中国不妊治療薬・デバイス市場:2024-2034年(100万米ドル、AGR (%)、CAGR (%)
表93 中国不妊治療薬・デバイス製品市場:2024-2034年(100万米ドル、AGR (%)、CAGR (%)
表94 インドの不妊治療薬・デバイス市場:2024-2034年(100万米ドル、AGR (%)、CAGR (%)
表95 インドの不妊治療薬・デバイス製品市場:2024-2034年(100万米ドル、AGR (%)、CAGR (%)
表96 韓国不妊治療薬・デバイス市場:2024-2034年(100万米ドル、AGR(%)、CAGR(%)
表97 韓国不妊治療薬・デバイス製品市場:2024-2034年(100万米ドル、AGR (%)、CAGR (%)
表98 オーストラリアの不妊治療薬・デバイス市場:2024-2034年(100万米ドル、AGR (%)、CAGR (%)
表99 オーストラリアの不妊治療薬・デバイス製品市場:2024-2034年(100万米ドル、AGR (%)、CAGR (%)
表100 アジア太平洋地域の不妊治療薬・デバイス市場:2024-2034年(100万米ドル、AGR (%)、CAGR (%)
表101 アジア太平洋地域の残りの不妊治療薬・デバイス製品市場:2024-2034年(100万米ドル、AGR (%)、CAGR (%)
表102 中南米不妊治療薬・デバイス市場:国別、2024-2034年(100万米ドル、AGR (%)、CAGR (%)
表103 ラテンアメリカの不妊治療薬・デバイス製品市場:2024-2034年(100万米ドル、AGR (%)、CAGR (%)
表104 中南米不妊治療薬市場:2024-2034年(100万米ドル、AGR (%)、CAGR (%)
表105 ラテンアメリカの不妊治療機器市場、2024-2034年 (US $ Mn, AGR (%), CAGR (%))
表106 中南米不妊治療薬・機器市場:2024-2034年(100万米ドル、AGR (%)、CAGR (%)
表107 ラテンアメリカの患者市場:2024-2034年(100万米ドル、AGR (%)、CAGR (%)
表108 ラテンアメリカの不妊治療薬・器具市場、2024-2034年 (百万米ドル、AGR (%)、CAGR (%))
表109 ブラジル不妊治療薬・デバイス市場:2024-2034年(100万米ドル、AGR (%)、CAGR (%)
表110 ブラジル不妊治療薬・デバイス製品市場:2024-2034年(100万米ドル、AGR (%)、CAGR (%)
表111 メキシコの不妊治療薬・デバイス市場:2024-2034年(100万米ドル、AGR (%)、CAGR (%)
表112 メキシコの不妊治療薬・デバイス製品市場:2024~2034年(100万米ドル、AGR (%)、CAGR (%)
表113 その他のラテンアメリカの不妊治療薬・デバイス市場:2024-2034年(100万米ドル、AGR (%)、CAGR (%)
表114 その他のラテンアメリカの不妊治療薬・デバイス製品市場:2024-2034年(100万米ドル、AGR (%)、CAGR (%)
表115 MEA不妊治療薬・デバイス市場:国別、2024-2034年(100万米ドル、AGR (%)、CAGR (%)
表116 MEA不妊治療薬・デバイス製品市場:2024-2034年(100万米ドル、AGR (%)、CAGR (%)
表117 MEA不妊治療薬市場:2024-2034年(100万米ドル、AGR (%)、CAGR (%)
表118 MEA不妊治療機器市場:2024-2034年(100万米ドル、AGR (%)、CAGR (%)
表119 MEA不妊治療薬・機器市場:2024-2034年(100万米ドル、AGR (%)、CAGR (%)
表120 MEA患者市場:2024-2034年(100万米ドル、AGR (%)、CAGR (%)
表121 MEAの不妊治療薬・器具市場、2024-2034年 (百万米ドル、AGR (%)、CAGR (%))
表122 南アフリカの不妊治療薬・デバイス市場:2024-2034年(100万米ドル、AGR (%)、CAGR (%)
表123 南アフリカの不妊治療薬・デバイス製品市場:2024~2034年(100万米ドル、AGR (%)、CAGR (%)
表124 GCCの不妊治療薬・デバイス市場:2024-2034年(100万米ドル、AGR (%)、CAGR (%)
表125 GCC不妊治療薬・デバイス製品市場:2024-2034年(100万米ドル、AGR (%)、CAGR (%)
表126 MEAの残りの不妊治療薬・デバイス市場:2024-2034年(100万米ドル、AGR (%)、CAGR (%)
表127 MEAの残りの不妊治療薬・デバイス製品市場:2024-2034年(100万米ドル、AGR (%)、CAGR (%)
表128 不妊治療薬・デバイス市場における主要企業の事業戦略 詳細
表129 The Cooper Companies, Inc.:主な詳細(CEO、本社、売上高、設立、従業員数、企業タイプ、ウェブサイト、事業セグメント)
表130 ザ・クーパー・カンパニーズ:製品ベンチマーク
表131 ザ・クーパーカンパニーズ:最近の動向
表132 ビトロライフ主な詳細、(CEO、本社、売上高、設立、従業員数、会社タイプ、ウェブサイト、事業セグメント)
表 133 Vitrolife:製品ベンチマーク
表134 ビトロライフ社:最近の動向
表135 サーモフィッシャーサイエンティフィック主な詳細(CEO、本社、売上高、設立、従業員数、企業タイプ、ウェブサイト、事業セグメント)
表136 サーモフィッシャーサイエンティフィック製品ベンチマーク
表 137 サーモフィッシャーサイエンティフィック:最近の動向
表138 ハミルトン・ソーン主な詳細(CEO、本社、売上高、設立、従業員数、企業タイプ、ウェブサイト、事業セグメント)
表 139 ハミルトンソーン製品ベンチマーク
表 140 ハミルトンソーン会社の最近の動向
表141 エスコ・マイクロ・ピーティーイー・リミテッド:主要業績(CEO、本社所在地、売上高、設立、従業員数、企業タイプ、ウェブサイト、事業セグメント)
表 142 Esco Micro Pte Ltd: 製品ベンチマーク
表143 エスコ・マイクロ・ピーティーイー・リミテッド:最近の動向
表144 富士フイルム・アーバイン・サイエンティフィック主な詳細(CEO, 本社, 売上高, 設立, 従業員数, 企業タイプ, ウェブサイト, 事業セグメント)
表 145 富士フイルム・アーバイン・サイエンティフィック:製品ベンチマーク
表 146 富士フイルム・アーバイン・サイエンティフィック:製品ベンチマーク最近の動向
表147 ザ・ベーカー・カンパニー主な詳細(CEO, 本社, 売上高, 設立, 従業員数, 企業タイプ, ウェブサイト, 事業セグメント)
表 148 ザ・ベーカーカンパニー製品ベンチマーク
表149 ザ・ベーカー社会社の最近の動向
表150 メルクKGaA:主要業績(CEO、本社、売上高、設立、従業員数、企業タイプ、ウェブサイト、事業セグメント)
表151 Merck KGaA : 製品ベンチマーク
表152 Merck KGaA : 会社の最近の動向
表153 Ferring BV:主な詳細(CEO、本社、売上高、設立、従業員数、企業タイプ、ウェブサイト、事業セグメント)
表154 フェリングBV:製品ベンチマーク
表155 フェリングBV:会社の最近の動向
表156 アボット:主要業績(CEO、本社、売上高、設立、従業員数、企業タイプ、ウェブサイト、事業セグメント)
表157 アボット : 製品ベンチマーク
アボット:製品のベンチマーク
図の一覧
図1 不妊治療薬・機器市場のセグメント化
図2 不妊治療薬・機器市場の地域別予測市場魅力度指数
図3 製品別不妊治療薬・機器市場予測:市場魅力度指数市場魅力度指数
図4 手技別不妊治療薬・機器市場:市場魅力度指数不妊治療薬・機器市場:市場魅力度指数
図5 不妊治療薬・デバイス市場:患者別市場魅力度指数
図6 不妊治療薬・デバイス市場:エンドユーズ別市場魅力度指数
図1 不妊治療薬・機器市場:市場ダイナミクス
図7 不妊治療薬・機器市場:インパクト分析インパクト分析
図8 不妊治療薬・機器市場:サプライチェーン分析サプライチェーン分析
図2 不妊治療薬・機器市場:サプライチェーン分析ポーターのファイブフォース分析
図3 不妊治療薬・機器市場:PEST分析PEST分析
図4 不妊治療薬・デバイス市場:製品別2024年予測(売上高、CAGR)
図5 不妊治療薬・デバイス市場:製品別シェア予測(2024年、2029年、2034年)
図6 不妊治療薬・デバイスの製品別市場予測、2024年~2034年 (百万米ドル, AGR%)
図7 地域別医薬品市場予測、2024~2034年(百万米ドル)
図8 2024年および2034年の地域別医薬品市場シェア予測(%)
図9 医薬品のタイプ別市場予測、2024〜2034年(百万米ドル)
図10 医薬品のタイプ別市場シェア予測、2024年および2034年(%)
図11 ゴナドトロピンの市場予測、2024〜2034年(百万米ドル)
図12 アロマターゼ阻害剤の市場予測、2024年〜2034年(百万米ドル)
図13 選択的エストロゲン受容体モジュレーター(SERMs)の市場予測、2024〜2034年(百万米ドル)
図14 ドパミン作動薬の市場予測、2024〜2034年(百万米ドル)
図15 その他の薬物クラスの地域別市場予測、2024〜2034年(百万米ドル)
図16 装置の地域別市場予測、2024-2034年(百万米ドル)
図17 地域別機器市場シェア予測、2024年・2034年(%)
図18 機器のタイプ別市場予測、2024~2034年(百万米ドル)
図19 機器のタイプ別市場シェア予測、2024年・2034年(%)
図20 顕微鏡の市場予測、2024年~2034年(百万米ドル)
図21 イメージングシステムの市場予測、2024年~2034年(百万米ドル)
図22 精子分析システムの市場予測、2024年~2034年(百万米ドル)
図23 卵子吸引ポンプの市場予測、2024年~2034年(百万米ドル)
図24 マイクロマニピュレーターシステムの市場予測、2024年~2034年(百万米ドル)
図25 インキュベーターの市場予測、2024年~2034年(百万米ドル)
図26 ガス分析装置の市場予測、2024年~2034年(百万米ドル)
図27 レーザーシステムの市場予測、2024-2034年(百万米ドル)
図28 冷凍システムの市場予測、2024-2034年(百万米ドル)
図29 精子分離装置の市場予測、2024~2034年(百万米ドル)
図30 メディア・消耗品の地域別市場予測、2024~2034年(百万米ドル)
図31 メディア・消耗品の地域別市場予測、2024年・2034年(%)
図32 アクセサリーの地域別市場展望、2024~2034年(百万米ドル)
図33 アクセサリー市場地域別シェア予測、2024年~2034年(%)
図34 不妊治療薬・器具の手技別市場予測、2024年 (売上高, CAGR%)
図 35 2024-2034 手技別不妊治療薬・デバイス市場予測(百万米ドル、AGR)
図 36 不妊治療薬・デバイスの手技別市場予測、2024 年および 2034 年 (%)
図37 生殖補助医療技術の地域別市場予測、2024~2034年(百万米ドル)
図38 生殖補助医療技術の地域別市場シェア予測、2024年・2034年(%)
図39 生殖補助医療技術のタイプ別市場予測、2024年~2034年(百万米ドル)
図40 生殖補助医療技術のタイプ別市場シェア予測、2024年・2034年(%)
図 41 体外受精の市場予測、2024~2034年(百万米ドル)
図42 卵細胞質内精子注入法の市場予測、2024年~2034年(百万米ドル)
図43 代理出産の市場予測、2024~2034年(百万米ドル)
図44 人工授精の地域別市場予測、2024~2034年(百万米ドル)
図45 人工授精の地域別市場シェア予測、2024年・2034年(%)
図46 人工授精のタイプ別市場予測、2024~2034年(百万米ドル)
図47 人工授精のタイプ別市場シェア予測、2024年・2034年(%)
図48 子宮内人工授精の市場予測、2024年~2034年(百万米ドル)
図49 子宮頸管内市場の予測、2024年~2034年(百万米ドル)
図50 子宮頸管内市場の予測、2024年~2034年(百万米ドル)
図51 不妊手術の地域別市場予測、2024~2034年(百万米ドル)
図52 不妊手術の地域別市場シェア予測、2024年・2034年 (%)
図53 不妊手術の種類別市場予測、2024年~2034年(百万米ドル)
図54 不妊手術のタイプ別市場シェア予測、2024年・2034年(%)
図55 腹腔鏡検査の市場予測、2024年~2034年(百万米ドル)
図56 子宮鏡検査の市場予測、2024年~2034年(百万米ドル)
図57 精巣摘出術の市場予測、2024~2034年(百万米ドル)
図58 腹腔鏡手術の市場予測、2024~2034年(百万米ドル)
図59 卵管結紮反転術の市場予測、2024~2034年(百万米ドル)
図60 マイクロ外科的再建術の市場予測、2024~2034年(百万米ドル)
図61 その他の不妊治療手技の地域別市場予測、2024~2034年(百万米ドル)
図62 その他の不妊治療手技の地域別市場シェア予測、2024年・2034年(%)
図63 不妊治療薬・器具の患者別市場予測(2024年)(売上高、CAGR
図64 2024年~2034年の不妊治療薬・デバイス市場患者別予測(百万米ドル、AGR)
図 65 患者別不妊治療薬・デバイス市場予測、2024, 2029, 2034 (%)
図66 女性の地域別市場予測、2024~2034年(百万米ドル)
図67 女性の地域別市場シェア予測、2024年、2034年(%)
図68 男性市場地域別予測、2024年~2034年(百万米ドル)
図69 男性市場地域別シェア予測、2024年および2034年(%)
図70 不妊治療薬・デバイス市場予測:最終用途別2024年(売上高、CAGR)
図 71 2024-2034 エンドユース別不妊治療薬・デバイス市場予測(百万米ドル, AGR)
図 72 不妊治療薬・デバイスのエンドユーザー別市場予測、2024, 2029, 2034 (%)
図73 不妊治療センターの地域別市場予測、2024年~2034年(百万米ドル)
図74 不妊治療センターの地域別市場予測、2024年、2034年(%)
図75 病院・外科クリニックの地域別市場予測、2024~2034年(百万米ドル)
図76 病院・外科クリニックの地域別市場展望、2024年および2034年(%)
図77 クライオバンクの地域別市場予測、2024~2034年(百万米ドル)
図78 クライオバンクの地域別市場シェア予測、2024年および2034年(%)
図79 研究機関の地域別市場予測、2024年~2034年(百万米ドル)
図80 研究機関の地域別市場シェア予測、2024年および2034年(%)
図 81 不妊治療薬・デバイスの地域別市場予測(2024年、2034年)(売上高
図 82 不妊治療薬・デバイス地域別市場展望 2024年、2029年、2034年(%)
図 83 不妊治療薬・デバイスの地域別市場予測 2024-2034 (百万米ドル, AGR %, CAGR %)
図84 北米不妊治療薬・デバイス市場魅力度指数(2024年
図85 北米不妊治療薬・デバイス地域別市場(2024年、2029年、2034年)(百万米ドル
図86 北米不妊治療薬・機器市場の国別予測(2024~2034年:百万ドル、AGR)
図87 北米不妊治療薬・デバイス市場国別シェア予測、2024年、2029年、2034年(%)
図88 北米不妊治療薬・デバイス市場製品別予測、2024~2034年 (百万米ドル, AGR %)
図89 北米不妊治療薬・デバイス市場製品別シェア予測、2024年、2029年、2034年(%)
図90 北米不妊治療薬・デバイス市場薬剤別予測(2024~2034年、百万米ドル、AGR)
図91 北米不妊治療薬・デバイス市場薬剤別シェア予測、2024年、2029年、2034年(%)
図92 北米不妊治療薬・機器市場予測(機器別:2024-2034年)(百万ドル, AGR %)
図93 北米不妊治療薬・デバイス市場機器別シェア予測、2024年、2029年、2034年(%)
図94 北米不妊治療薬・デバイス市場:手技別予測(2024~2034年、100万ドル、AGR)
図95 北米不妊治療薬・デバイス市場手技別シェア予測、2024年、2029年、2034年 (%)
図96 北米不妊治療薬・デバイス市場患者別予測:2024~2034年(百万米ドル、AGR)
図97 北米不妊治療薬・デバイス市場患者別シェア予測、2024年、2029年、2034年 (%)
図98 北米不妊治療薬・デバイス市場予測(用途別):2024~2034年(百万米ドル、AGR
図99 北米不妊治療薬・デバイス市場エンドユース別予測、2024年、2029年、2034年(%)
図100 米国不妊治療薬・デバイス市場予測、2024~2034年 (百万米ドル、AGR %)
図101 米国の不妊治療薬・デバイス市場製品別予測、2024~2034年 (百万米ドル, AGR %)
図102 米国不妊治療薬・デバイス市場製品別シェア予測、2024年、2029年、2034年 (%)
図103 カナダの不妊治療薬・デバイス市場予測、2024~2034年 (百万米ドル, AGR %)
図104 カナダの不妊治療薬・デバイスの製品別市場展望、2024~2034年 (百万米ドル, AGR %)
図105 カナダの不妊治療薬・デバイス市場製品別シェア予測、2024年, 2029年, 2034年 (%)
図106 欧州不妊治療薬・デバイス市場魅力度指数(2024年
図107 欧州不妊治療薬・デバイス国別市場(2024年、2029年、2034年) (百万米ドル
図108 欧州不妊治療薬・デバイス国別市場予測、2024~2034年(百万米ドル、AGR)
図109 欧州不妊治療薬・デバイス市場国別シェア予測、2024年、2029年、2034年 (%)
図110 欧州の不妊治療薬・デバイス市場製品別予測、2024~2034年 (百万米ドル、AGR %)
図111 欧州不妊治療薬・デバイス市場製品別シェア予測、2024年、2029年、2034年 (%)
図112 欧州不妊治療薬・デバイス市場薬剤別予測、2024~2034年 (百万米ドル、AGR %)
図 113 欧州不妊治療薬・デバイス市場薬剤別シェア予測、2024, 2029, 2034 (%)
図 114 欧州不妊治療薬・機器市場予測(機器別)、2024~2034 年 (百万米ドル、AGR
図 115 欧州不妊治療薬・デバイス市場機器別シェア予測、2024, 2029, 2034 (%)
図 116 欧州の不妊治療薬・デバイス市場:手技別予測(2024-2034 年) (百万米ドル、AGR
図 117 欧州の不妊治療薬・デバイス市場手技別シェア予測、2024, 2029, 2034 (%)
図 118 欧州の不妊治療薬・デバイス市場患者別予測 2024-2034 (百万米ドル, AGR %)
図 119 欧州不妊治療薬・デバイス市場患者別シェア予測、2024, 2029, 2034 (%)
図120 欧州の不妊治療薬・デバイス市場:用途別予測(2024-2034年、百万米ドル、AGR)
図121 欧州の不妊治療薬・デバイス市場:用途別シェア予測(2024年、2029年、2034年)
図122 ドイツの不妊治療薬・デバイス市場予測、2024~2034年 (百万米ドル、AGR %)
図 123 ドイツの不妊治療薬・デバイス市場製品別予測、2024~2034年 (百万米ドル, AGR %)
図124 ドイツの不妊治療薬・デバイス市場製品別シェア予測、2024年, 2029年, 2034年 (%)
図125 英国不妊治療薬・デバイス市場予測、2024~2034年 (百万米ドル、AGR %)
図126 英国不妊治療薬・デバイス市場製品別予測、2024~2034年 (百万米ドル, AGR %)
図127 英国不妊治療薬・デバイス市場製品別シェア予測、2024年、2029年、2034年 (%)
図128 フランスの不妊治療薬・デバイス市場予測、2024~2034年 (百万米ドル, AGR %)
図129 フランスの不妊治療薬・デバイスの製品別市場展望、2024~2034年 (百万米ドル, AGR %)
図130 フランスの不妊治療薬・デバイス市場製品別シェア予測、2024, 2029, 2034 (%)
図131 イタリアの不妊治療薬・デバイス市場予測、2024~2034年 (百万ドル, AGR %)
図 132 イタリアの不妊治療薬・デバイス市場製品別予測、2024~2034年 (百万米ドル, AGR %)
図 133 イタリアの不妊治療薬・デバイス市場製品別シェア予測、2024, 2029, 2034 (%)
図 134 スペイン不妊治療薬・デバイス市場予測、2024~2034年 (百万米ドル, AGR %)
図 134 スペイン不妊治療薬・デバイス市場予測、2024~2034 年(百万米ドル、AGR)
図 136 スペイン不妊治療薬・デバイス市場製品別シェア予測、2024, 2029, 2034 (%)
図 137 欧州以外の不妊治療薬・デバイス市場予測、2024~2034年 (百万米ドル、AGR %)
図 138 欧州残りの不妊治療薬・デバイス市場製品別予測、2024~2034 年 (百万米ドル、AGR)
図 139 欧州残りの不妊治療薬・デバイス市場製品別シェア予測、2024, 2029, 2034 (%)
図140 アジア太平洋地域の不妊治療薬・デバイス市場魅力度指数(2024年
図141 アジア太平洋地域の不妊治療薬・デバイスの国別市場規模予測(2024年、2029年、2034年) (百万米ドル
図142 アジア太平洋地域の不妊治療薬・デバイスの国別市場予測、2024~2034年(百万米ドル、AGR)
図143 アジア太平洋地域の不妊治療薬・デバイスの国別市場展望、2024年、2029年、2034年(%)
図144 アジア太平洋地域の不妊治療薬・デバイスの製品別市場展望(2024~2034年、百万米ドル、AGR)
図145 アジア太平洋地域の不妊治療薬・デバイス市場製品別シェア予測、2024年、2029年、2034年 (%)
図146 アジア太平洋地域の不妊治療薬・デバイス市場薬剤別予測(2024~2034年、百万米ドル、AGR)
図147 アジア太平洋地域の不妊治療薬・デバイス市場薬剤別シェア予測、2024年、2029年、2034年 (%)
図148 アジア太平洋地域の不妊治療薬・機器市場予測(機器別:2024-2034年) (百万米ドル, AGR %)
図149 アジア太平洋地域の不妊治療薬・デバイス市場機器別シェア予測、2024年、2029年、2034年 (%)
図150 アジア太平洋地域の不妊治療薬・デバイスの手技別市場予測:2024~2034年(百万米ドル、AGR)
図151 アジア太平洋地域の不妊治療薬・デバイス市場手技別シェア予測、2024年、2029年、2034年 (%)
図152 アジア太平洋地域の不妊治療薬・デバイス市場患者別予測(2024~2034年、百万米ドル、AGR)
図153 アジア太平洋地域の不妊治療薬・デバイス市場患者別シェア予測、2024年、2029年、2034年 (%)
図154 アジア太平洋地域の不妊治療薬・デバイス市場:用途別予測(2024~2034年、百万米ドル、AGR)
図155 アジア太平洋地域の不妊治療薬・デバイス市場:用途別シェア予測(2024年、2029年、2034年) (%)
図156 日本不妊治療薬・デバイス市場予測、2024年~2034年 (百万米ドル、AGR %)
図 157 日本の不妊治療薬・デバイスの製品別市場展望、2024~2034 年 (百万米ドル、AGR)
図 158 日本の不妊治療薬・デバイス市場製品別シェア予測、2024, 2029, 2034 (%)
図 159 中国不妊治療薬・デバイス市場予測、2024~2034年 (百万米ドル、AGR %)
図 160 中国の不妊治療薬・デバイスの製品別市場展望、2024~2034 年 (100 万米ドル, AGR %)
図161 中国不妊治療薬・デバイス市場製品別シェア予測、2024年, 2029年, 2034年 (%)
図 162 インド不妊治療薬・デバイス市場予測、2024~2034年 (百万米ドル, AGR %)
図 163 インド不妊治療薬・デバイス市場製品別予測、2024~2034 年 (百万米ドル、AGR)
図 164 インド不妊治療薬・デバイス市場製品別シェア予測、2024, 2029, 2034 (%)
図 165 韓国不妊治療薬・デバイス市場予測、2024~2034 年 (百万米ドル、AGR)
図 166 韓国不妊治療薬・デバイスの製品別市場展望、2024~2034 年 (百万米ドル、AGR)
図 167 韓国不妊治療薬・デバイス市場製品別シェア予測、2024, 2029, 2034 (%)
図168 オーストラリアの不妊治療薬・デバイス市場予測、2024~2034年 (百万米ドル, AGR %)
図 169 オーストラリアの不妊治療薬・デバイスの製品別市場展望、2024~2034 年 (百万米ドル、AGR)
図170 オーストラリアの不妊治療薬・デバイス市場製品別シェア予測、2024年, 2029年, 2034年 (%)
図 171 その他のアジア太平洋地域の不妊治療薬・デバイス市場予測、2024~2034年 (百万米ドル、AGR %)
図 172 その他のアジア太平洋地域の不妊治療薬・デバイスの製品別市場予測、2024~2034年 (百万米ドル、AGR %)
図173 その他のAPAC地域の不妊治療薬・デバイス市場製品別シェア予測、2024年、2029年、2034年 (%)
図174 中南米不妊治療薬・デバイス市場魅力度指数(2024年
図175 中南米不妊治療薬・機器市場の国別推移(2024年、2029年、2034年)(百万米ドル
図176 中南米不妊治療薬・機器市場の国別予測(2024~2034年:百万ドル、AGR)
図 177 ラテンアメリカの不妊治療薬・デバイスの国別市場シェア予測、2024, 2029, 2034 (%)
図178 ラテンアメリカの不妊治療薬・デバイス市場製品別予測、2024~2034年 (百万米ドル, AGR %)
図 179 ラテンアメリカの不妊治療薬・デバイス市場製品別シェア予測、2024, 2029, 2034 (%)
図180 ラテンアメリカの不妊治療薬・デバイス市場薬剤別予測、2024~2034年 (百万米ドル、AGR %)
図181 中南米不妊治療薬・デバイス市場薬剤別シェア予測、2024年、2029年、2034年 (%)
図182 中南米不妊治療薬・機器市場予測(機器別:2024-2034年)(百万ドル, AGR %)
図183 中南米不妊治療薬・デバイス市場機器別シェア予測、2024年、2029年、2034年 (%)
図184 中南米の不妊治療薬・デバイス市場予測(手技別)、2024~2034年 (百万米ドル、AGR %)
図185 中南米不妊治療薬・デバイス市場手技別シェア予測、2024年、2029年、2034年 (%)
図186 中南米不妊治療薬・デバイス市場患者別予測、2024~2034年 (百万米ドル、AGR %)
図187 中南米不妊治療薬・デバイス市場患者別シェア予測、2024年、2029年、2034年 (%)
図188 ラテンアメリカの不妊治療薬・デバイス市場:用途別予測(2024~2034年、100万ドル、AGR)
図189 中南米不妊治療薬・デバイス市場用途別シェア予測、2024年、2029年、2034年 (%)
図190 ブラジル不妊治療薬・デバイス市場予測、2024~2034年 (百万米ドル, AGR %)
図191 ブラジル不妊治療薬・デバイス市場製品別予測、2024~2034年 (百万米ドル, AGR %)
図192 ブラジル不妊治療薬・デバイス市場製品別シェア予測、2024, 2029, 2034 (%)
図193 メキシコの不妊治療薬・デバイス市場予測、2024~2034年 (百万米ドル, AGR %)
図194 メキシコの不妊治療薬・デバイス市場製品別予測、2024~2034年 (百万米ドル, AGR %)
図195 メキシコの不妊治療薬・デバイス市場製品別シェア予測(2024年、2029年、2034年)
図196 その他のLATAM地域の不妊治療薬・デバイス市場予測、2024~2034年 (百万米ドル、AGR %)
図197 その他のLATAM地域の不妊治療薬・デバイスの製品別市場予測、2024~2034年 (百万米ドル, AGR %)
図198 その他のLATAM地域の不妊治療薬・デバイス市場製品別シェア予測、2024年、2029年、2034年 (%)
図199 MEA不妊治療薬・デバイス市場魅力度指数(2024年
図200 MEA不妊治療薬・デバイス国別市場(2024年、2029年、2034年)(百万米ドル
図201 MEA不妊治療薬・機器市場の国別予測、2024~2034年(百万米ドル、AGR)
図202 MEA不妊治療薬・デバイスの国別市場予測、2024年、2029年、2034年(%)
図203 MEA不妊治療薬・デバイスの製品別市場予測 2024-2034 (百万米ドル, AGR %)
図204 MEA不妊治療薬・デバイス市場製品別シェア予測、2024年、2029年、2034年 (%)
図205 MEA不妊治療薬・デバイス市場薬別予測、2024~2034年 (百万米ドル、AGR %)
図206 MEA不妊治療薬・デバイス市場薬別シェア予測、2024年、2029年、2034年 (%)
図207 MEA不妊治療薬・機器市場予測(機器別:2024-2034年) (百万ドル, AGR %)
図208 MEA不妊治療薬・デバイス市場機器別シェア予測 2024年、2029年、2034年 (%)
図209 MEA不妊治療薬・デバイス市場:手技別予測(2024-2034年) (百万ドル, AGR %)
図210 MEA不妊治療薬・デバイスの手技別市場予測、2024年、2029年、2034年 (%)
図211 MEA不妊治療薬・デバイス市場患者別予測、2024~2034年 (百万米ドル、AGR %)
図212 MEA不妊治療薬・デバイス市場患者別シェア予測、2024年、2029年、2034年 (%)
図213 MEA不妊治療薬・デバイス市場の用途別予測(2024~2034年:百万ドル、AGR)
図214 MEA不妊治療薬・機器市場の用途別予測、2024年、2029年、2034年 (%)
図215 南アフリカの不妊治療薬・デバイス市場予測、2024~2034年 (百万米ドル, AGR %)
図 216 南アフリカの不妊治療薬・デバイス市場製品別予測、2024~2034年 (百万米ドル, AGR %)
図217 南アフリカの不妊治療薬・デバイス市場製品別シェア予測、2024年, 2029年, 2034年 (%)
図218 GCC不妊治療薬・デバイス市場予測、2024~2034年 (百万米ドル, AGR %)
図219 GCC不妊治療薬・デバイスの製品別市場予測、2024~2034年 (百万米ドル, AGR %)
図220 GCC不妊治療薬・デバイス市場製品別シェア予測、2024年, 2029年, 2034年 (%)
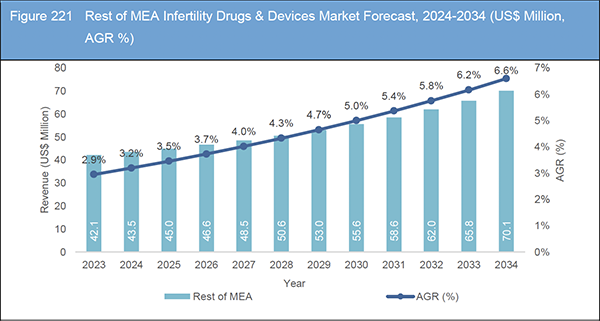
図221 MEA残りの不妊治療薬・デバイス市場予測、2024~2034年 (百万米ドル, AGR %)
図222 MEAの残りの地域の不妊治療薬・デバイスの製品別市場予測、2024~2034年 (百万米ドル, AGR %)
図223 MEAの残りの地域の不妊治療薬・デバイス市場製品別シェア予測、2024年、2029年、2034年 (%)
図 224 不妊治療薬・デバイス市場:企業ランキング分析(2023年
図225 The Cooper Companies, Inc.:売上高、2019年~2023年(百万米ドル、AGR)
図226 The Cooper Companies, Inc.:地域別市場シェア(2023年
図 227 The Cooper Companies, Inc.:R&D、2019-2023 (百万米ドル、AGR %)
図 9 The Cooper Companies, Inc:SWOT分析
図 228 Vitrolife Group : 売上高、2019-2023 年 (US$ Million, AGR %)
図 229 Vitrolife Group : 地域別市場シェア、2023 年
図 230 Vitrolife Group : R&D、2019年-2023年 (百万米ドル, AGR %)
図 231 サーモフィッシャーサイエンティフィック純収入、2019-2023年 (10億米ドル、AGR %)
図 232 サーモフィッシャーサイエンティフィック地域別市場シェア(2023年
図 233 サーモフィッシャーサイエンティフィック研究開発費、2019年-2023年 (10億米ドル、AGR %)
図 234 ハミルトン・ソーン:売上高、2019年~2023年 (百万米ドル、AGR %)
図 235 ハミルトンソーン地域別市場シェア(2023年
図 236 ハミルトンソーンR&D, 2019-2023 (百万米ドル, AGR %)
図 237 富士フイルム売上高、2019-2023年(10億米ドル、AGR)
図 238 富士フイルム:地域別市場シェア、2023年
図 239 富士フイルム:R&D, 2019-2023 (10億米ドル, AGR %)
図 10 富士フイルム・アーバイン・サイエンティフィック:SWOT 分析
図 240 Merck KGaA : 純収入、2019-2023 (百万米ドル、AGR %)
図 241 Merck KGaA : 地域別市場シェア、2023 年
図242 Merck KGaA:R&D、2019-2023年(百万米ドル、AGR)
図 11 フェリング BV:SWOT分析
図243 アボット:純収入、2019-2023年(百万米ドル、AGR)
図244 アボット:地域別市場シェア、2023年
図 245 アボット : R&D、2019年-2023年 (百万米ドル, AGR %)
ページTOPに戻る
Summary
Report Details
The Infertility Drugs & Devices Market Report 2024-2034: This report will prove invaluable to leading firms striving for new revenue pockets if they wish to better understand the industry and its underlying dynamics. It will be useful for companies that would like to expand into different industries or to expand their existing operations in a new region.
High cost of treatment
A single IVF cycle ranges from US$15,000 to US$30,000, depending on the centre and the patient needs. Medications constitute 35% of these charges and other additional costs such as genetic testing of the embryos and surgical procedures that increases the cost further. Also, the costs would also depend on number of cycles conducted that range from 1 to 6, which imposes heavy financial burden on the patients. Such high costs limit the use and appropriate treatment option for the patients restricting market growth. Whereas the insurance coverage especially in the U.S. depends on the coverage plans that the employer has offered. Semen analysis is usually covered. However, major parts of the treatment such as embryo transfer, mini-IVF costs, Full IVF cost, using donor egg costs are not completely covered under insurance. There is a growing demand from employers in the U.S. to also provide fertility treatment coverage.
Unsupportive Government Regulations
Government regulations in the form of funding, grants, policies, subsidies, insurance greatly impact the adoption of ART procedures. Lack of these support systems the access to treatment services is restricted and hence leads to limited adoption of these clinical services. For instance, in Japan, ART treatments were initiated to be covered under health insurance since April 2022 as a move to deal with low fertility rates. Prior to this, only eligible couples received partial subsidies for ART treatment due to focus on lower-income citizens in Japan. Similar norms were set up for ART subsidies in Korea and Taiwan. In the U.S. , only 15 states have authorized legislation to private insurers to cover partial or full costs of infertility treatments, however, type of coverage varies by state, with only 8 states authorizing reimbursement for ART. Most European countries allow gametes donation that includes eggs and sperms. Sperm donation is allowed in 20 EU states while Egg donation is permitted in 17 states of the total 27 EU states. These regulations limit the adoption of ART and hence act as a critical barrier in market growth.
What Questions Should You Ask before Buying a Market Research Report?
-
How is the Infertility Drugs & Devices market evolving?
-
What is driving and restraining the Infertility Drugs & Devices market?
-
How will each Infertility Drugs & Devices submarket segment grow over the forecast period and how much revenue will these submarkets account for in 2034?
-
How will the market shares for each Infertility Drugs & Devices submarket develop from 2024 to 2034?
-
What will be the main driver for the overall market from 2024 to 2034?
-
Will leading Infertility Drugs & Devices markets broadly follow the macroeconomic dynamics, or will individual national markets outperform others?
-
How will the market shares of the national markets change by 2034 and which geographical region will lead the market in 2034?
-
Who are the leading players and what are their prospects over the forecast period?
-
What are the Infertility Drugs & Devices projects for these leading companies?
-
How will the industry evolve during the period between 2024 and 2034? What are the implications of Infertility Drugs & Devices projects taking place now and over the next 10 years?
-
Is there a greater need for product commercialisation to further scale the Infertility Drugs & Devices market?
-
Where is the Infertility Drugs & Devices market heading and how can you ensure you are at the forefront of the market?
-
What are the best investment options for new product and service lines?
-
What are the key prospects for moving companies into a new growth path and C-suite?
You need to discover how this will impact the Infertility Drugs & Devices market today, and over the next 10 years:
-
Our 351-page report provides 156 tables and 245 charts/graphs exclusively to you.
-
The report highlights key lucrative areas in the industry so you can target them – NOW.
-
It contains in-depth analysis of global, regional and national sales and growth.
-
It highlights for you the key successful trends, changes and revenue projections made by your competitors.
Forecasts to 2034 and other analyses reveal commercial prospects
-
In addition to revenue forecasting to 2034, our new study provides you with recent results, growth rates, and market shares.
-
You will find original analyses, with business outlooks and developments.
-
Discover qualitative analyses (including market dynamics, drivers, opportunities, restraints and challenges), cost structure, impact of rising Infertility Drugs & Devices prices and recent developments.
Segments Covered in the Report
Product
-
Drugs
– Gonadotropins
– Aromatase Inhibitors
– Selective Estrogen Receptor Modulators (SERMs)
– Dopamine Agonists
– Other drug classes
-
Equipment
– Microscopes
– Imaging Systems
– Sperm Analyzer Systems
– Ovum Aspiration Pumps
– Micromanipulator Systems
– Incubators
– Gas Analyzers
– Laser Systems
– Cryosystems
– Sperm Separation Devices
-
Media & Consumables
-
Accessories
Procedure
-
Assisted Reproductive Technology
– IVF
– Intracytoplasmic Sperm Injection
– Surrogacy
-
Artificial Insemination
– Intrauterine
– Intracervical
– Intratubal
-
Fertility Surgeries
– Laparoscopy
– Hysteroscopy
– Varicocelectomy
– Laparotomy
– Tubal Ligation Reversal
– Microsurgical Reconstruction
-
Other Infertility Treatment Procedures
Patient
End-Use
-
Fertility Centers
-
Hospitals & Surgical Clinics
-
Cryobanks
-
Research Institutes
In addition to the revenue predictions for the overall world market and segments, you will also find revenue forecasts for five regional and 16 leading national markets:
North America
Europe
-
Germany
-
UK
-
France
-
Spain
-
Italy
-
Rest of Europe
Asia Pacific
-
China
-
Japan
-
India
-
Australia
-
South Korea
-
Rest of Asia Pacific
Latin America
-
Brazil
-
Mexico
-
Rest of Latin America
MEA
-
GCC
-
South Africa
-
Rest of MEA
The report also includes profiles and for some of the leading companies in the Infertility Drugs & Devices Market, 2024 to 2034, with a focus on this segment of these companies’ operations.
Leading companies profiled in the report
-
Abbott Laboratories
-
Esco Micro Pte Ltd
-
Ferring BV
-
FUJIFILM Irvine Scientific
-
Hamilton Thorne
-
Merck KGaA
-
The Baker Company
-
The Cooper Companies, Inc.
-
Thermo Fisher Scientific
-
Vitrolife
Overall world revenue for Infertility Drugs & Devices Market, 2024 to 2034 in terms of value the market will surpass US$5.9 billion in 2024, our work calculates. We predict strong revenue growth through to 2034. Our work identifies which organizations hold the greatest potential. Discover their capabilities, progress, and commercial prospects, helping you stay ahead.
How will the Infertility Drugs & Devices Market, 2024 to 2034 report help you?
In summary, our 350+ page report provides you with the following knowledge:
-
Revenue forecasts to 2034 for Infertility Drugs & Devices Market, 2024 to 2034 Market, with forecasts for product, procedure, patient, end-use, each forecast at a global and regional level – discover the industry’s prospects, finding the most lucrative places for investments and revenues.
-
Revenue forecasts to 2034 for five regional and 16 key national markets – See forecasts for the Infertility Drugs & Devices Market, 2024 to 2034 market in North America, Europe, Asia-Pacific, Latin America, and MEA. Also forecasted is the market in the U.S., Canada, Mexico, Brazil, Germany, France, U.K., Italy, China, India, Japan, and Australia among other prominent economies.
-
Prospects for established firms and those seeking to enter the market – including company profiles for 10 of the major companies involved in the Infertility Drugs & Devices Market, 2024 to 2034.
Find quantitative and qualitative analyses with independent predictions. Receive information that only our report contains, staying informed with invaluable business intelligence.
Information found nowhere else
With our new report, you are less likely to fall behind in knowledge or miss out on opportunities. See how our work could benefit your research, analyses, and decisions. Visiongain’s study is for everybody needing commercial analyses for the Infertility Drugs & Devices Market, 2024 to 2034, market-leading companies. You will find data, trends and predictions.
ページTOPに戻る
Table of Contents
1. Report Overview
1.1 Objectives of the Study
1.2 Introduction to Infertility Drugs & Devices Market
1.3 What This Report Delivers
1.4 Why You Should Read This Report
1.5 Key Questions Answered by This Analytical Report Include:
1.6 Who is This Report For?
1.7 Methodology
1.7.1 Market Definitions
1.7.2 Market Evaluation & Forecasting Methodology
1.7.3 Data Validation
1.8 Frequently Asked Questions (FAQs)
1.9 Associated Visiongain Reports
1.10 About Visiongain
2 Executive Summary
3 Market Overview
3.1 Key Findings
3.2 Market Dynamics
3.3 Impact Analysis
3.3.1 Market Driving Factors
3.3.2 Market Restraining Factors
3.3.3 Market Opportunities
3.4 Supply Chain Analysis
3.5 Regulatory Framework
3.6 Emerging Markets and Megatrends
3.7 Porter’s Five Forces Analysis
3.7.1 Supplier Power
3.7.2 Buyer Power
3.7.3 Competitive Rivalry
3.7.4 Threat of Substitutes
3.7.5 Threat of New Entrants
3.8 PEST Analysis
4 Global Infertility Drugs & Devices Market Analysis by Product
4.1 Key Findings
4.2 Product Segment: Market Attractiveness Index
4.3 Infertility Drugs & Devices Market Size Estimation and Forecast by Product
4.4 Drugs
4.4.1 Drugs Market Forecast by Region, 2024-2034 (US$ Mn)
4.4.2 Drugs Market Share by Region, 2024 and 2034 (%)
4.4.3 Drugs Market Forecast by Type, 2024-2034 (US$ Mn)
4.4.4 Drugs Market Share by Type, 2024 and 2034 (%)
4.5 Equipment
4.5.1 Equipment Market Forecast by Region, 2024-2034 (US$ Mn)
4.5.2 Equipment Market Share by Region, 2024 and 2034 (%)
4.5.3 Equipment Market Forecast by Type, 2024-2034 (US$ Mn)
4.5.4 Equipment Market Share by Type, 2024 and 2034 (%)
4.6 Media & Consumables
4.6.1 Media & Consumables Market Forecast, 2024-2034 (US$ Mn)
4.6.2 Media & Consumables Market Share by Region, 2024 and 2034 (%)
4.7 Accessories
4.7.1 Accessories Market Forecast by Region, 2024-2034 (US$ Mn)
4.7.2 Accessories Market Share by Region, 2024 and 2034 (%)
5 Infertility Drugs & Devices Market Analysis by Procedure
5.1 Key Findings
5.2 Procedure Segment: Market Attractiveness Index
5.3 Infertility Drugs & Devices Market Size Estimation and Forecast by Procedure
5.4 Infertility Drugs & Devices Market Share by Procedure, 2024 & 2034
5.5 Assisted Reproductive Technology
5.5.1 Assisted Reproductive Technology Market Forecast by Region, 2024-2034 (US$ Mn)
5.5.2 Assisted Reproductive Technology Market Share by Region, 2024 and 2034 (%)
5.5.3 Assisted Reproductive Technology Market Forecast by Type, 2024-2034 (US$ Mn)
5.5.4 Assisted Reproductive Technology Market Share by Type, 2024 and 2034 (%)
5.6 Artificial Insemination
5.6.1 Artificial Insemination Market Forecast, 2024-2034 (US$ Mn)
5.6.2 Artificial Insemination Market Share by Region, 2024 and 2034 (%)
5.6.3 Artificial Insemination Market Forecast by Type, 2024-2034 (US$ Mn)
5.6.4 Artificial Insemination Market Share by Type, 2024 and 2034 (%)
5.7 Fertility Surgeries
5.7.1 Fertility Surgeries Market Forecast by Region, 2024-2034 (US$ Mn)
5.7.2 Fertility Surgeries Market Share by Region, 2024 and 2034 (%)
5.7.3 Fertility Surgeries Market Forecast by Type, 2024-2034 (US$ Mn)
5.7.4 Fertility Surgeries Market Share by Type, 2024 and 2034 (%)
5.8 Other Infertility Treatment Procedures
5.8.1 Other Infertility Treatment Procedures Market Forecast by Region, 2024-2034 (US$ Mn)
5.8.2 Other Infertility Treatment Procedures Market Share by Region, 2024 and 2034 (%)
6 Infertility Drugs & Devices Market Analysis by Patient
6.1 Key Findings
6.2 Patient Segment: Market Attractiveness Index
6.3 Infertility Drugs & Devices Market Size Estimation and Forecast by Patient
6.4 Infertility Drugs & Devices Market Share by Patient, 2024, 2029, 2034
6.5 Female
6.5.1 Female Market Forecast by Region, 2024-2034 (US$ Mn)
6.5.2 Female Market Share by Region, 2024 and 2034 (%)
6.6 Male
6.6.1 Male Market Forecast by Region, 2024-2034 (US$ Mn)
6.6.2 Male Market Share by Region, 2024 and 2034 (%)
7 Infertility Drugs & Devices Market Analysis by End-use
7.1 Key Findings
7.2 End-use Segment: Market Attractiveness Index
7.3 Infertility Drugs & Devices Market Size Estimation and Forecast by End-use
7.4 Infertility Drugs & Devices Market Share by End-use, 2024, 2029, 2034
7.5 Fertility Centers
7.5.1 Fertility Centers Market Forecast by Region, 2024-2034 (US$ Mn)
7.5.2 Fertility Centers Market Share by Region, 2024 and 2034 (%)
7.6 Hospitals & Surgical Clinics
7.6.1 Hospitals & Surgical Clinics Market Forecast by Region, 2024-2034 (US$ Mn)
7.6.2 Hospitals & Surgical Clinics Market Share by Region, 2024 and 2034 (%)
7.7 Cryobanks
7.7.1 Cryobanks Market Forecast by Region, 2024-2034 (US$ Mn)
7.7.2 Cryobanks Market Share by Region, 2024 and 2034 (%)
7.8 Research Institutes
7.8.1 Research Institutes Market Forecast by Region, 2024-2034 (US$ Mn)
7.8.2 Research Institutes Market Share by Region, 2024 and 2034 (%)
8 Infertility Drugs & Devices Market Analysis by Region
8.1 Key Findings
8.2 Regional Market Size Estimation and Forecast
9 North America Infertility Drugs & Devices Market Analysis
9.1 Key Findings
9.2 North America Infertility Drugs & Devices Market Attractiveness Index
9.3 North America Infertility Drugs & Devices Market by Country, 2024, 2029 & 2034 (US$ Mn)
9.4 North America Infertility Drugs & Devices Market Size Estimation and Forecast by Country
9.5 North America Infertility Drugs & Devices Market Size Estimation and Forecast by Product
9.6 North America Infertility Drugs & Devices Market Size Estimation and Forecast by Drugs
9.7 North America Infertility Drugs & Devices Market Size Estimation and Forecast by Equipment
9.8 North America Infertility Drugs & Devices Market Size Estimation and Forecast by Procedure
9.9 North America Infertility Drugs & Devices Market Size Estimation and Forecast by Patient
9.10 North America Infertility Drugs & Devices Market Size Estimation and Forecast by End-users
9.11 U.S.
9.11.1 U.S. Infertility Drugs & Devices Market by Product
9.12 Canada
9.12.1 Canada Infertility Drugs & Devices Market by Product
10 Europe Infertility Drugs & Devices Market Analysis
10.1 Key Findings
10.2 Europe Infertility Drugs & Devices Market Attractiveness Index
10.3 Europe Infertility Drugs & Devices Market by Country, 2024, 2029 & 2034 (US$ Mn)
10.4 Europe Infertility Drugs & Devices Market Size Estimation and Forecast by Country
10.5 Europe Infertility Drugs & Devices Market Size Estimation and Forecast by Product
10.6 Europe Infertility Drugs & Devices Market Size Estimation and Forecast by Drugs
10.7 Europe Infertility Drugs & Devices Market Size Estimation and Forecast by Equipment
10.8 Europe Infertility Drugs & Devices Market Size Estimation and Forecast by Procedure
10.9 Europe Infertility Drugs & Devices Market Size Estimation and Forecast by Patient
10.10 Europe Infertility Drugs & Devices Market Size Estimation and Forecast by End-use
10.11 Germany
10.11.1 Germany Infertility Drugs & Devices Market by Product
10.12 U.K.
10.12.1 U.K. Infertility Drugs & Devices Market by Product
10.13 France
10.13.1 France Infertility Drugs & Devices Market by Product
10.14 Italy
10.14.1 Italy Infertility Drugs & Devices Market by Product
10.15 Spain
10.15.1 Spain Infertility Drugs & Devices Market by Product
10.16 Rest of Europe
10.16.1 Rest of Europe Infertility Drugs & Devices Market by Product
11 Asia Pacific Infertility Drugs & Devices Market Analysis
11.1 Key Findings
11.2 Asia Pacific Infertility Drugs & Devices Market Attractiveness Index
11.3 Asia Pacific Infertility Drugs & Devices Market by Country, 2024, 2029 & 2034 (US$ Mn)
11.4 Asia Pacific Infertility Drugs & Devices Market Size Estimation and Forecast by Country
11.5 Asia Pacific Infertility Drugs & Devices Market Size Estimation and Forecast by Product
11.6 Asia Pacific Infertility Drugs & Devices Market Size Estimation and Forecast by Drugs
11.7 Asia Pacific Infertility Drugs & Devices Market Size Estimation and Forecast by Equipment
11.8 Asia-Pacific Infertility Drugs & Devices Market Size Estimation and Forecast by Procedure
11.9 Asia Pacific Infertility Drugs & Devices Market Size Estimation and Forecast by Patient
11.10 Asia Pacific Infertility Drugs & Devices Market Size Estimation and Forecast by End-use
11.11 Japan
11.11.1 Japan Infertility Drugs & Devices Market by Product
11.12 China
11.12.1 China Infertility Drugs & Devices Market by Product
11.13 India
11.13.1 India Infertility Drugs & Devices Market by Product
11.14 South Korea
11.14.1 South Korea Infertility Drugs & Devices Market by Product
11.15 Australia
11.15.1 Australia Infertility Drugs & Devices Market by Product
11.16 Rest of APAC
11.16.1 Rest of APAC Infertility Drugs & Devices Market by Product
12 Latin America Infertility Drugs & Devices Market Analysis
12.1 Key Findings
12.2 Latin America Infertility Drugs & Devices Market Attractiveness Index
12.3 Latin America Infertility Drugs & Devices Market by Country, 2024, 2029 & 2034 (US$ Mn)
12.4 Latin America Infertility Drugs & Devices Market Size Estimation and Forecast by Country
12.5 Latin America Infertility Drugs & Devices Market Size Estimation and Forecast by Product
12.6 Latin America Infertility Drugs & Devices Market Size Estimation and Forecast by Drugs
12.7 Latin America Infertility Drugs & Devices Market Size Estimation and Forecast by Equipment
12.8 Latin America Infertility Drugs & Devices Market Size Estimation and Forecast by Procedure
12.9 Latin America Infertility Drugs & Devices Market Size Estimation and Forecast by Patient
12.10 Latin America Infertility Drugs & Devices Market Size Estimation and Forecast by End-use
12.11Brazil
12.11.1 Brazil Infertility Drugs & Devices Market by Product
12.12 Mexico
12.12.1 Mexico Infertility Drugs & Devices Market by Product
12.13 Rest of Latin America
12.13.1 Rest of LATAM Infertility Drugs & Devices Market by Product
13 MEA Infertility Drugs & Devices Market Analysis
13.1 Key Findings
13.2 MEA Infertility Drugs & Devices Market Attractiveness Index
13.3 MEA Infertility Drugs & Devices Market by Country, 2024, 2029 & 2034 (US$ Mn)
13.4 MEA Infertility Drugs & Devices Market Size Estimation and Forecast by Country
13.5 MEA Infertility Drugs & Devices Market Size Estimation and Forecast by Product
13.6 MEA Infertility Drugs & Devices Market Size Estimation and Forecast by Drugs
13.7 MEA Infertility Drugs & Devices Market Size Estimation and Forecast by Equipment
13.8 MEA Infertility Drugs & Devices Market Size Estimation and Forecast by Procedure
13.9 MEA Infertility Drugs & Devices Market Size Estimation and Forecast by Patient
13.10 MEA Infertility Drugs & Devices Market Size Estimation and Forecast by End-use
13.11 South Africa
13.11.1 South Africa Infertility Drugs & Devices Market by Product
13.12 GCC
13.12.1 GCC Infertility Drugs & Devices Market by Product
13.13 Rest of MEA
13.13.1 Rest of MEA Infertility Drugs & Devices Market by Product
14 Competitive Landscape
14.1 Company Ranking Analysis
14.2 Key Business Strategy Analysis
15 Company Profiles
15.1 The Cooper Companies, Inc.
15.1.1 Company Snapshot
15.1.2 Company Overview
15.1.3 Financial Analysis
15.1.4 Product Benchmarking
15.1.5 Strategic Outlook
15.1.6 SWOT Analysis
15.2 Vitrolife
15.2.1 Company Snapshot
15.2.2 Company Overview
15.2.3 Financial Analysis
15.2.4 Product Benchmarking
15.2.5 Strategic Outlook
15.3 Thermo Fisher Scientific
15.3.1 Company Snapshot
15.3.2 Company Overview
15.3.3 Financial Analysis
15.3.4 Product Benchmarking
15.3.5 Strategic Outlook
15.4 Hamilton Thorne
15.4.1 Company Snapshot
15.4.2 Company Overview
15.4.3 Financial Analysis
15.4.4 Product Benchmarking
15.4.5 Strategic Outlook
15.5 Esco Micro Pte Ltd
15.5.1 Company Snapshot
15.5.2 Company Overview
15.5.3 Product Benchmarking
15.5.4 Strategic Outlook
15.6 FUJIFILM Irvine Scientific
15.6.1 Company Snapshot
15.6.2 Company Overview
15.6.3 Financial Analysis
15.6.4 Product Benchmarking
15.6.5 Strategic Outlook
15.6.6 SWOT Analysis
15.7 The Baker Company
15.7.1 Company Snapshot
15.7.2 Company Overview
15.7.3 Product Benchmarking
15.7.4 Strategic Outlook
15.8 Merck KGaA
15.8.1 Company Snapshot
15.8.2 Company Overview
15.8.3 Financial Analysis
15.8.4 Product Benchmarking
15.8.5 Strategic Outlook
15.9 Ferring BV
15.9.1 Company Snapshot
15.9.2 Company Overview
15.9.3 Product Benchmarking
15.9.4 Strategic Outlook
15.9.5 SWOT Analysis
15.10 Abbott
15.10.1 Company Snapshot
15.10.2 Company Overview
15.10.3 Financial Analysis
15.10.4 Product Benchmarking
16 Conclusion and Recommendations
16.1 Concluding Remarks from Visiongain
16.2 Recommendations for Market Players
ページTOPに戻る
List of Tables/Graphs
List of Tables
Table 1 Infertility Drugs & Devices Market Snapshot, 2024 & 2034 (US$ million, CAGR %)
Table 2 Infertility Drugs & Devices Product Market, 2024-2034 (US$ Mn, AGR (%), CAGR (%))
Table 3 Drugs Market, by Region, 2024-2034 (US$ Mn, AGR (%), CAGR (%))
Table 4 Drugs Market, by Type, 2024-2034 (US$ Mn, AGR (%), CAGR (%))
Table 5 Gonadotropin Market, 2024-2034 (US$ Mn, AGR (%), CAGR (%))
Table 6 Aromatase Inhibitors Market, 2024-2034 (US$ Mn, AGR (%), CAGR (%))
Table 7 Selective Estrogen Receptor Modulators Market, 2024-2034 (US$ Mn, AGR (%), CAGR (%))
Table 8 Dopamine Agonists Market, 2024-2034 (US$ Mn, AGR (%), CAGR (%))
Table 9 Other Drug Classes Market, 2024-2034 (US$ Mn, AGR (%), CAGR (%))
Table 10 Equipment Market, by Region, 2024-2034 (US$ Mn, AGR (%), CAGR (%))
Table 11 Equipment Market, By Type, 2024-2034 (US$ Mn, AGR (%), CAGR (%))
Table 12 Microscopes Market, 2024-2034 (US$ Mn, AGR (%), CAGR (%))
Table 13 Imaging Systems Market, 2024-2034 (US$ Mn, AGR (%), CAGR (%))
Table 14 Sperm Analyzer Systems Market, 2024-2034 (US$ Mn, AGR (%), CAGR (%))
Table 15 Ovum Aspiration Pumps Market, 2024-2034 (US$ Mn, AGR (%), CAGR (%))
Table 16 Micromanipulator Systems Market, 2024-2034 (US$ Mn, AGR (%), CAGR (%))
Table 17 Incubators Market, 2024-2034 (US$ Mn, AGR (%), CAGR (%))
Table 18 Gas Analyzers Market, 2024-2034 (US$ Mn, AGR (%), CAGR (%))
Table 19 Laser Systems Market, 2024-2034 (US$ Mn, AGR (%), CAGR (%))
Table 20 Cryosystems Market, 2024-2034 (US$ Mn, AGR (%), CAGR (%))
Table 21 Sperm Separation Devices Market, 2024-2034 (US$ Mn, AGR (%), CAGR (%))
Table 22 Media & Consumables Market, by Region, 2024-2034 (US$ Mn, AGR (%), CAGR (%))
Table 23 Accessories Market, by Region, 2024-2034 (US$ Mn, AGR (%), CAGR (%))
Table 24 Infertility Drugs & Devices Procedure Market, 2024-2034 (US$ Mn, AGR (%), CAGR (%))
Table 25 Assisted Reproductive Technology Market, by Region, 2024-2034 (US$ Mn, AGR (%), CAGR (%))
Table 26 Assisted Reproductive Technology Market, By Type, 2024-2034 (US$ Mn, AGR (%), CAGR (%))
Table 27 IVF Market, 2024-2034 (US$ Mn, AGR (%), CAGR (%))
Table 28 Intracytoplasmic Sperm Injection Market, 2024-2034 (US$ Mn, AGR (%), CAGR (%))
Table 29 Surrogacy Market, 2024-2034 (US$ Mn, AGR (%), CAGR (%))
Table 30 Artificial Insemination Market, by Region, 2024-2034 (US$ Mn, AGR (%), CAGR (%))
Table 31 Artificial Insemination Market, By Type, 2024-2034 (US$ Mn, AGR (%), CAGR (%))
Table 32 Intrauterine Market, 2024-2034 (US$ Mn, AGR (%), CAGR (%))
Table 33 Intracervical Market, 2024-2034 (US$ Mn, AGR (%), CAGR (%))
Table 34 Intratubal Market, 2024-2034 (US$ Mn, AGR (%), CAGR (%))
Table 35 Fertility Surgeries Market, by Region, 2024-2034 (US$ Mn, AGR (%), CAGR (%))
Table 36 Fertility Surgeries Market, By Type, 2024-2034 (US$ Mn, AGR (%), CAGR (%))
Table 37 Laparoscopy Market, 2024-2034 (US$ Mn, AGR (%), CAGR (%))
Table 38 Hysteroscopy Market, 2024-2034 (US$ Mn, AGR (%), CAGR (%))
Table 39 Varicocelectomy Market, 2024-2034 (US$ Mn, AGR (%), CAGR (%))
Table 40 Laparotomy Market, 2024-2034 (US$ Mn, AGR (%), CAGR (%))
Table 41 Tubal Ligation Reversal Market, 2024-2034 (US$ Mn, AGR (%), CAGR (%))
Table 42 Microsurgical Reconstruction Market, 2024-2034 (US$ Mn, AGR (%), CAGR (%))
Table 43 Other Infertility Treatment Procedures Market, by Region, 2024-2034 (US$ Mn, AGR (%), CAGR (%))
Table 44 Infertility Drugs & Devices Patient Market, 2024-2034 (US$ Mn, AGR (%), CAGR (%))
Table 45 Female Market, by Region, 2024-2034 (US$ Mn, AGR (%), CAGR (%))
Table 46 Male Market, by Region, 2024-2034 (US$ Mn, AGR (%), CAGR (%))
Table 47 Infertility Drugs & Devices End Use Market, 2024-2034 (US$ Mn, AGR (%), CAGR (%))
Table 48 Fertility Centers Market, by Region, 2024-2034 (US$ Mn, AGR (%), CAGR (%))
Table 49 Hospitals & Surgical Clinics Market, by Region, 2024-2034 (US$ Mn, AGR (%), CAGR (%))
Table 50 Cryobanks Market, by Region, 2024-2034 (US$ Mn, AGR (%), CAGR (%))
Table 51 Research Institutes Market, by Region, 2024-2034 (US$ Mn, AGR (%), CAGR (%))
Table 52 Infertility Drugs & Devices Market, By Region, 2024-2034 (US$ Mn, AGR (%), CAGR (%))
Table 53 North America Infertility Drugs & Devices Market, By Country, 2024-2034 (US$ Mn, AGR (%), CAGR (%))
Table 54 North America Infertility Drugs & Devices Product Market, 2024-2034 (US$ Mn, AGR (%), CAGR (%))
Table 55 North America Infertility Drugs Market, 2024-2034 (US$ Mn, AGR (%), CAGR (%))
Table 56 North America Infertility Equipment Market, 2024-2034 (US$ Mn, AGR (%), CAGR (%))
Table 57 North America Infertility Drugs & Devices Procedure Market, 2024-2034 (US$ Mn, AGR (%), CAGR (%))
Table 58 North America Patient Market, 2024-2034 (US$ Mn, AGR (%), CAGR (%))
Table 59 North America Infertility Drugs & Devices End Users Market, 2024-2034 (US$ Mn, AGR (%), CAGR (%))
Table 60 U.S. Infertility Drugs & Devices Market, 2024-2034 (US$ Mn, AGR (%), CAGR (%))
Table 61 U.S. Infertility Drugs & Devices Product Market, 2024-2034 (US$ Mn, AGR (%), CAGR (%))
Table 62 Canada Infertility Drugs & Devices Market, 2024-2034 (US$ Mn, AGR (%), CAGR (%))
Table 63 Canada Infertility Drugs & Devices Product Market, 2024-2034 (US$ Mn, AGR (%), CAGR (%))
Table 64 Europe Infertility Drugs & Devices Market, By Country, 2024-2034 (US$ Mn, AGR (%), CAGR (%))
Table 65 Europe Infertility Drugs & Devices Product Market, 2024-2034 (US$ Mn, AGR (%), CAGR (%))
Table 66 Europe Infertility Drugs Market, 2024-2034 (US$ Mn, AGR (%), CAGR (%))
Table 67 Europe Infertility Equipment Market, 2024-2034 (US$ Mn, AGR (%), CAGR (%))
Table 68 Europe Infertility Drugs & Devices Procedure Market, 2024-2034 (US$ Mn, AGR (%), CAGR (%))
Table 69 Europe Patient Market, 2024-2034 (US$ Mn, AGR (%), CAGR (%))
Table 70 Europe Infertility Drugs & Devices End-use Market, 2024-2034 (US$ Mn, AGR (%), CAGR (%))
Table 71 Germany Infertility Drugs & Devices Market, 2024-2034 (US$ Mn, AGR (%), CAGR (%))
Table 72 Germany Infertility Drugs & Devices Product Market, 2024-2034 (US$ Mn, AGR (%), CAGR (%))
Table 73 UK Infertility Drugs & Devices Market, 2024-2034 (US$ Mn, AGR (%), CAGR (%))
Table 74 UK Infertility Drugs & Devices Product Market, 2024-2034 (US$ Mn, AGR (%), CAGR (%))
Table 75 France Infertility Drugs & Devices Market, 2024-2034 (US$ Mn, AGR (%), CAGR (%))
Table 76 France Infertility Drugs & Devices Product Market, 2024-2034 (US$ Mn, AGR (%), CAGR (%))
Table 77 Italy Infertility Drugs & Devices Market, 2024-2034 (US$ Mn, AGR (%), CAGR (%))
Table 78 Italy Infertility Drugs & Devices Product Market, 2024-2034 (US$ Mn, AGR (%), CAGR (%))
Table 79 Spain Infertility Drugs & Devices Market, 2024-2034 (US$ Mn, AGR (%), CAGR (%))
Table 80 Spain Infertility Drugs & Devices Product Market, 2024-2034 (US$ Mn, AGR (%), CAGR (%))
Table 81 Rest of Europe Infertility Drugs & Devices Market, 2024-2034 (US$ Mn, AGR (%), CAGR (%))
Table 82 Rest of Europe Infertility Drugs & Devices Product Market, 2024-2034 (US$ Mn, AGR (%), CAGR (%))
Table 83 Asia Pacific Infertility Drugs & Devices Market, By Country, 2024-2034 (US$ Mn, AGR (%), CAGR (%))
Table 84 Asia Pacific Infertility Drugs & Devices Product Market, 2024-2034 (US$ Mn, AGR (%), CAGR (%))
Table 85 Asia-Pacific Infertility Drugs Market, 2024-2034 (US$ Mn, AGR (%), CAGR (%))
Table 86 Asia-Pacific Infertility Equipment Market, 2024-2034 (US$ Mn, AGR (%), CAGR (%))
Table 87 Asia-Pacific Infertility Drugs & Devices Procedure Market, 2024-2034 (US$ Mn, AGR (%), CAGR (%))
Table 88 Asia-Pacific Patient Market, 2024-2034 (US$ Mn, AGR (%), CAGR (%))
Table 89 Asia-Pacific Infertility Drugs & Devices End-use Market, 2024-2034 (US$ Mn, AGR (%), CAGR (%))
Table 90 Japan Infertility Drugs & Devices Market, 2024-2034 (US$ Mn, AGR (%), CAGR (%))
Table 91 Japan Infertility Drugs & Devices Product Market, 2024-2034 (US$ Mn, AGR (%), CAGR (%))
Table 92 China Infertility Drugs & Devices Market, 2024-2034 (US$ Mn, AGR (%), CAGR (%))
Table 93 China Infertility Drugs & Devices Product Market, 2024-2034 (US$ Mn, AGR (%), CAGR (%))
Table 94 India Infertility Drugs & Devices Market, 2024-2034 (US$ Mn, AGR (%), CAGR (%))
Table 95 India Infertility Drugs & Devices Product Market, 2024-2034 (US$ Mn, AGR (%), CAGR (%))
Table 96 South Korea Infertility Drugs & Devices Market, 2024-2034 (US$ Mn, AGR (%), CAGR (%))
Table 97 South Korea Infertility Drugs & Devices Product Market, 2024-2034 (US$ Mn, AGR (%), CAGR (%))
Table 98 Australia Infertility Drugs & Devices Market, 2024-2034 (US$ Mn, AGR (%), CAGR (%))
Table 99 Australia Infertility Drugs & Devices Product Market, 2024-2034 (US$ Mn, AGR (%), CAGR (%))
Table 100 Rest of Asia Pacific Infertility Drugs & Devices Market, 2024-2034 (US$ Mn, AGR (%), CAGR (%))
Table 101 Rest of Asia Pacific Infertility Drugs & Devices Product Market, 2024-2034 (US$ Mn, AGR (%), CAGR (%))
Table 102 Latin America Infertility Drugs & Devices Market, By Country, 2024-2034 (US$ Mn, AGR (%), CAGR (%))
Table 103 Latin America Infertility Drugs & Devices Product Market, 2024-2034 (US$ Mn, AGR (%), CAGR (%))
Table 104 Latin America Infertility Drugs Market, 2024-2034 (US$ Mn, AGR (%), CAGR (%))
Table 105 Latin America Infertility Equipment Market, 2024-2034 (US$ Mn, AGR (%), CAGR (%))
Table 106 Latin America Infertility Drugs & Devices Procedure Market, 2024-2034 (US$ Mn, AGR (%), CAGR (%))
Table 107 Latin America Patient Market, 2024-2034 (US$ Mn, AGR (%), CAGR (%))
Table 108 Latin America Infertility Drugs & Devices End-use Market, 2024-2034 (US$ Mn, AGR (%), CAGR (%))
Table 109 Brazil Infertility Drugs & Devices Market, 2024-2034 (US$ Mn, AGR (%), CAGR (%))
Table 110 Brazil Infertility Drugs & Devices Product Market, 2024-2034 (US$ Mn, AGR (%), CAGR (%))
Table 111 Mexico Infertility Drugs & Devices Market, 2024-2034 (US$ Mn, AGR (%), CAGR (%))
Table 112 Mexico Infertility Drugs & Devices Product Market, 2024-2034 (US$ Mn, AGR (%), CAGR (%))
Table 113 Rest of Latin America Infertility Drugs & Devices Market, 2024-2034 (US$ Mn, AGR (%), CAGR (%))
Table 114 Rest of LATAM Infertility Drugs & Devices Product Market, 2024-2034 (US$ Mn, AGR (%), CAGR (%))
Table 115 MEA Infertility Drugs & Devices Market, By Country, 2024-2034 (US$ Mn, AGR (%), CAGR (%))
Table 116 MEA Infertility Drugs & Devices Product Market, 2024-2034 (US$ Mn, AGR (%), CAGR (%))
Table 117 MEA Infertility Drugs Market, 2024-2034 (US$ Mn, AGR (%), CAGR (%))
Table 118 MEA Infertility Equipment Market, 2024-2034 (US$ Mn, AGR (%), CAGR (%))
Table 119 MEA Infertility Drugs & Devices Procedure Market, 2024-2034 (US$ Mn, AGR (%), CAGR (%))
Table 120 MEA Patient Market, 2024-2034 (US$ Mn, AGR (%), CAGR (%))
Table 121 MEA Infertility Drugs & Devices End-use Market, 2024-2034 (US$ Mn, AGR (%), CAGR (%))
Table 122 South Africa Infertility Drugs & Devices Market, 2024-2034 (US$ Mn, AGR (%), CAGR (%))
Table 123 South Africa Infertility Drugs & Devices Product Market, 2024-2034 (US$ Mn, AGR (%), CAGR (%))
Table 124 GCC Infertility Drugs & Devices Market, 2024-2034 (US$ Mn, AGR (%), CAGR (%))
Table 125 GCC Infertility Drugs & Devices Product Market, 2024-2034 (US$ Mn, AGR (%), CAGR (%))
Table 126 Rest of MEA Infertility Drugs & Devices Market, 2024-2034 (US$ Mn, AGR (%), CAGR (%))
Table 127 Rest of MEA Infertility Drugs & Devices Product Market, 2024-2034 (US$ Mn, AGR (%), CAGR (%))
Table 128 Key Business Strategies Adopted by Key Players in Infertility Drugs & Devices Market Details
Table 129 The Cooper Companies, Inc. : Key Details, (CEO, HQ, Revenue, Founded, No. of Employees, Company Type, Website, Business Segment)
Table 130 The Cooper Companies, Inc. : Product Benchmarking
Table 131 The Cooper Companies, Inc. : Company Recent Developments
Table 132 Vitrolife: Key Details, (CEO, HQ, Revenue, Founded, No. of Employees, Company Type, Website, Business Segment)
Table 133 Vitrolife: Product Benchmarking
Table 134 Vitrolife : Company Recent Developments
Table 135 Thermo Fisher Scientific: Key Details, (CEO, HQ, Revenue, Founded, No. of Employees, Company Type, Website, Business Segment)
Table 136 Thermo Fisher Scientific: Product Benchmarking
Table 137 Thermo Fisher Scientific : Company Recent Developments
Table 138 Hamilton Thorne: Key Details, (CEO, HQ, Revenue, Founded, No. of Employees, Company Type, Website, Business Segment)
Table 139 Hamilton Thorne: Product Benchmarking
Table 140 Hamilton Thorne: Company Recent Developments
Table 141 Esco Micro Pte Ltd: Key Details, (CEO, HQ, Revenue, Founded, No. of Employees, Company Type, Website, Business Segment)
Table 142 Esco Micro Pte Ltd: Product Benchmarking
Table 143 Esco Micro Pte Ltd: Company Recent Developments
Table 144 FUJIFILM Irvine Scientific: Key Details, (CEO, HQ, Revenue, Founded, No. of Employees, Company Type, Website, Business Segment)
Table 145 FUJIFILM Irvine Scientific: Product Benchmarking
Table 146 FUJIFILM Irvine Scientific: Company Recent Developments
Table 147 The Baker Company: Key Details, (CEO, HQ, Revenue, Founded, No. of Employees, Company Type, Website, Business Segment)
Table 148 The Baker Company: Product Benchmarking
Table 149 The Baker Company: Company Recent Developments
Table 150 Merck KGaA : Key Details, (CEO, HQ, Revenue, Founded, No. of Employees, Company Type, Website, Business Segment)
Table 151 Merck KGaA : Product Benchmarking
Table 152 Merck KGaA : Company Recent Developments
Table 153 Ferring BV: Key Details, (CEO, HQ, Revenue, Founded, No. of Employees, Company Type, Website, Business Segment)
Table 154 Ferring BV: Product Benchmarking
Table 155 Ferring BV: Company Recent Developments
Table 156 Abbott : Key Details, (CEO, HQ, Revenue, Founded, No. of Employees, Company Type, Website, Business Segment)
Table 157 Abbott : Product Benchmarking
List of Figures
Figure 1 Infertility Drugs & Devices Market Segmentation
Figure 2 Infertility Drugs & Devices Market Forecast by Region: Market Attractiveness Index
Figure 3 Infertility Drugs & Devices Market by Product: Market Attractiveness Index
Figure 4 Infertility Drugs & Devices Market by Procedure: Market Attractiveness Index
Figure 5 Infertility Drugs & Devices Market by Patient: Market Attractiveness Index
Figure 6 Infertility Drugs & Devices Market by End-use: Market Attractiveness Index
Figure 1 Infertility Drugs & Devices Market: Market Dynamics
Figure 7 Infertility Drugs & Devices Market: Impact Analysis
Figure 8 Infertility Drugs & Devices Market: Supply Chain Analysis
Figure 2 Infertility Drugs & Devices Market: Porter’s Five Forces Analysis
Figure 3 Infertility Drugs & Devices Market: PEST Analysis
Figure 4 Infertility Drugs & Devices Market Forecast by Product 2024 (Revenue, CAGR%)
Figure 5 Infertility Drugs & Devices Market Share Forecast by Product, 2024, 2029, 2034 (%)
Figure 6 Infertility Drugs & Devices Market Forecast by Product, 2024-2034 (US$ Million, AGR %)
Figure 7 Drugs Market Forecast by Region, 2024-2034 (US$ million)
Figure 8 Drugs Market Share Forecast by Region, 2024 and 2034 (%)
Figure 9 Drugs Market Forecast by Type, 2024-2034 (US$ million)
Figure 10 Drugs Market Share Forecast by Type, 2024 and 2034 (%)
Figure 11 Gonadotropins Market Forecast, 2024-2034 (US$ million)
Figure 12 Aromatase Inhibitors Market Forecast, 2024-2034 (US$ million)
Figure 13 Selective Estrogen Receptor Modulators (SERMs) Market Forecast, 2024-2034 (US$ million)
Figure 14 Dopamine Agonists Market Forecast, 2024-2034 (US$ million)
Figure 15 Other Drug Classes Market Forecast by Region, 2024-2034 (US$ million)
Figure 16 Equipment Market Forecast by Region, 2024-2034 (US$ million)
Figure 17 Equipment Market Share Forecast by Region, 2024 and 2034 (%)
Figure 18 Equipment Market Forecast by Type, 2024-2034 (US$ million)
Figure 19 Equipment Market Share Forecast by Type, 2024 and 2034 (%)
Figure 20 Microscopes Market Forecast, 2024-2034 (US$ million)
Figure 21 Imaging Systems Market Forecast, 2024-2034 (US$ million)
Figure 22 Sperm Analyzer Systems Market Forecast, 2024-2034 (US$ million)
Figure 23 Ovum Aspiration Pumps Market Forecast, 2024-2034 (US$ million)
Figure 24 Micromanipulator Systems Market Forecast, 2024-2034 (US$ million)
Figure 25 Incubators Market Forecast, 2024-2034 (US$ million)
Figure 26 Gas Analyzers Market Forecast, 2024-2034 (US$ million)
Figure 27 Laser Systems Market Forecast, 2024-2034 (US$ million)
Figure 28 Cryosystems Market Forecast, 2024-2034 (US$ million)
Figure 29 Sperm Separation Devices Market Forecast, 2024-2034 (US$ million)
Figure 30 Media & Consumables Market Forecast by Region, 2024-2034 (US$ million)
Figure 31 Media & Consumables Market Share Forecast by Region, 2024 and 2034 (%)
Figure 32 Accessories Market Forecast by Region, 2024-2034 (US$ million)
Figure 33 Accessories Market Share Forecast by Region, 2024-2034 (%)
Figure 34 Infertility Drugs & Devices Market Forecast by Procedure 2024 (Revenue, CAGR%)
Figure 35 Infertility Drugs & Devices Market Forecast by Procedure, 2024-2034 (US$ Million, AGR %)
Figure 36 Infertility Drugs & Devices Market Share Forecast by Procedure, 2024 and 2034 (%)
Figure 37 Assisted Reproductive Technology Market Forecast by Region, 2024-2034 (US$ million)
Figure 38 Assisted Reproductive Technology Market Share Forecast by Region, 2024 and 2034 (%)
Figure 39 Assisted Reproductive Technology Market Forecast by Type, 2024-2034 (US$ million)
Figure 40 Assisted Reproductive Technology Market Share Forecast by Type, 2024 and 2034 (%)
Figure 41 IVF Market Forecast, 2024-2034 (US$ million)
Figure 42 Intracytoplasmic Sperm Injection Market Forecast, 2024-2034 (US$ million)
Figure 43 Surrogacy Market Forecast, 2024-2034 (US$ million)
Figure 44 Artificial Insemination Market Forecast by Region, 2024-2034 (US$ million)
Figure 45 Artificial Insemination Market Share Forecast by Region, 2024 and 2034 (%)
Figure 46 Artificial Insemination Market Forecast by Type, 2024-2034 (US$ million)
Figure 47 Artificial Insemination Market Share Forecast by Type, 2024 and 2034 (%)
Figure 48 Intrauterine Market Forecast, 2024-2034 (US$ million)
Figure 49 Intracervical Market Forecast, 2024-2034 (US$ million)
Figure 50 Intratubal Market Forecast, 2024-2034 (US$ million)
Figure 51 Fertility Surgeries Market Forecast by Region, 2024-2034 (US$ million)
Figure 52 Fertility Surgeries Market Share Forecast by Region, 2024 and 2034 (%)
Figure 53 Fertility Surgeries Market Forecast by Type, 2024-2034 (US$ million)
Figure 54 Fertility Surgeries Market Share Forecast by Type, 2024 and 2034 (%)
Figure 55 Laparoscopy Market Forecast, 2024-2034 (US$ million)
Figure 56 Hysteroscopy Market Forecast, 2024-2034 (US$ million)
Figure 57 Varicocelectomy Market Forecast, 2024-2034 (US$ million)
Figure 58 Laparotomy Market Forecast, 2024-2034 (US$ million)
Figure 59 Tubal Ligation Reversal Market Forecast, 2024-2034 (US$ million)
Figure 60 Microsurgical Reconstruction Market Forecast, 2024-2034 (US$ million)
Figure 61 Other Infertility Treatment Procedures Market Forecast by Region, 2024-2034 (US$ million)
Figure 62 Other Infertility Treatment Procedures Market Share Forecast by Region, 2024 and 2034 (%)
Figure 63 Infertility Drugs & Devices Market Forecast by Patient 2024 (Revenue, CAGR%)
Figure 64 Infertility Drugs & Devices Market Forecast by Patient, 2024-2034 (US$ Million, AGR %)
Figure 65 Infertility Drugs & Devices Market Share Forecast by Patient, 2024, 2029, 2034 (%)
Figure 66 Female Market Forecast by Region, 2024-2034 (US$ million)
Figure 67 Female Market Share Forecast by Region, 2024 and 2034 (%)
Figure 68 Male Market Forecast by Region, 2024-2034 (US$ million)
Figure 69 Male Market Share Forecast by Region, 2024 and 2034 (%)
Figure 70 Infertility Drugs & Devices Market Forecast by End-use 2024 (Revenue, CAGR%)
Figure 71 Infertility Drugs & Devices Market Forecast by End-use, 2024-2034 (US$ Million, AGR %)
Figure 72 Infertility Drugs & Devices Market Share Forecast by End-use, 2024, 2029, 2034 (%)
Figure 73 Fertility Centers Market Forecast by Region, 2024-2034 (US$ million)
Figure 74 Fertility Centers Market Share Forecast by Region, 2024 and 2034 (%)
Figure 75 Hospitals & Surgical Clinics Market Forecast by Region, 2024-2034 (US$ million)
Figure 76 Hospitals & Surgical Clinics Market Share Forecast by Region, 2024 and 2034 (%)
Figure 77 Cryobanks Market Forecast by Region, 2024-2034 (US$ million)
Figure 78 Cryobanks Market Share Forecast by Region, 2024 and 2034 (%)
Figure 79 Research Institutes Market Forecast by Region, 2024-2034 (US$ million)
Figure 80 Research Institutes Market Share Forecast by Region, 2024 and 2034 (%)
Figure 81 Infertility Drugs & Devices Market Forecast by Region 2024, 2034 (Revenue)
Figure 82 Infertility Drugs & Devices Market Share Forecast by Region 2024, 2029, 2034 (%)
Figure 83 Infertility Drugs & Devices Market by Region, 2024-2034 (US$ Million, AGR %, CAGR %)
Figure 84 North America Infertility Drugs & Devices Market Attractiveness Index, 2024
Figure 85 North America Infertility Drugs & Devices Market by Region, 2024, 2029 & 2034 (US$ million)
Figure 86 North America Infertility Drugs & Devices Market Forecast by Country, 2024-2034 (US$ Million, AGR %)
Figure 87 North America Infertility Drugs & Devices Market Share Forecast by Country, 2024, 2029, 2034(%)
Figure 88 North America Infertility Drugs & Devices Market Forecast by Product, 2024-2034 (US$ Million, AGR %)
Figure 89 North America Infertility Drugs & Devices Market Share Forecast by Product, 2024, 2029, 2034 (%)
Figure 90 North America Infertility Drugs & Devices Market Forecast by Drugs, 2024-2034 (US$ Million, AGR %)
Figure 91 North America Infertility Drugs & Devices Market Share Forecast by Drugs, 2024, 2029, 2034 (%)
Figure 92 North America Infertility Drugs & Devices Market Forecast by Equipment, 2024-2034 (US$ Million, AGR %)
Figure 93 North America Infertility Drugs & Devices Market Share Forecast by Equipment, 2024, 2029, 2034 (%)
Figure 94 North America Infertility Drugs & Devices Market Forecast by Procedure, 2024-2034 (US$ Million, AGR %)
Figure 95 North America Infertility Drugs & Devices Market Share Forecast by Procedure, 2024, 2029, 2034 (%)
Figure 96 North America Infertility Drugs & Devices Market Forecast by Patient, 2024-2034 (US$ Million, AGR %)
Figure 97 North America Infertility Drugs & Devices Market Share Forecast by Patient, 2024, 2029, 2034 (%)
Figure 98 North America Infertility Drugs & Devices Market Forecast by End-use, 2024-2034 (US$ Million, AGR %)
Figure 99 North America Infertility Drugs & Devices Market Share Forecast by End-use, 2024, 2029, 2034 (%)
Figure 100 U.S. Infertility Drugs & Devices Market Forecast, 2024-2034 (US$ Million, AGR %)
Figure 101 U.S. Infertility Drugs & Devices Market Forecast by Product, 2024-2034 (US$ Million, AGR %)
Figure 102 U.S. Infertility Drugs & Devices Market Share Forecast by Product, 2024, 2029, 2034 (%)
Figure 103 Canada Infertility Drugs & Devices Market Forecast, 2024-2034 (US$ Million, AGR %)
Figure 104 Canada Infertility Drugs & Devices Market Forecast by Product, 2024-2034 (US$ Million, AGR %)
Figure 105 Canada Infertility Drugs & Devices Market Share Forecast by Product, 2024, 2029, 2034 (%)
Figure 106 Europe Infertility Drugs & Devices Market Attractiveness Index, 2024
Figure 107 Europe Infertility Drugs & Devices Market by Country, 2024, 2029 & 2034 (US$ million)
Figure 108 Europe Infertility Drugs & Devices Market Forecast by Country, 2024-2034 (US$ Million, AGR %)
Figure 109 Europe Infertility Drugs & Devices Market Share Forecast by Country, 2024, 2029, 2034 (%)
Figure 110 Europe Infertility Drugs & Devices Market Forecast by Product, 2024-2034 (US$ Million, AGR %)
Figure 111 Europe Infertility Drugs & Devices Market Share Forecast by Product, 2024, 2029, 2034 (%)
Figure 112 Europe Infertility Drugs & Devices Market Forecast by Drugs, 2024-2034 (US$ Million, AGR %)
Figure 113 Europe Infertility Drugs & Devices Market Share Forecast by Drugs, 2024, 2029, 2034 (%)
Figure 114 Europe Infertility Drugs & Devices Market Forecast by Equipment, 2024-2034 (US$ Million, AGR %)
Figure 115 Europe Infertility Drugs & Devices Market Share Forecast by Equipment, 2024, 2029, 2034 (%)
Figure 116 Europe Infertility Drugs & Devices Market Forecast by Procedure, 2024-2034 (US$ Million, AGR %)
Figure 117 Europe Infertility Drugs & Devices Market Share Forecast by Procedure, 2024, 2029, 2034 (%)
Figure 118 Europe Infertility Drugs & Devices Market Forecast by Patient, 2024-2034 (US$ Million, AGR %)
Figure 119 Europe Infertility Drugs & Devices Market Share Forecast by Patient, 2024, 2029, 2034 (%)
Figure 120 Europe Infertility Drugs & Devices Market Forecast by End-use, 2024-2034 (US$ Million, AGR %)
Figure 121 Europe Infertility Drugs & Devices Market Share Forecast by End-use, 2024, 2029, 2034 (%)
Figure 122 Germany Infertility Drugs & Devices Market Forecast, 2024-2034 (US$ Million, AGR %)
Figure 123 Germany Infertility Drugs & Devices Market Forecast by Product, 2024-2034 (US$ Million, AGR %)
Figure 124 Germany Infertility Drugs & Devices Market Share Forecast by Product, 2024, 2029, 2034 (%)
Figure 125 U.K. Infertility Drugs & Devices Market Forecast, 2024-2034 (US$ Million, AGR %)
Figure 126 U.K. Infertility Drugs & Devices Market Forecast by Product, 2024-2034 (US$ Million, AGR %)
Figure 127 U.K. Infertility Drugs & Devices Market Share Forecast by Product, 2024, 2029, 2034 (%)
Figure 128 France Infertility Drugs & Devices Market Forecast, 2024-2034 (US$ Million, AGR %)
Figure 129 France Infertility Drugs & Devices Market Forecast by Product, 2024-2034 (US$ Million, AGR %)
Figure 130 France Infertility Drugs & Devices Market Share Forecast by Product, 2024, 2029, 2034 (%)
Figure 131 Italy Infertility Drugs & Devices Market Forecast, 2024-2034 (US$ Million, AGR %)
Figure 132 Italy Infertility Drugs & Devices Market Forecast by Product, 2024-2034 (US$ Million, AGR %)
Figure 133 Italy Infertility Drugs & Devices Market Share Forecast by Product, 2024, 2029, 2034 (%)
Figure 134 Spain Infertility Drugs & Devices Market Forecast, 2024-2034 (US$ Million, AGR %)
Figure 135 Spain Infertility Drugs & Devices Market Forecast by Product, 2024-2034 (US$ Million, AGR %)
Figure 136 Spain Infertility Drugs & Devices Market Share Forecast by Product, 2024, 2029, 2034 (%)
Figure 137 Rest of Europe Infertility Drugs & Devices Market Forecast, 2024-2034 (US$ Million, AGR %)
Figure 138 Rest of Europe Infertility Drugs & Devices Market Forecast by Product, 2024-2034 (US$ Million, AGR %)
Figure 139 Rest of Europe Infertility Drugs & Devices Market Share Forecast by Product, 2024, 2029, 2034 (%)
Figure 140 Asia Pacific Infertility Drugs & Devices Market Attractiveness Index, 2024
Figure 141 Asia Pacific Infertility Drugs & Devices Market by Country, 2024, 2029 & 2034 (US$ million)
Figure 142 Asia Pacific Infertility Drugs & Devices Market Forecast by Country, 2024-2034 (US$ Million, AGR %)
Figure 143 Asia Pacific Infertility Drugs & Devices Market Share Forecast by Country, 2024, 2029, 2034 (%)
Figure 144 Asia Pacific Infertility Drugs & Devices Market Forecast by Product, 2024-2034 (US$ Million, AGR %)
Figure 145 Asia Pacific Infertility Drugs & Devices Market Share Forecast by Product, 2024, 2029, 2034 (%)
Figure 146 Asia Pacific Infertility Drugs & Devices Market Forecast by Drugs, 2024-2034 (US$ Million, AGR %)
Figure 147 Asia Pacific Infertility Drugs & Devices Market Share Forecast by Drugs, 2024, 2029, 2034 (%)
Figure 148 Asia Pacific Infertility Drugs & Devices Market Forecast by Equipment, 2024-2034 (US$ Million, AGR %)
Figure 149 Asia Pacific Infertility Drugs & Devices Market Share Forecast by Equipment, 2024, 2029, 2034 (%)
Figure 150 Asia-Pacific Infertility Drugs & Devices Market Forecast by Procedure, 2024-2034 (US$ Million, AGR %)
Figure 151 Asia-Pacific Infertility Drugs & Devices Market Share Forecast by Procedure, 2024, 2029, 2034 (%)
Figure 152 Asia Pacific Infertility Drugs & Devices Market Forecast by Patient, 2024-2034 (US$ Million, AGR %)
Figure 153 Asia Pacific Infertility Drugs & Devices Market Share Forecast by Patient, 2024, 2029, 2034 (%)
Figure 154 Asia Pacific Infertility Drugs & Devices Market Forecast by End-use, 2024-2034 (US$ Million, AGR %)
Figure 155 Asia Pacific Infertility Drugs & Devices Market Share Forecast by End-use, 2024, 2029, 2034 (%)
Figure 156 Japan Infertility Drugs & Devices Market Forecast, 2024-2034 (US$ Million, AGR %)
Figure 157 Japan Infertility Drugs & Devices Market Forecast by Product, 2024-2034 (US$ Million, AGR %)
Figure 158 Japan Infertility Drugs & Devices Market Share Forecast by Product, 2024, 2029, 2034 (%)
Figure 159 China Infertility Drugs & Devices Market Forecast, 2024-2034 (US$ Million, AGR %)
Figure 160 China Infertility Drugs & Devices Market Forecast by Product, 2024-2034 (US$ Million, AGR %)
Figure 161 China Infertility Drugs & Devices Market Share Forecast by Product, 2024, 2029, 2034 (%)
Figure 162 India Infertility Drugs & Devices Market Forecast, 2024-2034 (US$ Million, AGR %)
Figure 163 India Infertility Drugs & Devices Market Forecast by Product, 2024-2034 (US$ Million, AGR %)
Figure 164 India Infertility Drugs & Devices Market Share Forecast by Product, 2024, 2029, 2034 (%)
Figure 165 South Korea Infertility Drugs & Devices Market Forecast, 2024-2034 (US$ Million, AGR %)
Figure 166 South Korea Infertility Drugs & Devices Market Forecast by Product, 2024-2034 (US$ Million, AGR %)
Figure 167 South Korea Infertility Drugs & Devices Market Share Forecast by Product, 2024, 2029, 2034 (%)
Figure 168 Australia Infertility Drugs & Devices Market Forecast, 2024-2034 (US$ Million, AGR %)
Figure 169 Australia Infertility Drugs & Devices Market Forecast by Product, 2024-2034 (US$ Million, AGR %)
Figure 170 Australia Infertility Drugs & Devices Market Share Forecast by Product, 2024, 2029, 2034 (%)
Figure 171 Rest of Asia Pacific Infertility Drugs & Devices Market Forecast, 2024-2034 (US$ Million, AGR %)
Figure 172 Rest of APAC Infertility Drugs & Devices Market Forecast by Product, 2024-2034 (US$ Million, AGR %)
Figure 173 Rest of APAC Infertility Drugs & Devices Market Share Forecast by Product, 2024, 2029, 2034 (%)
Figure 174 Latin America Infertility Drugs & Devices Market Attractiveness Index, 2024
Figure 175 Latin America Infertility Drugs & Devices Market by Country, 2024, 2029 & 2034 (US$ million)
Figure 176 Latin America Infertility Drugs & Devices Market Forecast by Country, 2024-2034 (US$ Million, AGR %)
Figure 177 Latin America Infertility Drugs & Devices Market Share Forecast by Country, 2024, 2029, 2034 (%)
Figure 178 Latin America Infertility Drugs & Devices Market Forecast by Product, 2024-2034 (US$ Million, AGR %)
Figure 179 Latin America Infertility Drugs & Devices Market Share Forecast by Product, 2024, 2029, 2034 (%)
Figure 180 Latin America Infertility Drugs & Devices Market Forecast by Drugs, 2024-2034 (US$ Million, AGR %)
Figure 181 Latin America Infertility Drugs & Devices Market Share Forecast by Drugs, 2024, 2029, 2034 (%)
Figure 182 Latin America Infertility Drugs & Devices Market Forecast by Equipment, 2024-2034 (US$ Million, AGR %)
Figure 183 Latin America Infertility Drugs & Devices Market Share Forecast by Equipment, 2024, 2029, 2034 (%)
Figure 184 Latin America Infertility Drugs & Devices Market Forecast by Procedure, 2024-2034 (US$ Million, AGR %)
Figure 185 Latin America Infertility Drugs & Devices Market Share Forecast by Procedure, 2024, 2029, 2034 (%)
Figure 186 Latin America Infertility Drugs & Devices Market Forecast by Patient, 2024-2034 (US$ Million, AGR %)
Figure 187 Latin America Infertility Drugs & Devices Market Share Forecast by Patient, 2024, 2029, 2034 (%)
Figure 188 Latin America Infertility Drugs & Devices Market Forecast by End-use, 2024-2034 (US$ Million, AGR %)
Figure 189 Latin America Infertility Drugs & Devices Market Share Forecast by End-use, 2024, 2029, 2034 (%)
Figure 190 Brazil Infertility Drugs & Devices Market Forecast, 2024-2034 (US$ Million, AGR %)
Figure 191 Brazil Infertility Drugs & Devices Market Forecast by Product, 2024-2034 (US$ Million, AGR %)
Figure 192 Brazil Infertility Drugs & Devices Market Share Forecast by Product, 2024, 2029, 2034 (%)
Figure 193 Mexico Infertility Drugs & Devices Market Forecast, 2024-2034 (US$ Million, AGR %)
Figure 194 Mexico Infertility Drugs & Devices Market Forecast by Product, 2024-2034 (US$ Million, AGR %)
Figure 195 Mexico Infertility Drugs & Devices Market Share Forecast by Product, 2024, 2029, 2034 (%)
Figure 196 Rest of LATAM Infertility Drugs & Devices Market Forecast, 2024-2034 (US$ Million, AGR %)
Figure 197 Rest of LATAM Infertility Drugs & Devices Market Forecast by Product, 2024-2034 (US$ Million, AGR %)
Figure 198 Rest of LATAM Infertility Drugs & Devices Market Share Forecast by Product, 2024, 2029, 2034 (%)
Figure 199 MEA Infertility Drugs & Devices Market Attractiveness Index, 2024
Figure 200 MEA Infertility Drugs & Devices Market by Country, 2024, 2029 & 2034 (US$ million)
Figure 201 MEA Infertility Drugs & Devices Market Forecast by Country, 2024-2034 (US$ Million, AGR %)
Figure 202 MEA Infertility Drugs & Devices Market Share Forecast by Country, 2024, 2029, 2034 (%)
Figure 203 MEA Infertility Drugs & Devices Market Forecast by Product, 2024-2034 (US$ Million, AGR %)
Figure 204 MEA Infertility Drugs & Devices Market Share Forecast by Product, 2024, 2029, 2034 (%)
Figure 205 MEA Infertility Drugs & Devices Market Forecast by Drugs, 2024-2034 (US$ Million, AGR %)
Figure 206 MEA Infertility Drugs & Devices Market Share Forecast by Drugs, 2024, 2029, 2034 (%)
Figure 207 MEA Infertility Drugs & Devices Market Forecast by Equipment, 2024-2034 (US$ Million, AGR %)
Figure 208 MEA Infertility Drugs & Devices Market Share Forecast by Equipment, 2024, 2029, 2034 (%)
Figure 209 MEA Infertility Drugs & Devices Market Forecast by Procedure, 2024-2034 (US$ Million, AGR %)
Figure 210 MEA Infertility Drugs & Devices Market Share Forecast by Procedure, 2024, 2029, 2034 (%)
Figure 211 MEA Infertility Drugs & Devices Market Forecast by Patient, 2024-2034 (US$ Million, AGR %)
Figure 212 MEA Infertility Drugs & Devices Market Share Forecast by Patient, 2024, 2029, 2034 (%)
Figure 213 MEA Infertility Drugs & Devices Market Forecast by End-use, 2024-2034 (US$ Million, AGR %)
Figure 214 MEA Infertility Drugs & Devices Market Share Forecast by End-use, 2024, 2029, 2034 (%)
Figure 215 South Africa Infertility Drugs & Devices Market Forecast, 2024-2034 (US$ Million, AGR %)
Figure 216 South Africa Infertility Drugs & Devices Market Forecast by Product, 2024-2034 (US$ Million, AGR %)
Figure 217 South Africa Infertility Drugs & Devices Market Share Forecast by Product, 2024, 2029, 2034 (%)
Figure 218 GCC Infertility Drugs & Devices Market Forecast, 2024-2034 (US$ Million, AGR %)
Figure 219 GCC Infertility Drugs & Devices Market Forecast by Product, 2024-2034 (US$ Million, AGR %)
Figure 220 GCC Infertility Drugs & Devices Market Share Forecast by Product, 2024, 2029, 2034 (%)
Figure 221 Rest of MEA Infertility Drugs & Devices Market Forecast, 2024-2034 (US$ Million, AGR %)
Figure 222 Rest of MEA Infertility Drugs & Devices Market Forecast by Product, 2024-2034 (US$ Million, AGR %)
Figure 223 Rest of MEA Infertility Drugs & Devices Market Share Forecast by Product, 2024, 2029, 2034 (%)
Figure 224 Infertility Drugs & Devices Market: Company Ranking Analysis, 2023
Figure 225 The Cooper Companies, Inc. : Net Sales, 2019-2023 (US$ Million, AGR %)
Figure 226 The Cooper Companies, Inc. : Regional Market Shares, 2023
Figure 227 The Cooper Companies, Inc. : R&D, 2019-2023 (US$ Million, AGR %)
Figure 9 The Cooper Companies, Inc: SWOT Analysis
Figure 228 Vitrolife Group : Net Sales, 2019-2023 (US$ Million, AGR %)
Figure 229 Vitrolife Group : Regional Market Shares, 2023
Figure 230 Vitrolife Group : R&D, 2019-2023 (US$ Million, AGR %)
Figure 231 Thermo Fisher Scientific: Net Revenue, 2019-2023 (US$ Billion, AGR %)
Figure 232 Thermo Fisher Scientific: Regional Market Shares, 2023
Figure 233 Thermo Fisher Scientific: R&D, 2019-2023 (US$ Billion, AGR %)
Figure 234 Hamilton Thorne: Net Sales, 2019-2023 (US$ Million, AGR %)
Figure 235 Hamilton Thorne: Regional Market Shares, 2023
Figure 236 Hamilton Thorne: R&D, 2019-2023 (US$ Million, AGR %)
Figure 237 FUJIFILM: Revenue, 2019-2023 (US$ Billion, AGR %)
Figure 238 FUJIFILM: Regional Market Shares, 2023
Figure 239 FUJIFILM: R&D, 2019-2023 (US$ Billion, AGR %)
Figure 10 FUJIFILM Irvine Scientific: SWOT Analysis
Figure 240 Merck KGaA : Net Revenue, 2019-2023 (US$ Million, AGR %)
Figure 241 Merck KGaA : Regional Market Shares, 2023
Figure 242 Merck KGaA: R&D, 2019-2023 (US$ Million, AGR %)
Figure 11 Ferring BV: SWOT Analysis
Figure 243 Abbott : Net Revenue, 2019-2023 (US$ Million, AGR %)
Figure 244 Abbott : Regional Market Shares, 2023
Figure 245 Abbott : R&D, 2019-2023 (US$ Million, AGR %)
ページTOPに戻る
よくあるご質問
Visiongain社はどのような調査会社ですか?
英国の調査会社ヴィジョンゲイン社(Visiongain)は、通信とエネルギーのほか、自動車や化学・医薬品、金属など、広範な市場を対象に調査を行っています。自動車市場については、市場全般に関する調査のほ... もっと見る
調査レポートの納品までの日数はどの程度ですか?
在庫のあるものは速納となりますが、平均的には 3-4日と見て下さい。
但し、一部の調査レポートでは、発注を受けた段階で内容更新をして納品をする場合もあります。
発注をする前のお問合せをお願いします。
注文の手続きはどのようになっていますか?
1)お客様からの御問い合わせをいただきます。
2)見積書やサンプルの提示をいたします。
3)お客様指定、もしくは弊社の発注書をメール添付にて発送してください。
4)データリソース社からレポート発行元の調査会社へ納品手配します。
5) 調査会社からお客様へ納品されます。最近は、pdfにてのメール納品が大半です。
お支払方法の方法はどのようになっていますか?
納品と同時にデータリソース社よりお客様へ請求書(必要に応じて納品書も)を発送いたします。
お客様よりデータリソース社へ(通常は円払い)の御振り込みをお願いします。
請求書は、納品日の日付で発行しますので、翌月最終営業日までの当社指定口座への振込みをお願いします。振込み手数料は御社負担にてお願いします。
お客様の御支払い条件が60日以上の場合は御相談ください。
尚、初めてのお取引先や個人の場合、前払いをお願いすることもあります。ご了承のほど、お願いします。
データリソース社はどのような会社ですか?
当社は、世界各国の主要調査会社・レポート出版社と提携し、世界各国の市場調査レポートや技術動向レポートなどを日本国内の企業・公官庁及び教育研究機関に提供しております。
世界各国の「市場・技術・法規制などの」実情を調査・収集される時には、データリソース社にご相談ください。
お客様の御要望にあったデータや情報を抽出する為のレポート紹介や調査のアドバイスも致します。
|
|


