圧延銅製品市場レポート:2024-2034
Rolled Copper Products Market Report 2024-2034
レポート詳細
圧延銅製品市場レポート 2024-2034年:本レポートは、業界とその基礎となる原動力をより良く理解したいと望むなら、新たな収益ポケットを目指している大手企業にとって貴重なものとなる... もっと見る
※上記価格は部署ライセンス(Departmental licence)価格です。
その他の価格についてはデータリソースまでお問合せください。
日本語のページは自動翻訳を利用し作成しています。
実際のレポートは英文のみでご納品いたします。
サマリー
レポート詳細
圧延銅製品市場レポート 2024-2034年:本レポートは、業界とその基礎となる原動力をより良く理解したいと望むなら、新たな収益ポケットを目指している大手企業にとって貴重なものとなるでしょう。異業種への進出や新規地域での既存事業の拡大を目指す企業にとっても有益なレポートです。
建設、エレクトロニクス、自動車、通信など様々な産業における銅需要の増加が市場拡大に拍車
世界の圧延銅製品市場は、いくつかの重要な要因によって安定した成長を遂げています。建設、エレクトロニクス、自動車、テレコミュニケーションなど、さまざまな産業で銅の需要が高まっていることが、市場拡大の原動力となっています。シート、ストリップ、箔などの圧延銅製品は、電気配線、配管システム、電子機器、建築用途に欠かせない部品であり、広く採用される要因となっています。
さらに、持続可能でエネルギー効率のよい解決策を重視する傾向が強まっていることも、銅製品の需要を押し上げ ています。銅は導電性、耐久性、リサイクル性に優れているため、グリーンビルディングや再生可能エネルギーシステム、電気自動車に最適です。世界中の政府が持続可能性を推進し、二酸化炭素排出を減らすために厳しい規制やイニシアチブをとっているため、 銅圧延製品の需要は今後も伸び続けると予想されます。
市場が成長するなか、業界関係者にはいくつかのチャンスと課題があります。医療施設や公共スペースで、抗菌性のある銅の表面が使われるようになってきていることは、圧延銅製品のメー カーにとって大きなチャンスです。銅には抗菌作用があるため、細菌やウィルスなどの病原体の拡散を抑える効果があり、触れる機会の多い表面に使われる魅力が高まります。
代替金属箔の入手が市場成長の妨げに
特に金や銀のような貴金属の特性を模倣した革新的な素材が出現しているためです。日本の科学者たちは、銅をベースにした物質を高価な金属の特性を再現した素材に変えるという大きな進歩を遂げ、電子デ バイスの製造に有望な用途を提供しました。銅のナノ粒子を作り出したこの画期的な技術は、従来は高価な金や銀に頼っていた電子部品の開発に道を開くものです。
市場調査レポートを購入する前にすべき質問とは?
-
圧延銅製品市場はどのように発展しているのでしょうか?
-
圧延銅製品市場を牽引しているもの、抑制しているものは何でしょうか?
-
銅圧延製品の各サブマーケット・セグメントは予測期間中にどのように成長し、2034年にはどれくらいの売上を占めるようになるのでしょうか?
-
2024年から2034年にかけて、圧延銅製品の各サブマーケットの市場シェアはどうなっていくのか?
-
2024年から2034年にかけて、市場全体を牽引する主な要因は何か?
-
主要な圧延銅製品市場はマクロ経済の動きに大筋で追随するのか、それとも個々の国の市場が他を上回るのか。
-
2034年までに各国市場のシェアはどのように変化し、どの地域が2034年の市場をリードするのか。
-
主要プレーヤーと予測期間中の見通しは?
-
これらの大手企業にとって、圧延銅製品はどのようなプロジェクトなのでしょうか?
-
2024 年から 2034 年の間に業界はどのように発展していくのか?現在、そして今後 10 年間に行なわれる圧延銅製品プロジェクトはどのような意味を持つのか?
-
圧延銅製品市場をさらに拡大するためには、製品の商品化がより必要なのでしょうか?
-
圧延銅製品市場はどこへ向かっているのでしょうか?
-
新商品や新サービスに最適な投資方法とは?
-
企業を新たな成長軌道に乗せ、C-suiteに移行させるための重要な展望とは?
このことが現在、そして今後 10 年間の圧延銅製品市場にどのような影響を与えるかを知る必要があります:
-
127の表と193の図表を掲載した386ページのレポートをお届けします。
-
本レポートでは、業界における主要な有利分野を取り上げているため、今すぐターゲットを絞ることができる。
-
世界、地域、国の売上高と成長に関する詳細な分析が含まれている。
-
競合他社が成功した主なトレンド、変化、収益予測をハイライトします。
本レポートは、今後10年間、COVID-19の景気後退と好転の変動に合わせて、圧延銅製品市場がどのように発展するかをTODAYでお伝えします。この市場は、過去10年間のどの時点よりも今が重要なのです。
2034年までの予測やその他の分析から、商業的な展望が明らかになる
-
2034年までの収益予測に加え、最新の実績、成長率、市場シェアも提供している。
-
ビジネスの展望や展開など、独自の分析が掲載されている。
-
質的な分析(市場力学、促進要因、機会、阻害要因、課題など)、コスト構造、圧延銅製品価格上昇の影響、最近の動向などをご覧ください。
本レポートには、COVID-19が業界と貴社にどのような影響を与えるかについてのデータ分析と貴重な洞察が含まれている。本レポートでは、COVID-19の4つの回収パターンとその影響、すなわち「V」、「L」、「W」、「U」について論じている。
レポート対象セグメント
合金タイプ別市場セグメント
厚さ別市場セグメント
-
薄型ゲージ(0.2mm以下)
-
中型ゲージ(0.2~1mm)
-
厚型ゲージ(1mm以上)
形態別市場セグメント
-
ロール・シート
-
ロールストリップ
-
圧延フォイル
-
その他のフォーム
用途別市場セグメント
-
プリント基板(PCB)
-
電気配線
-
屋根とクラッディング
-
熱交換器
-
その他の用途
エンドユーザー産業別市場セグメント
-
電気・電子
-
自動車
-
建設
-
産業機械
-
消費財
-
航空宇宙&防衛
世界市場全体とセグメント別の収益予測に加え、4つの地域と20の主要国市場の収益予測も掲載しています:
北米
欧州
-
ドイツ
-
スペイン
-
イギリス
-
フランス
-
イタリア
-
その他の欧州地域
アジア太平洋
-
中国
-
日本
-
インド
-
オーストラリア
-
韓国
-
その他のアジア太平洋地域
ラテンアメリカ
中東・アフリカ
また、2024年から2034年までの圧延銅製品市場における主要企業のプロファイルも掲載しており、これらの企業の事業のこのセグメントに焦点を当てている。
主要企業と市場成長の可能性
-
Aurubis AG
-
Chinalco Luoyang Copper Processing Co., Ltd.
-
Freeport-McMoRan Inc.
-
Furukawa Electric Co., Ltd.
-
Jiangxi Copper Company
-
JX Nippon Mining & Metals Corporation
-
LS-Nikko Copper Inc.
-
Metallurgical Corporation of China
-
Mitsubishi Materials Corporation
-
Mueller Industries
-
Ningbo Jintian Copper (Group) Co., Ltd.
-
Sam Dong
-
Southwire Company, LLC
-
Wieland Electric GmbH
-
Wieland-Werke AG
2024年から2034年までの圧延銅製品市場全体の世界売上高(金額ベース)は、2024年に261.6億米ドルを突破すると弊社は計算しています。2034年まで力強い収益成長を予測しています。当社の調査では、どの企業が最も大きな可能性を秘めているかを特定します。彼らの能力、進歩、商業的展望を発見し、あなたが一歩先を行くのを支援します。
圧延銅製品市場、2024-2034年レポートはどのようにお役に立ちますか?
要約すると、380ページを超えるこのレポートは、以下の知識を提供する:
-
圧延銅製品市場の2024年から2034年までの収益予測 合金タイプ、厚さ、形状、用途、最終用途産業別に世界と地域レベルで予測 - 業界の将来性を発見し、投資と収益に最も有利な場所を見つけます。
-
4つの地域と20の主要国市場の2034年までの収益予測 - 北米、欧州、アジア太平洋、ラテンアメリカ、中東・アフリカの圧延銅製品市場2024年から2034年までの市場予測をご覧ください。また、米国、カナダ、ブラジル、ドイツ、フランス、英国、イタリア、中国、インド、日本、オーストラリアなど著名な経済圏の市場も予測しています。
-
2024年から2034年までの圧延銅製品市場に関わる主要企業15社の企業プロファイルを含む。
独自の予測による定量的・定性的分析をご覧ください。私たちのレポートだけに含まれる情報を入手し、貴重なビジネスインテリジェンスで情報を得ることができます。
他にはない情報
私たちの新しいレポートがあれば、知識に遅れをとったり、チャンスを逃したりする可能性が低くなります。弊社の調査レポートが貴社の調査、分析、意思決定にどのように役立つかをご覧ください。Visiongainの調査は、圧延銅製品市場、2024年から2034年、市場をリードする企業の商業分析を必要とするすべての人のためのものです。データ、トレンド、予測をご覧いただけます。
ページTOPに戻る
目次
1 レポート概要
1.1 研究の目的
1.2 圧延銅製品市場の紹介
1.3 本レポートの内容
1.4 本レポートを読むべき理由
1.5 本分析レポートが回答する主な質問
1.6 本レポートは誰のためのものか?
1.7 方法論
1.7.1 市場の定義
1.7.2 市場評価・予測手法
1.7.3 データの検証
1.7.3.1 一次調査
1.7.3.2 セカンダリーリサーチ
1.8 よくある質問(FAQ)
1.9 Visiongainの関連レポート
1.10 Visiongainについて
2 エグゼクティブ・サマリー
3 市場概要
3.1 主要な調査結果
3.2 市場ダイナミクス
3.2.1 市場牽引要因
3.2.1.1 エレクトロニクス産業の急成長とスマートフォンの台頭
3.2.1.2 自動車端子・コネクター向け圧延銅製品ビジネス
3.2.1.3 建設業界の需要拡大
3.2.2 市場抑制要因
3.2.2.1 代替金属箔の入手可能性が市場成長を妨げる
3.2.2.2 銅不足による新たな製造上の課題
3.2.2.3 原材料価格の変動が市場成長を妨げる
3.2.3 市場機会
3.2.3.1 新興国における急速な工業化と都市化が大きな成長機会をもたらす
3.2.3.2 銅製品の需要が高い新市場・地域への地理的進出
3.2.3.3 市場プレーヤー間の協力とパートナーシップは市場にとって好機である
3.3 ポーターのファイブフォース分析
3.3.1 サプライヤーの交渉力(中)
3.3.2 買い手の交渉力(低~中)
3.3.3 競争上のライバル(高)
3.3.4 代替品による脅威(低)
3.3.5 新規参入の脅威(低)
3.4 COVID-19の影響分析
3.4.1 "V字型回復"
3.4.2 "U字型回復"
3.4.3 "W字型回復"
3.4.4 "L字型回復"
3.5 PEST分析
4 圧延銅製品市場分析:合金タイプ別
4.1 主要調査結果
4.2 合金タイプセグメント 市場魅力度指数
4.3 合金タイプ別圧延銅製品市場規模の推定と予測
4.4 純銅
4.4.1 2024〜2034年の地域別市場規模(US$ Billion)
4.4.2 地域別市場シェア、2024年・2034年(%)
4.5 銅合金
4.5.1 2024〜2034年の地域別市場規模(US$ Billion)
4.5.2 地域別市場シェア、2024年・2034年(%)
5 圧延銅製品市場分析:板厚別
5.1 主要調査結果
5.2 厚さセグメント 市場魅力度指数
5.3 厚さ別圧延銅製品市場規模の推定と予測
5.4 薄型ゲージ(0.2mm未満)
5.4.1 2024-2034年地域別市場規模(US$ Billion)
5.4.2 地域別市場シェア、2024年・2034年(%)
5.5 中型ゲージ(0.2~1mm)
5.5.1 2024~2034年の地域別市場規模(US$ Billion)
5.5.2 地域別市場シェア、2024年・2034年(%)
5.6 厚型ゲージ(1mm以上)
5.6.1 2024~2034年の地域別市場規模(10億米ドル)
5.6.2 地域別市場シェア、2024年・2034年(%)
6 圧延銅製品市場分析:形状別
6.1 主要調査結果
6.2 形状セグメント 市場魅力度指数
6.3 形状別圧延銅製品市場規模の推定と予測
6.4 圧延板
6.4.1 2024〜2034年の地域別市場規模(US$ Billion)
6.4.2 地域別市場シェア、2024年・2034年(%)
6.5 ストリップ
6.5.1 2024~2034年の地域別市場規模(US$ Billion)
6.5.2 地域別市場シェア、2024年・2034年(%)
6.6 圧延フォイル
6.6.1 2024~2034年の地域別市場規模(US$ Billion)
6.6.2 地域別市場シェア、2024年・2034年(%)
6.7 その他の形状
6.7.1 2024〜2034年の地域別市場規模(US$ Billion)
6.7.2 地域別市場シェア、2024年・2034年(%)
7 圧延銅製品市場分析:用途別
7.1 主要調査結果
7.2 用途別セグメント 市場魅力度指数
7.3 用途別圧延銅製品市場規模の推定と予測
7.4 プリント基板(PCB)
7.4.1 2024〜2034年の地域別市場規模(US$ Billion)
7.4.2 地域別市場シェア、2024年・2034年(%)
7.5 電気配線
7.5.1 2024〜2034年の地域別市場規模(US$ Billion)
7.5.2 地域別市場シェア、2024年・2034年(%)
7.6 屋根材と被覆材
7.6.1 2024〜2034年の地域別市場規模(US$ Billion)
7.6.2 地域別市場シェア、2024年・2034年(%)
7.7 熱交換器
7.7.1 2024〜2034年の地域別市場規模(US$ Billion)
7.7.2 地域別市場シェア、2024年・2034年(%)
7.8 その他の用途
7.8.1 2024〜2034年の地域別市場規模(US$ Billion)
7.8.2 地域別市場シェア、2024年・2034年(%)
8 圧延銅製品市場分析:最終用途産業別
8.1 主要な調査結果
8.2 最終用途産業セグメント市場魅力度指数
8.3 圧延銅製品の最終用途産業別市場規模の推定と予測
8.4 電気・電子
8.4.1 2024〜2034年地域別市場規模(US$ Billion)
8.4.2 地域別市場シェア、2024年・2034年(%)
8.5 自動車
8.5.1 2024-2034年地域別市場規模(US$ Billion)
8.5.2 地域別市場シェア、2024年・2034年 (%)
8.6 建設
8.6.1 2024〜2034年地域別市場規模(US$ Billion)
8.6.2 地域別市場シェア、2024年・2034年 (%)
8.7 産業機械
8.7.1 2024〜2034年地域別市場規模(US$ Billion)
8.7.2 地域別市場シェア、2024年・2034年 (%)
8.8 消費財
8.8.1 2024〜2034年地域別市場規模(US$ Billion)
8.8.2 地域別市場シェア、2024年・2034年 (%)
8.9 航空宇宙・防衛
8.9.1 2024〜2034年地域別市場規模(US$ Billion)
8.9.2 地域別市場シェア、2024年・2034年 (%)
9 地域別圧延銅製品市場分析
9.1 主要な調査結果
9.2 地域別市場規模の推定と予測
10 北米の圧延銅製品市場分析
10.1 主要な調査結果
10.2 北米の圧延銅製品市場魅力度指数
10.3 北米の圧延銅製品市場の国別市場規模、2024年、2029年、2034年(US$ Billion)
10.4 北米の圧延銅製市場規模の推定と予測
10.5 北米の圧延銅製品市場規模推定と予測:国別
10.6 北米の圧延銅製品市場規模推定と予測:合金タイプ別
10.7 北米の圧延銅製品市場規模推定と予測:厚さ別
10.8 北米の圧延銅製品市場規模推定と予測:形状別
10.9 北米の圧延銅製品市場規模推定と予測:用途別
10.10 北米の圧延銅製品市場規模推定と予測:最終用途産業別
10.11 アメリカの圧延銅製品市場分析
10.12 カナダの圧延銅製品市場分析
11 欧州の圧延銅製品市場分析
11.1 主要な調査結果
11.2 欧州の圧延銅製品市場魅力度指数
11.3 欧州の圧延銅製品国別市場、2024年、2029年、2034年(US$ Billion)
11.4 欧州の圧延銅製品市場規模推定と予測
11.5 欧州の圧延銅製品市場規模推定と予測:国別
11.6 欧州の圧延銅製品市場規模推定と予測:合金タイプ別
11.7 欧州の圧延銅製品市場規模推定と予測:板厚別
11.8 欧州の圧延銅製品市場規模推定と予測:形状別
11.9 欧州の圧延銅製品市場規模推定と予測:用途別
11.10 欧州の圧延銅製品市場規模推定と予測:最終用途産業別
11.11 ドイツの圧延銅製品市場分析
11.12 イギリスの圧延銅製品市場分析
11.13 フランスの圧延銅製品市場分析
11.14 イタリアの圧延銅製品市場分析
11.15 スペインの伸銅品市場分析
11.16 その他の欧州の圧延銅製品市場分析
12 アジア太平洋地域の圧延銅製品市場分析
12.1 主要な調査結果
12.2 アジア太平洋地域の圧延銅製品市場魅力度指数
12.3 アジア太平洋地域の圧延銅製品国別市場、2024年、2029年、2034年(US$ Billion)
12.4 アジア太平洋地域の伸銅品市場規模推定と予測
12.5 アジア太平洋地域の圧延銅製品市場規模推定と予測:国別
12.6 アジア太平洋地域の圧延銅製品市場規模推定と予測:合金タイプ別
12.7 アジア太平洋地域の圧延銅製品市場規模推定と予測:板厚別
12.8 アジア太平洋地域の圧延銅製品市場規模推定と予測:形状別
12.9 アジア太平洋地域の圧延銅製品市場規模推定と予測:用途別
12.10 アジア太平洋地域の圧延銅製品市場規模推定と予測:最終用途産業別
12.11 中国の圧延銅製品市場分析
12.12 インドの圧延銅製品市場分析
12.13 日本の圧延銅製品市場分析
12.14 韓国の圧延銅製品市場分析
12.15 オーストラリアの圧延銅製品市場分析
12.16 その他のアジア太平洋地域の圧延銅製品市場分析
13 中東・アフリカの圧延銅製品市場分析
13.1 主要な調査結果
13.2 中東・アフリカの圧延銅製品市場魅力度指数
13.3 中東・アフリカの圧延銅製品国別市場:2024年、2029年、2034年(US$ Billion)
13.4 中東・アフリカの圧延銅製品市場規模推定と予測
13.5 中東・アフリカの圧延銅製品市場規模推定と予測:国別
13.6 中東・アフリカの圧延銅製品市場規模推定と予測:合金タイプ別
13.7 中東・アフリカの圧延銅製品市場規模推定と予測:板厚別
13.8 中東・アフリカの圧延銅製品市場規模推定と予測:形状別
13.9 中東・アフリカの圧延銅製品市場規模推定と予測:用途別
13.10 中東・アフリカの圧延銅製品市場規模推定と予測:最終用途産業別
13.11 GCCの伸銅品市場分析
13.12 南アフリカの圧延銅製品市場分析
13.13 その他の中東・アフリカ圧延銅製品市場分析
14 ラテンアメリカの圧延銅製品市場分析
14.1 主要な調査結果
14.2 ラテンアメリカの圧延銅製品市場魅力度指数
14.3 ラテンアメリカの圧延銅製品国別市場、2024年、2029年、2034年(US$ Billion)
14.4 ラテンアメリカの圧延銅製品市場規模推定と予測
14.5 ラテンアメリカの圧延銅製品市場規模推定と予測:国別
14.6 ラテンアメリカの圧延銅製品市場規模推定と予測:合金タイプ別
14.7 ラテンアメリカの圧延銅製品市場規模推定と予測:厚さ別
14.8 ラテンアメリカの圧延銅製品市場規模推定と予測:形状別
14.9 ラテンアメリカの圧延銅製品市場規模推定と予測:用途別
14.10 ラテンアメリカの圧延銅製品市場規模推定と予測:最終用途産業別
14.11 チリの伸銅品市場分析
14.12 ペルーの圧延銅製品市場分析
14.13 その他のラテンアメリカの圧延銅製品市場分析
15 会社概要
15.1 競争環境、2023年
15.2 戦略的展望
15.3 Aurubis AG
15.3.1 会社概要
15.3.2 会社概要
15.3.3 財務分析
15.3.3.1 純収入、2019年~2023年
15.3.3.2 地域別収益シェア、2023年(%)
15.3.3.3 事業セグメント別売上高シェア、2023年(%)
15.3.4 製品ベンチマーク
15.3.5 戦略的展望
15.4 Jiangxi Copper Company
15.4.1 会社概要
15.4.2 会社概要
15.4.3 財務分析
15.4.3.1 純収入、2018-2022年
15.4.3.2 R&D、2018年~2022年
15.4.3.3 地域別収益シェア、2022年(%)
15.4.3.4 事業セグメント収益シェア、2022年(%)
15.4.4 製品ベンチマーク
15.4.5 戦略的展望
15.5 Mitsubishi Materials Corporation
15.5.1 会社概要
15.5.2 会社概要
15.5.3 財務分析
15.5.3.1 純収入、2019-2023年
15.5.4 製品ベンチマーク
15.5.5 戦略的展望
15.6 Wieland-Werke AG
15.6.1 会社概要
15.6.2 会社概要
15.6.3 製品ベンチマーク
15.6.4 戦略的展望
15.7 Metallurgical Corporation of China
15.7.1 会社概要
15.7.2 会社概要
15.7.3 財務分析
15.7.3.1 純収入(2019-2023年
15.7.3.2 R&D、2019-2023年
15.7.3.3 地域別売上高シェア(2023年)
15.7.3.4 事業セグメント収益シェア、2023年(%)
15.7.4 製品ベンチマーク
15.8 JX Nippon Mining & Metals Corporation
15.8.1 会社概要
15.8.2 会社概要
15.8.3 製品ベンチマーク
15.8.4 戦略的展望
15.9 Freeport-McMoRan Inc.
15.9.1 会社概要
15.9.2 会社概要
15.9.3 財務分析
15.9.3.1 純収入(2019-2023年
15.9.3.2 R&D、2019-2023年
15.9.3.3 事業セグメント収益シェア、2023年(%)
15.9.4 製品ベンチマーク
15.10 Sam Dong
15.10.1 会社概要
15.10.2 会社概要
15.10.3 製品ベンチマーク
15.11 Ningbo Jintian Copper (Group) Co., Ltd.
15.11.1 会社概要
15.11.2 会社概要
15.11.3 製品ベンチマーク
15.12 Wieland Electric GmbH
15.12.1 会社概要
15.12.2 会社概要
15.12.3 製品ベンチマーク
15.12.4 戦略的展望
15.13 Southwire Company, LLC
15.13.1 会社概要
15.13.2 会社概要
15.13.3 製品ベンチマーク
15.13.4 戦略的展望
15.14 LS-Nikko Copper Inc.
15.14.1 会社概要
15.14.2 会社概要
15.14.3 製品ベンチマーク
15.14.4 戦略的展望
15.15 Mueller Industries
15.15.1 会社概要
15.15.2 会社概要
15.15.3 財務分析
15.15.3.1 純収入、2019年~2023年
15.15.3.2 地域別収益シェア、2023年(%)
15.15.3.3 事業セグメント別売上高シェア、2023年(%)
15.15.4 製品ベンチマーク
15.16 Furukawa Electric Co., Ltd.
15.16.1 会社概要
15.16.2 会社概要
15.16.3 財務分析
15.16.3.1 純収入、2018-2022年
15.16.3.2 R&D(2018年~2022年
15.16.3.3 地域別収益シェア、2022年(%)
15.16.4 製品ベンチマーク
15.17 Chinalco Luoyang Copper Processing Co., Ltd.
15.17.1 会社概要
15.17.2 会社概要
15.17.3 財務分析
15.17.3.1 純収入(2019-2023年
15.17.3.2 R&D(2019年〜2023年
15.17.3.3 事業セグメント収益シェア、2023年(%)
15.17.4 製品ベンチマーク
16 結論と提言
16.1 Visiongainからの結びの言葉
16.2 市場プレイヤーへの提言
ページTOPに戻る
図表リスト
表の一覧
表1 伸銅品市場のスナップショット、2024年~2034年 (億米ドル、CAGR %)
表2 銅圧延品の世界地域別市場:2024年~2034年(10億米ドル、AGR (%)、CAGR (%))(V字回復シナリオ)
表3 銅圧延品の世界地域別市場:2024-2034年(億米ドル、AGR (%)、CAGR (%))(U字回復シナリオ)
表4 銅圧延品の世界地域別市場:2024年~2034年(億米ドル、AGR (%)、CAGR (%))(W字型回復シナリオ)
表5 銅圧延品の世界地域別市場:2024-2034年(億米ドル、AGR (%)、CAGR (%))(L字型回復シナリオ)
表6 銅圧延品の世界市場:合金タイプ別、2024年~2034年 (億米ドル、AGR (%)、CAGR (%))
表7 銅価格月次分析
表8 純銅の地域別市場、2024-2034年 (億米ドル、AGR (%)、CAGR (%))
表9 銅合金の地域別市場、2024-2034年 (億米ドル、AGR (%)、CAGR (%))
表10 銅圧延品の世界市場:厚さ別、2024-2034年 (億米ドル、AGR (%)、CAGR (%))
表11 薄ゲージ(0.2mm未満)地域別市場、2024-2034年(億米ドル、AGR (%)、CAGR (%)
表12 中ゲージ(0.2~1mm)の地域別市場、2024~2034年(億米ドル、AGR (%)、CAGR (%)
表13 厚ゲージ(1mm以上)地域別市場、2024-2034年(億米ドル、AGR (%)、CAGR (%)
表14 銅圧延品の世界市場:形状別、2024-2034年 (億米ドル、AGR (%)、CAGR (%))
表15 圧延板の地域別市場:2024-2034年(億米ドル、AGR (%)、CAGR (%)
表16 圧延ストリップの地域別市場:2024-2034年(億米ドル、AGR (%)、CAGR (%)
表17 圧延フォイル地域別市場:2024-2034年(億米ドル、AGR (%)、CAGR (%)
表 18 その他の形状市場:地域別 2024-2034 (億米ドル、AGR (%)、CAGR (%))
表 19 銅圧延品の世界市場:用途別、2024-2034年 (億米ドル、AGR (%)、CAGR (%))
表 20 PCB
表21 プリント基板(PCB)の地域別市場、2024-2034年 (億米ドル、AGR (%)、CAGR (%))
表22 電気配線の地域別市場:2024-2034年(億米ドル、AGR (%)、CAGR (%)
表23 屋根材と被覆材の地域別市場:2024-2034年(億米ドル、AGR (%)、CAGR (%)
表24 熱交換器の地域別市場:2024-2034年(億米ドル、AGR (%)、CAGR (%)
表25 その他の用途の地域別市場、2024-2034年 (億米ドル、AGR (%)、CAGR (%))
表26 銅圧延品の世界市場:最終用途産業別、2024-2034年 (億米ドル、AGR (%)、CAGR (%))
表27 電気・電子機器地域別市場:2024-2034年(億米ドル、AGR (%)、CAGR (%)
表28 自動車地域別市場:2024-2034年(億米ドル、AGR (%)、CAGR (%)
表29 建設機械地域別市場:2024-2034年(億米ドル、AGR (%)、CAGR (%)
表30 産業機械の地域別市場:2024-2034年(億米ドル、AGR (%)、CAGR (%)
表31 地域別消費財市場:2024-2034年(億米ドル、AGR (%)、CAGR (%)
表 32 航空宇宙・防衛市場:地域別 2024-2034 (億米ドル、AGR (%)、CAGR (%))
表33 銅圧延製品の世界地域別市場:2024-2034年(億米ドル、AGR (%)、CAGR (%)
表34 北米の伸銅品市場:金額ベース、2024-2034年 (億米ドル、AGR (%)、CAGR (%))
表35 北米の伸銅品市場:国別、2024-2034年 (億米ドル、AGR (%)、CAGR (%))
表36 北米の圧延銅製品市場:合金タイプ別、2024-2034年 (億米ドル、AGR (%)、CAGR (%))
表37 北米の圧延銅製品市場:厚さ別、2024-2034年 (億米ドル、AGR (%)、CAGR (%))
表 38 北米の圧延銅製品市場:形状別、2024-2034 (億米ドル、AGR (%)、CAGR (%))
表39 北米の伸銅品市場:用途別、2024-2034年 (億米ドル、AGR (%)、CAGR (%))
表40 北米の伸銅品市場:最終用途産業別、2024-2034年 (億米ドル、AGR (%)、CAGR (%))
表41 米国の伸銅品市場:金額ベース、2024-2034年 (億米ドル、AGR (%)、CAGR (%))
表42 カナダの伸銅品市場:金額 2024-2034 (億米ドル、AGR (%)、CAGR (%))
表43 欧州の伸銅品市場:金額ベース、2024-2034年 (億米ドル、AGR (%)、CAGR (%))
表44 欧州の伸銅品市場:国別、2024-2034年 (億米ドル、AGR (%)、CAGR (%))
表45 欧州の圧延銅製品市場:合金タイプ別、2024-2034年 (億米ドル、AGR (%)、CAGR (%))
表46 銅圧延製品の欧州市場:厚さ別、2024-2034年 (億米ドル、AGR (%)、CAGR (%))
表47 欧州の圧延銅製品市場:形状別、2024-2034年 (億米ドル、AGR (%)、CAGR (%))
表 48 欧州の伸銅品市場:用途別、2024-2034 (億米ドル、AGR (%)、CAGR (%))
表49 欧州の伸銅品市場:最終用途産業別、2024-2034年 (億米ドル、AGR (%)、CAGR (%))
表50 ドイツの伸銅品市場:金額ベース、2024-2034年 (億米ドル、AGR (%)、CAGR (%))
表51 銅圧延製品のイギリス市場:金額 2024-2034 (億米ドル、AGR (%)、CAGR (%))
表 52 フランスの伸銅品市場:金額 2024-2034 (億米ドル、AGR (%)、CAGR (%))
表 53 イタリアの伸銅品市場:金額 2024-2034 (億米ドル、AGR (%)、CAGR (%))
表 54 スペインの伸銅品市場:金額 2024-2034 (億米ドル、AGR (%)、CAGR (%))
表 55 その他のヨーロッパの伸銅品市場:金額 2024-2034 (億米ドル、AGR (%)、CAGR (%))
表 56 アジア太平洋地域の伸銅品市場:金額 2024-2034 (億米ドル、AGR (%)、CAGR (%))
表57 アジア太平洋地域の伸銅品市場:国別、2024-2034年 (億米ドル、AGR (%)、CAGR (%))
表58 アジア太平洋地域の圧延銅製品市場:合金タイプ別、2024-2034年 (億米ドル、AGR (%)、CAGR (%))
表59 アジア太平洋地域の圧延銅製品市場:厚さ別、2024-2034年 (億米ドル、AGR (%)、CAGR (%))
表60 アジア太平洋地域の圧延銅製品市場:形状別、2024-2034年 (億米ドル、AGR (%)、CAGR (%))
表61 アジア太平洋地域の伸銅品市場:用途別、2024-2034年(億米ドル、AGR (%)、CAGR (%)
表62 アジア太平洋地域の伸銅品市場:最終用途産業別、2024-2034年 (億米ドル、AGR (%)、CAGR (%))
表63 中国の伸銅品市場:金額ベース、2024-2034年 (億米ドル、AGR (%)、CAGR (%))
表64 インドの伸銅品市場:金額ベース、2024-2034年 (億米ドル、AGR (%)、CAGR (%))
表65 日本の伸銅品市場:金額ベース、2024-2034年 (億米ドル、AGR (%)、CAGR (%))
表 66 韓国の伸銅品市場:金額 2024-2034 (億米ドル、AGR (%)、CAGR (%))
表 67 オーストラリアの伸銅品市場:金額 2024-2034 (億米ドル、AGR (%)、CAGR (%))
表 68 その他のアジア太平洋地域の伸銅品市場:金額 2024-2034 (億米ドル、AGR (%)、CAGR (%))
表 69 中東・アフリカの伸銅品市場:金額 2024-2034 (億米ドル、AGR (%)、CAGR (%))
表70 中東・アフリカの伸銅品市場:国別、2024-2034年 (億米ドル、AGR (%)、CAGR (%))
表71 中東・アフリカの圧延銅製品市場:合金タイプ別、2024-2034年 (億米ドル、AGR (%)、CAGR (%))
表72 中東・アフリカ板厚別伸銅品市場:2024-2034年 (億米ドル、AGR (%)、CAGR (%))
表73 中東・アフリカの圧延銅製品市場:形状別、2024-2034年 (億米ドル、AGR (%)、CAGR (%))
表 74 中東・アフリカの伸銅品市場:用途別、2024-2034年 (億米ドル、AGR (%)、CAGR (%))
表75 中東・アフリカの伸銅品市場:最終用途産業別、2024-2034年 (億米ドル、AGR (%)、CAGR (%))
表76 GCCの伸銅品市場:金額ベース、2024-2034年 (億米ドル、AGR (%)、CAGR (%))
表77 南アフリカの伸銅品市場:金額(2024-2034年) (億米ドル、AGR (%)、CAGR (%))
表78 その他の中東・アフリカの伸銅品市場:金額 2024-2034 (億米ドル、AGR (%)、CAGR (%))
表79 ラテンアメリカの伸銅品市場:金額 2024-2034 (億米ドル、AGR (%)、CAGR (%))
表80 ラテンアメリカの圧延銅製品市場:国別、2024-2034年 (億米ドル、AGR (%)、CAGR (%))
表81 中南米の圧延銅製品市場:合金タイプ別、2024-2034年 (億米ドル、AGR (%)、CAGR (%))
表82 中南米の圧延銅製品市場:厚さ別、2024-2034年 (億米ドル、AGR (%)、CAGR (%))
表83 中南米の圧延銅製品市場:形状別、2024-2034年 (億米ドル、AGR (%)、CAGR (%))
表84 ラテンアメリカの圧延銅製品市場:用途別、2024-2034年 (億米ドル、AGR (%)、CAGR (%))
表85 ラテンアメリカの伸銅品市場:最終用途産業別、2024-2034年 (億米ドル、AGR (%)、CAGR (%))
表86 チリの伸銅品市場:金額ベース、2024-2034年 (億米ドル、AGR (%)、CAGR (%))
表87 ペルー銅圧延品市場の金額:2024~2034年 (億米ドル、AGR (%)、CAGR (%))
表88 その他のラテンアメリカの伸銅品市場:金額 2024-2034 (億米ドル、AGR (%)、CAGR (%))
表 89 戦略的展望 - 契約
表90 Aurubis AG: 主要詳細(CEO, 本社, 売上高, 設立, 従業員数, 企業タイプ, ウェブサイト, 事業セグメント)
表 91 Aurubis AG: 製品ベンチマーク
表92 オールビスAG:戦略的展望
表93 江西省銅集団:主な詳細(CEO, 本社, 売上高, 設立, 従業員数, 企業タイプ, ウェブサイト, 事業セグメント)
表 94 江西銅業股份有限公司:戦略的展望製品ベンチマーク
表95 江西銅業:戦略的展望戦略的展望
表96 三菱マテリアル:戦略的展望主要詳細(CEO, 本社, 売上高, 設立, 従業員数, 企業タイプ, ウェブサイト, 事業セグメント)
表 97 三菱マテリアル製品ベンチマーク
表98 三菱マテリアル:戦略的展望
表99 Wieland-Werke AG: 主要詳細(CEO, 本社, 売上高, 設立, 従業員数, 企業タイプ, ウェブサイト, 事業セグメント)
表100 Wieland-Werke AG: 製品ベンチマーク
表101 ヴィーラント・ヴェルケAG:戦略的展望
表102 中国冶金公司: 主要詳細(CEO、本社、売上高、設立、従業員数、企業タイプ、ウェブサイト、事業セグメント)
表 103 中国冶金公司:製品ベンチマーク
表104 JX日鉱日石金属:製品ベンチマーク主な詳細(CEO, 本社, 売上高, 設立, 従業員数, 企業タイプ, ウェブサイト, 事業セグメント)
表 105 JX日鉱日石金属:製品ベンチマーク
表106 JX日鉱日石金属:戦略的展望戦略的展望
表 107 フリーポート・マクモランInc:主な詳細(CEO, 本社, 売上高, 設立, 従業員数, 企業タイプ, ウェブサイト, 事業セグメント)
表 108 フリーポート・マクモランInc:製品ベンチマーク
表109 サム・ドン主な詳細(CEO, 本社, 売上高, 設立, 従業員数, 企業タイプ, ウェブサイト, 事業セグメント)
表110 サム・ドン製品ベンチマーク
表111 寧波津田銅(集団)有限公司: 主要詳細(CEO, 本社, 売上高, 設立, 従業員数, 企業タイプ, ウェブサイト, 事業セグメント)
表 112 寧波錦田銅業(集団)有限公司: 主要詳細(CEO, 本社, 売上高, 設立, 従業員数, 企業タイプ, ウェブサイト, 事業部門):製品ベンチマーク
表113 ヴィーランド・エレクトリックGmbH: 主要詳細(CEO, 本社, 売上高, 設立, 従業員数, 企業タイプ, ウェブサイト, 事業セグメント)
表 114 ヴィーランド・エレクトリックGmbH:製品ベンチマーク
表115 ヴィーランド・エレクトリックGmbH:戦略的展望
表116 Southwire Company, LLC:主な詳細(CEO, 本社, 売上高, 設立, 従業員数, 企業タイプ, ウェブサイト, 事業セグメント)
表 117 サウスワイヤー社製品ベンチマーク
表 118 サウスワイヤ・カンパニーLLC:戦略的展望
表119 LS日鉱日石金属:戦略的展望主な詳細(CEO, 本社, 売上高, 設立, 従業員数, 企業タイプ, ウェブサイト, 事業セグメント)
表 120 LS 日鉱カッパー:製品ベンチマーク
表121 LS日鉱日石銅:戦略的展望
表122 ミューラー・インダストリーズ主な詳細(CEO, 本社, 売上高, 設立, 従業員数, 企業タイプ, ウェブサイト, 事業セグメント)
表 123 ミューラー・インダストリーズ:製品ベンチマーク
表124 古河電気工業:主要詳細(CEO, 本社, 売上高, 設立, 従業員数, 企業タイプ, ウェブサイト, 事業セグメント)
表 125 古河電気工業:主な事業内容(CEO, 本社, 売上高, 設立, 従業員数, 企業タイプ, ウェブサイト, 事業セグメント製品ベンチマーク
表126 洛陽銅加工有限公司: 主要詳細(CEO, 本社, 売上高, 設立, 従業員数, 企業タイプ, ウェブサイト, 事業セグメント)
表 127 洛陽銅業有限公司: 主要詳細(CEO, 本社, 売上高, 設立, 従業員数, 企業種 類, ウェブサイト, 事業部門):製品ベンチマーク
図の一覧
図 1 伸銅品市場のセグメンテーション
図 2 合金タイプ別圧延銅製品市場:市場魅力度指数
図 3 厚さ別圧延銅製品市場:市場魅力度指数市場魅力度指数
図4 伸銅品市場:形状別:市場魅力度指数市場魅力度指数
図5 圧延銅製品の用途別市場:市場魅力度指数市場魅力度指数
図6 銅圧延製品市場:最終用途産業別市場魅力度指数
図7 伸銅品市場:地域別魅力度指数
図8 伸銅品市場市場ダイナミクス
図 9 伸銅品市場:市場ダイナミクスポーターのファイブフォース分析
図 10 伸銅品世界市場:COVID別シェア予測、2024-2034年(%)
図11 伸銅品の世界地域別市場規模予測(2024年~2034年)(億米ドル、AGR (%))(V字回復シナリオ
図12 銅圧延品の地域別世界市場、2024年~2034年 (億米ドル、AGR (%)) (U字回復シナリオ)
図 13 銅圧延品の地域別世界市場、2024-2034 年(億米ドル、AGR (%))(W 字型回復シナリオ)
図14 銅圧延品の地域別世界市場、2024年~2034年(10億米ドル、AGR (%))(L字型回復シナリオ)
図 15 伸銅品市場:PEST分析
図 16 合金タイプ別圧延銅製品市場:PEST 分析市場魅力度指数
図 17 合金タイプ別圧延銅製品の世界市場:2024 年~2034 年(10 億米ドル、AGR (%)
図 18 合金タイプ別圧延銅製品市場シェア予測、2024 年、2029 年、2034 年 (%)
図 19 純銅製品の地域別市場予測、2024~2034 年 (US$Bn、AGR (%))
図 20 純銅の地域別市場シェア予測、2024 年& 2034 年(%)
図 21 銅合金地域別市場:2024-2034 年(億米ドル、AGR (%)
図 22 銅合金の地域別市場シェア予測、2024 年~2034 年 (%)
図 23 銅圧延品の板厚別市場:市場魅力度指数
図 24 銅圧延品の厚さ別世界市場予測(2024 年~2034 年)(億米ドル、AGR (%)
図 25 厚さ別圧延銅製品市場シェア予測、2024 年、2029 年、2034 年 (%)
図 26 薄板ゲージ(0.2 mm 未満)地域別市場:2024~2034 年(億米ドル、AGR (%)
図27 薄型ゲージ(0.2mm未満)地域別市場シェア予測、2024年~2034年(%)
図28 中ゲージ(0.2~1mm)の地域別市場予測、2024~2034年(10億米ドル、AGR (%)
図 29 ミディアムゲージ(0.2~1 mm)地域別市場シェア予測、2024~2034 年 (%)
図 30 厚ゲージ(1 mm 以上)地域別市場予測、2024~2034 年 (US$ Bn, AGR (%))
図 31 厚板(1 mm 以上)地域別市場シェア予測、2024 年~2034 年 (%)
図 32 形状別圧延銅製品市場:市場魅力度指数
図 33 形状別圧延銅製品の世界市場、2024 年~2034 年 (US$ Bn, AGR (%))
図 34 形状別圧延銅製品市場シェア予測、2024 年、2029 年、2034 年 (%)
図 35 圧延板の地域別市場規模予測(2024~2034 年、10 億米ドル、AGR (%)
図 36 圧延シートの地域別市場シェア予測、2024 年& 2034 年(%)
図 37 巻きストリップの地域別市場:2024~2034年 (億米ドル、AGR (%))
図 38 圧延ストリップの地域別市場シェア予測、2024 年~2034 年 (%)
図 39 圧延箔の地域別市場:2024~2034年 (億米ドル、AGR (%))
図 40 圧延箔の地域別市場シェア予測、2024 年~2034 年(%)
図 41 その他のフォームの地域別市場予測(2024~2034 年)(億米ドル、AGR (%)
図 42 その他の形状の地域別市場シェア予測、2024 年~2034 年 (%)
図 43 用途別圧延銅製品市場市場魅力度指数
図 44 用途別圧延銅製品の世界市場:2024 年~2034 年 (US$ Bn, AGR (%))
図 45 用途別圧延銅製品市場シェア予測、2024 年、2029 年、2034 年 (%)
図 46 プリント回路基板(PCB)地域別市場:2024~2034 年(億米ドル、AGR (%)
図 47 プリント基板(PCB)地域別市場シェア予測、2024 年/2034 年 (%)
図 48 電気配線の地域別市場予測(2024~2034 年)(億米ドル、AGR (%)
図 49 電気配線の地域別市場シェア予測、2024 & 2034 (%)
図50 2024~2034年の地域別屋根材・被覆材市場(億米ドル、AGR (%)
図 51 屋根材と被覆材の地域別市場シェア予測、2024 年~2034 年 (%)
図 52 熱交換器の地域別市場:2024~2034年(億米ドル、AGR (%)
図 53 熱交換器の地域別市場シェア予測、2024 & 2034 (%)
図 54 その他の用途の地域別市場規模予測(2024~2034年、10億米ドル、AGR (%)
図 55 その他の用途の地域別市場シェア予測、2024 年~2034 年 (%)
図 56 銅圧延製品市場:最終用途産業別:市場魅力度指数
図 57 銅圧延製品の世界市場:最終用途産業別、2024 年~2034 年 (US$ Bn, AGR (%))
図 58 銅圧延品の最終用途産業別市場シェア予測(2024 年、2029 年、2034 年) (%)
図 59 電気・電子機器市場の地域別予測(2024~2034 年)(億米ドル、AGR (%)
図 60 地域別電気・電子機器市場シェア予測、2024 年~2034 年 (%)
図 61 2024-2034 年自動車地域別市場予測(億米ドル、AGR (%)
図62 地域別自動車市場シェア予測、2024年~2034年(%)
図63 2024〜2034年建設市場地域別予測(億米ドル、AGR (%)
図64 地域別建設機械市場シェア予測、2024年~2034年(%)
図 65 産業機械の地域別市場規模予測(2024~2034年、10億米ドル、AGR (%)
図 66 産業機械の地域別市場シェア予測、2024年&2034年(%)
図 67 2024-2034 年の地域別消費財市場(億米ドル、AGR (%)
図 68 2024-2034 年消費財地域別市場シェア予測 (%)
図 69 2024-2034 年地域別航空宇宙・防衛市場(億米ドル、AGR (%)
図 70 航空宇宙・防衛市場の地域別シェア予測、2024 年~2034 年(%)
図 71 2024 年と 2034 年の地域別圧延銅製品市場予測(売上高、CAGR)
図 72 2024 年、2029 年、2034 年の圧延銅製品の地域別市場シェア予測(%)
図 73 2024-2034 年の圧延銅製品の世界地域別市場予測 (US$ Bn, AGR (%))
図 74 北米圧延銅製品市場魅力度指数
図 75 北米圧延銅製品地域別市場(2024 年、2029 年、2034 年)(億米ドル
図 76 北米の伸銅品市場:金額ベース(2024 年~2034 年)(億米ドル、AGR (%)
図 77 北米の伸銅品市場:国別(2024-2034 年)(億米ドル、AGR (%)
図 78 北米の伸銅品国別市場シェア予測、2024 年~2034 年 (%)
図 79 北米の圧延銅製品市場:合金タイプ別、2024~2034年 (億米ドル、AGR (%))
図 80 北米圧延銅製品市場合金タイプ別シェア予測、2024 年~2034 年 (%)
図 81 北米の圧延銅製品市場:板厚別(2024~2034 年)(億米ドル、AGR (%))
図 82 北米の伸銅品市場厚さ別シェア予測、2024 年~2034 年 (%)
図 83 北米の圧延銅製品市場:形状別予測(2024~2034 年)(億米ドル、AGR (%))
図 84 北米圧延銅製品市場形態別シェア予測、2024 年・2034 年 (%)
図 85 北米の圧延銅製品市場:用途別予測(2024-2034 年) (US$ Bn, AGR (%))
図 86 北米圧延銅製品市場:用途別シェア予測、2024 年~2034 年 (%)
図87 北米の伸銅品市場:最終用途産業別、2024年~2034年 (億米ドル、AGR (%))
図 88 北米の伸銅品市場:最終用途産業別シェア予測、2024 年~2034 年 (%)
図 89 米国の伸銅品市場:金額ベース、2024 年~2034 年(億米ドル、AGR (%)
図 90 カナダの伸銅品市場:金額(2024-2034 年) (US$ Bn, AGR (%))
図 91 欧州伸銅品市場魅力度指数
図 92 欧州の伸銅品市場:地域別(2024 年、2029 年、2034 年)(億米ドル
図 93 銅圧延製品の欧州市場:金額ベース(2024 年~2034 年)(億米ドル、AGR (%)
図 94 欧州伸銅品市場:国別(2024~2034 年)(億米ドル、AGR (%)
図 95 銅圧延製品の欧州国別市場シェア予測、2024 年~2034 年 (%)
図 96 欧州の圧延銅製品市場:合金タイプ別(2024~2034 年)(億米ドル、AGR (%))
図 97 欧州伸銅品市場合金タイプ別シェア予測、2024 年~2034 年 (%)
図 98 銅圧延製品の厚さ別欧州市場:2024~2034 年 (US$ Bn, AGR (%))
図 99 欧州伸銅品市場厚さ別シェア予測、2024 年~2034 年 (%)
図 100 欧州圧延銅製品市場:形状別予測(2024~2034 年)(億米ドル、AGR (%)
図 101 欧州圧延銅製品市場形態別シェア予測、2024 年・2034 年 (%)
図 102 欧州の圧延銅製品市場:用途別予測(2024-2034年、10億米ドル、AGR (%)
図 103 欧州伸銅品市場用途別シェア予測、2024 年 & 2034 年 (%)
図 104 欧州圧延銅製品市場:最終用途産業別、2024~2034年 (億米ドル、AGR (%))
図 105 欧州伸銅品市場:最終用途産業別シェア予測、2024 年~2034 年 (%)
図 106 ドイツ圧延銅製品市場:金額ベース、2024~2034 年(億米ドル、AGR (%)
図 107 銅圧延品のイギリス市場:金額(億米ドル、AGR (%)
図 108 フランスの伸銅品市場:金額 2024-2034 (US$Bn、AGR (%))
図 109 イタリアの伸銅品市場:金額 2024-2034 (US$Bn、AGR (%))
図 110 スペインの伸銅品市場の金額:2024-2034 年 (US$Bn、AGR (%))
図 111 その他のヨーロッパの伸銅品市場:金額 2024-2034 (US$Bn、AGR (%))
図 112 アジア太平洋地域の伸銅品市場魅力度指数
図 113 アジア太平洋地域の伸銅品市場:地域別(2024 年、2029 年、2034 年)(億米ドル
図 114 アジア太平洋地域の伸銅品市場:金額ベース(2024 年~2034 年、10 億米ドル、AGR (%)
図 115 アジア太平洋地域の伸銅品市場:国別(2024 年~2034 年、10 億米ドル、AGR (%)
図 116 アジア太平洋地域の伸銅品国別市場シェア予測、2024 年~2034 年 (%)
図 117 アジア太平洋地域の圧延銅製品市場:合金タイプ別、2024~2034年 (億米ドル、AGR (%))
図 118 アジア太平洋地域の伸銅品市場:合金タイプ別シェア予測、2024 年~2034 年 (%)
図 119 アジア太平洋地域の圧延銅製品市場:板厚別(2024~2034 年)(億米ドル、AGR (%)
図 120 アジア太平洋地域の伸銅品市場厚さ別シェア予測、2024 年~2034 年 (%)
図 121 アジア太平洋地域の伸銅品市場:形状別予測(2024~2034 年)(億米ドル、AGR (%)
図 122 アジア太平洋地域の伸銅品市場形態別シェア予測、2024 年~2034 年 (%)
図 123 アジア太平洋地域の伸銅品市場:用途別予測(2024~2034年、10億米ドル、AGR (%)
図 124 アジア太平洋地域の伸銅品市場:用途別シェア予測、2024 年~2034 年 (%)
図 125 アジア太平洋地域の伸銅品市場:最終用途産業別、2024年~2034年 (億米ドル、AGR (%))
図 126 アジア太平洋地域の伸銅品市場:最終用途産業別シェア予測、2024 年~2034 年 (%)
図 127 中国の伸銅品市場:金額ベース、2024 年~2034 年(億米ドル、AGR (%)
図 128 インド圧延銅製品市場:金額(億米ドル、AGR (%)
図 129 日本の伸銅品市場:金額 2024-2034 (US$Bn、AGR (%))
図 130 韓国の伸銅品市場:金額 2024-2034 (US$Bn、AGR (%))
図 131 オーストラリアの伸銅品市場:金額 2024-2034 (US$Bn、AGR (%))
図 132 その他のアジア太平洋地域の伸銅品市場:金額 2024-2034 (US$ Bn, AGR (%))
図 133 中東・アフリカ圧延銅製品市場魅力度指数
図 134 中東・アフリカ圧延銅製品地域別市場(2024 年、2029 年、2034 年)(億米ドル
図 135 中東・アフリカの伸銅品市場:金額ベース(2024~2034 年、10 億ドル、AGR (%)
図 136 中東・アフリカ圧延銅製品国別市場:2024~2034年 (億米ドル、AGR (%))
図 137 中東・アフリカ圧延銅製品国別市場シェア予測、2024 年~2034 年 (%)
図 138 中東・アフリカの圧延銅製品市場:合金タイプ別、2024~2034 年 (US$ Bn, AGR (%))
図 139 中東・アフリカ圧延銅製品市場:合金タイプ別シェア予測、2024 年~2034 年 (%)
図 140 中東・アフリカ板厚別伸銅品市場予測:2024~2034 年 (US$ Bn, AGR (%))
図 141 中東・アフリカ板厚別伸銅品市場シェア予測、2024~2034 年 (%)
図 142 中東・アフリカの圧延銅製品市場:形状別予測(2024~2034 年)(億米ドル、AGR (%))
図 143 中東・アフリカ圧延銅製品市場形態別シェア予測、2024 年~2034 年 (%)
図 144 中東・アフリカの圧延銅製品市場:用途別予測(2024~2034 年)(億米ドル、AGR (%))
図 145 中東・アフリカの用途別伸銅品市場シェア予測、2024 年~2034 年 (%)
図 146 中東・アフリカの圧延銅製品市場:最終用途産業別 (2024-2034 年) (US$ Bn, AGR (%))
図 147 中東・アフリカの伸銅品市場:最終用途産業別シェア予測、2024 年~2034 年 (%)
図 148 2024-2034 年の GCC 銅圧延品市場規模別シェア(億米ドル、AGR (%)
図 149 南アフリカの伸銅品市場:金額(億米ドル、AGR (%)
図 150 その他の中東・アフリカの伸銅品市場:金額(億米ドル、AGR (%)
図 151 中南米の圧延銅製品市場魅力度指数
図 152 ラテンアメリカ圧延銅製品地域別市場(2024 年、2029 年、2034 年)(億米ドル
図 153 中南米の伸銅品市場:金額ベース(2024~2034 年、10 億米ドル、AGR (%)
図 154 ラテンアメリカの伸銅品市場:国別(2024~2034 年)(億米ドル、AGR (%))
図 155 ラテンアメリカの伸銅品国別市場シェア予測、2024 年~2034 年 (%)
図 156 中南米の圧延銅製品市場:合金タイプ別、2024~2034年 (億米ドル、AGR (%))
図 157 中南米の圧延銅製品市場合金タイプ別シェア予測、2024~2034 年 (%)
図 158 中南米の圧延銅製品市場:板厚別(2024~2034年、20億米ドル、AGR (%)
図 159 中南米の伸銅品市場厚さ別シェア予測、2024~2034 年 (%)
図 160 中南米の圧延銅製品市場:形状別予測(2024~2034年、20億米ドル、AGR (%)
図 161 ラテンアメリカ圧延銅製品市場形態別シェア予測、2024 年~2034 年 (%)
図 162 ラテンアメリカの圧延銅製品市場:用途別予測(2024~2034年、20億米ドル、AGR (%)
図 163 ラテンアメリカ圧延銅製品市場用途別シェア予測、2024 年~2034 年 (%)
図 164 ラテンアメリカの伸銅品市場:最終用途産業別、2024~2034年 (億米ドル、AGR (%))
図 165 ラテンアメリカ銅圧延品市場:最終用途産業別シェア予測、2024 年~2034 年 (%)
図 166 チリ銅圧延品市場:金額ベース(2024~2034 年)(億米ドル、AGR (%))
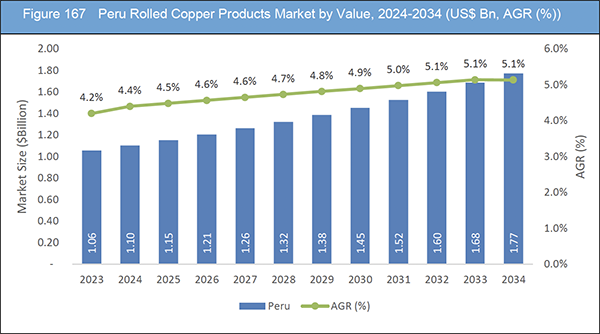
図 167 ペルーの伸銅品市場:金額(2024~2034 年)(億米ドル、AGR (%))
図 168 その他のラテンアメリカの伸銅品市場:金額(US$ Bn、AGR (%)
図 169 伸銅品市場:企業シェア、2023 年
図 170 Aurubis AG.:純収入、2019~2023 年(百万米ドル、AGR)
図 171 Aurubis AG.:地域別売上高シェア、2023 年 (%)
図 172 Aurubis AG.:事業別収益シェア、2023 年(%)
図 173 Jiangxi Copper Company:純収入, 2018-2022 (百万米ドル, AGR%)
図 174 Jiangxi Copper Company:R&D, 2018-2022 (百万米ドル, AGR%)
図 175 Jiangxi Copper Company:地域別収益シェア, 2022 (%)
図 176 Jiangxi Copper Company:事業別収益シェア, 2022 (%)
図 177 三菱マテリアル純収入, 2019-2023 (百万米ドル, AGR%)
図 178 中国冶金公司:純収入、2019-2023 年 (100 万米ドル、AGR%)
図 179 中国冶金公司..:R&D, 2019-2023 (百万米ドル, AGR%)
図 180 中国冶金公司:地域別売上高シェア、2023 年 (%)
図 181 中国冶金公司:事業別売上高シェア、2023 年(%)
図 182 フリーポート・マクモラン社: 純収入, 2019-2023 (US$ Million, AGR%)
図 183 フリーポート・マクモラン Inc:R&D, 2019-2023 (百万米ドル, AGR%)
図 184 フリーポート・マクモラン社: 事業セグメント収益シェア, 2023 (%)
図 185 ミューラー・インダストリーズ:純収入、2019年~2023年(百万米ドル、AGR)
図 186 ミューラー・インダストリーズ:地域別収益シェア、2023 年(%)
図 187 ミューラー・インダストリーズ:事業セグメント別売上高シェア、2023 年(%)
図 188 古河電気工業:純収入、2018 年~2022 年(百万米ドル、AGR)
図 189 古河電気工業(株):R&D, 2018-2022 (US$ Million, AGR%)
図 190 古河電気工業(株):地域別売上高シェア, 2022 (%)
図 191 洛陽銅加工有限公司:純収入、2019 年~2023 年(百万米ドル、AGR)
図 192 中国洛陽銅加工有限公司(Chinalco Luoyang Copper Processing Co., Ltd.):R&D, 2019-2023 (百万米ドル, AGR%)
図 193 洛陽銅加工有限公司: 事業セグメント売上高シェア, 2022 (%)
ページTOPに戻る
Summary
Report Details
The Rolled Copper Products Market Report 2024-2034: This report will prove invaluable to leading firms striving for new revenue pockets if they wish to better understand the industry and its underlying dynamics. It will be useful for companies that would like to expand into different industries or to expand their existing operations in a new region.
The Increasing Demand for Copper in Various Industries, Including Construction, Electronics, Automotive, and Telecommunications, Is Fuelling the Market’s Expansion
The global rolled copper products market is experiencing steady growth, driven by several key factors. The increasing demand for copper in various industries, including construction, electronics, automotive, and telecommunications, is fuelling the market’s expansion. Rolled copper products, such as sheets, strips, and foils, are essential components in electrical wiring, plumbing systems, electronic devices, and architectural applications, contributing to their widespread adoption.
Furthermore, the growing emphasis on sustainable and energy-efficient solutions is driving the demand for copper products. Copper’s excellent conductivity, durability, and recyclability make it an ideal choice for green building initiatives, renewable energy systems, and electric vehicles. As governments worldwide implement stringent regulations and initiatives to promote sustainability and reduce carbon emissions, the demand for rolled copper products is expected to continue growing.
Amidst the market’s growth, several opportunities and challenges exist for industry players. The increasing adoption of antimicrobial copper surfaces in healthcare facilities and public spaces presents a significant opportunity for manufacturers of rolled copper products. The antimicrobial properties of copper make it effective in reducing the spread of pathogens, including bacteria and viruses, enhancing its appeal for use in high-touch surfaces.
Availability of Alternative Metal Foils Hinder the Market Growth
The availability of alternative metal foils poses a significant restraining factor in the copper market, particularly with the emergence of innovative materials that mimic the properties of precious metals like gold and silver. Japanese scientists have made significant strides in transforming copper-based substances into materials that replicate the characteristics of costly metals, offering promising applications in electronic device production. This breakthrough, involving the creation of copper nanoparticles, opens avenues for the development of electronic components that traditionally rely on expensive gold and silver counterparts.
What Questions Should You Ask before Buying a Market Research Report?
-
How is the rolled copper products market evolving?
-
What is driving and restraining the rolled copper products market?
-
How will each rolled copper products submarket segment grow over the forecast period and how much revenue will these submarkets account for in 2034?
-
How will the market shares for each rolled copper products submarket develop from 2024 to 2034?
-
What will be the main driver for the overall market from 2024 to 2034?
-
Will leading rolled copper products markets broadly follow the macroeconomic dynamics, or will individual national markets outperform others?
-
How will the market shares of the national markets change by 2034 and which geographical region will lead the market in 2034?
-
Who are the leading players and what are their prospects over the forecast period?
-
What are the rolled copper products projects for these leading companies?
-
How will the industry evolve during the period between 2024 and 2034? What are the implications of rolled copper products projects taking place now and over the next 10 years?
-
Is there a greater need for product commercialisation to further scale the rolled copper products market?
-
Where is the rolled copper products market heading and how can you ensure you are at the forefront of the market?
-
What are the best investment options for new product and service lines?
-
What are the key prospects for moving companies into a new growth path and C-suite?
You need to discover how this will impact the rolled copper products market today, and over the next 10 years:
-
Our 386-page report provides 127 tables and 193 charts/graphs exclusively to you.
-
The report highlights key lucrative areas in the industry so you can target them – NOW.
-
It contains in-depth analysis of global, regional and national sales and growth.
-
It highlights for you the key successful trends, changes and revenue projections made by your competitors.
This report tells you TODAY how the rolled copper products market will develop in the next 10 years, and in line with the variations in COVID-19 economic recession and bounce. This market is more critical now than at any point over the last 10 years.
Forecasts to 2034 and other analyses reveal commercial prospects
-
In addition to revenue forecasting to 2034, our new study provides you with recent results, growth rates, and market shares.
-
You will find original analyses, with business outlooks and developments.
-
Discover qualitative analyses (including market dynamics, drivers, opportunities, restraints and challenges), cost structure, impact of rising rolled copper products prices and recent developments.
This report includes data analysis and invaluable insight into how COVID-19 will affect the industry and your company. Four COVID-19 recovery patterns and their impact, namely, “V”, “L”, “W” and “U” are discussed in this report.
Segments Covered in the Report
Market Segment by Alloy Type
-
Pure Copper
-
Copper Alloys
Market Segment by Thickness
-
Thin Gauge (Less than 0.2 mm)
-
Medium Gauge (0.2-1 mm)
-
Thick Gauge (More than 1 mm)
Market Segment by Form
-
Rolled Sheets
-
Rolled Strips
-
Rolled Foils
-
Other Form
Market Segment by Application
-
Printed Circuit Boards (PCBs)
-
Electrical Wiring
-
Roofing and Cladding
-
Heat Exchangers
-
Other Applications
Market Segment by End-Use Industry
-
Electrical & Electronics
-
Automotive
-
Construction
-
Industrial Machinery
-
Consumer Goods
-
Aerospace & Defence
In addition to the revenue predictions for the overall world market and segments, you will also find revenue forecasts for four regional and 20 leading national markets:
North America
Europe
-
Germany
-
Spain
-
United Kingdom
-
France
-
Italy
-
Rest of Europe
Asia Pacific
-
China
-
Japan
-
India
-
Australia
-
South Korea
-
Rest of Asia Pacific
Latin America
-
Brazil
-
Mexico
-
Rest of Latin America
Middle East & Africa
-
GCC
-
South Africa
-
Rest of Middle East & Africa
The report also includes profiles and for some of the leading companies in the Rolled Copper Products Market, 2024 to 2034, with a focus on this segment of these companies’ operations.
Leading companies and the potential for market growth
-
Aurubis AG
-
Chinalco Luoyang Copper Processing Co., Ltd.
-
Freeport-McMoRan Inc.
-
Furukawa Electric Co., Ltd.
-
Jiangxi Copper Company
-
JX Nippon Mining & Metals Corporation
-
LS-Nikko Copper Inc.
-
Metallurgical Corporation of China
-
Mitsubishi Materials Corporation
-
Mueller Industries
-
Ningbo Jintian Copper (Group) Co., Ltd.
-
Sam Dong
-
Southwire Company, LLC
-
Wieland Electric GmbH
-
Wieland-Werke AG
Overall world revenue for Rolled Copper Products Market, 2024 to 2034 in terms of value the market will surpass US$26.16 billion in 2024, our work calculates. We predict strong revenue growth through to 2034. Our work identifies which organizations hold the greatest potential. Discover their capabilities, progress, and commercial prospects, helping you stay ahead.
How will the Rolled Copper Products Market, 2024 to 2034 report help you?
In summary, our 380+ page report provides you with the following knowledge:
-
Revenue forecasts to 2034 for Rolled Copper Products Market, 2024 to 2034 Market, with forecasts for alloy type, thickness, form, application, and end-use industry, each forecast at a global and regional level – discover the industry’s prospects, finding the most lucrative places for investments and revenues.
-
Revenue forecasts to 2034 for four regional and 20 key national markets – See forecasts for the Rolled Copper Products Market, 2024 to 2034 market in North America, Europe, Asia-Pacific, Latin America and Middle East & Africa. Also forecasted is the market in the US, Canada, Brazil, Germany, France, UK, Italy, China, India, Japan, and Australia among other prominent economies.
-
Prospects for established firms and those seeking to enter the market – including company profiles for 15 of the major companies involved in the Rolled Copper Products Market, 2024 to 2034.
Find quantitative and qualitative analyses with independent predictions. Receive information that only our report contains, staying informed with invaluable business intelligence.
Information found nowhere else
With our new report, you are less likely to fall behind in knowledge or miss out on opportunities. See how our work could benefit your research, analyses, and decisions. Visiongain’s study is for everybody needing commercial analyses for the Rolled Copper Products Market, 2024 to 2034, market-leading companies. You will find data, trends and predictions.
ページTOPに戻る
Table of Contents
1 Report Overview
1.1 Objectives of the Study
1.2 Introduction to Rolled Copper Products Market
1.3 What This Report Delivers
1.4 Why You Should Read This Report
1.5 Key Questions Answered by This Analytical Report
1.6 Who Is This Report for?
1.7 Methodology
1.7.1 Market Definitions
1.7.2 Market Evaluation & Forecasting Methodology
1.7.3 Data Validation
1.7.3.1 Primary Research
1.7.3.2 Secondary Research
1.8 Frequently Asked Questions (FAQs)
1.9 Associated Visiongain Reports
1.10 About Visiongain
2 Executive Summary
3 Market Overview
3.1 Key Findings
3.2 Market Dynamics
3.2.1 Market Driving Factors
3.2.1.1 The Speedily Growing Electronics Industry and Rise of Smartphones
3.2.1.2 Copper Rolled Product Business for Automotive Terminals and Connectors
3.2.1.3 Growing Demand from Construction Industry
3.2.2 Market Restraining Factors
3.2.2.1 Availability of Alternative Metal Foils Hinder the Market Growth
3.2.2.2 Copper Shortages Present New Manufacturing Challenges
3.2.2.3 Fluctuating Raw Material Prices Hinder the Market Growth
3.2.3 Market Opportunities
3.2.3.1 Rapid Industrialization and Urbanization in Emerging Economies Present Significant Growth Opportunities
3.2.3.2 Geographical Expansion into New Markets or Regions with High Demand for Copper Products
3.2.3.3 Collaboration and Partnership Between Market Players Opportunities for the Market
3.3 Porter’s Five Forces Analysis
3.3.1 Bargaining Power of Suppliers (Medium)
3.3.2 Bargaining Power of Buyers (Low to Medium)
3.3.3 Competitive Rivalry (High)
3.3.4 Threat from Substitutes (Low)
3.3.5 Threat of New Entrants (Low)
3.4 COVID-19 Impact Analysis
3.4.1 “V-Shaped Recovery”
3.4.2 “U-Shaped Recovery”
3.4.3 “W-Shaped Recovery”
3.4.4 “L-Shaped Recovery”
3.5 PEST Analysis
4 Rolled Copper Products Market Analysis by Alloy Type
4.1 Key Findings
4.2 Alloy Type Segment: Market Attractiveness Index
4.3 Rolled Copper Products Market Size Estimation and Forecast by Alloy Type
4.4 Pure Copper
4.4.1 Market Size by Region, 2024-2034 (US$ Billion)
4.4.2 Market Share by Region, 2024 & 2034 (%)
4.5 Copper Alloys
4.5.1 Market Size by Region, 2024-2034 (US$ Billion)
4.5.2 Market Share by Region, 2024 & 2034 (%)
5 Rolled Copper Products Market Analysis by Thickness
5.1 Key Findings
5.2 Thickness Segment: Market Attractiveness Index
5.3 Rolled Copper Products Market Size Estimation and Forecast by Thickness
5.4 Thin Gauge (Less than 0.2 mm)
5.4.1 Market Size by Region, 2024-2034 (US$ Billion)
5.4.2 Market Share by Region, 2024 & 2034 (%)
5.5 Medium Gauge (0.2 - 1 mm)
5.5.1 Market Size by Region, 2024-2034 (US$ Billion)
5.5.2 Market Share by Region, 2024 & 2034 (%)
5.6 Thick Gauge (More than 1 mm)
5.6.1 Market Size by Region, 2024-2034 (US$ Billion)
5.6.2 Market Share by Region, 2024 & 2034 (%)
6 Rolled Copper Products Market Analysis by Form
6.1 Key Findings
6.2 Form Segment: Market Attractiveness Index
6.3 Rolled Copper Products Market Size Estimation and Forecast by Form
6.4 Rolled Sheets
6.4.1 Market Size by Region, 2024-2034 (US$ Billion)
6.4.2 Market Share by Region, 2024 & 2034 (%)
6.5 Rolled Strips
6.5.1 Market Size by Region, 2024-2034 (US$ Billion)
6.5.2 Market Share by Region, 2024 & 2034 (%)
6.6 Rolled Foils
6.6.1 Market Size by Region, 2024-2034 (US$ Billion)
6.6.2 Market Share by Region, 2024 & 2034 (%)
6.7 Other Form
6.7.1 Market Size by Region, 2024-2034 (US$ Billion)
6.7.2 Market Share by Region, 2024 & 2034 (%)
7 Rolled Copper Products Market Analysis by Application
7.1 Key Findings
7.2 Application Segment: Market Attractiveness Index
7.3 Rolled Copper Products Market Size Estimation and Forecast by Application
7.4 Printed Circuit Boards (PCBs)
7.4.1 Market Size by Region, 2024-2034 (US$ Billion)
7.4.2 Market Share by Region, 2024 & 2034 (%)
7.5 Electrical Wiring
7.5.1 Market Size by Region, 2024-2034 (US$ Billion)
7.5.2 Market Share by Region, 2024 & 2034 (%)
7.6 Roofing and Cladding
7.6.1 Market Size by Region, 2024-2034 (US$ Billion)
7.6.2 Market Share by Region, 2024 & 2034 (%)
7.7 Heat Exchangers
7.7.1 Market Size by Region, 2024-2034 (US$ Billion)
7.7.2 Market Share by Region, 2024 & 2034 (%)
7.8 Other Applications
7.8.1 Market Size by Region, 2024-2034 (US$ Billion)
7.8.2 Market Share by Region, 2024 & 2034 (%)
8 Rolled Copper Products Market Analysis by End-Use Industry
8.1 Key Findings
8.2 End-Use Industry Segment: Market Attractiveness Index
8.3 Rolled Copper Products Market Size Estimation and Forecast by End-Use Industry
8.4 Electrical & Electronics
8.4.1 Market Size by Region, 2024-2034 (US$ Million)
8.4.2 Market Share by Region, 2024 & 2034 (%)
8.5 Automotive
8.5.1 Market Size by Region, 2024-2034 (US$ Million)
8.5.2 Market Share by Region, 2024 & 2034 (%)
8.6 Construction
8.6.1 Market Size by Region, 2024-2034 (US$ Million)
8.6.2 Market Share by Region, 2024 & 2034 (%)
8.7 Industrial Machinery
8.7.1 Market Size by Region, 2024-2034 (US$ Million)
8.7.2 Market Share by Region, 2024 & 2034 (%)
8.8 Consumer Goods
8.8.1 Market Size by Region, 2024-2034 (US$ Million)
8.8.2 Market Share by Region, 2024 & 2034 (%)
8.9 Aerospace & Defence
8.9.1 Market Size by Region, 2024-2034 (US$ Million)
8.9.2 Market Share by Region, 2024 & 2034 (%)
9 Rolled Copper Products Market Analysis by Region
9.1 Key Findings
9.2 Regional Market Size Estimation and Forecast
10 North America Rolled Copper Products Market Analysis
10.1 Key Findings
10.2 North America Rolled Copper Products Market Attractiveness Index
10.3 North America Rolled Copper Products Market by Country, 2024, 2029 & 2034 (US$ Billion)
10.4 North America Rolled Copper Products Market Size Estimation and Forecast
10.5 North America Rolled Copper Products Market Size Estimation and Forecast by Country
10.6 North America Rolled Copper Products Market Size Estimation and Forecast by Alloy Type
10.7 North America Rolled Copper Products Market Size Estimation and Forecast by Thickness
10.8 North America Rolled Copper Products Market Size Estimation and Forecast by Form
10.9 North America Rolled Copper Products Market Size Estimation and Forecast by Application
10.10 North America Rolled Copper Products Market Size Estimation and Forecast by End-Use Industry
10.11 U.S. Rolled Copper Products Market Analysis
10.12 Canada Rolled Copper Products Market Analysis
11 Europe Rolled Copper Products Market Analysis
11.1 Key Findings
11.2 Europe Rolled Copper Products Market Attractiveness Index
11.3 Europe Rolled Copper Products Market by Country, 2024, 2029 & 2034 (US$ Billion)
11.4 Europe Rolled Copper Products Market Size Estimation and Forecast
11.5 Europe Rolled Copper Products Market Size Estimation and Forecast by Country
11.6 Europe Rolled Copper Products Market Size Estimation and Forecast by Alloy Type
11.7 Europe Rolled Copper Products Market Size Estimation and Forecast by Thickness
11.8 Europe Rolled Copper Products Market Size Estimation and Forecast by Form
11.9 Europe Rolled Copper Products Market Size Estimation and Forecast by Application
11.10 Europe Rolled Copper Products Market Size Estimation and Forecast by End-Use Industry
11.11 Germany Rolled Copper Products Market Analysis
11.12 UK Rolled Copper Products Market Analysis
11.13 France Rolled Copper Products Market Analysis
11.14 Italy Rolled Copper Products Market Analysis
11.15 Spain Rolled Copper Products Market Analysis
11.16 Rest of Europe Rolled Copper Products Market Analysis
12 Asia-Pacific Rolled Copper Products Market Analysis
12.1 Key Findings
12.2 Asia-Pacific Rolled Copper Products Market Attractiveness Index
12.3 Asia-Pacific Rolled Copper Products Market by Country, 2024, 2029 & 2034 (US$ Billion)
12.4 Asia-Pacific Rolled Copper Products Market Size Estimation and Forecast
12.5 Asia-Pacific Rolled Copper Products Market Size Estimation and Forecast by Country
12.6 Asia-Pacific Rolled Copper Products Market Size Estimation and Forecast by Alloy Type
12.7 Asia-Pacific Rolled Copper Products Market Size Estimation and Forecast by Thickness
12.8 Asia-Pacific Rolled Copper Products Market Size Estimation and Forecast by Form
12.9 Asia-Pacific Rolled Copper Products Market Size Estimation and Forecast by Application
12.10 Asia-Pacific Rolled Copper Products Market Size Estimation and Forecast by End-Use Industry
12.11 China Rolled Copper Products Market Analysis
12.12 India Rolled Copper Products Market Analysis
12.13 Japan Rolled Copper Products Market Analysis
12.14 South Korea Rolled Copper Products Market Analysis
12.15 Australia Rolled Copper Products Market Analysis
12.16 Rest of Asia-Pacific Rolled Copper Products Market Analysis
13 Middle East and Africa Rolled Copper Products Market Analysis
13.1 Key Findings
13.2 Middle East and Africa Rolled Copper Products Market Attractiveness Index
13.3 Middle East and Africa Rolled Copper Products Market by Country, 2024, 2029 & 2034 (US$ Billion)
13.4 Middle East and Africa Rolled Copper Products Market Size Estimation and Forecast
13.5 Middle East and Africa Rolled Copper Products Market Size Estimation and Forecast by Country
13.6 Middle East and Africa Rolled Copper Products Market Size Estimation and Forecast by Alloy Type
13.7 Middle East and Africa Rolled Copper Products Market Size Estimation and Forecast by Thickness
13.8 Middle East and Africa Rolled Copper Products Market Size Estimation and Forecast by Form
13.9 Middle East and Africa Rolled Copper Products Market Size Estimation and Forecast by Application
13.10 Middle East and Africa Rolled Copper Products Market Size Estimation and Forecast by End-Use Industry
13.11 GCC Rolled Copper Products Market Analysis
13.12 South Africa Rolled Copper Products Market Analysis
13.13 Rest of Middle East & Africa Rolled Copper Products Market Analysis
14 Latin America Rolled Copper Products Market Analysis
14.1 Key Findings
14.2 Latin America Rolled Copper Products Market Attractiveness Index
14.3 Latin America Rolled Copper Products Market by Country, 2024, 2029 & 2034 (US$ Billion)
14.4 Latin America Rolled Copper Products Market Size Estimation and Forecast
14.5 Latin America Rolled Copper Products Market Size Estimation and Forecast by Country
14.6 Latin America Rolled Copper Products Market Size Estimation and Forecast by Alloy Type
14.7 Latin America Rolled Copper Products Market Size Estimation and Forecast by Thickness
14.8 Latin America Rolled Copper Products Market Size Estimation and Forecast by Form
14.9 Latin America Rolled Copper Products Market Size Estimation and Forecast by Application
14.10 Latin America Rolled Copper Products Market Size Estimation and Forecast by End-Use Industry
14.11 Chile Rolled Copper Products Market Analysis
14.12 Peru Rolled Copper Products Market Analysis
14.13 Rest of Latin America Rolled Copper Products Market Analysis
15 Company Profiles
15.1 Competitive Landscape, 2023
15.2 Strategic Outlook
15.3 Aurubis AG
15.3.1 Company Snapshot
15.3.2 Company Overview
15.3.3 Financial Analysis
15.3.3.1 Net Revenue, 2019-2023
15.3.3.2 Regional Revenue Share, 2023 (%)
15.3.3.3 Business Segment Revenue Share, 2023 (%)
15.3.4 Product Benchmarking
15.3.5 Strategic Outlook
15.4 Jiangxi Copper Company
15.4.1 Company Snapshot
15.4.2 Company Overview
15.4.3 Financial Analysis
15.4.3.1 Net Revenue, 2018-2022
15.4.3.2 R&D, 2018-2022
15.4.3.3 Regional Revenue Share, 2022 (%)
15.4.3.4 Business Segment Revenue Share, 2022 (%)
15.4.4 Product Benchmarking
15.4.5 Strategic Outlook
15.5 Mitsubishi Materials Corporation
15.5.1 Company Snapshot
15.5.2 Company Overview
15.5.3 Financial Analysis
15.5.3.1 Net Revenue, 2019-2023
15.5.4 Product Benchmarking
15.5.5 Strategic Outlook
15.6 Wieland-Werke AG
15.6.1 Company Snapshot
15.6.2 Company Overview
15.6.3 Product Benchmarking
15.6.4 Strategic Outlook
15.7 Metallurgical Corporation of China
15.7.1 Company Snapshot
15.7.2 Company Overview
15.7.3 Financial Analysis
15.7.3.1 Net Revenue, 2019-2023
15.7.3.2 R&D, 2019-2023
15.7.3.3 Regional Revenue Share, 2023 (%)
15.7.3.4 Business Segment Revenue Share, 2023 (%)
15.7.4 Product Benchmarking
15.8 JX Nippon Mining & Metals Corporation
15.8.1 Company Snapshot
15.8.2 Company Overview
15.8.3 Product Benchmarking
15.8.4 Strategic Outlook
15.9 Freeport-McMoRan Inc.
15.9.1 Company Snapshot
15.9.2 Company Overview
15.9.3 Financial Analysis
15.9.3.1 Net Revenue, 2019-2023
15.9.3.2 R&D, 2019-2023
15.9.3.3 Business Segment Revenue Share, 2023 (%)
15.9.4 Product Benchmarking
15.10 Sam Dong
15.10.1 Company Snapshot
15.10.2 Company Overview
15.10.3 Product Benchmarking
15.11 Ningbo Jintian Copper (Group) Co., Ltd.
15.11.1 Company Snapshot
15.11.2 Company Overview
15.11.3 Product Benchmarking
15.12 Wieland Electric GmbH
15.12.1 Company Snapshot
15.12.2 Company Overview
15.12.3 Product Benchmarking
15.12.4 Strategic Outlook
15.13 Southwire Company, LLC
15.13.1 Company Snapshot
15.13.2 Company Overview
15.13.3 Product Benchmarking
15.13.4 Strategic Outlook
15.14 LS-Nikko Copper Inc.
15.14.1 Company Snapshot
15.14.2 Company Overview
15.14.3 Product Benchmarking
15.14.4 Strategic Outlook
15.15 Mueller Industries
15.15.1 Company Snapshot
15.15.2 Company Overview
15.15.3 Financial Analysis
15.15.3.1 Net Revenue, 2019-2023
15.15.3.2 Regional Revenue Share, 2023 (%)
15.15.3.3 Business Segment Revenue Share, 2023 (%)
15.15.4 Product Benchmarking
15.16 Furukawa Electric Co., Ltd.
15.16.1 Company Snapshot
15.16.2 Company Overview
15.16.3 Financial Analysis
15.16.3.1 Net Revenue, 2018-2022
15.16.3.2 R&D, 2018-2022
15.16.3.3 Regional Revenue Share, 2022 (%)
15.16.4 Product Benchmarking
15.17 Chinalco Luoyang Copper Processing Co., Ltd.
15.17.1 Company Snapshot
15.17.2 Company Overview
15.17.3 Financial Analysis
15.17.3.1 Net Revenue, 2019-2023
15.17.3.2 R&D, 2019-2023
15.17.3.3 Business Segment Revenue Share, 2023 (%)
15.17.4 Product Benchmarking
16 Conclusion and Recommendations
16.1 Concluding Remarks from Visiongain
16.2 Recommendations for Market Players
ページTOPに戻る
List of Tables/Graphs
List of Tables
Table 1 Rolled Copper Products Market Snapshot, 2024 & 2034 (US$ Billion, CAGR %)
Table 2 Global Rolled Copper Products Market by Region, 2024-2034 (US$ Bn, AGR (%), CAGR (%)) (V-Shaped Recovery Scenario)
Table 3 Global Rolled Copper Products Market by Region, 2024-2034 (US$ Bn, AGR (%), CAGR (%)) (U-Shaped Recovery Scenario)
Table 4 Global Rolled Copper Products Market by Region, 2024-2034 (US$ Bn, AGR (%), CAGR (%)) (W-Shaped Recovery Scenario)
Table 5 Global Rolled Copper Products Market by Region, 2024-2034 (US$ Bn, AGR (%), CAGR (%)) (L-Shaped Recovery Scenario)
Table 6 Global Rolled Copper Products Market by Alloy Type, 2024-2034 (US$ Bn, AGR (%), CAGR (%))
Table 7 Copper Price Monthly Analysis
Table 8 Pure Copper Market by Region, 2024-2034 (US$ Bn, AGR (%), CAGR (%))
Table 9 Copper Alloys Market by Region, 2024-2034 (US$ Bn, AGR (%), CAGR (%))
Table 10 Global Rolled Copper Products Market by Thickness, 2024-2034 (US$ Bn, AGR (%), CAGR (%))
Table 11 Thin Gauge (Less than 0.2 mm) Market by Region, 2024-2034 (US$ Bn, AGR (%), CAGR (%))
Table 12 Medium Gauge (0.2 - 1 mm) Market by Region, 2024-2034 (US$ Bn, AGR (%), CAGR (%))
Table 13 Thick Gauge (More than 1 mm) Market by Region, 2024-2034 (US$ Bn, AGR (%), CAGR (%))
Table 14 Global Rolled Copper Products Market by Form, 2024-2034 (US$ Bn, AGR (%), CAGR (%))
Table 15 Rolled Sheets Market by Region, 2024-2034 (US$ Bn, AGR (%), CAGR (%))
Table 16 Rolled Strips Market by Region, 2024-2034 (US$ Bn, AGR (%), CAGR (%))
Table 17 Rolled Foils Market by Region, 2024-2034 (US$ Bn, AGR (%), CAGR (%))
Table 18 Other Form Market by Region, 2024-2034 (US$ Bn, AGR (%), CAGR (%))
Table 19 Global Rolled Copper Products Market by Application, 2024-2034 (US$ Bn, AGR (%), CAGR (%))
Table 20 PCB
Table 21 Printed Circuit Boards (PCBs) Market by Region, 2024-2034 (US$ Bn, AGR (%), CAGR (%))
Table 22 Electrical Wiring Market by Region, 2024-2034 (US$ Bn, AGR (%), CAGR (%))
Table 23 Roofing and Cladding Market by Region, 2024-2034 (US$ Bn, AGR (%), CAGR (%))
Table 24 Heat Exchangers Market by Region, 2024-2034 (US$ Bn, AGR (%), CAGR (%))
Table 25 Other Applications Market by Region, 2024-2034 (US$ Bn, AGR (%), CAGR (%))
Table 26 Global Rolled Copper Products Market by End-Use Industry, 2024-2034 (US$ Bn, AGR (%), CAGR (%))
Table 27 Electrical & Electronics Market by Region, 2024-2034 (US$ Bn, AGR (%), CAGR (%))
Table 28 Automotive Market by Region, 2024-2034 (US$ Bn, AGR (%), CAGR (%))
Table 29 Construction Market by Region, 2024-2034 (US$ Bn, AGR (%), CAGR (%))
Table 30 Industrial Machinery Market by Region, 2024-2034 (US$ Bn, AGR (%), CAGR (%))
Table 31 Consumer Goods Market by Region, 2024-2034 (US$ Bn, AGR (%), CAGR (%))
Table 32 Aerospace & Defence Market by Region, 2024-2034 (US$ Bn, AGR (%), CAGR (%))
Table 33 Global Rolled Copper Products Market by Region, 2024-2034 (US$ Bn, AGR (%), CAGR (%))
Table 34 North America Rolled Copper Products Market by Value, 2024-2034 (US$ Bn, AGR (%), CAGR (%))
Table 35 North America Rolled Copper Products Market by Country, 2024-2034 (US$ Bn, AGR (%), CAGR (%))
Table 36 North America Rolled Copper Products Market by Alloy Type, 2024-2034 (US$ Bn, AGR (%), CAGR (%))
Table 37 North America Rolled Copper Products Market by Thickness, 2024-2034 (US$ Bn, AGR (%), CAGR (%))
Table 38 North America Rolled Copper Products Market by Form, 2024-2034 (US$ Bn, AGR (%), CAGR (%))
Table 39 North America Rolled Copper Products Market by Application, 2024-2034 (US$ Bn, AGR (%), CAGR (%))
Table 40 North America Rolled Copper Products Market by End-Use Industry, 2024-2034 (US$ Bn, AGR (%), CAGR (%))
Table 41 US Rolled Copper Products Market by Value, 2024-2034 (US$ Bn, AGR (%), CAGR (%))
Table 42 Canada Rolled Copper Products Market by Value, 2024-2034 (US$ Bn, AGR (%), CAGR (%))
Table 43 Europe Rolled Copper Products Market by Value, 2024-2034 (US$ Bn, AGR (%), CAGR (%))
Table 44 Europe Rolled Copper Products Market by Country, 2024-2034 (US$ Bn, AGR (%), CAGR (%))
Table 45 Europe Rolled Copper Products Market by Alloy Type, 2024-2034 (US$ Bn, AGR (%), CAGR (%))
Table 46 Europe Rolled Copper Products Market by Thickness, 2024-2034 (US$ Bn, AGR (%), CAGR (%))
Table 47 Europe Rolled Copper Products Market by Form, 2024-2034 (US$ Bn, AGR (%), CAGR (%))
Table 48 Europe Rolled Copper Products Market by Application, 2024-2034 (US$ Bn, AGR (%), CAGR (%))
Table 49 Europe Rolled Copper Products Market by End-Use Industry, 2024-2034 (US$ Bn, AGR (%), CAGR (%))
Table 50 Germany Rolled Copper Products Market by Value, 2024-2034 (US$ Bn, AGR (%), CAGR (%))
Table 51 UK Rolled Copper Products Market by Value, 2024-2034 (US$ Bn, AGR (%), CAGR (%))
Table 52 France Rolled Copper Products Market by Value, 2024-2034 (US$ Bn, AGR (%), CAGR (%))
Table 53 Italy Rolled Copper Products Market by Value, 2024-2034 (US$ Bn, AGR (%), CAGR (%))
Table 54 Spain Rolled Copper Products Market by Value, 2024-2034 (US$ Bn, AGR (%), CAGR (%))
Table 55 Rest of Europe Rolled Copper Products Market by Value, 2024-2034 (US$ Bn, AGR (%), CAGR (%))
Table 56 Asia-Pacific Rolled Copper Products Market by Value, 2024-2034 (US$ Bn, AGR (%), CAGR (%))
Table 57 Asia-Pacific Rolled Copper Products Market by Country, 2024-2034 (US$ Bn, AGR (%), CAGR (%))
Table 58 Asia-Pacific Rolled Copper Products Market by Alloy Type, 2024-2034 (US$ Bn, AGR (%), CAGR (%))
Table 59 Asia-Pacific Rolled Copper Products Market by Thickness, 2024-2034 (US$ Bn, AGR (%), CAGR (%))
Table 60 Asia-Pacific Rolled Copper Products Market by Form, 2024-2034 (US$ Bn, AGR (%), CAGR (%))
Table 61 Asia-Pacific Rolled Copper Products Market by Application, 2024-2034 (US$ Bn, AGR (%), CAGR (%))
Table 62 Asia-Pacific Rolled Copper Products Market by End-Use Industry, 2024-2034 (US$ Bn, AGR (%), CAGR (%))
Table 63 China Rolled Copper Products Market by Value, 2024-2034 (US$ Bn, AGR (%), CAGR (%))
Table 64 India Rolled Copper Products Market by Value, 2024-2034 (US$ Bn, AGR (%), CAGR (%))
Table 65 Japan Rolled Copper Products Market by Value, 2024-2034 (US$ Bn, AGR (%), CAGR (%))
Table 66 South Korea Rolled Copper Products Market by Value, 2024-2034 (US$ Bn, AGR (%), CAGR (%))
Table 67 Australia Rolled Copper Products Market by Value, 2024-2034 (US$ Bn, AGR (%), CAGR (%))
Table 68 Rest of Asia-Pacific Rolled Copper Products Market by Value, 2024-2034 (US$ Bn, AGR (%), CAGR (%))
Table 69 Middle East & Africa Rolled Copper Products Market by Value, 2024-2034 (US$ Bn, AGR (%), CAGR (%))
Table 70 Middle East & Africa Rolled Copper Products Market by Country, 2024-2034 (US$ Bn, AGR (%), CAGR (%))
Table 71 Middle East & Africa Rolled Copper Products Market by Alloy Type, 2024-2034 (US$ Bn, AGR (%), CAGR (%))
Table 72 Middle East & Africa Rolled Copper Products Market by Thickness, 2024-2034 (US$ Bn, AGR (%), CAGR (%))
Table 73 Middle East & Africa Rolled Copper Products Market by Form, 2024-2034 (US$ Bn, AGR (%), CAGR (%))
Table 74 Middle East & Africa Rolled Copper Products Market by Application, 2024-2034 (US$ Bn, AGR (%), CAGR (%))
Table 75 Middle East & Africa Rolled Copper Products Market by End-Use Industry, 2024-2034 (US$ Bn, AGR (%), CAGR (%))
Table 76 GCC Rolled Copper Products Market by Value, 2024-2034 (US$ Bn, AGR (%), CAGR (%))
Table 77 South Africa Rolled Copper Products Market by Value, 2024-2034 (US$ Bn, AGR (%), CAGR (%))
Table 78 Rest of Middle East & Africa Rolled Copper Products Market by Value, 2024-2034 (US$ Bn, AGR (%), CAGR (%))
Table 79 Latin America Rolled Copper Products Market by Value, 2024-2034 (US$ Bn, AGR (%), CAGR (%))
Table 80 Latin America Rolled Copper Products Market by Country, 2024-2034 (US$ Bn, AGR (%), CAGR (%))
Table 81 Latin America Rolled Copper Products Market by Alloy Type, 2024-2034 (US$ Bn, AGR (%), CAGR (%))
Table 82 Latin America Rolled Copper Products Market by Thickness, 2024-2034 (US$ Bn, AGR (%), CAGR (%))
Table 83 Latin America Rolled Copper Products Market by Form, 2024-2034 (US$ Bn, AGR (%), CAGR (%))
Table 84 Latin America Rolled Copper Products Market by Application, 2024-2034 (US$ Bn, AGR (%), CAGR (%))
Table 85 Latin America Rolled Copper Products Market by End-Use Industry, 2024-2034 (US$ Bn, AGR (%), CAGR (%))
Table 86 Chile Rolled Copper Products Market by Value, 2024-2034 (US$ Bn, AGR (%), CAGR (%))
Table 87 Peru Rolled Copper Products Market by Value, 2024-2034 (US$ Bn, AGR (%), CAGR (%))
Table 88 Rest of Latin America Rolled Copper Products Market by Value, 2024-2034 (US$ Bn, AGR (%), CAGR (%))
Table 89 Strategic Outlook - Contract
Table 90 Aurubis AG: Key Details, (CEO, HQ, Revenue, Founded, No. of Employees, Company Type, Website, Business Segment)
Table 91 Aurubis AG: Product Benchmarking
Table 92 Aurubis AG: Strategic Outlook
Table 93 Jiangxi Copper Company: Key Details, (CEO, HQ, Revenue, Founded, No. of Employees, Company Type, Website, Business Segment)
Table 94 Jiangxi Copper Company: Product Benchmarking
Table 95 Jiangxi Copper Company: Strategic Outlook
Table 96 Mitsubishi Materials Corporation: Key Details, (CEO, HQ, Revenue, Founded, No. of Employees, Company Type, Website, Business Segment)
Table 97 Mitsubishi Materials Corporation: Product Benchmarking
Table 98 Mitsubishi Materials Corporation: Strategic Outlook
Table 99 Wieland-Werke AG: Key Details, (CEO, HQ, Revenue, Founded, No. of Employees, Company Type, Website, Business Segment)
Table 100 Wieland-Werke AG: Product Benchmarking
Table 101 Wieland-Werke AG: Strategic Outlook
Table 102 Metallurgical Corporation of China.: Key Details, (CEO, HQ, Revenue, Founded, No. of Employees, Company Type, Website, Business Segment)
Table 103 Metallurgical Corporation of China.: Product Benchmarking
Table 104 JX Nippon Mining & Metals Corporation: Key Details, (CEO, HQ, Revenue, Founded, No. of Employees, Company Type, Website, Business Segment)
Table 105 JX Nippon Mining & Metals Corporation: Product Benchmarking
Table 106 JX Nippon Mining & Metals Corporation: Strategic Outlook
Table 107 Freeport-McMoRan Inc.: Key Details, (CEO, HQ, Revenue, Founded, No. of Employees, Company Type, Website, Business Segment)
Table 108 Freeport-McMoRan Inc.: Product Benchmarking
Table 109 Sam Dong: Key Details, (CEO, HQ, Revenue, Founded, No. of Employees, Company Type, Website, Business Segment)
Table 110 Sam Dong: Product Benchmarking
Table 111 Ningbo Jintian Copper (Group) Co., Ltd.: Key Details, (CEO, HQ, Revenue, Founded, No. of Employees, Company Type, Website, Business Segment)
Table 112 Ningbo Jintian Copper (Group) Co., Ltd.: Product Benchmarking
Table 113 Wieland Electric GmbH: Key Details, (CEO, HQ, Revenue, Founded, No. of Employees, Company Type, Website, Business Segment)
Table 114 Wieland Electric GmbH: Product Benchmarking
Table 115 Wieland Electric GmbH: Strategic Outlook
Table 116 Southwire Company, LLC: Key Details, (CEO, HQ, Revenue, Founded, No. of Employees, Company Type, Website, Business Segment)
Table 117 Southwire Company, LLC: Product Benchmarking
Table 118 Southwire Company, LLC: Strategic Outlook
Table 119 LS-Nikko Copper Inc.: Key Details, (CEO, HQ, Revenue, Founded, No. of Employees, Company Type, Website, Business Segment)
Table 120 LS-Nikko Copper Inc.: Product Benchmarking
Table 121 LS-Nikko Copper Inc.: Strategic Outlook
Table 122 Mueller Industries: Key Details, (CEO, HQ, Revenue, Founded, No. of Employees, Company Type, Website, Business Segment)
Table 123 Mueller Industries: Product Benchmarking
Table 124 Furukawa Electric Co., Ltd.: Key Details, (CEO, HQ, Revenue, Founded, No. of Employees, Company Type, Website, Business Segment)
Table 125 Furukawa Electric Co., Ltd.: Product Benchmarking
Table 126 Chinalco Luoyang Copper Processing Co., Ltd.: Key Details, (CEO, HQ, Revenue, Founded, No. of Employees, Company Type, Website, Business Segment)
Table 127 Chinalco Luoyang Copper Processing Co., Ltd.: Product Benchmarking
List of Figures
Figure 1 Rolled Copper Products Market Segmentation
Figure 2 Rolled Copper Products Market by Alloy Type: Market Attractiveness Index
Figure 3 Rolled Copper Products Market by Thickness: Market Attractiveness Index
Figure 4 Rolled Copper Products Market by Form: Market Attractiveness Index
Figure 5 Rolled Copper Products Market by Application: Market Attractiveness Index
Figure 6 Rolled Copper Products Market by End-Use Industry: Market Attractiveness Index
Figure 7 Rolled Copper Products Market Attractiveness Index by Region
Figure 8 Rolled Copper Products Market: Market Dynamics
Figure 9 Rolled Copper Products Market: Porter’s Five Forces Analysis
Figure 10 Global Rolled Copper Products Market Share Forecast by COVID, 2024-2034 (%)
Figure 11 Global Rolled Copper Products Market by Region, 2024-2034 (US$ Bn, AGR (%)) (V-Shaped Recovery Scenario)
Figure 12 Global Rolled Copper Products Market by Region, 2024-2034 (US$ Bn, AGR (%)) (U-Shaped Recovery Scenario)
Figure 13 Global Rolled Copper Products Market by Region, 2024-2034 (US$ Bn, AGR (%)) (W-Shaped Recovery Scenario)
Figure 14 Global Rolled Copper Products Market by Region, 2024-2034 (US$ Bn, AGR (%)) (L-Shaped Recovery Scenario)
Figure 15 Rolled Copper Products Market: PEST Analysis
Figure 16 Rolled Copper Products Market by Alloy Type: Market Attractiveness Index
Figure 17 Global Rolled Copper Products Market by Alloy Type, 2024-2034 (US$ Bn, AGR (%))
Figure 18 Rolled Copper Products Market Share Forecast by Alloy Type, 2024, 2029, 2034 (%)
Figure 19 Pure Copper Market by Region, 2024-2034 (US$ Bn, AGR (%))
Figure 20 Pure Copper Market Share Forecast by Region, 2024 & 2034 (%)
Figure 21 Copper Alloys Market by Region, 2024-2034 (US$ Bn, AGR (%))
Figure 22 Copper Alloys Market Share Forecast by Region, 2024 & 2034 (%)
Figure 23 Rolled Copper Products Market by Thickness: Market Attractiveness Index
Figure 24 Global Rolled Copper Products Market by Thickness, 2024-2034 (US$ Bn, AGR (%))
Figure 25 Rolled Copper Products Market Share Forecast by Thickness, 2024, 2029, 2034 (%)
Figure 26 Thin Gauge (Less than 0.2 mm) Market by Region, 2024-2034 (US$ Bn, AGR (%))
Figure 27 Thin Gauge (Less than 0.2 mm) Market Share Forecast by Region, 2024 & 2034 (%)
Figure 28 Medium Gauge (0.2 - 1 mm) Market by Region, 2024-2034 (US$ Bn, AGR (%))
Figure 29 Medium Gauge (0.2 - 1 mm) Market Share Forecast by Region, 2024 & 2034 (%)
Figure 30 Thick Gauge (More than 1 mm) Market by Region, 2024-2034 (US$ Bn, AGR (%))
Figure 31 Thick Gauge (More than 1 mm) Market Share Forecast by Region, 2024 & 2034 (%)
Figure 32 Rolled Copper Products Market by Form: Market Attractiveness Index
Figure 33 Global Rolled Copper Products Market by Form, 2024-2034 (US$ Bn, AGR (%))
Figure 34 Rolled Copper Products Market Share Forecast by Form, 2024, 2029, 2034 (%)
Figure 35 Rolled Sheets Market by Region, 2024-2034 (US$ Bn, AGR (%))
Figure 36 Rolled Sheets Market Share Forecast by Region, 2024 & 2034 (%)
Figure 37 Rolled Strips Market by Region, 2024-2034 (US$ Bn, AGR (%))
Figure 38 Rolled Strips Market Share Forecast by Region, 2024 & 2034 (%)
Figure 39 Rolled Foils Market by Region, 2024-2034 (US$ Bn, AGR (%))
Figure 40 Rolled Foils Market Share Forecast by Region, 2024 & 2034 (%)
Figure 41 Other Form Market by Region, 2024-2034 (US$ Bn, AGR (%))
Figure 42 Other Form Market Share Forecast by Region, 2024 & 2034 (%)
Figure 43 Rolled Copper Products Market by Application: Market Attractiveness Index
Figure 44 Global Rolled Copper Products Market by Application, 2024-2034 (US$ Bn, AGR (%))
Figure 45 Rolled Copper Products Market Share Forecast by Application, 2024, 2029, 2034 (%)
Figure 46 Printed Circuit Boards (PCBs) Market by Region, 2024-2034 (US$ Bn, AGR (%))
Figure 47 Printed Circuit Boards (PCBs) Market Share Forecast by Region, 2024 & 2034 (%)
Figure 48 Electrical Wiring Market by Region, 2024-2034 (US$ Bn, AGR (%))
Figure 49 Electrical Wiring Market Share Forecast by Region, 2024 & 2034 (%)
Figure 50 Roofing and Cladding Market by Region, 2024-2034 (US$ Bn, AGR (%))
Figure 51 Roofing and Cladding Market Share Forecast by Region, 2024 & 2034 (%)
Figure 52 Heat Exchangers Market by Region, 2024-2034 (US$ Bn, AGR (%))
Figure 53 Heat Exchangers Market Share Forecast by Region, 2024 & 2034 (%)
Figure 54 Other Applications Market by Region, 2024-2034 (US$ Bn, AGR (%))
Figure 55 Other Applications Market Share Forecast by Region, 2024 & 2034 (%)
Figure 56 Rolled Copper Products Market by End-Use Industry: Market Attractiveness Index
Figure 57 Global Rolled Copper Products Market by End-Use Industry, 2024-2034 (US$ Bn, AGR (%))
Figure 58 Rolled Copper Products Market Share Forecast by End-Use Industry, 2024, 2029, 2034 (%)
Figure 59 Electrical & Electronics Market by Region, 2024-2034 (US$ Bn, AGR (%))
Figure 60 Electrical & Electronics Market Share Forecast by Region, 2024 & 2034 (%)
Figure 61 Automotive Market by Region, 2024-2034 (US$ Bn, AGR (%))
Figure 62 Automotive Market Share Forecast by Region, 2024 & 2034 (%)
Figure 63 Construction Market by Region, 2024-2034 (US$ Bn, AGR (%))
Figure 64 Construction Market Share Forecast by Region, 2024 & 2034 (%)
Figure 65 Industrial Machinery Market by Region, 2024-2034 (US$ Bn, AGR (%))
Figure 66 Industrial Machinery Market Share Forecast by Region, 2024 & 2034 (%)
Figure 67 Consumer Goods Market by Region, 2024-2034 (US$ Bn, AGR (%))
Figure 68 Consumer Goods Market Share Forecast by Region, 2024 & 2034 (%)
Figure 69 Aerospace & Defence Market by Region, 2024-2034 (US$ Bn, AGR (%))
Figure 70 Aerospace & Defence Market Share Forecast by Region, 2024 & 2034 (%)
Figure 71 Rolled Copper Products Market Forecast by Region 2024 and 2034 (Revenue, CAGR%)
Figure 72 Rolled Copper Products Market Share Forecast by Region 2024, 2029, 2034 (%)
Figure 73 Global Rolled Copper Products Market by Region, 2024-2034 (US$ Bn, AGR (%))
Figure 74 North America Rolled Copper Products Market Attractiveness Index
Figure 75 North America Rolled Copper Products Market by Region, 2024, 2029 & 2034 (US$ Billion)
Figure 76 North America Rolled Copper Products Market by Value, 2024-2034 (US$ Bn, AGR (%))
Figure 77 North America Rolled Copper Products Market by Country, 2024-2034 (US$ Bn, AGR (%))
Figure 78 North America Rolled Copper Products Market Share Forecast by Country, 2024 & 2034 (%)
Figure 79 North America Rolled Copper Products Market by Alloy Type, 2024-2034 (US$ Bn, AGR (%))
Figure 80 North America Rolled Copper Products Market Share Forecast Alloy Type, 2024 & 2034 (%)
Figure 81 North America Rolled Copper Products Market by Thickness, 2024-2034 (US$ Bn, AGR (%))
Figure 82 North America Rolled Copper Products Market Share Forecast by Thickness, 2024 & 2034 (%)
Figure 83 North America Rolled Copper Products Market by Form, 2024-2034 (US$ Bn, AGR (%))
Figure 84 North America Rolled Copper Products Market Share Forecast by Form, 2024 & 2034 (%)
Figure 85 North America Rolled Copper Products Market by Application, 2024-2034 (US$ Bn, AGR (%))
Figure 86 North America Rolled Copper Products Market Share Forecast by Application, 2024 & 2034 (%)
Figure 87 North America Rolled Copper Products Market by End-Use Industry, 2024-2034 (US$ Bn, AGR (%))
Figure 88 North America Rolled Copper Products Market Share Forecast by End-Use Industry, 2024 & 2034 (%)
Figure 89 US Rolled Copper Products Market by Value, 2024-2034 (US$ Bn, AGR (%))
Figure 90 Canada Rolled Copper Products Market by Value, 2024-2034 (US$ Bn, AGR (%))
Figure 91 Europe Rolled Copper Products Market Attractiveness Index
Figure 92 Europe Rolled Copper Products Market by Region, 2024, 2029 & 2034 (US$ Billion)
Figure 93 Europe Rolled Copper Products Market by Value, 2024-2034 (US$ Bn, AGR (%))
Figure 94 Europe Rolled Copper Products Market by Country, 2024-2034 (US$ Bn, AGR (%))
Figure 95 Europe Rolled Copper Products Market Share Forecast by Country, 2024 & 2034 (%)
Figure 96 Europe Rolled Copper Products Market by Alloy Type, 2024-2034 (US$ Bn, AGR (%))
Figure 97 Europe Rolled Copper Products Market Share Forecast Alloy Type, 2024 & 2034 (%)
Figure 98 Europe Rolled Copper Products Market by Thickness, 2024-2034 (US$ Bn, AGR (%))
Figure 99 Europe Rolled Copper Products Market Share Forecast by Thickness, 2024 & 2034 (%)
Figure 100 Europe Rolled Copper Products Market by Form, 2024-2034 (US$ Bn, AGR (%))
Figure 101 Europe Rolled Copper Products Market Share Forecast by Form, 2024 & 2034 (%)
Figure 102 Europe Rolled Copper Products Market by Application, 2024-2034 (US$ Bn, AGR (%))
Figure 103 Europe Rolled Copper Products Market Share Forecast by Application, 2024 & 2034 (%)
Figure 104 Europe Rolled Copper Products Market by End-Use Industry, 2024-2034 (US$ Bn, AGR (%))
Figure 105 Europe Rolled Copper Products Market Share Forecast by End-Use Industry, 2024 & 2034 (%)
Figure 106 Germany Rolled Copper Products Market by Value, 2024-2034 (US$ Bn, AGR (%))
Figure 107 UK Rolled Copper Products Market by Value, 2024-2034 (US$ Bn, AGR (%))
Figure 108 France Rolled Copper Products Market by Value, 2024-2034 (US$ Bn, AGR (%))
Figure 109 Italy Rolled Copper Products Market by Value, 2024-2034 (US$ Bn, AGR (%))
Figure 110 Spain Rolled Copper Products Market by Value, 2024-2034 (US$ Bn, AGR (%))
Figure 111 Rest of Europe Rolled Copper Products Market by Value, 2024-2034 (US$ Bn, AGR (%))
Figure 112 Asia-Pacific Rolled Copper Products Market Attractiveness Index
Figure 113 Asia-Pacific Rolled Copper Products Market by Region, 2024, 2029 & 2034 (US$ Billion)
Figure 114 Asia-Pacific Rolled Copper Products Market by Value, 2024-2034 (US$ Bn, AGR (%))
Figure 115 Asia-Pacific Rolled Copper Products Market by Country, 2024-2034 (US$ Bn, AGR (%))
Figure 116 Asia-Pacific Rolled Copper Products Market Share Forecast by Country, 2024 & 2034 (%)
Figure 117 Asia-Pacific Rolled Copper Products Market by Alloy Type, 2024-2034 (US$ Bn, AGR (%))
Figure 118 Asia-Pacific Rolled Copper Products Market Share Forecast Alloy Type, 2024 & 2034 (%)
Figure 119 Asia-Pacific Rolled Copper Products Market by Thickness, 2024-2034 (US$ Bn, AGR (%))
Figure 120 Asia-Pacific Rolled Copper Products Market Share Forecast by Thickness, 2024 & 2034 (%)
Figure 121 Asia-Pacific Rolled Copper Products Market by Form, 2024-2034 (US$ Bn, AGR (%))
Figure 122 Asia-Pacific Rolled Copper Products Market Share Forecast by Form, 2024 & 2034 (%)
Figure 123 Asia-Pacific Rolled Copper Products Market by Application, 2024-2034 (US$ Bn, AGR (%))
Figure 124 Asia-Pacific Rolled Copper Products Market Share Forecast by Application, 2024 & 2034 (%)
Figure 125 Asia-Pacific Rolled Copper Products Market by End-Use Industry, 2024-2034 (US$ Bn, AGR (%))
Figure 126 Asia-Pacific Rolled Copper Products Market Share Forecast by End-Use Industry, 2024 & 2034 (%)
Figure 127 China Rolled Copper Products Market by Value, 2024-2034 (US$ Bn, AGR (%))
Figure 128 India Rolled Copper Products Market by Value, 2024-2034 (US$ Bn, AGR (%))
Figure 129 Japan Rolled Copper Products Market by Value, 2024-2034 (US$ Bn, AGR (%))
Figure 130 South Korea Rolled Copper Products Market by Value, 2024-2034 (US$ Bn, AGR (%))
Figure 131 Australia Rolled Copper Products Market by Value, 2024-2034 (US$ Bn, AGR (%))
Figure 132 Rest of Asia-Pacific Rolled Copper Products Market by Value, 2024-2034 (US$ Bn, AGR (%))
Figure 133 Middle East and Africa Rolled Copper Products Market Attractiveness Index
Figure 134 Middle East and Africa Rolled Copper Products Market by Region, 2024, 2029 & 2034 (US$ Billion)
Figure 135 Middle East & Africa Rolled Copper Products Market by Value, 2024-2034 (US$ Bn, AGR (%))
Figure 136 Middle East & Africa Rolled Copper Products Market by Country, 2024-2034 (US$ Bn, AGR (%))
Figure 137 Middle East and Africa Rolled Copper Products Market Share Forecast by Country, 2024 & 2034 (%)
Figure 138 Middle East & Africa Rolled Copper Products Market by Alloy Type, 2024-2034 (US$ Bn, AGR (%))
Figure 139 Middle East and Africa Rolled Copper Products Market Share Forecast Alloy Type, 2024 & 2034 (%)
Figure 140 Middle East & Africa Rolled Copper Products Market by Thickness, 2024-2034 (US$ Bn, AGR (%))
Figure 141 Middle East and Africa Rolled Copper Products Market Share Forecast by Thickness, 2024 & 2034 (%)
Figure 142 Middle East & Africa Rolled Copper Products Market by Form, 2024-2034 (US$ Bn, AGR (%))
Figure 143 Middle East and Africa Rolled Copper Products Market Share Forecast by Form, 2024 & 2034 (%)
Figure 144 Middle East & Africa Rolled Copper Products Market by Application, 2024-2034 (US$ Bn, AGR (%))
Figure 145 Middle East and Africa Rolled Copper Products Market Share Forecast by Application, 2024 & 2034 (%)
Figure 146 Middle East & Africa Rolled Copper Products Market by End-Use Industry, 2024-2034 (US$ Bn, AGR (%))
Figure 147 Middle East and Africa Rolled Copper Products Market Share Forecast by End-Use Industry, 2024 & 2034 (%)
Figure 148 GCC Rolled Copper Products Market by Value, 2024-2034 (US$ Bn, AGR (%))
Figure 149 South Africa Rolled Copper Products Market by Value, 2024-2034 (US$ Bn, AGR (%))
Figure 150 Rest of Middle East & Africa Rolled Copper Products Market by Value, 2024-2034 (US$ Bn, AGR (%))
Figure 151 Latin America Rolled Copper Products Market Attractiveness Index
Figure 152 Latin America Rolled Copper Products Market by Region, 2024, 2029 & 2034 (US$ Billion)
Figure 153 Latin America Rolled Copper Products Market by Value, 2024-2034 (US$ Bn, AGR (%))
Figure 154 Latin America Rolled Copper Products Market by Country, 2024-2034 (US$ Bn, AGR (%))
Figure 155 Latin America Rolled Copper Products Market Share Forecast by Country, 2024 & 2034 (%)
Figure 156 Latin America Rolled Copper Products Market by Alloy Type, 2024-2034 (US$ Bn, AGR (%))
Figure 157 Latin America Rolled Copper Products Market Share Forecast Alloy Type, 2024 & 2034 (%)
Figure 158 Latin America Rolled Copper Products Market by Thickness, 2024-2034 (US$ Bn, AGR (%))
Figure 159 Latin America Rolled Copper Products Market Share Forecast by Thickness, 2024 & 2034 (%)
Figure 160 Latin America Rolled Copper Products Market by Form, 2024-2034 (US$ Bn, AGR (%))
Figure 161 Latin America Rolled Copper Products Market Share Forecast by Form, 2024 & 2034 (%)
Figure 162 Latin America Rolled Copper Products Market by Application, 2024-2034 (US$ Bn, AGR (%))
Figure 163 Latin America Rolled Copper Products Market Share Forecast by Application, 2024 & 2034 (%)
Figure 164 Latin America Rolled Copper Products Market by End-Use Industry, 2024-2034 (US$ Bn, AGR (%))
Figure 165 Latin America Rolled Copper Products Market Share Forecast by End-Use Industry, 2024 & 2034 (%)
Figure 166 Chile Rolled Copper Products Market by Value, 2024-2034 (US$ Bn, AGR (%))
Figure 167 Peru Rolled Copper Products Market by Value, 2024-2034 (US$ Bn, AGR (%))
Figure 168 Rest of Latin America Rolled Copper Products Market by Value, 2024-2034 (US$ Bn, AGR (%))
Figure 169 Rolled Copper Products Market: Company Share, 2023
Figure 170 Aurubis AG.: Net Revenue, 2019-2023 (US$ Million, AGR%)
Figure 171 Aurubis AG.: Regional Revenue Share, 2023 (%)
Figure 172 Aurubis AG.: Business Segment Revenue Share, 2023 (%)
Figure 173 Jiangxi Copper Company.: Net Revenue, 2018-2022 (US$ Million, AGR%)
Figure 174 Jiangxi Copper Company.: R&D, 2018-2022 (US$ Million, AGR%)
Figure 175 Jiangxi Copper Company.: Regional Revenue Share, 2022 (%)
Figure 176 Jiangxi Copper Company.: Business Segment Revenue Share, 2022 (%)
Figure 177 Mitsubishi Materials Corporation.: Net Revenue, 2019-2023 (US$ Million, AGR%)
Figure 178 Metallurgical Corporation of China..: Net Revenue, 2019-2023 (US$ Million, AGR%)
Figure 179 Metallurgical Corporation of China..: R&D, 2019-2023 (US$ Million, AGR%)
Figure 180 Metallurgical Corporation of China.: Regional Revenue Share, 2023 (%)
Figure 181 Metallurgical Corporation of China.: Business Segment Revenue Share, 2023(%)
Figure 182 Freeport-McMoRan Inc..: Net Revenue, 2019-2023 (US$ Million, AGR%)
Figure 183 Freeport-McMoRan Inc..: R&D, 2019-2023 (US$ Million, AGR%)
Figure 184 Freeport-McMoRan Inc..: Business Segment Revenue Share, 2023 (%)
Figure 185 Mueller Industries.: Net Revenue, 2019-2023 (US$ Million, AGR%)
Figure 186 Mueller Industries.: Regional Revenue Share, 2023 (%)
Figure 187 Mueller Industries.: Business Segment Revenue Share, 2023 (%)
Figure 188 Furukawa Electric Co., Ltd..: Net Revenue, 2018-2022 (US$ Million, AGR%)
Figure 189 Furukawa Electric Co., Ltd..: R&D, 2018-2022 (US$ Million, AGR%)
Figure 190 Furukawa Electric Co., Ltd..: Regional Revenue Share, 2022 (%)
Figure 191 Chinalco Luoyang Copper Processing Co., Ltd..: Net Revenue, 2019-2023 (US$ Million, AGR%)
Figure 192 Chinalco Luoyang Copper Processing Co., Ltd..: R&D, 2019-2023 (US$ Million, AGR%)
Figure 193 Chinalco Luoyang Copper Processing Co., Ltd..: Business Segment Revenue Share, 2022 (%)
ページTOPに戻る
Visiongain社の建設分野での最新刊レポート
本レポートと同じKEY WORD(copper)の最新刊レポート
よくあるご質問
Visiongain社はどのような調査会社ですか?
英国の調査会社ヴィジョンゲイン社(Visiongain)は、通信とエネルギーのほか、自動車や化学・医薬品、金属など、広範な市場を対象に調査を行っています。自動車市場については、市場全般に関する調査のほ... もっと見る
調査レポートの納品までの日数はどの程度ですか?
在庫のあるものは速納となりますが、平均的には 3-4日と見て下さい。
但し、一部の調査レポートでは、発注を受けた段階で内容更新をして納品をする場合もあります。
発注をする前のお問合せをお願いします。
注文の手続きはどのようになっていますか?
1)お客様からの御問い合わせをいただきます。
2)見積書やサンプルの提示をいたします。
3)お客様指定、もしくは弊社の発注書をメール添付にて発送してください。
4)データリソース社からレポート発行元の調査会社へ納品手配します。
5) 調査会社からお客様へ納品されます。最近は、pdfにてのメール納品が大半です。
お支払方法の方法はどのようになっていますか?
納品と同時にデータリソース社よりお客様へ請求書(必要に応じて納品書も)を発送いたします。
お客様よりデータリソース社へ(通常は円払い)の御振り込みをお願いします。
請求書は、納品日の日付で発行しますので、翌月最終営業日までの当社指定口座への振込みをお願いします。振込み手数料は御社負担にてお願いします。
お客様の御支払い条件が60日以上の場合は御相談ください。
尚、初めてのお取引先や個人の場合、前払いをお願いすることもあります。ご了承のほど、お願いします。
データリソース社はどのような会社ですか?
当社は、世界各国の主要調査会社・レポート出版社と提携し、世界各国の市場調査レポートや技術動向レポートなどを日本国内の企業・公官庁及び教育研究機関に提供しております。
世界各国の「市場・技術・法規制などの」実情を調査・収集される時には、データリソース社にご相談ください。
お客様の御要望にあったデータや情報を抽出する為のレポート紹介や調査のアドバイスも致します。
|
|

