鉄鋼市場レポート:2023-2033
Steel Market Report 2023-2033
レポート詳細
鉄鋼市場レポート 2023-2033 :本レポートは、新たな収益の柱を目指す大手企業にとって、業界とその根底にある力学をより深く理解する上で貴重なものとなろう。異業種への進出や、新たな... もっと見る
※上記価格は部署ライセンス(Departmental licence)価格です。
その他の価格についてはデータリソースまでお問合せください。
日本語のページは自動翻訳を利用し作成しています。
実際のレポートは英文のみでご納品いたします。
サマリー
レポート詳細
鉄鋼市場レポート 2023-2033:本レポートは、新たな収益の柱を目指す大手企業にとって、業界とその根底にある力学をより深く理解する上で貴重なものとなろう。異業種への進出や、新たな地域での既存事業の拡大を希望する企業にとっても有用であろう。
経済成長とインフラ整備が市場を牽引
経済成長は世界鉄鋼市場の主要な原動力である。経済が拡大するにつれ、政府と民間部門は道路、橋、鉄道、建物などのインフラ・プロジェクトに投資する。これらのプロジェクトには大量の鉄鋼が必要であり、建設に不可欠な材料となっている。さらに、鉄鋼は産業や製造業の発展に不可欠であり、経済成長をさらに促進する。インフラ・プロジェクトにおける鉄鋼の安定した需要は、鉄鋼業界に安定と成長の機会をもたらし、国や地域の全体的な経済発展に大きく貢献しています。
技術協力と研究
鉄鋼会社と研究機関の協力は、鉄鋼の生産と応用における技術革新を推進します。研究開発の努力は、鉄鋼の特性を高め、環境への影響を低減し、新しい用途を開発することに重点を置き、鉄鋼業界を技術と競争力の最前線に保っています。
市場調査レポートを購入する前にすべき質問とは?
- 鉄鋼市場はどのように進化しているのか?
- 鉄鋼市場の推進要因と抑制要因は何か?
- 各鉄鋼サブマーケットセグメントは予測期間中にどのように成長し、2033年にどれくらいの売上を占めるのか?
- 2023年から2033年にかけて、各鉄鋼サブマーケットの市場シェアはどのように推移するのか?
- 2023年から2033年にかけての市場全体の主な牽引役は何か?
- 主要鉄鋼市場はマクロ経済の動きに概ね追随するのか、それとも個々の国別市場が他を凌駕するのか?
- 2033年までに各国市場のシェアはどう変化し、2033年に市場をリードするのはどの地域か?
- 主要プレーヤーは誰で、予測期間中の見通しは?
- これらの大手企業の鉄鋼プロジェクトとは?
- 2023年から2033年の間に、業界はどのように進化するのか?現在および今後10年間の鉄鋼プロジェクトにはどのような意味があるのか?
- 鉄鋼市場をさらに拡大するために、製品の商業化の必要性は高まっているのか?
- 鉄鋼市場はどこへ向かっているのか、そしてどのようにすれば市場の最前線に立つことができるのか?
- 新製品やサービスラインへの最適な投資方法とは?
- 企業を新たな成長軌道に乗せ、C-suiteに移行させるための重要な展望とは?
このことが今日、そして今後10年間の鉄鋼市場にどのような影響を与えるかを見極める必要がある:
- 352ページにわたる本レポートでは、121の表と176の図表を掲載しています。
- 本レポートでは、業界における主要な有利分野を取り上げているため、今すぐターゲットを絞ることができます。
- 世界、地域、国の売上と成長に関する詳細な分析が含まれています。
- 競合他社が成功した主なトレンド、変化、収益予測をハイライトしています。
本レポートは、鉄鋼市場が今後10年間でどのように発展するか、またCOVID-19の景気後退と好転の変動に合わせて、今日あなたに伝えます。この市場は、過去10年間のどの時点よりも今が重要です。
2033年までの予測やその他の分析から、商業的な展望が明らかになる
- 2033年までの収益予測に加え、直近の業績、成長率、市場シェアもご覧いただけます。
- ビジネスの展望と展開に関する独自の分析をご覧いただけます。
- 定性的分析(市場力学、促進要因、機会、阻害要因、課題を含む)、コスト構造、鋼材価格上昇の影響、最近の動向をご覧いただけます。
本レポートには、COVID-19が業界と貴社にどのような影響を与えるかについてのデータ分析と貴重な洞察が含まれている。本レポートでは、COVID-19の4つの回収パターンとその影響、すなわち「V」、「L」、「W」、「U」について論じている。
レポート対象セグメント
生産技術別市場セグメント
- 基礎酸素炉
- 電気アーク炉
- オープンハース
製品別市場セグメント
- 鋼板
- 鋼ビーム
- 棒鋼
- その他の製品
用途別市場セグメント
- 建築・インフラ
- 機械・電気機器
- 自動車
- 金属・家庭用品
- その他の用途
タイプ別市場セグメント
- 炭素鋼
- ステンレス鋼
- 合金鋼
- アルミニウム鋼
- コバルト鋼
- その他の鋼種
世界市場全体とセグメント別の収益予測に加え、4つの地域と20の主要国市場の収益予測も掲載しています:
北米
- アメリカ
- カナダ
欧州
- ドイツ
- ロシア
- ウクライナ
- フランス
- イタリア
- その他の欧州
アジア太平洋
- 中国
- 日本
- インド
- オーストラリア
- 韓国
- その他のアジア太平洋地域
ラテンアメリカ
- ブラジル
- メキシコ
- その他のラテンアメリカ
中東・アフリカ
- GCC
- 南アフリカ
- その他の中東・アフリカ
このレポートには、2023年から2033年の鉄鋼市場におけるいくつかの主要企業のプロフィールも含まれており、これらの企業の事業のこのセグメントに焦点を当てています。
主要企業と市場成長の可能性
・ Anshan Iron and Steel Group Corporation
・ ArcelorMittal S.A.
・ China Baowu Steel Group
・ Delong Steel Group
・ Hesteel Group Company Limited
・ Hyundai Steel Co., Ltd.
・ JFE Steel Corporation
・ Jiangsu Shagang Group Company Limited
・ Jiangxi Fangda Iron & Steel Group Co Ltd
・ Jianlong Group
・ Liuzhou Iron & Steel Co., Ltd
・ Nucor Corporation
・ POSCO
・ Shandong Iron and Steel Co., Ltd.
・ Tata Steel Limited
2023年から2033年にかけての世界の鉄鋼市場全体の売上高は、金額ベースで2023年に1兆6,564億米ドルを突破する。2033年まで力強い収益成長を予測。当研究所では、最も大きな可能性を秘めた組織を特定している。彼らの能力、進歩、商業的展望を発見し、あなたが一歩先を行くのを支援します。
2023年から2033年までの鉄鋼市場」レポートはどのようにお役に立ちますか?
要約すると、350ページを超えるこのレポートは、以下の知識を提供する:
- 鉄鋼市場の2023年から2033年までの収益予測 - 生産技術、製品、用途、タイプ別に世界と地域レベルで予測 - 業界の将来性を発見し、投資と収益に最も有利な場所を見つけることができます。
- 4つの地域と20の主要国市場の2033年までの収益予測 - 北米、欧州、アジア太平洋、中南米、中東・アフリカの鉄鋼市場2023年から2033年までの市場予測をご覧ください。また、米国、カナダ、ブラジル、ドイツ、フランス、ウクライナ、イタリア、中国、インド、日本、ロシア、オーストラリアなどの著名経済圏の市場も予測しています。
- 2023 年から 2033 年までの鉄鋼市場に関与する主要企業 20 社の企業概要を含む、既存企業と市場への参入を目指す企業の見通し。
独自の予測による定量的・定性的分析をご覧ください。私たちのレポートだけに含まれる情報を入手し、貴重なビジネスインテリジェンスで情報を得ることができます。
他にはない情報
私たちの新しいレポートがあれば、知識に遅れをとったり、チャンスを逃したりする可能性が低くなります。弊社の調査レポートが貴社の調査、分析、意思決定にどのように役立つかをご覧ください。Visiongainの調査は、鉄鋼市場、2023年から2033年、市場をリードする企業の商業分析を必要とするすべての人のためのものです。データ、トレンド、予測をご覧いただけます。
ページTOPに戻る
目次
目次
1 レポート概要
1.1 研究の目的
1.2 鉄鋼市場の紹介
1.3 本レポートの内容
1.4 本レポートを読むべき理由
1.5 本分析レポートが回答する主な質問
1.6 本レポートは誰のためのものか?
1.7 方法論
1.7.1 市場の定義
1.7.2 市場評価・予測手法
1.7.3 データの検証
1.7.3.1 一次調査
1.7.3.2 セカンダリーリサーチ
1.8 よくある質問(FAQ)
1.9 Visiongainの関連レポート
1.10 Visiongainについて
2 エグゼクティブ・サマリー
3 市場概要
3.1 主要な調査結果
3.2 市場ダイナミクス
3.2.1 市場促進要因
3.2.1.1 リサイクル鋼材需要の増加が鉄スクラップ需要を押し上げる
3.2.1.2 インフラ分野への投資拡大
3.2.1.3 自動車の軽量化が高強度鋼の需要を牽引
3.2.2 市場抑制要因
3.2.2.1 厳しい環境規制への対応と炭素排出量削減が鉄鋼業界の課題
3.2.2.2 アルミニウム、複合材料、先端プラスチックなどの代替材料との競争に直面し、特定分野の需要に影響
3.2.2.3 グローバルサプライチェーンダイナミクスの変化が鉄鋼需要パターンの混乱につながる可能性
3.2.3 市場機会
3.2.3.1 先進国での老朽化したインフラのアップグレードは、改修・近代化プロジェクトでの鉄鋼消費を促進する
3.2.3.2 発展途上国における都市化が成長を牽引
3.2.3.3 ネット・ゼロ・スチールへの移行
3.3 ポーターのファイブフォース分析
3.3.1 サプライヤーの交渉力(中)
3.3.2 買い手の交渉力(高)
3.3.3 競争力(高)
3.3.4 代替品による脅威(低)
3.3.5 新規参入の脅威(低~中)
3.4 COVID-19の影響分析
3.4.1 "V字型回復"
3.4.2 "U字型回復"
3.4.3 "W字型回復"
3.4.4 "L字型回復"
3.5 PEST分析
4 鉄鋼市場分析:生産技術別
4.1 主要な調査結果
4.2 生産技術セグメント 市場魅力度指数
4.3 生産技術別の鉄鋼市場規模の推定と予測
4.4 基礎酸素炉
4.4.1 2023~2033年の地域別市場規模(US$ Billion)
4.4.2 地域別市場シェア、2023年・2033年(%)
4.5 電気アーク炉
4.5.1 2023〜2033年の地域別市場規模(US$ Billion)
4.5.2 地域別市場シェア、2023年・2033年(%)
4.6 オープンハース
4.6.1 2023〜2033年の地域別市場規模(US$ Billion)
4.6.2 地域別市場シェア、2023年・2033年(%)
5 鉄鋼市場分析:製品別
5.1 主要な調査結果
5.2 製品セグメント 市場魅力度指数
5.3 製品別鉄鋼市場規模の推定と予測
5.4 鋼板
5.4.1 2023〜2033年の地域別市場規模(US$ Billion)
5.4.2 地域別市場シェア、2023年・2033年(%)
5.5 鋼鉄梁
5.5.1 2023~2033年の地域別市場規模(US$ Billion)
5.5.2 地域別市場シェア、2023年・2033年(%)
5.6 棒鋼
5.6.1 2023~2033年の地域別市場規模(US$ Billion)
5.6.2 地域別市場シェア、2023年・2033年(%)
5.7 その他の製品
5.7.1 2023〜2033年の地域別市場規模(US$ Billion)
5.7.2 地域別市場シェア、2023年・2033年(%)
6 鉄鋼市場分析:用途別
6.1 主要な調査結果
6.2 用途別セグメント 市場魅力度指数
6.3 用途別鉄鋼市場規模の推定と予測
6.4 建築・インフラ
6.4.1 2023〜2033年の地域別市場規模(US$ Billion)
6.4.2 地域別市場シェア、2023年・2033年(%)
6.5 機械・電気機器
6.5.1 2023〜2033年の地域別市場規模(US$ Billion)
6.5.2 地域別市場シェア、2023年・2033年(%)
6.6 自動車
6.6.1 2023〜2033年の地域別市場規模(US$ Billion)
6.6.2 地域別市場シェア、2023年・2033年(%)
6.7 金属・国内製品
6.7.1 2023~2033年の地域別市場規模(US$ Billion)
6.7.2 地域別市場シェア、2023年・2033年(%)
6.8 その他の用途
6.8.1 2023〜2033年の地域別市場規模(US$ Billion)
6.8.2 地域別市場シェア、2023年・2033年(%)
7 鉄鋼市場分析:タイプ別
7.1 主要な調査結果
7.2 タイプ別セグメント 市場魅力度指数
7.3 タイプ別鉄鋼市場規模の推定と予測
7.4 炭素鋼
7.4.1 2023年~2033年の地域別市場規模(US$ Billion)
7.4.2 地域別市場シェア、2023年・2033年(%)
7.5 ステンレス鋼
7.5.1 2023~2033年の地域別市場規模(US$ Billion)
7.5.2 地域別市場シェア、2023年・2033年(%)
7.6 合金鋼
7.6.1 2023~2033年の地域別市場規模(US$ Billion)
7.6.2 地域別市場シェア、2023年・2033年(%)
7.7 アルミニウム鋼
7.7.1 2023~2033年の地域別市場規模(US$ Billion)
7.7.2 地域別市場シェア、2023年・2033年(%)
7.8 コバルト鋼
7.8.1 2023~2033年の地域別市場規模(US$ Billion)
7.8.2 地域別市場シェア、2023年・2033年(%)
7.9 その他の鋼種
7.9.1 2023~2033年の地域別市場規模(US$ Billion)
7.9.2 地域別市場シェア、2023年・2033年(%)
8 鉄鋼市場分析:地域別
8.1 主要な調査結果
8.2 地域別市場規模の推定と予測
9 北米の鉄鋼市場分析
9.1 主要な調査結果
9.2 北米の鉄鋼市場魅力度指数
9.3 北米の鉄鋼市場市場規模:国別、2023年、2028年、2033年(US$ Billion)
9.4 北米の鉄鋼市場規模推定と予測
9.5 北米の鉄鋼市場規模推定と予測:国別
9.6 北米の鉄鋼市場規模推定と予測:生産技術別
9.7 北米の鉄鋼市場規模推定と予測:製品別
9.8 北米の鉄鋼市場規模推定と予測:用途別
9.9 北米の鉄鋼市場規模推定と予測:タイプ別
9.10 アメリカの鉄鋼市場分析
9.11 カナダの鉄鋼市場の分析
10 欧州の鉄鋼市場分析
10.1 主要な調査結果
10.2 欧州の鉄鋼市場魅力度指数
10.3 欧州の鉄鋼市場市場規模:国別、2023年、2028年、2033年(US$ Billion)
10.4 欧州の鉄鋼市場規模推定と予測
10.5 欧州の鉄鋼市場規模推定と予測:国別
10.6 欧州の鉄鋼市場規模推定と予測:生産技術別
10.7 欧州の鉄鋼市場規模推定と予測:製品別
10.8 欧州の鉄鋼市場規模推定と予測:用途別
10.9 欧州の鉄鋼市場規模推定と予測:タイプ別
10.10 ドイツの鉄鋼市場の分析
10.11 ウクライナの鉄鋼市場の分析
10.12 フランスの鉄鋼市場の分析
10.13 イタリアの鉄鋼市場の分析
10.14 ロシアの鉄鋼市場の分析
10.15 その他の欧州の鉄鋼市場の分析
11 アジア太平洋の鉄鋼市場分析
11.1 主要な調査結果
11.2 アジア太平洋鉄鋼市場魅力度指数
11.3 アジア太平洋地域の鉄鋼市場:国別、2023年、2028年、2033年(US$ Billion)
11.4 アジア太平洋地域の鉄鋼市場規模推定と予測
11.5 アジア太平洋地域の鉄鋼市場規模推定と予測:国別
11.6 アジア太平洋地域の鉄鋼市場規模推定と予測:生産技術別
11.7 アジア太平洋地域の鉄鋼市場規模推定と予測:製品別
11.8 アジア太平洋地域の鉄鋼市場規模推定と予測:用途別
11.9 アジア太平洋地域の鉄鋼市場規模推定と予測:タイプ別
11.10 中国の鉄鋼市場の分析
11.11 インド鉄鋼市場の分析
11.12 日本の鉄鋼市場の分析
11.13 韓国鉄鋼市場の分析
11.14 オーストラリアの鉄鋼市場の分析
11.15 その他のアジア太平洋地域の鉄鋼市場の分析
12 中東・アフリカの鉄鋼市場分析
12.1 主要な調査結果
12.2 中東・アフリカ鉄鋼市場魅力度指数
12.3 中東・アフリカ鉄鋼市場の市場規模:国別、2023年、2028年、2033年(US$ Billion)
12.4 中東・アフリカ鉄鋼市場規模推定と予測
12.5 中東・アフリカ鉄鋼市場規模推定と予測:国別
12.6 中東・アフリカ鉄鋼市場規模推定と予測:生産技術別
12.7 中東・アフリカ鉄鋼市場規模推定と予測:製品別
12.8 中東・アフリカ鉄鋼市場規模推定と予測:用途別
12.9 中東・アフリカ鉄鋼市場規模推定と予測:タイプ別
12.10 GCCの鉄鋼市場の分析
12.11 南アフリカの鉄鋼市場分析
12.12 その他の中東・アフリカの鉄鋼市場の分析
13 ラテンアメリカの鉄鋼市場分析
13.1 主要な調査結果
13.2 ラテンアメリカの鉄鋼市場魅力度指数
13.3 ラテンアメリカの鉄鋼市場:国別、2023年、2028年、2033年(US$ Billion)
13.4 ラテンアメリカの鉄鋼市場規模推定と予測
13.5 ラテンアメリカの鉄鋼市場規模推定と予測:国別
13.6 ラテンアメリカの鉄鋼市場規模推定と予測:生産技術別
13.7 ラテンアメリカの鉄鋼市場規模推定と予測:製品別
13.8 ラテンアメリカの鉄鋼市場規模推定と予測:用途別
13.9 ラテンアメリカの鉄鋼市場規模推定と予測:タイプ別
13.10 ブラジルの鉄鋼市場の分析
13.11 メキシコの鉄鋼市場分析
13.12 その他のラテンアメリカの鉄鋼市場の分析
14 主要企業のプロファイル
14.1 競争環境、2022年
14.2 戦略的展望
14.3 China Baowu Steel Group
14.3.1 会社概要
14.3.2 会社概要
14.3.3 製品ベンチマーク
14.3.4 戦略的展望
14.4 ArcelorMittal S.A.
14.4.1 会社概要
14.4.2 会社概要
14.4.3 財務分析
14.4.3.1 純収入、2018-2022年
14.4.3.2 R&D、2018年~2022年
14.4.3.3 地域別収益シェア、2022年(%)
14.4.3.4 事業セグメント収益シェア、2022年(%)
14.4.4 製品ベンチマーク
14.4.5 戦略的展望
14.5 Anshan Iron and Steel Group Corporation
14.5.1 会社概要
14.5.2 会社概要
14.5.3 製品ベンチマーク
14.6 Jiangsu Shagang Group Company Limited
14.6.1 会社概要
14.6.2 会社概要
14.6.3 製品ベンチマーク
14.7 POSCO
14.7.1 会社概要
14.7.2 会社概要
14.7.3 財務分析
14.7.3.1 純収入、2018-2022年
14.7.3.2 R&D、2018年~2022年
14.7.3.3 地域別収益シェア、2022年(%)
14.7.3.4 事業セグメント収益シェア、2022年(%)
14.7.4 製品ベンチマーク
14.7.5 戦略的展望
14.8 Hesteel Group Company Limited
14.8.1 会社概要
14.8.2 会社概要
14.8.3 製品ベンチマーク
14.8.4 戦略的展望
14.9 Jianlong Group
14.9.1 会社概要
14.9.2 会社概要
14.9.3 製品ベンチマーク
14.10 Tata Steel Limited
14.10.1 会社概要
14.10.2 会社概要
14.10.3 財務分析
14.10.3.1 純収入、2018-2022年
14.10.3.2 R&D、2018年~2022年
14.10.3.3 地域別収益シェア、2022年(%)
14.10.3.4 事業セグメント収益シェア、2022年(%)
14.10.4 製品ベンチマーク
14.10.5 戦略的展望
14.11 Shandong Iron and Steel Co., Ltd.
14.11.1 会社概要
14.11.2 会社概要
14.11.3 製品ベンチマーク
14.12 Delong Steel Group
14.12.1 会社概要
14.12.2 会社概要
14.12.3 製品ベンチマーク
14.13 JFE Steel Corporation
14.13.1 会社概要
14.13.2 会社概要
14.13.3 財務分析
14.13.3.1 純売上高、2018年~2022年
14.13.3.2 事業セグメント収益シェア、2022年(%)
14.13.4 製品ベンチマーク
14.13.5 戦略的展望
14.14 Nucor Corporation
14.14.1 会社概要
14.14.2 会社概要
14.14.3 財務分析
14.14.3.1 純収入、2018年~2022年
14.14.3.2 事業セグメント収益シェア、2022年(%)
14.14.4 製品ベンチマーク
14.14.5 戦略的展望
14.15 Jiangxi Fangda Iron & Steel Group Co Ltd
14.15.1 会社概要
14.15.2 会社概要
14.15.3 製品ベンチマーク
14.16 Liuzhou Iron & Steel Co., Ltd
14.16.1 会社概要
14.16.2 会社概要
14.16.3 製品ベンチマーク
14.17 Hyundai Steel Co., Ltd.
14.17.1 会社概要
14.17.2 会社概要
14.17.3 財務分析
14.17.3.1 純収入、2018-2022年
14.17.3.2 R&D、2018年~2022年
14.17.3.3 地域別売上高シェア、2022年(%)
14.17.3.4 事業セグメント収益シェア、2022年(%)
14.17.4 製品ベンチマーク
15 結論と提言
15.1 Visiongainからの結びの言葉
15.2 市場プレイヤーへの提言
ページTOPに戻る
図表リスト
表の一覧
Table 1 Steel Market Snapshot, 2023 & 2033 (US$ Billion, CAGR %)
Table 2 Steel Market Forecast, 2023-2033 (US$ Bn, AGR (%), CAGR (%)) (V-Shaped Recovery Scenario)
Table 3 Steel Market by Region, 2023-2033 (US$ Bn, AGR (%), CAGR (%)) (V-Shaped Recovery Scenario)
Table 4 Steel Market Forecast, 2023-2033 (US$ Bn, AGR (%), CAGR (%)) (U-Shaped Recovery Scenario)
Table 5 Steel Market by Region, 2023-2033 (US$ Bn, AGR (%), CAGR (%)) (U-Shaped Recovery Scenario)
Table 6 Steel Market Forecast, 2023-2033 (US$ Bn, AGR (%), CAGR (%)) (W-Shaped Recovery Scenario)
Table 7 Steel Market by Region, 2023-2033 (US$ Bn, AGR (%), CAGR (%)) (W-Shaped Recovery Scenario)
Table 8 Steel Market Forecast, 2023-2033 (US$ Bn, AGR (%), CAGR (%)) (L-Shaped Recovery Scenario)
Table 9 Steel Market by Region, 2023-2033 (US$ Bn, AGR (%), CAGR (%)) (L-Shaped Recovery Scenario)
Table 10 Steel Market by Production Technology, 2023-2033 (US$ Bn, AGR (%), CAGR (%))
Table 11 Basic Oxygen Furnace Market by Region, 2023-2033 (US$ Bn, AGR (%), CAGR (%))
Table 12 Electric Arc Furnace Market by Region, 2023-2033 (US$ Bn, AGR (%), CAGR (%))
Table 13 Open Hearth Market by Region, 2023-2033 (US$ Bn, AGR (%), CAGR (%))
Table 14 Steel Market by Product, 2023-2033 (US$ Bn, AGR (%), CAGR (%))
Table 15 Steel Sheets Market by Region, 2023-2033 (US$ Bn, AGR (%), CAGR (%))
Table 16 Steel Beams Market by Region, 2023-2033 (US$ Bn, AGR (%), CAGR (%))
Table 17 Steel Bars Market by Region, 2023-2033 (US$ Bn, AGR (%), CAGR (%))
Table 18 Other Product Market by Region, 2023-2033 (US$ Bn, AGR (%), CAGR (%))
Table 19 Steel Market by Application, 2023-2033 (US$ Bn, AGR (%), CAGR (%))
Table 20 Building and Infrastructure Market by Region, 2023-2033 (US$ Bn, AGR (%), CAGR (%))
Table 21 Mechanical & Electrical Equipment Market by Region, 2023-2033 (US$ Bn, AGR (%), CAGR (%))
Table 22 Automotive Market by Region, 2023-2033 (US$ Bn, AGR (%), CAGR (%))
Table 23 Metal & Domestic Products Market by Region, 2023-2033 (US$ Bn, AGR (%), CAGR (%))
Table 24 Other Applications Market by Region, 2023-2033 (US$ Bn, AGR (%), CAGR (%))
Table 25 Steel Market by Type, 2023-2033 (US$ Bn, AGR (%), CAGR (%))
Table 26 Carbon Steel Market by Region, 2023-2033 (US$ Bn, AGR (%), CAGR (%))
Table 27 Stainless Steel Market by Region, 2023-2033 (US$ Bn, AGR (%), CAGR (%))
Table 28 Alloy Steel Market by Region, 2023-2033 (US$ Bn, AGR (%), CAGR (%))
Table 29 Aluminium Steel Market by Region, 2023-2033 (US$ Bn, AGR (%), CAGR (%))
Table 30 Cobalt Steel Market by Region, 2023-2033 (US$ Bn, AGR (%), CAGR (%))
Table 31 Other Steel Type Market by Region, 2023-2033 (US$ Bn, AGR (%), CAGR (%))
Table 32 Steel Market Forecast, 2023-2033 (US$ Bn, AGR (%), CAGR (%))
Table 33 Steel Market Forecast by Region, 2023-2033 (US$ Billion, AGR%, CAGR%)
Table 34 North America Steel Market by Value, 2023-2033 (US$ Bn, AGR (%), CAGR (%))
Table 35 North America Steel Market by Country, 2023-2033 (US$ Bn, AGR (%), CAGR (%))
Table 36 North America Steel Market by Production Technology, 2023-2033 (US$ Bn, AGR (%), CAGR (%))
Table 37 North America Steel Market by Product, 2023-2033 (US$ Bn, AGR (%), CAGR (%))
Table 38 North America Steel Market by Application, 2023-2033 (US$ Bn, AGR (%), CAGR (%))
Table 39 North America Steel Market by Type, 2023-2033 (US$ Bn, AGR (%), CAGR (%))
Table 40 US Steel Market by Value, 2023-2033 (US$ Bn, AGR (%), CAGR (%))
Table 41 Canada Steel Market by Value, 2023-2033 (US$ Bn, AGR (%), CAGR (%))
Table 42 Europe Steel Market by Value, 2023-2033 (US$ Bn, AGR (%), CAGR (%))
Table 43 Europe Steel Market by Country, 2023-2033 (US$ Bn, AGR (%), CAGR (%))
Table 44 Europe Steel Market by Production Technology, 2023-2033 (US$ Bn, AGR (%), CAGR (%))
Table 45 Europe Steel Market by Product, 2023-2033 (US$ Bn, AGR (%), CAGR (%))
Table 46 Europe Steel Market by Application, 2023-2033 (US$ Bn, AGR (%), CAGR (%))
Table 47 Europe Steel Market by Type, 2023-2033 (US$ Bn, AGR (%), CAGR (%))
Table 48 Germany Steel Market by Value, 2023-2033 (US$ Bn, AGR (%), CAGR (%))
Table 49 Ukraine Steel Market by Value, 2023-2033 (US$ Bn, AGR (%), CAGR (%))
Table 50 France Steel Market by Value, 2023-2033 (US$ Bn, AGR (%), CAGR (%))
Table 51 Italy Steel Market by Value, 2023-2033 (US$ Bn, AGR (%), CAGR (%))
Table 52 Russia Steel Market by Value, 2023-2033 (US$ Bn, AGR (%), CAGR (%))
Table 53 Rest of Europe Steel Market by Value, 2023-2033 (US$ Bn, AGR (%), CAGR (%))
Table 54 Asia-Pacific Steel Market by Value, 2023-2033 (US$ Bn, AGR (%), CAGR (%))
Table 55 Asia-Pacific Steel Market by Country, 2023-2033 (US$ Bn, AGR (%), CAGR (%))
Table 56 Asia-Pacific Steel Market by Production Technology, 2023-2033 (US$ Bn, AGR (%), CAGR (%))
Table 57 Asia-Pacific Steel Market by Product, 2023-2033 (US$ Bn, AGR (%), CAGR (%))
Table 58 Asia-Pacific Steel Market by Application, 2023-2033 (US$ Bn, AGR (%), CAGR (%))
Table 59 Asia-Pacific Steel Market by Type, 2023-2033 (US$ Bn, AGR (%), CAGR (%))
Table 60 China Steel Market by Value, 2023-2033 (US$ Bn, AGR (%), CAGR (%))
Table 61 India Steel Market by Value, 2023-2033 (US$ Bn, AGR (%), CAGR (%))
Table 62 Japan Steel Market by Value, 2023-2033 (US$ Bn, AGR (%), CAGR (%))
Table 63 South Korea Steel Market by Value, 2023-2033 (US$ Bn, AGR (%), CAGR (%))
Table 64 Australia Steel Market by Value, 2023-2033 (US$ Bn, AGR (%), CAGR (%))
Table 65 Rest of Asia-Pacific Steel Market by Value, 2023-2033 (US$ Bn, AGR (%), CAGR (%))
Table 66 Middle East & Africa Steel Market by Value, 2023-2033 (US$ Bn, AGR (%), CAGR (%))
Table 67 Middle East & Africa Steel Market by Country, 2023-2033 (US$ Bn, AGR (%), CAGR (%))
Table 68 Middle East & Africa Steel Market by Production Technology, 2023-2033 (US$ Bn, AGR (%), CAGR (%))
Table 69 Middle East & Africa Steel Market by Product, 2023-2033 (US$ Bn, AGR (%), CAGR (%))
Table 70 Middle East & Africa Steel Market by Application, 2023-2033 (US$ Bn, AGR (%), CAGR (%))
Table 71 Middle East & Africa Steel Market by Type, 2023-2033 (US$ Bn, AGR (%), CAGR (%))
Table 72 GCC Steel Market by Value, 2023-2033 (US$ Bn, AGR (%), CAGR (%))
Table 73 South Africa Steel Market by Value, 2023-2033 (US$ Bn, AGR (%), CAGR (%))
Table 74 Rest of Middle East & Africa Steel Market by Value, 2023-2033 (US$ Bn, AGR (%), CAGR (%))
Table 75 Latin America Steel Market by Value, 2023-2033 (US$ Bn, AGR (%), CAGR (%))
Table 76 Latin America Steel Market by Country, 2023-2033 (US$ Bn, AGR (%), CAGR (%))
Table 77 Latin America Steel Market by Production Technology, 2023-2033 (US$ Bn, AGR (%), CAGR (%))
Table 78 Latin America Steel Market by Product, 2023-2033 (US$ Bn, AGR (%), CAGR (%))
Table 79 Latin America Steel Market by Application, 2023-2033 (US$ Bn, AGR (%), CAGR (%))
Table 80 Latin America Steel Market by Type, 2023-2033 (US$ Bn, AGR (%), CAGR (%))
Table 81 Brazil Steel Market by Value, 2023-2033 (US$ Bn, AGR (%), CAGR (%))
Table 82 Mexico Steel Market by Value, 2023-2033 (US$ Bn, AGR (%), CAGR (%))
Table 83 Rest of Latin America Steel Market by Value, 2023-2033 (US$ Bn, AGR (%), CAGR (%))
Table 84 Strategic Outlook - Contract
Table 85 China Baowu Steel Group: Key Details, (CEO, HQ, Revenue, Founded, No. of Employees, Company Type, Website, Business Segment)
Table 86 China Baowu Steel Group: Product Benchmarking
Table 87 China Baowu Steel Group: Strategic Outlook
Table 88 ArcelorMittal S.A.: Key Details, (CEO, HQ, Revenue, Founded, No. of Employees, Company Type, Website, Business Segment)
Table 89 ArcelorMittal S.A: Product Benchmarking
Table 90 ArcelorMittal S.A: Strategic Outlook
Table 91 Anshan Iron and Steel Group Corporation: Key Details, (CEO, HQ, Revenue, Founded, No. of Employees, Company Type, Website, Business Segment)
Table 92 Anshan Iron and Steel Group Corporation: Product Benchmarking
Table 93 Jiangsu Shagang Group Company Limited : Key Details, (CEO, HQ, Revenue, Founded, No. of Employees, Company Type, Website, Business Segment)
Table 94 Jiangsu Shagang Group Company Limited: Product Benchmarking
Table 95 POSCO: Key Details, (CEO, HQ, Revenue, Founded, No. of Employees, Company Type, Website, Business Segment)
Table 96 POSCO: Product Benchmarking
Table 97 POSCO: Strategic Outlook
Table 98 Hesteel Group Company Limited: Key Details, (CEO, HQ, Revenue, Founded, No. of Employees, Company Type, Website, Business Segment)
Table 99 Hesteel Group Company Limited : Product Benchmarking
Table 100 Hesteel Group Company Limited: Strategic Outlook
Table 101 Jianlong Group: Key Details, (CEO, HQ, Revenue, Founded, No. of Employees, Company Type, Website, Business Segment)
Table 102 Jianlong Group: Product Benchmarking
Table 103 Tata Steel Limited: Key Details, (CEO, HQ, Revenue, Founded, No. of Employees, Company Type, Website, Business Segment)
Table 104 Tata Steel Limited: Product Benchmarking
Table 105 Tata Steel Limited: Strategic Outlook
Table 106 Shandong Iron and Steel Co., Ltd.: Key Details, (CEO, HQ, Revenue, Founded, No. of Employees, Company Type, Website, Business Segment)
Table 107 Shandong Iron and Steel Co., Ltd.: Product Benchmarking
Table 108 Delong Steel Group: Key Details, (CEO, HQ, Revenue, Founded, No. of Employees, Company Type, Website, Business Segment)
Table 109 Delong Steel Group: Product Benchmarking
Table 110 JFE Steel Corporation: Key Details, (CEO, HQ, Revenue, Founded, No. of Employees, Company Type, Website, Business Segment)
Table 111 JFE Steel Corporation: Product Benchmarking
Table 112 JFE Steel Corporation: Strategic Outlook
Table 113 Nucor Corporation: Key Details, (CEO, HQ, Revenue, Founded, No. of Employees, Company Type, Website, Business Segment)
Table 114 Nucor Corporation: Product Benchmarking
Table 115 Nucor Corporation: Strategic Outlook
Table 116 Jiangxi Fangda Iron & Steel Group Co Ltd: Key Details, (CEO, HQ, Revenue, Founded, No. of Employees, Company Type, Website, Business Segment)
Table 117 Jiangxi Fangda Iron & Steel Group Co Ltd: Product Benchmarking
Table 118 Liuzhou Iron & Steel Co., Ltd: Key Details, (CEO, HQ, Revenue, Founded, No. of Employees, Company Type, Website, Business Segment)
Table 119 Liuzhou Iron & Steel Co., Ltd: Product Benchmarking
Table 120 Hyundai Steel Co., Ltd.: Key Details, (CEO, HQ, Revenue, Founded, No. of Employees, Company Type, Website, Business Segment)
Table 121 Hyundai Steel Co., Ltd: Product Benchmarking
図の一覧
Figure 1 Steel Market Segmentation
Figure 2 Steel Market by Production Technology: Market Attractiveness Index
Figure 3 Steel Market by Product: Market Attractiveness Index
Figure 4 Steel Market by Application: Market Attractiveness Index
Figure 5 Steel Market by Type: Market Attractiveness Index
Figure 6 Steel Market Attractiveness Index by Region
Figure 7 Steel Market: Market Dynamics
Figure 8 Steel Market: Porter’s Five Forces Analysis
Figure 9 Steel Market Share Forecast by COVID, 2023-2033 (%)
Figure 10 Steel Market Forecast, 2023-2033 (US$ Bn, AGR (%)) (V-Shaped Recovery Scenario)
Figure 11 Steel Market by Region, 2023-2033 (US$ Bn, AGR (%)) (V-Shaped Recovery Scenario)
Figure 12 Steel Market Forecast, 2023-2033 (US$ Bn, AGR (%)) (U-Shaped Recovery Scenario)
Figure 13 Steel Market by Region, 2023-2033 (US$ Bn, AGR (%)) (U-Shaped Recovery Scenario)
Figure 14 Steel Market Forecast, 2023-2033 (US$ Bn, AGR (%)) (W-Shaped Recovery Scenario)
Figure 15 Steel Market by Region, 2023-2033 (US$ Bn, AGR (%)) (W-Shaped Recovery Scenario)
Figure 16 Steel Market Forecast, 2023-2033 (US$ Bn, AGR (%)) (L-Shaped Recovery Scenario)
Figure 17 Steel Market by Region, 2023-2033 (US$ Bn, AGR (%)) (L-Shaped Recovery Scenario)
Figure 18 Steel Market: PEST Analysis
Figure 19 Steel Market by Production Technology: Market Attractiveness Index
Figure 20 Steel Market by Production Technology, 2023-2033 (US$ Bn, AGR (%))
Figure 21 Steel Market Share Forecast by Production Technology, 2023, 2028, 2033 (%)
Figure 22 Basic Oxygen Furnace Market by Region, 2023-2033 (US$ Bn, AGR (%))
Figure 23 Basic Oxygen Furnace Market Share Forecast by Region, 2023 & 2033 (%)
Figure 24 Electric Arc Furnace Market by Region, 2023-2033 (US$ Bn, AGR (%))
Figure 25 Electric Arc Furnace Market Share Forecast by Region, 2023 & 2033 (%)
Figure 26 Open Hearth Market by Region, 2023-2033 (US$ Bn, AGR (%))
Figure 27 Open Hearth Market Share Forecast by Region, 2023 & 2033 (%)
Figure 28 Steel Market by Product: Market Attractiveness Index
Figure 29 Steel Market by Product, 2023-2033 (US$ Bn, AGR (%))
Figure 30 Steel Market Share Forecast by Product, 2023, 2028, 2033 (%)
Figure 31 Steel Sheets Market by Region, 2023-2033 (US$ Bn, AGR (%))
Figure 32 Steel Sheets Market Share Forecast by Region, 2023 & 2033 (%)
Figure 33 Steel Beams Market by Region, 2023-2033 (US$ Bn, AGR (%))
Figure 34 Steel Beams Market Share Forecast by Region, 2023 & 2033 (%)
Figure 35 Steel Bars Market by Region, 2023-2033 (US$ Bn, AGR (%))
Figure 36 Steel Bars Market Share Forecast by Region, 2023 & 2033 (%)
Figure 37 Other Product Market by Region, 2023-2033 (US$ Bn, AGR (%))
Figure 38 Other Product Market Share Forecast by Region, 2023 & 2033 (%)
Figure 39 Steel Market by Application: Market Attractiveness Index
Figure 40 Steel Market by Application, 2023-2033 (US$ Bn, AGR (%))
Figure 41 Steel Market Share Forecast by Application, 2023, 2028, 2033 (%)
Figure 42 Building and Infrastructure Market by Region, 2023-2033 (US$ Bn, AGR (%))
Figure 43 Building and Infrastructure Market Share Forecast by Region, 2023 & 2033 (%)
Figure 44 Mechanical & Electrical Equipment Market by Region, 2023-2033 (US$ Bn, AGR (%))
Figure 45 Mechanical & Electrical Equipment Market Share Forecast by Region, 2023 & 2033 (%)
Figure 46 Automotive Market by Region, 2023-2033 (US$ Bn, AGR (%))
Figure 47 Automotive Market Share Forecast by Region, 2023 & 2033 (%)
Figure 48 Metal & Domestic Products Market by Region, 2023-2033 (US$ Bn, AGR (%))
Figure 49 Metal & Domestic Products Market Share Forecast by Region, 2023 & 2033 (%)
Figure 50 Other Applications Market by Region, 2023-2033 (US$ Bn, AGR (%))
Figure 51 Other Applications Market Share Forecast by Region, 2023 & 2033 (%)
Figure 52 Steel Market by Type: Market Attractiveness Index
Figure 53 Steel Market by Type, 2023-2033 (US$ Bn, AGR (%))
Figure 54 Steel Market Share Forecast by Type, 2023, 2028, 2033 (%)
Figure 55 Carbon Steel Market by Region, 2023-2033 (US$ Bn, AGR (%))
Figure 56 Carbon Steel Market Share Forecast by Region, 2023 & 2033 (%)
Figure 57 Stainless Steel Market by Region, 2023-2033 (US$ Bn, AGR (%))
Figure 58 Stainless Steel Market Share Forecast by Region, 2023 & 2033 (%)
Figure 59 Alloy Steel Market by Region, 2023-2033 (US$ Bn, AGR (%))
Figure 60 Alloy Steel Market Share Forecast by Region, 2023 & 2033 (%)
Figure 61 Aluminium Steel Market by Region, 2023-2033 (US$ Bn, AGR (%))
Figure 62 Aluminium Steel Market Share Forecast by Region, 2023 & 2033 (%)
Figure 63 Cobalt Steel Market by Region, 2023-2033 (US$ Bn, AGR (%))
Figure 64 Cobalt Steel Market Share Forecast by Region, 2023 & 2033 (%)
Figure 65 Other Steel Type Market by Region, 2023-2033 (US$ Bn, AGR (%))
Figure 66 Other Steel Type Market Share Forecast by Region, 2023 & 2033 (%)
Figure 67 Steel Market Forecast by Region 2023 and 2033 (Revenue, CAGR%)
Figure 68 Steel Market Forecast, 2023-2033 (US$ Bn, AGR (%))
Figure 69 Steel Market Share Forecast by Region 2023, 2028, 2033 (%)
Figure 70 Steel Market by Region, 2023-2033 (US$ Bn, AGR (%))
Figure 71 North America Steel Market Attractiveness Index
Figure 72 North America Steel Market by Region, 2023, 2028 & 2033 (US$ Billion)
Figure 73 North America Steel Market by Value, 2023-2033 (US$ Bn, AGR (%))
Figure 74 North America Steel Market by Country, 2023-2033 (US$ Bn, AGR (%))
Figure 75 North America Steel Market Share Forecast by Country, 2023 & 2033 (%)
Figure 76 North America Steel Market by Production Technology, 2023-2033 (US$ Bn, AGR (%))
Figure 77 North America Steel Market Share Forecast Production Technology, 2023 & 2033 (%)
Figure 78 North America Steel Market by Product, 2023-2033 (US$ Bn, AGR (%))
Figure 79 North America Steel Market Share Forecast by Product, 2023 & 2033 (%)
Figure 80 North America Steel Market by Application, 2023-2033 (US$ Bn, AGR (%))
Figure 81 North America Steel Market Share Forecast by Application, 2023 & 2033 (%)
Figure 82 North America Steel Market by Type, 2023-2033 (US$ Bn, AGR (%))
Figure 83 North America Steel Market Share Forecast by Type, 2023 & 2033 (%)
Figure 84 US Steel Market by Value, 2023-2033 (US$ Bn, AGR (%))
Figure 85 Canada Steel Market by Value, 2023-2033 (US$ Bn, AGR (%))
Figure 86 Europe Steel Market Attractiveness Index
Figure 87 Europe Steel Market by Region, 2023, 2028 & 2033 (US$ Billion)
Figure 88 Europe Steel Market by Value, 2023-2033 (US$ Bn, AGR (%))
Figure 89 Europe Steel Market by Country, 2023-2033 (US$ Bn, AGR (%))
Figure 90 Europe Steel Market Share Forecast by Country, 2023 & 2033 (%)
Figure 91 Europe Steel Market by Production Technology, 2023-2033 (US$ Bn, AGR (%))
Figure 92 Europe Steel Market Share Forecast Production Technology, 2023 & 2033 (%)
Figure 93 Europe Steel Market by Product, 2023-2033 (US$ Bn, AGR (%))
Figure 94 Europe Steel Market Share Forecast by Product, 2023 & 2033 (%)
Figure 95 Europe Steel Market by Application, 2023-2033 (US$ Bn, AGR (%))
Figure 96 Europe Steel Market Share Forecast by Application, 2023 & 2033 (%)
Figure 97 Europe Steel Market by Type, 2023-2033 (US$ Bn, AGR (%))
Figure 98 Europe Steel Market Share Forecast by Type, 2023 & 2033 (%)
Figure 99 Germany Steel Market by Value, 2023-2033 (US$ Bn, AGR (%))
Figure 100 Ukraine Steel Market by Value, 2023-2033 (US$ Bn, AGR (%))
Figure 101 France Steel Market by Value, 2023-2033 (US$ Bn, AGR (%))
Figure 102 Italy Steel Market by Value, 2023-2033 (US$ Bn, AGR (%))
Figure 103 Russia Steel Market by Value, 2023-2033 (US$ Bn, AGR (%))
Figure 104 Rest of Europe Steel Market by Value, 2023-2033 (US$ Bn, AGR (%))
Figure 105 Asia-Pacific Steel Market Attractiveness Index
Figure 106 Asia-Pacific Steel Market by Region, 2023, 2028 & 2033 (US$ Billion)
Figure 107 Asia-Pacific Steel Market by Value, 2023-2033 (US$ Bn, AGR (%))
Figure 108 Asia-Pacific Steel Market by Country, 2023-2033 (US$ Bn, AGR (%))
Figure 109 Asia-Pacific Steel Market Share Forecast by Country, 2023 & 2033 (%)
Figure 110 Asia-Pacific Steel Market by Production Technology, 2023-2033 (US$ Bn, AGR (%))
Figure 111 Asia-Pacific Steel Market Share Forecast Production Technology, 2023 & 2033 (%)
Figure 112 Asia-Pacific Steel Market by Product, 2023-2033 (US$ Bn, AGR (%))
Figure 113 Asia-Pacific Steel Market Share Forecast by Product, 2023 & 2033 (%)
Figure 114 Asia-Pacific Steel Market by Application, 2023-2033 (US$ Bn, AGR (%))
Figure 115 Asia-Pacific Steel Market Share Forecast by Application, 2023 & 2033 (%)
Figure 116 Asia-Pacific Steel Market by Type, 2023-2033 (US$ Bn, AGR (%))
Figure 117 Asia-Pacific Steel Market Share Forecast by Type, 2023 & 2033 (%)
Figure 118 China Steel Market by Value, 2023-2033 (US$ Bn, AGR (%))
Figure 119 India Steel Market by Value, 2023-2033 (US$ Bn, AGR (%))
Figure 120 Japan Steel Market by Value, 2023-2033 (US$ Bn, AGR (%))
Figure 121 South Korea Steel Market by Value, 2023-2033 (US$ Bn, AGR (%))
Figure 122 Australia Steel Market by Value, 2023-2033 (US$ Bn, AGR (%))
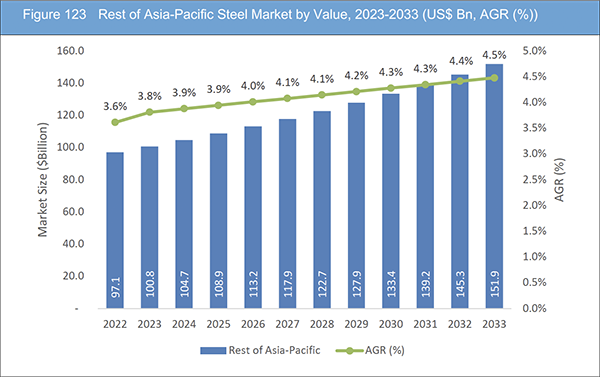
Figure 123 Rest of Asia-Pacific Steel Market by Value, 2023-2033 (US$ Bn, AGR (%))
Figure 124 Middle East and Africa Steel Market Attractiveness Index
Figure 125 Middle East and Africa Steel Market by Region, 2023, 2028 & 2033 (US$ Billion)
Figure 126 Middle East & Africa Steel Market by Value, 2023-2033 (US$ Bn, AGR (%))
Figure 127 Middle East & Africa Steel Market by Country, 2023-2033 (US$ Bn, AGR (%))
Figure 128 Middle East and Africa Steel Market Share Forecast by Country, 2023 & 2033 (%)
Figure 129 Middle East & Africa Steel Market by Production Technology, 2023-2033 (US$ Bn, AGR (%))
Figure 130 Middle East and Africa Steel Market Share Forecast Production Technology, 2023 & 2033 (%)
Figure 131 Middle East & Africa Steel Market by Product, 2023-2033 (US$ Bn, AGR (%))
Figure 132 Middle East and Africa Steel Market Share Forecast by Product, 2023 & 2033 (%)
Figure 133 Middle East & Africa Steel Market by Application, 2023-2033 (US$ Bn, AGR (%))
Figure 134 Middle East and Africa Steel Market Share Forecast by Application, 2023 & 2033 (%)
Figure 135 Middle East & Africa Steel Market by Type, 2023-2033 (US$ Bn, AGR (%))
Figure 136 Middle East and Africa Steel Market Share Forecast by Type, 2023 & 2033 (%)
Figure 137 GCC Steel Market by Value, 2023-2033 (US$ Bn, AGR (%))
Figure 138 South Africa Steel Market by Value, 2023-2033 (US$ Bn, AGR (%))
Figure 139 Rest of Middle East & Africa Steel Market by Value, 2023-2033 (US$ Bn, AGR (%))
Figure 140 Latin America Steel Market Attractiveness Index
Figure 141 Latin America Steel Market by Region, 2023, 2028 & 2033 (US$ Billion)
Figure 142 Latin America Steel Market by Value, 2023-2033 (US$ Bn, AGR (%))
Figure 143 Latin America Steel Market by Country, 2023-2033 (US$ Bn, AGR (%))
Figure 144 Latin America Steel Market Share Forecast by Country, 2023 & 2033 (%)
Figure 145 Latin America Steel Market by Production Technology, 2023-2033 (US$ Bn, AGR (%))
Figure 146 Latin America Steel Market Share Forecast Production Technology, 2023 & 2033 (%)
Figure 147 Latin America Steel Market by Product, 2023-2033 (US$ Bn, AGR (%))
Figure 148 Latin America Steel Market Share Forecast by Product, 2023 & 2033 (%)
Figure 149 Latin America Steel Market by Application, 2023-2033 (US$ Bn, AGR (%))
Figure 150 Latin America Steel Market Share Forecast by Application, 2023 & 2033 (%)
Figure 151 Latin America Steel Market by Type, 2023-2033 (US$ Bn, AGR (%))
Figure 152 Latin America Steel Market Share Forecast by Type, 2023 & 2033 (%)
Figure 153 Brazil Steel Market by Value, 2023-2033 (US$ Bn, AGR (%))
Figure 154 Mexico Steel Market by Value, 2023-2033 (US$ Bn, AGR (%))
Figure 155 Rest of Latin America Steel Market by Value, 2023-2033 (US$ Bn, AGR (%))
Figure 156 Steel Market: Company Share, 2022
Figure 157 ArcelorMittal S.A..: Net Revenue, 2018-2022 (US$ Million, AGR%)
Figure 158 ArcelorMittal S.A..: R&D, 2018-2022 (US$ Million, AGR%)
Figure 159 ArcelorMittal S.A.: Regional Revenue Share, 2022 (%)
Figure 160 ArcelorMittal S.A.: Business Segment Revenue Share, 2022 (%)
Figure 161 POSCO.: Net Revenue, 2018-2022 (US$ Million, AGR%)
Figure 162 POSCO.: R&D, 2018-2022 (US$ Million, AGR%)
Figure 163 POSCO.: Regional Revenue Share, 2022 (%)
Figure 164 POSCO.: Business Segment Revenue Share, 2022 (%)
Figure 165 Tata Steel Limited: Net Revenue, 2018-2022 (US$ Million, AGR%)
Figure 166 Tata Steel Limited.: R&D, 2018-2022 (US$ Million, AGR%)
Figure 167 Tata Steel Limited.: Regional Revenue Share, 2022 (%)
Figure 168 Tata Steel Limited.: Business Segment Revenue Share, 2022 (%)
Figure 169 JFE Steel Corporation.: Net Revenue, 2018-2022 (US$ Million, AGR%)
Figure 170 JFE Steel Corporation.: Business Segment Revenue Share, 2022 (%)
Figure 171 Nucor Corporation.: Net Revenue, 2018-2022 (US$ Million, AGR%)
Figure 172 Nucor Corporation.: Business Segment Revenue Share, 2022 (%)
Figure 173 Hyundai Steel Co., Ltd.: Net Revenue, 2018-2022 (US$ Million, AGR%)
Figure 174 Hyundai Steel Co., Ltd.: R&D, 2018-2022 (US$ Million, AGR%)
Figure 175 Hyundai Steel Co., Ltd.: Regional Revenue Share, 2022 (%)
Figure 176 Hyundai Steel Co., Ltd.: Business Segment Revenue Share, 2022 (%)
ページTOPに戻る
Summary
Report Details
The Steel Market Report 2023-2033: This report will prove invaluable to leading firms striving for new revenue pockets if they wish to better understand the industry and its underlying dynamics. It will be useful for companies that would like to expand into different industries or to expand their existing operations in a new region.
Economic Growth and Infrastructure Development Is Driving the Market
Economic growth is a primary driver of the global steel market. As economies expand, governments and private sectors invest in infrastructure projects like roads, bridges, railways, and buildings. These projects require large quantities of steel, making it an essential material in construction. Additionally, steel is crucial in the development of industries and manufacturing, which further fuels economic growth. The steady demand for steel in infrastructure projects creates stability and growth opportunities for the steel industry, contributing significantly to the overall economic development of a country or region.
Technological Cooperation and Research
Collaborations between steel companies and research institutions drive innovation in steel production and application. Research and development efforts focus on enhancing steel’s properties, reducing environmental impacts, and developing novel applications, which keep the steel industry at the forefront of technology and competitiveness.
What Questions Should You Ask before Buying a Market Research Report?
• How is the steel market evolving?
• What is driving and restraining the steel market?
• How will each steel submarket segment grow over the forecast period and how much revenue will these submarkets account for in 2033?
• How will the market shares for each steel submarket develop from 2023 to 2033?
• What will be the main driver for the overall market from 2023 to 2033?
• Will leading steel markets broadly follow the macroeconomic dynamics, or will individual national markets outperform others?
• How will the market shares of the national markets change by 2033 and which geographical region will lead the market in 2033?
• Who are the leading players and what are their prospects over the forecast period?
• What are the steel projects for these leading companies?
• How will the industry evolve during the period between 2023 and 2033? What are the implications of steel projects taking place now and over the next 10 years?
• Is there a greater need for product commercialisation to further scale the steel market?
• Where is the steel market heading and how can you ensure you are at the forefront of the market?
• What are the best investment options for new product and service lines?
• What are the key prospects for moving companies into a new growth path and C-suite?
You need to discover how this will impact the steel market today, and over the next 10 years:
• Our 352-page report provides 121 tables and 176 charts/graphs exclusively to you.
• The report highlights key lucrative areas in the industry so you can target them – NOW.
• It contains in-depth analysis of global, regional and national sales and growth.
• It highlights for you the key successful trends, changes and revenue projections made by your competitors.
This report tells you TODAY how the steel market will develop in the next 10 years, and in line with the variations in COVID-19 economic recession and bounce. This market is more critical now than at any point over the last 10 years.
Forecasts to 2033 and other analyses reveal commercial prospects
• In addition to revenue forecasting to 2033, our new study provides you with recent results, growth rates, and market shares.
• You will find original analyses, with business outlooks and developments.
• Discover qualitative analyses (including market dynamics, drivers, opportunities, restraints and challenges), cost structure, impact of rising steel prices and recent developments.
This report includes data analysis and invaluable insight into how COVID-19 will affect the industry and your company. Four COVID-19 recovery patterns and their impact, namely, “V”, “L”, “W” and “U” are discussed in this report.
Segments Covered in the Report
Market Segment by Production Technology
• Basic Oxygen Furnace
• Electric Arc Furnace
• Open Hearth
Market Segment by Product
• Steel Sheets
• Steel Beams
• Steel Bars
• Other Product
Market Segment by Application
• Building and Infrastructure
• Mechanical & Electrical Equipment
• Automotive
• Metal & Domestic Products
• Other Applications
Market Segment by Type
• Carbon Steel
• Stainless Steel
• Alloy Steel
• Aluminium Steel
• Cobalt Steel
• Other Steel Type
In addition to the revenue predictions for the overall world market and segments, you will also find revenue forecasts for four regional and 20 leading national markets:
North America
• U.S.
• Canada
Europe
• Germany
• Russia
• Ukraine
• France
• Italy
• Rest of Europe
Asia Pacific
• China
• Japan
• India
• Australia
• South Korea
• Rest of Asia Pacific
Latin America
• Brazil
• Mexico
• Rest of Latin America
Middle East & Africa
• GCC
• South Africa
• Rest of Middle East & Africa
The report also includes profiles and for some of the leading companies in the Steel Market, 2023 to 2033, with a focus on this segment of these companies’ operations.
Leading companies and the potential for market growth
• Anshan Iron and Steel Group Corporation
• ArcelorMittal S.A.
• China Baowu Steel Group
• Delong Steel Group
• Hesteel Group Company Limited
• Hyundai Steel Co., Ltd.
• JFE Steel Corporation
• Jiangsu Shagang Group Company Limited
• Jiangxi Fangda Iron & Steel Group Co Ltd
• Jianlong Group
• Liuzhou Iron & Steel Co., Ltd
• Nucor Corporation
• POSCO
• Shandong Iron and Steel Co., Ltd.
• Tata Steel Limited
Overall world revenue for Steel Market, 2023 to 2033 in terms of value the market will surpass US$1,656.4 billion in 2023, our work calculates. We predict strong revenue growth through to 2033. Our work identifies which organizations hold the greatest potential. Discover their capabilities, progress, and commercial prospects, helping you stay ahead.
How will the Steel Market, 2023 to 2033 report help you?
In summary, our 350+ page report provides you with the following knowledge:
• Revenue forecasts to 2033 for Steel Market, 2023 to 2033 Market, with forecasts for production technology, product, application, and type, each forecast at a global and regional level – discover the industry’s prospects, finding the most lucrative places for investments and revenues.
• Revenue forecasts to 2033 for four regional and 20 key national markets – See forecasts for the Steel Market, 2023 to 2033 market in North America, Europe, Asia-Pacific, Latin America and Middle East & Africa. Also forecasted is the market in the US, Canada, Brazil, Germany, France, Ukraine, Italy, China, India, Japan, Russia, and Australia among other prominent economies.
• Prospects for established firms and those seeking to enter the market – including company profiles for 20 of the major companies involved in the Steel Market, 2023 to 2033.
Find quantitative and qualitative analyses with independent predictions. Receive information that only our report contains, staying informed with invaluable business intelligence.
Information found nowhere else
With our new report, you are less likely to fall behind in knowledge or miss out on opportunities. See how our work could benefit your research, analyses, and decisions. Visiongain’s study is for everybody needing commercial analyses for the Steel Market, 2023 to 2033, market-leading companies. You will find data, trends and predictions.
ページTOPに戻る
Table of Contents
Table of Contents
1 Report Overview
1.1 Objectives of the Study
1.2 Introduction to Steel Market
1.3 What This Report Delivers
1.4 Why You Should Read This Report
1.5 Key Questions Answered by This Analytical Report
1.6 Who Is This Report for?
1.7 Methodology
1.7.1 Market Definitions
1.7.2 Market Evaluation & Forecasting Methodology
1.7.3 Data Validation
1.7.3.1 Primary Research
1.7.3.2 Secondary Research
1.8 Frequently Asked Questions (FAQs)
1.9 Associated Visiongain Reports
1.10 About Visiongain
2 Executive Summary
3 Market Overview
3.1 Key Findings
3.2 Market Dynamics
3.2.1 Market Driving Factors
3.2.1.1 Rising Demand for Recycled Steel Pushes Demand for Steel Scrap
3.2.1.2 Growing Investments in Infrastructure Sector
3.2.1.3 Ongoing Drive for Lighter Weight Vehicles Drives Demand for High Strength Steel
3.2.2 Market Restraining Factors
3.2.2.1 Meeting Stringent Environmental Regulations and Reducing Carbon Emissions Is a Challenge for the Steel Industry
3.2.2.2 Steel Faces Competition from Alternative Materials Like Aluminium, Composites, and Advanced Plastics, Affecting Demand in Specific Sectors
3.2.2.3 Changes in Global Supply Chain Dynamics Can Lead to Disruptions in Steel Demand Patterns
3.2.3 Market Opportunities
3.2.3.1 Upgrading Aging Infrastructure in Developed Economies Drives Steel Consumption for Renovation and Modernization Projects
3.2.3.2 Urbanization in Developing Countries to Drive Growth
3.2.3.3 Transition towards Net Zero Steel
3.3 Porter’s Five Forces Analysis
3.3.1 Bargaining Power of Suppliers (Medium)
3.3.2 Bargaining Power of Buyers (High)
3.3.3 Competitive Rivalry (High)
3.3.4 Threat from Substitutes (Low)
3.3.5 Threat of New Entrants (Low to Medium)
3.4 COVID-19 Impact Analysis
3.4.1 “V-Shaped Recovery”
3.4.2 “U-Shaped Recovery”
3.4.3 “W-Shaped Recovery”
3.4.4 “L-Shaped Recovery”
3.5 PEST Analysis
4 Steel Market Analysis by Production Technology
4.1 Key Findings
4.2 Production Technology Segment: Market Attractiveness Index
4.3 Steel Market Size Estimation and Forecast by Production Technology
4.4 Basic Oxygen Furnace
4.4.1 Market Size by Region, 2023-2033 (US$ Billion)
4.4.2 Market Share by Region, 2023 & 2033 (%)
4.5 Electric Arc Furnace
4.5.1 Market Size by Region, 2023-2033 (US$ Billion)
4.5.2 Market Share by Region, 2023 & 2033 (%)
4.6 Open Hearth
4.6.1 Market Size by Region, 2023-2033 (US$ Billion)
4.6.2 Market Share by Region, 2023 & 2033 (%)
5 Steel Market Analysis by Product
5.1 Key Findings
5.2 Product Segment: Market Attractiveness Index
5.3 Steel Market Size Estimation and Forecast by Product
5.4 Steel Sheets
5.4.1 Market Size by Region, 2023-2033 (US$ Billion)
5.4.2 Market Share by Region, 2023 & 2033 (%)
5.5 Steel Beams
5.5.1 Market Size by Region, 2023-2033 (US$ Billion)
5.5.2 Market Share by Region, 2023 & 2033 (%)
5.6 Steel Bars
5.6.1 Market Size by Region, 2023-2033 (US$ Billion)
5.6.2 Market Share by Region, 2023 & 2033 (%)
5.7 Other Product
5.7.1 Market Size by Region, 2023-2033 (US$ Billion)
5.7.2 Market Share by Region, 2023 & 2033 (%)
6 Steel Market Analysis by Application
6.1 Key Findings
6.2 Application Segment: Market Attractiveness Index
6.3 Steel Market Size Estimation and Forecast by Application
6.4 Building and Infrastructure
6.4.1 Market Size by Region, 2023-2033 (US$ Billion)
6.4.2 Market Share by Region, 2023 & 2033 (%)
6.5 Mechanical & Electrical Equipment
6.5.1 Market Size by Region, 2023-2033 (US$ Billion)
6.5.2 Market Share by Region, 2023 & 2033 (%)
6.6 Automotive
6.6.1 Market Size by Region, 2023-2033 (US$ Billion)
6.6.2 Market Share by Region, 2023 & 2033 (%)
6.7 Metal & Domestic Products
6.7.1 Market Size by Region, 2023-2033 (US$ Billion)
6.7.2 Market Share by Region, 2023 & 2033 (%)
6.8 Other Applications
6.8.1 Market Size by Region, 2023-2033 (US$ Billion)
6.8.2 Market Share by Region, 2023 & 2033 (%)
7 Steel Market Analysis by Type
7.1 Key Findings
7.2 Type Segment: Market Attractiveness Index
7.3 Steel Market Size Estimation and Forecast by Type
7.4 Carbon Steel
7.4.1 Market Size by Region, 2023-2033 (US$ Billion)
7.4.2 Market Share by Region, 2023 & 2033 (%)
7.5 Stainless Steel
7.5.1 Market Size by Region, 2023-2033 (US$ Billion)
7.5.2 Market Share by Region, 2023 & 2033 (%)
7.6 Alloy Steel
7.6.1 Market Size by Region, 2023-2033 (US$ Billion)
7.6.2 Market Share by Region, 2023 & 2033 (%)
7.7 Aluminium Steel
7.7.1 Market Size by Region, 2023-2033 (US$ Billion)
7.7.2 Market Share by Region, 2023 & 2033 (%)
7.8 Cobalt Steel
7.8.1 Market Size by Region, 2023-2033 (US$ Billion)
7.8.2 Market Share by Region, 2023 & 2033 (%)
7.9 Other Steel Type
7.9.1 Market Size by Region, 2023-2033 (US$ Billion)
7.9.2 Market Share by Region, 2023 & 2033 (%)
8 Steel Market Analysis by Region
8.1 Key Findings
8.2 Regional Market Size Estimation and Forecast
9 North America Steel Market Analysis
9.1 Key Findings
9.2 North America Steel Market Attractiveness Index
9.3 North America Steel Market by Country, 2023, 2028 & 2033 (US$ Billion)
9.4 North America Steel Market Size Estimation and Forecast
9.5 North America Steel Market Size Estimation and Forecast by Country
9.6 North America Steel Market Size Estimation and Forecast by Production Technology
9.7 North America Steel Market Size Estimation and Forecast by Product
9.8 North America Steel Market Size Estimation and Forecast by Application
9.9 North America Steel Market Size Estimation and Forecast by Type
9.10 U.S. Steel Market Analysis
9.11 Canada Steel Market Analysis
10 Europe Steel Market Analysis
10.1 Key Findings
10.2 Europe Steel Market Attractiveness Index
10.3 Europe Steel Market by Country, 2023, 2028 & 2033 (US$ Billion)
10.4 Europe Steel Market Size Estimation and Forecast
10.5 Europe Steel Market Size Estimation and Forecast by Country
10.6 Europe Steel Market Size Estimation and Forecast by Production Technology
10.7 Europe Steel Market Size Estimation and Forecast by Product
10.8 Europe Steel Market Size Estimation and Forecast by Application
10.9 Europe Steel Market Size Estimation and Forecast by Type
10.10 Germany Steel Market Analysis
10.11 Ukraine Steel Market Analysis
10.12 France Steel Market Analysis
10.13 Italy Steel Market Analysis
10.14 Russia Steel Market Analysis
10.15 Rest of Europe Steel Market Analysis
11 Asia-Pacific Steel Market Analysis
11.1 Key Findings
11.2 Asia-Pacific Steel Market Attractiveness Index
11.3 Asia-Pacific Steel Market by Country, 2023, 2028 & 2033 (US$ Billion)
11.4 Asia-Pacific Steel Market Size Estimation and Forecast
11.5 Asia-Pacific Steel Market Size Estimation and Forecast by Country
11.6 Asia-Pacific Steel Market Size Estimation and Forecast by Production Technology
11.7 Asia-Pacific Steel Market Size Estimation and Forecast by Product
11.8 Asia-Pacific Steel Market Size Estimation and Forecast by Application
11.9 Asia-Pacific Steel Market Size Estimation and Forecast by Type
11.10 China Steel Market Analysis
11.11 India Steel Market Analysis
11.12 Japan Steel Market Analysis
11.13 South Korea Steel Market Analysis
11.14 Australia Steel Market Analysis
11.15 Rest of Asia-Pacific Steel Market Analysis
12 Middle East and Africa Steel Market Analysis
12.1 Key Findings
12.2 Middle East and Africa Steel Market Attractiveness Index
12.3 Middle East and Africa Steel Market by Country, 2023, 2028 & 2033 (US$ Billion)
12.4 Middle East and Africa Steel Market Size Estimation and Forecast
12.5 Middle East and Africa Steel Market Size Estimation and Forecast by Country
12.6 Middle East and Africa Steel Market Size Estimation and Forecast by Production Technology
12.7 Middle East and Africa Steel Market Size Estimation and Forecast by Product
12.8 Middle East and Africa Steel Market Size Estimation and Forecast by Application
12.9 Middle East and Africa Steel Market Size Estimation and Forecast by Type
12.10 GCC Steel Market Analysis
12.11 South Africa Steel Market Analysis
12.12 Rest of Middle East & Africa Steel Market Analysis
13 Latin America Steel Market Analysis
13.1 Key Findings
13.2 Latin America Steel Market Attractiveness Index
13.3 Latin America Steel Market by Country, 2023, 2028 & 2033 (US$ Billion)
13.4 Latin America Steel Market Size Estimation and Forecast
13.5 Latin America Steel Market Size Estimation and Forecast by Country
13.6 Latin America Steel Market Size Estimation and Forecast by Production Technology
13.7 Latin America Steel Market Size Estimation and Forecast by Product
13.8 Latin America Steel Market Size Estimation and Forecast by Application
13.9 Latin America Steel Market Size Estimation and Forecast by Type
13.10 Brazil Steel Market Analysis
13.11 Mexico Steel Market Analysis
13.12 Rest of Latin America Steel Market Analysis
14 Company Profiles
14.1 Competitive Landscape, 2022
14.2 Strategic Outlook
14.3 China Baowu Steel Group
14.3.1 Company Snapshot
14.3.2 Company Overview
14.3.3 Product Benchmarking
14.3.4 Strategic Outlook
14.4 ArcelorMittal S.A.
14.4.1 Company Snapshot
14.4.2 Company Overview
14.4.3 Financial Analysis
14.4.3.1 Net Revenue, 2018-2022
14.4.3.2 R&D, 2018-2022
14.4.3.3 Regional Revenue Share, 2022 (%)
14.4.3.4 Business Segment Revenue Share, 2022 (%)
14.4.4 Product Benchmarking
14.4.5 Strategic Outlook
14.5 Anshan Iron and Steel Group Corporation
14.5.1 Company Snapshot
14.5.2 Company Overview
14.5.3 Product Benchmarking
14.6 Jiangsu Shagang Group Company Limited
14.6.1 Company Snapshot
14.6.2 Company Overview
14.6.3 Product Benchmarking
14.7 POSCO
14.7.1 Company Snapshot
14.7.2 Company Overview
14.7.3 Financial Analysis
14.7.3.1 Net Revenue, 2018-2022
14.7.3.2 R&D, 2018-2022
14.7.3.3 Regional Revenue Share, 2022 (%)
14.7.3.4 Business Segment Revenue Share, 2022 (%)
14.7.4 Product Benchmarking
14.7.5 Strategic Outlook
14.8 Hesteel Group Company Limited
14.8.1 Company Snapshot
14.8.2 Company Overview
14.8.3 Product Benchmarking
14.8.4 Strategic Outlook
14.9 Jianlong Group
14.9.1 Company Snapshot
14.9.2 Company Overview
14.9.3 Product Benchmarking
14.10 Tata Steel Limited
14.10.1 Company Snapshot
14.10.2 Company Overview
14.10.3 Financial Analysis
14.10.3.1 Net Revenue, 2018-2022
14.10.3.2 R&D, 2018-2022
14.10.3.3 Regional Revenue Share, 2022 (%)
14.10.3.4 Business Segment Revenue Share, 2022 (%)
14.10.4 Product Benchmarking
14.10.5 Strategic Outlook
14.11 Shandong Iron and Steel Co., Ltd.
14.11.1 Company Snapshot
14.11.2 Company Overview
14.11.3 Product Benchmarking
14.12 Delong Steel Group
14.12.1 Company Snapshot
14.12.2 Company Overview
14.12.3 Product Benchmarking
14.13 JFE Steel Corporation
14.13.1 Company Snapshot
14.13.2 Company Overview
14.13.3 Financial Analysis
14.13.3.1 Net Revenue, 2018-2022
14.13.3.2 Business Segment Revenue Share, 2022 (%)
14.13.4 Product Benchmarking
14.13.5 Strategic Outlook
14.14 Nucor Corporation
14.14.1 Company Snapshot
14.14.2 Company Overview
14.14.3 Financial Analysis
14.14.3.1 Net Revenue, 2018-2022
14.14.3.2 Business Segment Revenue Share, 2022 (%)
14.14.4 Product Benchmarking
14.14.5 Strategic Outlook
14.15 Jiangxi Fangda Iron & Steel Group Co Ltd
14.15.1 Company Snapshot
14.15.2 Company Overview
14.15.3 Product Benchmarking
14.16 Liuzhou Iron & Steel Co., Ltd
14.16.1 Company Snapshot
14.16.2 Company Overview
14.16.3 Product Benchmarking
14.17 Hyundai Steel Co., Ltd.
14.17.1 Company Snapshot
14.17.2 Company Overview
14.17.3 Financial Analysis
14.17.3.1 Net Revenue, 2018-2022
14.17.3.2 R&D, 2018-2022
14.17.3.3 Regional Revenue Share, 2022 (%)
14.17.3.4 Business Segment Revenue Share, 2022 (%)
14.17.4 Product Benchmarking
15 Conclusion and Recommendations
15.1 Concluding Remarks from Visiongain
15.2 Recommendations for Market Players
ページTOPに戻る
List of Tables/Graphs
List of Tables
Table 1 Steel Market Snapshot, 2023 & 2033 (US$ Billion, CAGR %)
Table 2 Steel Market Forecast, 2023-2033 (US$ Bn, AGR (%), CAGR (%)) (V-Shaped Recovery Scenario)
Table 3 Steel Market by Region, 2023-2033 (US$ Bn, AGR (%), CAGR (%)) (V-Shaped Recovery Scenario)
Table 4 Steel Market Forecast, 2023-2033 (US$ Bn, AGR (%), CAGR (%)) (U-Shaped Recovery Scenario)
Table 5 Steel Market by Region, 2023-2033 (US$ Bn, AGR (%), CAGR (%)) (U-Shaped Recovery Scenario)
Table 6 Steel Market Forecast, 2023-2033 (US$ Bn, AGR (%), CAGR (%)) (W-Shaped Recovery Scenario)
Table 7 Steel Market by Region, 2023-2033 (US$ Bn, AGR (%), CAGR (%)) (W-Shaped Recovery Scenario)
Table 8 Steel Market Forecast, 2023-2033 (US$ Bn, AGR (%), CAGR (%)) (L-Shaped Recovery Scenario)
Table 9 Steel Market by Region, 2023-2033 (US$ Bn, AGR (%), CAGR (%)) (L-Shaped Recovery Scenario)
Table 10 Steel Market by Production Technology, 2023-2033 (US$ Bn, AGR (%), CAGR (%))
Table 11 Basic Oxygen Furnace Market by Region, 2023-2033 (US$ Bn, AGR (%), CAGR (%))
Table 12 Electric Arc Furnace Market by Region, 2023-2033 (US$ Bn, AGR (%), CAGR (%))
Table 13 Open Hearth Market by Region, 2023-2033 (US$ Bn, AGR (%), CAGR (%))
Table 14 Steel Market by Product, 2023-2033 (US$ Bn, AGR (%), CAGR (%))
Table 15 Steel Sheets Market by Region, 2023-2033 (US$ Bn, AGR (%), CAGR (%))
Table 16 Steel Beams Market by Region, 2023-2033 (US$ Bn, AGR (%), CAGR (%))
Table 17 Steel Bars Market by Region, 2023-2033 (US$ Bn, AGR (%), CAGR (%))
Table 18 Other Product Market by Region, 2023-2033 (US$ Bn, AGR (%), CAGR (%))
Table 19 Steel Market by Application, 2023-2033 (US$ Bn, AGR (%), CAGR (%))
Table 20 Building and Infrastructure Market by Region, 2023-2033 (US$ Bn, AGR (%), CAGR (%))
Table 21 Mechanical & Electrical Equipment Market by Region, 2023-2033 (US$ Bn, AGR (%), CAGR (%))
Table 22 Automotive Market by Region, 2023-2033 (US$ Bn, AGR (%), CAGR (%))
Table 23 Metal & Domestic Products Market by Region, 2023-2033 (US$ Bn, AGR (%), CAGR (%))
Table 24 Other Applications Market by Region, 2023-2033 (US$ Bn, AGR (%), CAGR (%))
Table 25 Steel Market by Type, 2023-2033 (US$ Bn, AGR (%), CAGR (%))
Table 26 Carbon Steel Market by Region, 2023-2033 (US$ Bn, AGR (%), CAGR (%))
Table 27 Stainless Steel Market by Region, 2023-2033 (US$ Bn, AGR (%), CAGR (%))
Table 28 Alloy Steel Market by Region, 2023-2033 (US$ Bn, AGR (%), CAGR (%))
Table 29 Aluminium Steel Market by Region, 2023-2033 (US$ Bn, AGR (%), CAGR (%))
Table 30 Cobalt Steel Market by Region, 2023-2033 (US$ Bn, AGR (%), CAGR (%))
Table 31 Other Steel Type Market by Region, 2023-2033 (US$ Bn, AGR (%), CAGR (%))
Table 32 Steel Market Forecast, 2023-2033 (US$ Bn, AGR (%), CAGR (%))
Table 33 Steel Market Forecast by Region, 2023-2033 (US$ Billion, AGR%, CAGR%)
Table 34 North America Steel Market by Value, 2023-2033 (US$ Bn, AGR (%), CAGR (%))
Table 35 North America Steel Market by Country, 2023-2033 (US$ Bn, AGR (%), CAGR (%))
Table 36 North America Steel Market by Production Technology, 2023-2033 (US$ Bn, AGR (%), CAGR (%))
Table 37 North America Steel Market by Product, 2023-2033 (US$ Bn, AGR (%), CAGR (%))
Table 38 North America Steel Market by Application, 2023-2033 (US$ Bn, AGR (%), CAGR (%))
Table 39 North America Steel Market by Type, 2023-2033 (US$ Bn, AGR (%), CAGR (%))
Table 40 US Steel Market by Value, 2023-2033 (US$ Bn, AGR (%), CAGR (%))
Table 41 Canada Steel Market by Value, 2023-2033 (US$ Bn, AGR (%), CAGR (%))
Table 42 Europe Steel Market by Value, 2023-2033 (US$ Bn, AGR (%), CAGR (%))
Table 43 Europe Steel Market by Country, 2023-2033 (US$ Bn, AGR (%), CAGR (%))
Table 44 Europe Steel Market by Production Technology, 2023-2033 (US$ Bn, AGR (%), CAGR (%))
Table 45 Europe Steel Market by Product, 2023-2033 (US$ Bn, AGR (%), CAGR (%))
Table 46 Europe Steel Market by Application, 2023-2033 (US$ Bn, AGR (%), CAGR (%))
Table 47 Europe Steel Market by Type, 2023-2033 (US$ Bn, AGR (%), CAGR (%))
Table 48 Germany Steel Market by Value, 2023-2033 (US$ Bn, AGR (%), CAGR (%))
Table 49 Ukraine Steel Market by Value, 2023-2033 (US$ Bn, AGR (%), CAGR (%))
Table 50 France Steel Market by Value, 2023-2033 (US$ Bn, AGR (%), CAGR (%))
Table 51 Italy Steel Market by Value, 2023-2033 (US$ Bn, AGR (%), CAGR (%))
Table 52 Russia Steel Market by Value, 2023-2033 (US$ Bn, AGR (%), CAGR (%))
Table 53 Rest of Europe Steel Market by Value, 2023-2033 (US$ Bn, AGR (%), CAGR (%))
Table 54 Asia-Pacific Steel Market by Value, 2023-2033 (US$ Bn, AGR (%), CAGR (%))
Table 55 Asia-Pacific Steel Market by Country, 2023-2033 (US$ Bn, AGR (%), CAGR (%))
Table 56 Asia-Pacific Steel Market by Production Technology, 2023-2033 (US$ Bn, AGR (%), CAGR (%))
Table 57 Asia-Pacific Steel Market by Product, 2023-2033 (US$ Bn, AGR (%), CAGR (%))
Table 58 Asia-Pacific Steel Market by Application, 2023-2033 (US$ Bn, AGR (%), CAGR (%))
Table 59 Asia-Pacific Steel Market by Type, 2023-2033 (US$ Bn, AGR (%), CAGR (%))
Table 60 China Steel Market by Value, 2023-2033 (US$ Bn, AGR (%), CAGR (%))
Table 61 India Steel Market by Value, 2023-2033 (US$ Bn, AGR (%), CAGR (%))
Table 62 Japan Steel Market by Value, 2023-2033 (US$ Bn, AGR (%), CAGR (%))
Table 63 South Korea Steel Market by Value, 2023-2033 (US$ Bn, AGR (%), CAGR (%))
Table 64 Australia Steel Market by Value, 2023-2033 (US$ Bn, AGR (%), CAGR (%))
Table 65 Rest of Asia-Pacific Steel Market by Value, 2023-2033 (US$ Bn, AGR (%), CAGR (%))
Table 66 Middle East & Africa Steel Market by Value, 2023-2033 (US$ Bn, AGR (%), CAGR (%))
Table 67 Middle East & Africa Steel Market by Country, 2023-2033 (US$ Bn, AGR (%), CAGR (%))
Table 68 Middle East & Africa Steel Market by Production Technology, 2023-2033 (US$ Bn, AGR (%), CAGR (%))
Table 69 Middle East & Africa Steel Market by Product, 2023-2033 (US$ Bn, AGR (%), CAGR (%))
Table 70 Middle East & Africa Steel Market by Application, 2023-2033 (US$ Bn, AGR (%), CAGR (%))
Table 71 Middle East & Africa Steel Market by Type, 2023-2033 (US$ Bn, AGR (%), CAGR (%))
Table 72 GCC Steel Market by Value, 2023-2033 (US$ Bn, AGR (%), CAGR (%))
Table 73 South Africa Steel Market by Value, 2023-2033 (US$ Bn, AGR (%), CAGR (%))
Table 74 Rest of Middle East & Africa Steel Market by Value, 2023-2033 (US$ Bn, AGR (%), CAGR (%))
Table 75 Latin America Steel Market by Value, 2023-2033 (US$ Bn, AGR (%), CAGR (%))
Table 76 Latin America Steel Market by Country, 2023-2033 (US$ Bn, AGR (%), CAGR (%))
Table 77 Latin America Steel Market by Production Technology, 2023-2033 (US$ Bn, AGR (%), CAGR (%))
Table 78 Latin America Steel Market by Product, 2023-2033 (US$ Bn, AGR (%), CAGR (%))
Table 79 Latin America Steel Market by Application, 2023-2033 (US$ Bn, AGR (%), CAGR (%))
Table 80 Latin America Steel Market by Type, 2023-2033 (US$ Bn, AGR (%), CAGR (%))
Table 81 Brazil Steel Market by Value, 2023-2033 (US$ Bn, AGR (%), CAGR (%))
Table 82 Mexico Steel Market by Value, 2023-2033 (US$ Bn, AGR (%), CAGR (%))
Table 83 Rest of Latin America Steel Market by Value, 2023-2033 (US$ Bn, AGR (%), CAGR (%))
Table 84 Strategic Outlook - Contract
Table 85 China Baowu Steel Group: Key Details, (CEO, HQ, Revenue, Founded, No. of Employees, Company Type, Website, Business Segment)
Table 86 China Baowu Steel Group: Product Benchmarking
Table 87 China Baowu Steel Group: Strategic Outlook
Table 88 ArcelorMittal S.A.: Key Details, (CEO, HQ, Revenue, Founded, No. of Employees, Company Type, Website, Business Segment)
Table 89 ArcelorMittal S.A: Product Benchmarking
Table 90 ArcelorMittal S.A: Strategic Outlook
Table 91 Anshan Iron and Steel Group Corporation: Key Details, (CEO, HQ, Revenue, Founded, No. of Employees, Company Type, Website, Business Segment)
Table 92 Anshan Iron and Steel Group Corporation: Product Benchmarking
Table 93 Jiangsu Shagang Group Company Limited : Key Details, (CEO, HQ, Revenue, Founded, No. of Employees, Company Type, Website, Business Segment)
Table 94 Jiangsu Shagang Group Company Limited: Product Benchmarking
Table 95 POSCO: Key Details, (CEO, HQ, Revenue, Founded, No. of Employees, Company Type, Website, Business Segment)
Table 96 POSCO: Product Benchmarking
Table 97 POSCO: Strategic Outlook
Table 98 Hesteel Group Company Limited: Key Details, (CEO, HQ, Revenue, Founded, No. of Employees, Company Type, Website, Business Segment)
Table 99 Hesteel Group Company Limited : Product Benchmarking
Table 100 Hesteel Group Company Limited: Strategic Outlook
Table 101 Jianlong Group: Key Details, (CEO, HQ, Revenue, Founded, No. of Employees, Company Type, Website, Business Segment)
Table 102 Jianlong Group: Product Benchmarking
Table 103 Tata Steel Limited: Key Details, (CEO, HQ, Revenue, Founded, No. of Employees, Company Type, Website, Business Segment)
Table 104 Tata Steel Limited: Product Benchmarking
Table 105 Tata Steel Limited: Strategic Outlook
Table 106 Shandong Iron and Steel Co., Ltd.: Key Details, (CEO, HQ, Revenue, Founded, No. of Employees, Company Type, Website, Business Segment)
Table 107 Shandong Iron and Steel Co., Ltd.: Product Benchmarking
Table 108 Delong Steel Group: Key Details, (CEO, HQ, Revenue, Founded, No. of Employees, Company Type, Website, Business Segment)
Table 109 Delong Steel Group: Product Benchmarking
Table 110 JFE Steel Corporation: Key Details, (CEO, HQ, Revenue, Founded, No. of Employees, Company Type, Website, Business Segment)
Table 111 JFE Steel Corporation: Product Benchmarking
Table 112 JFE Steel Corporation: Strategic Outlook
Table 113 Nucor Corporation: Key Details, (CEO, HQ, Revenue, Founded, No. of Employees, Company Type, Website, Business Segment)
Table 114 Nucor Corporation: Product Benchmarking
Table 115 Nucor Corporation: Strategic Outlook
Table 116 Jiangxi Fangda Iron & Steel Group Co Ltd: Key Details, (CEO, HQ, Revenue, Founded, No. of Employees, Company Type, Website, Business Segment)
Table 117 Jiangxi Fangda Iron & Steel Group Co Ltd: Product Benchmarking
Table 118 Liuzhou Iron & Steel Co., Ltd: Key Details, (CEO, HQ, Revenue, Founded, No. of Employees, Company Type, Website, Business Segment)
Table 119 Liuzhou Iron & Steel Co., Ltd: Product Benchmarking
Table 120 Hyundai Steel Co., Ltd.: Key Details, (CEO, HQ, Revenue, Founded, No. of Employees, Company Type, Website, Business Segment)
Table 121 Hyundai Steel Co., Ltd: Product Benchmarking
List of Figures
Figure 1 Steel Market Segmentation
Figure 2 Steel Market by Production Technology: Market Attractiveness Index
Figure 3 Steel Market by Product: Market Attractiveness Index
Figure 4 Steel Market by Application: Market Attractiveness Index
Figure 5 Steel Market by Type: Market Attractiveness Index
Figure 6 Steel Market Attractiveness Index by Region
Figure 7 Steel Market: Market Dynamics
Figure 8 Steel Market: Porter’s Five Forces Analysis
Figure 9 Steel Market Share Forecast by COVID, 2023-2033 (%)
Figure 10 Steel Market Forecast, 2023-2033 (US$ Bn, AGR (%)) (V-Shaped Recovery Scenario)
Figure 11 Steel Market by Region, 2023-2033 (US$ Bn, AGR (%)) (V-Shaped Recovery Scenario)
Figure 12 Steel Market Forecast, 2023-2033 (US$ Bn, AGR (%)) (U-Shaped Recovery Scenario)
Figure 13 Steel Market by Region, 2023-2033 (US$ Bn, AGR (%)) (U-Shaped Recovery Scenario)
Figure 14 Steel Market Forecast, 2023-2033 (US$ Bn, AGR (%)) (W-Shaped Recovery Scenario)
Figure 15 Steel Market by Region, 2023-2033 (US$ Bn, AGR (%)) (W-Shaped Recovery Scenario)
Figure 16 Steel Market Forecast, 2023-2033 (US$ Bn, AGR (%)) (L-Shaped Recovery Scenario)
Figure 17 Steel Market by Region, 2023-2033 (US$ Bn, AGR (%)) (L-Shaped Recovery Scenario)
Figure 18 Steel Market: PEST Analysis
Figure 19 Steel Market by Production Technology: Market Attractiveness Index
Figure 20 Steel Market by Production Technology, 2023-2033 (US$ Bn, AGR (%))
Figure 21 Steel Market Share Forecast by Production Technology, 2023, 2028, 2033 (%)
Figure 22 Basic Oxygen Furnace Market by Region, 2023-2033 (US$ Bn, AGR (%))
Figure 23 Basic Oxygen Furnace Market Share Forecast by Region, 2023 & 2033 (%)
Figure 24 Electric Arc Furnace Market by Region, 2023-2033 (US$ Bn, AGR (%))
Figure 25 Electric Arc Furnace Market Share Forecast by Region, 2023 & 2033 (%)
Figure 26 Open Hearth Market by Region, 2023-2033 (US$ Bn, AGR (%))
Figure 27 Open Hearth Market Share Forecast by Region, 2023 & 2033 (%)
Figure 28 Steel Market by Product: Market Attractiveness Index
Figure 29 Steel Market by Product, 2023-2033 (US$ Bn, AGR (%))
Figure 30 Steel Market Share Forecast by Product, 2023, 2028, 2033 (%)
Figure 31 Steel Sheets Market by Region, 2023-2033 (US$ Bn, AGR (%))
Figure 32 Steel Sheets Market Share Forecast by Region, 2023 & 2033 (%)
Figure 33 Steel Beams Market by Region, 2023-2033 (US$ Bn, AGR (%))
Figure 34 Steel Beams Market Share Forecast by Region, 2023 & 2033 (%)
Figure 35 Steel Bars Market by Region, 2023-2033 (US$ Bn, AGR (%))
Figure 36 Steel Bars Market Share Forecast by Region, 2023 & 2033 (%)
Figure 37 Other Product Market by Region, 2023-2033 (US$ Bn, AGR (%))
Figure 38 Other Product Market Share Forecast by Region, 2023 & 2033 (%)
Figure 39 Steel Market by Application: Market Attractiveness Index
Figure 40 Steel Market by Application, 2023-2033 (US$ Bn, AGR (%))
Figure 41 Steel Market Share Forecast by Application, 2023, 2028, 2033 (%)
Figure 42 Building and Infrastructure Market by Region, 2023-2033 (US$ Bn, AGR (%))
Figure 43 Building and Infrastructure Market Share Forecast by Region, 2023 & 2033 (%)
Figure 44 Mechanical & Electrical Equipment Market by Region, 2023-2033 (US$ Bn, AGR (%))
Figure 45 Mechanical & Electrical Equipment Market Share Forecast by Region, 2023 & 2033 (%)
Figure 46 Automotive Market by Region, 2023-2033 (US$ Bn, AGR (%))
Figure 47 Automotive Market Share Forecast by Region, 2023 & 2033 (%)
Figure 48 Metal & Domestic Products Market by Region, 2023-2033 (US$ Bn, AGR (%))
Figure 49 Metal & Domestic Products Market Share Forecast by Region, 2023 & 2033 (%)
Figure 50 Other Applications Market by Region, 2023-2033 (US$ Bn, AGR (%))
Figure 51 Other Applications Market Share Forecast by Region, 2023 & 2033 (%)
Figure 52 Steel Market by Type: Market Attractiveness Index
Figure 53 Steel Market by Type, 2023-2033 (US$ Bn, AGR (%))
Figure 54 Steel Market Share Forecast by Type, 2023, 2028, 2033 (%)
Figure 55 Carbon Steel Market by Region, 2023-2033 (US$ Bn, AGR (%))
Figure 56 Carbon Steel Market Share Forecast by Region, 2023 & 2033 (%)
Figure 57 Stainless Steel Market by Region, 2023-2033 (US$ Bn, AGR (%))
Figure 58 Stainless Steel Market Share Forecast by Region, 2023 & 2033 (%)
Figure 59 Alloy Steel Market by Region, 2023-2033 (US$ Bn, AGR (%))
Figure 60 Alloy Steel Market Share Forecast by Region, 2023 & 2033 (%)
Figure 61 Aluminium Steel Market by Region, 2023-2033 (US$ Bn, AGR (%))
Figure 62 Aluminium Steel Market Share Forecast by Region, 2023 & 2033 (%)
Figure 63 Cobalt Steel Market by Region, 2023-2033 (US$ Bn, AGR (%))
Figure 64 Cobalt Steel Market Share Forecast by Region, 2023 & 2033 (%)
Figure 65 Other Steel Type Market by Region, 2023-2033 (US$ Bn, AGR (%))
Figure 66 Other Steel Type Market Share Forecast by Region, 2023 & 2033 (%)
Figure 67 Steel Market Forecast by Region 2023 and 2033 (Revenue, CAGR%)
Figure 68 Steel Market Forecast, 2023-2033 (US$ Bn, AGR (%))
Figure 69 Steel Market Share Forecast by Region 2023, 2028, 2033 (%)
Figure 70 Steel Market by Region, 2023-2033 (US$ Bn, AGR (%))
Figure 71 North America Steel Market Attractiveness Index
Figure 72 North America Steel Market by Region, 2023, 2028 & 2033 (US$ Billion)
Figure 73 North America Steel Market by Value, 2023-2033 (US$ Bn, AGR (%))
Figure 74 North America Steel Market by Country, 2023-2033 (US$ Bn, AGR (%))
Figure 75 North America Steel Market Share Forecast by Country, 2023 & 2033 (%)
Figure 76 North America Steel Market by Production Technology, 2023-2033 (US$ Bn, AGR (%))
Figure 77 North America Steel Market Share Forecast Production Technology, 2023 & 2033 (%)
Figure 78 North America Steel Market by Product, 2023-2033 (US$ Bn, AGR (%))
Figure 79 North America Steel Market Share Forecast by Product, 2023 & 2033 (%)
Figure 80 North America Steel Market by Application, 2023-2033 (US$ Bn, AGR (%))
Figure 81 North America Steel Market Share Forecast by Application, 2023 & 2033 (%)
Figure 82 North America Steel Market by Type, 2023-2033 (US$ Bn, AGR (%))
Figure 83 North America Steel Market Share Forecast by Type, 2023 & 2033 (%)
Figure 84 US Steel Market by Value, 2023-2033 (US$ Bn, AGR (%))
Figure 85 Canada Steel Market by Value, 2023-2033 (US$ Bn, AGR (%))
Figure 86 Europe Steel Market Attractiveness Index
Figure 87 Europe Steel Market by Region, 2023, 2028 & 2033 (US$ Billion)
Figure 88 Europe Steel Market by Value, 2023-2033 (US$ Bn, AGR (%))
Figure 89 Europe Steel Market by Country, 2023-2033 (US$ Bn, AGR (%))
Figure 90 Europe Steel Market Share Forecast by Country, 2023 & 2033 (%)
Figure 91 Europe Steel Market by Production Technology, 2023-2033 (US$ Bn, AGR (%))
Figure 92 Europe Steel Market Share Forecast Production Technology, 2023 & 2033 (%)
Figure 93 Europe Steel Market by Product, 2023-2033 (US$ Bn, AGR (%))
Figure 94 Europe Steel Market Share Forecast by Product, 2023 & 2033 (%)
Figure 95 Europe Steel Market by Application, 2023-2033 (US$ Bn, AGR (%))
Figure 96 Europe Steel Market Share Forecast by Application, 2023 & 2033 (%)
Figure 97 Europe Steel Market by Type, 2023-2033 (US$ Bn, AGR (%))
Figure 98 Europe Steel Market Share Forecast by Type, 2023 & 2033 (%)
Figure 99 Germany Steel Market by Value, 2023-2033 (US$ Bn, AGR (%))
Figure 100 Ukraine Steel Market by Value, 2023-2033 (US$ Bn, AGR (%))
Figure 101 France Steel Market by Value, 2023-2033 (US$ Bn, AGR (%))
Figure 102 Italy Steel Market by Value, 2023-2033 (US$ Bn, AGR (%))
Figure 103 Russia Steel Market by Value, 2023-2033 (US$ Bn, AGR (%))
Figure 104 Rest of Europe Steel Market by Value, 2023-2033 (US$ Bn, AGR (%))
Figure 105 Asia-Pacific Steel Market Attractiveness Index
Figure 106 Asia-Pacific Steel Market by Region, 2023, 2028 & 2033 (US$ Billion)
Figure 107 Asia-Pacific Steel Market by Value, 2023-2033 (US$ Bn, AGR (%))
Figure 108 Asia-Pacific Steel Market by Country, 2023-2033 (US$ Bn, AGR (%))
Figure 109 Asia-Pacific Steel Market Share Forecast by Country, 2023 & 2033 (%)
Figure 110 Asia-Pacific Steel Market by Production Technology, 2023-2033 (US$ Bn, AGR (%))
Figure 111 Asia-Pacific Steel Market Share Forecast Production Technology, 2023 & 2033 (%)
Figure 112 Asia-Pacific Steel Market by Product, 2023-2033 (US$ Bn, AGR (%))
Figure 113 Asia-Pacific Steel Market Share Forecast by Product, 2023 & 2033 (%)
Figure 114 Asia-Pacific Steel Market by Application, 2023-2033 (US$ Bn, AGR (%))
Figure 115 Asia-Pacific Steel Market Share Forecast by Application, 2023 & 2033 (%)
Figure 116 Asia-Pacific Steel Market by Type, 2023-2033 (US$ Bn, AGR (%))
Figure 117 Asia-Pacific Steel Market Share Forecast by Type, 2023 & 2033 (%)
Figure 118 China Steel Market by Value, 2023-2033 (US$ Bn, AGR (%))
Figure 119 India Steel Market by Value, 2023-2033 (US$ Bn, AGR (%))
Figure 120 Japan Steel Market by Value, 2023-2033 (US$ Bn, AGR (%))
Figure 121 South Korea Steel Market by Value, 2023-2033 (US$ Bn, AGR (%))
Figure 122 Australia Steel Market by Value, 2023-2033 (US$ Bn, AGR (%))
Figure 123 Rest of Asia-Pacific Steel Market by Value, 2023-2033 (US$ Bn, AGR (%))
Figure 124 Middle East and Africa Steel Market Attractiveness Index
Figure 125 Middle East and Africa Steel Market by Region, 2023, 2028 & 2033 (US$ Billion)
Figure 126 Middle East & Africa Steel Market by Value, 2023-2033 (US$ Bn, AGR (%))
Figure 127 Middle East & Africa Steel Market by Country, 2023-2033 (US$ Bn, AGR (%))
Figure 128 Middle East and Africa Steel Market Share Forecast by Country, 2023 & 2033 (%)
Figure 129 Middle East & Africa Steel Market by Production Technology, 2023-2033 (US$ Bn, AGR (%))
Figure 130 Middle East and Africa Steel Market Share Forecast Production Technology, 2023 & 2033 (%)
Figure 131 Middle East & Africa Steel Market by Product, 2023-2033 (US$ Bn, AGR (%))
Figure 132 Middle East and Africa Steel Market Share Forecast by Product, 2023 & 2033 (%)
Figure 133 Middle East & Africa Steel Market by Application, 2023-2033 (US$ Bn, AGR (%))
Figure 134 Middle East and Africa Steel Market Share Forecast by Application, 2023 & 2033 (%)
Figure 135 Middle East & Africa Steel Market by Type, 2023-2033 (US$ Bn, AGR (%))
Figure 136 Middle East and Africa Steel Market Share Forecast by Type, 2023 & 2033 (%)
Figure 137 GCC Steel Market by Value, 2023-2033 (US$ Bn, AGR (%))
Figure 138 South Africa Steel Market by Value, 2023-2033 (US$ Bn, AGR (%))
Figure 139 Rest of Middle East & Africa Steel Market by Value, 2023-2033 (US$ Bn, AGR (%))
Figure 140 Latin America Steel Market Attractiveness Index
Figure 141 Latin America Steel Market by Region, 2023, 2028 & 2033 (US$ Billion)
Figure 142 Latin America Steel Market by Value, 2023-2033 (US$ Bn, AGR (%))
Figure 143 Latin America Steel Market by Country, 2023-2033 (US$ Bn, AGR (%))
Figure 144 Latin America Steel Market Share Forecast by Country, 2023 & 2033 (%)
Figure 145 Latin America Steel Market by Production Technology, 2023-2033 (US$ Bn, AGR (%))
Figure 146 Latin America Steel Market Share Forecast Production Technology, 2023 & 2033 (%)
Figure 147 Latin America Steel Market by Product, 2023-2033 (US$ Bn, AGR (%))
Figure 148 Latin America Steel Market Share Forecast by Product, 2023 & 2033 (%)
Figure 149 Latin America Steel Market by Application, 2023-2033 (US$ Bn, AGR (%))
Figure 150 Latin America Steel Market Share Forecast by Application, 2023 & 2033 (%)
Figure 151 Latin America Steel Market by Type, 2023-2033 (US$ Bn, AGR (%))
Figure 152 Latin America Steel Market Share Forecast by Type, 2023 & 2033 (%)
Figure 153 Brazil Steel Market by Value, 2023-2033 (US$ Bn, AGR (%))
Figure 154 Mexico Steel Market by Value, 2023-2033 (US$ Bn, AGR (%))
Figure 155 Rest of Latin America Steel Market by Value, 2023-2033 (US$ Bn, AGR (%))
Figure 156 Steel Market: Company Share, 2022
Figure 157 ArcelorMittal S.A..: Net Revenue, 2018-2022 (US$ Million, AGR%)
Figure 158 ArcelorMittal S.A..: R&D, 2018-2022 (US$ Million, AGR%)
Figure 159 ArcelorMittal S.A.: Regional Revenue Share, 2022 (%)
Figure 160 ArcelorMittal S.A.: Business Segment Revenue Share, 2022 (%)
Figure 161 POSCO.: Net Revenue, 2018-2022 (US$ Million, AGR%)
Figure 162 POSCO.: R&D, 2018-2022 (US$ Million, AGR%)
Figure 163 POSCO.: Regional Revenue Share, 2022 (%)
Figure 164 POSCO.: Business Segment Revenue Share, 2022 (%)
Figure 165 Tata Steel Limited: Net Revenue, 2018-2022 (US$ Million, AGR%)
Figure 166 Tata Steel Limited.: R&D, 2018-2022 (US$ Million, AGR%)
Figure 167 Tata Steel Limited.: Regional Revenue Share, 2022 (%)
Figure 168 Tata Steel Limited.: Business Segment Revenue Share, 2022 (%)
Figure 169 JFE Steel Corporation.: Net Revenue, 2018-2022 (US$ Million, AGR%)
Figure 170 JFE Steel Corporation.: Business Segment Revenue Share, 2022 (%)
Figure 171 Nucor Corporation.: Net Revenue, 2018-2022 (US$ Million, AGR%)
Figure 172 Nucor Corporation.: Business Segment Revenue Share, 2022 (%)
Figure 173 Hyundai Steel Co., Ltd.: Net Revenue, 2018-2022 (US$ Million, AGR%)
Figure 174 Hyundai Steel Co., Ltd.: R&D, 2018-2022 (US$ Million, AGR%)
Figure 175 Hyundai Steel Co., Ltd.: Regional Revenue Share, 2022 (%)
Figure 176 Hyundai Steel Co., Ltd.: Business Segment Revenue Share, 2022 (%)
ページTOPに戻る
Visiongain社の建設分野での最新刊レポート
本レポートと同じKEY WORD(steel)の最新刊レポート
よくあるご質問
Visiongain社はどのような調査会社ですか?
英国の調査会社ヴィジョンゲイン社(Visiongain)は、通信とエネルギーのほか、自動車や化学・医薬品、金属など、広範な市場を対象に調査を行っています。自動車市場については、市場全般に関する調査のほ... もっと見る
調査レポートの納品までの日数はどの程度ですか?
在庫のあるものは速納となりますが、平均的には 3-4日と見て下さい。
但し、一部の調査レポートでは、発注を受けた段階で内容更新をして納品をする場合もあります。
発注をする前のお問合せをお願いします。
注文の手続きはどのようになっていますか?
1)お客様からの御問い合わせをいただきます。
2)見積書やサンプルの提示をいたします。
3)お客様指定、もしくは弊社の発注書をメール添付にて発送してください。
4)データリソース社からレポート発行元の調査会社へ納品手配します。
5) 調査会社からお客様へ納品されます。最近は、pdfにてのメール納品が大半です。
お支払方法の方法はどのようになっていますか?
納品と同時にデータリソース社よりお客様へ請求書(必要に応じて納品書も)を発送いたします。
お客様よりデータリソース社へ(通常は円払い)の御振り込みをお願いします。
請求書は、納品日の日付で発行しますので、翌月最終営業日までの当社指定口座への振込みをお願いします。振込み手数料は御社負担にてお願いします。
お客様の御支払い条件が60日以上の場合は御相談ください。
尚、初めてのお取引先や個人の場合、前払いをお願いすることもあります。ご了承のほど、お願いします。
データリソース社はどのような会社ですか?
当社は、世界各国の主要調査会社・レポート出版社と提携し、世界各国の市場調査レポートや技術動向レポートなどを日本国内の企業・公官庁及び教育研究機関に提供しております。
世界各国の「市場・技術・法規制などの」実情を調査・収集される時には、データリソース社にご相談ください。
お客様の御要望にあったデータや情報を抽出する為のレポート紹介や調査のアドバイスも致します。
|
|

