薬物送達技術市場レポート:2024-2034
Drug Delivery Technologies Market Report 2024-2034
レポート詳細
薬物送達技術市場レポート 2024-2034年 :本レポートは、業界とその根底にあるダイナミクスをより良く理解したい場合、新たな収益ポケットを目指す大手企業にとって貴重なものとなるで... もっと見る
※上記価格は部署ライセンス(Departmental licence)価格です。
その他の価格についてはデータリソースまでお問合せください。
日本語のページは自動翻訳を利用し作成しています。
実際のレポートは英文のみでご納品いたします。

|
サマリー
レポート詳細
薬物送達技術市場レポート 2024-2034年:本レポートは、業界とその根底にあるダイナミクスをより良く理解したい場合、新たな収益ポケットを目指す大手企業にとって貴重なものとなるでしょう。異業種への進出や新地域での既存事業の拡大を目指す企業にも有用です。
薬物送達技術分野の拡大は、いくつかの主要な推進要因によるところが大きい。慢性疾患の蔓延、生物製剤市場の急成長、研究開発投資の増加、技術的ブレークスルー、新規製品の導入などである。さらに、製薬・バイオ医薬品企業は、多様な治療用途や革新的なドラッグデリバリープラットフォームに合わせた新しい分子体の育成を目指した研究開発に戦略的に資源を投入している。これらの企業は、優れた品質の画期的な製品を確実に市場に送り出すため、研究開発への多額の投資に全力を注いでいる。特に、バイオ医薬品企業による研究開発への資金配分は、時間の経過とともに大幅に増加している。しかし、針刺し損傷リスクの高まりや価格圧力の上昇など、当面の市場成長に対する潜在的な制約を認識することが不可欠である。
市場調査レポートを購入する前にすべき質問とは?
-
薬物送達技術市場はどのように進化しているのか?
-
薬物送達技術市場の牽引役と阻害要因は何か?
-
薬物送達技術の各サブマーケットは予測期間中にどのように成長し、2034年にはどれくらいの売上を占めるようになるのか?
-
2024年から2034年にかけて、薬物送達技術の各サブマーケットの市場シェアはどのように推移するのか?
-
2024年から2034年にかけて、市場全体を牽引する主な要因は何か?
-
主要な薬物送達技術市場は、マクロ経済の動きに幅広く追随するのか、それとも個々の国の市場が他を凌駕するのか。
-
2034年までに各国市場のシェアはどのように変化し、どの地域が2034年の市場をリードするのか。
-
主要プレーヤーは誰か、また予測期間中の見通しは?
-
これらの大手企業にとって、薬物送達技術はどのようなプロジェクトなのだろうか?
-
2024年から2034年の間に、業界はどのように進化するのか?その影響は?
薬物送達技術のプロジェクトは現在、そして今後10年の間に行われるのか?
-
薬物送達技術市場をさらに拡大するために、製品の商業化の必要性は高まっているか?
-
ドラッグデリバリーテクノロジー市場はどこに向かっているのか、そしてどのようにすれば市場の最前線に立てるのか?
-
新商品や新サービスに最適な投資方法とは?
-
企業を新たな成長軌道に乗せ、C-suiteに移行させるための重要な展望とは?
このことが、現在、そして今後10年間の薬物送達技術市場にどのような影響を与えるかを見極める必要がある:
-
328ページにわたるレポートには、121の表、184の図表が掲載されている。
-
本レポートでは、業界における主要な有利分野を取り上げているため、今すぐターゲットを絞ることができる。
-
世界、地域、国の売上高と成長に関する詳細な分析が含まれている。
-
競合他社が成功した主なトレンド、変化、収益予測をハイライトします。
本レポートは、薬物送達技術市場が今後10年間にどのように発展するか、またCOVID-19の景気後退と好転の変動に合わせてTODAYをお伝えします。この市場は、過去10年間のどの時点よりも今が重要である。
2034年までの予測やその他の分析から、商業的な展望が明らかになる
-
2034年までの収益予測に加え、最近の実績、成長率、市場シェアも提供している。
-
ビジネスの展望や展開など、独自の分析が掲載されている。
-
定性的分析(市場ダイナミクス、促進要因、機会、阻害要因など)、ポーターのファイブフォース分析、PEST分析、最近の動向をご覧いただけます。
本レポートには、COVID-19が業界と貴社にどのような影響を与えるかについてのデータ分析と貴重な洞察が含まれている。本レポートでは、COVID-19の4つの回復パターンとその影響、すなわち「V」、「L」、「W」、「U」について論じている。
レポート対象セグメント
投与経路
-
インプラント薬物送達
-
注射薬物送達
-
経鼻薬物送達
-
眼薬物送達
-
経口薬物送達
-
肺薬物送達
-
局所薬物送達
-
経粘膜薬物送達
用途
エンドユーザー
世界市場全体と各分野の売上予測に加え、5つの地域と21の主要国市場の売上予測も掲載しています:
北米
欧州
-
ドイツ
-
英国
-
フランス
-
イタリア
-
スペイン
-
ロシア
-
その他の欧州
アジア太平洋
-
日本
-
中国
-
インド
-
オーストラリア
-
韓国
-
その他のアジア太平洋
ラテンアメリカ
MEA
また、本レポートでは、薬物送達技術市場の2024年から2034年にかけての主要企業のプロファイルと、これらの企業の事業のこのセグメントに焦点を当てている。
主要企業と市場成長の可能性
-
AbbVie Inc.
-
Amgen Inc.
-
AstraZeneca plc
-
Bayer AG
-
BD
-
Boehringer Ingelheim
-
Boston Scientific Corporation
-
Bristol-Myers Squibb
-
Eli Lilly and Company
-
F. Hoffmann-La Roche Ltd.
-
Gerresheimer AG
-
Gilead Sciences, Inc.
-
GSK plc
-
Johnson & Johnson Services, Inc.
-
Novartis AG
-
Merck & Co., Inc.
-
Pfizer Inc.
-
Sanofi
-
Teva Pharmaceuticals Industries Ltd.
2024年から2034年までの薬物送達技術市場全体の世界売上高(金額ベース)は、2024年に1兆7,000億米ドルを突破する。2034年まで力強い収益成長を予測。当調査では、最も大きな可能性を秘めた組織を特定しています。彼らの能力、進歩、商業的展望を発見し、一歩先を行くお手伝いをします。
薬物送達技術市場、2024-2034年レポートはどのように役立つのか?
要約すると、320ページを超えるこのレポートは、以下の知識を提供する:
-
薬物送達技術市場の2024年から2034年までの収益予測、投与経路、用途、エンドユーザー別の予測を世界および地域レベルで掲載 - 業界の将来性を発見し、投資と収益に最も有利な場所を見つけることができます。
-
5つの地域と21の主要国市場の2034年までの収益予測 - 薬物送達技術市場の北米、ヨーロッパ、アジア太平洋、ラテンアメリカ、MEAの2024年から2034年までの予測をご覧ください。また、米国、カナダ、メキシコ、ブラジル、ドイツ、フランス、英国、イタリア、中国、インド、日本、オーストラリアなどの主要国の市場も予測しています。
-
2024年から2034年までの薬物送達技術市場に関わる主要企業19社の企業プロファイルを含む。
独自の予測による定量的・定性的分析をご覧ください。私たちのレポートだけに含まれる情報を入手し、貴重なビジネスインテリジェンスで情報を得ることができます。
他にはない情報
私たちの新しいレポートがあれば、知識に遅れをとったり、チャンスを逃したりする可能性が低くなります。弊社のレポートが貴社の調査、分析、意思決定にどのように役立つかをご覧ください。Visiongainの調査は、薬物送達技術市場2024年から2034年、市場をリードする企業の商業分析を必要とするすべての人のためのものです。データ、トレンド、予測をご覧いただけます。
ページTOPに戻る
目次
1 レポート概要
1.1 研究の目的
1.2 薬物送達技術市場の紹介
1.3 本レポートの内容
1.4 本レポートを読むべき理由
1.5 本分析レポートが回答する主な質問は以下の通り
1.6 本レポートの対象者
1.7 方法論
1.7.1 市場の定義
1.7.2 市場評価・予測手法
1.7.3 データの検証
1.7.3.1 一次調査
1.7.3.2 セカンダリーリサーチ
1.8 よくある質問(FAQ)
1.9 Visiongainの関連レポート
1.10 Visiongainについて
2 エグゼクティブ・サマリー
3 市場概要
3.1 主要な調査結果
3.2 市場ダイナミクス
3.2.1 市場促進要因
3.2.1.1 慢性疾患の有病率の上昇
3.2.1.2 業界成長を牽引する技術の進歩
3.2.1.3 患者中心のケアへの注目の高まり
3.2.1.4 AIとビッグデータの統合
3.2.2 市場抑制要因
3.2.2.1 意識とインフラの欠如
3.2.2.2 針刺し損傷のリスク
3.2.2.3 高度薬物送達技術における償還の問題
3.2.3 市場機会
3.2.3.1 自己投与と在宅ケア
3.2.3.2 デジタル統合と接続性
3.2.3.3 生物製剤と遺伝子治療への応用拡大
3.2.3.4 薬物送達技術における持続可能で環境に優しいイノベーション
3.3 COVID-19インパクト分析
3.4 ポーターのファイブフォース分析
3.4.1 サプライヤーの力
3.4.2 バイヤーパワー
3.4.3 競争ライバル
3.4.4 代替品の脅威
3.4.5 新規参入企業の脅威
3.5 PEST分析
4 薬物送達技術市場分析:投与経路別
4.1 主要調査結果
4.2 投与経路セグメント 市場魅力度指数
4.3 薬物送達技術の投与経路別市場規模推定と予測
4.4 インプラント薬物送達
4.4.1 2024〜2034年の地域別市場予測(US$ Billion, AGR %)
4.4.2 地域別市場シェア、2024年・2034年 (%)
4.5 注射薬デリバリー
4.5.1 2024〜2034年の地域別市場予測(US$ Billion, AGR %)
4.5.2 地域別市場シェア、2024年・2034年 (%)
4.6 経鼻薬物送達
4.6.1 2024〜2034年の地域別市場予測(US$ Billion, AGR %)
4.6.2 地域別市場シェア、2024年・2034年 (%)
4.7 眼薬物送達
4.7.1 2024〜2034年の地域別市場予測(US$ Billion, AGR %)
4.7.2 地域別市場シェア、2024年・2034年 (%)
4.8 経口薬物送達
4.8.1 2024〜2034年の地域別市場予測(US$ Billion, AGR %)
4.8.2 地域別市場シェア、2024年・2034年 (%)
4.9 肺薬物送達
4.9.1 2024〜2034年の地域別市場予測(US$ Billion, AGR %)
4.9.2 地域別市場シェア、2024年・2034年 (%)
4.10 局所ドラッグデリバリー
4.10.1 2024〜2034年の地域別市場予測(US$ Billion, AGR %)
4.10.2 地域別市場シェア、2024年・2034年 (%)
4.11 経粘膜薬物送達
4.11.1 2024〜2034年の地域別市場予測(US$ Billion, AGR %)
4.11.2 地域別市場シェア、2024年・2034年 (%)
5 薬物送達技術市場分析:用途別
5.1 主要な調査結果
5.2 アプリケーションセグメント 市場魅力度指数
5.3 薬物送達技術の用途別市場規模推定と予測
5.4 癌
5.4.1 2024〜2034年の地域別市場予測(US$ Billion, AGR %)
5.4.2 地域別市場シェア、2024年・2034年 (%)
5.5 循環器
5.5.1 2024〜2034年の地域別市場予測(US$ Billion, AGR %)
5.5.2 地域別市場シェア、2024年・2034年 (%)
5.6 糖尿病
5.6.1 2024〜2034年の地域別市場予測(US$ Billion, AGR %)
5.6.2 地域別市場シェア、2024年・2034年 (%)
5.7 感染症
5.7.1 2024〜2034年の地域別市場予測(US$ Billion, AGR %)
5.7.2 地域別市場シェア、2024年・2034年 (%)
5.8 その他
5.8.1 2024〜2034年の地域別市場予測(US$ Billion, AGR %)
5.8.2 地域別市場シェア、2024年・2034年 (%)
6 薬物送達技術市場分析:エンドユーザー別
6.1 主要調査結果
6.2 エンドユーザーセグメント: 市場魅力度指数
6.3 薬物送達技術のエンドユーザー別市場規模推定と予測
6.4 外来手術センター
6.4.1 2024〜2034年の地域別市場予測(US$ Billion, AGR %)
6.4.2 地域別市場シェア、2024年・2034年(%)
6.5 病院
6.5.1 2024〜2034年の地域別市場予測(US$ Billion, AGR %)
6.5.2 地域別市場シェア、2024年・2034年(%)
6.6 在宅介護
6.6.1 2024〜2034年の地域別市場予測(US$ Billion, AGR %)
6.6.2 地域別市場シェア、2024年・2034年(%)
6.7 その他
6.7.1 2024〜2034年の地域別市場展望(US$ Billion, AGR %)
6.7.2 地域別市場シェア、2024年・2034年(%)
7 薬物送達技術市場分析:地域別
7.1 主要な調査結果
7.2 地域別市場規模の推定と予測
8 北米の薬物送達技術市場分析
8.1 主要な調査結果
8.2 北米の薬物送達技術市場魅力度指数
8.3 北米の薬物送達技術市場の国別推定、2024年、2029年、2034年(US$ Billion)
8.4 北米の薬物送達技術市場規模推定と予測:国別
8.5 北米の薬物送達技術市場規模推定と予測:投与経路別
8.6 北米の薬物送達技術市場規模推定と予測:用途別
8.7 北米の薬物送達技術市場規模推定と予測:エンドユーザー別
8.8 米国の薬物送達技術市場分析
8.9 カナダの薬物送達技術市場分析
9 欧州の薬物送達技術市場分析
9.1 主要な調査結果
9.2 欧州薬物送達技術市場魅力度指数
9.3 欧州の薬物送達技術市場の国別推定、2024年、2029年、2034年(US$ Billion)
9.4 欧州の薬物送達技術市場規模推定と予測:国別
9.5 欧州の薬物送達技術市場規模推定と予測:投与経路別
9.6 欧州の薬物送達技術市場規模推定と予測:用途別
9.7 欧州の薬物送達技術市場規模推定と予測:エンドユーザー別
9.8 ドイツの薬物送達技術市場分析
9.9 イギリスの薬物送達技術市場分析
9.10 フランスの薬物送達技術市場分析
9.11 イタリアの薬物送達技術市場分析
9.12 スペインの薬物送達技術市場分析
9.13 ロシア薬物送達技術市場分析
9.14 その他の欧州の薬物送達技術市場分析
10 アジア太平洋地域の薬物送達技術市場分析
10.1 主要な調査結果
10.2 アジア太平洋地域の薬物送達技術市場魅力度指数
10.3 アジア太平洋地域の薬物送達技術の国別市場規模、2024年、2029年、2034年(US$ Billion)
10.4 アジア太平洋地域の薬物送達技術市場規模推定と予測:国別
10.5 アジア太平洋地域の薬物送達技術市場規模推定と予測:投与経路別
10.6 アジア太平洋地域の薬物送達技術市場規模推定と予測:用途別
10.7 アジア太平洋地域の薬物送達技術市場規模推定と予測:エンドユーザー別
10.8 日本の薬物送達技術市場分析
10.9 中国の薬物送達技術市場分析
10.10 インドの薬物送達技術市場分析
10.11 オーストラリアの薬物送達技術市場分析
10.12 韓国の薬物送達技術市場分析
10.13 東南アジアの薬物送達技術市場分析
10.14 その他のアジア太平洋地域薬物送達技術市場分析
11 ラテンアメリカの薬物送達技術市場分析
11.1 主要な調査結果
11.2 ラテンアメリカの薬物送達技術市場魅力度指数
11.3 ラテンアメリカの薬物送達技術市場国別推移、2024年、2029年、2034年(US$ Billion)
11.4 ラテンアメリカの薬物送達技術市場規模推定と予測:国別別
11.5 ラテンアメリカの薬物送達技術市場規模推定と予測:投与経路別
11.6 ラテンアメリカの薬物送達技術市場規模推定と予測:用途別
11.7 ラテンアメリカの薬物送達技術市場規模推定と予測:エンドユーザー別
11.8 ブラジルの薬物送達技術市場分析
11.9 メキシコの薬物送達技術の場分析
11.10 その他のラテンアメリカの薬物送達技術市場分析
12 MEAの薬物送達技術市場分析
12.1 主要な調査結果
12.2 MEAの薬物送達技術市場魅力度指数
12.3 MEAの薬物送達技術市場国別、2024年、2029年、2034年(US$ Billion
12.4 MEAの薬物送達技術市場規模推定と予測:国別
12.5 MEAの薬物送達技術市場規模推定と予測:投与経路別
12.6 MEAの薬物送達技術市場規模推定と予測:用途別
12.7 MEA薬物送達技術の市場規模推定と予測:エンドユーザー別
12.8 GCCの薬物送達技術市場分析
12.9 南アフリカの薬物送達技術の市場分析
12.10 その他のMEA薬物送達技術の市場分析
13 企業プロフィール
13.1 Johnson & Johnson Services, Inc.
13.1.1 会社概要
13.1.2 会社概要
13.1.3 財務分析
13.1.3.1 純収入(2015-2023年
13.1.3.2 地域市場シェア(2023年
13.1.3.3 R&D(2015-2023年
13.1.4 製品ベンチマーク
13.2 Novartis AG
13.2.1 会社概要
13.2.2 会社概要
13.2.3 財務分析
13.2.3.1 純収入(2015-2023年
13.2.3.2 地域市場シェア(2023年
13.2.3.3 R&D、2015-2023年
13.2.4 製品ベンチマーク
13.2.5 戦略的展望
13.3 F. Hoffmann-La Roche Ltd.
13.3.1 会社概要
13.3.2 会社概要
13.3.3 財務分析
13.3.3.1 純売上高、2015-2023年
13.3.3.2 地域市場シェア(2023年
13.3.3.3 R&D(2015-2023年
13.3.4 製品ベンチマーク
13.3.5 戦略的展望
13.4 Pfizer Inc.
13.4.1 会社概要
13.4.2 会社概要
13.4.3 財務分析
13.4.3.1 純収入、2015年~2023年
13.4.3.2 地域市場シェア、2023年
13.4.3.3 R&D(2015-2023年
13.4.4 製品ベンチマーク
13.4.5 戦略的展望
13.5 Bayer AG
13.5.1 会社概要
13.5.2 会社概要
13.5.3 財務分析
13.5.3.1 純収入、2015-2022年
13.5.3.2 地域市場シェア、2022年
13.5.3.3 R&D、2015-2022年
13.5.4 製品ベンチマーク
13.5.5 戦略的展望
13.6 Becton, Dickinson and Company
13.6.1 会社概要
13.6.2 会社概要
13.6.3 財務分析
13.6.3.1 純収入、2015-2023年
13.6.3.2 地域市場シェア、2023年
13.6.3.3 R&D(2015-2023年
13.6.4 製品ベンチマーク
13.6.5 戦略的展望
13.7 GSK plc
13.7.1 会社概要
13.7.2 会社概要
13.7.3 財務分析
13.7.3.1 純収入(2015-2023年
13.7.3.2 地域市場シェア、2023年
13.7.3.3 R&D(2015年~2023年
13.7.4 製品ベンチマーク
13.8 Merck & Co., Inc.
13.8.1 会社概要
13.8.2 会社概要
13.8.3 財務分析
13.8.3.1 純売上高、2015-2023年
13.8.3.2 地域市場シェア(2023年
13.8.3.3 R&D(2015-2023年
13.8.4 製品ベンチマーク
13.8.5 戦略的展望
13.9 Sanofi
13.9.1 会社概要
13.9.2 会社概要
13.9.3 財務分析
13.9.3.1 純収入(2015-2023年
13.9.3.2 地域市場シェア、2023年
13.9.3.3 R&D(2015年~2023年
13.9.4 製品ベンチマーク
13.9.5 戦略的展望
13.10 Amgen Inc.
13.10.1 会社概要
13.10.2 会社概要
13.10.3 財務分析
13.10.3.1 純収入、2015-2023年
13.10.3.2 売上高、2015-2023年
13.10.3.3 地域市場シェア、2023年
13.10.4 製品ベンチマーク
13.10.5 戦略的展望
13.11 AbbVie Inc.
13.11.1 会社概要
13.11.2 会社概要
13.11.3 財務分析
13.11.3.1 純売上高、2015-2023年
13.11.3.2 地域市場シェア、2023年
13.11.3.3 R&D(2015年~2023年
13.11.4 製品ベンチマーク
13.11.5 戦略的展望
13.12 Gilead Sciences, Inc.
13.12.1 会社概要
13.12.2 会社概要
13.12.3 財務分析
13.12.3.1 純収入、2015-2023年
13.12.3.2 売上高、2015-2023年
13.12.4 製品ベンチマーク
13.12.5 戦略的展望
13.13 Boehringer Ingelheim
13.13.1 会社概要
13.13.2 会社概要
13.13.3 財務分析
13.13.3.1 純収入、2015-2022年
13.13.3.2 地域市場シェア、2022年
13.13.4 製品ベンチマーク
13.14 AstraZeneca plc
13.14.1 会社概要
13.14.2 会社概要
13.14.3 財務分析
13.14.3.1 純収入、2015年~2023年
13.14.3.2 地域市場シェア、2023年
13.14.3.3 R&D、2015-2022年
13.14.4 製品ベンチマーク
13.14.5 戦略的展望
13.15 Eli Lilly and Company
13.15.1 会社概要
13.15.2 会社概要
13.15.3 財務分析
13.15.3.1 純収入、2015-2022年
13.15.3.2 地域市場シェア、2023年
13.15.3.3 R&D(2015年~2022年
13.15.4 製品ベンチマーク
13.15.5 戦略的展望
13.16 Teva Pharmaceuticals Industries Ltd.
13.16.1 会社概要
13.16.2 会社概要
13.16.3 財務分析
13.16.3.1 純収入、2015-2022年
13.16.3.2 地域市場シェア、2023年
13.16.3.3 R&D(2015年~2022年
13.16.4 製品ベンチマーク
13.16.5 戦略的展望
13.17 Bristol-Myers Squibb
13.17.1 会社概要
13.17.2 会社概要
13.17.3 財務分析
13.17.3.1 純収入、2015-2022年
13.17.3.2 地域市場シェア、2023年
13.17.3.3 R&D、2015年~2022年
13.17.4 製品ベンチマーク
13.18 Gerresheimer AG
13.18.1 会社概要
13.18.2 会社概要
13.18.3 財務分析
13.18.3.1 純収入(2015年~2023年
13.18.3.2 地域市場シェア(2023年
13.18.4 製品ベンチマーク
13.18.5 戦略的展望
13.19 Boston Scientific Corporation
13.19.1 会社概要
13.19.2 会社概要
13.19.3 財務分析
13.19.3.1 純収入(2015-2022年
13.19.3.2 地域市場シェア、2023年
13.19.3.3 R&D(2015-2022年
13.19.4 製品ベンチマーク
13.19.5 戦略的展望
14 結論と提言
14.1 Visiongainからの結びの言葉
14.2 市場プレイヤーへの提言
ページTOPに戻る
図表リスト テーブル一覧
表1 薬物送達技術市場のスナップショット、2024年〜2034年(10億米ドル、CAGR)
表2 薬物送達技術の地域別市場予測、2024~2034年(10億米ドル、AGR%、CAGR%):「V字型回復
表3 薬物送達技術の地域別市場予測、2024~2034年(10億米ドル、AGR%、CAGR%):「U字型回復
表4 薬物送達技術の地域別市場予測、2024~2034年(10億米ドル、AGR%、CAGR%):「W字型回復
表5 薬物送達技術の地域別市場予測、2024~2034年(10億米ドル、AGR%、CAGR%):「L字型回復
表6 薬物送達技術の投与経路別市場予測、2024〜2034年(10億米ドル、AGR%、CAGR)
表7 移植型ドラッグデリバリーセグメントの地域別市場予測、2024〜2034年(10億米ドル、AGR%、CAGR)
表8 注射薬物送達セグメントの地域別市場予測、2024-2034年(10億米ドル、AGR%、CAGR)
表9 経鼻薬物送達セグメントの地域別市場予測、2024-2034年(10億米ドル、AGR%、CAGR)
表10 眼科用薬物送達セグメントの地域別市場予測、2024-2034年(10億米ドル、AGR%、CAGR)
表11 経口薬物送達セグメントの地域別市場予測、2024-2034年(10億米ドル、AGR%、CAGR)
表12 肺薬物送達セグメントの地域別市場予測、2024-2034年(10億米ドル、AGR%、CAGR)
表13 局所ドラッグデリバリーセグメント地域別市場予測、2024-2034年(10億米ドル、AGR%、CAGR)
表14 経粘膜薬物送達セグメントの地域別市場予測、2024-2034年(10億米ドル、AGR%、CAGR)
表15 薬物送達技術の用途別市場予測、2024〜2034年(10億米ドル、AGR%、CAGR)
表16 癌セグメントの地域別市場予測、2024-2034年(10億米ドル、AGR%、CAGR)
表17 循環器セグメントの地域別市場予測、2024〜2034年(10億米ドル、AGR%、CAGR)
表18 糖尿病セグメントの地域別市場予測、2024〜2034年(10億米ドル、AGR%、CAGR)
表19 感染症セグメントの地域別市場予測、2024〜2034年(10億米ドル、AGR%、CAGR)
表20 その他セグメントの地域別市場予測、2024-2034年(10億米ドル、AGR%、CAGR)
表21 薬物送達技術のエンドユーザー別市場予測、2024〜2034年(10億米ドル、AGR%、CAGR)
表22 外来手術センターセグメントの地域別市場予測、2024〜2034年(10億米ドル、AGR%、CAGR)
表23 病院セグメントの地域別市場予測、2024-2034年(10億米ドル、AGR%、CAGR)
表24 在宅介護施設セグメントの地域別市場予測、2024〜2034年(10億米ドル、AGR%、CAGR)
表25 その他セグメントの地域別市場予測、2024-2034年(10億米ドル、AGR%、CAGR)
表26 薬物送達技術の地域別市場予測、2024-2034年(10億米ドル、AGR%、CAGR)
表27 北米の薬物送達技術の国別市場予測、2024-2034年(10億米ドル、AGR%、CAGR)
表28 北米の薬物送達技術市場予測:投与経路別、2024-2034年(10億米ドル、AGR%、CAGR)
表29 北米の薬物送達技術市場予測:用途別、2024-2034年(10億米ドル、AGR%、CAGR)
表30 北米の薬物送達技術市場の予測:エンドユーザー別、2024〜2034年(10億米ドル、AGR%、CAGR)
表31 米国薬物送達技術市場予測、2024〜2034年(10億米ドル、AGR%、CAGR)
表32 カナダの薬物送達技術市場の予測、2024-2034年(10億米ドル、AGR%、CAGR)
表33 欧州の薬物送達技術の国別市場予測、2024〜2034年(10億米ドル、AGR%、CAGR)
表34 欧州の薬物送達技術市場の予測:投与経路別、2024〜2034年(10億米ドル、AGR%、CAGR)
表35 欧州薬物送達技術の用途別市場予測:2024〜2034年(10億米ドル、AGR%、CAGR)
表36 欧州の薬物送達技術の市場予測:エンドユーザー別、2024〜2034年(10億米ドル、AGR%、CAGR)
表37 ドイツの薬物送達技術の市場予測、2024-2034年(10億米ドル、AGR%、CAGR)
表38 英国薬物送達技術の市場予測、2024~2034年(10億米ドル、AGR%、CAGR)
表39 フランスの薬物送達技術市場の予測、2024-2034年(10億米ドル、AGR%、CAGR)
表40 イタリアの薬物送達技術の市場予測、2024-2034年(10億米ドル、AGR%、CAGR)
表41 スペイン薬物送達技術の市場予測、2024〜2034年(10億米ドル、AGR%、CAGR)
表42 ロシア薬物送達技術市場の予測、2024-2034年(10億米ドル、AGR%、CAGR)
表43 その他のヨーロッパの薬物送達技術市場の予測、2024-2034年(10億米ドル、AGR%、CAGR)
表44 アジア太平洋地域の薬物送達技術の国別市場予測、2024-2034年(10億米ドル、AGR%、CAGR)
表45 アジア太平洋地域の薬物送達技術市場予測:投与経路別、2024〜2034年(10億米ドル、AGR%、CAGR)
表46 アジア太平洋地域の薬物送達技術の用途別市場予測、2024〜2034年(10億米ドル、AGR%、CAGR)
表47 アジア太平洋地域の薬物送達技術市場の予測:エンドユーザー別、2024〜2034年(10億米ドル、AGR%、CAGR)
表48 日本薬物送達技術市場の予測、2024年~2034年(10億米ドル、AGR%、CAGR)
表49 中国薬物送達技術の市場予測、2024〜2034年(10億米ドル、AGR%、CAGR)
表50 インド薬物送達技術の市場予測、2024〜2034年(10億米ドル、AGR%、CAGR)
表51 オーストラリアの薬物送達技術の市場予測、2024-2034年(10億米ドル、AGR%、CAGR)
表52 韓国薬物送達技術の市場予測、2024~2034年(10億米ドル、AGR%、CAGR)
表53 東南アジアの薬物送達技術市場の予測、2024年~2034年(10億米ドル、AGR%、CAGR)
表54 その他のアジア太平洋地域の薬物送達技術の市場予測、2024-2034年(10億米ドル、AGR%、CAGR)
表55 ラテンアメリカの薬物送達技術の国別市場予測、2024-2034年(10億米ドル、AGR%、CAGR)
表56 ラテンアメリカの薬物送達技術市場予測:投与経路別、2024〜2034年(10億米ドル、AGR%、CAGR)
表57 中南米の薬物送達技術市場予測:用途別(2024〜2034年、10億米ドル、AGR%、CAGR)
表58 ラテンアメリカの薬物送達技術市場予測:エンドユーザー別、2024〜2034年(10億米ドル、AGR%、CAGR)
表59 ブラジル薬物送達技術の市場予測、2024〜2034年 (10億米ドル、AGR%、CAGR%)
表60 メキシコ薬物送達技術市場の予測、2024-2034年(10億米ドル、AGR%、CAGR)
表61 ラテンアメリカ以外の薬物送達技術の市場予測、2024-2034年(10億米ドル、AGR%、CAGR)
表62 MEA薬物送達技術の国別市場予測、2024-2034年(10億米ドル、AGR%、CAGR)
表63 MEA薬物送達技術の投与経路別市場予測:2024-2034年(10億米ドル、AGR%、CAGR)
表64 MEA薬物送達技術の用途別市場予測:2024-2034年(10億米ドル、AGR%、CAGR)
表65 MEA薬物送達技術のエンドユーザー別市場予測:2024-2034年(10億米ドル、AGR%、CAGR)
表66 GCCの薬物送達技術市場予測、2024-2034年(10億米ドル、AGR%、CAGR)
表67 南アフリカの薬物送達技術の市場予測、2024〜2034年(10億米ドル、AGR%、CAGR)
表68 その他のMEA薬物送達技術市場の予測、2024-2034年(10億米ドル、AGR%、CAGR)
表69 ジョンソン・エンド・ジョンソンサービス社主な詳細(CEO, 本社, 売上高, 設立, 従業員数, 企業タイプ, ウェブサイト, 事業セグメント)
表 70 ジョンソン・エンド・ジョンソンサービス(株):製品ベンチマーク
表71 ノバルティスAG:主な詳細(CEO, 本社, 売上高, 設立, 従業員数, 企業タイプ, ウェブサイト, 事業セグメント)
表72 ノバルティスAG:製品ベンチマーク
表73 ノバルティスAG:戦略的展望
表74 F.ホフマン・ラ・ロシュ社: 主要詳細(CEO, 本社, 売上高, 設立, 従業員数, 企業タイプ, ウェブサイト, 事業セグメント)
表 75 F. ホフマン・ラ・ロシュ社: 製品ベンチマーク
表76 F.ホフマン・ラ・ロシュ:戦略的展望
表77 ファイザー主な詳細(CEO, 本社, 売上高, 設立, 従業員数, 企業タイプ, ウェブサイト, 事業セグメント)
表 78 ファイザー製品ベンチマーク
表79 ファイザー:戦略的展望
表80 バイエルAG:主要詳細(CEO、本社、売上高、設立、従業員数、企業タイプ、ウェブサイト、事業セグメント)
表81 バイエルAG:製品ベンチマーク
表82 バイエルAG:戦略的展望
表83 ベクトン・ディッキンソン アンド カンパニー:戦略的展望主な詳細(CEO、本社、売上高、設立、従業員数、企業タイプ、ウェブサイト、事業セグメント)
表84 ベクトン・ディッキンソン・アンド・カンパニー:製品ベンチマーク製品ベンチマーク
表 85 ベクトン・ディッキンソン アンド カンパニー:戦略的展望戦略的展望
表86 GSK plc:主な詳細(CEO, 本社, 売上高, 設立, 従業員数, 企業タイプ, ウェブサイト, 事業セグメント)
表 87 GSK plc:製品ベンチマーク
表88 Merck & Co:主な詳細(CEO, 本社, 売上高, 設立, 従業員数, 企業タイプ, ウェブサイト, 事業セグメント)
表89 Merck & Co:製品ベンチマーク
表90 Merck & Co:戦略的展望
表91 サノフィ主な詳細(CEO, 本社, 売上高, 設立, 従業員数, 企業タイプ, ウェブサイト, 事業セグメント)
表92 サノフィ製品のベンチマーク
表93 サノフィ:戦略的展望
表94 アムジェン社主な詳細(CEO, 本社, 売上高, 設立, 従業員数, 企業タイプ, ウェブサイト, 事業セグメント)
表95 アムジェンInc:製品のベンチマーク
表96 アムジェンInc:戦略的展望
表97 アッヴィInc:主な詳細(CEO, 本社, 売上高, 設立, 従業員数, 企業タイプ, ウェブサイト, 事業セグメント)
表98 アッヴィー社製品ベンチマーク
表99 アッヴィーInc:戦略的展望
表100 ギリアド・サイエンシズInc:主な詳細(CEO, 本社, 売上高, 設立, 従業員数, 企業タイプ, ウェブサイト, 事業セグメント)
表101 ギリアド・サイエンシズInc:製品ベンチマーク
表102 ギリアド・サイエンシズInc:戦略的展望
表103 ベーリンガーインゲルハイム:主要詳細(CEO、本社、売上高、設立、従業員数、企業タイプ、ウェブサイト、事業セグメント)
表104 ベーリンガーインゲルハイム:製品ベンチマーク製品ベンチマーク
表105 アストラゼネカ plc:主な詳細(CEO、本社所在地、売上高、設立、従業員数、企業タイプ、ウェブサイト、事業セグメント)
表 106 アストラゼネカ plc:製品ベンチマーク
表 107 アストラゼネカ plc:戦略的展望
表108 イーライリリー・アンド・カンパニー主な詳細(CEO, 本社, 売上高, 設立, 従業員数, 企業タイプ, ウェブサイト, 事業セグメント)
表 109 イーライリリー・アンド・カンパニー製品ベンチマーク
表110 イーライリリー・アンド・カンパニー戦略的展望
表111 テバ・ファーマシューティカルズ・インダストリーズ社:主要詳細(CEO、本社、売上高、設立、従業員数、企業タイプ、ウェブサイト、事業セグメント)
表 112 テバ・ファーマシューティカルズ・インダストリーズ(株):戦略的展望製品のベンチマーク
表113 テバ・ファーマシューティカルズ・インダストリーズ社:戦略的展望
表114 ブリストル・マイヤーズ スクイブ:主要な詳細(CEO、本社、売上高、設立、従業員数、企業タイプ、ウェブサイト、事業セグメント)
表115 ブリストル・マイヤーズ スクイブ:製品ベンチマーク
表116 Gerresheimer AG: 主要業績(CEO, 本社, 売上高, 設立, 従業員数, 企業タイプ, ウェブサイト, 事業セグメント)
表117 Gerresheimer AG: 製品ベンチマーク
表118 ゲレスハイマーAG:戦略的展望
表119 ボストン・サイエンティフィック・コーポレーション主な詳細(CEO、本社、売上高、設立、従業員数、会社タイプ、ウェブサイト、事業セグメント)
表120 ボストン・サイエンティフィック・コーポレーション製品ベンチマーク
表121 ボストン・サイエンティフィック・コーポレーション戦略的展望
表 121 ボストン・サイエンティフィック:戦略的展望
図表一覧
図1 薬物送達技術市場のセグメンテーション
図2 薬物送達技術の投与経路別市場市場魅力度指数
図3 薬物送達技術市場:用途別市場魅力度指数
図4 薬物送達技術市場:エンドユーザー別市場魅力度指数
図5 薬物送達技術市場:地域別市場魅力度指数
図6 薬物送達技術市場:市場ダイナミクス
図7 薬物送達技術の地域別市場:2024年~2034年(10億米ドル、AGR %):「V字型回復
図8 2024~2034年の地域別薬物送達技術市場(10億米ドル、AGR %):「U字型回復
図9 薬物送達技術の地域別市場:2024年~2034年(10億米ドル、AGR)「W字型回復
図10 薬物送達技術の地域別市場:2024年~2034年(10億米ドル、AGR %):「L字型回復
図11 薬物送達技術市場:ポーターのファイブフォース分析
図12 薬物送達技術市場:PEST分析PEST分析
図13 薬物送達技術市場:投与経路別魅力度指数
図14 薬物送達技術の投与経路別市場予測(2024~2034年、10億米ドル、AGR)
図15 薬物送達技術の投与経路別市場シェア予測(2024年、2029年、2034年)
図16 移植型ドラッグデリバリーセグメントの地域別市場予測、2024~2034年 (10億米ドル、AGR %)
図17 移植型薬物送達セグメントの地域別市場シェア予測、2024年&2034年(%)
図18 注射薬物送達セグメントの地域別市場予測、2024~2034年 (10億米ドル、AGR %)
図19 注射剤薬物送達セグメントの地域別市場シェア予測、2024年〜2034年 (%)
図20 経鼻薬物送達セグメントの地域別市場予測、2024~2034年 (10億米ドル、AGR %)
図21 経鼻薬物送達セグメントの地域別市場シェア予測、2024年〜2034年(%)
図22 2024〜2034年における眼科用薬物送達セグメントの地域別市場予測(10億米ドル、AGR)
図23 2024〜2034年における眼科用薬物送達セグメントの地域別市場シェア予測 (%)
図24 経口薬物送達セグメントの地域別市場予測、2024~2034年 (10億米ドル、AGR %)
図25 経口薬物送達セグメントの地域別市場シェア予測、2024年〜2034年 (%)
図26 肺薬物送達セグメントの地域別市場予測、2024~2034年 (10億米ドル、AGR %)
図27 肺薬物送達セグメントの地域別市場シェア予測、2024年〜2034年(%)
図28 局所薬物送達セグメントの地域別市場予測、2024~2034年 (10億米ドル、AGR %)
図29 局所ドラッグデリバリーセグメントの地域別市場シェア予測、2024年&2034年(%)
図30 経粘膜薬物送達セグメントの地域別市場予測、2024~2034年 (10億米ドル、AGR %)
図31 経粘膜薬物送達技術の地域別市場シェア予測、2024年〜2034年 (%)
図32 薬物送達技術市場の魅力度指数(投与経路別
図33 薬物送達技術の用途別市場予測(2024~2034年、10億米ドル、AGR)
図34 薬物送達技術の用途別市場予測、2024年、2029年、2034年(%)
図35 2024〜2034年地域別がんセグメント市場予測(10億米ドル、AGR)
図36 地域別がんセグメント市場シェア予測、2024年&2034年(%)
図37 2024〜2034年における心血管セグメントの地域別市場予測(10億米ドル、AGR)
図38 2024〜2034年における心血管セグメントの地域別市場シェア予測(%)
図39 糖尿病セグメントの地域別市場予測、2024~2034年(10億米ドル、AGR)
図40 糖尿病セグメントの地域別市場シェア予測、2024年〜2034年(%)
図41 2024~2034年地域別感染症セグメント市場予測(10億米ドル、AGR)
図42 2024〜2034年地域別感染症セグメント市場シェア予測 (%)
図43 その他セグメントの地域別市場展望、2024~2034年 (10億米ドル、AGR %)
図44 その他セグメントの地域別市場シェア予測、2024年〜2034年(%)
図45 薬物送達技術のエンドユーザー別市場魅力度指数
図46 エンドユーザー別薬物送達技術市場予測(2024~2034年、10億ドル、AGR)
図47 薬物送達技術のエンドユーザー別市場予測(2024年、2029年、2034年) (%)
図48 外来手術センターセグメント地域別市場予測、2024~2034年 (10億米ドル、AGR %)
図49 外来手術センターセグメント地域別市場シェア予測、2024年&2034年(%)
図50 病院セグメントの地域別市場予測、2024~2034年 (10億米ドル, AGR %)
図51 2024〜2034年地域別病院セグメント市場シェア予測(%)
図52 2024~2034年地域別在宅ケアセグメント市場予測(10億米ドル、AGR)
図53 2024年~2034年の地域別ホームケアセグメント市場シェア予測(%)
図54 その他セグメントの地域別市場予測、2024~2034年 (10億米ドル、AGR %)
図55 その他セグメントの地域別市場シェア予測、2024年〜2034年(%)
図56 薬物送達技術の地域別市場展望 2024年、2029年、2034年 (売上高, CAGR%)
図57 2024年、2029年、2034年の薬物送達技術の地域別市場シェア予測(%)
図58 薬物送達技術の地域別市場予測(2024年~2034年、10億米ドル、AGR)
図59 北米の薬物送達技術市場魅力度指数
図60 北米の薬物送達技術市場(地域別):2024年、2029年、2034年(10億米ドル
図61 北米の薬物送達技術市場:国別予測(2024〜2034年、10億米ドル、AGR)
図62 北米薬物送達技術の国別市場予測、2024年&2034年(%)
図63 北米の薬物送達技術の投与経路別市場予測、2024~2034年 (10億米ドル、AGR %)
図64 北米の薬物送達技術の投与経路別市場予測、2024年〜2034年(%)
図65 北米の薬物送達技術の用途別市場予測、2024~2034年 (10億米ドル、AGR %)
図66 北米薬物送達技術の用途別市場予測、2024年&2034年(%)
図67 北米の薬物送達技術市場:エンドユーザー別予測(2024~2034年、10億米ドル、AGR)
図68 北米薬物送達技術のエンドユーザー別市場予測、2024年〜2034年(%)
図69 米国薬物送達技術市場予測、2024~2034年 (10億米ドル、AGR %)
図 70 カナダの薬物送達技術市場予測、2024~2034 年 (10 億米ドル、AGR)
図71 欧州薬物送達技術市場魅力度指数
図72 欧州の薬物送達技術市場(地域別):2024年、2029年、2034年(10億米ドル
図73 欧州の薬物送達技術市場:国別予測(2024~2034年、10億米ドル、AGR)
図74 欧州薬物送達技術市場国別シェア予測、2024年~2034年(%)
図75 欧州薬物送達技術の投与経路別市場予測、2024~2034年 (10億米ドル、AGR %)
図76 欧州薬物送達技術の投与経路別市場予測、2024年〜2034年(%)
図77 欧州薬物送達技術の用途別市場予測、2024~2034年 (10億米ドル、AGR %)
図78 欧州薬物送達技術の用途別市場シェア予測、2024年~2034年 (%)
図79 欧州の薬物送達技術市場:エンドユーザー別予測(2024~2034年、10億米ドル、AGR)
図80 欧州薬物送達技術のエンドユーザー別市場予測、2024年~2034年 (%)
図81 ドイツ薬物送達技術市場予測、2024~2034年 (10億米ドル、AGR %)
図82 イギリスの薬物送達技術市場予測、2024~2034年 (10億米ドル、AGR %)
図83 フランスの薬物送達技術の市場展望、2024~2034年 (10億米ドル、AGR %)
図84 イタリアの薬物送達技術の市場展望、2024~2034年 (10億米ドル、AGR %)
図 85 スペイン薬物送達技術市場の予測、2024-2034 (10億米ドル、AGR %)
図 86 ロシア薬物送達技術市場の予測、2024~2034年 (10億米ドル、AGR %)
図 87 その他のヨーロッパの薬物送達技術市場予測、2024~2034年 (10億米ドル、AGR %)
図88 アジア太平洋地域の薬物送達技術市場魅力度指数
図89 アジア太平洋地域の薬物送達技術市場(地域別):2024年、2029年、2034年(10億米ドル
図90 アジア太平洋地域の薬物送達技術市場:国別予測(2024~2034年、10億米ドル、AGR)
図91 アジア太平洋地域の薬物送達技術の国別市場シェア予測、2024年&2034年(%)
図92 アジア太平洋地域の薬物送達技術市場:投与経路別予測(2024~2034年、10億米ドル、AGR)
図93 アジア太平洋地域の薬物送達技術市場、投与経路別シェア予測、2024年〜2034年 (%)
図94 アジア太平洋地域の薬物送達技術の用途別市場予測、2024~2034年 (10億米ドル、AGR %)
図95 アジア太平洋地域の薬物送達技術市場:用途別シェア予測、2024年~2034年(%)
図96 アジア太平洋地域の薬物送達技術市場:エンドユーザー別予測(2024~2034年、10億米ドル、AGR)
図97 アジア太平洋地域の薬物送達技術市場:エンドユーザー別シェア予測、2024年〜2034年 (%)
図98 日本薬物送達技術市場予測、2024~2034年 (10億米ドル、AGR %)
図99 中国薬物送達技術市場予測、2024~2034年 (10億米ドル、AGR %)
図100 インド薬物送達技術の市場展望、2024~2034年 (10億米ドル、AGR %)
図101 オーストラリアの薬物送達技術市場の予測、2024-2034年 (10億米ドル、AGR %)
図 102 韓国の薬物送達技術の市場展望、2024~2034年 (10億米ドル、AGR %)
図 103 東南アジア薬物送達技術市場の予測、2024~2034年 (10億米ドル、AGR %)
図 104 その他のアジア太平洋地域の薬物送達技術市場予測、2024~2034年 (10億米ドル、AGR %)
図105 中南米の薬物送達技術市場魅力度指数
図106 中南米の薬物送達技術市場(地域別):2024年、2029年、2034年(10億米ドル
図107 中南米の薬物送達技術市場:国別予測(2024~2034年、10億米ドル、AGR)
図108 中南米の薬物送達技術の国別市場予測、2024年~2034年(%)
図109 中南米の薬物送達技術市場:投与経路別予測(2024~2034年、10億米ドル、AGR)
図110 中南米の薬物送達技術市場、投与経路別予測、2024年〜2034年(%)
図111 中南米の薬物送達技術の用途別市場予測、2024~2034年 (10億米ドル、AGR %)
図112 中南米の薬物送達技術市場:用途別シェア予測、2024年~2034年(%)
図113 中南米の薬物送達技術市場:エンドユーザー別予測(2024~2034年、10億米ドル、AGR)
図114 ラテンアメリカの薬物送達技術市場:エンドユーザー別シェア予測、2024年~2034年 (%)
図115 ブラジル薬物送達技術市場予測、2024~2034年 (10億米ドル、AGR %)
図116 メキシコの薬物送達技術市場予測、2024~2034年 (10億米ドル、AGR %)
図 117 その他のラテンアメリカの薬物送達技術市場予測、2024~2034年 (10億米ドル、AGR %)
図118 MEA薬物送達技術市場魅力度指数
図119 MEA薬物送達技術の地域別市場規模(2024年、2029年&2034年)(10億米ドル
図120 MEA薬物送達技術の国別市場予測(2024年~2034年、10億米ドル、AGR)
図121 MEA薬物送達技術の国別市場シェア予測、2024年~2034年(%)
図122 MEAの薬物送達技術市場:投与経路別予測(2024-2034年) (10億ドル, AGR %)
図123 MEA薬物送達技術の投与経路別市場予測、2024年~2034年(%)
図124 MEA薬物送達技術の用途別市場予測、2024~2034年 (10億米ドル、AGR %)
図125 MEA薬物送達技術の用途別市場シェア予測、2024年~2034年(%)
図126 MEA薬物送達技術のエンドユーザー別市場予測、2024年~2034年 (10億米ドル、AGR %)
図127 MEA薬物送達技術のエンドユーザー別市場予測、2024年~2034年 (%)
図128 GCCの薬物送達技術市場予測、2024~2034年 (10億米ドル, AGR %)
図129 南アフリカの薬物送達技術市場予測、2024~2034年 (10億米ドル, AGR %)
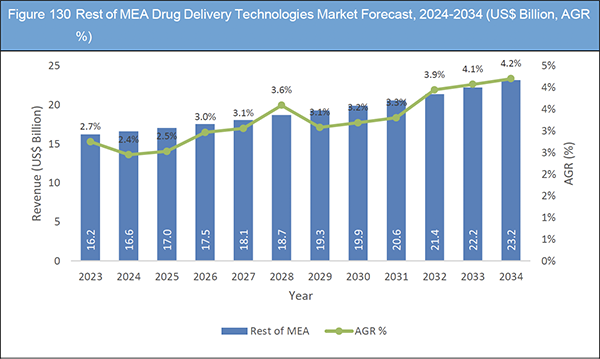
図130 その他のMEA薬物送達技術市場の予測、2024-2034年 (10億米ドル、AGR %)
図 131 ジョンソン・エンド・ジョンソンサービス社純収入、2015年~2023年(百万米ドル、AGR)
図 132 Johnson & Johnson Services, Inc:地域別市場シェア(%), 2023
図 133 Johnson & Johnson Services, Inc:R&D, 2015-2023 (百万米ドル, AGR%)
図134 ノバルティスAG:純収入、2015-2023年(百万米ドル、AGR)
図135 ノバルティスAG:地域別市場シェア(%)、2023年
図136 ノバルティスAG:研究開発費(百万米ドル、AGR)
図 137 F.ホフマン・ラ・ロシュ:純収入(百万米ドル、AGR)
図 138 F. ホフマン・ラ・ロシュ社:地域別市場シェア(%)、2023 年
図 139 F. ホフマン・ラ・ロシュ社:研究開発費(百万米ドル、AGR)
図 140 ファイザー純収入、2015年~2023年(百万米ドル、AGR)
図 141 ファイザー地域別市場シェア(%), 2023
図 142 ファイザー:R&D、2015-2023年(百万米ドル、AGR)
図143 バイエルAG:純収入、2015-2022年(百万米ドル、AGR)
図144 バイエルAG:地域別市場シェア(%)、2022年
図 145 バイエル:研究開発費(百万米ドル、AGR)
図 146 ベクトン・ディッキンソン・アンド・カンパニー純収入、2015-2023年(百万米ドル、AGR)
図 147 ベクトン・ディッキンソン アンド カンパニー:地域別市場シェア(%), 2023
図 148 米ベクトン・ディッキンソン社:地域別市場シェア(%)R&D、2015年~2023年(百万米ドル、AGR)
図 149 GSK plc:純収入、2015-2023年(百万米ドル、AGR)
図 150 GSK plc:地域別市場シェア(%), 2023
図 151 GSK plc:研究開発費、2015-2023年(百万米ドル、AGR)
図 152 Merck & Co:純収入, 2015-2023 (百万米ドル, AGR%)
図 153 Merck & Co:地域別市場シェア(%), 2023
図 154 Merck & Co:R&D、2015-2023年(百万米ドル、AGR)
図 155 サノフィ純収入、2015-2023年(百万米ドル、AGR)
図 156 サノフィ:地域別市場シェア(%), 2023
図157 サノフィ研究開発費、2015-2023年(百万米ドル、AGR)
図 158 アムジェン社純収入、2015-2023年(百万米ドル、AGR)
図 159 アムジェン社研究開発費、2015-2023年(百万米ドル、AGR)
図 160 アムジェン社地域別市場シェア(%), 2023
図 161 アッヴィ・インク:純収入、2015-2023年(百万米ドル、AGR)
図 162 アッヴィー社:地域別市場シェア(%), 2023
図 163 アッヴィ・インク:研究開発費、2015-2023年(百万米ドル、AGR)
図 164 ギリアド・サイエンシズInc:純収入, 2015-2023 (百万米ドル, AGR%)
図 165 ギリアド・サイエンシズInc:研究開発費、2015-2023年(百万米ドル、AGR)
図 166 ベーリンガーインゲルハイム: 純収入, 2015-2022 (百万米ドル, AGR%)
図167 ベーリンガーインゲルハイム:地域別市場シェア(%)地域別市場シェア(%), 2022
図 168 アストラゼネカ plc:純収入, 2015-2023 (百万米ドル, AGR%)
図 169 アストラゼネカ plc:地域別市場シェア(%), 2023
図 170 アストラゼネカ plc:研究開発費、2015-2022年(百万米ドル、AGR)
図 171 イーライリリー・アンド・カンパニー純収入、2015-2022年(百万米ドル、AGR)
図 172 イーライリリー・アンド・カンパニー地域別市場シェア(%), 2023
図 173 イーライリリー・アンド・カンパニー研究開発費、2015-2022年(百万米ドル、AGR)
図 174 テバ・ファーマシューティカルズ・インダストリーズ社: 純収入, 2015-2022 (百万米ドル, AGR%)
図 175 テバ・ファーマシューティカルズ・インダストリーズ社:地域別市場シェア(%), 2023
図 176 テバ・ファーマシューティカルズ・インダストリーズ社:研究開発費、2015-2022 年(百万米ドル、AGR)
図 177 ブリストル・マイヤーズ スクイブ:純収入、2015-2022 年(百万米ドル、AGR)
図 178 ブリストル・マイヤーズ スクイブ:地域別市場シェア(%)、2023 年
図 179 ブリストル・マイヤーズ スクイブ:研究開発費、2015-2022 年(百万米ドル、AGR)
図180 ゲレスハイマーAG:純収入、2015-2023年(百万米ドル、AGR)
図181 Gerresheimer AG:地域別市場シェア(%)、2023年
図 182 ボストン・サイエンティフィック・コーポレーション純収入, 2015-2022 (百万米ドル, AGR%)
図 183 ボストン・サイエンティフィック・コーポレーション地域別市場シェア(%), 2023
図 184 ボストン・サイエンティフィック社研究開発費、2015-2022 年(百万米ドル、AGR)
ページTOPに戻る
Summary
Report Details
The Drug Delivery Technologies Market Report 2024-2034: This report will prove invaluable to leading firms striving for new revenue pockets if they wish to better understand the industry and its underlying dynamics. It will be useful for companies that would like to expand into different industries or to expand their existing operations in a new region.
The expansion observed in the drug delivery technologies sector can be largely attributed to several key drivers. These include the escalating prevalence of chronic ailments, the burgeoning biologics market, heightened investments in research and development, technological breakthroughs, and the introduction of novel products. Additionally, pharmaceutical and biopharmaceutical enterprises are strategically directing resources towards research and development endeavours aimed at cultivating new molecular entities tailored for diverse therapeutic applications and innovative drug delivery platforms. These companies are committed to substantial investments in research and development endeavours to ensure the delivery of superior-quality and ground-breaking products to the marketplace. Notably, the allocation of funds towards research and development by biopharmaceutical entities has witnessed a significant uptick over time. However, it’s imperative to acknowledge potential constraints to market growth in the foreseeable future, such as the heightened risk of needlestick injuries and escalating pricing pressures.
What Questions Should You Ask before Buying a Market Research Report?
-
How is the drug delivery technologies market evolving?
-
What is driving and restraining the drug delivery technologies market?
-
How will each drug delivery technologies submarket segment grow over the forecast period and how much revenue will these submarkets account for in 2034?
-
How will the market shares for each drug delivery technologies submarket develop from 2024 to 2034?
-
What will be the main driver for the overall market from 2024 to 2034?
-
Will leading drug delivery technologies markets broadly follow the macroeconomic dynamics, or will individual national markets outperform others?
-
How will the market shares of the national markets change by 2034 and which geographical region will lead the market in 2034?
-
Who are the leading players and what are their prospects over the forecast period?
-
What are the drug delivery technologies projects for these leading companies?
-
How will the industry evolve during the period between 2024 and 2034? What are the implications of
drug delivery technologies projects taking place now and over the next 10 years?
-
Is there a greater need for product commercialisation to further scale the drug delivery technologies market?
-
Where is the drug delivery technologies market heading and how can you ensure you are at the forefront of the market?
-
What are the best investment options for new product and service lines?
-
What are the key prospects for moving companies into a new growth path and C-suite?
You need to discover how this will impact the drug delivery technologies market today, and over the next 10 years:
-
Our 328-page report provides 121 tables, 184 charts/graphs exclusively to you.
-
The report highlights key lucrative areas in the industry so you can target them – NOW.
-
It contains in-depth analysis of global, regional and national sales and growth.
-
It highlights for you the key successful trends, changes and revenue projections made by your competitors.
This report tells you TODAY how the drug delivery technologies market will develop in the next 10 years, and in line with the variations in COVID-19 economic recession and bounce. This market is more critical now than at any point over the last 10 years.
Forecasts to 2034 and other analyses reveal commercial prospects
-
In addition to revenue forecasting to 2034, our new study provides you with recent results, growth rates, and market shares.
-
You will find original analyses, with business outlooks and developments.
-
Discover qualitative analyses (including market dynamics, drivers, opportunities, and restraints), Porter’s Five Forces Analysis, PEST Analysis and recent developments.
This report includes data analysis and invaluable insight into how COVID-19 will affect the industry and your company. Four COVID-19 recovery patterns and their impact, namely, “V”, “L”, “W” and “U” are discussed in this report.
Segments Covered in the Report
Route of Administration
-
Implantable Drug Delivery
-
Injectable Drug Delivery
-
Nasal Drug Delivery
-
Ocular Drug Delivery
-
Oral Drug Delivery
-
Pulmonary Drug Delivery
-
Topical Drug Delivery
-
Transmucosal Drug Delivery
Application
-
Cancer
-
Cardiovascular
-
Diabetes
-
Infectious Diseases
-
Others
End-users
-
Ambulatory Surgical Centres
-
Hospitals
-
Home Care Settings
-
Others
In addition to the revenue predictions for the overall world market and segments, you will also find revenue forecasts for five regional and 21 leading national markets:
North America
Europe
-
Germany
-
UK
-
France
-
Italy
-
Spain
-
Russia
-
Rest of Europe
Asia Pacific
-
Japan
-
China
-
India
-
Australia
-
South Korea
-
Rest of Asia Pacific
Latin America
-
Brazil
-
Mexico
-
Rest of Latin America
MEA
-
GCC
-
South Africa
-
Rest of MEA
The report also includes profiles and for some of the leading companies in the Drug Delivery Technologies Market, 2024 to 2034, with a focus on this segment of these companies’ operations.
Leading companies and the potential for market growth
-
AbbVie Inc.
-
Amgen Inc.
-
AstraZeneca plc
-
Bayer AG
-
BD
-
Boehringer Ingelheim
-
Boston Scientific Corporation
-
Bristol-Myers Squibb
-
Eli Lilly and Company
-
F. Hoffmann-La Roche Ltd.
-
Gerresheimer AG
-
Gilead Sciences, Inc.
-
GSK plc
-
Johnson & Johnson Services, Inc.
-
Novartis AG
-
Merck & Co., Inc.
-
Pfizer Inc.
-
Sanofi
-
Teva Pharmaceuticals Industries Ltd.
Overall world revenue for Drug Delivery Technologies Market, 2024 to 2034 in terms of value the market will surpass US$1,700 billion in 2024, our work calculates. We predict strong revenue growth through to 2034. Our work identifies which organizations hold the greatest potential. Discover their capabilities, progress, and commercial prospects, helping you stay ahead.
How will the Drug Delivery Technologies Market, 2024 to 2034 report help you?
In summary, our 320+ page report provides you with the following knowledge:
-
Revenue forecasts to 2034 for Drug Delivery Technologies Market 2024 to 2034, with forecasts for route of administration, application, and end-users each forecast at a global and regional level – discover the industry’s prospects, finding the most lucrative places for investments and revenues.
-
Revenue forecasts to 2034 for five regional and 21 key national markets – See forecasts for the Drug Delivery Technologies Market, 2024 to 2034 in North America, Europe, Asia-Pacific, Latin America, and MEA. Also forecasted is the market in the US, Canada, Mexico, Brazil, Germany, France, UK, Italy, China, India, Japan, and Australia among other prominent economies.
-
Prospects for established firms and those seeking to enter the market – including company profiles for 19 of the major companies involved in the Drug Delivery Technologies Market, 2024 to 2034.
Find quantitative and qualitative analyses with independent predictions. Receive information that only our report contains, staying informed with invaluable business intelligence.
Information found nowhere else
With our new report, you are less likely to fall behind in knowledge or miss out on opportunities. See how our work could benefit your research, analyses, and decisions. Visiongain’s study is for everybody needing commercial analyses for the Drug Delivery Technologies Market 2024 to 2034, market-leading companies. You will find data, trends and predictions.
ページTOPに戻る
Table of Contents
1 Report Overview
1.1 Objectives of the Study
1.2 Introduction to Drug Delivery Technologies Market
1.3 What This Report Delivers
1.4 Why You Should Read This Report
1.5 Key Questions Answered by This Analytical Report Include:
1.6 Who is This Report For?
1.7 Methodology
1.7.1 Market Definitions
1.7.2 Market Evaluation & Forecasting Methodology
1.7.3 Data Validation
1.7.3.1 Primary Research
1.7.3.2 Secondary Research
1.8 Frequently Asked Questions (FAQs)
1.9 Associated Visiongain Reports
1.10 About Visiongain
2 Executive Summary
3 Market Overview
3.1 Key Findings
3.2 Market Dynamics
3.2.1 Market Driving Factors
3.2.1.1 Rising Prevalence of Chronic Diseases
3.2.1.2 Technological Advancements Driving Industry Growth
3.2.1.3 Rising Focus on Patient-centric Care
3.2.1.4 Integration of AI and Big Data
3.2.2 Market Restraining Factors
3.2.2.1 Lack of Awareness and Infrastructure
3.2.2.2 Risk of Needlestick Injuries
3.2.2.3 Reimbursement Issues in Advanced Drug Delivery Technologies
3.2.3 Market Opportunities
3.2.3.1 Self-administration and Home Care
3.2.3.2 Digital Integration and Connectivity
3.2.3.3 Expanding Applications in Biologics and Gene Therapies
3.2.3.4 Sustainable and Eco-friendly Innovations in Drug Delivery Technologies
3.3 COVID-19 Impact Analysis
3.4 Porter’s Five Forces Analysis
3.4.1 Supplier Power
3.4.2 Buyer Power
3.4.3 Competitive Rivalry
3.4.4 Threat of Substitutes
3.4.5 Threat of New Entrants
3.5 PEST Analysis
4 Drug Delivery Technologies Market Analysis by Route of Administration
4.1 Key Findings
4.2 Route of Administration Segment: Market Attractiveness Index
4.3 Drug Delivery Technologies Market Size Estimation and Forecast by Route of Administration
4.4 Implantable Drug Delivery
4.4.1 Market Forecast by Region, 2024-2034 (US$ Billion, AGR %)
4.4.2 Market Share by Region, 2024 & 2034 (%)
4.5 Injectable Drug Delivery
4.5.1 Market Forecast by Region, 2024-2034 (US$ Billion, AGR %)
4.5.2 Market Share by Region, 2024 & 2034 (%)
4.6 Nasal Drug Delivery
4.6.1 Market Forecast by Region, 2024-2034 (US$ Billion, AGR %)
4.6.2 Market Share by Region, 2024 & 2034 (%)
4.7 Ocular Drug Delivery
4.7.1 Market Forecast by Region, 2024-2034 (US$ Billion, AGR %)
4.7.2 Market Share by Region, 2024 & 2034 (%)
4.8 Oral Drug Delivery
4.8.1 Market Forecast by Region, 2024-2034 (US$ Billion, AGR %)
4.8.2 Market Share by Region, 2024 & 2034 (%)
4.9 Pulmonary Drug Delivery
4.9.1 Market Forecast by Region, 2024-2034 (US$ Billion, AGR %)
4.9.2 Market Share by Region, 2024 & 2034 (%)
4.10 Topical Drug Delivery
4.10.1 Market Forecast by Region, 2024-2034 (US$ Billion, AGR %)
4.10.2 Market Share by Region, 2024 & 2034 (%)
4.11 Transmucosal Drug Delivery
4.11.1 Market Forecast by Region, 2024-2034 (US$ Billion, AGR %)
4.11.2 Market Share by Region, 2024 & 2034 (%)
5 Drug Delivery Technologies Market Analysis by Application
5.1 Key Findings
5.2 Application Segment: Market Attractiveness Index
5.3 Drug Delivery Technologies Market Size Estimation and Forecast by Application
5.4 Cancer
5.4.1 Market Forecast by Region, 2024-2034 (US$ Billion, AGR %)
5.4.2 Market Share by Region, 2024 & 2034 (%)
5.5 Cardiovascular
5.5.1 Market Forecast by Region, 2024-2034 (US$ Billion, AGR %)
5.5.2 Market Share by Region, 2024 & 2034 (%)
5.6 Diabetes
5.6.1 Market Forecast by Region, 2024-2034 (US$ Billion, AGR %)
5.6.2 Market Share by Region, 2024 & 2034 (%)
5.7 Infectious Diseases
5.7.1 Market Forecast by Region, 2024-2034 (US$ Billion, AGR %)
5.7.2 Market Share by Region, 2024 & 2034 (%)
5.8 Others
5.8.1 Market Forecast by Region, 2024-2034 (US$ Billion, AGR %)
5.8.2 Market Share by Region, 2024 & 2034 (%)
6 Drug Delivery Technologies Market Analysis by End-users
6.1 Key Findings
6.2 End-users Segment: Market Attractiveness Index
6.3 Drug Delivery Technologies Market Size Estimation and Forecast by End-users
6.4 Ambulatory Surgical Centres
6.4.1 Market Forecast by Region, 2024-2034 (US$ Billion, AGR %)
6.4.2 Market Share by Region, 2024 & 2034 (%)
6.5 Hospitals
6.5.1 Market Forecast by Region, 2024-2034 (US$ Billion, AGR %)
6.5.2 Market Share by Region, 2024 & 2034 (%)
6.6 Home Care Settings
6.6.1 Market Forecast by Region, 2024-2034 (US$ Billion, AGR %)
6.6.2 Market Share by Region, 2024 & 2034 (%)
6.7 Others
6.7.1 Market Forecast by Region, 2024-2034 (US$ Billion, AGR %)
6.7.2 Market Share by Region, 2024 & 2034 (%)
7 Drug Delivery Technologies Market Analysis by Region
7.1 Key Findings
7.2 Regional Market Size Estimation and Forecast
8 North America Drug Delivery Technologies Market Analysis
8.1 Key Findings
8.2 North America Drug Delivery Technologies Market Attractiveness Index
8.3 North America Drug Delivery Technologies Market by Country, 2024, 2029 & 2034 (US$ Billion)
8.4 North America Drug Delivery Technologies Market Size Estimation and Forecast by Country
8.5 North America Drug Delivery Technologies Market Size Estimation and Forecast by Route of Administration
8.6 North America Drug Delivery Technologies Market Size Estimation and Forecast by Application
8.7 North America Drug Delivery Technologies Market Size Estimation and Forecast by End-users
8.8 U.S. Drug Delivery Technologies Market Analysis
8.9 Canada Drug Delivery Technologies Market Analysis
9 Europe Drug Delivery Technologies Market Analysis
9.1 Key Findings
9.2 Europe Drug Delivery Technologies Market Attractiveness Index
9.3 Europe Drug Delivery Technologies Market by Country, 2024, 2029 & 2034 (US$ Billion)
9.4 Europe Drug Delivery Technologies Market Size Estimation and Forecast by Country
9.5 Europe Drug Delivery Technologies Market Size Estimation and Forecast by Route of Administration
9.6 Europe Drug Delivery Technologies Market Size Estimation and Forecast by Application
9.7 Europe Drug Delivery Technologies Market Size Estimation and Forecast by End-users
9.8 Germany Drug Delivery Technologies Market Analysis
9.9 UK Drug Delivery Technologies Market Analysis
9.10 France Drug Delivery Technologies Market Analysis
9.11 Italy Drug Delivery Technologies Market Analysis
9.12 Spain Drug Delivery Technologies Market Analysis
9.13 Russia Drug Delivery Technologies Market Analysis
9.14 Rest of Europe Drug Delivery Technologies Market Analysis
10 Asia Pacific Drug Delivery Technologies Market Analysis
10.1 Key Findings
10.2 Asia Pacific Drug Delivery Technologies Market Attractiveness Index
10.3 Asia Pacific Drug Delivery Technologies Market by Country, 2024, 2029 & 2034 (US$ Billion)
10.4 Asia Pacific Drug Delivery Technologies Market Size Estimation and Forecast by Country
10.5 Asia Pacific Drug Delivery Technologies Market Size Estimation and Forecast by Route of Administration
10.6 Asia Pacific Drug Delivery Technologies Market Size Estimation and Forecast by Application
10.7 Asia Pacific Drug Delivery Technologies Market Size Estimation and Forecast by End-users
10.8 Japan Drug Delivery Technologies Market Analysis
10.9 China Drug Delivery Technologies Market Analysis
10.10 India Drug Delivery Technologies Market Analysis
10.11 Australia Drug Delivery Technologies Market Analysis
10.12 South Korea Drug Delivery Technologies Market Analysis
10.13 South-East Asia Drug Delivery Technologies Market Analysis
10.14 Rest of Asia Pacific Drug Delivery Technologies Market Analysis
11 Latin America Drug Delivery Technologies Market Analysis
11.1 Key Findings
11.2 Latin America Drug Delivery Technologies Market Attractiveness Index
11.3 Latin America Drug Delivery Technologies Market by Country, 2024, 2029 & 2034 (US$ Billion)
11.4 Latin America Drug Delivery Technologies Market Size Estimation and Forecast by Country
11.5 Latin America Drug Delivery Technologies Market Size Estimation and Forecast by Route of Administration
11.6 Latin America Drug Delivery Technologies Market Size Estimation and Forecast by Application
11.7 Latin America Drug Delivery Technologies Market Size Estimation and Forecast by End-users
11.8 Brazil Drug Delivery Technologies Market Analysis
11.9 Mexico Drug Delivery Technologies Market Analysis
11.10 Rest of Latin America Drug Delivery Technologies Market Analysis
12 MEA Drug Delivery Technologies Market Analysis
12.1 Key Findings
12.2 MEA Drug Delivery Technologies Market Attractiveness Index
12.3 MEA Drug Delivery Technologies Market by Country, 2024, 2029 & 2034 (US$ Billion)
12.4 MEA Drug Delivery Technologies Market Size Estimation and Forecast by Country
12.5 MEA Drug Delivery Technologies Market Size Estimation and Forecast by Route of Administration
12.6 MEA Drug Delivery Technologies Market Size Estimation and Forecast by Application
12.7 MEA Drug Delivery Technologies Market Size Estimation and Forecast by End-users
12.8 GCC Drug Delivery Technologies Market Analysis
12.9 South Africa Drug Delivery Technologies Market Analysis
12.10 Rest of MEA Drug Delivery Technologies Market Analysis
13 Company Profiles
13.1 Johnson & Johnson Services, Inc.
13.1.1 Company Snapshot
13.1.2 Company Overview
13.1.3 Financial Analysis
13.1.3.1 Net Revenue, 2015-2023
13.1.3.2 Regional Market Shares, 2023
13.1.3.3 R&D, 2015-2023
13.1.4 Product Benchmarking
13.2 Novartis AG
13.2.1 Company Snapshot
13.2.2 Company Overview
13.2.3 Financial Analysis
13.2.3.1 Net Revenue, 2015-2023
13.2.3.2 Regional Market Shares, 2023
13.2.3.3 R&D, 2015-2023
13.2.4 Product Benchmarking
13.2.5 Strategic Outlook
13.3 F. Hoffmann-La Roche Ltd.
13.3.1 Company Snapshot
13.3.2 Company Overview
13.3.3 Financial Analysis
13.3.3.1 Net Revenue, 2015-2023
13.3.3.2 Regional Market Shares, 2023
13.3.3.3 R&D, 2015-2023
13.3.4 Product Benchmarking
13.3.5 Strategic Outlook
13.4 Pfizer Inc.
13.4.1 Company Snapshot
13.4.2 Company Overview
13.4.3 Financial Analysis
13.4.3.1 Net Revenue, 2015-2023
13.4.3.2 Regional Market Shares, 2023
13.4.3.3 R&D, 2015-2023
13.4.4 Product Benchmarking
13.4.5 Strategic Outlook
13.5 Bayer AG
13.5.1 Company Snapshot
13.5.2 Company Overview
13.5.3 Financial Analysis
13.5.3.1 Net Revenue, 2015-2022
13.5.3.2 Regional Market Shares, 2022
13.5.3.3 R&D, 2015-2022
13.5.4 Product Benchmarking
13.5.5 Strategic Outlook
13.6 Becton, Dickinson and Company
13.6.1 Company Snapshot
13.6.2 Company Overview
13.6.3 Financial Analysis
13.6.3.1 Net Revenue, 2015-2023
13.6.3.2 Regional Market Shares, 2023
13.6.3.3 R&D, 2015-2023
13.6.4 Product Benchmarking
13.6.5 Strategic Outlook
13.7 GSK plc
13.7.1 Company Snapshot
13.7.2 Company Overview
13.7.3 Financial Analysis
13.7.3.1 Net Revenue, 2015-2023
13.7.3.2 Regional Market Shares, 2023
13.7.3.3 R&D, 2015-2023
13.7.4 Product Benchmarking
13.8 Merck & Co., Inc.
13.8.1 Company Snapshot
13.8.2 Company Overview
13.8.3 Financial Analysis
13.8.3.1 Net Revenue, 2015-2023
13.8.3.2 Regional Market Shares, 2023
13.8.3.3 R&D, 2015-2023
13.8.4 Product Benchmarking
13.8.5 Strategic Outlook
13.9 Sanofi
13.9.1 Company Snapshot
13.9.2 Company Overview
13.9.3 Financial Analysis
13.9.3.1 Net Revenue, 2015-2023
13.9.3.2 Regional Market Shares, 2023
13.9.3.3 R&D, 2015-2023
13.9.4 Product Benchmarking
13.9.5 Strategic Outlook
13.10 Amgen Inc.
13.10.1 Company Snapshot
13.10.2 Company Overview
13.10.3 Financial Analysis
13.10.3.1 Net Revenue, 2015-2023
13.10.3.2 R&D, 2015-2023
13.10.3.3 Regional Market Shares, 2023
13.10.4 Product Benchmarking
13.10.5 Strategic Outlook
13.11 AbbVie Inc.
13.11.1 Company Snapshot
13.11.2 Company Overview
13.11.3 Financial Analysis
13.11.3.1 Net Revenue, 2015-2023
13.11.3.2 Regional Market Shares, 2023
13.11.3.3 R&D, 2015-2023
13.11.4 Product Benchmarking
13.11.5 Strategic Outlook
13.12 Gilead Sciences, Inc.
13.12.1 Company Snapshot
13.12.2 Company Overview
13.12.3 Financial Analysis
13.12.3.1 Net Revenue, 2015-2023
13.12.3.2 R&D, 2015-2023
13.12.4 Product Benchmarking
13.12.5 Strategic Outlook
13.13 Boehringer Ingelheim
13.13.1 Company Snapshot
13.13.2 Company Overview
13.13.3 Financial Analysis
13.13.3.1 Net Revenue, 2015-2022
13.13.3.2 Regional Market Shares, 2022
13.13.4 Product Benchmarking
13.14 AstraZeneca plc
13.14.1 Company Snapshot
13.14.2 Company Overview
13.14.3 Financial Analysis
13.14.3.1 Net Revenue, 2015-2023
13.14.3.2 Regional Market Shares, 2023
13.14.3.3 R&D, 2015-2022
13.14.4 Product Benchmarking
13.14.5 Strategic Outlook
13.15 Eli Lilly and Company
13.15.1 Company Snapshot
13.15.2 Company Overview
13.15.3 Financial Analysis
13.15.3.1 Net Revenue, 2015-2022
13.15.3.2 Regional Market Shares, 2023
13.15.3.3 R&D, 2015-2022
13.15.4 Product Benchmarking
13.15.5 Strategic Outlook
13.16 Teva Pharmaceuticals Industries Ltd.
13.16.1 Company Snapshot
13.16.2 Company Overview
13.16.3 Financial Analysis
13.16.3.1 Net Revenue, 2015-2022
13.16.3.2 Regional Market Shares, 2023
13.16.3.3 R&D, 2015-2022
13.16.4 Product Benchmarking
13.16.5 Strategic Outlook
13.17 Bristol-Myers Squibb
13.17.1 Company Snapshot
13.17.2 Company Overview
13.17.3 Financial Analysis
13.17.3.1 Net Revenue, 2015-2022
13.17.3.2 Regional Market Shares, 2023
13.17.3.3 R&D, 2015-2022
13.17.4 Product Benchmarking
13.18 Gerresheimer AG
13.18.1 Company Snapshot
13.18.2 Company Overview
13.18.3 Financial Analysis
13.18.3.1 Net Revenue, 2015-2023
13.18.3.2 Regional Market Shares, 2023
13.18.4 Product Benchmarking
13.18.5 Strategic Outlook
13.19 Boston Scientific Corporation
13.19.1 Company Snapshot
13.19.2 Company Overview
13.19.3 Financial Analysis
13.19.3.1 Net Revenue, 2015-2022
13.19.3.2 Regional Market Shares, 2023
13.19.3.3 R&D, 2015-2022
13.19.4 Product Benchmarking
13.19.5 Strategic Outlook
14 Conclusion and Recommendations
14.1 Concluding Remarks from Visiongain
14.2 Recommendations for Market Players
ページTOPに戻る
List of Tables/Graphs
List of Tables
Table 1 Drug Delivery Technologies Market Snapshot, 2024 & 2034 (US$ Billion, CAGR %)
Table 2 Drug Delivery Technologies Market Forecast by Region, 2024-2034 (US$ Billion, AGR%, CAGR%): "V" Shaped Recovery
Table 3 Drug Delivery Technologies Market Forecast by Region, 2024-2034 (US$ Billion, AGR%, CAGR%): "U" Shaped Recovery
Table 4 Drug Delivery Technologies Market Forecast by Region, 2024-2034 (US$ Billion, AGR%, CAGR%): "W" Shaped Recovery
Table 5 Drug Delivery Technologies Market Forecast by Region, 2024-2034 (US$ Billion, AGR%, CAGR%): "L" Shaped Recovery
Table 6 Drug Delivery Technologies Market Forecast by Route of Administration, 2024-2034 (US$ Billion, AGR%, CAGR%)
Table 7 Implantable Drug Delivery Segment Market Forecast by Region, 2024-2034 (US$ Billion, AGR%, CAGR%)
Table 8 Injectable Drug Delivery Segment Market Forecast by Region, 2024-2034 (US$ Billion, AGR%, CAGR%)
Table 9 Nasal Drug Delivery Segment Market Forecast by Region, 2024-2034 (US$ Billion, AGR%, CAGR%)
Table 10 Ocular Drug Delivery Segment Market Forecast by Region, 2024-2034 (US$ Billion, AGR%, CAGR%)
Table 11 Oral Drug Delivery Segment Market Forecast by Region, 2024-2034 (US$ Billion, AGR%, CAGR%)
Table 12 Pulmonary Drug Delivery Segment Market Forecast by Region, 2024-2034 (US$ Billion, AGR%, CAGR%)
Table 13 Topical Drug Delivery Segment Market Forecast by Region, 2024-2034 (US$ Billion, AGR%, CAGR%)
Table 14 Transmucosal Drug Delivery Segment Market Forecast by Region, 2024-2034 (US$ Billion, AGR%, CAGR%)
Table 15 Drug Delivery Technologies Market Forecast by Application, 2024-2034 (US$ Billion, AGR%, CAGR%)
Table 16 Cancer Segment Market Forecast by Region, 2024-2034 (US$ Billion, AGR%, CAGR%)
Table 17 Cardiovascular Segment Market Forecast by Region, 2024-2034 (US$ Billion, AGR%, CAGR%)
Table 18 Diabetes Segment Market Forecast by Region, 2024-2034 (US$ Billion, AGR%, CAGR%)
Table 19 Infectious Diseases Segment Market Forecast by Region, 2024-2034 (US$ Billion, AGR%, CAGR%)
Table 20 Others Segment Market Forecast by Region, 2024-2034 (US$ Billion, AGR%, CAGR%)
Table 21 Drug Delivery Technologies Market Forecast by End-users, 2024-2034 (US$ Billion, AGR%, CAGR%)
Table 22 Ambulatory Surgical Centres Segment Market Forecast by Region, 2024-2034 (US$ Billion, AGR%, CAGR%)
Table 23 Hospitals Segment Market Forecast by Region, 2024-2034 (US$ Billion, AGR%, CAGR%)
Table 24 Home Care Settings Segment Market Forecast by Region, 2024-2034 (US$ Billion, AGR%, CAGR%)
Table 25 Others Segment Market Forecast by Region, 2024-2034 (US$ Billion, AGR%, CAGR%)
Table 26 Drug Delivery Technologies Market Forecast by Region, 2024-2034 (US$ Billion, AGR%, CAGR%)
Table 27 North America Drug Delivery Technologies Market Forecast by Country, 2024-2034 (US$ Billion, AGR%, CAGR%)
Table 28 North America Drug Delivery Technologies Market Forecast by Route of Administration, 2024-2034 (US$ Billion, AGR%, CAGR%)
Table 29 North America Drug Delivery Technologies Market Forecast by Application, 2024-2034 (US$ Billion, AGR%, CAGR%)
Table 30 North America Drug Delivery Technologies Market Forecast by End-users, 2024-2034 (US$ Billion, AGR%, CAGR%)
Table 31 U.S. Drug Delivery Technologies Market Forecast, 2024-2034 (US$ Billion, AGR%, CAGR%)
Table 32 Canada Drug Delivery Technologies Market Forecast, 2024-2034 (US$ Billion, AGR%, CAGR%)
Table 33 Europe Drug Delivery Technologies Market Forecast by Country, 2024-2034 (US$ Billion, AGR%, CAGR%)
Table 34 Europe Drug Delivery Technologies Market Forecast by Route of Administration, 2024-2034 (US$ Billion, AGR%, CAGR%)
Table 35 Europe Drug Delivery Technologies Market Forecast by Application, 2024-2034 (US$ Billion, AGR%, CAGR%)
Table 36 Europe Drug Delivery Technologies Market Forecast by End-users, 2024-2034 (US$ Billion, AGR%, CAGR%)
Table 37 Germany Drug Delivery Technologies Market Forecast, 2024-2034 (US$ Billion, AGR%, CAGR%)
Table 38 UK Drug Delivery Technologies Market Forecast, 2024-2034 (US$ Billion, AGR%, CAGR%)
Table 39 France Drug Delivery Technologies Market Forecast, 2024-2034 (US$ Billion, AGR%, CAGR%)
Table 40 Italy Drug Delivery Technologies Market Forecast, 2024-2034 (US$ Billion, AGR%, CAGR%)
Table 41 Spain Drug Delivery Technologies Market Forecast, 2024-2034 (US$ Billion, AGR%, CAGR%)
Table 42 Russia Drug Delivery Technologies Market Forecast, 2024-2034 (US$ Billion, AGR%, CAGR%)
Table 43 Rest of Europe Drug Delivery Technologies Market Forecast, 2024-2034 (US$ Billion, AGR%, CAGR%)
Table 44 Asia Pacific Drug Delivery Technologies Market Forecast by Country, 2024-2034 (US$ Billion, AGR%, CAGR%)
Table 45 Asia Pacific Drug Delivery Technologies Market Forecast by Route of Administration, 2024-2034 (US$ Billion, AGR%, CAGR%)
Table 46 Asia Pacific Drug Delivery Technologies Market Forecast by Application, 2024-2034 (US$ Billion, AGR%, CAGR%)
Table 47 Asia Pacific Drug Delivery Technologies Market Forecast by End-users, 2024-2034 (US$ Billion, AGR%, CAGR%)
Table 48 Japan Drug Delivery Technologies Market Forecast, 2024-2034 (US$ Billion, AGR%, CAGR%)
Table 49 China Drug Delivery Technologies Market Forecast, 2024-2034 (US$ Billion, AGR%, CAGR%)
Table 50 India Drug Delivery Technologies Market Forecast, 2024-2034 (US$ Billion, AGR%, CAGR%)
Table 51 Australia Drug Delivery Technologies Market Forecast, 2024-2034 (US$ Billion, AGR%, CAGR%)
Table 52 South Korea Drug Delivery Technologies Market Forecast, 2024-2034 (US$ Billion, AGR%, CAGR%)
Table 53 South-East Asia Drug Delivery Technologies Market Forecast, 2024-2034 (US$ Billion, AGR%, CAGR%)
Table 54 Rest of Asia Pacific Drug Delivery Technologies Market Forecast, 2024-2034 (US$ Billion, AGR%, CAGR%)
Table 55 Latin America Drug Delivery Technologies Market Forecast by Country, 2024-2034 (US$ Billion, AGR%, CAGR%)
Table 56 Latin America Drug Delivery Technologies Market Forecast by Route of Administration, 2024-2034 (US$ Billion, AGR%, CAGR%)
Table 57 Latin America Drug Delivery Technologies Market Forecast by Application, 2024-2034 (US$ Billion, AGR%, CAGR%)
Table 58 Latin America Drug Delivery Technologies Market Forecast by End-users, 2024-2034 (US$ Billion, AGR%, CAGR%)
Table 59 Brazil Drug Delivery Technologies Market Forecast, 2024-2034 (US$ Billion, AGR%, CAGR%)
Table 60 Mexico Drug Delivery Technologies Market Forecast, 2024-2034 (US$ Billion, AGR%, CAGR%)
Table 61 Rest of Latin America Drug Delivery Technologies Market Forecast, 2024-2034 (US$ Billion, AGR%, CAGR%)
Table 62 MEA Drug Delivery Technologies Market Forecast by Country, 2024-2034 (US$ Billion, AGR%, CAGR%)
Table 63 MEA Drug Delivery Technologies Market Forecast by Route of Administration, 2024-2034 (US$ Billion, AGR%, CAGR%)
Table 64 MEA Drug Delivery Technologies Market Forecast by Application, 2024-2034 (US$ Billion, AGR%, CAGR%)
Table 65 MEA Drug Delivery Technologies Market Forecast by End-users, 2024-2034 (US$ Billion, AGR%, CAGR%)
Table 66 GCC Drug Delivery Technologies Market Forecast, 2024-2034 (US$ Billion, AGR%, CAGR%)
Table 67 South Africa Drug Delivery Technologies Market Forecast, 2024-2034 (US$ Billion, AGR%, CAGR%)
Table 68 Rest of MEA Drug Delivery Technologies Market Forecast, 2024-2034 (US$ Billion, AGR%, CAGR%)
Table 69 Johnson & Johnson Services, Inc.: Key Details, (CEO, HQ, Revenue, Founded, No. of Employees, Company Type, Website, Business Segment)
Table 70 Johnson & Johnson Services, Inc.: Product Benchmarking
Table 71 Novartis AG: Key Details, (CEO, HQ, Revenue, Founded, No. of Employees, Company Type, Website, Business Segment)
Table 72 Novartis AG: Product Benchmarking
Table 73 Novartis AG: Strategic Outlook
Table 74 F. Hoffmann-La Roche Ltd: Key Details, (CEO, HQ, Revenue, Founded, No. of Employees, Company Type, Website, Business Segment)
Table 75 F. Hoffmann-La Roche Ltd: Product Benchmarking
Table 76 F. Hoffmann-La Roche Ltd: Strategic Outlook
Table 77 Pfizer Inc.: Key Details, (CEO, HQ, Revenue, Founded, No. of Employees, Company Type, Website, Business Segment)
Table 78 Pfizer Inc.: Product Benchmarking
Table 79 Pfizer Inc.: Strategic Outlook
Table 80 Bayer AG: Key Details, (CEO, HQ, Revenue, Founded, No. of Employees, Company Type, Website, Business Segment)
Table 81 Bayer AG: Product Benchmarking
Table 82 Bayer AG: Strategic Outlook
Table 83 Becton, Dickinson and Company: Key Details, (CEO, HQ, Revenue, Founded, No. of Employees, Company Type, Website, Business Segment)
Table 84 Becton, Dickinson and Company: Product Benchmarking
Table 85 Becton, Dickinson and Company: Strategic Outlook
Table 86 GSK plc: Key Details, (CEO, HQ, Revenue, Founded, No. of Employees, Company Type, Website, Business Segment)
Table 87 GSK plc: Product Benchmarking
Table 88 Merck & Co., Inc.: Key Details, (CEO, HQ, Revenue, Founded, No. of Employees, Company Type, Website, Business Segment)
Table 89 Merck & Co., Inc.: Product Benchmarking
Table 90 Merck & Co., Inc.: Strategic Outlook
Table 91 Sanofi: Key Details, (CEO, HQ, Revenue, Founded, No. of Employees, Company Type, Website, Business Segment)
Table 92 Sanofi: Product Benchmarking
Table 93 Sanofi: Strategic Outlook
Table 94 Amgen Inc.: Key Details, (CEO, HQ, Revenue, Founded, No. of Employees, Company Type, Website, Business Segment)
Table 95 Amgen Inc.: Product Benchmarking
Table 96 Amgen Inc.: Strategic Outlook
Table 97 AbbVie Inc.: Key Details, (CEO, HQ, Revenue, Founded, No. of Employees, Company Type, Website, Business Segment)
Table 98 AbbVie Inc.: Product Benchmarking
Table 99 AbbVie Inc.: Strategic Outlook
Table 100 Gilead Sciences, Inc.: Key Details, (CEO, HQ, Revenue, Founded, No. of Employees, Company Type, Website, Business Segment)
Table 101 Gilead Sciences, Inc.: Product Benchmarking
Table 102 Gilead Sciences, Inc.: Strategic Outlook
Table 103 Boehringer Ingelheim: Key Details, (CEO, HQ, Revenue, Founded, No. of Employees, Company Type, Website, Business Segment)
Table 104 Boehringer Ingelheim: Product Benchmarking
Table 105 AstraZeneca plc: Key Details, (CEO, HQ, Revenue, Founded, No. of Employees, Company Type, Website, Business Segment)
Table 106 AstraZeneca plc: Product Benchmarking
Table 107 AstraZeneca plc: Strategic Outlook
Table 108 Eli Lilly and Company: Key Details, (CEO, HQ, Revenue, Founded, No. of Employees, Company Type, Website, Business Segment)
Table 109 Eli Lilly and Company: Product Benchmarking
Table 110 Eli Lilly and Company: Strategic Outlook
Table 111 Teva Pharmaceuticals Industries Ltd.: Key Details, (CEO, HQ, Revenue, Founded, No. of Employees, Company Type, Website, Business Segment)
Table 112 Teva Pharmaceuticals Industries Ltd.: Product Benchmarking
Table 113 Teva Pharmaceuticals Industries Ltd.: Strategic Outlook
Table 114 Bristol-Myers Squibb: Key Details, (CEO, HQ, Revenue, Founded, No. of Employees, Company Type, Website, Business Segment)
Table 115 Bristol-Myers Squibb: Product Benchmarking
Table 116 Gerresheimer AG: Key Details, (CEO, HQ, Revenue, Founded, No. of Employees, Company Type, Website, Business Segment)
Table 117 Gerresheimer AG: Product Benchmarking
Table 118 Gerresheimer AG: Strategic Outlook
Table 119 Boston Scientific Corporation: Key Details, (CEO, HQ, Revenue, Founded, No. of Employees, Company Type, Website, Business Segment)
Table 120 Boston Scientific Corporation: Product Benchmarking
Table 121 Boston Scientific Corporation: Strategic Outlook
List of Figures
Figure 1 Drug Delivery Technologies Market Segmentation
Figure 2 Drug Delivery Technologies Market by Route of Administration: Market Attractiveness Index
Figure 3 Drug Delivery Technologies Market by Application: Market Attractiveness Index
Figure 4 Drug Delivery Technologies Market by End-users: Market Attractiveness Index
Figure 5 Drug Delivery Technologies Market Attractiveness Index by Region
Figure 6 Drug Delivery Technologies Market: Market Dynamics
Figure 7 Drug Delivery Technologies Market by Region, 2024-2034 (US$ Billion, AGR %): “V” Shaped Recovery
Figure 8 Drug Delivery Technologies Market by Region, 2024-2034 (US$ Billion, AGR %): “U” Shaped Recovery
Figure 9 Drug Delivery Technologies Market by Region, 2024-2034 (US$ Billion, AGR %): “W” Shaped Recovery
Figure 10 Drug Delivery Technologies Market by Region, 2024-2034 (US$ Billion, AGR %): “L” Shaped Recovery
Figure 11 Drug Delivery Technologies Market: Porter’s Five Forces Analysis
Figure 12 Drug Delivery Technologies Market: PEST Analysis
Figure 13 Drug Delivery Technologies Market Attractiveness Index by Route of Administration
Figure 14 Drug Delivery Technologies Market Forecast by Route of Administration, 2024-2034 (US$ Billion, AGR %)
Figure 15 Drug Delivery Technologies Market Share Forecast by Route of Administration, 2024, 2029, 2034 (%)
Figure 16 Implantable Drug Delivery Segment Market Forecast by Region, 2024-2034 (US$ Billion, AGR %)
Figure 17 Implantable Drug Delivery Segment Market Share Forecast by Region, 2024 & 2034 (%)
Figure 18 Injectable Drug Delivery Segment Market Forecast by Region, 2024-2034 (US$ Billion, AGR %)
Figure 19 Injectable Drug Delivery Segment Market Share Forecast by Region, 2024 & 2034 (%)
Figure 20 Nasal Drug Delivery Segment Market Forecast by Region, 2024-2034 (US$ Billion, AGR %)
Figure 21 Nasal Drug Delivery Segment Market Share Forecast by Region, 2024 & 2034 (%)
Figure 22 Ocular Drug Delivery Segment Market Forecast by Region, 2024-2034 (US$ Billion, AGR %)
Figure 23 Ocular Drug Delivery Segment Market Share Forecast by Region, 2024 & 2034 (%)
Figure 24 Oral Drug Delivery Segment Market Forecast by Region, 2024-2034 (US$ Billion, AGR %)
Figure 25 Oral Drug Delivery Segment Market Share Forecast by Region, 2024 & 2034 (%)
Figure 26 Pulmonary Drug Delivery Segment Market Forecast by Region, 2024-2034 (US$ Billion, AGR %)
Figure 27 Pulmonary Drug Delivery Segment Market Share Forecast by Region, 2024 & 2034 (%)
Figure 28 Topical Drug Delivery Segment Market Forecast by Region, 2024-2034 (US$ Billion, AGR %)
Figure 29 Topical Drug Delivery Segment Market Share Forecast by Region, 2024 & 2034 (%)
Figure 30 Transmucosal Drug Delivery Segment Market Forecast by Region, 2024-2034 (US$ Billion, AGR %)
Figure 31 Transmucosal Drug Delivery Segment Market Share Forecast by Region, 2024 & 2034 (%)
Figure 32 Drug Delivery Technologies Market Attractiveness Index by Route of Administration
Figure 33 Drug Delivery Technologies Market Forecast by Application, 2024-2034 (US$ Billion, AGR %)
Figure 34 Drug Delivery Technologies Market Share Forecast by Application, 2024, 2029, 2034 (%)
Figure 35 Cancer Segment Market Forecast by Region, 2024-2034 (US$ Billion, AGR %)
Figure 36 Cancer Segment Market Share Forecast by Region, 2024 & 2034 (%)
Figure 37 Cardiovascular Segment Market Forecast by Region, 2024-2034 (US$ Billion, AGR %)
Figure 38 Cardiovascular Segment Market Share Forecast by Region, 2024 & 2034 (%)
Figure 39 Diabetes Segment Market Forecast by Region, 2024-2034 (US$ Billion, AGR %)
Figure 40 Diabetes Segment Market Share Forecast by Region, 2024 & 2034 (%)
Figure 41 Infectious Diseases Segment Market Forecast by Region, 2024-2034 (US$ Billion, AGR %)
Figure 42 Infectious Diseases Segment Market Share Forecast by Region, 2024 & 2034 (%)
Figure 43 Others Segment Market Forecast by Region, 2024-2034 (US$ Billion, AGR %)
Figure 44 Others Segment Market Share Forecast by Region, 2024 & 2034 (%)
Figure 45 Drug Delivery Technologies Market Attractiveness Index by End-users
Figure 46 Drug Delivery Technologies Market Forecast by End-users, 2024-2034 (US$ Billion, AGR %)
Figure 47 Drug Delivery Technologies Market Share Forecast by End-users, 2024, 2029, 2034 (%)
Figure 48 Ambulatory Surgical Centres Segment Market Forecast by Region, 2024-2034 (US$ Billion, AGR %)
Figure 49 Ambulatory Surgical Centres Segment Market Share Forecast by Region, 2024 & 2034 (%)
Figure 50 Hospitals Segment Market Forecast by Region, 2024-2034 (US$ Billion, AGR %)
Figure 51 Hospitals Segment Market Share Forecast by Region, 2024 & 2034 (%)
Figure 52 Home Care Settings Segment Market Forecast by Region, 2024-2034 (US$ Billion, AGR %)
Figure 53 Home Care Settings Segment Market Share Forecast by Region, 2024 & 2034 (%)
Figure 54 Others Segment Market Forecast by Region, 2024-2034 (US$ Billion, AGR %)
Figure 55 Others Segment Market Share Forecast by Region, 2024 & 2034 (%)
Figure 56 Drug Delivery Technologies Market Forecast by Region 2024, 2029, 2034 (Revenue, CAGR%)
Figure 57 Drug Delivery Technologies Market Share Forecast by Region 2024, 2029, 2034 (%)
Figure 58 Drug Delivery Technologies Market by Region, 2024-2034 (US$ Bn, AGR %)
Figure 59 North America Drug Delivery Technologies Market Attractiveness Index
Figure 60 North America Drug Delivery Technologies Market by Region, 2024, 2029 & 2034 (US$ Billion)
Figure 61 North America Drug Delivery Technologies Market Forecast by Country, 2024-2034 (US$ Billion, AGR %)
Figure 62 North America Drug Delivery Technologies Market Share Forecast by Country, 2024 & 2034 (%)
Figure 63 North America Drug Delivery Technologies Market Forecast by Route of Administration, 2024-2034 (US$ Billion, AGR %)
Figure 64 North America Drug Delivery Technologies Market Share Forecast by Route of Administration, 2024 & 2034 (%)
Figure 65 North America Drug Delivery Technologies Market Forecast by Application, 2024-2034 (US$ Billion, AGR %)
Figure 66 North America Drug Delivery Technologies Market Share Forecast by Application, 2024 & 2034 (%)
Figure 67 North America Drug Delivery Technologies Market Forecast by End-users, 2024-2034 (US$ Billion, AGR %)
Figure 68 North America Drug Delivery Technologies Market Share Forecast by End-users, 2024 & 2034 (%)
Figure 69 U.S. Drug Delivery Technologies Market Forecast, 2024-2034 (US$ Billion, AGR %)
Figure 70 Canada Drug Delivery Technologies Market Forecast, 2024-2034 (US$ Billion, AGR %)
Figure 71 Europe Drug Delivery Technologies Market Attractiveness Index
Figure 72 Europe Drug Delivery Technologies Market by Region, 2024, 2029 & 2034 (US$ Billion)
Figure 73 Europe Drug Delivery Technologies Market Forecast by Country, 2024-2034 (US$ Billion, AGR %)
Figure 74 Europe Drug Delivery Technologies Market Share Forecast by Country, 2024 & 2034 (%)
Figure 75 Europe Drug Delivery Technologies Market Forecast by Route of Administration, 2024-2034 (US$ Billion, AGR %)
Figure 76 Europe Drug Delivery Technologies Market Share Forecast by Route of Administration, 2024 & 2034 (%)
Figure 77 Europe Drug Delivery Technologies Market Forecast by Application, 2024-2034 (US$ Billion, AGR %)
Figure 78 Europe Drug Delivery Technologies Market Share Forecast by Application, 2024 & 2034 (%)
Figure 79 Europe Drug Delivery Technologies Market Forecast by End-users, 2024-2034 (US$ Billion, AGR %)
Figure 80 Europe Drug Delivery Technologies Market Share Forecast by End-users, 2024 & 2034 (%)
Figure 81 Germany Drug Delivery Technologies Market Forecast, 2024-2034 (US$ Billion, AGR %)
Figure 82 UK Drug Delivery Technologies Market Forecast, 2024-2034 (US$ Billion, AGR %)
Figure 83 France Drug Delivery Technologies Market Forecast, 2024-2034 (US$ Billion, AGR %)
Figure 84 Italy Drug Delivery Technologies Market Forecast, 2024-2034 (US$ Billion, AGR %)
Figure 85 Spain Drug Delivery Technologies Market Forecast, 2024-2034 (US$ Billion, AGR %)
Figure 86 Russia Drug Delivery Technologies Market Forecast, 2024-2034 (US$ Billion, AGR %)
Figure 87 Rest of Europe Drug Delivery Technologies Market Forecast, 2024-2034 (US$ Billion, AGR %)
Figure 88 Asia Pacific Drug Delivery Technologies Market Attractiveness Index
Figure 89 Asia Pacific Drug Delivery Technologies Market by Region, 2024, 2029 & 2034 (US$ Billion)
Figure 90 Asia Pacific Drug Delivery Technologies Market Forecast by Country, 2024-2034 (US$ Billion, AGR %)
Figure 91 Asia Pacific Drug Delivery Technologies Market Share Forecast by Country, 2024 & 2034 (%)
Figure 92 Asia Pacific Drug Delivery Technologies Market Forecast by Route of Administration, 2024-2034 (US$ Billion, AGR %)
Figure 93 Asia Pacific Drug Delivery Technologies Market Share Forecast by Route of Administration, 2024 & 2034 (%)
Figure 94 Asia Pacific Drug Delivery Technologies Market Forecast by Application, 2024-2034 (US$ Billion, AGR %)
Figure 95 Asia Pacific Drug Delivery Technologies Market Share Forecast by Application, 2024 & 2034 (%)
Figure 96 Asia Pacific Drug Delivery Technologies Market Forecast by End-users, 2024-2034 (US$ Billion, AGR %)
Figure 97 Asia Pacific Drug Delivery Technologies Market Share Forecast by End-users, 2024 & 2034 (%)
Figure 98 Japan Drug Delivery Technologies Market Forecast, 2024-2034 (US$ Billion, AGR %)
Figure 99 China Drug Delivery Technologies Market Forecast, 2024-2034 (US$ Billion, AGR %)
Figure 100 India Drug Delivery Technologies Market Forecast, 2024-2034 (US$ Billion, AGR %)
Figure 101 Australia Drug Delivery Technologies Market Forecast, 2024-2034 (US$ Billion, AGR %)
Figure 102 South Korea Drug Delivery Technologies Market Forecast, 2024-2034 (US$ Billion, AGR %)
Figure 103 South-East Asia Drug Delivery Technologies Market Forecast, 2024-2034 (US$ Billion, AGR %)
Figure 104 Rest of Asia Pacific Drug Delivery Technologies Market Forecast, 2024-2034 (US$ Billion, AGR %)
Figure 105 Latin America Drug Delivery Technologies Market Attractiveness Index
Figure 106 Latin America Drug Delivery Technologies Market by Region, 2024, 2029 & 2034 (US$ Billion)
Figure 107 Latin America Drug Delivery Technologies Market Forecast by Country, 2024-2034 (US$ Billion, AGR %)
Figure 108 Latin America Drug Delivery Technologies Market Share Forecast by Country, 2024 & 2034 (%)
Figure 109 Latin America Drug Delivery Technologies Market Forecast by Route of Administration, 2024-2034 (US$ Billion, AGR %)
Figure 110 Latin America Drug Delivery Technologies Market Share Forecast by Route of Administration, 2024 & 2034 (%)
Figure 111 Latin America Drug Delivery Technologies Market Forecast by Application, 2024-2034 (US$ Billion, AGR %)
Figure 112 Latin America Drug Delivery Technologies Market Share Forecast by Application, 2024 & 2034 (%)
Figure 113 Latin America Drug Delivery Technologies Market Forecast by End-users, 2024-2034 (US$ Billion, AGR %)
Figure 114 Latin America Drug Delivery Technologies Market Share Forecast by End-users, 2024 & 2034 (%)
Figure 115 Brazil Drug Delivery Technologies Market Forecast, 2024-2034 (US$ Billion, AGR %)
Figure 116 Mexico Drug Delivery Technologies Market Forecast, 2024-2034 (US$ Billion, AGR %)
Figure 117 Rest of Latin America Drug Delivery Technologies Market Forecast, 2024-2034 (US$ Billion, AGR %)
Figure 118 MEA Drug Delivery Technologies Market Attractiveness Index
Figure 119 MEA Drug Delivery Technologies Market by Region, 2024, 2029 & 2034 (US$ Billion)
Figure 120 MEA Drug Delivery Technologies Market Forecast by Country, 2024-2034 (US$ Billion, AGR %)
Figure 121 MEA Drug Delivery Technologies Market Share Forecast by Country, 2024 & 2034 (%)
Figure 122 MEA Drug Delivery Technologies Market Forecast by Route of Administration, 2024-2034 (US$ Billion, AGR %)
Figure 123 MEA Drug Delivery Technologies Market Share Forecast by Route of Administration, 2024 & 2034 (%)
Figure 124 MEA Drug Delivery Technologies Market Forecast by Application, 2024-2034 (US$ Billion, AGR %)
Figure 125 MEA Drug Delivery Technologies Market Share Forecast by Application, 2024 & 2034 (%)
Figure 126 MEA Drug Delivery Technologies Market Forecast by End-users, 2024-2034 (US$ Billion, AGR %)
Figure 127 MEA Drug Delivery Technologies Market Share Forecast by End-users, 2024 & 2034 (%)
Figure 128 GCC Drug Delivery Technologies Market Forecast, 2024-2034 (US$ Billion, AGR %)
Figure 129 South Africa Drug Delivery Technologies Market Forecast, 2024-2034 (US$ Billion, AGR %)
Figure 130 Rest of MEA Drug Delivery Technologies Market Forecast, 2024-2034 (US$ Billion, AGR %)
Figure 131 Johnson & Johnson Services, Inc.: Net Revenue, 2015-2023 (US$ Million, AGR%)
Figure 132 Johnson & Johnson Services, Inc.: Regional Market Shares (%), 2023
Figure 133 Johnson & Johnson Services, Inc.: R&D, 2015-2023 (US$ Million, AGR%)
Figure 134 Novartis AG: Net Revenue, 2015-2023 (US$ Million, AGR%)
Figure 135 Novartis AG: Regional Market Shares (%), 2023
Figure 136 Novartis AG: R&D, 2015-2023 (US$ Million, AGR%)
Figure 137 F. Hoffmann-La Roche Ltd: Net Revenue, 2015-2023 (US$ Million, AGR%)
Figure 138 F. Hoffmann-La Roche Ltd: Regional Market Shares (%), 2023
Figure 139 F. Hoffmann-La Roche Ltd: R&D, 2015-2023 (US$ Million, AGR%)
Figure 140 Pfizer Inc.: Net Revenue, 2015-2023 (US$ Million, AGR%)
Figure 141 Pfizer Inc.: Regional Market Shares (%), 2023
Figure 142 Pfizer Inc.: R&D, 2015-2023 (US$ Million, AGR%)
Figure 143 Bayer AG: Net Revenue, 2015-2022 (US$ Million, AGR%)
Figure 144 Bayer AG: Regional Market Shares (%), 2022
Figure 145 Bayer AG: R&D, 2015-2022 (US$ Million, AGR%)
Figure 146 Becton, Dickinson and Company: Net Revenue, 2015-2023 (US$ Million, AGR%)
Figure 147 Becton, Dickinson and Company: Regional Market Shares (%), 2023
Figure 148 Becton, Dickinson and Company: R&D, 2015-2023 (US$ Million, AGR%)
Figure 149 GSK plc: Net Revenue, 2015-2023 (US$ Million, AGR%)
Figure 150 GSK plc: Regional Market Shares (%), 2023
Figure 151 GSK plc: R&D, 2015-2023 (US$ Million, AGR%)
Figure 152 Merck & Co., Inc.: Net Revenue, 2015-2023 (US$ Million, AGR%)
Figure 153 Merck & Co., Inc.: Regional Market Shares (%), 2023
Figure 154 Merck & Co., Inc.: R&D, 2015-2023 (US$ Million, AGR%)
Figure 155 Sanofi: Net Revenue, 2015-2023 (US$ Million, AGR%)
Figure 156 Sanofi: Regional Market Shares (%), 2023
Figure 157 Sanofi: R&D, 2015-2023 (US$ Million, AGR%)
Figure 158 Amgen Inc.: Net Revenue, 2015-2023 (US$ Million, AGR%)
Figure 159 Amgen Inc.: R&D, 2015-2023 (US$ Million, AGR%)
Figure 160 Amgen Inc.: Regional Market Shares (%), 2023
Figure 161 AbbVie Inc.: Net Revenue, 2015-2023 (US$ Million, AGR%)
Figure 162 AbbVie Inc.: Regional Market Shares (%), 2023
Figure 163 AbbVie Inc.: R&D, 2015-2023 (US$ Million, AGR%)
Figure 164 Gilead Sciences, Inc.: Net Revenue, 2015-2023 (US$ Million, AGR%)
Figure 165 Gilead Sciences, Inc.: R&D, 2015-2023 (US$ Million, AGR%)
Figure 166 Boehringer Ingelheim: Net Revenue, 2015-2022 (US$ Million, AGR%)
Figure 167 Boehringer Ingelheim: Regional Market Shares (%), 2022
Figure 168 AstraZeneca plc: Net Revenue, 2015-2023 (US$ Million, AGR%)
Figure 169 AstraZeneca plc: Regional Market Shares (%), 2023
Figure 170 AstraZeneca plc: R&D, 2015-2022 (US$ Million, AGR%)
Figure 171 Eli Lilly and Company: Net Revenue, 2015-2022 (US$ Million, AGR%)
Figure 172 Eli Lilly and Company: Regional Market Shares (%), 2023
Figure 173 Eli Lilly and Company: R&D, 2015-2022 (US$ Million, AGR%)
Figure 174 Teva Pharmaceuticals Industries Ltd.: Net Revenue, 2015-2022 (US$ Million, AGR%)
Figure 175 Teva Pharmaceuticals Industries Ltd.: Regional Market Shares (%), 2023
Figure 176 Teva Pharmaceuticals Industries Ltd.: R&D, 2015-2022 (US$ Million, AGR%)
Figure 177 Bristol-Myers Squibb: Net Revenue, 2015-2022 (US$ Million, AGR%)
Figure 178 Bristol-Myers Squibb: Regional Market Shares (%), 2023
Figure 179 Bristol-Myers Squibb: R&D, 2015-2022 (US$ Million, AGR%)
Figure 180 Gerresheimer AG: Net Revenue, 2015-2023 (US$ Million, AGR%)
Figure 181 Gerresheimer AG: Regional Market Shares (%), 2023
Figure 182 Boston Scientific Corporation: Net Revenue, 2015-2022 (US$ Million, AGR%)
Figure 183 Boston Scientific Corporation: Regional Market Shares (%), 2023
Figure 184 Boston Scientific Corporation: R&D, 2015-2022 (US$ Million, AGR%)
ページTOPに戻る
本レポートと同じKEY WORD(drug)の最新刊レポート
よくあるご質問
Visiongain社はどのような調査会社ですか?
英国の調査会社ヴィジョンゲイン社(Visiongain)は、通信とエネルギーのほか、自動車や化学・医薬品、金属など、広範な市場を対象に調査を行っています。自動車市場については、市場全般に関する調査のほ... もっと見る
調査レポートの納品までの日数はどの程度ですか?
在庫のあるものは速納となりますが、平均的には 3-4日と見て下さい。
但し、一部の調査レポートでは、発注を受けた段階で内容更新をして納品をする場合もあります。
発注をする前のお問合せをお願いします。
注文の手続きはどのようになっていますか?
1)お客様からの御問い合わせをいただきます。
2)見積書やサンプルの提示をいたします。
3)お客様指定、もしくは弊社の発注書をメール添付にて発送してください。
4)データリソース社からレポート発行元の調査会社へ納品手配します。
5) 調査会社からお客様へ納品されます。最近は、pdfにてのメール納品が大半です。
お支払方法の方法はどのようになっていますか?
納品と同時にデータリソース社よりお客様へ請求書(必要に応じて納品書も)を発送いたします。
お客様よりデータリソース社へ(通常は円払い)の御振り込みをお願いします。
請求書は、納品日の日付で発行しますので、翌月最終営業日までの当社指定口座への振込みをお願いします。振込み手数料は御社負担にてお願いします。
お客様の御支払い条件が60日以上の場合は御相談ください。
尚、初めてのお取引先や個人の場合、前払いをお願いすることもあります。ご了承のほど、お願いします。
データリソース社はどのような会社ですか?
当社は、世界各国の主要調査会社・レポート出版社と提携し、世界各国の市場調査レポートや技術動向レポートなどを日本国内の企業・公官庁及び教育研究機関に提供しております。
世界各国の「市場・技術・法規制などの」実情を調査・収集される時には、データリソース社にご相談ください。
お客様の御要望にあったデータや情報を抽出する為のレポート紹介や調査のアドバイスも致します。
|
|

