炎症性腸疾患(IBD)治療薬市場レポート:2024-2034
Inflammatory Bowel Diseases (IBD) Drugs Market Report 2024-2034
レポート詳細
炎症性腸疾患(IBD)治療薬市場レポート 2024-2034年 :本レポートは、新たな収益機会を求める著名企業にとって不可欠であり、業界とその固有のダイナミクスに関する理解を深めることを... もっと見る
※上記価格は部署ライセンス(Departmental licence)価格です。
その他の価格についてはデータリソースまでお問合せください。
日本語のページは自動翻訳を利用し作成しています。
実際のレポートは英文のみでご納品いたします。

|
サマリー
レポート詳細
炎症性腸疾患(IBD)治療薬市場レポート 2024-2034年:本レポートは、新たな収益機会を求める著名企業にとって不可欠であり、業界とその固有のダイナミクスに関する理解を深めることを目的としています。本レポートは、様々な分野への多角化や新たな地域への事業展開に関心のある企業にとって貴重な洞察を提供します。
IBD罹患率の上昇がIBD治療薬市場の需要を押し上げる
炎症性腸疾患(IBD)の世界的な罹患率と有病率は増加しており、先進国と発展途上国の間で顕著な差が見られる。クローン病や潰瘍性大腸炎は、欧米型の食生活や生活習慣に起因する可能性があるため、先進国でより一般的となっている。急速な都市化もIBDを含む自己免疫疾患の増加に寄与している。欧米では罹患率は安定しているように見えるが、発展途上国では増加しており、これはおそらく欧米化と疾患に対する意識の向上によるものであろう。最近の研究では、特に以前は罹患率が低かった地域で罹患率が上昇している。ヨーロッパでの罹患率が最も高く、次いで北米、アジア・中東となっている。EFCCA(European Federation of Crohn´s and Ulcerative Colitis Associations:欧州クローン性大腸炎・潰瘍性大腸炎協会連合)によると、2022年には世界で1000万人のIBD患者がいるという。一方、CCFA(米国クローン病・大腸炎財団)によると、米国では毎年7万人が新たにIBDと診断され、約8万人の子供がIBDに罹患していると推定されている。IBDは約160万人のアメリカ人が罹患していると報告されており、そのほとんどが35歳以前に診断されている。
遺伝的要因も一役買っているが、罹患率の変化は環境要因の重要性を強調している。社会経済的な変化と西洋的なライフスタイルの普及がこの増加に寄与している。腸管外症状や大腸癌のような合併症は患者にとって重大なリスクであり、治療による長期的な影響はまだ解明されていない。消化器内科クリニックは、より若いIBD患者と併存疾患を持つ高齢化した患者の両方を管理する課題に直面することになり、慎重な管理戦略が必要となる。
IBD治療薬開発における大きな成功が市場需要を牽引
これまで、炎症性腸疾患(IBD)の診断率は低く、特に発展途上国に影響を及ぼしていた。先進国でもIBDの診断は難しく、多くの患者にとって誤診が長期化していた。しかし、最近の診断法の改善により患者層が拡大し、その結果、治療に対する需要が高まり、市場収益が増加している。
クローン病(CD)および潰瘍性大腸炎(UC)の治療に関する無作為臨床試験が、詳細な疫学調査とともに急速に行われている。当初は様々な議論があったが、現在では、IBDは先進国の患者を中心に発症し、その罹患率は増加傾向にあることが明らかになっている。新しい技術の出現により、IBD治療におけるパラダイムシフトが報告されている。最近の主な動きとしては、例えば新薬の発売や承認が挙げられる:
ファイザー社は2024年2月、欧州委員会(EC)が16歳以上の中等度から重度の活動性を有する潰瘍性大腸炎(UC)患者を対象としたVELSIPITY(一般名:エトラシモド)の販売承認を欧州連合内で取得したことを発表した。この承認は、従来の治療法または生物学的製剤で効果不十分、効果消失、不耐容を示した患者にも適用されます。
2024年3月、セルトリオンUSAはインフリキシマブの皮下投与(SC)バージョンであるZYMFENTRA(infliximab-dyyb)を導入し、治療の選択肢を大きく前進させた。ZYMFENTRAは、2023年に米国食品医薬品局(FDA)から承認された唯一の皮下インフリキシマブである。
2023年7月、米国セルトリオン社は、高濃度(100mg/mL)かつクエン酸塩を含まない製剤を代替選択肢として患者に提供するユフリマ(アダリムマブ-aaty)の発売を発表した。ユフリマは、関節リウマチ、若年性特発性関節炎、関節症性乾癬、強直性脊椎炎、クローン病、潰瘍性大腸炎、尋常性乾癬、膿疱性汗腺炎の8疾患の治療薬として承認されている。
さらに、生検を伴う光ファイバー大腸内視鏡検査と回腸大腸内視鏡検査は、UCとCDの診断を世界的に変容させ、特に疾患の範囲と重症度を定義し、その結果、患者がIBDを管理・コントロールするのに役立っている。
市場調査レポートを購入する前にすべき質問とは?
-
炎症性腸疾患治療薬市場はどのように発展しているのか?
-
炎症性腸疾患治療薬市場の促進要因と阻害要因は何か?
-
炎症性腸疾患治療薬の各サブマーケットは予測期間中にどのように成長し、2034年にはどれくらいの売上を占めるようになるのか?
-
2024年から2034年にかけて、炎症性腸疾患治療薬の各サブマーケットの市場シェアはどのように推移するのか?
2024年から2034年にかけて、市場全体を牽引する主な要因は何か?
-
主要な炎症性腸疾患治療薬市場はマクロ経済の動きに幅広く追随するのか、それとも個々の国市場が他を凌駕するのか?
-
2034年までに各国市場のシェアはどのように変化し、どの地域が2034年の市場をリードするのか。
-
主要プレーヤーと予測期間中の見通しは?
-
これらの主要企業の炎症性腸疾患治療薬プロジェクトとは?
-
2024年から2034年の間に、業界はどのように発展するのか?炎症性疾患の影響とは?
-
腸疾患治療薬のプロジェクトは、現在、そして今後10年間に実施されるのか?
-
炎症性腸疾患治療薬市場をさらに拡大するために、製品の商業化の必要性は高まっているか?
-
炎症性腸疾患治療薬市場はどこへ向かっているのか?
-
新商品や新サービスに最適な投資方法とは?
-
企業を新たな成長軌道に乗せ、C-suiteに移行させるための重要な展望とは?
このことが炎症性腸疾患治療薬市場に現在、そして今後10年間、どのような影響を与えるかを知る必要がある:
-
318ページにわたるレポートには、112の表と192の図表が掲載されている。
-
本レポートでは、業界における主要な有利分野を取り上げているため、今すぐターゲットを絞ることができる。
-
世界、地域、国の売上高と成長に関する詳細な分析が含まれている。
-
競合他社が成功した主なトレンド、変化、収益予測をハイライトします。
本レポートは、炎症性腸疾患治療薬市場が今後10年間にどのように発展していくのか、またCOVID-19の景気後退と好転の変動に合わせてどのように発展していくのかをお伝えします。この市場は過去10年間のどの時点よりも今が重要である。
2034年までの予測やその他の分析から、商業的な展望が明らかになる
-
2034年までの収益予測に加え、最近の実績、成長率、市場シェアも提供している。
-
ビジネスの展望や展開など、独自の分析が掲載されている。
-
定性的分析(市場ダイナミクス、促進要因、機会、阻害要因、課題を含む)、コスト構造、炎症性腸疾患治療薬の価格上昇の影響、最近の動向をご覧いただけます。
本レポートには、COVID-19が業界と貴社にどのような影響を与えるかについてのデータ分析と貴重な洞察が含まれている。本レポートでは、COVID-19の4つの回復パターンとその影響、すなわち「V」、「L」、「W」、「U」について論じている。
レポート対象セグメント
適応症の見通し
投与経路の見通し
流通チャネルの見通し
医薬品クラスの見通し
-
TNFα遮断薬
-
インテグリン遮断薬
-
インターロイキン阻害剤
-
JAK阻害剤
-
S1Psモジュレーターとその他
医薬品の見通し
-
チムジア
-
エンティビオ
-
ヒュミラ
-
リンボック
-
スカイリッジ
-
レミケード
-
シンポニー
-
ステラーラ
-
その他
世界市場全体と各分野の売上予測に加え、5つの地域と21の主要国市場の売上予測も掲載しています:
北米
欧州
-
ドイツ
-
英国
-
フランス
-
スペイン
-
イタリア
-
その他の欧州
アジア太平洋
-
中国
-
日本
-
インド
-
オーストラリア
-
韓国
-
その他のアジア太平洋
ラテンアメリカ
MEA
本レポートには、炎症性腸疾患治療薬市場における主要企業の2024年から2034年までのプロファイルも含まれており、これらの企業の事業のこのセグメントに焦点を当てている。
報告書に掲載されている主要企業
-
AbbVie
-
Biogen
-
Celltrion Healthcare Co.,Ltd.
-
F. Hoffmann-La Roche Ltd
-
Ferring B.V.
-
Johnsons & Johnsons
-
Novartis AG
-
Pfizer
-
Takeda Pharmaceutical Company Limited
-
UCB S.A.
2024年から2034年までの炎症性腸疾患治療薬市場全体の世界売上高(金額ベース)は、2024年に290.9億米ドルを突破する。2034年まで力強い収益成長を予測。当調査では、最も大きな可能性を秘めた企業を特定しています。彼らの能力、進歩、商業的展望を発見し、あなたが一歩先を行くのを支援します。
炎症性腸疾患治療薬市場、2024-2034年レポートはどのようにお役に立ちますか?
要約すると、310ページを超えるこのレポートは、以下の知識を提供する:
-
炎症性腸疾患治療薬市場の2034年までの収益予測、2024年〜2034年市場 - 医薬品、薬剤クラス、適応症、投与経路の各予測を世界および地域レベルで掲載 - 業界の展望を発見し、投資と収益に最も有利な場所を見つけることができます。
-
5つの地域と21の主要国市場の2034年までの収益予測 - 北米、欧州、アジア太平洋、ラテンアメリカ、MEAの炎症性腸疾患治療薬市場の2024年から2034年までの予測をご覧ください。また、米国、カナダ、メキシコ、ブラジル、ドイツ、フランス、英国、イタリア、中国、インド、日本、オーストラリアなどの著名経済圏の市場も予測しています。
-
既存企業および市場参入を目指す企業の展望 - 炎症性腸疾患治療薬市場に関わる主要企業15社の企業プロファイルを含む、2024年から2034年までの市場。
独自の予測による定量的・定性的分析をご覧ください。私たちのレポートだけに含まれる情報を入手し、貴重なビジネスインテリジェンスで情報を得ることができます。
他にはない情報
私たちの新しいレポートがあれば、知識に遅れをとったり、チャンスを逃したりする可能性が低くなります。弊社のレポートが貴社の調査、分析、意思決定にどのように役立つかをご覧ください。Visiongainの調査は、炎症性腸疾患治療薬市場、2024年から2034年、市場をリードする企業の商業分析を必要とするすべての人のためのものです。データ、トレンド、予測をご覧いただけます。
ページTOPに戻る
目次
目次
1 レポート概要
1.1 研究の目的
1.2 炎症性腸疾患治療薬市場の紹介
1.3 本レポートの内容
1.4 本レポートを読むべき理由
1.5 本分析レポートが回答する主な質問
1.6 本レポートは誰のためのものか?
1.7 方法論
1.7.1 市場の定義
1.7.2 市場評価・予測手法
1.7.3 データの検証
1.7.3.1 一次調査
1.7.3.2 セカンダリーリサーチ
1.8 よくある質問(FAQ)
1.9 Visiongainの関連レポート
1.10 Visiongainについて
2 エグゼクティブ・サマリー
3 市場概要
3.1 主要な調査結果
3.2 市場ダイナミクス
3.2.1 市場牽引要因
3.2.1.1 IBD罹患率の上昇がIBD治療薬市場の需要を押し上げる
3.2.1.2 IBD治療薬開発における大きな成功が市場需要を牽引
3.2.1.3 炎症性腸疾患に対する経口薬物送達の進歩
3.2.2 市場抑制要因
3.2.2.1 疾患病因の理解不足
3.2.2.2 コンプライアンス?頻繁な投与は不便
3.2.2.3 IBD治療薬の限界 ?副作用プロファイル
3.2.3 市場機会
3.2.3.1 生物学的製剤の進歩が市場を大きく牽引する
3.2.3.2 アジア市場におけるIBD治療薬の機会増加
3.3 COVID-19の影響分析
3.4 ポーターのファイブフォース分析
3.4.1 サプライヤーの交渉力
3.4.2 買い手の交渉力
3.4.3 競争相手のライバル関係
3.4.4 代替品による脅威
3.4.5 新規参入企業の脅威
3.5 PEST分析
4 炎症性腸疾患治療薬市場分析:適応症別
4.1 主な調査結果
4.2 適応症セグメント 市場魅力度指数
4.3 炎症性腸疾患治療薬の適応症別市場規模推定と予測
4.4 クローン病
4.4.1 2024〜2034年の地域別市場規模(US$ Billion)
4.4.2 地域別市場シェア、2024年・2034年(%)
4.5 潰瘍性大腸炎
4.5.1 2024〜2034年の地域別市場規模(US$ Billion)
4.5.2 地域別市場シェア、2024年・2034年(%)
5 炎症性腸疾患治療薬市場分析:投与経路別
5.1 主要調査結果
5.2 適応症セグメント 市場魅力度指数
5.3 炎症性腸疾患治療薬の投与経路別市場規模推定と予測
5.4 経口剤
5.4.1 2024〜2034年の地域別市場規模(US$ Billion)
5.4.2 地域別市場シェア、2024年・2034年(%)
5.5 非経口剤
5.5.1 2024〜2034年の地域別市場規模(US$ Billion)
5.5.2 地域別市場シェア、2024年・2034年(%)
5.6 直腸
5.6.1 2024〜2034年の地域別市場規模(US$ Billion)
5.6.2 地域別市場シェア、2024年・2034年(%)
6 炎症性腸疾患治療薬市場分析:流通チャネル別
6.1 主な調査結果
6.2 適応症セグメント 市場魅力度指数
6.3 流通チャネル別炎症性腸疾患治療薬市場規模推定と予測
6.4 病院薬局
6.4.1 2024〜2034年の地域別市場規模(US$ Billion)
6.4.2 地域別市場シェア、2024年・2034年(%)
6.5 小売薬局
6.5.1 2024〜2034年の地域別市場規模(US$ Billion)
6.5.2 地域別市場シェア、2024年・2034年(%)
6.6 電子商取引薬局
6.6.1 2024〜2034年の地域別市場規模(US$ Billion)
6.6.2 地域別市場シェア、2024年・2034年(%)
6.7 その他
6.7.1 2024〜2034年の地域別市場規模(US$ Billion)
6.7.2 地域別市場シェア、2024年・2034年(%)
7 炎症性腸疾患治療薬市場分析:薬効別
7.1 主要な調査結果
7.2 薬剤クラス別セグメント 市場魅力度指数
7.3 薬剤クラス別炎症性腸疾患治療薬市場規模の推定と予測
7.4 TNFα遮断薬
7.4.1 2024〜2034年の地域別市場規模(US$ Billion)
7.4.2 地域別市場シェア、2024年・2034年(%)
7.5 インテグリン遮断薬
7.5.1 2024〜2034年の地域別市場規模(US$ Billion)
7.5.2 地域別市場シェア、2024年・2034年(%)
7.6 インターロイキン阻害剤
7.6.1 2024〜2034年の地域別市場規模(US$ Billion)
7.6.2 地域別市場シェア、2024年・2034年(%)
7.7 JAK阻害剤
7.7.1 2024〜2034年の地域別市場規模(US$ Billion)
7.7.2 地域別市場シェア、2024年・2034年(%)
7.8 S1Psモジュレーターおよびその他
7.8.1 2024〜2034年の地域別市場規模(US$ Billion)
7.8.2 地域別市場シェア、2024年・2034年(%)
8 炎症性腸疾患治療薬市場分析:薬剤別
8.1 主要な調査結果
8.2 医薬品セグメント 市場魅力度指数
8.3 炎症性腸疾患治療薬の薬剤別市場規模推定と予測
8.4 シムジア
8.4.1 2024〜2034年の地域別市場規模(US$ Billion)
8.4.2 地域別市場シェア、2024年・2034年(%)
8.5 エンティビオ
8.5.1 2024〜2034年の地域別市場規模(US$ Billion)
8.5.2 地域別市場シェア、2024年・2034年(%)
8.6 ヒュミラ
8.6.1 2024〜2034年の地域別市場規模(US$ Billion)
8.6.2 地域別市場シェア、2024年・2034年(%)
8.7 リンボック
8.7.1 2024年~2034年の地域別市場規模(US$ Billion)
8.7.2 地域別市場シェア、2024年・2034年(%)
8.8 スカイリッジ
8.8.1 2024年~2034年の地域別市場規模(US$ Billion)
8.8.2 地域別市場シェア、2024年・2034年(%)
8.9 レミケード
8.9.1 2024〜2034年の地域別市場規模(US$ Billion)
8.9.2 地域別市場シェア、2024年・2034年(%)
8.10 シンポニー
8.10.1 2024〜2034年の地域別市場規模(US$ Billion)
8.10.2 地域別市場シェア、2024年・2034年(%)
8.11 ステラーラ
8.11.1 2024〜2034年の地域別市場規模(US$ Billion)
8.11.2 地域別市場シェア、2024年・2034年(%)
8.12 その他
8.12.1 2024〜2034年の地域別市場規模(US$ Billion)
8.12.2 地域別市場シェア、2024年・2034年(%)
9 炎症性腸疾患治療薬市場分析:地域別
9.1 主要な調査結果
9.2 地域別市場規模の推定と予測
10 北米の炎症性腸疾患治療薬市場分析
10.1 主要な調査結果
10.2 北米の炎症性腸疾患治療薬市場魅力度指数
10.3 北米の炎症性腸疾患治療薬国別市場、2024年、2029年、2034年(US$ Billion)
10.4 北米の炎症性腸疾患治療薬市場規模推定と予測:国別
10.5 北米の炎症性腸疾患治療薬市場規模推定と予測:適応症別
10.6 北米の炎症性腸疾患治療薬市場規模推定と予測:投与経路別
10.7 北米の炎症性腸疾患治療薬市場規模推定と予測:流通経路別
10.8 北米の炎症性腸疾患治療薬市場規模推定と予測:薬効分類別
10.9 北米の炎症性腸疾患治療薬市場規模推定と予測:薬剤別
10.10 アメリカの炎症性腸疾患治療薬市場分析
10.11 カナダの炎症性腸疾患治療薬市場分析
11 欧州炎症性腸疾患治療薬の市場分析
11.1 主要な調査結果
11.2 欧州炎症性腸疾患治療薬市場魅力度指数
11.3 欧州の炎症性腸疾患治療薬国別市場、2024年、2029年、2034年(US$ Billion)
11.4 欧州の炎症性腸疾患治療薬市場規模推定と予測:国別
11.5 欧州の炎症性腸疾患治療薬市場規模推定と予測:適応症別
11.6 欧州の炎症性腸疾患治療薬市場規模推定と予測:投与経路別
11.7 欧州の炎症性腸疾患治療薬市場規模推定と予測:流通経路別
11.8 欧州の炎症性腸疾患治療薬市場規模推定と予測:薬効分類別
11.9 欧州の炎症性腸疾患治療薬市場規模推定と予測:薬効別
11.10 ドイツの炎症性腸疾患治療薬市場分析
11.11 フランスの炎症性腸疾患治療薬市場分析
11.12 イギリスの炎症性腸疾患治療薬市場分析
11.13 イタリアの炎症性腸疾患治療薬市場分析
11.14 スペインの炎症性腸疾患治療薬市場分析
11.15 その他の欧州の炎症性腸疾患治療薬市場分析
12 アジア太平洋地域の炎症性腸疾患治療薬市場分析
12.1 主要な調査結果
12.2 アジア太平洋地域の炎症性腸疾患治療薬市場魅力度指数
12.3 アジア太平洋地域の炎症性腸疾患治療薬国別市場、2024年、2029年、2034年(US$ Billion)
12.4 アジア太平洋地域の炎症性腸疾患治療薬市場規模推定と予測:国別
12.5 アジア太平洋地域の炎症性腸疾患治療薬市場規模推定と予測:適応症別
12.6 アジア太平洋地域の炎症性腸疾患治療薬市場規模推定と予測:投与経路別
12.7 アジア太平洋地域の炎症性腸疾患治療薬市場規模推定と予測:流通経路別
12.8 アジア太平洋地域の炎症性腸疾患治療薬市場規模推定と予測:薬効分類別
12.9 アジア太平洋地域の炎症性腸疾患治療薬市場規模推定と予測:薬効別
12.10 日本の炎症性腸疾患治療薬市場分析
12.11 中国の炎症性腸疾患治療薬市場分析
12.12 インドの炎症性腸疾患治療薬市場分析
12.13 オーストラリアの炎症性腸疾患治療薬市場分析
12.14 韓国の炎症性腸疾患治療薬市場分析
12.15 その他のアジア太平洋地域の炎症性腸疾患治療薬市場分析
13 ラテンアメリカの炎症性腸疾患治療薬の市場分析
13.1 主要な調査結果
13.2 ラテンアメリカの炎症性腸疾患治療薬市場魅力度指数
13.3 ラテンアメリカの炎症性腸疾患治療薬国別市場、2024年、2029年、2034年(US$ Billion)
13.4 ラテンアメリカの炎症性腸疾患治療薬市場規模推定と予測:国別
13.5 ラテンアメリカの炎症性腸疾患治療薬市場規模推定と予測:適応症別
13.6 ラテンアメリカの炎症性腸疾患治療薬市場規模推定と予測:投与経路別
13.7 ラテンアメリカの炎症性腸疾患治療薬市場規模推定と予測:流通経路別
13.8 ラテンアメリカの炎症性腸疾患治療薬市場規模推定と予測:薬効分類別
13.9 ラテンアメリカの炎症性腸疾患治療薬市場規模推定と予測:薬効別
13.10 ブラジルの炎症性腸疾患治療薬市場分析
13.11 メキシコの炎症性腸疾患治療薬市場分析
13.12 その他のラテンアメリカの炎症性腸疾患治療薬市場分析
14 中東・アフリカの炎症性腸疾患治療薬市場分析
14.1 主要な調査結果
14.2 中東・アフリカ炎症性腸疾患治療薬市場魅力度指数
14.3 中東・アフリカの炎症性腸疾患治療薬国別市場、2024年、2029年、2034年(US$ Billion)
14.4 中東・アフリカ炎症性腸疾患治療薬市場規模推定と予測:国別
14.5 中東・アフリカ炎症性腸疾患治療薬市場規模推定と予測:適応症別
14.6 中東・アフリカ炎症性腸疾患治療薬市場規模推定と予測:投与経路別
14.7 中東・アフリカ炎症性腸疾患治療薬市場規模推定と予測:流通経路別
14.8 中東・アフリカ炎症性腸疾患治療薬市場規模推定と予測:薬効分類別
14.9 中東・アフリカ炎症性腸疾患治療薬市場規模推定と予測:薬効別
14.10 GCCの炎症性腸疾患治療薬市場分析
14.11 南アフリカの炎症性腸疾患治療薬市場分析
14.12 その他のMEAの炎症性腸疾患治療薬市場分析
15 会社概要
15.1 競争環境、2023年
15.2 戦略的展望
15.3 AbbVie
15.3.1 会社概要
15.3.2 会社概要
15.3.3 財務分析
15.3.3.1 純収入、2018-2022年
15.3.3.2 R&D、2018-2022年
15.3.3.3 地域市場シェア、2022年
15.3.4 製品ベンチマーク
15.3.5 戦略的展望
15.4 Johnsons & Johnsons
15.4.1 会社概要
15.4.2 会社概要
15.4.3 財務分析
15.4.3.1 純収入、2018-2022年
15.4.3.2 地域市場シェア、2022年
15.4.4 製品ベンチマーク
15.4.5 戦略的展望
15.5 Takeda Pharmaceutical Company Limited
15.5.1 会社概要
15.5.2 会社概要
15.5.3 財務分析
15.5.3.1 純収入、2019-2023年
15.5.3.2 R&D、2019-2023年
15.5.3.3 地域市場シェア、2022年
15.5.4 製品ベンチマーク
15.5.5 戦略的展望
15.6 Pfizer
15.6.1 会社概要
15.6.2 会社概要
15.6.3 財務分析
15.6.3.1 純収入、2018-2022年
15.6.3.2 R&D、2018年〜2022年
15.6.3.3 地域市場シェア、2022年
15.6.4 製品ベンチマーク
15.6.5 戦略的展望
15.7 Novartis AG
15.7.1 会社概要
15.7.2 会社概要
15.7.3 財務分析
15.7.3.1 純収入、2018-2022年
15.7.3.2 R&D、2018-2022年
15.7.3.3 地域市場シェア、2022年
15.7.4 製品ベンチマーク
15.7.5 戦略的展望
15.8 UCB S.A.
15.8.1 会社概要
15.8.2 会社概要
15.8.3 財務分析
15.8.3.1 純収入、2019-2023年
15.8.3.2 R&D、2019-2023年
15.8.3.3 地域市場シェア、2023年
15.8.4 製品ベンチマーク
15.8.5 戦略的展望
15.9 Biogen
15.9.1 会社概要
15.9.2 会社概要
15.9.3 財務分析
15.9.3.1 純収入、2019-2023年
15.9.3.2 売上高、2019-2023年
15.9.4 製品ベンチマーク
15.9.5 戦略的展望
15.10 F. Hoffmann-La Roche Ltd
15.10.1 会社概要
15.10.2 会社概要
15.10.3 財務分析
15.10.3.1 純収入、2018-2022年
15.10.3.2 売上高、2018-2022年
15.10.4 製品ベンチマーク
15.11 Celltrion Corporation
15.11.1 会社概要
15.11.2 会社概要
15.11.3 財務分析
15.11.3.1 純収入、2018-2022年
15.11.3.2 R&D、2018年~2022年
15.11.4 製品ベンチマーク
15.11.5 戦略的展望
15.12 Ferring B.V.
15.12.1 会社概要
15.12.2 会社概要
15.12.3 製品ベンチマーク
15.12.4 戦略的展望
16 結論と提言
16.1 Visiongainからの結びの言葉
16.2 市場プレイヤーへの提言
ページTOPに戻る
図表リスト
表の一覧
Table 1 Inflammatory Bowel Diseases Drugs Market Snapshot, 2024 & 2034 (US$ Billion, CAGR %)
Table 2 Inflammatory Bowel Diseases Drugs Market Forecast by Region, 2024-2034 (US$ Billion, AGR%, CAGR%): “V” Shaped Recovery
Table 3 Inflammatory Bowel Diseases Drugs Market Forecast by Region, 2024-2034 (US$ Billion, AGR%, CAGR%): “U” Shaped Recovery
Table 4 Inflammatory Bowel Diseases Drugs Market Forecast by Region, 2024-2034 (US$ Billion, AGR%, CAGR%): “W” Shaped Recovery
Table 5 Inflammatory Bowel Diseases Drugs Market Forecast by Region, 2024-2034 (US$ Billion, AGR%, CAGR%): “L” Shaped Recovery
Table 6 Inflammatory Bowel Diseases Drugs Market Forecast by Indication, 2024-2034 (US$ Billion, AGR%, CAGR %)
Table 7 Crohn’s Disease Segment Market Forecast by Region, 2024-2034 (US$ Billion, AGR%, CAGR %)
Table 8 Ulcerative Colitis Segment Market Forecast by Region, 2024-2034 (US$ Billion, AGR%, CAGR%)
Table 9 Inflammatory Bowel Diseases Drugs Market Forecast by Route of Administration, 2024-2034 (US$ Billion, AGR%, CAGR%)
Table 10 Oral Segment Market Forecast by Region, 2024-2034 (US$ Billion, AGR%, CAGR%)
Table 11 Parenteral Segment Market Forecast by Region, 2024-2034 (US$ Billion, AGR%, CAGR%)
Table 12 Rectal Segment Market Forecast by Region, 2024-2034 (US$ Billion, AGR%, CAGR%)
Table 13 Inflammatory Bowel Diseases Drugs Market Forecast by Distribution Channel, 2024-2034 (US$ Billion, AGR%, CAGR%)
Table 14 Hospital Pharmacy Segment Market Forecast by Region, 2024-2034 (US$ Billion, AGR%, CAGR%)
Table 15 Retail Pharmacy Segment Market Forecast by Region, 2024-2034 (US$ Billion, AGR%, CAGR%)
Table 16 E-commerce Pharmacy Segment Market Forecast by Region, 2024-2034 (US$ Billion, AGR%, CAGR%)
Table 17 Others Segment Market Forecast by Region, 2024-2034 (US$ Billion, AGR%, CAGR%)
Table 18 Inflammatory Bowel Diseases Drugs Market Forecast by Drug Class, 2024-2034 (US$ Billion, AGR%, CAGR%)
Table 19 TNF-alpha Blockers Segment Market Forecast by Region, 2024-2034 (US$ Billion, AGR%, CAGR%)
Table 20 Integrin Blockers Segment Market Forecast by Region, 2024-2034 (US$ Billion, AGR%, CAGR%)
Table 21 Interleukin Inhibitors Segment Market Forecast by Region, 2024-2034 (US$ Billion, AGR%, CAGR%)
Table 22 JAK inhibitors Segment Market Forecast by Region, 2024-2034 (US$ Billion, AGR%, CAGR%)
Table 23 S1Ps Modulators and Others Segment Market Forecast by Region, 2024-2034 (US$ Billion, AGR%, CAGR%)
Table 24 Inflammatory Bowel Diseases Drugs Market Forecast by Drugs, 2024-2034 (US$ Billion, AGR%, CAGR%)
Table 25 Cimzia Blockers Segment Market Forecast by Region, 2024-2034 (US$ Billion, AGR%, CAGR%)
Table 26 Entyvio Segment Market Forecast by Region, 2024-2034 (US$ Billion, AGR%, CAGR%)
Table 27 Humira Segment Market Forecast by Region, 2024-2034 (US$ Billion, AGR%, CAGR%)
Table 28 Rinvoq Segment Market Forecast by Region, 2024-2034 (US$ Billion, AGR%, CAGR%)
Table 29 Skyrizi Segment Market Forecast by Region, 2024-2034 (US$ Billion, AGR%, CAGR%)
Table 30 Remicade Segment Market Forecast by Region, 2024-2034 (US$ Billion, AGR%, CAGR%)
Table 31 Simponi Segment Market Forecast by Region, 2024-2034 (US$ Billion, AGR%, CAGR%)
Table 32 Stelara Segment Market Forecast by Region, 2024-2034 (US$ Billion, AGR%, CAGR%)
Table 33 Others Segment Market Forecast by Region, 2024-2034 (US$ Billion, AGR%, CAGR%)
Table 34 Inflammatory Bowel Diseases Drugs Market Forecast by Region, 2024-2034 (US$ Billion, AGR%, CAGR%)
Table 35 North America Inflammatory Bowel Diseases Drugs Market Forecast by Country, 2024-2034 (US$ Billion, AGR%, CAGR%)
Table 36 North America Inflammatory Bowel Diseases Drugs Market Forecast by Indication, 2024-2034 (US$ Billion, AGR%, CAGR%)
Table 37 North America Inflammatory Bowel Diseases Drugs Market Forecast by Route of Administration, 2024-2034 (US$ Billion, AGR%, CAGR%)
Table 38 North America Inflammatory Bowel Diseases Drugs Market Forecast by Distribution Channel, 2024-2034 (US$ Billion, AGR%, CAGR%)
Table 39 North America Inflammatory Bowel Diseases Drugs Market Forecast by Drug Class, 2024-2034 (US$ Billion, AGR%, CAGR%)
Table 40 North America Inflammatory Bowel Diseases Drugs Market Forecast by Drugs, 2024-2034 (US$ Billion, AGR%, CAGR%)
Table 41 U.S. Inflammatory Bowel Diseases Drugs Market Forecast, 2024-2034 (US$ Billion, AGR%, CAGR%)
Table 42 Canada Inflammatory Bowel Diseases Drugs Market Forecast, 2024-2034 (US$ Billion, AGR%, CAGR%)
Table 43 Europe Inflammatory Bowel Diseases Drugs Market Forecast by Country, 2024-2034 (US$ Billion, AGR%, CAGR%)
Table 44 Europe Inflammatory Bowel Diseases Drugs Market Forecast by Indication, 2024-2034 (US$ Billion, AGR%, CAGR%)
Table 45 Europe Inflammatory Bowel Diseases Drugs Market Forecast by Route of Administration, 2024-2034 (US$ Billion, AGR%, CAGR%)
Table 46 Europe Inflammatory Bowel Diseases Drugs Market Forecast by Distribution Channel, 2024-2034 (US$ Billion, AGR%, CAGR%)
Table 47 Europe Inflammatory Bowel Diseases Drugs Market Forecast by Drug Class, 2024-2034 (US$ Billion, AGR%, CAGR%)
Table 48 Europe Inflammatory Bowel Diseases Drugs Market Forecast by Drugs, 2024-2034 (US$ Billion, AGR%, CAGR%)
Table 49 Germany Inflammatory Bowel Diseases Drugs Market Forecast, 2024-2034 (US$ Billion, AGR%, CAGR%)
Table 50 France Inflammatory Bowel Diseases Drugs Market Forecast, 2024-2034 (US$ Billion, AGR%, CAGR%)
Table 51 UK Inflammatory Bowel Diseases Drugs Market Forecast, 2024-2034 (US$ Billion, AGR%, CAGR%)
Table 52 Italy Inflammatory Bowel Diseases Drugs Market Forecast, 2024-2034 (US$ Billion, AGR%, CAGR%)
Table 53 Spain Inflammatory Bowel Diseases Drugs Market Forecast, 2024-2034 (US$ Billion, AGR%, CAGR%)
Table 54 Rest of Europe Inflammatory Bowel Diseases Drugs Market Forecast, 2024-2034 (US$ Billion, AGR%, CAGR%)
Table 55 Asia Pacific Vaccine Contract Manufacturing Market Forecast by Country, 2024-2034 (US$ Billion, AGR%, CAGR%)
Table 56 Asia Pacific Inflammatory Bowel Diseases Drugs Market Forecast by Indication, 2024-2034 (US$ Billion, AGR%, CAGR%)
Table 57 Asia Pacific Inflammatory Bowel Diseases Drugs Market Forecast by Route of Administration, 2024-2034 (US$ Billion, AGR%, CAGR%)
Table 58 Asia Pacific Inflammatory Bowel Diseases Drugs Market Forecast by Distribution Channel, 2024-2034 (US$ Billion, AGR%, CAGR%)
Table 59 Asia Pacific Inflammatory Bowel Diseases Drugs Market Forecast by Drug Class, 2024-2034 (US$ Billion, AGR%, CAGR%)
Table 60 Asia Pacific Inflammatory Bowel Diseases Drugs Market Forecast by Drugs, 2024-2034 (US$ Billion, AGR%, CAGR%)
Table 61 Japan Inflammatory Bowel Diseases Drugs Market Forecast, 2024-2034 (US$ Billion, AGR%, CAGR%)
Table 62 China Inflammatory Bowel Diseases Drugs Market Forecast, 2024-2034 (US$ Billion, AGR%, CAGR%)
Table 63 India Inflammatory Bowel Diseases Drugs Market Forecast, 2024-2034 (US$ Billion, AGR%, CAGR%)
Table 64 Australia Inflammatory Bowel Diseases Drugs Market Forecast, 2024-2034 (US$ Billion, AGR%, CAGR%)
Table 65 South Korea Inflammatory Bowel Diseases Drugs Market Forecast, 2024-2034 (US$ Billion, AGR%, CAGR%)
Table 66 Rest of Asia Pacific Inflammatory Bowel Diseases Drugs Market Forecast, 2024-2034 (US$ Billion, AGR%, CAGR%)
Table 67 Latin America Inflammatory Bowel Diseases Drugs Market Forecast by Country, 2024-2034 (US$ Billion, AGR%, CAGR%)
Table 68 Latin America Inflammatory Bowel Diseases Drugs Market Forecast by Indication, 2024-2034 (US$ Billion, AGR%, CAGR%)
Table 69 Latin America Inflammatory Bowel Diseases Drugs Market Forecast by Route of Administration, 2024-2034 (US$ Billion, AGR%, CAGR%)
Table 70 Latin America Inflammatory Bowel Diseases Drugs Market Forecast by Distribution Channel, 2024-2034 (US$ Billion, AGR%, CAGR%)
Table 71 Latin America Inflammatory Bowel Diseases Drugs Market Forecast by Drug Class, 2024-2034 (US$ Billion, AGR%, CAGR%)
Table 72 Latin America Inflammatory Bowel Diseases Drugs Market Forecast by Drugs, 2024-2034 (US$ Billion, AGR%, CAGR%)
Table 73 Brazil Inflammatory Bowel Diseases Drugs Market Forecast, 2024-2034 (US$ Billion, AGR%, CAGR%)
Table 74 Mexico Inflammatory Bowel Diseases Drugs Market Forecast, 2024-2034 (US$ Billion, AGR%, CAGR%)
Table 75 Rest of Latin America Inflammatory Bowel Diseases Drugs Market Forecast, 2024-2034 (US$ Billion, AGR%, CAGR%)
Table 76 Middle East and Africa Inflammatory Bowel Diseases Drugs Market Forecast by Country, 2024-2034 (US$ Billion, AGR%, CAGR%)
Table 77 Middle East and Africa Inflammatory Bowel Diseases Drugs Market Forecast by Indication, 2024-2034 (US$ Billion, AGR%, CAGR%)
Table 78 Middle East and Africa Inflammatory Bowel Diseases Drugs Market Forecast by Route of Administration, 2024-2034 (US$ Billion, AGR%, CAGR%)
Table 79 Middle East and Africa Inflammatory Bowel Diseases Drugs Market Forecast by Distribution Channel, 2024-2034 (US$ Billion, AGR%, CAGR%)
Table 80 Middle East and Africa Inflammatory Bowel Diseases Drugs Market Forecast by Drug Class, 2024-2034 (US$ Billion, AGR%, CAGR%)
Table 81 Middle East and Africa Inflammatory Bowel Diseases Drugs Market Forecast by Drugs, 2024-2034 (US$ Billion, AGR%, CAGR%)
Table 82 GCC Inflammatory Bowel Diseases Drugs Market Forecast, 2024-2034 (US$ Billion, AGR%, CAGR%)
Table 83 South Africa Inflammatory Bowel Diseases Drugs Market Forecast, 2024-2034 (US$ Billion, AGR%, CAGR%)
Table 84 Rest of MEA Inflammatory Bowel Diseases Drugs Market Forecast, 2024-2034 (US$ Billion, AGR%, CAGR%)
Table 85 Strategic Outlook
Table 86 AbbVie: Key Details, (CEO, HQ, Revenue, Founded, No. of Employees, Company Type, Website, Business Segment)
Table 87 AbbVie: Product Benchmarking
Table 88 AbbVie: Strategic Outlook
Table 89 Johnsons & Johnsons: Key Details, (CEO, HQ, Revenue, Founded, No. of Employees, Company Type, Website, Business Segment)
Table 90 Johnsons & Johnsons: Product Benchmarking
Table 91 Johnsons & Johnsons: Strategic Outlook
Table 92 Takeda Pharmaceutical Company Limited: Key Details, (CEO, HQ, Revenue, Founded, No. of Employees, Company Type, Website, Business Segment)
Table 93 Takeda Pharmaceutical Company Limited: Product Benchmarking
Table 94 Takeda Pharmaceutical Company Limited: Strategic Outlook
Table 95 Pfizer: Key Details, (CEO, HQ, Revenue, Founded, No. of Employees, Company Type, Website, Business Segment)
Table 96 Pfizer: Product Benchmarking
Table 97 Pfizer: Strategic Outlook
Table 98 Novartis AG: Key Details, (CEO, HQ, Revenue, Founded, No. of Employees, Company Type, Website, Business Segment)
Table 99 Novartis AG: Product Benchmarking
Table 100 Novartis AG: Strategic Outlook
Table 101 UCB S.A.: Key Details, (CEO, HQ, Revenue, Founded, No. of Employees, Company Type, Website, Business Segment)
Table 102 UCB S.A.: Product Benchmarking
Table 103 UCB S.A.: Strategic Outlook
Table 104 Biogen: Key Details, (CEO, HQ, Revenue, Founded, No. of Employees, Company Type, Website, Business Segment)
Table 105 Biogen: Product Benchmarking
Table 106 Biogen: Strategic Outlook
Table 107 F. Hoffmann-La Roche Ltd: Key Details, (CEO, HQ, Revenue, Founded, No. of Employees, Company Type, Website, Business Segment)
Table 108 F. Hoffmann-La Roche Ltd: Product Benchmarking
Table 109 Celltrion Corporation: Key Details, (CEO, HQ, Revenue, Founded, No. of Employees, Company Type, Website, Business Segment)
Table 110 Celltrion Corporation: Product Benchmarking
Table 111 Celltrion Corporation: Strategic Outlook
Table 112 Ferring B.V.: Key Details, (CEO, HQ, Revenue, Founded, No. of Employees, Company Type, Website, Business Segment)
Table 113 Ferring B.V.: Product Benchmarking
Table 114 Ferring B.V.: Strategic Outlook
図の一覧
Figure 1 Inflammatory Bowel Diseases Drugs Market Segmentation
Figure 2 Inflammatory Bowel Diseases Drugs Market by Indication: Market Attractiveness Index
Figure 3 Inflammatory Bowel Diseases Drugs Market by Route of Administration: Market Attractiveness Index
Figure 4 Inflammatory Bowel Diseases Drugs Market by Distribution Channel: Market Attractiveness Index
Figure 5 Inflammatory Bowel Diseases Drugs Market by Drug Class: Market Attractiveness Index
Figure 6 Inflammatory Bowel Diseases Drugs Market by Drugs: Market Attractiveness Index
Figure 7 Inflammatory Bowel Diseases Drugs Market Attractiveness Index by Region
Figure 8 Inflammatory Bowel Diseases Drugs Market: Market Dynamics
Figure 9 Inflammatory Bowel Diseases Drugs Market by Region, 2024-2034 (US$ Billion, AGR %): “V” Shaped Recovery
Figure 10 Inflammatory Bowel Diseases Drugs Market by Region, 2024-2034 (US$ Billion, AGR %): “U” Shaped Recovery
Figure 11 Inflammatory Bowel Diseases Drugs Market by Region, 2024-2034 (US$ Billion, AGR %): “W” Shaped Recovery
Figure 12 Inflammatory Bowel Diseases Drugs Market by Region, 2024-2034 (US$ Billion, AGR %): “L” Shaped Recovery
Figure 13 Inflammatory Bowel Diseases Drugs Market: Porter’s Five Forces Analysis
Figure 14 IBD Drugs Market: PEST Analysis
Figure 15 Inflammatory Bowel Diseases Drugs Market by Indication: Market Attractiveness Index
Figure 16 Inflammatory Bowel Diseases Drugs Market Forecast by Indication, 2024-2034 (US$ Billion, AGR %)
Figure 17 Inflammatory Bowel Diseases Drugs Market Share Forecast by Indication, 2024, 2029, 2034 (%)
Figure 18 Crohn’s Disease Segment Market Forecast by Region, 2024-2034 (US$ Billion, AGR %)
Figure 19 Crohn’s Disease Segment Market Share Forecast by Region, 2024 & 2034 (%)
Figure 20 Ulcerative Colitis Segment Market Forecast by Region, 2024-2034 (US$ Billion, AGR %)
Figure 21 Ulcerative Colitis Segment Market Share Forecast by Region, 2024 & 2034 (%)
Figure 22 Inflammatory Bowel Diseases Drugs Market by Route of Administration: Market Attractiveness Index
Figure 23 Inflammatory Bowel Diseases Drugs Market Forecast by Route of Administration, 2024-2034 (US$ Billion, AGR %)
Figure 24 Inflammatory Bowel Diseases Drugs Market Share Forecast by Route of Administration, 2024, 2029, 2034 (%)
Figure 25 Oral Segment Market Forecast by Region, 2024-2034 (US$ Billion, AGR %)
Figure 26 Oral Segment Market Share Forecast by Region, 2024 & 2034 (%)
Figure 27 Parental Segment Market Forecast by Region, 2024-2034 (US$ Billion, AGR %)
Figure 28 Parenteral Segment Market Share Forecast by Region, 2024 & 2034 (%)
Figure 29 Rectal Segment Market Forecast by Region, 2024-2034 (US$ Billion, AGR %)
Figure 30 Rectal Segment Market Share Forecast by Region, 2024 & 2034 (%)
Figure 31 Inflammatory Bowel Diseases Drugs Market by Distribution Channel: Market Attractiveness Index
Figure 32 Inflammatory Bowel Diseases Drugs Market Forecast by Distribution Channel, 2024-2034 (US$ Billion, AGR %)
Figure 33 Inflammatory Bowel Diseases Drugs Market Share Forecast by Distribution Channel, 2024, 2029, 2034 (%)
Figure 34 Hospital Pharmacy Segment Market Forecast by Region, 2024-2034 (US$ Billion, AGR %)
Figure 35 Hospital Pharmacy Segment Market Share Forecast by Region, 2024 & 2034 (%)
Figure 36 Retail Pharmacy Segment Market Forecast by Region, 2024-2034 (US$ Billion, AGR %)
Figure 37 Retail Pharmacy Segment Market Share Forecast by Region, 2024 & 2034 (%)
Figure 38 E-commerce Pharmacy Segment Market Forecast by Region, 2024-2034 (US$ Billion, AGR %)
Figure 39 E-commerce Pharmacy Segment Market Share Forecast by Region, 2024 & 2034 (%)
Figure 40 Others Segment Market Forecast by Region, 2024-2034 (US$ Billion, AGR %)
Figure 41 Others Segment Market Share Forecast by Region, 2024 & 2034 (%)
Figure 42 Inflammatory Bowel Diseases Drugs Market by Drug Class: Market Attractiveness Index
Figure 43 Inflammatory Bowel Diseases Drugs Market Forecast by Drug Class, 2024-2034 (US$ Billion, AGR %)
Figure 44 Inflammatory Bowel Diseases Drugs Market Share Forecast by Drug Class, 2024, 2029, 2034 (%)
Figure 45 TNF-alpha Blockers Segment Market Forecast by Region, 2024-2034 (US$ Billion, AGR %)
Figure 46 TNF-alpha Blockers Segment Market Share Forecast by Region, 2024 & 2034 (%)
Figure 47 Integrin Blockers Segment Market Forecast by Region, 2024-2034 (US$ Billion, AGR %)
Figure 48 Integrin Blockers Segment Market Share Forecast by Region, 2024 & 2034 (%)
Figure 49 Interleukin Inhibitors Segment Market Forecast by Region, 2024-2034 (US$ Billion, AGR %)
Figure 50 Interleukin Inhibitors Segment Market Share Forecast by Region, 2024 & 2034 (%)
Figure 51 JAK inhibitors Segment Market Forecast by Region, 2024-2034 (US$ Billion, AGR %)
Figure 52 JAK inhibitors Segment Market Share Forecast by Region, 2024 & 2034 (%)
Figure 53 S1Ps Modulators and Others Segment Market Forecast by Region, 2024-2034 (US$ Billion, AGR %)
Figure 54 S1Ps Modulators and Others Segment Market Share Forecast by Region, 2024 & 2034 (%)
Figure 55 Inflammatory Bowel Diseases Drugs Market by Drugs: Market Attractiveness Index
Figure 56 Inflammatory Bowel Diseases Drugs Market Forecast by Drugs, 2024-2034 (US$ Billion, AGR %)
Figure 57 Inflammatory Bowel Diseases Drugs Market Share Forecast by Drug Class, 2024, 2029, 2034 (%)
Figure 58 Cimzia Segment Market Forecast by Region, 2024-2034 (US$ Billion, AGR %)
Figure 59 Cimzia Segment Market Share Forecast by Region, 2024 & 2034 (%)
Figure 60 Entyvio Segment Market Forecast by Region, 2024-2034 (US$ Billion, AGR %)
Figure 61 Entyvio Segment Market Share Forecast by Region, 2024 & 2034 (%)
Figure 62 Humira Segment Market Forecast by Region, 2024-2034 (US$ Billion, AGR %)
Figure 63 Humira Segment Market Share Forecast by Region, 2024 & 2034 (%)
Figure 64 Rinvoq Segment Market Forecast by Region, 2024-2034 (US$ Billion, AGR %)
Figure 65 Rinvoq Segment Market Share Forecast by Region, 2024 & 2034 (%)
Figure 66 Skyrizi Segment Market Forecast by Region, 2024-2034 (US$ Billion, AGR %)
Figure 67 Skyrizi Segment Market Share Forecast by Region, 2024 & 2034 (%)
Figure 68 Remicade Segment Market Forecast by Region, 2024-2034 (US$ Billion, AGR %)
Figure 69 Remicade Segment Market Share Forecast by Region, 2024 & 2034 (%)
Figure 70 Simponi Segment Market Forecast by Region, 2024-2034 (US$ Billion, AGR %)
Figure 71 Simponi Segment Market Share Forecast by Region, 2024 & 2034 (%)
Figure 72 Stelara Segment Market Forecast by Region, 2024-2034 (US$ Billion, AGR %)
Figure 73 Stelara Segment Market Share Forecast by Region, 2024 & 2034 (%)
Figure 74 Others Segment Market Forecast by Region, 2024-2034 (US$ Billion, AGR %)
Figure 75 Others Segment Market Share Forecast by Region, 2024 & 2034 (%)
Figure 76 Inflammatory Bowel Diseases Drugs Market Forecast by Region 2024 and 2034 (Revenue, CAGR%)
Figure 77 Inflammatory Bowel Diseases Drugs Market Share Forecast by Region 2024, 2029, 2034 (%)
Figure 78 Inflammatory Bowel Diseases Drugs Market by Region, 2024-2034 (US$ Billion, AGR %)
Figure 79 North America Inflammatory Bowel Diseases Drugs Market Attractiveness Index
Figure 80 North America Inflammatory Bowel Diseases Drugs Market by Region, 2024, 2029 & 2034 (US$ Billion)
Figure 81 North America Inflammatory Bowel Diseases Drugs Market Forecast by Country, 2024-2034 (US$ Billion, AGR %)
Figure 82 North America Inflammatory Bowel Diseases Drugs Market Share Forecast by Country, 2024 & 2034 (%)
Figure 83 North America Inflammatory Bowel Diseases Drugs Market Forecast by Indication, 2024-2034 (US$ Billion, AGR %)
Figure 84 North America Inflammatory Bowel Diseases Drugs Market Share Forecast by Indication, 2024 & 2034 (%)
Figure 85 North America Inflammatory Bowel Diseases Drugs Market Forecast by Route of Administration, 2024-2034 (US$ Billion, AGR %)
Figure 86 North America Inflammatory Bowel Diseases Drugs Market Share Forecast by Route of Administration, 2024 & 2034 (%)
Figure 87 North America Inflammatory Bowel Diseases Drugs Market Forecast by Distribution Channel, 2024-2034 (US$ Billion, AGR %)
Figure 88 North America Inflammatory Bowel Diseases Drugs Market Share Forecast by Distribution Channel, 2024 & 2034 (%)
Figure 89 North America Inflammatory Bowel Diseases Drugs Market Forecast by Drug Class, 2024-2034 (US$ Billion, AGR %)
Figure 90 North America Inflammatory Bowel Diseases Drugs Market Share Forecast by Drug Class, 2024 & 2034 (%)
Figure 91 North America Inflammatory Bowel Diseases Drugs Market Forecast by Drugs, 2024-2034 (US$ Billion, AGR %)
Figure 92 North America Inflammatory Bowel Diseases Drugs Market Share Forecast by Drugs, 2024 & 2034 (%)
Figure 93 U.S. Inflammatory Bowel Diseases Drugs Market Forecast, 2024-2034 (US$ Billion, AGR %)
Figure 94 Canada Inflammatory Bowel Diseases Drugs Market Forecast, 2024-2034 (US$ Billion, AGR %)
Figure 95 Europe Inflammatory Bowel Diseases Drugs Market Attractiveness Index
Figure 96 Europe Inflammatory Bowel Diseases Drugs Market by Region, 2024, 2029 & 2034 (US$ Billion)
Figure 97 Europe Inflammatory Bowel Diseases Drugs Market Forecast by Country, 2024-2034 (US$ Billion, AGR %)
Figure 98 Europe Inflammatory Bowel Diseases Drugs Market Share Forecast by Country, 2024 & 2034 (%)
Figure 99 Europe Inflammatory Bowel Diseases Drugs Market Forecast by Indication, 2024-2034 (US$ Billion, AGR %)
Figure 100 Europe Inflammatory Bowel Diseases Drugs Market Share Forecast by Indication, 2024 & 2034 (%)
Figure 101 Europe Inflammatory Bowel Diseases Drugs Market Forecast by Route of Administration, 2024-2034 (US$ Billion, AGR %)
Figure 102 Europe Inflammatory Bowel Diseases Drugs Market Share Forecast by Route of Administration, 2024 & 2034 (%)
Figure 103 Europe Inflammatory Bowel Diseases Drugs Market Forecast by Distribution Channel, 2024-2034 (US$ Billion, AGR %)
Figure 104 Europe Inflammatory Bowel Diseases Drugs Market Share Forecast by Distribution Channel, 2024 & 2034 (%)
Figure 105 Europe Inflammatory Bowel Diseases Drugs Market Forecast by Drug Class, 2024-2034 (US$ Billion, AGR %)
Figure 106 Europe Inflammatory Bowel Diseases Drugs Market Share Forecast by Drug Class, 2024 & 2034 (%)
Figure 107 Europe Inflammatory Bowel Diseases Drugs Market Forecast by Drugs, 2024-2034 (US$ Billion, AGR %)
Figure 108 Europe Inflammatory Bowel Diseases Drugs Market Share Forecast by Drugs, 2024 & 2034 (%)
Figure 109 Germany Inflammatory Bowel Diseases Drugs Market Forecast, 2024-2034 (US$ Billion, AGR %)
Figure 110 France Inflammatory Bowel Diseases Drugs Market Forecast, 2024-2034 (US$ Billion, AGR %)
Figure 111 UK Inflammatory Bowel Diseases Drugs Market Forecast, 2024-2034 (US$ Billion, AGR %)
Figure 112 Italy Inflammatory Bowel Diseases Drugs Market Forecast, 2024-2034 (US$ Billion, AGR %)
Figure 113 Spain Inflammatory Bowel Diseases Drugs Market Forecast, 2024-2034 (US$ Billion, AGR %)
Figure 114 Rest of Europe Inflammatory Bowel Diseases Drugs Market Forecast, 2024-2034 (US$ Billion, AGR %)
Figure 115 Asia Pacific Inflammatory Bowel Diseases Drugs Market Attractiveness Index
Figure 116 Asia Pacific Inflammatory Bowel Diseases Drugs Market by Region, 2024, 2029 & 2034 (US$ Billion)
Figure 117 Asia Pacific Inflammatory Bowel Diseases Drugs Market Forecast by Country, 2024-2034 (US$ Billion, AGR %)
Figure 118 Asia Pacific Inflammatory Bowel Diseases Drugs Market Share Forecast by Country, 2024 & 2034 (%)
Figure 119 Asia Pacific Inflammatory Bowel Diseases Drugs Market Forecast by Indication, 2024-2034 (US$ Billion, AGR %)
Figure 120 Asia Pacific Inflammatory Bowel Diseases Drugs Market Share Forecast by Indication, 2024 & 2034 (%)
Figure 121 Asia Pacific Inflammatory Bowel Diseases Drugs Market Forecast by Route of Administration, 2024-2034 (US$ Billion, AGR %)
Figure 122 Asia Pacific Inflammatory Bowel Diseases Drugs Market Share Forecast by Route of Administration, 2024 & 2034 (%)
Figure 123 Asia Pacific Inflammatory Bowel Diseases Drugs Market Forecast by Distribution Channel, 2024-2034 (US$ Billion, AGR %)
Figure 124 Asia Pacific Inflammatory Bowel Diseases Drugs Market Share Forecast by Distribution Channel, 2024 & 2034 (%)
Figure 125 Asia Pacific Inflammatory Bowel Diseases Drugs Market Forecast by Drug Class, 2024-2034 (US$ Billion, AGR %)
Figure 126 Asia Pacific Inflammatory Bowel Diseases Drugs Market Share Forecast by Drug Class, 2024 & 2034 (%)
Figure 127 Asia Pacific Inflammatory Bowel Diseases Drugs Market Forecast by Drugs, 2024-2034 (US$ Billion, AGR %)
Figure 128 Asia Pacific Inflammatory Bowel Diseases Drugs Market Share Forecast by Drugs, 2024 & 2034 (%)
Figure 129 Japan Inflammatory Bowel Diseases Drugs Market Forecast, 2024-2034 (US$ Billion, AGR %)
Figure 130 China Inflammatory Bowel Diseases Drugs Market Forecast, 2024-2034 (US$ Billion, AGR %)
Figure 131 India Inflammatory Bowel Diseases Drugs Market Forecast, 2024-2034 (US$ Billion, AGR %)
Figure 132 Australia Inflammatory Bowel Diseases Drugs Market Forecast, 2024-2034 (US$ Billion, AGR %)
Figure 133 South Korea Inflammatory Bowel Diseases Drugs Market Forecast, 2024-2034 (US$ Billion, AGR %)
Figure 134 Rest of Asia Pacific Inflammatory Bowel Diseases Drugs Market Forecast, 2024-2034 (US$ Billion, AGR %)
Figure 135 Latin America Inflammatory Bowel Diseases Drugs Market Attractiveness Index
Figure 136 Latin America Inflammatory Bowel Diseases Drugs Market by Region, 2024, 2029 & 2034 (US$ Billion)
Figure 137 Latin America Inflammatory Bowel Diseases Drugs Market Forecast by Country, 2024-2034 (US$ Billion, AGR %)
Figure 138 Latin America Inflammatory Bowel Diseases Drugs Market Share Forecast by Country, 2024 & 2034 (%)
Figure 139 Latin America Inflammatory Bowel Diseases Drugs Market Forecast by Indication, 2024-2034 (US$ Billion, AGR %)
Figure 140 Latin America Inflammatory Bowel Diseases Drugs Market Share Forecast by Indication, 2024 & 2034 (%)
Figure 141 Latin America Inflammatory Bowel Diseases Drugs Market Forecast by Route of Administration, 2024-2034 (US$ Billion, AGR %)
Figure 142 Latin America Inflammatory Bowel Diseases Drugs Market Share Forecast by Route of Administration, 2024 & 2034 (%)
Figure 143 Latin America Inflammatory Bowel Diseases Drugs Market Forecast by Distribution Channel, 2024-2034 (US$ Billion, AGR %)
Figure 144 Latin America Inflammatory Bowel Diseases Drugs Market Share Forecast by Distribution Channel, 2024 & 2034 (%)
Figure 145 Latin America Inflammatory Bowel Diseases Drugs Market Forecast by Drug Class, 2024-2034 (US$ Billion, AGR %)
Figure 146 Latin America Inflammatory Bowel Diseases Drugs Market Share Forecast by Drug Class, 2024 & 2034 (%)
Figure 147 Latin America Inflammatory Bowel Diseases Drugs Market Forecast by Drugs, 2024-2034 (US$ Billion, AGR %)
Figure 148 Latin America Inflammatory Bowel Diseases Drugs Market Share Forecast by Drugs, 2024 & 2034 (%)
Figure 149 Brazil Inflammatory Bowel Diseases Drugs Market Forecast, 2024-2034 (US$ Billion, AGR %)
Figure 150 Mexico Inflammatory Bowel Diseases Drugs Market Forecast, 2024-2034 (US$ Billion, AGR %)
Figure 151 Rest of Latin America Inflammatory Bowel Diseases Drugs Market Forecast, 2024-2034 (US$ Billion, AGR %)
Figure 152 Middle East and Africa Inflammatory Bowel Diseases Drugs Market Attractiveness Index
Figure 153 Middle East and Africa Inflammatory Bowel Diseases Drugs Market by Region, 2024, 2029 & 2034 (US$ Billion)
Figure 154 Middle East and Africa Inflammatory Bowel Diseases Drugs Market Forecast by Country, 2024-2034 (US$ Billion, AGR %)
Figure 155 Middle East and Africa Inflammatory Bowel Diseases Drugs Market Share Forecast by Country, 2024 & 2034 (%)
Figure 156 Middle East and Africa Inflammatory Bowel Diseases Drugs Market Forecast by Indication, 2024-2034 (US$ Billion, AGR %)
Figure 157 Middle East and Africa Inflammatory Bowel Diseases Drugs Market Share Forecast by Indication, 2024 & 2034 (%)
Figure 158 Middle East and Africa Inflammatory Bowel Diseases Drugs Market Forecast by Route of Administration, 2024-2034 (US$ Billion, AGR %)
Figure 159 Middle East and Africa Inflammatory Bowel Diseases Drugs Market Share Forecast by Route of Administration, 2024 & 2034 (%)
Figure 160 Middle East and Africa Inflammatory Bowel Diseases Drugs Market Forecast by Distribution Channel, 2024-2034 (US$ Billion, AGR %)
Figure 161 Middle East and Africa Inflammatory Bowel Diseases Drugs Market Share Forecast by Distribution Channel, 2024 & 2034 (%)
Figure 162 Middle East and Africa Inflammatory Bowel Diseases Drugs Market Forecast by Drug Class, 2024-2034 (US$ Billion, AGR %)
Figure 163 Middle East and Africa Inflammatory Bowel Diseases Drugs Market Share Forecast by Drug Class, 2024 & 2034 (%)
Figure 164 Middle East and Africa Inflammatory Bowel Diseases Drugs Market Forecast by Drugs, 2024-2034 (US$ Billion, AGR %)
Figure 165 Middle East and Africa Inflammatory Bowel Diseases Drugs Market Share Forecast by Drugs, 2024 & 2034 (%)
Figure 166 GCC Inflammatory Bowel Diseases Drugs Market Forecast, 2024-2034 (US$ Billion, AGR %)
Figure 167 South Africa Inflammatory Bowel Diseases Drugs Market Forecast, 2024-2034 (US$ Billion, AGR %)
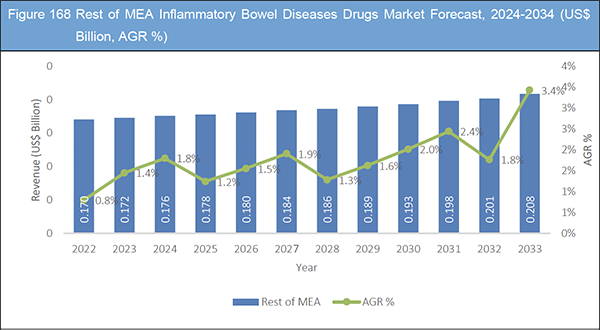
Figure 168 Rest of MEA Inflammatory Bowel Diseases Drugs Market Forecast, 2024-2034 (US$ Billion, AGR %)
Figure 169 Inflammatory Bowel Diseases Drugs Market: Company Share/Ranking, 2023
Figure 170 AbbVie: Net Revenue, 2018-2022 (US$ Million, AGR%)
Figure 171 AbbVie: R&D, 2018-2022 (US$ Million, AGR%)
Figure 172 AbbVie: Regional Market Shares, 2022
Figure 173 Johnson & Johnson Private Limited: Annual Revenue, 2018-2022 (US$ Million, AGR%)
Figure 174 Johnson & Johnson Private Limited: Regional Market Shares, 2022
Figure 175 Takeda Pharmaceutical Company Limited: Net Revenue, 2019-2023 (US$ Billion, AGR%)
Figure 176 Takeda Pharmaceutical Company Limited: R&D, 2019-2023 (US$ Billion, AGR%)
Figure 177 Takeda Pharmaceutical Company Limited: Regional Market Shares, 2022
Figure 178 Pfizer: Net Revenue, 2018-2022 (US$ Million, AGR%)
Figure 179 Pfizer: R&D, 2018-2022 (US$ Million, AGR%)
Figure 180 Pfizer: Regional Market Shares, 2022
Figure 181 Novartis AG: Net Revenue, 2018-2022 (US$ Billion, AGR%)
Figure 182 Novartis AG: R&D, 2018-2022 (US$ Billion, AGR%)
Figure 183 Novartis AG: Regional Market Shares, 2022
Figure 184 UCB S.A.: Net Revenue, 2019-20233 (US$ Billion, AGR%)
Figure 185 UCB S.A.: R&D, 2019-2023 (US$ Billion, AGR%)
Figure 186 UCB S.A.: Regional Market Shares, 2023
Figure 187 Biogen: Net Revenue, 2019-2023 (US$ Billion, AGR%)
Figure 188 Biogen: R&D, 2019-2023 (US$ Billion, AGR%)
Figure 189 F. Hoffmann-La Roche Ltd: Net Revenue, 2018-2022 (US$ Billion, AGR%)
Figure 190 F. Hoffmann-La Roche Ltd: R&D Expense, 2018-2022 (US$ Billion, AGR%)
Figure 191 Celltrion Corporation: Net Revenue, 2018-2022 (US$ Billion, AGR%)
Figure 192 Celltrion Corporation: R&D, 2018-2022 (US$ Billion, AGR%)
ページTOPに戻る
Summary
Report Details
The Inflammatory Bowel Diseases (IBD) Drugs Market Report 2024-2034: This report is essential for prominent enterprises seeking fresh revenue opportunities, aiming to enhance their comprehension of the industry and its inherent dynamics. It provides valuable insights for firms interested in diversifying across various sectors or expanding their current activities into new geographical areas.
Rise in IBD Incidence to Boost the Demand of IBD Drugs Market
The global incidence and prevalence of Inflammatory Bowel Disease (IBD) are increasing, with marked variations between developed and developing nations. Crohn’s disease and ulcerative colitis are more common in developed countries, potentially due to Western diets and lifestyle factors. Rapid urbanization has also contributed to the rise in autoimmune diseases, including IBD. While the incidence appears stable in the West, it is increasing in the developing countries, possibly due to Westernization and improved disease awareness. Recent studies show rising incidence rates, especially in regions with previously low rates. Europe has the highest incidence rates, followed by North America and Asia/Middle East. According to EFCCA (European Federation of Crohn´s and Ulcerative Colitis Associations) in 2022 there were 10 million people living with IBD worldwide. While according to CCFA ( Crohn’s & Colitis Foundation of America), as many as 70,000 new cases of IBD are diagnosed in the United States each year and estimated that approximately 80,000 children in the U.S. are affected with IBD. The IBD has reported to affect almost 1.6 million Americans, most of whom are diagnosed before the age of 35.
Genetic factors play a role, but changing incidence rates emphasize the significance of environmental factors. Socioeconomic shifts and the spread of Western lifestyle contribute to this rise. Extra intestinal manifestations and complications like colon cancer pose significant risks to patients, with long-term implications of treatment are still being understood. Gastroenterology clinics will face challenges managing both younger IBD patients and an aging population with comorbidities, necessitating careful management strategies.
Significant success in IBD Drug Development to Drive the Market Demand
Previously, the diagnosis rate of Inflammatory Bowel Disease (IBD) was low particularly impacting developing countries. Even in developed nations, diagnosing IBD was challenging, leading to prolonged misdiagnoses for many sufferers. However, recent improvements in diagnostics have expanded the patient pool, consequently driving demand for treatments and boosting market revenue.
There has been a rapid surge in randomized clinical trials for Crohn’s disease (CD) and ulcerative colitis (UC) treatments, accompanied by detailed epidemiological studies. Despite initial debates, it’s now evident that IBD predominantly affects individuals in industrialized nations, with its incidence on the rise. With the advent of newer technologies, there has been a paradigm shift reported in treatment of IBD. Some of the major recent developments include launch and approval of new drugs for instance:
In February 2024, Pfizer Inc. disclosed that the European Commission (EC) has approved marketing authorization for VELSIPITY (etrasimod) within the European Union for the management of moderately to severely active ulcerative colitis (UC) in patients aged 16 and above. This approval extends to individuals who have shown insufficient response, loss of response, or intolerance to conventional therapy or a biological agent.
In March 2024, Celltrion USA has introduced ZYMFENTRA (infliximab-dyyb), a subcutaneous (SC) version of infliximab, marking a significant advancement in treatment options. ZYMFENTRA stands as the sole subcutaneous infliximab approved by the U.S. Food and Drug Administration (FDA) in 2023.
In July 2023, the launch of Yuflyma (adalimumab-aaty) has been announced by Celltrion USA, presenting patients with a high-concentration (100mg/mL) and citrate-free formulation as an alternative option. Yuflyma is approved for the treatment of eight conditions, which encompass rheumatoid arthritis, juvenile idiopathic arthritis, psoriatic arthritis, ankylosing spondylitis, Crohn’s disease, ulcerative colitis, plaque psoriasis, and hidradenitis suppurativa.
Additionally, Fiberoptic colonoscopy with biopsies and ileocolonoscopy have transformed the diagnosis of both UC and CD globally, particularly in defining disease extent and severity, consequently helping the patients to manage and control IBD.
What Questions Should You Ask before Buying a Market Research Report?
-
How is the Inflammatory Bowel Diseases Drugs market evolving?
-
What is driving and restraining the Inflammatory Bowel Diseases Drugs market?
-
How will each Inflammatory Bowel Diseases Drugs submarket segment grow over the forecast period and how much revenue will these submarkets account for in 2034?
-
How will the market shares for each Inflammatory Bowel Diseases Drugs submarket develop from 2024 to 2034?
What will be the main driver for the overall market from 2024 to 2034?
-
Will leading Inflammatory Bowel Diseases Drugs markets broadly follow the macroeconomic dynamics, or will individual national markets outperform others?
-
How will the market shares of the national markets change by 2034 and which geographical region will lead the market in 2034?
-
Who are the leading players and what are their prospects over the forecast period?
-
What are the Inflammatory Bowel Diseases Drugs projects for these leading companies?
-
How will the industry evolve during the period between 2024 and 2034? What are the implications of Inflammatory
-
Bowel Diseases Drugs projects taking place now and over the next 10 years?
-
Is there a greater need for product commercialisation to further scale the Inflammatory Bowel Diseases Drugs market?
-
Where is the Inflammatory Bowel Diseases Drugs market heading and how can you ensure you are at the forefront of the market?
-
What are the best investment options for new product and service lines?
-
What are the key prospects for moving companies into a new growth path and C-suite?
You need to discover how this will impact the Inflammatory Bowel Diseases Drugs market today, and over the next 10 years:
-
Our 318-page report provides 112 tables and 192 charts/graphs exclusively to you.
-
The report highlights key lucrative areas in the industry so you can target them – NOW.
-
It contains in-depth analysis of global, regional and national sales and growth.
-
It highlights for you the key successful trends, changes and revenue projections made by your competitors.
This report tells you TODAY how the Inflammatory Bowel Diseases Drugs market will develop in the next 10 years, and in line with the variations in COVID-19 economic recession and bounce. This market is more critical now than at any point over the last 10 years.
Forecasts to 2034 and other analyses reveal commercial prospects
-
In addition to revenue forecasting to 2034, our new study provides you with recent results, growth rates, and market shares.
-
You will find original analyses, with business outlooks and developments.
-
Discover qualitative analyses (including market dynamics, drivers, opportunities, restraints and challenges), cost structure, impact of rising Inflammatory Bowel Diseases Drugs prices and recent developments.
This report includes data analysis and invaluable insight into how COVID-19 will affect the industry and your company. Four COVID-19 recovery patterns and their impact, namely, “V”, “L”, “W” and “U” are discussed in this report.
Segments Covered in the Report
Indication Outlook
-
Crohn’s Disease
-
Ulcerative Colitis
Route of Administration Outlook
Distribution Channel Outlook
-
Hospital Pharmacy
-
Retail Pharmacy
-
E-commerce Pharmacy
-
Others
Drug Class Outlook
-
TNF-alpha Blockers
-
Integrin Blockers
-
Interleukin Inhibitors
-
JAK Inhibitors
-
S1Ps Modulators and Others
Drugs Outlook
-
Cimzia
-
Entyvio
-
Humira
-
Rinvoq
-
Skyrizi
-
Remicade
-
Simponi
-
Stelara
-
Others
In addition to the revenue predictions for the overall world market and segments, you will also find revenue forecasts for five regional and 21 leading national markets:
North America
Europe
-
Germany
-
UK
-
France
-
Spain
-
Italy
-
Rest of Europe
Asia Pacific
-
China
-
Japan
-
India
-
Australia
-
South Korea
-
Rest of Asia Pacific
Latin America
-
Brazil
-
Mexico
-
Rest of Latin America
MEA
-
GCC
-
South Africa
-
Rest of MEA
The report also includes profiles and for some of the leading companies in the Inflammatory Bowel Diseases Drugs Market, 2024 to 2034, with a focus on this segment of these companies’ operations.
Leading companies profiled in the report
-
AbbVie
-
Biogen
-
Celltrion Healthcare Co.,Ltd.
-
F. Hoffmann-La Roche Ltd
-
Ferring B.V.
-
Johnsons & Johnsons
-
Novartis AG
-
Pfizer
-
Takeda Pharmaceutical Company Limited
-
UCB S.A.
Overall world revenue for Inflammatory Bowel Diseases Drugs Market, 2024 to 2034 in terms of value the market will surpass US$29.09 billion in 2024, our work calculates. We predict strong revenue growth through to 2034. Our work identifies which organizations hold the greatest potential. Discover their capabilities, progress, and commercial prospects, helping you stay ahead.
How will the Inflammatory Bowel Diseases Drugs Market, 2024 to 2034 report help you?
In summary, our 310+ page report provides you with the following knowledge:
-
Revenue forecasts to 2034 for Inflammatory Bowel Diseases Drugs Market, 2024 to 2034 Market, with forecasts for drugs, drug class, indication and route of administration each forecast at a global and regional level – discover the industry’s prospects, finding the most lucrative places for investments and revenues.
-
Revenue forecasts to 2034 for five regional and 21 key national markets – See forecasts for the Inflammatory Bowel Diseases Drugs Market, 2024 to 2034 market in North America, Europe, Asia-Pacific, Latin America, and MEA. Also forecasted is the market in the US, Canada, Mexico, Brazil, Germany, France, UK, Italy, China, India, Japan, and Australia among other prominent economies.
-
Prospects for established firms and those seeking to enter the market – including company profiles for 15 of the major companies involved in the Inflammatory Bowel Diseases Drugs Market, 2024 to 2034.
Find quantitative and qualitative analyses with independent predictions. Receive information that only our report contains, staying informed with invaluable business intelligence.
Information found nowhere else
With our new report, you are less likely to fall behind in knowledge or miss out on opportunities. See how our work could benefit your research, analyses, and decisions. Visiongain’s study is for everybody needing commercial analyses for the Inflammatory Bowel Diseases Drugs Market, 2024 to 2034, market-leading companies. You will find data, trends and predictions.
ページTOPに戻る
Table of Contents
Table of Contents
1 Report Overview
1.1 Objectives of the Study
1.2 Introduction to Inflammatory Bowel Diseases Drugs Market
1.3 What This Report Delivers
1.4 Why You Should Read This Report
1.5 Key Questions Answered by This Analytical Report
1.6 Who is This Report for?
1.7 Methodology
1.7.1 Market Definitions
1.7.2 Market Evaluation & Forecasting Methodology
1.7.3 Data Validation
1.7.3.1 Primary Research
1.7.3.2 Secondary Research
1.8 Frequently Asked Questions (FAQs)
1.9 Associated Visiongain Reports
1.10 About Visiongain
2 Executive Summary
3 Market Overview
3.1 Key Findings
3.2 Market Dynamics
3.2.1 Market Driving Factors
3.2.1.1 Rise in IBD Incidence to Boost the Demand of IBD Drugs Market
3.2.1.2 Significant success in IBD Drug Development to Drive the Market Demand
3.2.1.3 Advancements in Oral Drug Delivery for Inflammatory Bowel Disease
3.2.2 Market Restraining Factors
3.2.2.1 Lack of Understanding of Disease Aetiology
3.2.2.2 Compliance – Frequent Dosing is Inconvenient
3.2.2.3 Limitations of IBD Drugs – Side Effect Profiles
3.2.3 Market Opportunities
3.2.3.1 Advancements in Biological Drugs to Drive the Market Significantly
3.2.3.2 Rising Opportunities for IBD Drugs in Asian Markets
3.3 COVID-19 Impact Analysis
3.4 Porter’s Five Forces Analysis
3.4.1 Bargaining Power of Suppliers
3.4.2 Bargaining Power of Buyers
3.4.3 Competitive Rivalry
3.4.4 Threat from Substitutes
3.4.5 Threat of New Entrants
3.5 PEST Analysis
4 Inflammatory Bowel Diseases Drugs Market Analysis by Indication
4.1 Key Findings
4.2 Indication Segment: Market Attractiveness Index
4.3 Inflammatory Bowel Diseases Drugs Market Size Estimation and Forecast by Indication
4.4 Crohn’s Disease
4.4.1 Market Size by Region, 2024-2034 (US$ Billion)
4.4.2 Market Share by Region, 2024 & 2034 (%)
4.5 Ulcerative Colitis
4.5.1 Market Size by Region, 2024-2034 (US$ Billion)
4.5.2 Market Share by Region, 2024 & 2034 (%)
5 Inflammatory Bowel Diseases Drugs Market Analysis by Route of Administration
5.1 Key Findings
5.2 Indication Segment: Market Attractiveness Index
5.3 Inflammatory Bowel Diseases Drugs Market Size Estimation and Forecast by Route of Administration
5.4 Oral
5.4.1 Market Size by Region, 2024-2034 (US$ Billion)
5.4.2 Market Share by Region, 2024 & 2034 (%)
5.5 Parenteral
5.5.1 Market Size by Region, 2024-2034 (US$ Billion)
5.5.2 Market Share by Region, 2024 & 2034 (%)
5.6 Rectal
5.6.1 Market Size by Region, 2024-2034 (US$ Billion)
5.6.2 Market Share by Region, 2024 & 2034 (%)
6 Inflammatory Bowel Diseases Drugs Market Analysis by Distribution Channel
6.1 Key Findings
6.2 Indication Segment: Market Attractiveness Index
6.3 Inflammatory Bowel Diseases Drugs Market Size Estimation and Forecast by Distribution Channel
6.4 Hospital Pharmacy
6.4.1 Market Size by Region, 2024-2034 (US$ Billion)
6.4.2 Market Share by Region, 2024 & 2034 (%)
6.5 Retail Pharmacy
6.5.1 Market Size by Region, 2024-2034 (US$ Billion)
6.5.2 Market Share by Region, 2024 & 2034 (%)
6.6 E-commerce Pharmacy
6.6.1 Market Size by Region, 2024-2034 (US$ Billion)
6.6.2 Market Share by Region, 2024 & 2034 (%)
6.7 Others
6.7.1 Market Size by Region, 2024-2034 (US$ Billion)
6.7.2 Market Share by Region, 2024 & 2034 (%)
7 Inflammatory Bowel Diseases Drugs Market Analysis by Drug Class
7.1 Key Findings
7.2 Drug Class Segment: Market Attractiveness Index
7.3 Inflammatory Bowel Diseases Drugs Market Size Estimation and Forecast by Drug Class
7.4 TNF-alpha Blockers
7.4.1 Market Size by Region, 2024-2034 (US$ Billion)
7.4.2 Market Share by Region, 2024 & 2034 (%)
7.5 Integrin Blockers
7.5.1 Market Size by Region, 2024-2034 (US$ Billion)
7.5.2 Market Share by Region, 2024 & 2034 (%)
7.6 Interleukin Inhibitors
7.6.1 Market Size by Region, 2024-2034 (US$ Billion)
7.6.2 Market Share by Region, 2024 & 2034 (%)
7.7 JAK inhibitors
7.7.1 Market Size by Region, 2024-2034 (US$ Billion)
7.7.2 Market Share by Region, 2024 & 2034 (%)
7.8 S1Ps Modulators and Others
7.8.1 Market Size by Region, 2024-2034 (US$ Billion)
7.8.2 Market Share by Region, 2024 & 2034 (%)
8 Inflammatory Bowel Diseases Drugs Market Analysis by Drugs
8.1 Key Findings
8.2 Drugs Segment: Market Attractiveness Index
8.3 Inflammatory Bowel Diseases Drugs Market Size Estimation and Forecast by Drugs
8.4 Cimzia
8.4.1 Market Size by Region, 2024-2034 (US$ Billion)
8.4.2 Market Share by Region, 2024 & 2034 (%)
8.5 Entyvio
8.5.1 Market Size by Region, 2024-2034 (US$ Billion)
8.5.2 Market Share by Region, 2024 & 2034 (%)
8.6 Humira
8.6.1 Market Size by Region, 2024-2034 (US$ Billion)
8.6.2 Market Share by Region, 2024 & 2034 (%)
8.7 Rinvoq
8.7.1 Market Size by Region, 2024-2034 (US$ Billion)
8.7.2 Market Share by Region, 2024 & 2034 (%)
8.8 Skyrizi
8.8.1 Market Size by Region, 2024-2034 (US$ Billion)
8.8.2 Market Share by Region, 2024 & 2034 (%)
8.9 Remicade
8.9.1 Market Size by Region, 2024-2034 (US$ Billion)
8.9.2 Market Share by Region, 2024 & 2034 (%)
8.10 Simponi
8.10.1 Market Size by Region, 2024-2034 (US$ Billion)
8.10.2 Market Share by Region, 2024 & 2034 (%)
8.11 Stelara
8.11.1 Market Size by Region, 2024-2034 (US$ Billion)
8.11.2 Market Share by Region, 2024 & 2034 (%)
8.12 Others
8.12.1 Market Size by Region, 2024-2034 (US$ Billion)
8.12.2 Market Share by Region, 2024 & 2034 (%)
9 Inflammatory Bowel Diseases Drugs Market Analysis by Region
9.1 Key Findings
9.2 Regional Market Size Estimation and Forecast
10 North America Inflammatory Bowel Diseases Drugs Market Analysis
10.1 Key Findings
10.2 North America Inflammatory Bowel Diseases Drugs Market Attractiveness Index
10.3 North America Inflammatory Bowel Diseases Drugs Market by Country, 2024, 2029 & 2034 (US$ Billion)
10.4 North America Inflammatory Bowel Diseases Drugs Market Size Estimation and Forecast by Country
10.5 North America Inflammatory Bowel Diseases Drugs Market Size Estimation and Forecast by Indication
10.6 North America Inflammatory Bowel Diseases Drugs Market Size Estimation and Forecast by Route of Administration
10.7 North America Inflammatory Bowel Diseases Drugs Market Size Estimation and Forecast by Distribution Channel
10.8 North America Inflammatory Bowel Diseases Drugs Market Size Estimation and Forecast by Drug Class
10.9 North America Inflammatory Bowel Diseases Drugs Market Size Estimation and Forecast by Drugs
10.10 U.S. Inflammatory Bowel Diseases Drugs Market Analysis
10.11 Canada Inflammatory Bowel Diseases Drugs Market Analysis
11 Europe Inflammatory Bowel Diseases Drugs Market Analysis
11.1 Key Findings
11.2 Europe Inflammatory Bowel Diseases Drugs Market Attractiveness Index
11.3 Europe Inflammatory Bowel Diseases Drugs Market by Country, 2024, 2029 & 2034 (US$ Billion)
11.4 Europe Inflammatory Bowel Diseases Drugs Market Size Estimation and Forecast by Country
11.5 Europe Inflammatory Bowel Diseases Drugs Market Size Estimation and Forecast by Indication
11.6 Europe Inflammatory Bowel Diseases Drugs Market Size Estimation and Forecast by Route of Administration
11.7 Europe Inflammatory Bowel Diseases Drugs Market Size Estimation and Forecast by Distribution Channel
11.8 Europe Inflammatory Bowel Diseases Drugs Market Size Estimation and Forecast by Drug Class
11.9 Europe Inflammatory Bowel Diseases Drugs Market Size Estimation and Forecast by Drugs
11.10 Germany Inflammatory Bowel Diseases Drugs Market Analysis
11.11 France Inflammatory Bowel Diseases Drugs Market Analysis
11.12 UK Inflammatory Bowel Diseases Drugs Market Analysis
11.13 Italy Inflammatory Bowel Diseases Drugs Market Analysis
11.14 Spain Inflammatory Bowel Diseases Drugs Market Analysis
11.15 Rest of Europe Inflammatory Bowel Diseases Drugs Market Analysis
12 Asia Pacific Inflammatory Bowel Diseases Drugs Market Analysis
12.1 Key Findings
12.2 Asia Pacific Inflammatory Bowel Diseases Drugs Market Attractiveness Index
12.3 Asia Pacific Inflammatory Bowel Diseases Drugs Market by Country, 2024, 2029 & 2034 (US$ Billion)
12.4 Asia Pacific Inflammatory Bowel Diseases Drugs Market Size Estimation and Forecast by Country
12.5 Asia Pacific Inflammatory Bowel Diseases Drugs Market Size Estimation and Forecast by Indication
12.6 Asia Pacific Inflammatory Bowel Diseases Drugs Market Size Estimation and Forecast by Route of Administration
12.7 Asia Pacific Inflammatory Bowel Diseases Drugs Market Size Estimation and Forecast by Distribution Channel
12.8 Asia Pacific Inflammatory Bowel Diseases Drugs Market Size Estimation and Forecast by Drug Class
12.9 Asia Pacific Inflammatory Bowel Diseases Drugs Market Size Estimation and Forecast by Drugs
12.10 Japan Inflammatory Bowel Diseases Drugs Market Analysis
12.11 China Inflammatory Bowel Diseases Drugs Market Analysis
12.12 India Inflammatory Bowel Diseases Drugs Market Analysis
12.13 Australia Inflammatory Bowel Diseases Drugs Market Analysis
12.14 South Korea Inflammatory Bowel Diseases Drugs Market Analysis
12.15 Rest of Asia Pacific Inflammatory Bowel Diseases Drugs Market Analysis
13 Latin America Inflammatory Bowel Diseases Drugs Market Analysis
13.1 Key Findings
13.2 Latin America Inflammatory Bowel Diseases Drugs Market Attractiveness Index
13.3 Latin America Inflammatory Bowel Diseases Drugs Market by Country, 2024, 2029 & 2034 (US$ Billion)
13.4 Latin America Inflammatory Bowel Diseases Drugs Market Size Estimation and Forecast by Country
13.5 Latin America Inflammatory Bowel Diseases Drugs Market Size Estimation and Forecast by Indication
13.6 Latin America Inflammatory Bowel Diseases Drugs Market Size Estimation and Forecast by Route of Administration
13.7 Latin America Inflammatory Bowel Diseases Drugs Market Size Estimation and Forecast by Distribution Channel
13.8 Latin America Inflammatory Bowel Diseases Drugs Market Size Estimation and Forecast by Drug Class
13.9 Latin America Inflammatory Bowel Diseases Drugs Market Size Estimation and Forecast by Drugs
13.10 Brazil Inflammatory Bowel Diseases Drugs Market Analysis
13.11 Mexico Inflammatory Bowel Diseases Drugs Market Analysis
13.12 Rest of Latin America Inflammatory Bowel Diseases Drugs Market Analysis
14 Middle East and Africa Inflammatory Bowel Diseases Drugs Market Analysis
14.1 Key Findings
14.2 Middle East and Africa Inflammatory Bowel Diseases Drugs Market Attractiveness Index
14.3 Middle East and Africa Inflammatory Bowel Diseases Drugs Market by Country, 2024, 2029 & 2034 (US$ Billion)
14.4 Middle East and Africa Inflammatory Bowel Diseases Drugs Market Size Estimation and Forecast by Country
14.5 Middle East and Africa Inflammatory Bowel Diseases Drugs Market Size Estimation and Forecast by Indication
14.6 Middle East and Africa Inflammatory Bowel Diseases Drugs Market Size Estimation and Forecast by Route of Administration
14.7 Middle East and Africa Inflammatory Bowel Diseases Drugs Market Size Estimation and Forecast by Distribution Channel
14.8 Middle East and Africa Inflammatory Bowel Diseases Drugs Market Size Estimation and Forecast by Drug Class
14.9 Middle East and Africa Inflammatory Bowel Diseases Drugs Market Size Estimation and Forecast by Drugs
14.10 GCC Inflammatory Bowel Diseases Drugs Market Analysis
14.11 South Africa Inflammatory Bowel Diseases Drugs Market Analysis
14.12 Rest of MEA Inflammatory Bowel Diseases Drugs Market Analysis
15 Company Profiles
15.1 Competitive Landscape, 2023
15.2 Strategic Outlook
15.3 AbbVie
15.3.1 Company Snapshot
15.3.2 Company Overview
15.3.3 Financial Analysis
15.3.3.1 Net Revenue, 2018-2022
15.3.3.2 R&D, 2018-2022
15.3.3.3 Regional Market Shares, 2022
15.3.4 Product Benchmarking
15.3.5 Strategic Outlook
15.4 Johnsons & Johnsons
15.4.1 Company Snapshot
15.4.2 Company Overview
15.4.3 Financial Analysis
15.4.3.1 Net Revenue, 2018-2022
15.4.3.2 Regional Market Shares, 2022
15.4.4 Product Benchmarking
15.4.5 Strategic Outlook
15.5 Takeda Pharmaceutical Company Limited
15.5.1 Company Snapshot
15.5.2 Company Overview
15.5.3 Financial Analysis
15.5.3.1 Net Revenue, 2019-2023
15.5.3.2 R&D, 2019-2023
15.5.3.3 Regional Market Shares, 2022
15.5.4 Product Benchmarking
15.5.5 Strategic Outlook
15.6 Pfizer
15.6.1 Company Snapshot
15.6.2 Company Overview
15.6.3 Financial Analysis
15.6.3.1 Net Revenue, 2018-2022
15.6.3.2 R&D, 2018-2022
15.6.3.3 Regional Market Shares, 2022
15.6.4 Product Benchmarking
15.6.5 Strategic Outlook
15.7 Novartis AG
15.7.1 Company Snapshot
15.7.2 Company Overview
15.7.3 Financial Analysis
15.7.3.1 Net Revenue, 2018-2022
15.7.3.2 R&D, 2018-2022
15.7.3.3 Regional Market Shares, 2022
15.7.4 Product Benchmarking
15.7.5 Strategic Outlook
15.8 UCB S.A.
15.8.1 Company Snapshot
15.8.2 Company Overview
15.8.3 Financial Analysis
15.8.3.1 Net Revenue, 2019-2023
15.8.3.2 R&D, 2019-2023
15.8.3.3 Regional Market Shares, 2023
15.8.4 Product Benchmarking
15.8.5 Strategic Outlook
15.9 Biogen
15.9.1 Company Snapshot
15.9.2 Company Overview
15.9.3 Financial Analysis
15.9.3.1 Net Revenue, 2019-2023
15.9.3.2 R&D, 2019-2023
15.9.4 Product Benchmarking
15.9.5 Strategic Outlook
15.10 F. Hoffmann-La Roche Ltd
15.10.1 Company Snapshot
15.10.2 Company Overview
15.10.3 Financial Analysis
15.10.3.1 Net Revenue, 2018-2022
15.10.3.2 R&D, 2018-2022
15.10.4 Product Benchmarking
15.11 Celltrion Corporation
15.11.1 Company Snapshot
15.11.2 Company Overview
15.11.3 Financial Analysis
15.11.3.1 Net Revenue, 2018-2022
15.11.3.2 R&D, 2018-2022
15.11.4 Product Benchmarking
15.11.5 Strategic Outlook
15.12 Ferring B.V.
15.12.1 Company Snapshot
15.12.2 Company Overview
15.12.3 Product Benchmarking
15.12.4 Strategic Outlook
16 Conclusion and Recommendations
16.1 Concluding Remarks from Visiongain
16.2 Recommendations for Market Players
ページTOPに戻る
List of Tables/Graphs
List of Tables
Table 1 Inflammatory Bowel Diseases Drugs Market Snapshot, 2024 & 2034 (US$ Billion, CAGR %)
Table 2 Inflammatory Bowel Diseases Drugs Market Forecast by Region, 2024-2034 (US$ Billion, AGR%, CAGR%): “V” Shaped Recovery
Table 3 Inflammatory Bowel Diseases Drugs Market Forecast by Region, 2024-2034 (US$ Billion, AGR%, CAGR%): “U” Shaped Recovery
Table 4 Inflammatory Bowel Diseases Drugs Market Forecast by Region, 2024-2034 (US$ Billion, AGR%, CAGR%): “W” Shaped Recovery
Table 5 Inflammatory Bowel Diseases Drugs Market Forecast by Region, 2024-2034 (US$ Billion, AGR%, CAGR%): “L” Shaped Recovery
Table 6 Inflammatory Bowel Diseases Drugs Market Forecast by Indication, 2024-2034 (US$ Billion, AGR%, CAGR %)
Table 7 Crohn’s Disease Segment Market Forecast by Region, 2024-2034 (US$ Billion, AGR%, CAGR %)
Table 8 Ulcerative Colitis Segment Market Forecast by Region, 2024-2034 (US$ Billion, AGR%, CAGR%)
Table 9 Inflammatory Bowel Diseases Drugs Market Forecast by Route of Administration, 2024-2034 (US$ Billion, AGR%, CAGR%)
Table 10 Oral Segment Market Forecast by Region, 2024-2034 (US$ Billion, AGR%, CAGR%)
Table 11 Parenteral Segment Market Forecast by Region, 2024-2034 (US$ Billion, AGR%, CAGR%)
Table 12 Rectal Segment Market Forecast by Region, 2024-2034 (US$ Billion, AGR%, CAGR%)
Table 13 Inflammatory Bowel Diseases Drugs Market Forecast by Distribution Channel, 2024-2034 (US$ Billion, AGR%, CAGR%)
Table 14 Hospital Pharmacy Segment Market Forecast by Region, 2024-2034 (US$ Billion, AGR%, CAGR%)
Table 15 Retail Pharmacy Segment Market Forecast by Region, 2024-2034 (US$ Billion, AGR%, CAGR%)
Table 16 E-commerce Pharmacy Segment Market Forecast by Region, 2024-2034 (US$ Billion, AGR%, CAGR%)
Table 17 Others Segment Market Forecast by Region, 2024-2034 (US$ Billion, AGR%, CAGR%)
Table 18 Inflammatory Bowel Diseases Drugs Market Forecast by Drug Class, 2024-2034 (US$ Billion, AGR%, CAGR%)
Table 19 TNF-alpha Blockers Segment Market Forecast by Region, 2024-2034 (US$ Billion, AGR%, CAGR%)
Table 20 Integrin Blockers Segment Market Forecast by Region, 2024-2034 (US$ Billion, AGR%, CAGR%)
Table 21 Interleukin Inhibitors Segment Market Forecast by Region, 2024-2034 (US$ Billion, AGR%, CAGR%)
Table 22 JAK inhibitors Segment Market Forecast by Region, 2024-2034 (US$ Billion, AGR%, CAGR%)
Table 23 S1Ps Modulators and Others Segment Market Forecast by Region, 2024-2034 (US$ Billion, AGR%, CAGR%)
Table 24 Inflammatory Bowel Diseases Drugs Market Forecast by Drugs, 2024-2034 (US$ Billion, AGR%, CAGR%)
Table 25 Cimzia Blockers Segment Market Forecast by Region, 2024-2034 (US$ Billion, AGR%, CAGR%)
Table 26 Entyvio Segment Market Forecast by Region, 2024-2034 (US$ Billion, AGR%, CAGR%)
Table 27 Humira Segment Market Forecast by Region, 2024-2034 (US$ Billion, AGR%, CAGR%)
Table 28 Rinvoq Segment Market Forecast by Region, 2024-2034 (US$ Billion, AGR%, CAGR%)
Table 29 Skyrizi Segment Market Forecast by Region, 2024-2034 (US$ Billion, AGR%, CAGR%)
Table 30 Remicade Segment Market Forecast by Region, 2024-2034 (US$ Billion, AGR%, CAGR%)
Table 31 Simponi Segment Market Forecast by Region, 2024-2034 (US$ Billion, AGR%, CAGR%)
Table 32 Stelara Segment Market Forecast by Region, 2024-2034 (US$ Billion, AGR%, CAGR%)
Table 33 Others Segment Market Forecast by Region, 2024-2034 (US$ Billion, AGR%, CAGR%)
Table 34 Inflammatory Bowel Diseases Drugs Market Forecast by Region, 2024-2034 (US$ Billion, AGR%, CAGR%)
Table 35 North America Inflammatory Bowel Diseases Drugs Market Forecast by Country, 2024-2034 (US$ Billion, AGR%, CAGR%)
Table 36 North America Inflammatory Bowel Diseases Drugs Market Forecast by Indication, 2024-2034 (US$ Billion, AGR%, CAGR%)
Table 37 North America Inflammatory Bowel Diseases Drugs Market Forecast by Route of Administration, 2024-2034 (US$ Billion, AGR%, CAGR%)
Table 38 North America Inflammatory Bowel Diseases Drugs Market Forecast by Distribution Channel, 2024-2034 (US$ Billion, AGR%, CAGR%)
Table 39 North America Inflammatory Bowel Diseases Drugs Market Forecast by Drug Class, 2024-2034 (US$ Billion, AGR%, CAGR%)
Table 40 North America Inflammatory Bowel Diseases Drugs Market Forecast by Drugs, 2024-2034 (US$ Billion, AGR%, CAGR%)
Table 41 U.S. Inflammatory Bowel Diseases Drugs Market Forecast, 2024-2034 (US$ Billion, AGR%, CAGR%)
Table 42 Canada Inflammatory Bowel Diseases Drugs Market Forecast, 2024-2034 (US$ Billion, AGR%, CAGR%)
Table 43 Europe Inflammatory Bowel Diseases Drugs Market Forecast by Country, 2024-2034 (US$ Billion, AGR%, CAGR%)
Table 44 Europe Inflammatory Bowel Diseases Drugs Market Forecast by Indication, 2024-2034 (US$ Billion, AGR%, CAGR%)
Table 45 Europe Inflammatory Bowel Diseases Drugs Market Forecast by Route of Administration, 2024-2034 (US$ Billion, AGR%, CAGR%)
Table 46 Europe Inflammatory Bowel Diseases Drugs Market Forecast by Distribution Channel, 2024-2034 (US$ Billion, AGR%, CAGR%)
Table 47 Europe Inflammatory Bowel Diseases Drugs Market Forecast by Drug Class, 2024-2034 (US$ Billion, AGR%, CAGR%)
Table 48 Europe Inflammatory Bowel Diseases Drugs Market Forecast by Drugs, 2024-2034 (US$ Billion, AGR%, CAGR%)
Table 49 Germany Inflammatory Bowel Diseases Drugs Market Forecast, 2024-2034 (US$ Billion, AGR%, CAGR%)
Table 50 France Inflammatory Bowel Diseases Drugs Market Forecast, 2024-2034 (US$ Billion, AGR%, CAGR%)
Table 51 UK Inflammatory Bowel Diseases Drugs Market Forecast, 2024-2034 (US$ Billion, AGR%, CAGR%)
Table 52 Italy Inflammatory Bowel Diseases Drugs Market Forecast, 2024-2034 (US$ Billion, AGR%, CAGR%)
Table 53 Spain Inflammatory Bowel Diseases Drugs Market Forecast, 2024-2034 (US$ Billion, AGR%, CAGR%)
Table 54 Rest of Europe Inflammatory Bowel Diseases Drugs Market Forecast, 2024-2034 (US$ Billion, AGR%, CAGR%)
Table 55 Asia Pacific Vaccine Contract Manufacturing Market Forecast by Country, 2024-2034 (US$ Billion, AGR%, CAGR%)
Table 56 Asia Pacific Inflammatory Bowel Diseases Drugs Market Forecast by Indication, 2024-2034 (US$ Billion, AGR%, CAGR%)
Table 57 Asia Pacific Inflammatory Bowel Diseases Drugs Market Forecast by Route of Administration, 2024-2034 (US$ Billion, AGR%, CAGR%)
Table 58 Asia Pacific Inflammatory Bowel Diseases Drugs Market Forecast by Distribution Channel, 2024-2034 (US$ Billion, AGR%, CAGR%)
Table 59 Asia Pacific Inflammatory Bowel Diseases Drugs Market Forecast by Drug Class, 2024-2034 (US$ Billion, AGR%, CAGR%)
Table 60 Asia Pacific Inflammatory Bowel Diseases Drugs Market Forecast by Drugs, 2024-2034 (US$ Billion, AGR%, CAGR%)
Table 61 Japan Inflammatory Bowel Diseases Drugs Market Forecast, 2024-2034 (US$ Billion, AGR%, CAGR%)
Table 62 China Inflammatory Bowel Diseases Drugs Market Forecast, 2024-2034 (US$ Billion, AGR%, CAGR%)
Table 63 India Inflammatory Bowel Diseases Drugs Market Forecast, 2024-2034 (US$ Billion, AGR%, CAGR%)
Table 64 Australia Inflammatory Bowel Diseases Drugs Market Forecast, 2024-2034 (US$ Billion, AGR%, CAGR%)
Table 65 South Korea Inflammatory Bowel Diseases Drugs Market Forecast, 2024-2034 (US$ Billion, AGR%, CAGR%)
Table 66 Rest of Asia Pacific Inflammatory Bowel Diseases Drugs Market Forecast, 2024-2034 (US$ Billion, AGR%, CAGR%)
Table 67 Latin America Inflammatory Bowel Diseases Drugs Market Forecast by Country, 2024-2034 (US$ Billion, AGR%, CAGR%)
Table 68 Latin America Inflammatory Bowel Diseases Drugs Market Forecast by Indication, 2024-2034 (US$ Billion, AGR%, CAGR%)
Table 69 Latin America Inflammatory Bowel Diseases Drugs Market Forecast by Route of Administration, 2024-2034 (US$ Billion, AGR%, CAGR%)
Table 70 Latin America Inflammatory Bowel Diseases Drugs Market Forecast by Distribution Channel, 2024-2034 (US$ Billion, AGR%, CAGR%)
Table 71 Latin America Inflammatory Bowel Diseases Drugs Market Forecast by Drug Class, 2024-2034 (US$ Billion, AGR%, CAGR%)
Table 72 Latin America Inflammatory Bowel Diseases Drugs Market Forecast by Drugs, 2024-2034 (US$ Billion, AGR%, CAGR%)
Table 73 Brazil Inflammatory Bowel Diseases Drugs Market Forecast, 2024-2034 (US$ Billion, AGR%, CAGR%)
Table 74 Mexico Inflammatory Bowel Diseases Drugs Market Forecast, 2024-2034 (US$ Billion, AGR%, CAGR%)
Table 75 Rest of Latin America Inflammatory Bowel Diseases Drugs Market Forecast, 2024-2034 (US$ Billion, AGR%, CAGR%)
Table 76 Middle East and Africa Inflammatory Bowel Diseases Drugs Market Forecast by Country, 2024-2034 (US$ Billion, AGR%, CAGR%)
Table 77 Middle East and Africa Inflammatory Bowel Diseases Drugs Market Forecast by Indication, 2024-2034 (US$ Billion, AGR%, CAGR%)
Table 78 Middle East and Africa Inflammatory Bowel Diseases Drugs Market Forecast by Route of Administration, 2024-2034 (US$ Billion, AGR%, CAGR%)
Table 79 Middle East and Africa Inflammatory Bowel Diseases Drugs Market Forecast by Distribution Channel, 2024-2034 (US$ Billion, AGR%, CAGR%)
Table 80 Middle East and Africa Inflammatory Bowel Diseases Drugs Market Forecast by Drug Class, 2024-2034 (US$ Billion, AGR%, CAGR%)
Table 81 Middle East and Africa Inflammatory Bowel Diseases Drugs Market Forecast by Drugs, 2024-2034 (US$ Billion, AGR%, CAGR%)
Table 82 GCC Inflammatory Bowel Diseases Drugs Market Forecast, 2024-2034 (US$ Billion, AGR%, CAGR%)
Table 83 South Africa Inflammatory Bowel Diseases Drugs Market Forecast, 2024-2034 (US$ Billion, AGR%, CAGR%)
Table 84 Rest of MEA Inflammatory Bowel Diseases Drugs Market Forecast, 2024-2034 (US$ Billion, AGR%, CAGR%)
Table 85 Strategic Outlook
Table 86 AbbVie: Key Details, (CEO, HQ, Revenue, Founded, No. of Employees, Company Type, Website, Business Segment)
Table 87 AbbVie: Product Benchmarking
Table 88 AbbVie: Strategic Outlook
Table 89 Johnsons & Johnsons: Key Details, (CEO, HQ, Revenue, Founded, No. of Employees, Company Type, Website, Business Segment)
Table 90 Johnsons & Johnsons: Product Benchmarking
Table 91 Johnsons & Johnsons: Strategic Outlook
Table 92 Takeda Pharmaceutical Company Limited: Key Details, (CEO, HQ, Revenue, Founded, No. of Employees, Company Type, Website, Business Segment)
Table 93 Takeda Pharmaceutical Company Limited: Product Benchmarking
Table 94 Takeda Pharmaceutical Company Limited: Strategic Outlook
Table 95 Pfizer: Key Details, (CEO, HQ, Revenue, Founded, No. of Employees, Company Type, Website, Business Segment)
Table 96 Pfizer: Product Benchmarking
Table 97 Pfizer: Strategic Outlook
Table 98 Novartis AG: Key Details, (CEO, HQ, Revenue, Founded, No. of Employees, Company Type, Website, Business Segment)
Table 99 Novartis AG: Product Benchmarking
Table 100 Novartis AG: Strategic Outlook
Table 101 UCB S.A.: Key Details, (CEO, HQ, Revenue, Founded, No. of Employees, Company Type, Website, Business Segment)
Table 102 UCB S.A.: Product Benchmarking
Table 103 UCB S.A.: Strategic Outlook
Table 104 Biogen: Key Details, (CEO, HQ, Revenue, Founded, No. of Employees, Company Type, Website, Business Segment)
Table 105 Biogen: Product Benchmarking
Table 106 Biogen: Strategic Outlook
Table 107 F. Hoffmann-La Roche Ltd: Key Details, (CEO, HQ, Revenue, Founded, No. of Employees, Company Type, Website, Business Segment)
Table 108 F. Hoffmann-La Roche Ltd: Product Benchmarking
Table 109 Celltrion Corporation: Key Details, (CEO, HQ, Revenue, Founded, No. of Employees, Company Type, Website, Business Segment)
Table 110 Celltrion Corporation: Product Benchmarking
Table 111 Celltrion Corporation: Strategic Outlook
Table 112 Ferring B.V.: Key Details, (CEO, HQ, Revenue, Founded, No. of Employees, Company Type, Website, Business Segment)
Table 113 Ferring B.V.: Product Benchmarking
Table 114 Ferring B.V.: Strategic Outlook
List of Figures
Figure 1 Inflammatory Bowel Diseases Drugs Market Segmentation
Figure 2 Inflammatory Bowel Diseases Drugs Market by Indication: Market Attractiveness Index
Figure 3 Inflammatory Bowel Diseases Drugs Market by Route of Administration: Market Attractiveness Index
Figure 4 Inflammatory Bowel Diseases Drugs Market by Distribution Channel: Market Attractiveness Index
Figure 5 Inflammatory Bowel Diseases Drugs Market by Drug Class: Market Attractiveness Index
Figure 6 Inflammatory Bowel Diseases Drugs Market by Drugs: Market Attractiveness Index
Figure 7 Inflammatory Bowel Diseases Drugs Market Attractiveness Index by Region
Figure 8 Inflammatory Bowel Diseases Drugs Market: Market Dynamics
Figure 9 Inflammatory Bowel Diseases Drugs Market by Region, 2024-2034 (US$ Billion, AGR %): “V” Shaped Recovery
Figure 10 Inflammatory Bowel Diseases Drugs Market by Region, 2024-2034 (US$ Billion, AGR %): “U” Shaped Recovery
Figure 11 Inflammatory Bowel Diseases Drugs Market by Region, 2024-2034 (US$ Billion, AGR %): “W” Shaped Recovery
Figure 12 Inflammatory Bowel Diseases Drugs Market by Region, 2024-2034 (US$ Billion, AGR %): “L” Shaped Recovery
Figure 13 Inflammatory Bowel Diseases Drugs Market: Porter’s Five Forces Analysis
Figure 14 IBD Drugs Market: PEST Analysis
Figure 15 Inflammatory Bowel Diseases Drugs Market by Indication: Market Attractiveness Index
Figure 16 Inflammatory Bowel Diseases Drugs Market Forecast by Indication, 2024-2034 (US$ Billion, AGR %)
Figure 17 Inflammatory Bowel Diseases Drugs Market Share Forecast by Indication, 2024, 2029, 2034 (%)
Figure 18 Crohn’s Disease Segment Market Forecast by Region, 2024-2034 (US$ Billion, AGR %)
Figure 19 Crohn’s Disease Segment Market Share Forecast by Region, 2024 & 2034 (%)
Figure 20 Ulcerative Colitis Segment Market Forecast by Region, 2024-2034 (US$ Billion, AGR %)
Figure 21 Ulcerative Colitis Segment Market Share Forecast by Region, 2024 & 2034 (%)
Figure 22 Inflammatory Bowel Diseases Drugs Market by Route of Administration: Market Attractiveness Index
Figure 23 Inflammatory Bowel Diseases Drugs Market Forecast by Route of Administration, 2024-2034 (US$ Billion, AGR %)
Figure 24 Inflammatory Bowel Diseases Drugs Market Share Forecast by Route of Administration, 2024, 2029, 2034 (%)
Figure 25 Oral Segment Market Forecast by Region, 2024-2034 (US$ Billion, AGR %)
Figure 26 Oral Segment Market Share Forecast by Region, 2024 & 2034 (%)
Figure 27 Parental Segment Market Forecast by Region, 2024-2034 (US$ Billion, AGR %)
Figure 28 Parenteral Segment Market Share Forecast by Region, 2024 & 2034 (%)
Figure 29 Rectal Segment Market Forecast by Region, 2024-2034 (US$ Billion, AGR %)
Figure 30 Rectal Segment Market Share Forecast by Region, 2024 & 2034 (%)
Figure 31 Inflammatory Bowel Diseases Drugs Market by Distribution Channel: Market Attractiveness Index
Figure 32 Inflammatory Bowel Diseases Drugs Market Forecast by Distribution Channel, 2024-2034 (US$ Billion, AGR %)
Figure 33 Inflammatory Bowel Diseases Drugs Market Share Forecast by Distribution Channel, 2024, 2029, 2034 (%)
Figure 34 Hospital Pharmacy Segment Market Forecast by Region, 2024-2034 (US$ Billion, AGR %)
Figure 35 Hospital Pharmacy Segment Market Share Forecast by Region, 2024 & 2034 (%)
Figure 36 Retail Pharmacy Segment Market Forecast by Region, 2024-2034 (US$ Billion, AGR %)
Figure 37 Retail Pharmacy Segment Market Share Forecast by Region, 2024 & 2034 (%)
Figure 38 E-commerce Pharmacy Segment Market Forecast by Region, 2024-2034 (US$ Billion, AGR %)
Figure 39 E-commerce Pharmacy Segment Market Share Forecast by Region, 2024 & 2034 (%)
Figure 40 Others Segment Market Forecast by Region, 2024-2034 (US$ Billion, AGR %)
Figure 41 Others Segment Market Share Forecast by Region, 2024 & 2034 (%)
Figure 42 Inflammatory Bowel Diseases Drugs Market by Drug Class: Market Attractiveness Index
Figure 43 Inflammatory Bowel Diseases Drugs Market Forecast by Drug Class, 2024-2034 (US$ Billion, AGR %)
Figure 44 Inflammatory Bowel Diseases Drugs Market Share Forecast by Drug Class, 2024, 2029, 2034 (%)
Figure 45 TNF-alpha Blockers Segment Market Forecast by Region, 2024-2034 (US$ Billion, AGR %)
Figure 46 TNF-alpha Blockers Segment Market Share Forecast by Region, 2024 & 2034 (%)
Figure 47 Integrin Blockers Segment Market Forecast by Region, 2024-2034 (US$ Billion, AGR %)
Figure 48 Integrin Blockers Segment Market Share Forecast by Region, 2024 & 2034 (%)
Figure 49 Interleukin Inhibitors Segment Market Forecast by Region, 2024-2034 (US$ Billion, AGR %)
Figure 50 Interleukin Inhibitors Segment Market Share Forecast by Region, 2024 & 2034 (%)
Figure 51 JAK inhibitors Segment Market Forecast by Region, 2024-2034 (US$ Billion, AGR %)
Figure 52 JAK inhibitors Segment Market Share Forecast by Region, 2024 & 2034 (%)
Figure 53 S1Ps Modulators and Others Segment Market Forecast by Region, 2024-2034 (US$ Billion, AGR %)
Figure 54 S1Ps Modulators and Others Segment Market Share Forecast by Region, 2024 & 2034 (%)
Figure 55 Inflammatory Bowel Diseases Drugs Market by Drugs: Market Attractiveness Index
Figure 56 Inflammatory Bowel Diseases Drugs Market Forecast by Drugs, 2024-2034 (US$ Billion, AGR %)
Figure 57 Inflammatory Bowel Diseases Drugs Market Share Forecast by Drug Class, 2024, 2029, 2034 (%)
Figure 58 Cimzia Segment Market Forecast by Region, 2024-2034 (US$ Billion, AGR %)
Figure 59 Cimzia Segment Market Share Forecast by Region, 2024 & 2034 (%)
Figure 60 Entyvio Segment Market Forecast by Region, 2024-2034 (US$ Billion, AGR %)
Figure 61 Entyvio Segment Market Share Forecast by Region, 2024 & 2034 (%)
Figure 62 Humira Segment Market Forecast by Region, 2024-2034 (US$ Billion, AGR %)
Figure 63 Humira Segment Market Share Forecast by Region, 2024 & 2034 (%)
Figure 64 Rinvoq Segment Market Forecast by Region, 2024-2034 (US$ Billion, AGR %)
Figure 65 Rinvoq Segment Market Share Forecast by Region, 2024 & 2034 (%)
Figure 66 Skyrizi Segment Market Forecast by Region, 2024-2034 (US$ Billion, AGR %)
Figure 67 Skyrizi Segment Market Share Forecast by Region, 2024 & 2034 (%)
Figure 68 Remicade Segment Market Forecast by Region, 2024-2034 (US$ Billion, AGR %)
Figure 69 Remicade Segment Market Share Forecast by Region, 2024 & 2034 (%)
Figure 70 Simponi Segment Market Forecast by Region, 2024-2034 (US$ Billion, AGR %)
Figure 71 Simponi Segment Market Share Forecast by Region, 2024 & 2034 (%)
Figure 72 Stelara Segment Market Forecast by Region, 2024-2034 (US$ Billion, AGR %)
Figure 73 Stelara Segment Market Share Forecast by Region, 2024 & 2034 (%)
Figure 74 Others Segment Market Forecast by Region, 2024-2034 (US$ Billion, AGR %)
Figure 75 Others Segment Market Share Forecast by Region, 2024 & 2034 (%)
Figure 76 Inflammatory Bowel Diseases Drugs Market Forecast by Region 2024 and 2034 (Revenue, CAGR%)
Figure 77 Inflammatory Bowel Diseases Drugs Market Share Forecast by Region 2024, 2029, 2034 (%)
Figure 78 Inflammatory Bowel Diseases Drugs Market by Region, 2024-2034 (US$ Billion, AGR %)
Figure 79 North America Inflammatory Bowel Diseases Drugs Market Attractiveness Index
Figure 80 North America Inflammatory Bowel Diseases Drugs Market by Region, 2024, 2029 & 2034 (US$ Billion)
Figure 81 North America Inflammatory Bowel Diseases Drugs Market Forecast by Country, 2024-2034 (US$ Billion, AGR %)
Figure 82 North America Inflammatory Bowel Diseases Drugs Market Share Forecast by Country, 2024 & 2034 (%)
Figure 83 North America Inflammatory Bowel Diseases Drugs Market Forecast by Indication, 2024-2034 (US$ Billion, AGR %)
Figure 84 North America Inflammatory Bowel Diseases Drugs Market Share Forecast by Indication, 2024 & 2034 (%)
Figure 85 North America Inflammatory Bowel Diseases Drugs Market Forecast by Route of Administration, 2024-2034 (US$ Billion, AGR %)
Figure 86 North America Inflammatory Bowel Diseases Drugs Market Share Forecast by Route of Administration, 2024 & 2034 (%)
Figure 87 North America Inflammatory Bowel Diseases Drugs Market Forecast by Distribution Channel, 2024-2034 (US$ Billion, AGR %)
Figure 88 North America Inflammatory Bowel Diseases Drugs Market Share Forecast by Distribution Channel, 2024 & 2034 (%)
Figure 89 North America Inflammatory Bowel Diseases Drugs Market Forecast by Drug Class, 2024-2034 (US$ Billion, AGR %)
Figure 90 North America Inflammatory Bowel Diseases Drugs Market Share Forecast by Drug Class, 2024 & 2034 (%)
Figure 91 North America Inflammatory Bowel Diseases Drugs Market Forecast by Drugs, 2024-2034 (US$ Billion, AGR %)
Figure 92 North America Inflammatory Bowel Diseases Drugs Market Share Forecast by Drugs, 2024 & 2034 (%)
Figure 93 U.S. Inflammatory Bowel Diseases Drugs Market Forecast, 2024-2034 (US$ Billion, AGR %)
Figure 94 Canada Inflammatory Bowel Diseases Drugs Market Forecast, 2024-2034 (US$ Billion, AGR %)
Figure 95 Europe Inflammatory Bowel Diseases Drugs Market Attractiveness Index
Figure 96 Europe Inflammatory Bowel Diseases Drugs Market by Region, 2024, 2029 & 2034 (US$ Billion)
Figure 97 Europe Inflammatory Bowel Diseases Drugs Market Forecast by Country, 2024-2034 (US$ Billion, AGR %)
Figure 98 Europe Inflammatory Bowel Diseases Drugs Market Share Forecast by Country, 2024 & 2034 (%)
Figure 99 Europe Inflammatory Bowel Diseases Drugs Market Forecast by Indication, 2024-2034 (US$ Billion, AGR %)
Figure 100 Europe Inflammatory Bowel Diseases Drugs Market Share Forecast by Indication, 2024 & 2034 (%)
Figure 101 Europe Inflammatory Bowel Diseases Drugs Market Forecast by Route of Administration, 2024-2034 (US$ Billion, AGR %)
Figure 102 Europe Inflammatory Bowel Diseases Drugs Market Share Forecast by Route of Administration, 2024 & 2034 (%)
Figure 103 Europe Inflammatory Bowel Diseases Drugs Market Forecast by Distribution Channel, 2024-2034 (US$ Billion, AGR %)
Figure 104 Europe Inflammatory Bowel Diseases Drugs Market Share Forecast by Distribution Channel, 2024 & 2034 (%)
Figure 105 Europe Inflammatory Bowel Diseases Drugs Market Forecast by Drug Class, 2024-2034 (US$ Billion, AGR %)
Figure 106 Europe Inflammatory Bowel Diseases Drugs Market Share Forecast by Drug Class, 2024 & 2034 (%)
Figure 107 Europe Inflammatory Bowel Diseases Drugs Market Forecast by Drugs, 2024-2034 (US$ Billion, AGR %)
Figure 108 Europe Inflammatory Bowel Diseases Drugs Market Share Forecast by Drugs, 2024 & 2034 (%)
Figure 109 Germany Inflammatory Bowel Diseases Drugs Market Forecast, 2024-2034 (US$ Billion, AGR %)
Figure 110 France Inflammatory Bowel Diseases Drugs Market Forecast, 2024-2034 (US$ Billion, AGR %)
Figure 111 UK Inflammatory Bowel Diseases Drugs Market Forecast, 2024-2034 (US$ Billion, AGR %)
Figure 112 Italy Inflammatory Bowel Diseases Drugs Market Forecast, 2024-2034 (US$ Billion, AGR %)
Figure 113 Spain Inflammatory Bowel Diseases Drugs Market Forecast, 2024-2034 (US$ Billion, AGR %)
Figure 114 Rest of Europe Inflammatory Bowel Diseases Drugs Market Forecast, 2024-2034 (US$ Billion, AGR %)
Figure 115 Asia Pacific Inflammatory Bowel Diseases Drugs Market Attractiveness Index
Figure 116 Asia Pacific Inflammatory Bowel Diseases Drugs Market by Region, 2024, 2029 & 2034 (US$ Billion)
Figure 117 Asia Pacific Inflammatory Bowel Diseases Drugs Market Forecast by Country, 2024-2034 (US$ Billion, AGR %)
Figure 118 Asia Pacific Inflammatory Bowel Diseases Drugs Market Share Forecast by Country, 2024 & 2034 (%)
Figure 119 Asia Pacific Inflammatory Bowel Diseases Drugs Market Forecast by Indication, 2024-2034 (US$ Billion, AGR %)
Figure 120 Asia Pacific Inflammatory Bowel Diseases Drugs Market Share Forecast by Indication, 2024 & 2034 (%)
Figure 121 Asia Pacific Inflammatory Bowel Diseases Drugs Market Forecast by Route of Administration, 2024-2034 (US$ Billion, AGR %)
Figure 122 Asia Pacific Inflammatory Bowel Diseases Drugs Market Share Forecast by Route of Administration, 2024 & 2034 (%)
Figure 123 Asia Pacific Inflammatory Bowel Diseases Drugs Market Forecast by Distribution Channel, 2024-2034 (US$ Billion, AGR %)
Figure 124 Asia Pacific Inflammatory Bowel Diseases Drugs Market Share Forecast by Distribution Channel, 2024 & 2034 (%)
Figure 125 Asia Pacific Inflammatory Bowel Diseases Drugs Market Forecast by Drug Class, 2024-2034 (US$ Billion, AGR %)
Figure 126 Asia Pacific Inflammatory Bowel Diseases Drugs Market Share Forecast by Drug Class, 2024 & 2034 (%)
Figure 127 Asia Pacific Inflammatory Bowel Diseases Drugs Market Forecast by Drugs, 2024-2034 (US$ Billion, AGR %)
Figure 128 Asia Pacific Inflammatory Bowel Diseases Drugs Market Share Forecast by Drugs, 2024 & 2034 (%)
Figure 129 Japan Inflammatory Bowel Diseases Drugs Market Forecast, 2024-2034 (US$ Billion, AGR %)
Figure 130 China Inflammatory Bowel Diseases Drugs Market Forecast, 2024-2034 (US$ Billion, AGR %)
Figure 131 India Inflammatory Bowel Diseases Drugs Market Forecast, 2024-2034 (US$ Billion, AGR %)
Figure 132 Australia Inflammatory Bowel Diseases Drugs Market Forecast, 2024-2034 (US$ Billion, AGR %)
Figure 133 South Korea Inflammatory Bowel Diseases Drugs Market Forecast, 2024-2034 (US$ Billion, AGR %)
Figure 134 Rest of Asia Pacific Inflammatory Bowel Diseases Drugs Market Forecast, 2024-2034 (US$ Billion, AGR %)
Figure 135 Latin America Inflammatory Bowel Diseases Drugs Market Attractiveness Index
Figure 136 Latin America Inflammatory Bowel Diseases Drugs Market by Region, 2024, 2029 & 2034 (US$ Billion)
Figure 137 Latin America Inflammatory Bowel Diseases Drugs Market Forecast by Country, 2024-2034 (US$ Billion, AGR %)
Figure 138 Latin America Inflammatory Bowel Diseases Drugs Market Share Forecast by Country, 2024 & 2034 (%)
Figure 139 Latin America Inflammatory Bowel Diseases Drugs Market Forecast by Indication, 2024-2034 (US$ Billion, AGR %)
Figure 140 Latin America Inflammatory Bowel Diseases Drugs Market Share Forecast by Indication, 2024 & 2034 (%)
Figure 141 Latin America Inflammatory Bowel Diseases Drugs Market Forecast by Route of Administration, 2024-2034 (US$ Billion, AGR %)
Figure 142 Latin America Inflammatory Bowel Diseases Drugs Market Share Forecast by Route of Administration, 2024 & 2034 (%)
Figure 143 Latin America Inflammatory Bowel Diseases Drugs Market Forecast by Distribution Channel, 2024-2034 (US$ Billion, AGR %)
Figure 144 Latin America Inflammatory Bowel Diseases Drugs Market Share Forecast by Distribution Channel, 2024 & 2034 (%)
Figure 145 Latin America Inflammatory Bowel Diseases Drugs Market Forecast by Drug Class, 2024-2034 (US$ Billion, AGR %)
Figure 146 Latin America Inflammatory Bowel Diseases Drugs Market Share Forecast by Drug Class, 2024 & 2034 (%)
Figure 147 Latin America Inflammatory Bowel Diseases Drugs Market Forecast by Drugs, 2024-2034 (US$ Billion, AGR %)
Figure 148 Latin America Inflammatory Bowel Diseases Drugs Market Share Forecast by Drugs, 2024 & 2034 (%)
Figure 149 Brazil Inflammatory Bowel Diseases Drugs Market Forecast, 2024-2034 (US$ Billion, AGR %)
Figure 150 Mexico Inflammatory Bowel Diseases Drugs Market Forecast, 2024-2034 (US$ Billion, AGR %)
Figure 151 Rest of Latin America Inflammatory Bowel Diseases Drugs Market Forecast, 2024-2034 (US$ Billion, AGR %)
Figure 152 Middle East and Africa Inflammatory Bowel Diseases Drugs Market Attractiveness Index
Figure 153 Middle East and Africa Inflammatory Bowel Diseases Drugs Market by Region, 2024, 2029 & 2034 (US$ Billion)
Figure 154 Middle East and Africa Inflammatory Bowel Diseases Drugs Market Forecast by Country, 2024-2034 (US$ Billion, AGR %)
Figure 155 Middle East and Africa Inflammatory Bowel Diseases Drugs Market Share Forecast by Country, 2024 & 2034 (%)
Figure 156 Middle East and Africa Inflammatory Bowel Diseases Drugs Market Forecast by Indication, 2024-2034 (US$ Billion, AGR %)
Figure 157 Middle East and Africa Inflammatory Bowel Diseases Drugs Market Share Forecast by Indication, 2024 & 2034 (%)
Figure 158 Middle East and Africa Inflammatory Bowel Diseases Drugs Market Forecast by Route of Administration, 2024-2034 (US$ Billion, AGR %)
Figure 159 Middle East and Africa Inflammatory Bowel Diseases Drugs Market Share Forecast by Route of Administration, 2024 & 2034 (%)
Figure 160 Middle East and Africa Inflammatory Bowel Diseases Drugs Market Forecast by Distribution Channel, 2024-2034 (US$ Billion, AGR %)
Figure 161 Middle East and Africa Inflammatory Bowel Diseases Drugs Market Share Forecast by Distribution Channel, 2024 & 2034 (%)
Figure 162 Middle East and Africa Inflammatory Bowel Diseases Drugs Market Forecast by Drug Class, 2024-2034 (US$ Billion, AGR %)
Figure 163 Middle East and Africa Inflammatory Bowel Diseases Drugs Market Share Forecast by Drug Class, 2024 & 2034 (%)
Figure 164 Middle East and Africa Inflammatory Bowel Diseases Drugs Market Forecast by Drugs, 2024-2034 (US$ Billion, AGR %)
Figure 165 Middle East and Africa Inflammatory Bowel Diseases Drugs Market Share Forecast by Drugs, 2024 & 2034 (%)
Figure 166 GCC Inflammatory Bowel Diseases Drugs Market Forecast, 2024-2034 (US$ Billion, AGR %)
Figure 167 South Africa Inflammatory Bowel Diseases Drugs Market Forecast, 2024-2034 (US$ Billion, AGR %)
Figure 168 Rest of MEA Inflammatory Bowel Diseases Drugs Market Forecast, 2024-2034 (US$ Billion, AGR %)
Figure 169 Inflammatory Bowel Diseases Drugs Market: Company Share/Ranking, 2023
Figure 170 AbbVie: Net Revenue, 2018-2022 (US$ Million, AGR%)
Figure 171 AbbVie: R&D, 2018-2022 (US$ Million, AGR%)
Figure 172 AbbVie: Regional Market Shares, 2022
Figure 173 Johnson & Johnson Private Limited: Annual Revenue, 2018-2022 (US$ Million, AGR%)
Figure 174 Johnson & Johnson Private Limited: Regional Market Shares, 2022
Figure 175 Takeda Pharmaceutical Company Limited: Net Revenue, 2019-2023 (US$ Billion, AGR%)
Figure 176 Takeda Pharmaceutical Company Limited: R&D, 2019-2023 (US$ Billion, AGR%)
Figure 177 Takeda Pharmaceutical Company Limited: Regional Market Shares, 2022
Figure 178 Pfizer: Net Revenue, 2018-2022 (US$ Million, AGR%)
Figure 179 Pfizer: R&D, 2018-2022 (US$ Million, AGR%)
Figure 180 Pfizer: Regional Market Shares, 2022
Figure 181 Novartis AG: Net Revenue, 2018-2022 (US$ Billion, AGR%)
Figure 182 Novartis AG: R&D, 2018-2022 (US$ Billion, AGR%)
Figure 183 Novartis AG: Regional Market Shares, 2022
Figure 184 UCB S.A.: Net Revenue, 2019-20233 (US$ Billion, AGR%)
Figure 185 UCB S.A.: R&D, 2019-2023 (US$ Billion, AGR%)
Figure 186 UCB S.A.: Regional Market Shares, 2023
Figure 187 Biogen: Net Revenue, 2019-2023 (US$ Billion, AGR%)
Figure 188 Biogen: R&D, 2019-2023 (US$ Billion, AGR%)
Figure 189 F. Hoffmann-La Roche Ltd: Net Revenue, 2018-2022 (US$ Billion, AGR%)
Figure 190 F. Hoffmann-La Roche Ltd: R&D Expense, 2018-2022 (US$ Billion, AGR%)
Figure 191 Celltrion Corporation: Net Revenue, 2018-2022 (US$ Billion, AGR%)
Figure 192 Celltrion Corporation: R&D, 2018-2022 (US$ Billion, AGR%)
ページTOPに戻る
- 本レポートと同じKEY WORDの最新刊レポートはありません。
よくあるご質問
Visiongain社はどのような調査会社ですか?
英国の調査会社ヴィジョンゲイン社(Visiongain)は、通信とエネルギーのほか、自動車や化学・医薬品、金属など、広範な市場を対象に調査を行っています。自動車市場については、市場全般に関する調査のほ... もっと見る
調査レポートの納品までの日数はどの程度ですか?
在庫のあるものは速納となりますが、平均的には 3-4日と見て下さい。
但し、一部の調査レポートでは、発注を受けた段階で内容更新をして納品をする場合もあります。
発注をする前のお問合せをお願いします。
注文の手続きはどのようになっていますか?
1)お客様からの御問い合わせをいただきます。
2)見積書やサンプルの提示をいたします。
3)お客様指定、もしくは弊社の発注書をメール添付にて発送してください。
4)データリソース社からレポート発行元の調査会社へ納品手配します。
5) 調査会社からお客様へ納品されます。最近は、pdfにてのメール納品が大半です。
お支払方法の方法はどのようになっていますか?
納品と同時にデータリソース社よりお客様へ請求書(必要に応じて納品書も)を発送いたします。
お客様よりデータリソース社へ(通常は円払い)の御振り込みをお願いします。
請求書は、納品日の日付で発行しますので、翌月最終営業日までの当社指定口座への振込みをお願いします。振込み手数料は御社負担にてお願いします。
お客様の御支払い条件が60日以上の場合は御相談ください。
尚、初めてのお取引先や個人の場合、前払いをお願いすることもあります。ご了承のほど、お願いします。
データリソース社はどのような会社ですか?
当社は、世界各国の主要調査会社・レポート出版社と提携し、世界各国の市場調査レポートや技術動向レポートなどを日本国内の企業・公官庁及び教育研究機関に提供しております。
世界各国の「市場・技術・法規制などの」実情を調査・収集される時には、データリソース社にご相談ください。
お客様の御要望にあったデータや情報を抽出する為のレポート紹介や調査のアドバイスも致します。
|
|

