医療用画像機器市場レポート:2024-2034
Medical Imaging Devices Market Report 2024-2034
レポート詳細
医療用画像診断機器市場レポート 2023-2034年 :本レポートは、業界とその根底にあるダイナミクスをより良く理解したい場合、新たな収益ポケットを目指す大手企業にとって貴重なものと... もっと見る
※上記価格は部署ライセンス(Departmental licence)価格です。
その他の価格についてはデータリソースまでお問合せください。
日本語のページは自動翻訳を利用し作成しています。
実際のレポートは英文のみでご納品いたします。

|

|
サマリー
レポート詳細
医療用画像診断機器市場レポート 2023-2034年:本レポートは、業界とその根底にあるダイナミクスをより良く理解したい場合、新たな収益ポケットを目指す大手企業にとって貴重なものとなるでしょう。また、異業種への進出や新規地域での既存事業の拡大を目指す企業にも有用です。
高価な機器
高価な画像処理装置が市場の成長を妨げている。高度な技術を駆使した機器を高額で購入する必要があるため、さまざまな医療施設での導入が困難となる可能性がある。先進国はこのようなハイエンド機器を導入できるが、新興国は財政的な問題に直面している。新興国ではインフラや資金が不足しているため、こうした機器を導入して患者に高度な医療を提供することができない。そのため、製品やサービスの高額なコストとそれに伴うメンテナンス費用が市場に影響を及ぼすと予想される。
設備に関する複雑な規制
規制基準の導入に向けた世界各国の政府当局による取り組みの増加は、機器メーカーにとって障壁となっている。これらの規制には複雑な実施プロセスがあり、そのプロセスに伴う経済的負担や運用コストが増大する。例えば、米国FDAは、製造から流通、患者の使用まで、販売された医療機器を識別するために、固有の機器識別システム(UDI)を導入した。さらに、欧州連合(EU)の医療機器規則(MDR)では、文書化およびその他の要件がより厳しくなり、規制の遵守もより高いレベルになっています。例えば、医療機器指令(MDD)では重大インシデントの報告期限は30日でしたが、MDRではわずか15日となっています。
市場調査レポートを購入する前にすべき質問とは?
-
医療用画像診断機器市場はどのように進化しているのか?
-
何が医療用画像診断機器市場を牽引し、抑制しているのか?
-
医療用画像診断機器の各サブマーケットセグメントは予測期間中にどのように成長し、2034年にどれくらいの収益を占めるようになるのか?
-
2023年から2034年にかけて、医療用画像診断機器の各サブマーケットの市場シェアはどのように推移するのか?
-
2023年から2034年にかけて市場全体を牽引する主な要因は何か?
-
医療用画像診断機器の主要市場はマクロ経済の動きに大枠で追随するのか、それとも各国市場が他を凌駕するのか?
-
2034年までに各国市場のシェアはどう変化し、2034年に市場をリードするのはどの地域か?
-
主要プレイヤーは誰で、予測期間中の見通しは?
-
これらの主要企業の医療用画像診断機器プロジェクトは?
-
2023年から2034年の間に、業界はどのように発展していくのか?現在、そして将来にわたって行われている医療用画像
-
現在および今後10年間に行われる医療用画像診断機器のプロジェクトはどのような意味を持つのか?
-
医療用画像診断機器市場をさらに拡大するために、製品の商業化の必要性は高まっているか?
-
医療用画像診断機器市場はどこへ向かっているのか?
-
新製品やサービスラインに対する最適な投資オプションは何か?
-
企業を新たな成長軌道に乗せ、C-suiteに移行させるための重要な展望とは?
このことが、現在、そして今後10年間の医療用画像診断機器市場にどのような影響を与えるかを見極める必要がある:
-
312ページにわたる本レポートは、126の表、204のグラフ、チャートを提供する。
-
本レポートでは、業界における主要な有利分野を取り上げているため、今すぐターゲットを絞ることができる。
-
世界、地域、国の売上高と成長に関する詳細な分析が含まれている。
-
競合他社が成功した主なトレンド、変化、収益予測をハイライトします。
本レポートは、医療用画像診断機器市場が今後10年間にどのように発展していくのか、またCOVID-19の景気後退と好転の変動に合わせてどのように発展していくのかをTODAYでお伝えします。この市場は過去10年間のどの時点よりも今が重要である。
2034年までの予測やその他の分析により、商業的な展望が明らかになった。
-
2034年までの収益予測に加え、最新の実績、成長率、市場シェアも提供している。
-
ビジネスの展望や展開など、独自の分析が掲載されている。
-
定性的分析(市場ダイナミクス、促進要因、機会、阻害要因、課題を含む)、コスト構造、医療用画像診断機器の価格上昇の影響、最近の動向をご覧いただけます。
本レポートには、COVID-19が業界と貴社にどのような影響を与えるかについてのデータ分析と貴重な洞察が含まれている。本レポートでは、COVID-19の4つの回収パターンとその影響、すなわち「V」、「L」、「W」、「U」について論じている。
レポート対象セグメント
タイプ
-
MRIシステム
-
超音波:2D、3D、その他
-
CTスキャナーコンベンショナルCT、コーンビームCT
-
核画像システムSPECT、PET
-
X線画像診断システムデジタルX線システム、アナログX線システム
-
マンモグラフィーシステム
申し込み
-
心臓病学
-
婦人科/産科
-
整形外科・筋骨格系
-
放射線学
-
神経・脊椎
-
一般映像
-
その他
エンドユーザー
世界市場全体とセグメント別の収益予測に加え、5つの地域と20の主要国市場の収益予測も掲載しています:
北米
欧州
-
ドイツ
-
英国
-
フランス
-
イタリア
-
スペイン
-
その他の欧州
アジア太平洋
-
中国
-
日本
-
インド
-
オーストラリア
-
韓国
-
その他のアジア太平洋
ラテンアメリカ
MEA
また、医療用画像診断機器市場の2023年から2034年にかけての主要企業のプロファイルも掲載しており、これらの企業の事業のこのセグメントに焦点を当てている。
報告書に掲載されている主要企業
-
Canon Medical Systems
-
FUJIFILM VisualSonics Inc.
-
GE Healthcare
-
Hologic, Inc
-
Koning Corporation
-
Koninklijke Philips N.V.
-
Mindray Medical International
-
PerkinElmer, Inc. (Revvity Inc.)
-
Samsung Medison Co. Ltd
-
Siemens Healthineers AG
2023年から2034年にかけての医療用画像診断機器市場の世界全体の売上高は、金額ベースで2024年に543億米ドルを突破する。2034年まで力強い収益成長を予測。当調査では、最も大きな可能性を秘めた企業を特定しています。彼らの能力、進歩、商業的展望を発見し、一歩先を行くお手伝いをします。
医療用画像診断機器市場、2023-2034年レポートはどのように役立つのか?
要約すると、310ページを超えるこのレポートは、以下の知識を提供する:
-
医療用画像診断機器市場の2023年から2034年までの収益予測 世界および地域レベルでのタイプ、用途、エンドユーザー別の予測を掲載 - 業界の将来性を発見し、投資と収益に最も有利な場所を見つけます。
-
5つの地域と20の主要国市場の2034年までの収益予測 - 北米、欧州、アジア太平洋、中南米、MEAの医療用画像診断機器市場の2023年から2034年までの市場予測をご覧ください。また、米国、カナダ、メキシコ、ブラジル、ドイツ、フランス、英国、イタリア、中国、インド、日本、オーストラリアなどの主要国の市場も予測しています。
-
2023年から2034年までの医療用画像診断機器市場に関わる主要企業10社の企業プロファイルを含む。
独自の予測による定量的・定性的分析をご覧ください。私たちのレポートだけに含まれる情報を入手し、貴重なビジネスインテリジェンスで情報を得ることができます。
他にはない情報
私たちの新しいレポートがあれば、知識に遅れをとったり、チャンスを逃したりする可能性が低くなります。弊社の調査レポートが貴社の調査、分析、意思決定にどのように役立つかをご覧ください。Visiongainの調査は、医療用画像診断機器市場、2023年から2034年、市場をリードする企業の商業分析を必要とするすべての人のためのものです。データ、トレンド、予測をご覧いただけます。
ページTOPに戻る
目次
目次
1.レポート概要
1.1 研究の目的
1.2 医療用画像診断機器市場の紹介
1.3 本レポートの内容
1.4 本レポートを読むべき理由
1.5 本分析レポートが回答する主な質問は以下の通り:
1.6 本レポートの対象者
1.7 方法論
1.7.1 市場の定義
1.7.2 市場評価・予測手法
1.7.3 データの検証
1.8 よくある質問(FAQ)
1.9 関連レポート
1.10 Visiongainについて
2 エグゼクティブ・サマリー
2.1 地理的スナップショット医療用画像診断機器市場
2.2 タイプ別セグメント市場魅力度指数
2.3 アプリケーションセグメント:市場魅力度指数市場魅力度指数
2.4 エンドユーザーセグメント:市場魅力度指数
3 市場概要
3.1 主要な調査結果
3.2 市場ダイナミクス
3.2.1 市場促進要因
3.2.2 市場抑制要因
3.2.3 市場機会
3.2.4 課題
3.3 COVID-19の影響分析
3.4 ポーターのファイブフォース分析
3.4.1 供給者パワー
3.4.2 バイヤーパワー
3.4.3 競争ライバル
3.4.4 代替品による脅威
3.4.5 新規参入の脅威
4 医療用画像診断機器市場分析:タイプ別
4.1 主要調査結果
4.2 タイプ別セグメント 市場魅力度指数
4.3 タイプ別セグメントの成長展望
4.4 医療用画像診断機器のタイプ別市場規模推定と予測
4.5 MRIシステム
4.5.1 2024〜2034年の地域別市場規模(US$ Bn)
4.5.2 地域別市場シェア、2024-2034年(%)
4.6 超音波画像診断システム
4.6.1 2024-2034年の地域別市場規模(US$ Bn)
4.6.2 地域別市場シェア、2024-2034年(%)
4.7 CTスキャナー
4.7.1 2024-2034年の地域別市場規模(US$ Bn)
4.7.2 地域別市場シェア、2024-2034年 (%)
4.8 核医学イメージングシステム
4.8.1 2024-2034年の地域別市場規模(US$ Bn)
4.8.2 地域別市場シェア、2024-2034年(%)
4.9 X線イメージングシステム
4.9.1 2024-2034年の地域別市場規模(US$ Bn)
4.10 マンモグラフィシステム
4.10.1 2024-2034年の地域別市場規模(US$ Bn)
4.10.2 地域別市場シェア、2024-2034年 (%)
5 医療用画像診断機器市場分析:用途別
5.1 主な調査結果
5.2 アプリケーションセグメント 市場魅力度指数
5.3 医療用画像診断機器の用途別市場規模推定と予測
5.4 医療用画像診断機器の用途別市場シェア、2024年・2034年
5.5 循環器
5.5.1 2024〜2034年の地域別市場規模(US$ Bn)
5.5.2 地域別市場シェア、2024年~2034年(%)
5.6 婦人科/産科
5.6.1 2024〜2034年の地域別市場規模(US$ Bn)
5.6.2 地域別市場シェア、2024-2034年 (%)
5.7 整形外科・筋骨格系
5.7.1 2024〜2034年の地域別市場規模(US$ Bn)
5.7.2 地域別市場シェア、2024-2034年 (%)
5.8 放射線医学
5.8.1 2024-2034年地域別市場規模(US$ Bn)
5.8.2 地域別市場シェア、2024-2034年(%)
5.9 神経・脊椎
5.9.1 2024-2034年の地域別市場規模(US$ Bn)
5.9.2 地域別市場シェア、2024-2034年(%)
5.10 一般画像
5.10.1 2024-2034年の地域別市場規模(US$ Bn)
5.10.2 地域別市場シェア、2024-2034年(%)
5.11 その他
5.11.1 2024-2034年の地域別市場規模(US$ Bn)
5.11.2 地域別市場シェア、2024-2034年 (%)
6 医療用画像診断機器市場分析:エンドユーザー別
6.1 主要調査結果
6.2 エンドユーザーセグメント 市場魅力度指数
6.3 医療用画像診断機器のエンドユーザー別市場規模推定と予測
6.4 医療用画像診断機器のエンドユーザー別市場シェア、2024年、2029年、2034年
6.5 病院
6.5.1 2024〜2034年の地域別市場規模(US$ Bn)
6.5.2 地域別市場シェア、2024-2034年(%)
6.6 画像診断センター
6.6.1 2024〜2034年の地域別市場規模(US$ Bn)
6.6.2 地域別市場シェア、2024-2034年(%)
6.7 その他
6.7.1 2024〜2034年の地域別市場規模(US$ Bn)
6.7.2 地域別市場シェア、2024-2034年 (%)
7 医療用画像診断機器市場分析:地域別
7.1 主要な調査結果
7.2 地域別市場規模の推定と予測
8 北米医療用画像診断機器市場分析
8.1 主要な調査結果
8.2 北米の医療用画像診断機器市場魅力度指数
8.3 北米の医療用画像診断機器の国別市場、2024年、2029年、2034年(US$ Bn)
8.4 北米の医療用画像診断機器市場規模推定と予測:国別
8.5 北米の医療用画像診断機器市場規模推定と予測:タイプ別
8.6 北米の医療用画像診断機器市場規模推定と予測:用途別
8.7 北米の医療用画像診断機器市場規模推定と予測:エンドユーザー別
8.8 米国
8.8.1 米国の医療用画像診断機器市場:タイプ別
8.9 カナダ
8.9.1 カナダの医療用画像診断機器市場:タイプ別
9 欧州の医療用画像診断機器市場分析
9.1 主要な調査結果
9.2 欧州医療用画像診断機器市場魅力度指数
9.3 欧州の医療用画像診断機器の国別市場、2024年、2029年、2034年(US$ Bn)
9.4 欧州の医療用画像診断機器市場規模推定と予測:国別
9.5 欧州の医療用画像診断機器市場規模推定と予測:タイプ別
9.6 欧州の医療用画像診断機器市場規模推定と予測:用途別
9.7 欧州の医療用画像診断機器市場規模推定と予測:エンドユーザー別
9.8 ドイツ
9.8.1 ドイツの医療用画像診断機器市場:タイプ別
9.9 イギリス
9.9.1 イギリスの医療用画像診断機の市場:タイプ別
9.10 フランス
9.10.1 フランスの医療用画像診断機器市場:タイプ別
9.11 イタリア
9.11.1 イタリアの医療用画像診断機器市場:タイプ別
9.12 スペイン
9.12.1 スペインの医療用画像診断機器市場:タイプ別
9.13 その他の地域
9.13.1 その他の地域の医療用画像診断機器市場:タイプ別
10 アジア太平洋地域の医療用画像診断機器市場分析
10.1 主要な調査結果
10.2 アジア太平洋地域の医療用画像診断機器市場魅力度指数
10.3 アジア太平洋地域の医療用画像診断機器の国別市場、2024年、2029年、2034年(US$ Bn)
10.4 アジア太平洋地域の医療用画像診断機器市場規模推定と予測:国別
10.5 アジア太平洋地域の医療用画像診断機器市場規模推定と予測:タイプ別
10.6 アジア太平洋地域の医療用画像診断機器市場規模推定と予測:用途別
10.7 アジア太平洋地域の医療用画像診断機器市場規模推定と予測:エンドユーザー別
10.8 日本
10.8.1 日本の医療用画像診断機器市場:タイプ別
10.9 中国
10.9.1 中国の医療用画像診断機器市場:タイプ別
10.10 インド
10.10.1 インドの医療用画像診断機器市場:タイプ別
10.11 韓国
10.11.1 韓国の医療用画像診断機器市場:タイプ別
10.12 オーストラリア
10.12.1 オーストラリアの医療用画像診断機器市場:タイプ別
10.13 その他の地域
10.13.1 その他の地域の医療用画像診断機器市場:タイプ別
11 ラテンアメリカの医療用画像診断機器市場分析
11.1 主要な調査結果
11.2 ラテンアメリカの医療用画像診断機器市場魅力度指数
11.3 ラテンアメリカの医療用画像診断機器の国別市場:2024年、2029年、2034年 (US$ Bn)
11.4 ラテンアメリカの医療用画像診断機器市場規模推定と予測:国別
11.5 ラテンアメリカの医療用画像診断機器市場規模推定と予測:タイプ別
11.6 ラテンアメリカの医療用画像診断機器市場規模推定と予測:用途別
11.7 ラテンアメリカの医療用画像診断機器市場規模推定と予測:エンドユーザー別
11.8 ブラジル
11.8.1 ブラジルの医療用画像診断機器市場:タイプ別
11.9 メキシコ
11.9.1 メキシコの医療用画像診断機器市場:タイプ別
11.10 その他のラテンアメリカ
11.10.1 その他のラテンアメリカの医療用画像診断機器市場:タイプ別
12 MEAの医療用画像診断機器の市場分析
12.1 主要な調査結果
12.2 MEAの医療用画像診断機器市場の魅力度指数
12.3 MEAの医療用画像診断機器の国別市場:2024年、2029年、2034年 (億米ドル)
12.4 MEAの医療用画像診断機器市場規模推定と予測:国別
12.5 MEAの医療用画像診断機器市場規模推定と予測:タイプ別
12.6 MEAの医療用画像診断機器市場規模推定と予測:用途別
12.7 MEAの医療用画像診断機器市場規模推定と予測:エンドユーザー別
12.8 南アフリカ
12.8.1 南アフリカの医療用画像診断機器市場:タイプ別
12.9 GCC
12.9.1 GCCの医療用画像診断機器市場:タイプ別
12.10 その他のMEA
12.10.1 MEAのその他の地域医療用画像診断機器市場:タイプ別
13 競争環境
13.1 企業シェア分析
13.2 主要事業戦略分析
14 主要企業のプロファイル
14.1 Canon Medical Systems
14.1.1 会社概要
14.1.2 会社概要
14.1.3 財務分析
14.1.4 製品ベンチマーク
14.1.5 戦略的展望
14.2 FUJIFILM Visual Sonics Inc.
14.2.1 会社概要
14.2.2 会社概要
14.2.3 財務分析
14.2.4 製品ベンチマーク
14.2.5 戦略的展望
14.3 GE HEALTHCARE
14.3.1 会社概要
14.3.2 会社概要
14.3.3 財務分析
14.3.4 製品ベンチマーク
14.3.5 戦略的展望
14.4 Hologic, Inc
14.4.1 会社概要
14.4.2 会社概要
14.4.3 財務分析
14.4.4 製品ベンチマーク
14.4.5 戦略的展望
14.5 Koning Corporation
14.5.1 会社概要
14.5.2 会社概要
14.5.3 財務分析
14.5.4 製品ベンチマーク
14.5.5 戦略的展望
14.6 Koninklijke Philips N.V.
14.6.1 会社概要
14.6.2 会社概要
14.6.3 財務分析
14.6.4 製品ベンチマーク
14.6.5 戦略的展望
14.7 Mindray Medical International
14.7.1 会社概要
14.7.2 会社概要
14.7.3 財務分析
14.7.4 製品ベンチマーク
14.7.5 戦略的展望
14.8 PerkinElmer, Inc. (Revvity Inc.)
14.8.1 会社概要
14.8.2 会社概要
14.8.3 財務分析
14.8.4 製品ベンチマーク
14.8.5 戦略的展望
14.9 Samsung Medison Co.Ltd
14.9.1 会社概要
14.9.2 会社概要
14.9.3 財務分析
14.9.4 製品ベンチマーク
14.9.5 戦略的展望
14.10 Siemens Healthineers AG
14.10.1 会社概要
14.10.2 会社概要
14.10.3 財務分析
14.10.4 製品ベンチマーク
14.10.5 戦略的展望
15 結論と提言
15.1 報告書の最終所見
15.2 市場関係者への提言
ページTOPに戻る
プレスリリース
表の一覧
Table 1 Global Medical imaging devices market Snapshot, 2024 & 2034 (US$ Billion, CAGR %)
Table 2 Medical Imaging Devices Market Forecast by Region, 2022-2032 (US$ Bn, AGR %, CAGR %) (V-shaped Recovery)
Table 3 Medical Imaging Devices Market Forecast by Region, 2024-2034 (US$ Bn, AGR %, CAGR %) (U-shaped Recovery)
Table 4 Medical Imaging Devices Market Forecast by Region, 2024-2034 (US$ Bn, AGR %, CAGR %) (W-shaped Recovery)
Table 5 Medical Imaging Devices Market Forecast by Region, 2022-2032 (US$ Bn, AGR %, CAGR %) (L-shaped Recovery)
Table 6 Medical Imaging Devices Type Market, 2024-2034 (US$ Bn, AGR (%), CAGR (%))
Table 7 MRI systems Market Forecast by Region, 2024-2034 (US$ Bn, AGR (%), CAGR (%))
Table 8 Ultrasound systems Market Forecast by Region, 2024-2034 (US$ Bn, AGR (%), CAGR (%))
Table 9 2D Ultrasound Systems Market, 2024-2034 (US$ Bn, AGR (%), CAGR (%))
Table 10 3D Ultrasound Systems Market, 2024-2034 (US$ Bn, AGR (%), CAGR (%))
Table 11 Others Market, 2024-2034 (US$ Bn, AGR (%), CAGR (%))
Table 12 CT Scanners Market Forecast by Region, 2024-2034 (US$ Bn, AGR (%), CAGR (%))
Table 13 Conventional CT Scanners Type Market, 2024-2034 (US$ Bn, AGR (%), CAGR (%))
Table 14 CT Scanners Type Market, 2024-2034 (US$ Bn, AGR (%), CAGR (%))
Table 15 Nuclear imaging systems Market Forecast by Region, 2024-2034 (US$ Bn, AGR (%), CAGR (%))
Table 16 SPECT Systems Market, 2024-2034 (US$ Bn, AGR (%), CAGR (%))
Table 17 PET Systems Market, 2024-2034 (US$ Bn, AGR (%), CAGR (%))
Table 18 X-Ray imaging systems Market Forecast by Region, 2024-2034 (US$ Bn, AGR (%), CAGR (%))
Table 19 Digital X-ray Imaging Systems Market, 2024-2034 (US$ Bn, AGR (%), CAGR (%))
Table 20 Analog X-ray Imaging Systems Market, 2024-2034 (US$ Bn, AGR (%), CAGR (%))
Table 21 Mammography systems Market Forecast by Region, 2024-2034 (US$ Bn, AGR (%), CAGR (%))
Table 22 Medical Imaging Application Market, 2024-2034 (US$ Bn, AGR (%), CAGR (%))
Table 23 Cardiology Market Forecast by Region, 2024-2034 (US$ Bn, AGR (%), CAGR (%))
Table 24 Gynecology/Obs Market Forecast by Region, 2024-2034 (US$ Bn, AGR (%), CAGR (%))
Table 25 Orthopedics & Musculoskeletal Market Forecast by Region, 2024-2034 (US$ Bn, AGR (%), CAGR (%))
Table 26 Radiology Market Forecast by Region, 2024-2034 (US$ Bn, AGR (%), CAGR (%))
Table 27 Neurology & Spine Market Forecast by Region, 2024-2034 (US$ Bn, AGR (%), CAGR (%))
Table 28 General Imaging Market Forecast by Region, 2024-2034 (US$ Bn, AGR (%), CAGR (%))
Table 29 Other Market Forecast by Region, 2024-2034 (US$ Bn, AGR (%), CAGR (%))
Table 30 Medical Imaging Devices End User Market, 2024-2034 (US$ Bn, AGR (%), CAGR (%))
Table 31 Hospital Market Forecast by Region, 2024-2034 (US$ Bn, AGR (%), CAGR (%))
Table 32 Diagnostic Imaging Centers Market Forecast by Region, 2024-2034 (US$ Bn, AGR (%), CAGR (%))
Table 33 Others Market Forecast by Region, 2024-2034 (US$ Bn, AGR (%), CAGR (%))
Table 34 Medical Imaging Devices Market Forecast by Region, 2024-2034 (US$ Bn, AGR (%), CAGR (%))
Table 35 North America Medical Imaging Devices Market, By Country, 2024-2034 (US$ Bn, AGR (%), CAGR (%))
Table 36 North America Medical Imaging Type Market, 2024-2034 (US$ Bn, AGR (%), CAGR (%))
Table 37 North America Medical Imaging Application Market, 2024-2034 (US$ Bn, AGR (%), CAGR (%))
Table 38 North America End User Market, 2024-2034 (US$ Bn, AGR (%), CAGR (%))
Table 39 U.S. Medical Imaging Devices Market, 2024-2034 (US$ Bn, AGR (%), CAGR (%))
Table 40 US Medical Imaging Type Market, 2024-2034 (US$ Bn, AGR (%), CAGR (%))
Table 41 Canada Medical Imaging Devices Market, 2024-2034 (US$ Bn, AGR (%), CAGR (%))
Table 42 Canada Medical Imaging Type Market, 2024-2034 (US$ Bn, AGR (%), CAGR (%))
Table 43 Europe Medical Imaging Devices Market, By Country, 2024-2034 (US$ Bn, AGR (%), CAGR (%))
Table 44 Europe Medical Imaging Type Market, 2024-2034 (US$ Bn, AGR (%), CAGR (%))
Table 45 Europe Medical Imaging Application Market, 2024-2034 (US$ Bn, AGR (%), CAGR (%))
Table 46 Europe End User Market, 2024-2034 (US$ Bn, AGR (%), CAGR (%))
Table 47 Germany Medical Imaging Devices Market, 2024-2034 (US$ Bn, AGR (%), CAGR (%))
Table 48 Germany Medical Imaging Type Market, 2024-2034 (US$ Bn, AGR (%), CAGR (%))
Table 49 UK Medical Imaging Devices Market, 2024-2034 (US$ Bn, AGR (%), CAGR (%))
Table 50 UK Medical Imaging Type Market, 2024-2034 (US$ Bn, AGR (%), CAGR (%))
Table 51 France Medical Imaging Devices Market, 2024-2034 (US$ Bn, AGR (%), CAGR (%))
Table 52 France Medical Imaging Type Market, 2024-2034 (US$ Bn, AGR (%), CAGR (%))
Table 53 Italy Medical Imaging Devices Market, 2024-2034 (US$ Bn, AGR (%), CAGR (%))
Table 54 Italy Medical Imaging Type Market, 2024-2034 (US$ Bn, AGR (%), CAGR (%))
Table 55 Spain Medical Imaging Devices Market, 2024-2034 (US$ Bn, AGR (%), CAGR (%))
Table 56 Spain Medical Imaging Type Market, 2024-2034 (US$ Bn, AGR (%), CAGR (%))
Table 57 Rest of Europe Medical Imaging Devices Market, 2024-2034 (US$ Bn, AGR (%), CAGR (%))
Table 58 Rest of Europe Medical Imaging Type Market, 2024-2034 (US$ Bn, AGR (%), CAGR (%))
Table 59 Asia Pacific Medical Imaging Devices Market, By Country, 2024-2034 (US$ Bn, AGR (%), CAGR (%))
Table 60 Asia Pacific Medical Imaging Type Market, 2024-2034 (US$ Bn, AGR (%), CAGR (%))
Table 61 Asia-Pacific Medical Imaging Application Market, 2024-2034 (US$ Bn, AGR (%), CAGR (%))
Table 62 Asia-Pacific End User Market, 2024-2034 (US$ Bn, AGR (%), CAGR (%))
Table 63 Japan Medical Imaging Devices Market, 2024-2034 (US$ Bn, AGR (%), CAGR (%))
Table 64 Japan Medical Imaging Type Market, 2024-2034 (US$ Bn, AGR (%), CAGR (%))
Table 65 China Medical Imaging Devices Market, 2024-2034 (US$ Bn, AGR (%), CAGR (%))
Table 66 China Medical Imaging Type Market, 2024-2034 (US$ Bn, AGR (%), CAGR (%))
Table 67 India Medical Imaging Devices Market, 2024-2034 (US$ Bn, AGR (%), CAGR (%))
Table 68 India Medical Imaging Type Market, 2024-2034 (US$ Bn, AGR (%), CAGR (%))
Table 69 South Korea Medical Imaging Devices Market, 2024-2034 (US$ Bn, AGR (%), CAGR (%))
Table 70 South Korea Medical Imaging Type Market, 2024-2034 (US$ Bn, AGR (%), CAGR (%))
Table 71 Australia Medical Imaging Devices Market, 2024-2034 (US$ Bn, AGR (%), CAGR (%))
Table 72 Australia Medical Imaging Type Market, 2024-2034 (US$ Bn, AGR (%), CAGR (%))
Table 73 Rest of Asia Pacific Medical Imaging Devices Market, 2024-2034 (US$ Bn, AGR (%), CAGR (%))
Table 74 Rest of Asia Pacific Medical Imaging Type Market, 2024-2034 (US$ Bn, AGR (%), CAGR (%))
Table 75 Latin America Medical Imaging Devices Market, By Country, 2024-2034 (US$ Bn, AGR (%), CAGR (%))
Table 76 Latin America Medical Imaging Type Market, 2024-2034 (US$ Bn, AGR (%), CAGR (%))
Table 77 Latin America Medical Imaging Application Market, 2024-2034 (US$ Bn, AGR (%), CAGR (%))
Table 78 Latin America End User Market, 2024-2034 (US$ Bn, AGR (%), CAGR (%))
Table 79 Brazil Medical Imaging Devices Market, 2024-2034 (US$ Bn, AGR (%), CAGR (%))
Table 80 Brazil Medical Imaging Type Market, 2024-2034 (US$ Bn, AGR (%), CAGR (%))
Table 81 Mexico Medical Imaging Devices Market, 2024-2034 (US$ Bn, AGR (%), CAGR (%))
Table 82 Mexico Medical Imaging Type Market, 2024-2034 (US$ Bn, AGR (%), CAGR (%))
Table 83 Rest of LATAM Medical Imaging Devices Market, 2024-2034 (US$ Bn, AGR (%), CAGR (%))
Table 84 Rest of LATAM Medical Imaging Type Market, 2024-2034 (US$ Bn, AGR (%), CAGR (%))
Table 85 MEA Medical Imaging Devices Market, By Country, 2024-2034 (US$ Bn, AGR (%), CAGR (%))
Table 86 MEA Medical Imaging Type Market, 2024-2034 (US$ Bn, AGR (%), CAGR (%))
Table 87 MEA Medical Imaging Application Market, 2024-2034 (US$ Bn, AGR (%), CAGR (%))
Table 88 MEA End User Market, 2024-2034 (US$ Bn, AGR (%), CAGR (%))
Table 89 South Africa Medical Imaging Devices Market, 2024-2034 (US$ Bn, AGR (%), CAGR (%))
Table 90 South Africa Medical Imaging Type Market, 2024-2034 (US$ Bn, AGR (%), CAGR (%))
Table 91 GCC Medical Imaging Devices Market, 2024-2034 (US$ Bn, AGR (%), CAGR (%))
Table 92 GCC Medical Imaging Type Market, 2024-2034 (US$ Bn, AGR (%), CAGR (%))
Table 93 Rest of MEA Medical Imaging Devices Market, 2024-2034 (US$ Bn, AGR (%), CAGR (%))
Table 94 Rest of MEA Medical Imaging Type Market, 2024-2034 (US$ Bn, AGR (%), CAGR (%))
Table 95 Key Business Strategies Adopted by Key Players in Global Medical imaging devices market Details
Table 96 Canon Medical Systems: Key Details, (CEO, HQ, Revenue, Founded, No. of Employees, Company Type, Website, Business Segment)
Table 97 Canon Medical Systems: Product Benchmarking
Table 98 Canon Medical Systems Inc: Company Recent Developments
Table 99 FUJIFILM Visual Sonics Inc.: Key Details, (CEO, HQ, Revenue, Founded, No. of Employees, Company Type, Website, Business Segment)
Table 100 FUJIFILM VisualSonics Inc.: Product Benchmarking
Table 101 FUJIFILM VisualSonics Inc.: Company Recent Developments
Table 102 GE HEALTHCARE: Key Details, (CEO, HQ, Revenue, Founded, No. of Employees, Company Type, Website, Business Segment)
Table 103 GE HEALTHCARE: Product Benchmarking
Table 104 GE HEALTHCARE: Company Recent Developments
Table 105 Hologic, Inc: Key Details, (CEO, HQ, Revenue, Founded, No. of Employees, Company Type, Website)
Table 106 Hologic, Inc: Product Benchmarking
Table 107 Hologic, Inc: Company Recent Developments
Table 108 Koning Corporation: Key Details, (CEO, HQ, Revenue, Founded, No. of Employees, Company Type, Website, Business Segment)
Table 109 Koning Corporation: Product Benchmarking
Table 110 Koning Corporation: Company Recent Developments
Table 111 Koninklijke Philips N.V.: Key Details, (CEO, HQ, Revenue, Founded, No. of Employees, Company Type, Website, Business Segment)
Table 112 Koninklijke Philips N.V.: Product Benchmarking
Table 113 Koninklijke Philips N.V.: Company Recent Developments
Table 114 Mindray Medical International: Key Details, (CEO, HQ, Revenue, Founded, No. of Employees, Company Type, Website, Business Segment)
Table 115 Mindray Medical International: Product Benchmarking
Table 116 Mindray Medical International: Strategic Outlook
Table 117 PerkinElmer, Inc. (Revvity Inc.): Key Details, (CEO, HQ, Revenue, Founded, No. of Employees, Company Type, Website, Business Segment)
Table 118 PerkinElmer, Inc. (Revvity Inc.): Product Benchmarking
Table 119 PerkinElmer, Inc. (Revvity Inc.): Strategic Outlook
Table 120 Samsung Medison Co.Ltd: Key Details, (CEO, HQ, Revenue, Founded, No. of Employees, Company Type, Website, Business Segment)
Table 121 Samsung Medison Co.Ltd: Product Benchmarking
Table 122 Samsung Medison Co.Ltd: Strategic Outlook
Table 123 Siemens Healthineers AG: Key Details, (CEO, HQ, Revenue, Founded, No. of Employees, Company Type, Website, Business Segment)
Table 124 Siemens Healthineers AG: Product Benchmarking
Table 125 Siemens Healthineers AG: Strategic Outlook
図の一覧
Figure 1 Global Medical Imaging Devices Market Segmentation
Figure 2 Medical imaging devices market Forecast by Region, 2023: Market Attractiveness Index
Figure 3 Medical imaging devices market by Type: Market Attractiveness Index
Figure 4 Medical Imaging Devices market by Application: Market Attractiveness Index
Figure 5 Medical imaging devices market by End user: Market Attractiveness Index
Figure 6 Medical imaging devices market: Market Dynamics
Figure 7 Medical Imaging Devices Market Forecast by Region, 2024-2034 (US$ Bn, AGR (%), CAGR (%)): “V” Shaped Recovery
Figure 8 Medical Imaging Devices Market by Region, 2024-2034 (US$ Bn, AGR (%), CAGR (%)): “U” Shaped Recovery
Figure 9 Medical Imaging Devices Market Forecast by Region, 2024-2034 (US$ Bn, AGR (%), CAGR (%)): “W” Shaped Recovery
Figure 10 Medical imaging devices market by region, 2024-2034 (US$ Bn, AGR (%), CAGR (%)): “L” Shaped Recovery
Figure 11 Global Medical imaging devices market: Porter’s Five Forces Analysis
Figure 12 Medical imaging devices market by Type: Market Attractiveness Index
Figure 13 Medical imaging devices market Forecast by Type 2024-2034 (Revenue, CAGR%)
Figure 14 Medical imaging devices market Share Forecast by Type, 2024, 2029, 2034 (%)
Figure 15 MRI systems Market Forecast by Region, 2024-2034 (US$ billion)
Figure 16 MRI systems Market Share Forecast by Region, 2024-2034 (%)
Figure 17 Ultrasound imaging systems Market Forecast by Region, 2024-2034 (US$ billion)
Figure 18 Ultrasound imaging systems Market Share Forecast by Region, 2024-2034 (%)
Figure 19 2D Ultrasound Market Forecast, 2024-2034 (US$ billion)
Figure 20 3D Ultrasound Market Forecast, 2024-2034 (US$ billion)
Figure 21 Others Market Forecast, 2024-2034 (US$ billion)
Figure 22 CT Scanners Market Forecast by Region, 2024-2034 (US$ billion)
Figure 23 CT Scanners Market Share Forecast by Region, 2024-2034 (%)
Figure 24 Conventional CT Scanners Market Forecast, 2024-2034 (US$ billion)
Figure 25 Cone Beam CT Scanners Market Forecast, 2024-2034 (US$ billion)
Figure 26 Nuclear imaging systems Market Forecast by Region, 2024-2034 (US$ billion)
Figure 27 Nuclear imaging systems Market Share Forecast by Region, 2024-2034 (%)
Figure 28 SPECT Systems Market Forecast, 2024-2034 (US$ billion)
Figure 29 PET Systems Market Forecast, 2024-2034 (US$ billion)
Figure 30 X-Ray Imaging Systems Market Forecast by Region, 2024-2034 (US$ billion)
Figure 31 Digital X-Ray Imaging Systems Market Forecast, 2024-2034 (US$ billion)
Figure 32 Analog X-Ray Imaging Systems Market Forecast, 2024-2034 (US$ billion)
Figure 33 Mammography Systems Market Forecast by Region, 2024-2034 (US$ billion)
Figure 34 Mammography Systems Market Share Forecast by Region, 2024-2034 (%)
Figure 35 Medical Imaging Devices market by Application: Market Attractiveness Index
Figure 36 Medical imaging devices market Forecast by Application, 2024-2034 (US$ billion, AGR %)
Figure 37 Medical imaging devices market Share Forecast by Application, 2024, 2029, 2034 (%)
Figure 38 Cardiology Market Forecast by Region, 2024-2034 (US$ billion)
Figure 39 Cardiology Market Share Forecast by Region, 2024-2034 (%)
Figure 40 Gynaecology/Obs Market Forecast by Region, 2024-2034 (US$ billion)
Figure 41 Gynaecology/Obs Market Share Forecast by Region, 2024-2034 (%)
Figure 42 Orthopedics & Musculoskeletal Market Forecast by Region, 2024-2034 (US$ billion)
Figure 43 Orthopaedics & Musculoskeletal Market Share Forecast by Region, 2024-2034 (%)
Figure 44 Radiology Market Forecast by Region, 2024-2034 (US$ billion)
Figure 45 Radiology Market Share Forecast by Region, 2024-2034 (%)
Figure 46 Neurology & Spine Market Forecast by Region, 2024-2034 (US$ billion)
Figure 47 Neurology & Spine Market Share Forecast by Region, 2024-2034 (%)
Figure 48 General Imaging Market Forecast by Region, 2024-2034 (US$ billion)
Figure 49 General Imaging Market Share Forecast by Region, 2024-2034 (%)
Figure 50 Others Market Forecast by Region, 2024-2034 (US$ billion)
Figure 51 Others Market Share Forecast by Region, 2024-2034 (%)
Figure 52 Medical imaging devices market by End user: Market Attractiveness Index
Figure 53 Medical imaging devices market Forecast by End user, 2024-2034 (US$ billion, AGR %)
Figure 54 Medical imaging devices market Share Forecast by End user, 2024, 2029, 2034 (%)
Figure 55 Hospital Market Forecast by Region, 2024-2034 (US$ billion)
Figure 56 Hospital Market Share Forecast by Region, 2024-2034 (%)
Figure 57 Diagnostic Imaging Centers Market Forecast by Region, 2024-2034 (US$ billion)
Figure 58 Diagnostic Imaging Centers Market Share Forecast by Region, 2024-2034 (%)
Figure 59 Others Market Forecast by Region, 2024-2034 (US$ billion)
Figure 60 Others Market Share Forecast by Region, 2024-2034 (%)
Figure 61 Medical imaging devices market Forecast by Region 2024, 2034 (Revenue)
Figure 62 Medical imaging devices market Share Forecast by Region 2024, 2029, 2034 (%)
Figure 63 Medical imaging devices market by Region, 2024-2034 (US$ Bn, AGR (%), CAGR (%))
Figure 64 North America Medical imaging devices market Attractiveness Index, 2023
Figure 65 North America Medical imaging devices market by Region, 2024, 2029 & 2034 (US$ billion)
Figure 66 North America Medical imaging devices market Forecast by Country, 2024-2034 (US$ billion, AGR %)
Figure 67 North America Medical imaging devices market Share Forecast by Country, 2024, 2029, 2034(%)
Figure 68 North America Medical imaging devices market Forecast by Type, 2024-2034 (US$ billion, AGR %)
Figure 69 North America Medical imaging devices market Share Forecast by Type, 2024, 2029, 2034 (%)
Figure 70 North America Medical imaging devices market Forecast by Application, 2024-2034 (US$ billion, AGR %)
Figure 71 North America Medical imaging devices market Share Forecast by Application, 2024, 2029, 2034 (%)
Figure 72 North America Medical imaging devices market Forecast by End user, 2024-2034 (US$ billion, AGR %)
Figure 73 North America Medical imaging devices market Share Forecast by End user, 2024, 2029, 2034 (%)
Figure 74 U.S. Medical imaging devices market Forecast, 2024-2034 (US$ billion, AGR %)
Figure 75 U.S. Medical imaging devices market Forecast by Type, 2024-2034 (US$ billion, AGR %)
Figure 76 U.S. Medical imaging devices market Share Forecast by Type, 2024, 2029, 2034 (%)
Figure 77 Canada Medical imaging devices market Forecast, 2024-2034 (US$ billion, AGR %)
Figure 78 Canada Medical imaging devices market Forecast by Type, 2024-2034 (US$ billion, AGR %)
Figure 79 Canada Medical imaging devices market Share Forecast by Type, 2024, 2029, 2034 (%)
Figure 80 Europe Medical imaging devices market Attractiveness Index, 2023
Figure 81 Europe Medical imaging devices market by Region, 2024, 2029 & 2034 (US$ billion)
Figure 82 Europe Medical imaging devices market Forecast by Country, 2024-2034 (US$ billion, AGR %)
Figure 83 Europe Medical imaging devices market Share Forecast by Country, 2024, 2029, 2034 (%)
Figure 84 Europe Medical imaging devices market Forecast by Type, 2024-2034 (US$ billion, AGR %)
Figure 85 Europe Medical imaging devices market Share Forecast by Type, 2024, 2029, 2034 (%)
Figure 86 Europe Medical imaging devices market Forecast by Application, 2024-2034 (US$ billion, AGR %)
Figure 87 Europe Medical imaging devices market Share Forecast by Application, 2024, 2029, 2034 (%)
Figure 88 Europe Medical imaging devices market Forecast by End user, 2024-2034 (US$ billion, AGR %)
Figure 89 Europe Medical imaging devices market Share Forecast by End user, 2024, 2029, 2034 (%)
Figure 90 Germany Medical imaging devices market Forecast, 2024-2034 (US$ billion, AGR %)
Figure 91 Germany Medical imaging devices market Forecast by Type, 2024-2034 (US$ billion, AGR %)
Figure 92 Germany Medical imaging devices market Share Forecast by Type, 2024, 2029, 2034 (%)
Figure 93 UK Medical imaging devices market Forecast, 2024-2034 (US$ billion, AGR %)
Figure 94 U.K. Medical imaging devices market Forecast by Type, 2024-2034 (US$ billion, AGR %)
Figure 95 U.K. Medical imaging devices market Share Forecast by Type, 2024, 2029, 2034 (%)
Figure 96 France Medical imaging devices market Forecast, 2024-2034 (US$ billion, AGR %)
Figure 97 France Medical imaging devices market Forecast by Type, 2024-2034 (US$ billion, AGR %)
Figure 98 France Medical imaging devices market Share Forecast by Type, 2024, 2029, 2034 (%)
Figure 99 Italy Medical imaging devices market Forecast, 2024-2034 (US$ billion, AGR %)
Figure 100 Italy Medical imaging devices market Forecast by Type, 2024-2034 (US$ billion, AGR %)
Figure 101 Italy Medical imaging devices market Share Forecast by Type, 2024, 2029, 2034 (%)
Figure 102 Spain Medical imaging devices market Forecast, 2024-2034 (US$ billion, AGR %)
Figure 103 Spain Medical imaging devices market Forecast by Type, 2024-2034 (US$ billion, AGR %)
Figure 104 Spain Medical imaging devices market Share Forecast by Type, 2024, 2029, 2034 (%)
Figure 105 Rest of Europe Medical imaging devices market Forecast, 2024-2034 (US$ billion, AGR %)
Figure 106 Rest of Europe Medical imaging devices market Forecast by Type, 2024-2034 (US$ billion, AGR %)
Figure 107 Rest of Europe Medical imaging devices market Share Forecast by Type, 2024, 2029, 2034 (%)
Figure 108 Asia Pacific Medical imaging devices market Attractiveness Index, 2023
Figure 109 Asia Pacific Medical imaging devices market by Region, 2024, 2029 & 2034 (US$ billion)
Figure 110 Asia Pacific Medical imaging devices market Forecast by Country, 2024-2034 (US$ billion, AGR %)
Figure 111 Asia Pacific Medical imaging devices market Share Forecast by Country, 2024, 2029, 2034 (%)
Figure 112 Asia Pacific Medical imaging devices market Forecast by Type, 2024-2034 (US$ billion, AGR %)
Figure 113 Asia Pacific Medical imaging devices market Share Forecast by Type, 2024, 2029, 2034 (%)
Figure 114 Asia-Pacific Medical imaging devices market Forecast by Application, 2024-2034 (US$ billion, AGR %)
Figure 115 Asia-Pacific Medical imaging devices market Share Forecast by Application, 2024, 2029, 2034 (%)
Figure 116 Asia Pacific Medical imaging devices market Forecast by End user, 2024-2034 (US$ billion, AGR %)
Figure 117 Asia Pacific Medical imaging devices market Share Forecast by End user, 2024, 2029, 2034 (%)
Figure 118 Japan Medical imaging devices market Forecast, 2024-2034 (US$ billion, AGR %)
Figure 119 Japan Medical imaging devices market Forecast by Type, 2024-2034 (US$ billion, AGR %)
Figure 120 Japan Medical imaging devices market Share Forecast by Type, 2024, 2029, 2034 (%)
Figure 121 China Medical imaging devices market Forecast, 2024-2034 (US$ billion, AGR %)
Figure 122 China Medical imaging devices market Forecast by Type, 2024-2034 (US$ billion, AGR %)
Figure 123 China Medical imaging devices market Share Forecast by Type, 2024, 2029, 2034 (%)
Figure 124 India Medical imaging devices market Forecast, 2024-2034 (US$ billion, AGR %)
Figure 125 India Medical imaging devices market Forecast by Type, 2024-2034 (US$ billion, AGR %)
Figure 126 India Medical imaging devices market Share Forecast by Type, 2024, 2029, 2034 (%)
Figure 127 South Korea Medical imaging devices market Forecast, 2024-2034 (US$ billion, AGR %)
Figure 128 South Korea Medical imaging devices market Forecast by Type, 2024-2034 (US$ billion, AGR %)
Figure 129 South Korea Medical imaging devices market Share Forecast by Type, 2024, 2029, 2034 (%)
Figure 130 Australia Medical imaging devices market Forecast, 2024-2034 (US$ billion, AGR %)
Figure 131 Australia Medical imaging devices market Forecast by Type, 2024-2034 (US$ billion, AGR %)
Figure 132 Australia Medical imaging devices market Share Forecast by Type, 2024, 2029, 2034 (%)
Figure 133 Rest of Asia Pacific Medical imaging devices market Forecast, 2024-2034 (US$ billion, AGR %)
Figure 134 Rest of APAC Medical imaging devices market Forecast by Type, 2024-2034 (US$ billion, AGR %)
Figure 135 Rest of APAC Medical imaging devices market Share Forecast by Type, 2024, 2029, 2034 (%)
Figure 136 Latin America Medical imaging devices market Attractiveness Index, 2023
Figure 137 Latin America Medical imaging devices market by Region, 2024, 2029 & 2034 (US$ billion)
Figure 138 Latin America Medical imaging devices market Forecast by Country, 2024-2034 (US$ billion, AGR %)
Figure 139 Latin America Medical imaging devices market Share Forecast by Country, 2024, 2029, 2034 (%)
Figure 140 Latin America Medical imaging devices market Forecast by Type, 2024-2034 (US$ billion, AGR %)
Figure 141 Latin America Medical imaging devices market Share Forecast by Type, 2024, 2029, 2034 (%)
Figure 142 Latin America Medical imaging devices market Forecast by Application, 2024-2034 (US$ billion, AGR %)
Figure 143 Latin America Medical imaging devices market Share Forecast by Application, 2024, 2029, 2034 (%)
Figure 144 Latin America Medical imaging devices market Forecast by End user, 2024-2034 (US$ billion, AGR %)
Figure 145 Latin America Medical imaging devices market Share Forecast by End user, 2024, 2029, 2034 (%)
Figure 146 Brazil Medical imaging devices market Forecast, 2024-2034 (US$ billion, AGR %)
Figure 147 Brazil Medical imaging devices market Forecast by Type, 2024-2034 (US$ billion, AGR %)
Figure 148 Brazil Medical imaging devices market Share Forecast by Type, 2024, 2029, 2034 (%)
Figure 149 Mexico Medical imaging devices market Forecast, 2024-2034 (US$ billion, AGR %)
Figure 150 Mexico Medical imaging devices market Forecast by Type, 2024-2034 (US$ billion, AGR %)
Figure 151 Mexico Medical imaging devices market Share Forecast by Type, 2024, 2029, 2034 (%)
Figure 152 Rest of LATAM Medical imaging devices market Forecast, 2024-2034 (US$ billion, AGR %)
Figure 153 Rest of LATAM Medical imaging devices market Forecast by Type, 2024-2034 (US$ billion, AGR %)
Figure 154 Rest of LATAM Medical imaging devices market Share Forecast by Type, 2024, 2029, 2034 (%)
Figure 155 MEA Medical imaging devices market Attractiveness Index, 2023
Figure 156 MEA Medical imaging devices market by Region, 2024, 2029 & 2034 (US$ billion)
Figure 157 MEA Medical imaging devices market Forecast by Country, 2024-2034 (US$ billion, AGR %)
Figure 158 MEA Medical imaging devices market Share Forecast by Country, 2024, 2029, 2034 (%)
Figure 159 MEA Medical imaging devices market Forecast by Type, 2024-2034 (US$ billion, AGR %)
Figure 160 MEA Medical imaging devices market Share Forecast by Type, 2024, 2029, 2034 (%)
Figure 161 MEA Medical imaging devices market Forecast by Application, 2024-2034 (US$ billion, AGR %)
Figure 162 MEA Medical imaging devices market Share Forecast by Application, 2024, 2029, 2034 (%)
Figure 163 MEA Medical imaging devices market Forecast by End user, 2024-2034 (US$ billion, AGR %)
Figure 164 MEA Medical imaging devices market Share Forecast by End user, 2024, 2029, 2034 (%)
Figure 165 South Africa Medical imaging devices market Forecast, 2024-2034 (US$ billion, AGR %)
Figure 166 South Africa Medical imaging devices market Forecast by Type, 2024-2034 (US$ billion, AGR %)
Figure 167 South Africa Medical imaging devices market Share Forecast by Type, 2024, 2029, 2034 (%)
Figure 168 GCC Medical imaging devices market Forecast, 2024-2034 (US$ billion, AGR %)
Figure 169 GCC Medical imaging devices market Forecast by Type, 2024-2034 (US$ billion, AGR %)
Figure 170 GCC Medical imaging devices market Share Forecast by Type, 2024, 2029, 2034 (%)
Figure 171 Rest of MEA Medical imaging devices market Forecast, 2024-2034 (US$ billion, AGR %)
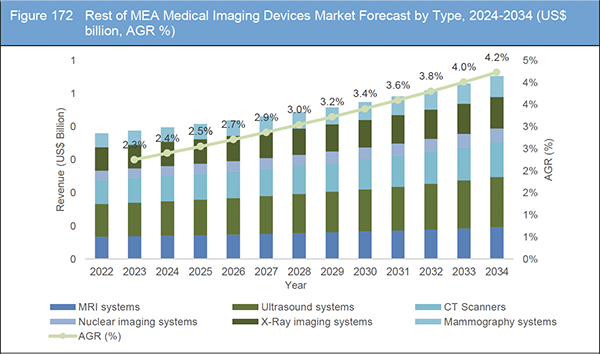
Figure 172 Rest of MEA Medical imaging devices market Forecast by Type, 2024-2034 (US$ billion, AGR %)
Figure 173 Rest of MEA Medical imaging devices market Share Forecast by Type, 2024, 2029, 2034 (%)
Figure 174 Medical imaging devices market: Company Share Analysis, 2022
Figure 175 Canon Medical Systems: Net Sales, 2019-2022 (US$ Billion, AGR%)
Figure 176 Canon Medical Systems: Regional Market Shares, 2022
Figure 177 Canon Medical Systems: R&D, 2019-2022 (US$ billion, AGR%)
Figure 178 FUJIFILM Visual Sonics Inc.: Net Revenue, 2019-2022 (US$ Million, AGR%)
Figure 179 FUJIFILM VisualSonics Inc.: Regional Market Shares, 2022
Figure 180 FUJIFILM VisualSonics Inc.: R&D, 2019-2022 (US$ Million, AGR%)
Figure 181 GE HEALTHCARE: Net Revenue, 2019-2022 (US$ Million, AGR%)
Figure 182 GE HEALTHCARE: Regional Market Shares, 2022
Figure 183 GE HEALTHCARE: R&D, 2019-2022 (US$ Million, AGR%)
Figure 184 Hologic, Inc: Net Revenue, 2019-2022 (US$ Million, AGR%)
Figure 185 Hologic, Inc: Regional Market Shares, 2022
Figure 186 Hologic, Inc: R&D, 2019-2022 (US$ Million, AGR%)
Figure 187 Koning Corporation: Sales, 2019-2022 (US$ Million, AGR%)
Figure 188 Koning Corporation: Regional Market Shares, 2022
Figure 189 Koning Corporation: R&D, 2019-2022 (US$ Million, AGR%)
Figure 190 Koninklijke Philips N.V.: Net Revenue, 2019-2022 (US$ Million, AGR%)
Figure 191 Koninklijke Philips N.V.: Regional Market Shares, 2022
Figure 192 Koninklijke Philips N.V.: R&D, 2019-2022 (US$ Million, AGR%)
Figure 193 Mindray Medical International: Net Sales, 2019-2022 (US$ Million, AGR%)
Figure 194 Mindray Medical International: R&D, 2019-2022 (US$ Million, AGR%)
Figure 195 PerkinElmer, Inc. (Revvity Inc.): Net Revenue, 2019-2022 (US$ Million)
Figure 196 PerkinElmer, Inc. (Revvity Inc.): Regional Market Shares, 2022
Figure 197 PerkinElmer, Inc. (Revvity Inc.): R&D, 2019-2022 (US$ Million)
Figure 198 Samsung Medison Co.Ltd: Net Revenue, 2019-2022 (US$ Million)
Figure 199 Samsung Medison Co.Ltd: Regional Market Shares, 2022
Figure 200 Samsung Medison Co.Ltd: R&D, 2019-2022 (US$ Million)
Figure 201 Siemens Healthineers AG: Net Revenue, 2019-2022 (US$ Million)
Figure 202 Siemens Healthineers AG: Regional Market Shares, 2022
Figure 203 Siemens Healthineers AG: R&D, 2019-2022 (US$ Million)
ページTOPに戻る
Summary
Report Details
The Medical Imaging Devices Market Report 2023-2034: This report will prove invaluable to leading firms striving for new revenue pockets if they wish to better understand the industry and its underlying dynamics. It will be useful for companies that would like to expand into different industries or to expand their existing operations in a new region.
High cost of devices
Expensive imaging devices hinder the growth of the market. Advanced technological devices need to be purchased at high cost that may be a challenge for adoption at various healthcare facilities. Developed countries are able to install such high-end devices but emerging countries face financial challenges. Lack of infrastructure and funding in emerging countries pose barrier to install such devices and provide advanced care for patients. Hence, high costs and associated maintenance costs for products and services are expected to impact the market.
Complex regulations for equipment
Increasing initiatives by government authorities around the world to implement regulatory standards have posed a barrier for device manufacturers. These regulations have complex processes for implementation that increases the financial burden and operational costs associated with the process. For instance, the US FDA implemented the unique device identification system (UDI) to identify sold medical devices from manufacturing to distribution to patient use. Furthermore, the European Union Medical Device Regulation (MDR) documentation and other requirements are stricter and following of regulations is at higher level. For example, the 30-day timeframe for reporting serious incidents under Medical Device Directive (MDD) has become only 15 days under MDR.
What Questions Should You Ask before Buying a Market Research Report?
-
How is the Medical Imaging Devices market evolving?
-
What is driving and restraining the Medical Imaging Devices market?
-
How will each Medical Imaging Devices submarket segment grow over the forecast period and how much revenue will these submarkets account for in 2034?
-
How will the market shares for each Medical Imaging Devices submarket develop from 2023 to 2034?
-
What will be the main driver for the overall market from 2023 to 2034?
-
Will leading Medical Imaging Devices markets broadly follow the macroeconomic dynamics, or will individual national markets outperform others?
-
How will the market shares of the national markets change by 2034 and which geographical region will lead the market in 2034?
-
Who are the leading players and what are their prospects over the forecast period?
-
What are the Medical Imaging Devices projects for these leading companies?
-
How will the industry evolve during the period between 2023 and 2034? What are the implications of Medical Imaging
-
Devices projects taking place now and over the next 10 years?
-
Is there a greater need for product commercialisation to further scale the Medical Imaging Devices market?
-
Where is the Medical Imaging Devices market heading and how can you ensure you are at the forefront of the market?
-
What are the best investment options for new product and service lines?
-
What are the key prospects for moving companies into a new growth path and C-suite?
You need to discover how this will impact the Medical Imaging Devices market today, and over the next 10 years:
-
Our 312-page report provides 126 tables, 204 charts and graphs exclusively to you.
-
The report highlights key lucrative areas in the industry so you can target them – NOW.
-
It contains in-depth analysis of global, regional and national sales and growth.
-
It highlights for you the key successful trends, changes and revenue projections made by your competitors.
This report tells you TODAY how the Medical Imaging Devices market will develop in the next 10 years, and in line with the variations in COVID-19 economic recession and bounce. This market is more critical now than at any point over the last 10 years.
Forecasts to 2034 and other analyses reveal commercial prospects.
-
In addition to revenue forecasting to 2034, our new study provides you with recent results, growth rates, and market shares.
-
You will find original analyses, with business outlooks and developments.
-
Discover qualitative analyses (including market dynamics, drivers, opportunities, restraints and challenges), cost structure, impact of rising Medical Imaging Devices prices and recent developments.
This report includes data analysis and invaluable insight into how COVID-19 will affect the industry and your company. Four COVID-19 recovery patterns and their impact, namely, “V”, “L”, “W” and “U” are discussed in this report.
Segments Covered in the Report
Type
-
MRI Systems
-
Ultrasound: 2D, 3D, Others
-
CT Scanners: Conventional CT, Cone Beam CT
-
Nuclear Imaging Systems: SPECT, PET
-
X-ray Imaging Systems: Digital X-ray Systems, Analog X-ray Systems
-
Mammography Systems
Application
-
Cardiology
-
Gynaecology/Obs
-
Orthopedics & Musculoskeletal
-
Radiology
-
Neurology & Spine
-
General Imaging
-
Others
End-user
-
Hospital
-
Diagnostic Centers
-
Others
In addition to the revenue predictions for the overall world market and segments, you will also find revenue forecasts for five regional and 20 leading national markets:
North America
Europe
-
Germany
-
UK
-
France
-
Italy
-
Spain
-
Rest of Europe
Asia Pacific
-
China
-
Japan
-
India
-
Australia
-
South Korea
-
Rest of Asia Pacific
Latin America
-
Brazil
-
Mexico
-
Rest of Latin America
MEA
-
GCC
-
South Africa
-
Rest of MEA
The report also includes profiles and for some of the leading companies in the Medical Imaging Devices Market, 2023 to 2034, with a focus on this segment of these companies’ operations.
Leading companies profiled in the report
-
Canon Medical Systems
-
FUJIFILM VisualSonics Inc.
-
GE Healthcare
-
Hologic, Inc
-
Koning Corporation
-
Koninklijke Philips N.V.
-
Mindray Medical International
-
PerkinElmer, Inc. (Revvity Inc.)
-
Samsung Medison Co. Ltd
-
Siemens Healthineers AG
Overall world revenue for Medical Imaging Devices Market, 2023 to 2034 in terms of value the market will surpass US$ 54.3 billion in 2024, our work calculates. We predict strong revenue growth through to 2034. Our work identifies which organizations hold the greatest potential. Discover their capabilities, progress, and commercial prospects, helping you stay ahead.
How will the Medical Imaging Devices Market, 2023 to 2034 report help you?
In summary, our 310+ page report provides you with the following knowledge:
-
Revenue forecasts to 2034 for Medical Imaging Devices Market, 2023 to 2034 Market, with forecasts for type, application, and end user each forecast at a global and regional level – discover the industry’s prospects, finding the most lucrative places for investments and revenues.
-
Revenue forecasts to 2034 for five regional and 20 key national markets – See forecasts for the Medical Imaging Devices Market, 2023 to 2034 market in North America, Europe, Asia-Pacific, Latin America, and MEA. Also forecasted is the market in the US, Canada, Mexico, Brazil, Germany, France, UK, Italy, China, India, Japan, and Australia among other prominent economies.
-
Prospects for established firms and those seeking to enter the market – including company profiles for 10 of the major companies involved in the Medical Imaging Devices Market, 2023 to 2034.
Find quantitative and qualitative analyses with independent predictions. Receive information that only our report contains, staying informed with invaluable business intelligence.
Information found nowhere else
With our new report, you are less likely to fall behind in knowledge or miss out on opportunities. See how our work could benefit your research, analyses, and decisions. Visiongain’s study is for everybody needing commercial analyses for the Medical Imaging Devices Market, 2023 to 2034, market-leading companies. You will find data, trends and predictions.
ページTOPに戻る
Table of Contents
Table of Contents
1. Report Overview
1.1 Objectives of the Study
1.2 Introduction to Medical Imaging Devices Market
1.3 What This Report Delivers
1.4 Why You Should Read This Report
1.5 Key Questions Answered By This Analytical Report Include:
1.6 Who is This Report For?
1.7 Methodology
1.7.1 Market Definitions
1.7.2 Market Evaluation & Forecasting Methodology
1.7.3 Data Validation
1.8 Frequently Asked Questions (FAQs)
1.9 Associated Visiongain Reports
1.10 About Visiongain
2 Executive Summary
2.1 Geographical Snapshot: Medical Imaging Devices Market
2.2 Type Segment: Market Attractiveness Index
2.3 Application Segment: Market Attractiveness Index
2.4 End user Segment: Market Attractiveness Index
3 Market Overview
3.1 Key Findings
3.2 Market Dynamics
3.2.1 Market Driving Factors
3.2.2 Market Restraining Factors
3.2.3 Market Opportunities
3.2.4 Challenges
3.3 COVID-19 Impact Analysis
3.4 Porter’s Five Forces Analysis
3.4.1 Supplier Power
3.4.2 Buyer Power
3.4.3 Competitive Rivalry
3.4.4 Threat from Substitutes
3.4.5 Threat of New Entrants
4 Medical Imaging Devices Market Analysis by Type
4.1 Key Findings
4.2 Type Segment: Market Attractiveness Index
4.3 Type Segment Growth Prospects
4.4 Medical Imaging Devices Market Size Estimation and Forecast by Type
4.5 MRI systems
4.5.1 Market Size by Region, 2024-2034 (US$ Bn)
4.5.2 Market Share by Region, 2024-2034 (%)
4.6 Ultrasound Imaging Systems
4.6.1 Market Size by Region, 2024-2034 (US$ Bn)
4.6.2 Market Share by Region, 2024-2034 (%)
4.7 CT Scanners
4.7.1 Market Size by Region, 2024-2034 (US$ Bn)
4.7.2 Market Share by Region, 2024-2034 (%)
4.8 Nuclear Imaging Systems
4.8.1 Market Size by Region, 2024-2034 (US$ Bn)
4.8.2 Market Share by Region, 2024-2034 (%)
4.9 X-Ray Imaging Systems
4.9.1 Market Size by Region, 2024-2034 (US$ Bn)
4.10 Mammography Systems
4.10.1 Market Size by Region, 2024-2034 (US$ Bn)
4.10.2 Market Share by Region, 2024-2034 (%)
5 Medical Imaging Devices Market Analysis by Application
5.1 Key Findings
5.2 Application Segment: Market Attractiveness Index
5.3 Medical Imaging Devices Market Size Estimation and Forecast by Application
5.4 Medical Imaging Devices Market Share by Application, 2024 & 2034
5.5 Cardiology
5.5.1 Market Size by Region, 2024-2034 (US$ Bn)
5.5.2 Market Share by Region, 2024-2034 (%)
5.6 Gynaecology/Obs
5.6.1 Market Size by Region, 2024-2034 (US$ Bn)
5.6.2 Market Share by Region, 2024-2034 (%)
5.7 Orthopaedics & Musculoskeletal
5.7.1 Market Size by Region, 2024-2034 (US$ Bn)
5.7.2 Market Share by Region, 2024-2034 (%)
5.8 Radiology
5.8.1 Market Size by Region, 2024-2034 (US$ Bn)
5.8.2 Market Share by Region, 2024-2034 (%)
5.9 Neurology & Spine
5.9.1 Market Size by Region, 2024-2034 (US$ Bn)
5.9.2 Market Share by Region, 2024-2034 (%)
5.10 General Imaging
5.10.1 Market Size by Region, 2024-2034 (US$ Bn)
5.10.2 Market Share by Region, 2024-2034 (%)
5.11 Others
5.11.1 Market Size by Region, 2024-2034 (US$ Bn)
5.11.2 Market Share by Region, 2024-2034 (%)
6 Medical Imaging Devices Market Analysis by End user
6.1 Key Findings
6.2 End user Segment: Market Attractiveness Index
6.3 Medical Imaging Devices Market Size Estimation and Forecast by End user
6.4 Medical Imaging Devices Market Share by End user, 2024, 2029, 2034
6.5 Hospital
6.5.1 Market Size by Region, 2024-2034 (US$ Bn)
6.5.2 Market Share by Region, 2024-2034 (%)
6.6 Diagnostic Imaging Centres
6.6.1 Market Size by Region, 2024-2034 (US$ Bn)
6.6.2 Market Share by Region, 2024-2034 (%)
6.7 Others
6.7.1 Market Size by Region, 2024-2034 (US$ Bn)
6.7.2 Market Share by Region, 2024-2034 (%)
7 Medical Imaging Devices Market Analysis by Region
7.1 Key Findings
7.2 Regional Market Size Estimation and Forecast
8 North America Medical Imaging Devices Market Analysis
8.1 Key Findings
8.2 North America Medical Imaging Devices Market Attractiveness Index
8.3 North America Medical Imaging Devices Market by Country, 2024, 2029 & 2034 (US$ Bn)
8.4 North America Medical Imaging Devices Market Size Estimation and Forecast by Country
8.5 North America Medical Imaging Devices Market Size Estimation and Forecast by Type
8.6 North America Medical Imaging Devices Market Size Estimation and Forecast by Application
8.7 North America Medical Imaging Devices Market Size Estimation and Forecast by End user
8.8 U.S.
8.8.1 U.S. Medical Imaging Devices Market by Type
8.9 Canada
8.9.1 Canada Medical Imaging Devices Market by Type
9 Europe Medical Imaging Devices Market Analysis
9.1 Key Findings
9.2 Europe Medical Imaging Devices Market Attractiveness Index
9.3 Europe Medical Imaging Devices Market by Country, 2024, 2029 & 2034 (US$ Bn)
9.4 Europe Medical Imaging Devices Market Size Estimation and Forecast by Country
9.5 Europe Medical Imaging Devices Market Size Estimation and Forecast by Type
9.6 Europe Medical Imaging Devices Market Size Estimation and Forecast by Application
9.7 Europe Medical Imaging Devices Market Size Estimation and Forecast by End user
9.8 Germany
9.8.1 Germany Medical Imaging Devices Market by Type
9.9 U.K.
9.9.1 U.K. Medical Imaging Devices Market by Type
9.10 France
9.10.1 France Medical Imaging Devices Market by Type
9.11 Italy
9.11.1 Italy Medical Imaging Devices Market by Type
9.12 Spain
9.12.1 Spain Medical Imaging Devices Market by Type
9.13 Rest of Europe
9.13.1 Rest of Europe Medical Imaging Devices Market by Type
10 Asia Pacific Medical Imaging Devices Market Analysis
10.1 Key Findings
10.2 Asia Pacific Medical Imaging Devices Market Attractiveness Index
10.3 Asia Pacific Medical Imaging Devices Market by Country, 2024, 2029 & 2034 (US$ Bn)
10.4 Asia Pacific Medical Imaging Devices Market Size Estimation and Forecast by Country
10.5 Asia Pacific Medical Imaging Devices Market Size Estimation and Forecast by Type
10.6 Asia-Pacific Medical Imaging Devices Market Size Estimation and Forecast by Application
10.7 Asia Pacific Medical Imaging Devices Market Size Estimation and Forecast by End user
10.8 Japan
10.8.1 Japan Medical Imaging Devices Market by Type
10.9 China
10.9.1 China Medical Imaging Devices Market by Type
10.10 India
10.10.1 India Medical Imaging Devices Market by Type
10.11 South Korea
10.11.1 South Korea Medical Imaging Devices Market by Type
10.12 Australia
10.12.1 Australia Medical Imaging Devices Market by Type
10.13 Rest of APAC
10.13.1 Rest of APAC Medical Imaging Devices Market by Type
11 Latin America Medical Imaging Devices Market Analysis
11.1 Key Findings
11.2 Latin America Medical Imaging Devices Market Attractiveness Index
11.3 Latin America Medical Imaging Devices Market by Country, 2024, 2029 & 2034 (US$ Bn)
11.4 Latin America Medical Imaging Devices Market Size Estimation and Forecast by Country
11.5 Latin America Medical Imaging Devices Market Size Estimation and Forecast by Type
11.6 Latin America Medical Imaging Devices Market Size Estimation and Forecast by Application
11.7 Latin America Medical Imaging Devices Market Size Estimation and Forecast by End user
11.8 Brazil
11.8.1 Brazil Medical Imaging Devices Market by Type
11.9 Mexico
11.9.1 Mexico Medical Imaging Devices Market by Type
11.10 Rest of Latin America
11.10.1 Rest of LATAM Medical Imaging Devices Market by Type
12 MEA Medical Imaging Devices Market Analysis
12.1 Key Findings
12.2 MEA Medical Imaging Devices Market Attractiveness Index
12.3 MEA Medical Imaging Devices Market by Country, 2024, 2029 & 2034 (US$ Bn)
12.4 MEA Medical Imaging Devices Market Size Estimation and Forecast by Country
12.5 MEA Medical Imaging Devices Market Size Estimation and Forecast by Type
12.6 MEA Medical Imaging Devices Market Size Estimation and Forecast by Application
12.7 MEA Medical Imaging Devices Market Size Estimation and Forecast by End user
12.8 South Africa
12.8.1 South Africa Medical Imaging Devices Market by Type
12.9 GCC
12.9.1 GCC Medical Imaging Devices Market by Type
12.10 Rest of MEA
12.10.1 Rest of MEA Medical Imaging Devices Market by Type
13 Competitive Landscape
13.1 Company Share Analysis
13.2 Key Business Strategy Analysis
14 Company Profiles
14.1 Canon Medical Systems
14.1.1 Company Snapshot
14.1.2 Company Overview
14.1.3 Financial Analysis
14.1.4 Product Benchmarking
14.1.5 Strategic Outlook
14.2 FUJIFILM Visual Sonics Inc.
14.2.1 Company Snapshot
14.2.2 Company Overview
14.2.3 Financial Analysis
14.2.4 Product Benchmarking
14.2.5 Strategic Outlook
14.3 GE HEALTHCARE
14.3.1 Company Snapshot
14.3.2 Company Overview
14.3.3 Financial Analysis
14.3.4 Product Benchmarking
14.3.5 Strategic Outlook
14.4 Hologic, Inc
14.4.1 Company Snapshot
14.4.2 Company Overview
14.4.3 Financial Analysis
14.4.4 Product Benchmarking
14.4.5 Strategic Outlook
14.5 Koning Corporation
14.5.1 Company Snapshot
14.5.2 Company Overview
14.5.3 Financial Analysis
14.5.4 Product Benchmarking
14.5.5 Strategic Outlook
14.6 Koninklijke Philips N.V.
14.6.1 Company Snapshot
14.6.2 Company Overview
14.6.3 Financial Analysis
14.6.4 Product Benchmarking
14.6.5 Strategic Outlook
14.7 Mindray Medical International
14.7.1 Company Snapshot
14.7.2 Company Overview
14.7.3 Financial Analysis
14.7.4 Product Benchmarking
14.7.5 Strategic Outlook
14.8 PerkinElmer, Inc. (Revvity Inc.)
14.8.1 Company Snapshot
14.8.2 Company Overview
14.8.3 Financial Analysis
14.8.4 Product Benchmarking
14.8.5 Strategic Outlook
14.9 Samsung Medison Co.Ltd
14.9.1 Company Snapshot
14.9.2 Company Overview
14.9.3 Financial Analysis
14.9.4 Product Benchmarking
14.9.5 Strategic Outlook
14.10 Siemens Healthineers AG
14.10.1 Company Snapshot
14.10.2 Company Overview
14.10.3 Financial Analysis
14.10.4 Product Benchmarking
14.10.5 Strategic Outlook
15 Conclusion and Recommendations
15.1 Final findings of report
15.2 Recommendations for Market Players
ページTOPに戻る
Press Release
List of Tables
Table 1 Global Medical imaging devices market Snapshot, 2024 & 2034 (US$ Billion, CAGR %)
Table 2 Medical Imaging Devices Market Forecast by Region, 2022-2032 (US$ Bn, AGR %, CAGR %) (V-shaped Recovery)
Table 3 Medical Imaging Devices Market Forecast by Region, 2024-2034 (US$ Bn, AGR %, CAGR %) (U-shaped Recovery)
Table 4 Medical Imaging Devices Market Forecast by Region, 2024-2034 (US$ Bn, AGR %, CAGR %) (W-shaped Recovery)
Table 5 Medical Imaging Devices Market Forecast by Region, 2022-2032 (US$ Bn, AGR %, CAGR %) (L-shaped Recovery)
Table 6 Medical Imaging Devices Type Market, 2024-2034 (US$ Bn, AGR (%), CAGR (%))
Table 7 MRI systems Market Forecast by Region, 2024-2034 (US$ Bn, AGR (%), CAGR (%))
Table 8 Ultrasound systems Market Forecast by Region, 2024-2034 (US$ Bn, AGR (%), CAGR (%))
Table 9 2D Ultrasound Systems Market, 2024-2034 (US$ Bn, AGR (%), CAGR (%))
Table 10 3D Ultrasound Systems Market, 2024-2034 (US$ Bn, AGR (%), CAGR (%))
Table 11 Others Market, 2024-2034 (US$ Bn, AGR (%), CAGR (%))
Table 12 CT Scanners Market Forecast by Region, 2024-2034 (US$ Bn, AGR (%), CAGR (%))
Table 13 Conventional CT Scanners Type Market, 2024-2034 (US$ Bn, AGR (%), CAGR (%))
Table 14 CT Scanners Type Market, 2024-2034 (US$ Bn, AGR (%), CAGR (%))
Table 15 Nuclear imaging systems Market Forecast by Region, 2024-2034 (US$ Bn, AGR (%), CAGR (%))
Table 16 SPECT Systems Market, 2024-2034 (US$ Bn, AGR (%), CAGR (%))
Table 17 PET Systems Market, 2024-2034 (US$ Bn, AGR (%), CAGR (%))
Table 18 X-Ray imaging systems Market Forecast by Region, 2024-2034 (US$ Bn, AGR (%), CAGR (%))
Table 19 Digital X-ray Imaging Systems Market, 2024-2034 (US$ Bn, AGR (%), CAGR (%))
Table 20 Analog X-ray Imaging Systems Market, 2024-2034 (US$ Bn, AGR (%), CAGR (%))
Table 21 Mammography systems Market Forecast by Region, 2024-2034 (US$ Bn, AGR (%), CAGR (%))
Table 22 Medical Imaging Application Market, 2024-2034 (US$ Bn, AGR (%), CAGR (%))
Table 23 Cardiology Market Forecast by Region, 2024-2034 (US$ Bn, AGR (%), CAGR (%))
Table 24 Gynecology/Obs Market Forecast by Region, 2024-2034 (US$ Bn, AGR (%), CAGR (%))
Table 25 Orthopedics & Musculoskeletal Market Forecast by Region, 2024-2034 (US$ Bn, AGR (%), CAGR (%))
Table 26 Radiology Market Forecast by Region, 2024-2034 (US$ Bn, AGR (%), CAGR (%))
Table 27 Neurology & Spine Market Forecast by Region, 2024-2034 (US$ Bn, AGR (%), CAGR (%))
Table 28 General Imaging Market Forecast by Region, 2024-2034 (US$ Bn, AGR (%), CAGR (%))
Table 29 Other Market Forecast by Region, 2024-2034 (US$ Bn, AGR (%), CAGR (%))
Table 30 Medical Imaging Devices End User Market, 2024-2034 (US$ Bn, AGR (%), CAGR (%))
Table 31 Hospital Market Forecast by Region, 2024-2034 (US$ Bn, AGR (%), CAGR (%))
Table 32 Diagnostic Imaging Centers Market Forecast by Region, 2024-2034 (US$ Bn, AGR (%), CAGR (%))
Table 33 Others Market Forecast by Region, 2024-2034 (US$ Bn, AGR (%), CAGR (%))
Table 34 Medical Imaging Devices Market Forecast by Region, 2024-2034 (US$ Bn, AGR (%), CAGR (%))
Table 35 North America Medical Imaging Devices Market, By Country, 2024-2034 (US$ Bn, AGR (%), CAGR (%))
Table 36 North America Medical Imaging Type Market, 2024-2034 (US$ Bn, AGR (%), CAGR (%))
Table 37 North America Medical Imaging Application Market, 2024-2034 (US$ Bn, AGR (%), CAGR (%))
Table 38 North America End User Market, 2024-2034 (US$ Bn, AGR (%), CAGR (%))
Table 39 U.S. Medical Imaging Devices Market, 2024-2034 (US$ Bn, AGR (%), CAGR (%))
Table 40 US Medical Imaging Type Market, 2024-2034 (US$ Bn, AGR (%), CAGR (%))
Table 41 Canada Medical Imaging Devices Market, 2024-2034 (US$ Bn, AGR (%), CAGR (%))
Table 42 Canada Medical Imaging Type Market, 2024-2034 (US$ Bn, AGR (%), CAGR (%))
Table 43 Europe Medical Imaging Devices Market, By Country, 2024-2034 (US$ Bn, AGR (%), CAGR (%))
Table 44 Europe Medical Imaging Type Market, 2024-2034 (US$ Bn, AGR (%), CAGR (%))
Table 45 Europe Medical Imaging Application Market, 2024-2034 (US$ Bn, AGR (%), CAGR (%))
Table 46 Europe End User Market, 2024-2034 (US$ Bn, AGR (%), CAGR (%))
Table 47 Germany Medical Imaging Devices Market, 2024-2034 (US$ Bn, AGR (%), CAGR (%))
Table 48 Germany Medical Imaging Type Market, 2024-2034 (US$ Bn, AGR (%), CAGR (%))
Table 49 UK Medical Imaging Devices Market, 2024-2034 (US$ Bn, AGR (%), CAGR (%))
Table 50 UK Medical Imaging Type Market, 2024-2034 (US$ Bn, AGR (%), CAGR (%))
Table 51 France Medical Imaging Devices Market, 2024-2034 (US$ Bn, AGR (%), CAGR (%))
Table 52 France Medical Imaging Type Market, 2024-2034 (US$ Bn, AGR (%), CAGR (%))
Table 53 Italy Medical Imaging Devices Market, 2024-2034 (US$ Bn, AGR (%), CAGR (%))
Table 54 Italy Medical Imaging Type Market, 2024-2034 (US$ Bn, AGR (%), CAGR (%))
Table 55 Spain Medical Imaging Devices Market, 2024-2034 (US$ Bn, AGR (%), CAGR (%))
Table 56 Spain Medical Imaging Type Market, 2024-2034 (US$ Bn, AGR (%), CAGR (%))
Table 57 Rest of Europe Medical Imaging Devices Market, 2024-2034 (US$ Bn, AGR (%), CAGR (%))
Table 58 Rest of Europe Medical Imaging Type Market, 2024-2034 (US$ Bn, AGR (%), CAGR (%))
Table 59 Asia Pacific Medical Imaging Devices Market, By Country, 2024-2034 (US$ Bn, AGR (%), CAGR (%))
Table 60 Asia Pacific Medical Imaging Type Market, 2024-2034 (US$ Bn, AGR (%), CAGR (%))
Table 61 Asia-Pacific Medical Imaging Application Market, 2024-2034 (US$ Bn, AGR (%), CAGR (%))
Table 62 Asia-Pacific End User Market, 2024-2034 (US$ Bn, AGR (%), CAGR (%))
Table 63 Japan Medical Imaging Devices Market, 2024-2034 (US$ Bn, AGR (%), CAGR (%))
Table 64 Japan Medical Imaging Type Market, 2024-2034 (US$ Bn, AGR (%), CAGR (%))
Table 65 China Medical Imaging Devices Market, 2024-2034 (US$ Bn, AGR (%), CAGR (%))
Table 66 China Medical Imaging Type Market, 2024-2034 (US$ Bn, AGR (%), CAGR (%))
Table 67 India Medical Imaging Devices Market, 2024-2034 (US$ Bn, AGR (%), CAGR (%))
Table 68 India Medical Imaging Type Market, 2024-2034 (US$ Bn, AGR (%), CAGR (%))
Table 69 South Korea Medical Imaging Devices Market, 2024-2034 (US$ Bn, AGR (%), CAGR (%))
Table 70 South Korea Medical Imaging Type Market, 2024-2034 (US$ Bn, AGR (%), CAGR (%))
Table 71 Australia Medical Imaging Devices Market, 2024-2034 (US$ Bn, AGR (%), CAGR (%))
Table 72 Australia Medical Imaging Type Market, 2024-2034 (US$ Bn, AGR (%), CAGR (%))
Table 73 Rest of Asia Pacific Medical Imaging Devices Market, 2024-2034 (US$ Bn, AGR (%), CAGR (%))
Table 74 Rest of Asia Pacific Medical Imaging Type Market, 2024-2034 (US$ Bn, AGR (%), CAGR (%))
Table 75 Latin America Medical Imaging Devices Market, By Country, 2024-2034 (US$ Bn, AGR (%), CAGR (%))
Table 76 Latin America Medical Imaging Type Market, 2024-2034 (US$ Bn, AGR (%), CAGR (%))
Table 77 Latin America Medical Imaging Application Market, 2024-2034 (US$ Bn, AGR (%), CAGR (%))
Table 78 Latin America End User Market, 2024-2034 (US$ Bn, AGR (%), CAGR (%))
Table 79 Brazil Medical Imaging Devices Market, 2024-2034 (US$ Bn, AGR (%), CAGR (%))
Table 80 Brazil Medical Imaging Type Market, 2024-2034 (US$ Bn, AGR (%), CAGR (%))
Table 81 Mexico Medical Imaging Devices Market, 2024-2034 (US$ Bn, AGR (%), CAGR (%))
Table 82 Mexico Medical Imaging Type Market, 2024-2034 (US$ Bn, AGR (%), CAGR (%))
Table 83 Rest of LATAM Medical Imaging Devices Market, 2024-2034 (US$ Bn, AGR (%), CAGR (%))
Table 84 Rest of LATAM Medical Imaging Type Market, 2024-2034 (US$ Bn, AGR (%), CAGR (%))
Table 85 MEA Medical Imaging Devices Market, By Country, 2024-2034 (US$ Bn, AGR (%), CAGR (%))
Table 86 MEA Medical Imaging Type Market, 2024-2034 (US$ Bn, AGR (%), CAGR (%))
Table 87 MEA Medical Imaging Application Market, 2024-2034 (US$ Bn, AGR (%), CAGR (%))
Table 88 MEA End User Market, 2024-2034 (US$ Bn, AGR (%), CAGR (%))
Table 89 South Africa Medical Imaging Devices Market, 2024-2034 (US$ Bn, AGR (%), CAGR (%))
Table 90 South Africa Medical Imaging Type Market, 2024-2034 (US$ Bn, AGR (%), CAGR (%))
Table 91 GCC Medical Imaging Devices Market, 2024-2034 (US$ Bn, AGR (%), CAGR (%))
Table 92 GCC Medical Imaging Type Market, 2024-2034 (US$ Bn, AGR (%), CAGR (%))
Table 93 Rest of MEA Medical Imaging Devices Market, 2024-2034 (US$ Bn, AGR (%), CAGR (%))
Table 94 Rest of MEA Medical Imaging Type Market, 2024-2034 (US$ Bn, AGR (%), CAGR (%))
Table 95 Key Business Strategies Adopted by Key Players in Global Medical imaging devices market Details
Table 96 Canon Medical Systems: Key Details, (CEO, HQ, Revenue, Founded, No. of Employees, Company Type, Website, Business Segment)
Table 97 Canon Medical Systems: Product Benchmarking
Table 98 Canon Medical Systems Inc: Company Recent Developments
Table 99 FUJIFILM Visual Sonics Inc.: Key Details, (CEO, HQ, Revenue, Founded, No. of Employees, Company Type, Website, Business Segment)
Table 100 FUJIFILM VisualSonics Inc.: Product Benchmarking
Table 101 FUJIFILM VisualSonics Inc.: Company Recent Developments
Table 102 GE HEALTHCARE: Key Details, (CEO, HQ, Revenue, Founded, No. of Employees, Company Type, Website, Business Segment)
Table 103 GE HEALTHCARE: Product Benchmarking
Table 104 GE HEALTHCARE: Company Recent Developments
Table 105 Hologic, Inc: Key Details, (CEO, HQ, Revenue, Founded, No. of Employees, Company Type, Website)
Table 106 Hologic, Inc: Product Benchmarking
Table 107 Hologic, Inc: Company Recent Developments
Table 108 Koning Corporation: Key Details, (CEO, HQ, Revenue, Founded, No. of Employees, Company Type, Website, Business Segment)
Table 109 Koning Corporation: Product Benchmarking
Table 110 Koning Corporation: Company Recent Developments
Table 111 Koninklijke Philips N.V.: Key Details, (CEO, HQ, Revenue, Founded, No. of Employees, Company Type, Website, Business Segment)
Table 112 Koninklijke Philips N.V.: Product Benchmarking
Table 113 Koninklijke Philips N.V.: Company Recent Developments
Table 114 Mindray Medical International: Key Details, (CEO, HQ, Revenue, Founded, No. of Employees, Company Type, Website, Business Segment)
Table 115 Mindray Medical International: Product Benchmarking
Table 116 Mindray Medical International: Strategic Outlook
Table 117 PerkinElmer, Inc. (Revvity Inc.): Key Details, (CEO, HQ, Revenue, Founded, No. of Employees, Company Type, Website, Business Segment)
Table 118 PerkinElmer, Inc. (Revvity Inc.): Product Benchmarking
Table 119 PerkinElmer, Inc. (Revvity Inc.): Strategic Outlook
Table 120 Samsung Medison Co.Ltd: Key Details, (CEO, HQ, Revenue, Founded, No. of Employees, Company Type, Website, Business Segment)
Table 121 Samsung Medison Co.Ltd: Product Benchmarking
Table 122 Samsung Medison Co.Ltd: Strategic Outlook
Table 123 Siemens Healthineers AG: Key Details, (CEO, HQ, Revenue, Founded, No. of Employees, Company Type, Website, Business Segment)
Table 124 Siemens Healthineers AG: Product Benchmarking
Table 125 Siemens Healthineers AG: Strategic Outlook
List of Figures
Figure 1 Global Medical Imaging Devices Market Segmentation
Figure 2 Medical imaging devices market Forecast by Region, 2023: Market Attractiveness Index
Figure 3 Medical imaging devices market by Type: Market Attractiveness Index
Figure 4 Medical Imaging Devices market by Application: Market Attractiveness Index
Figure 5 Medical imaging devices market by End user: Market Attractiveness Index
Figure 6 Medical imaging devices market: Market Dynamics
Figure 7 Medical Imaging Devices Market Forecast by Region, 2024-2034 (US$ Bn, AGR (%), CAGR (%)): “V” Shaped Recovery
Figure 8 Medical Imaging Devices Market by Region, 2024-2034 (US$ Bn, AGR (%), CAGR (%)): “U” Shaped Recovery
Figure 9 Medical Imaging Devices Market Forecast by Region, 2024-2034 (US$ Bn, AGR (%), CAGR (%)): “W” Shaped Recovery
Figure 10 Medical imaging devices market by region, 2024-2034 (US$ Bn, AGR (%), CAGR (%)): “L” Shaped Recovery
Figure 11 Global Medical imaging devices market: Porter’s Five Forces Analysis
Figure 12 Medical imaging devices market by Type: Market Attractiveness Index
Figure 13 Medical imaging devices market Forecast by Type 2024-2034 (Revenue, CAGR%)
Figure 14 Medical imaging devices market Share Forecast by Type, 2024, 2029, 2034 (%)
Figure 15 MRI systems Market Forecast by Region, 2024-2034 (US$ billion)
Figure 16 MRI systems Market Share Forecast by Region, 2024-2034 (%)
Figure 17 Ultrasound imaging systems Market Forecast by Region, 2024-2034 (US$ billion)
Figure 18 Ultrasound imaging systems Market Share Forecast by Region, 2024-2034 (%)
Figure 19 2D Ultrasound Market Forecast, 2024-2034 (US$ billion)
Figure 20 3D Ultrasound Market Forecast, 2024-2034 (US$ billion)
Figure 21 Others Market Forecast, 2024-2034 (US$ billion)
Figure 22 CT Scanners Market Forecast by Region, 2024-2034 (US$ billion)
Figure 23 CT Scanners Market Share Forecast by Region, 2024-2034 (%)
Figure 24 Conventional CT Scanners Market Forecast, 2024-2034 (US$ billion)
Figure 25 Cone Beam CT Scanners Market Forecast, 2024-2034 (US$ billion)
Figure 26 Nuclear imaging systems Market Forecast by Region, 2024-2034 (US$ billion)
Figure 27 Nuclear imaging systems Market Share Forecast by Region, 2024-2034 (%)
Figure 28 SPECT Systems Market Forecast, 2024-2034 (US$ billion)
Figure 29 PET Systems Market Forecast, 2024-2034 (US$ billion)
Figure 30 X-Ray Imaging Systems Market Forecast by Region, 2024-2034 (US$ billion)
Figure 31 Digital X-Ray Imaging Systems Market Forecast, 2024-2034 (US$ billion)
Figure 32 Analog X-Ray Imaging Systems Market Forecast, 2024-2034 (US$ billion)
Figure 33 Mammography Systems Market Forecast by Region, 2024-2034 (US$ billion)
Figure 34 Mammography Systems Market Share Forecast by Region, 2024-2034 (%)
Figure 35 Medical Imaging Devices market by Application: Market Attractiveness Index
Figure 36 Medical imaging devices market Forecast by Application, 2024-2034 (US$ billion, AGR %)
Figure 37 Medical imaging devices market Share Forecast by Application, 2024, 2029, 2034 (%)
Figure 38 Cardiology Market Forecast by Region, 2024-2034 (US$ billion)
Figure 39 Cardiology Market Share Forecast by Region, 2024-2034 (%)
Figure 40 Gynaecology/Obs Market Forecast by Region, 2024-2034 (US$ billion)
Figure 41 Gynaecology/Obs Market Share Forecast by Region, 2024-2034 (%)
Figure 42 Orthopedics & Musculoskeletal Market Forecast by Region, 2024-2034 (US$ billion)
Figure 43 Orthopaedics & Musculoskeletal Market Share Forecast by Region, 2024-2034 (%)
Figure 44 Radiology Market Forecast by Region, 2024-2034 (US$ billion)
Figure 45 Radiology Market Share Forecast by Region, 2024-2034 (%)
Figure 46 Neurology & Spine Market Forecast by Region, 2024-2034 (US$ billion)
Figure 47 Neurology & Spine Market Share Forecast by Region, 2024-2034 (%)
Figure 48 General Imaging Market Forecast by Region, 2024-2034 (US$ billion)
Figure 49 General Imaging Market Share Forecast by Region, 2024-2034 (%)
Figure 50 Others Market Forecast by Region, 2024-2034 (US$ billion)
Figure 51 Others Market Share Forecast by Region, 2024-2034 (%)
Figure 52 Medical imaging devices market by End user: Market Attractiveness Index
Figure 53 Medical imaging devices market Forecast by End user, 2024-2034 (US$ billion, AGR %)
Figure 54 Medical imaging devices market Share Forecast by End user, 2024, 2029, 2034 (%)
Figure 55 Hospital Market Forecast by Region, 2024-2034 (US$ billion)
Figure 56 Hospital Market Share Forecast by Region, 2024-2034 (%)
Figure 57 Diagnostic Imaging Centers Market Forecast by Region, 2024-2034 (US$ billion)
Figure 58 Diagnostic Imaging Centers Market Share Forecast by Region, 2024-2034 (%)
Figure 59 Others Market Forecast by Region, 2024-2034 (US$ billion)
Figure 60 Others Market Share Forecast by Region, 2024-2034 (%)
Figure 61 Medical imaging devices market Forecast by Region 2024, 2034 (Revenue)
Figure 62 Medical imaging devices market Share Forecast by Region 2024, 2029, 2034 (%)
Figure 63 Medical imaging devices market by Region, 2024-2034 (US$ Bn, AGR (%), CAGR (%))
Figure 64 North America Medical imaging devices market Attractiveness Index, 2023
Figure 65 North America Medical imaging devices market by Region, 2024, 2029 & 2034 (US$ billion)
Figure 66 North America Medical imaging devices market Forecast by Country, 2024-2034 (US$ billion, AGR %)
Figure 67 North America Medical imaging devices market Share Forecast by Country, 2024, 2029, 2034(%)
Figure 68 North America Medical imaging devices market Forecast by Type, 2024-2034 (US$ billion, AGR %)
Figure 69 North America Medical imaging devices market Share Forecast by Type, 2024, 2029, 2034 (%)
Figure 70 North America Medical imaging devices market Forecast by Application, 2024-2034 (US$ billion, AGR %)
Figure 71 North America Medical imaging devices market Share Forecast by Application, 2024, 2029, 2034 (%)
Figure 72 North America Medical imaging devices market Forecast by End user, 2024-2034 (US$ billion, AGR %)
Figure 73 North America Medical imaging devices market Share Forecast by End user, 2024, 2029, 2034 (%)
Figure 74 U.S. Medical imaging devices market Forecast, 2024-2034 (US$ billion, AGR %)
Figure 75 U.S. Medical imaging devices market Forecast by Type, 2024-2034 (US$ billion, AGR %)
Figure 76 U.S. Medical imaging devices market Share Forecast by Type, 2024, 2029, 2034 (%)
Figure 77 Canada Medical imaging devices market Forecast, 2024-2034 (US$ billion, AGR %)
Figure 78 Canada Medical imaging devices market Forecast by Type, 2024-2034 (US$ billion, AGR %)
Figure 79 Canada Medical imaging devices market Share Forecast by Type, 2024, 2029, 2034 (%)
Figure 80 Europe Medical imaging devices market Attractiveness Index, 2023
Figure 81 Europe Medical imaging devices market by Region, 2024, 2029 & 2034 (US$ billion)
Figure 82 Europe Medical imaging devices market Forecast by Country, 2024-2034 (US$ billion, AGR %)
Figure 83 Europe Medical imaging devices market Share Forecast by Country, 2024, 2029, 2034 (%)
Figure 84 Europe Medical imaging devices market Forecast by Type, 2024-2034 (US$ billion, AGR %)
Figure 85 Europe Medical imaging devices market Share Forecast by Type, 2024, 2029, 2034 (%)
Figure 86 Europe Medical imaging devices market Forecast by Application, 2024-2034 (US$ billion, AGR %)
Figure 87 Europe Medical imaging devices market Share Forecast by Application, 2024, 2029, 2034 (%)
Figure 88 Europe Medical imaging devices market Forecast by End user, 2024-2034 (US$ billion, AGR %)
Figure 89 Europe Medical imaging devices market Share Forecast by End user, 2024, 2029, 2034 (%)
Figure 90 Germany Medical imaging devices market Forecast, 2024-2034 (US$ billion, AGR %)
Figure 91 Germany Medical imaging devices market Forecast by Type, 2024-2034 (US$ billion, AGR %)
Figure 92 Germany Medical imaging devices market Share Forecast by Type, 2024, 2029, 2034 (%)
Figure 93 UK Medical imaging devices market Forecast, 2024-2034 (US$ billion, AGR %)
Figure 94 U.K. Medical imaging devices market Forecast by Type, 2024-2034 (US$ billion, AGR %)
Figure 95 U.K. Medical imaging devices market Share Forecast by Type, 2024, 2029, 2034 (%)
Figure 96 France Medical imaging devices market Forecast, 2024-2034 (US$ billion, AGR %)
Figure 97 France Medical imaging devices market Forecast by Type, 2024-2034 (US$ billion, AGR %)
Figure 98 France Medical imaging devices market Share Forecast by Type, 2024, 2029, 2034 (%)
Figure 99 Italy Medical imaging devices market Forecast, 2024-2034 (US$ billion, AGR %)
Figure 100 Italy Medical imaging devices market Forecast by Type, 2024-2034 (US$ billion, AGR %)
Figure 101 Italy Medical imaging devices market Share Forecast by Type, 2024, 2029, 2034 (%)
Figure 102 Spain Medical imaging devices market Forecast, 2024-2034 (US$ billion, AGR %)
Figure 103 Spain Medical imaging devices market Forecast by Type, 2024-2034 (US$ billion, AGR %)
Figure 104 Spain Medical imaging devices market Share Forecast by Type, 2024, 2029, 2034 (%)
Figure 105 Rest of Europe Medical imaging devices market Forecast, 2024-2034 (US$ billion, AGR %)
Figure 106 Rest of Europe Medical imaging devices market Forecast by Type, 2024-2034 (US$ billion, AGR %)
Figure 107 Rest of Europe Medical imaging devices market Share Forecast by Type, 2024, 2029, 2034 (%)
Figure 108 Asia Pacific Medical imaging devices market Attractiveness Index, 2023
Figure 109 Asia Pacific Medical imaging devices market by Region, 2024, 2029 & 2034 (US$ billion)
Figure 110 Asia Pacific Medical imaging devices market Forecast by Country, 2024-2034 (US$ billion, AGR %)
Figure 111 Asia Pacific Medical imaging devices market Share Forecast by Country, 2024, 2029, 2034 (%)
Figure 112 Asia Pacific Medical imaging devices market Forecast by Type, 2024-2034 (US$ billion, AGR %)
Figure 113 Asia Pacific Medical imaging devices market Share Forecast by Type, 2024, 2029, 2034 (%)
Figure 114 Asia-Pacific Medical imaging devices market Forecast by Application, 2024-2034 (US$ billion, AGR %)
Figure 115 Asia-Pacific Medical imaging devices market Share Forecast by Application, 2024, 2029, 2034 (%)
Figure 116 Asia Pacific Medical imaging devices market Forecast by End user, 2024-2034 (US$ billion, AGR %)
Figure 117 Asia Pacific Medical imaging devices market Share Forecast by End user, 2024, 2029, 2034 (%)
Figure 118 Japan Medical imaging devices market Forecast, 2024-2034 (US$ billion, AGR %)
Figure 119 Japan Medical imaging devices market Forecast by Type, 2024-2034 (US$ billion, AGR %)
Figure 120 Japan Medical imaging devices market Share Forecast by Type, 2024, 2029, 2034 (%)
Figure 121 China Medical imaging devices market Forecast, 2024-2034 (US$ billion, AGR %)
Figure 122 China Medical imaging devices market Forecast by Type, 2024-2034 (US$ billion, AGR %)
Figure 123 China Medical imaging devices market Share Forecast by Type, 2024, 2029, 2034 (%)
Figure 124 India Medical imaging devices market Forecast, 2024-2034 (US$ billion, AGR %)
Figure 125 India Medical imaging devices market Forecast by Type, 2024-2034 (US$ billion, AGR %)
Figure 126 India Medical imaging devices market Share Forecast by Type, 2024, 2029, 2034 (%)
Figure 127 South Korea Medical imaging devices market Forecast, 2024-2034 (US$ billion, AGR %)
Figure 128 South Korea Medical imaging devices market Forecast by Type, 2024-2034 (US$ billion, AGR %)
Figure 129 South Korea Medical imaging devices market Share Forecast by Type, 2024, 2029, 2034 (%)
Figure 130 Australia Medical imaging devices market Forecast, 2024-2034 (US$ billion, AGR %)
Figure 131 Australia Medical imaging devices market Forecast by Type, 2024-2034 (US$ billion, AGR %)
Figure 132 Australia Medical imaging devices market Share Forecast by Type, 2024, 2029, 2034 (%)
Figure 133 Rest of Asia Pacific Medical imaging devices market Forecast, 2024-2034 (US$ billion, AGR %)
Figure 134 Rest of APAC Medical imaging devices market Forecast by Type, 2024-2034 (US$ billion, AGR %)
Figure 135 Rest of APAC Medical imaging devices market Share Forecast by Type, 2024, 2029, 2034 (%)
Figure 136 Latin America Medical imaging devices market Attractiveness Index, 2023
Figure 137 Latin America Medical imaging devices market by Region, 2024, 2029 & 2034 (US$ billion)
Figure 138 Latin America Medical imaging devices market Forecast by Country, 2024-2034 (US$ billion, AGR %)
Figure 139 Latin America Medical imaging devices market Share Forecast by Country, 2024, 2029, 2034 (%)
Figure 140 Latin America Medical imaging devices market Forecast by Type, 2024-2034 (US$ billion, AGR %)
Figure 141 Latin America Medical imaging devices market Share Forecast by Type, 2024, 2029, 2034 (%)
Figure 142 Latin America Medical imaging devices market Forecast by Application, 2024-2034 (US$ billion, AGR %)
Figure 143 Latin America Medical imaging devices market Share Forecast by Application, 2024, 2029, 2034 (%)
Figure 144 Latin America Medical imaging devices market Forecast by End user, 2024-2034 (US$ billion, AGR %)
Figure 145 Latin America Medical imaging devices market Share Forecast by End user, 2024, 2029, 2034 (%)
Figure 146 Brazil Medical imaging devices market Forecast, 2024-2034 (US$ billion, AGR %)
Figure 147 Brazil Medical imaging devices market Forecast by Type, 2024-2034 (US$ billion, AGR %)
Figure 148 Brazil Medical imaging devices market Share Forecast by Type, 2024, 2029, 2034 (%)
Figure 149 Mexico Medical imaging devices market Forecast, 2024-2034 (US$ billion, AGR %)
Figure 150 Mexico Medical imaging devices market Forecast by Type, 2024-2034 (US$ billion, AGR %)
Figure 151 Mexico Medical imaging devices market Share Forecast by Type, 2024, 2029, 2034 (%)
Figure 152 Rest of LATAM Medical imaging devices market Forecast, 2024-2034 (US$ billion, AGR %)
Figure 153 Rest of LATAM Medical imaging devices market Forecast by Type, 2024-2034 (US$ billion, AGR %)
Figure 154 Rest of LATAM Medical imaging devices market Share Forecast by Type, 2024, 2029, 2034 (%)
Figure 155 MEA Medical imaging devices market Attractiveness Index, 2023
Figure 156 MEA Medical imaging devices market by Region, 2024, 2029 & 2034 (US$ billion)
Figure 157 MEA Medical imaging devices market Forecast by Country, 2024-2034 (US$ billion, AGR %)
Figure 158 MEA Medical imaging devices market Share Forecast by Country, 2024, 2029, 2034 (%)
Figure 159 MEA Medical imaging devices market Forecast by Type, 2024-2034 (US$ billion, AGR %)
Figure 160 MEA Medical imaging devices market Share Forecast by Type, 2024, 2029, 2034 (%)
Figure 161 MEA Medical imaging devices market Forecast by Application, 2024-2034 (US$ billion, AGR %)
Figure 162 MEA Medical imaging devices market Share Forecast by Application, 2024, 2029, 2034 (%)
Figure 163 MEA Medical imaging devices market Forecast by End user, 2024-2034 (US$ billion, AGR %)
Figure 164 MEA Medical imaging devices market Share Forecast by End user, 2024, 2029, 2034 (%)
Figure 165 South Africa Medical imaging devices market Forecast, 2024-2034 (US$ billion, AGR %)
Figure 166 South Africa Medical imaging devices market Forecast by Type, 2024-2034 (US$ billion, AGR %)
Figure 167 South Africa Medical imaging devices market Share Forecast by Type, 2024, 2029, 2034 (%)
Figure 168 GCC Medical imaging devices market Forecast, 2024-2034 (US$ billion, AGR %)
Figure 169 GCC Medical imaging devices market Forecast by Type, 2024-2034 (US$ billion, AGR %)
Figure 170 GCC Medical imaging devices market Share Forecast by Type, 2024, 2029, 2034 (%)
Figure 171 Rest of MEA Medical imaging devices market Forecast, 2024-2034 (US$ billion, AGR %)
Figure 172 Rest of MEA Medical imaging devices market Forecast by Type, 2024-2034 (US$ billion, AGR %)
Figure 173 Rest of MEA Medical imaging devices market Share Forecast by Type, 2024, 2029, 2034 (%)
Figure 174 Medical imaging devices market: Company Share Analysis, 2022
Figure 175 Canon Medical Systems: Net Sales, 2019-2022 (US$ Billion, AGR%)
Figure 176 Canon Medical Systems: Regional Market Shares, 2022
Figure 177 Canon Medical Systems: R&D, 2019-2022 (US$ billion, AGR%)
Figure 178 FUJIFILM Visual Sonics Inc.: Net Revenue, 2019-2022 (US$ Million, AGR%)
Figure 179 FUJIFILM VisualSonics Inc.: Regional Market Shares, 2022
Figure 180 FUJIFILM VisualSonics Inc.: R&D, 2019-2022 (US$ Million, AGR%)
Figure 181 GE HEALTHCARE: Net Revenue, 2019-2022 (US$ Million, AGR%)
Figure 182 GE HEALTHCARE: Regional Market Shares, 2022
Figure 183 GE HEALTHCARE: R&D, 2019-2022 (US$ Million, AGR%)
Figure 184 Hologic, Inc: Net Revenue, 2019-2022 (US$ Million, AGR%)
Figure 185 Hologic, Inc: Regional Market Shares, 2022
Figure 186 Hologic, Inc: R&D, 2019-2022 (US$ Million, AGR%)
Figure 187 Koning Corporation: Sales, 2019-2022 (US$ Million, AGR%)
Figure 188 Koning Corporation: Regional Market Shares, 2022
Figure 189 Koning Corporation: R&D, 2019-2022 (US$ Million, AGR%)
Figure 190 Koninklijke Philips N.V.: Net Revenue, 2019-2022 (US$ Million, AGR%)
Figure 191 Koninklijke Philips N.V.: Regional Market Shares, 2022
Figure 192 Koninklijke Philips N.V.: R&D, 2019-2022 (US$ Million, AGR%)
Figure 193 Mindray Medical International: Net Sales, 2019-2022 (US$ Million, AGR%)
Figure 194 Mindray Medical International: R&D, 2019-2022 (US$ Million, AGR%)
Figure 195 PerkinElmer, Inc. (Revvity Inc.): Net Revenue, 2019-2022 (US$ Million)
Figure 196 PerkinElmer, Inc. (Revvity Inc.): Regional Market Shares, 2022
Figure 197 PerkinElmer, Inc. (Revvity Inc.): R&D, 2019-2022 (US$ Million)
Figure 198 Samsung Medison Co.Ltd: Net Revenue, 2019-2022 (US$ Million)
Figure 199 Samsung Medison Co.Ltd: Regional Market Shares, 2022
Figure 200 Samsung Medison Co.Ltd: R&D, 2019-2022 (US$ Million)
Figure 201 Siemens Healthineers AG: Net Revenue, 2019-2022 (US$ Million)
Figure 202 Siemens Healthineers AG: Regional Market Shares, 2022
Figure 203 Siemens Healthineers AG: R&D, 2019-2022 (US$ Million)
ページTOPに戻る
よくあるご質問
Visiongain社はどのような調査会社ですか?
英国の調査会社ヴィジョンゲイン社(Visiongain)は、通信とエネルギーのほか、自動車や化学・医薬品、金属など、広範な市場を対象に調査を行っています。自動車市場については、市場全般に関する調査のほ... もっと見る
調査レポートの納品までの日数はどの程度ですか?
在庫のあるものは速納となりますが、平均的には 3-4日と見て下さい。
但し、一部の調査レポートでは、発注を受けた段階で内容更新をして納品をする場合もあります。
発注をする前のお問合せをお願いします。
注文の手続きはどのようになっていますか?
1)お客様からの御問い合わせをいただきます。
2)見積書やサンプルの提示をいたします。
3)お客様指定、もしくは弊社の発注書をメール添付にて発送してください。
4)データリソース社からレポート発行元の調査会社へ納品手配します。
5) 調査会社からお客様へ納品されます。最近は、pdfにてのメール納品が大半です。
お支払方法の方法はどのようになっていますか?
納品と同時にデータリソース社よりお客様へ請求書(必要に応じて納品書も)を発送いたします。
お客様よりデータリソース社へ(通常は円払い)の御振り込みをお願いします。
請求書は、納品日の日付で発行しますので、翌月最終営業日までの当社指定口座への振込みをお願いします。振込み手数料は御社負担にてお願いします。
お客様の御支払い条件が60日以上の場合は御相談ください。
尚、初めてのお取引先や個人の場合、前払いをお願いすることもあります。ご了承のほど、お願いします。
データリソース社はどのような会社ですか?
当社は、世界各国の主要調査会社・レポート出版社と提携し、世界各国の市場調査レポートや技術動向レポートなどを日本国内の企業・公官庁及び教育研究機関に提供しております。
世界各国の「市場・技術・法規制などの」実情を調査・収集される時には、データリソース社にご相談ください。
お客様の御要望にあったデータや情報を抽出する為のレポート紹介や調査のアドバイスも致します。
|
|


