神経調節装置市場レポート:2024-2034
Neuromodulation Devices Market Report 2024-2034
レポート詳細
神経調節装置市場レポート 2024-2034年 :この調査レポートは、業界とその基礎となる原動力をより良く理解することを望むなら、新たな収益ポケットを目指す大手企業にとって貴重なもの... もっと見る
※上記価格は部署ライセンス(Departmental licence)価格です。
その他の価格についてはデータリソースまでお問合せください。
日本語のページは自動翻訳を利用し作成しています。
実際のレポートは英文のみでご納品いたします。

|

|
サマリー
レポート詳細
神経調節装置市場レポート 2024-2034年:この調査レポートは、業界とその基礎となる原動力をより良く理解することを望むなら、新たな収益ポケットを目指す大手企業にとって貴重なものとなるでしょう。異業種への進出や新規地域での既存事業の拡大を目指す企業にも有用です。
神経調節における脳深部刺激療法(DBS)の需要急増
神経調節における脳深部刺激療法(DBS)の需要は、用途の拡大、技術の進歩、良好な臨床結果、神経学的研究の進展、患者や医療提供者の意識の高まりなどの要因によって、顕著な急増を経験している。この急増は、さまざまな神経疾患に対する効果的な治療介入としてDBSが受け入れられつつあることを反映している。神経調節の分野における継続的な開発は、DBSの需要増加に引き続き寄与しており、多様な病状に対処し、患者の転帰を改善する可能性を示しています。
神経調節装置の使用に伴う合併症
神経調節装置の使用は治療効果をもたらすが、潜在的な合併症がないわけではない。これらの機器に関連する合併症には、植え込み部位の感染、ハードウェアの不具合、リードの移動や破損、電気刺激に対する副作用などがある。さらに、患者はしびれ、痛み、筋収縮などの副作用を経験することもある。リスクを最小限に抑えるためには、適切な患者選択、正確な手術部位、継続的なモニタリングが重要である。神経調節の有効性にもかかわらず、合併症の可能性があることから、さまざまな神経疾患の管理にこれらの機器を安全かつ効果的に使用するためには、慎重な患者評価、徹底した術前計画、用心深い術後管理が重要であることが強調される。
市場調査レポートを購入する前にすべき質問とは?
-
神経調節装置市場はどのように発展しているのか?
-
神経調節装置市場の牽引役と阻害要因は何か?
-
神経調節装置の各サブマーケットは予測期間中にどのように成長し、2034年にはどれくらいの売上を占めるようになるのだろうか?
-
2024年から2034年にかけて、神経調節装置の各サブマーケットの市場シェアはどのように推移するのか?
-
2024年から2034年にかけて、市場全体を牽引する主な要因は何か?
-
主要な神経調節装置市場は、マクロ経済の動きに幅広く追随するのだろうか、それとも個々の国の市場が他を凌駕するのだろうか。
-
2034年までに各国市場のシェアはどのように変化し、どの地域が2034年の市場をリードするのか。
-
主要プレーヤーと予測期間中の見通しは?
-
これらの主要企業による神経調節装置プロジェクトとは?
-
2024年から2034年の間に、業界はどのように発展するのか?現在および今後10年間に実施される神経調節装置プロジェクトが意味するものは何か?
-
神経調節装置市場をさらに拡大するために、製品化の必要性は高まっているのだろうか?
-
神経調節装置市場はどこに向かっているのか、また、どのようにすれば市場の最前線に立てるのか。
-
新商品や新サービスに最適な投資方法とは?
-
企業を新たな成長軌道に乗せ、C-suiteに移行させるための重要な展望とは?
このことが、現在、そして今後10年間の神経調節装置市場にどのような影響を与えるかを見極める必要がある:
-
251ページに及ぶレポートには、96の表と133の図表が掲載されている。
-
について本レポートでは、業界の主要な有利分野を取り上げている。今すぐ
-
世界、地域、国の売上高と成長に関する詳細な分析が含まれている。
-
競合他社が成功した主なトレンド、変化、収益予測をハイライトします。
本レポートは、神経調節装置市場が今後10年間にどのように発展していくのか、またCOVID-19の景気後退と好転の変動に合わせてどのように発展していくのかをお伝えするものです。この市場は過去10年間のどの時点よりも今が重要である。
2034年までの予測やその他の分析から、商業的な展望が明らかになる
-
2034年までの収益予測に加え、最近の実績、成長率、市場シェアも提供している。
-
ビジネスの展望や展開など、独自の分析が掲載されている。
-
定性的分析(市場ダイナミクス、促進要因、機会、阻害要因、課題など)、コスト構造、神経調節装置価格上昇の影響、最近の動向などをご覧いただけます。
本レポートには、COVID-19が業界と貴社にどのような影響を与えるかについてのデータ分析と貴重な洞察が含まれている。本レポートでは、COVID-19の4つの回収パターンとその影響、すなわち「V」、「L」、「W」、「U」について論じている。
レポート対象セグメント
製品別
-
脳深部刺激装置
-
胃電気刺激装置
-
脊髄刺激装置
-
仙骨神経刺激装置
-
迷走神経刺激装置
-
経皮的電気神経刺激装置
-
その他
用途別
-
疼痛管理
-
てんかん
-
本態性振戦
-
尿失禁と便失禁
-
うつ病
-
ジストニア
-
胃不全麻痺
-
パーキンソン病
-
その他
世界市場全体とセグメント別の収益予測に加え、5つの地域と21の主要国市場の収益予測も掲載しています。
北米
欧州
-
ドイツ
-
英国
-
フランス
-
スペイン
-
イタリア
-
ロシア
-
その他の欧州
アジア太平洋
-
中国
-
日本
-
インド
-
オーストラリア
-
韓国
-
その他のアジア太平洋
ラテンアメリカ
MEA
また、本レポートでは、神経調節装置市場における主要企業のプロファイルと2024年から2034年までの事業セグメントを紹介している。
報告書に掲載されている主要企業
-
Abbott
-
Boston Scientific Corporation
-
electroCore, Inc.
-
Helbling Holding AG
-
Innovative Health Solutions
-
LivaNova PLC
-
Medtronic
-
MicroTransponder Inc.
-
Neuronetics Inc.
-
Parasym
-
Synapse Biomedical Inc.
-
tVNS Technologies GmbH
2024年から2034年にかけての神経調節装置市場全体の世界売上高は、金額ベースで2024年に100億米ドルを突破する。2034年まで力強い収益成長を予測。当研究所では、最大の可能性を秘めた組織を特定しています。彼らの能力、進歩、商業的展望を発見し、一歩先を行くお手伝いをします。
神経調節装置市場、2024-2034年レポートはどのようにお役に立つでしょうか?
まとめると、250ページを超えるこのレポートは、以下のような知識を提供する:
-
神経調節装置市場の2024年から2034年までの収益予測 世界および地域レベルでの製品、用途、投与経路ごとの予測を掲載 - 業界の将来性を発見し、投資と収益に最も有利な場所を見つけます。
-
5つの地域と21の主要国市場の2034年までの収益予測 - 北米、欧州、アジア太平洋、ラテンアメリカ、MEAの神経調節装置市場の2024年から2034年までの市場予測をご覧ください。また、米国、カナダ、メキシコ、ブラジル、ドイツ、フランス、英国、イタリア、中国、インド、日本、オーストラリアなどの主要国の市場も予測しています。
-
2024年から2034年までの神経調節装置市場に関わる主要企業12社の企業プロファイルを含む。
独自の予測による定量的・定性的分析をご覧ください。私たちのレポートだけに含まれる情報を入手し、貴重なビジネスインテリジェンスで情報を得ることができます。
他にはない情報
私たちの新しいレポートがあれば、知識に遅れをとったり、チャンスを逃したりする可能性が低くなります。弊社の調査レポートが貴社の調査、分析、意思決定にどのように役立つかをご覧ください。Visiongainの調査は、神経調節装置市場2024年から2034年、市場をリードする企業の商業分析を必要とするすべての人のためのものです。データ、トレンド、予測をご覧いただけます。
ページTOPに戻る
目次
目次
1 レポート概要
1.1 研究の目的
1.2 神経調節装置市場の紹介
1.3 本レポートの内容
1.4 本レポートを読むべき理由
1.5 本分析レポートが回答する主な質問
1.6 本レポートの対象者
1.7 方法論
1.7.1 市場の定義
1.7.2 市場評価・予測手法
1.7.3 データの検証
1.7.3.1 一次調査
1.7.3.2 セカンダリーリサーチ
1.8 よくある質問(FAQ)
1.9 Visiongainの関連レポート
1.10 Visiongainについて
2 エグゼクティブ・サマリー
3 市場概要
3.1 主要な調査結果
3.2 市場ダイナミクス
3.2.1 市場促進要因
3.2.1.1 製薬・バイオテクノロジー業界における脳深部刺激療法用神経調節デバイスの需要拡大
3.2.1.2 神経疾患および神経損傷の有病率の上昇
3.2.1.3 非侵襲的治療に対する患者の嗜好の高まり
3.2.1.4 神経調節装置の治療用途の拡大
3.2.1.5 神経調節装置の技術的進歩
3.2.2 市場抑制要因
3.2.2.1 神経調節装置の使用に伴う合併症
3.2.2.2 神経調節装置の高コスト
3.2.2.3 厳しい規制の枠組みと徹底した承認プロセス
3.2.2.4 神経調節装置よりも薬物療法が好まれる傾向
3.2.2.5 神経調節装置における製品リコール
3.2.2.6 熟練した医療従事者の不足
3.2.3 市場機会
3.2.3.1 先進国における低侵襲手術の需要増加
3.2.3.2 神経障害を持つ高齢患者の増加
3.3 COVID-19の影響分析
3.4 ポーターのファイブフォース分析
3.4.1 サプライヤーの交渉力
3.4.2 買い手の交渉力
3.4.3 競争相手のライバル関係
3.4.4 代替品による脅威
3.4.5 新規参入企業の脅威
3.5 PEST分析
4 神経調節装置市場分析:製品別
4.1 主要な調査結果
4.2 製品セグメント 市場魅力度指数
4.3 神経調節装置の製品別市場規模推定と予測
4.4 脳深部刺激装置
4.4.1 2024〜2034年の地域別市場規模(US$ Million)
4.4.2 地域別市場シェア、2024年・2034年(%)
4.5 胃電気刺激装置
4.5.1 2024~2034年の地域別市場規模(US$ Million)
4.5.2 地域別市場シェア、2024年・2034年(%)
4.6 脊髄電気刺激装置
4.6.1 2024~2034年の地域別市場規模(US$ Million)
4.6.2 地域別市場シェア、2024年・2034年(%)
4.7 仙骨神経刺激装置
4.7.1 2024~2034年の地域別市場規模(US$ Million)
4.7.2 地域別市場シェア、2024年・2034年(%)
4.8 迷走神経刺激装置
4.8.1 2024~2034年の地域別市場規模(US$ Million)
4.8.2 地域別市場シェア、2024年・2034年(%)
4.9 経皮電気神経刺激装置
4.9.1 2024~2034年の地域別市場規模(US$ Million)
4.9.2 地域別市場シェア、2024年・2034年(%)
4.10 その他
4.10.1 2024〜2034年の地域別市場規模(US$ Million)
4.10.2 地域別市場シェア、2024年・2034年 (%)
5 神経調節装置市場分析:用途別
5.1 主要な調査結果
5.2 用途別セグメント 市場魅力度指数
5.3 神経調節装置の用途別市場規模の推定と予測
5.4 疼痛管理
5.4.1 2024〜2034年の地域別市場規模(US$ Million)
5.4.2 地域別市場シェア、2024年・2034年 (%)
5.5 てんかん
5.5.1 2024〜2034年の地域別市場規模(US$ Million)
5.5.2 地域別市場シェア、2024年・2034年 (%)
5.6 本態性振戦
5.6.1 2024〜2034年の地域別市場規模(US$ Million)
5.6.2 地域別市場シェア、2024年・2034年 (%)
5.7 尿失禁および便失禁
5.7.1 2024〜2034年の地域別市場規模(US$ Million)
5.7.2 地域別市場シェア、2024年・2034年 (%)
5.8 うつ病
5.8.1 2024〜2034年の地域別市場規模(US$ Million)
5.8.2 地域別市場シェア、2024年・2034年 (%)
5.9 ジストニア
5.9.1 2024〜2034年の地域別市場規模(US$ Million)
5.9.2 地域別市場シェア、2024年・2034年 (%)
5.10 胃不全麻痺
5.10.1 2024〜2034年の地域別市場規模(US$ Million)
5.10.2 地域別市場シェア、2024年・2034年 (%)
5.11 パーキンソン病
5.11.1 2024〜2034年の地域別市場規模(US$ Million)
5.11.2 地域別市場シェア、2024年・2034年 (%)
5.12 その他
5.12.1 2024〜2034年の地域別市場規模(US$ Million)
5.12.2 地域別市場シェア、2024年・2034年 (%)
6 神経調節装置市場分析:地域別
6.1 主要な調査結果
6.2 地域別市場規模の推定と予測
7 北米の神経調節装置市場分析
7.1 主要な調査結果
7.2 北米の神経調節装置市場魅力度指数
7.3 北米の神経調節装置国別市場、2024年、2029年、2034年(US$ Million)
7.4 北米の神経調節装置市場規模推定と予測:国別
7.5 北米の神経調節装置市場規模推定と予測:製品別
7.6 北米の神経調節装置市場規模推定と予測:用途別
7.7 アメリカの神経調節装置市場分析
7.8 カナダの神経調節装置市場分析
8 欧州の神経調節装置の市場分析
8.1 主要な調査結果
8.2 欧州の神経調節装置市場魅力度指数
8.3 欧州の神経調節装置の国別市場、2024年、2029年、2034年(US$ Million)
8.4 欧州の神経調節装置市場規模推定と予測:国別
8.5 欧州の神経調節装置市場規模推定と予測:製品別
8.6 欧州の神経調節装置市場規模推定と予測:用途別
8.7 ドイツの神経調節装置市場分析
8.8 フランスの神経調節装置市場分析
8.9 イギリスの神経調節装置市場分析
8.10 イタリアの神経調節装置市場分析
8.11 スペインの神経調節装置市場分析
8.12 ロシアの神経調節装置市場分析
8.13 その他の欧州経調節装置市場の分析
9 アジア太平洋地域の神経調節装置市場分析
9.1 主要な調査結果
9.2 アジア太平洋地域の神経調節装置市場魅力度指数
9.3 アジア太平洋地域の神経調節装置国別市場、2024年、2029年、2034年(US$ Million)
9.4 アジア太平洋地域の神経調節装置市場規模推定と予測:国別
9.5 アジア太平洋地域の神経調節装置市場規模推定と予測:製品別
9.6 アジア太平洋地域の神経調節装置市場規模推定と予測:用途別
9.7 日本の神経調節装置市場分析
9.8 中国の神経調節装置市場分析
9.9 インドの神経調節装置市場分析
9.10 オーストラリアの神経調節装置市場分析
9.11 韓国神経調節装置市場分析
9.12 その他のアジア太平洋地域の神経調節装置市場分析
10 ラテンアメリカの神経調節装置市場分析
10.1 主要な調査結果
10.2 ラテンアメリカの神経調節装置市場魅力度指数
10.3 ラテンアメリカの神経調節装置の国別市場、2024年、2029年、2034年(US$ Million)
10.4 ラテンアメリカの神経調節装置市場規模推定と予測:国別
10.5 ラテンアメリカの神経調節装置市場規模推定と予測:製品別
10.6 ラテンアメリカの神経調節装置市場規模推定と予測:用途別
10.7 ブラジルの神経調節装置市場分析
10.8 メキシコの神経調節装置市場分析
10.9 その他のラテンアメリカの神経調節装置市場分析
11 MEAの神経調節装置の市場分析
11.1 主要な調査結果
11.2 MEAの神経調節装置市場魅力度指数
11.3 MEAの神経調節装置の国別市場、2024年、2029年、2034年(US$ Million)
11.4 MEAの神経調節装置市場規模推定と予測:国別
11.5 MEAの神経調節装置市場規模推定と予測:製品別
11.6 MEAの神経調節装置市場規模推定と予測:用途別
11.7 GCCの神経調節装置市場分析
11.8 南アフリカの神経調節装置市場分析
11.9 その他のMEA神経調節装置市場分析
12 主要企業のプロフィール
12.1 競争環境、2022年
12.2 戦略的展望
12.3 Abbott
12.3.1 会社概要
12.3.2 会社概要
12.3.3 財務分析
12.3.3.1 純収入、2017-2022年
12.3.3.2 R&D、2017-2022年
12.3.3.3 地域市場シェア、2022年
12.3.4 製品ベンチマーク
12.3.5 戦略的展望
12.4 Boston Scientific Corporation
12.4.1 会社概要
12.4.2 会社概要
12.4.3 財務分析
12.4.3.1 純収入、2017-2022年
12.4.3.2 売上高、2017-2022年
12.4.3.3 地域市場シェア、2022年
12.4.4 製品ベンチマーク
12.4.5 戦略的展望
12.5 electroCore, Inc.
12.5.1 会社概要
12.5.2 会社概要
12.5.3 財務分析
12.5.3.1 純収入、2017-2022年
12.5.3.2 R&D、2017-2022年
12.5.3.3 地域市場シェア、2022年
12.5.4 製品ベンチマーク
12.5.5 戦略的展望
12.6 Helbling Holding AG
12.6.1 会社概要
12.6.2 会社概要
12.6.3 財務分析
12.6.3.1 純収入、2017-2022年
12.6.4 製品ベンチマーク
12.6.5 戦略的展望
12.7 Innovative Health Solutions
12.7.1 会社概要
12.7.2 会社概要
12.7.3 製品ベンチマーク
12.8 LivaNova PLC
12.8.1 会社概要
12.8.2 会社概要
12.8.3 財務分析
12.8.3.1 純収入、2017-2022年
12.8.3.2 R&D、2017-2022年
12.8.3.3 地域市場シェア、2022年
12.8.4 製品ベンチマーク
12.8.5 戦略的展望
12.9 Medtronic
12.9.1 会社概要
12.9.2 会社概要
12.9.3 財務分析
12.9.3.1 純収入、2017-2022年
12.9.3.2 売上高、2017-2022年
12.9.3.3 地域市場シェア、2022年
12.9.4 製品ベンチマーク
12.9.5 戦略的展望
12.10 MicroTransponder Inc.
12.10.1 会社概要
12.10.2 会社概要
12.10.3 製品ベンチマーク
12.10.4 戦略的展望
12.11 Neuronetics Inc.
12.11.1 会社概要
12.11.2 会社概要
12.11.3 財務分析
12.11.3.1 純収入、2017-2022年
12.11.3.2 R&D、2017-2022年
12.11.3.3 地域市場シェア、2022年
12.11.4 製品ベンチマーク
12.11.5 戦略的展望
12.12 Parasym
12.12.1 会社概要
12.12.2 会社概要
12.12.3 製品ベンチマーク
12.12.4 戦略的展望
12.13 Synapse Biomedical Inc
12.13.1 会社概要
12.13.2 会社概要
12.13.3 製品ベンチマーク
12.13.4 戦略的展望
12.14 tVNS Technologies GmbH
12.14.1 会社概要
12.14.2 会社概要
12.14.3 製品ベンチマーク
12.14.4 戦略的展望
13 結論と提言
13.1 Visiongainからの結びの言葉
13.2 市場プレイヤーへの提言
ページTOPに戻る
図表リスト
表の一覧
Table 1 Neuromodulation Devices Market Snapshot, 2024 & 2034 (US$ Million, CAGR %)
Table 2 Neuromodulation Devices Market Forecast by Region, 2024-2034 (US$ Million, AGR%, CAGR%): “V” Shaped Recovery
Table 3 Neuromodulation Devices Market Forecast by Region, 2024-2034 (US$ Million, AGR%, CAGR%): “U” Shaped Recovery
Table 4 Neuromodulation Devices Market Forecast by Region, 2024-2034 (US$ Million, AGR%, CAGR%): “W” Shaped Recovery
Table 5 Neuromodulation Devices Market Forecast by Region, 2024-2034 (US$ Million, AGR%, CAGR%): “L” Shaped Recovery
Table 6 Neuromodulation Devices Market Forecast by Product, 2024-2034 (US$ Million, AGR%, CAGR %)
Table 7 Deep Brain Stimulator Market Forecast by Region, 2024-2034 (US$ Million, AGR%, CAGR %)
Table 8 Gastric Electric Stimulator Market Forecast by Region, 2024-2034 (US$ Million, AGR%, CAGR %)
Table 9 Spinal Cord Stimulator Market Forecast by Region, 2024-2034 (US$ Million, AGR%, CAGR%)
Table 10 Sacral Nerve Stimulator Market Forecast by Region, 2024-2034 (US$ Million, AGR%, CAGR%)
Table 11 Vagus Nerve Stimulator Market Forecast by Region, 2024-2034 (US$ Million, AGR%, CAGR%)
Table 12 Transcutaneous Electrical Nerve Stimulator Market Forecast by Region, 2024-2034 (US$ Million, AGR%, CAGR%)
Table 13 Others Market Forecast by Region, 2024-2034 (US$ Million, AGR%, CAGR%)
Table 14 Neuromodulation Devices Market Application, 2024-2034 (US$ Million, AGR%, CAGR%)
Table 15 Pain Management Market Forecast by Region, 2024-2034 (US$ Million, AGR%, CAGR%)
Table 16 Epilepsy Market Forecast by Region, 2024-2034 (US$ Million, AGR%, CAGR%)
Table 17 Essential Tremor Market Forecast by Region, 2024-2034 (US$ Million, AGR%, CAGR%)
Table 18 Urinary and Fecal Incontinence Market Forecast by Region, 2024-2034 (US$ Million, AGR%, CAGR%)
Table 19 Depression Market Forecast by Region, 2024-2034 (US$ Million, AGR%, CAGR%)
Table 20 Dystonia Market Forecast by Region, 2024-2034 (US$ Million, AGR%, CAGR%)
Table 21 Gastroparesis Market Forecast by Region, 2024-2034 (US$ Million, AGR%, CAGR%)
Table 22 Parkinson’s Disease Market Forecast by Region, 2024-2034 (US$ Million, AGR%, CAGR%)
Table 23 Others Market Forecast by Region, 2024-2034 (US$ Million, AGR%, CAGR%)
Table 24 Neuromodulation Devices Market Forecast by Region, 2024-2034 (US$ Million, AGR%, CAGR%)
Table 25 North America Neuromodulation Devices Market Forecast by Country, 2024-2034 (US$ Million, AGR%, CAGR %)
Table 26 North America Neuromodulation Devices Market Forecast by Product, 2024-2034 (US$ Million, AGR%, CAGR %)
Table 27 North America Neuromodulation Devices Market Application, 2024-2034 (US$ Million, AGR%, CAGR%)
Table 28 U.S. Neuromodulation Devices Market Forecast, 2024-2034 (US$ Million, AGR%, CAGR%)
Table 29 Canada Neuromodulation Devices Market Forecast, 2024-2034 (US$ Million, AGR%, CAGR %)
Table 30 Europe Neuromodulation Devices Market Forecast by Country, 2024-2034 (US$ Million, AGR%, CAGR%)
Table 31 Europe Neuromodulation Devices Market Forecast by Product, 2024-2034 (US$ Million, AGR%, CAGR %)
Table 32 Europe Neuromodulation Devices Market Application, 2024-2034 (US$ Million, AGR%, CAGR%)
Table 33 Germany Neuromodulation Devices Market Forecast, 2024-2034 (US$ Million, AGR%, CAGR %)
Table 34 France Neuromodulation Devices Market Forecast, 2024-2034 (US$ Million, AGR%, CAGR %)
Table 35 UK Neuromodulation Devices Market Forecast, 2024-2034 (US$ Million, AGR%, CAGR%)
Table 36 Italy Neuromodulation Devices Market Forecast, 2024-2034 (US$ Million, AGR%, CAGR %)
Table 37 Spain Neuromodulation Devices Market Forecast, 2024-2034 (US$ Million, AGR%, CAGR%)
Table 38 Russia Neuromodulation Devices Market Forecast, 2024-2034 (US$ Million, AGR%, CAGR%)
Table 39 Rest of Europe Neuromodulation Devices Market Forecast, 2024-2034 (US$ Million, AGR%, CAGR%)
Table 40 Asia Pacific Neuromodulation Devices Market Forecast by Country, 2024-2034 (US$ Million, AGR%, CAGR%)
Table 41 Asia Pacific Neuromodulation Devices Market Forecast by Product, 2024-2034 (US$ Million, AGR%, CAGR %)
Table 42 Asia Pacific Neuromodulation Devices Market Application, 2024-2034 (US$ Million, AGR%, CAGR%)
Table 43 Japan Neuromodulation Devices Market Forecast, 2024-2034 (US$ Million, AGR%, CAGR%)
Table 44 China Neuromodulation Devices Market Forecast, 2024-2034 (US$ Million, AGR%, CAGR%)
Table 45 India Neuromodulation Devices Market Forecast, 2024-2034 (US$ Million, AGR%, CAGR %)
Table 46 Australia Neuromodulation Devices Market Forecast, 2024-2034 (US$ Million, AGR%, CAGR %)
Table 47 South Korea Neuromodulation Devices Market Forecast, 2024-2034 (US$ Million, AGR%, CAGR%)
Table 48 Rest of Asia Pacific Neuromodulation Devices Market Forecast, 2024-2034 (US$ Million, AGR%, CAGR %)
Table 49 Latin America Neuromodulation Devices Market Forecast by Country, 2024-2034 (US$ Million, AGR%, CAGR%)
Table 50 Latin America Neuromodulation Devices Market Forecast by Product, 2024-2034 (US$ Million, AGR%, CAGR %)
Table 51 Latin America Neuromodulation Devices Market Application, 2024-2034 (US$ Million, AGR%, CAGR%)
Table 52 Brazil Neuromodulation Devices Market Forecast, 2024-2034 (US$ Million, AGR%, CAGR %)
Table 53 Mexico Neuromodulation Devices Market Forecast, 2024-2034 (US$ Million, AGR%, CAGR%)
Table 54 Rest of Latin America Neuromodulation Devices Market Forecast, 2024-2034 (US$ Million, AGR%, CAGR%)
Table 55 MEA Neuromodulation Devices Market Forecast by Country, 2024-2034 (US$ Million, AGR%, CAGR%)
Table 56 MEA Neuromodulation Devices Market Forecast by Product, 2024-2034 (US$ Million, AGR%, CAGR %)
Table 57 MEA Neuromodulation Devices Market Application, 2024-2034 (US$ Million, AGR%, CAGR%)
Table 58 GCC Neuromodulation Devices Market Forecast, 2024-2034 (US$ Million, AGR%, CAGR%)
Table 59 South Africa Neuromodulation Devices Market Forecast, 2024-2034 (US$ Million, AGR%, CAGR%)
Table 60 Rest of MEA Neuromodulation Devices Market Forecast, 2024-2034 (US$ Million, AGR%, CAGR %)
Table 61 Strategic Outlook
Table 62 Abbott: Key Details, (CEO, HQ, Revenue, Founded, No. of Employees, Company Type, Website, Business Segment)
Table 63 Abbott: Product Benchmarking
Table 64 Abbott.: Strategic Outlook
Table 65 Boston Scientific Corporation: Key Details, (CEO, HQ, Revenue, Founded, No. of Employees, Company Type, Website, Business Segment)
Table 66 Boston Scientific Corporation, Inc.: Product Benchmarking
Table 67 Boston Scientific Corporation, Inc.: Strategic Outlook
Table 68 electroCore, Inc.: Key Details, (CEO, HQ, Revenue, Founded, No. of Employees, Company Type, Website, Business Segment)
Table 69 electroCore, Inc.: Product Benchmarking
Table 70 electroCore, Inc.: Strategic Outlook
Table 71 Helbling Holding AG: Key Details, (CEO, HQ, Revenue, Founded, No. of Employees, Company Type, Website, Business Segment)
Table 72 Helbling Holding AG: Product Benchmarking
Table 73 Helbling Holding AG: Strategic Outlook
Table 74 Innovative Health Solutions: Key Details, (CEO, HQ, Revenue, Founded, No. of Employees, Company Type, Website, Business Segment)
Table 75 Innovative Health Solutions: Product Benchmarking
Table 76 LivaNova PLC: Key Details, (CEO, HQ, Revenue, Founded, No. of Employees, Company Type, Website, Business Segment)
Table 77 LivaNova PLC: Product Benchmarking
Table 78 LivaNova PLC: Strategic Outlook
Table 79 Medtronic: Key Details, (CEO, HQ, Revenue, Founded, No. of Employees, Company Type, Website, Business Segment)
Table 80 Medtronic: Product Benchmarking
Table 81 Medtronic: Strategic Outlook
Table 82 MicroTransponder Inc.: Key Details, (CEO, HQ, Revenue, Founded, No. of Employees, Company Type, Website, Business Segment)
Table 83 MicroTransponder Inc.: Product Benchmarking
Table 84 MicroTransponder Inc..: Strategic Outlook
Table 85 Neuronetics Inc.: Key Details, (CEO, HQ, Revenue, Founded, No. of Employees, Company Type, Website, Business Segment)
Table 86 Neuronetics Inc.: Product Benchmarking
Table 87 Neuronetics Inc.: Strategic Outlook
Table 88 Parasym: Key Details, (CEO, HQ, Revenue, Founded, No. of Employees, Company Type, Website, Business Segment)
Table 89 Parasym: Product Benchmarking
Table 90 Parasym: Strategic Outlook
Table 91 Synapse Biomedical Inc.: Key Details, (CEO, HQ, Revenue, Founded, No. of Employees, Company Type, Website, Business Segment)
Table 92 Synapse Biomedical Inc.: Product Benchmarking
Table 93 Synapse Biomedical Inc.: Strategic Outlook
Table 94 tVNS Technologies GmbH.: Key Details, (CEO, HQ, Revenue, Founded, No. of Employees, Company Type, Website, Business Segment)
Table 95 tVNS Technologies GmbH.: Product Benchmarking
Table 96 tVNS Technologies GmbH.: Strategic Outlook
図の一覧
Figure 1 Neuromodulation Devices Market Segmentation
Figure 2 Neuromodulation Devices Market by Product: Market Attractiveness Index
Figure 3 Neuromodulation Devices Market by Application: Market Attractiveness Index
Figure 4 Neuromodulation Devices Market Attractiveness Index by Region
Figure 5 Neuromodulation Devices Market: Market Dynamics
Figure 6 Neuromodulation Devices Market by Region, 2024-2034 (US$ Million, AGR %): “V” Shaped Recovery
Figure 7 Neuromodulation Devices Market by Region, 2024-2034 (US$ Million, AGR %): “U” Shaped Recovery
Figure 8 Neuromodulation Devices Market by Region, 2024-2034 (US$ Million, AGR %): “W” Shaped Recovery
Figure 9 Neuromodulation Devices Market by Region, 2024-2034 (US$ Million, AGR %): “L” Shaped Recovery
Figure 10 Neuromodulation Devices Market: Porter’s Five Forces Analysis
Figure 11 Neuromodulation Devices Market: PEST Analysis
Figure 12 Neuromodulation Devices Market by Product: Market Attractiveness Index
Figure 13 Neuromodulation Devices Market Forecast by Product, 2024-2034 (US$ Million, AGR %)
Figure 14 Neuromodulation Devices Market Share Forecast by Product, 2024, 2029, 2034 (%)
Figure 15 Deep Brain Stimulator Market Forecast by Region, 2024-2034 (US$ Million, AGR %)
Figure 16 Deep Brain Stimulator Market Share Forecast by Region, 2024 & 2034 (%)
Figure 17 Gastric Electric Stimulator Market Forecast by Region, 2024-2034 (US$ Million, AGR %)
Figure 18 Gastric Electric Stimulator Market Share Forecast by Region, 2024 & 2034 (%)
Figure 19 Spinal Cord Stimulator Market Forecast by Region, 2024-2034 (US$ Million, AGR %)
Figure 20 Spinal Cord Stimulator Market Share Forecast by Region, 2024 & 2034 (%)
Figure 21 Sacral Nerve Stimulator Market Forecast by Region, 2024-2034 (US$ Million, AGR %)
Figure 22 Sacral Nerve Stimulator Market Share Forecast by Region, 2024 & 2034 (%)
Figure 23 Vagus Nerve Stimulator Market Forecast by Region, 2024-2034 (US$ Million, AGR %)
Figure 24 Vagus Nerve Stimulator Market Share Forecast by Region, 2024 & 2034 (%)
Figure 25 Transcutaneous Electrical Nerve Stimulator Market Forecast by Region, 2024-2034 (US$ Million, AGR %)
Figure 26 Transcutaneous Electrical Nerve Stimulator Market Share Forecast by Region, 2024 & 2034 (%)
Figure 27 Others Market Forecast by Region, 2024-2034 (US$ Million, AGR %)
Figure 28 Others Market Share Forecast by Region, 2024 & 2034 (%)
Figure 29 Neuromodulation Devices Market by Application: Market Attractiveness Index
Figure 30 Neuromodulation Devices Market Forecast by Application, 2024-2034 (US$ Million, AGR %)
Figure 31 Neuromodulation Devices Market Share Forecast by Application, 2024, 2029, 2034 (%)
Figure 32 Pain Management Segment Market Forecast by Region, 2024-2034 (US$ Million, AGR %)
Figure 33 Pain Management Segment Market Share Forecast by Region, 2024 & 2034 (%)
Figure 34 Epilepsy Market Forecast by Region, 2024-2034 (US$ Million, AGR %)
Figure 35 Epilepsy Market Share Forecast by Region, 2024 & 2034 (%)
Figure 36 Essential Tremor Market Forecast by Region, 2024-2034 (US$ Million, AGR %)
Figure 37 Essential Tremor Market Share Forecast by Region, 2024 & 2034 (%)
Figure 38 Urinary and Fecal Incontinence Market Forecast by Region, 2024-2034 (US$ Million, AGR %)
Figure 39 Urinary and Fecal Incontinence Market Share Forecast by Region, 2024 & 2034 (%)
Figure 40 Depression Market Forecast by Region, 2024-2034 (US$ Million, AGR %)
Figure 41 Depression Market Share Forecast by Region, 2024 & 2034 (%)
Figure 42 Dystonia Market Forecast by Region, 2024-2034 (US$ Million, AGR %)
Figure 43 Dystonia Market Share Forecast by Region, 2024 & 2034 (%)
Figure 44 Gastroparesis Market Forecast by Region, 2024-2034 (US$ Million, AGR %)
Figure 45 Gastroparesis Market Share Forecast by Region, 2024 & 2034 (%)
Figure 46 Parkinson’s Disease Market Forecast by Region, 2024-2034 (US$ Million, AGR %)
Figure 47 Parkinson’s Disease Market Share Forecast by Region, 2024 & 2034 (%)
Figure 48 Others Market Forecast by Region, 2024-2034 (US$ Million, AGR %)
Figure 49 Others Market Share Forecast by Region, 2024 & 2034 (%)
Figure 50 Neuromodulation Devices Market Forecast by Region 2024 and 2034 (Revenue, CAGR %)
Figure 51 Neuromodulation Devices Market Share Forecast by Region 2024, 2029, 2034 (%)
Figure 52 Neuromodulation Devices Market by Region, 2024-2034 (US$ Million, AGR %)
Figure 53 North America Neuromodulation Devices Market Attractiveness Index
Figure 54 North America Neuromodulation Devices Market by Region, 2024, 2029 & 2034 (US$ Million)
Figure 55 North America Neuromodulation Devices Market Forecast by Country, 2024-2034 (US$ Million, AGR %)
Figure 56 North America Neuromodulation Devices Market Share Forecast by Country, 2024 & 2034 (%)
Figure 57 North America Neuromodulation Devices Market Forecast by Product, 2024-2034 (US$ Million, AGR %)
Figure 58 North America Neuromodulation Devices Market Share Forecast by Product, 2024 & 2034 (%)
Figure 59 North America Neuromodulation Devices Market Forecast by Application, 2024-2034 (US$ Million, AGR %)
Figure 60 North America Neuromodulation Devices Market Share Forecast by Application, 2024 & 2034 (%)
Figure 61 U.S. Neuromodulation Devices Market Forecast, 2024-2034 (US$ Million, AGR %)
Figure 62 Canada Neuromodulation Devices Market Forecast, 2024-2034 (US$ Million, AGR %)
Figure 63 Europe Neuromodulation Devices Market Attractiveness Index
Figure 64 Europe Neuromodulation Devices Market by Region, 2024, 2029 & 2034 (US$ Million)
Figure 65 Europe Neuromodulation Devices Market Forecast by Country, 2024-2034 (US$ Million, AGR %)
Figure 66 Europe Neuromodulation Devices Market Share Forecast by Country, 2024 & 2034 (%)
Figure 67 Europe Neuromodulation Devices Market Forecast by Product, 2024-2034 (US$ Million, AGR %)
Figure 68 Europe Neuromodulation Devices Market Share Forecast by Product, 2024 & 2034 (%)
Figure 69 Europe Neuromodulation Devices Market Forecast by Application, 2024-2034 (US$ Million, AGR %)
Figure 70 Europe Neuromodulation Devices Market Share Forecast by Application, 2024 & 2034 (%)
Figure 71 Germany Neuromodulation Devices Market Forecast, 2024-2034 (US$ Million, AGR %)
Figure 72 France Neuromodulation Devices Market Forecast, 2024-2034 (US$ Million, AGR %)
Figure 73 UK Neuromodulation Devices Market Forecast, 2024-2034 (US$ Million, AGR %)
Figure 74 Italy Neuromodulation Devices Market Forecast, 2024-2034 (US$ Million, AGR %)
Figure 75 Spain Neuromodulation Devices Market Forecast, 2024-2034 (US$ Million, AGR %)
Figure 76 Russia Neuromodulation Devices Market Forecast, 2024-2034 (US$ Million, AGR %)
Figure 77 Rest of Europe Neuromodulation Devices Market Forecast, 2024-2034 (US$ Million, AGR %)
Figure 78 Asia Pacific Neuromodulation Devices Market Attractiveness Index
Figure 79 Asia Pacific Neuromodulation Devices Market by Region, 2024, 2029 & 2034 (US$ Million)
Figure 80 Asia Pacific Neuromodulation Devices Market Forecast by Country, 2024-2034 (US$ Million, AGR %)
Figure 81 Asia Pacific Neuromodulation Devices Market Share Forecast by Country, 2024 & 2034 (%)
Figure 82 Asia Pacific Neuromodulation Devices Market Forecast by Product, 2024-2034 (US$ Million, AGR %)
Figure 83 Asia Pacific Neuromodulation Devices Market Share Forecast by Product, 2024 & 2034 (%)
Figure 84 Asia Pacific Neuromodulation Devices Market Forecast by Application, 2024-2034 (US$ Million, AGR %)
Figure 85 Asia Pacific Neuromodulation Devices Market Share Forecast by Application, 2024 & 2034 (%)
Figure 86 Japan Neuromodulation Devices Market Forecast, 2024-2034 (US$ Million, AGR %)
Figure 87 China Neuromodulation Devices Market Forecast, 2024-2034 (US$ Million, AGR %)
Figure 88 India Neuromodulation Devices Market Forecast, 2024-2034 (US$ Million, AGR %)
Figure 89 Australia Neuromodulation Devices Market Forecast, 2024-2034 (US$ Million, AGR %)
Figure 90 South Korea Neuromodulation Devices Market Forecast, 2024-2034 (US$ Million, AGR %)
Figure 91 Rest of Asia Pacific Neuromodulation Devices Market Forecast, 2024-2034 (US$ Million, AGR %)
Figure 92 Latin America Neuromodulation Devices Market Attractiveness Index
Figure 93 Latin America Neuromodulation Devices Market by Region, 2024, 2029 & 2034 (US$ Million)
Figure 94 Latin America Neuromodulation Devices Market Forecast by Country, 2024-2034 (US$ Million, AGR %)
Figure 95 Latin America Neuromodulation Devices Market Share Forecast by Country, 2024 & 2034 (%)
Figure 96 Latin America Neuromodulation Devices Market Forecast by Product, 2024-2034 (US$ Million, AGR %)
Figure 97 Latin America Neuromodulation Devices Market Share Forecast by Product, 2024 & 2034 (%)
Figure 98 Latin America Neuromodulation Devices Market Forecast by Application, 2024-2034 (US$ Million, AGR %)
Figure 99 Latin America Neuromodulation Devices Market Share Forecast by Application, 2024 & 2034 (%)
Figure 100 Brazil Neuromodulation Devices Market Forecast, 2024-2034 (US$ Million, AGR %)
Figure 101 Mexico Neuromodulation Devices Market Forecast, 2024-2034 (US$ Million, AGR %)
Figure 102 Rest of Latin America Neuromodulation Devices Market Forecast, 2024-2034 (US$ Million, AGR %)
Figure 103 MEA Neuromodulation Devices Market Attractiveness Index
Figure 104 MEA Neuromodulation Devices Market by Region, 2024, 2029 & 2034 (US$ Million)
Figure 105 MEA Neuromodulation Devices Market Forecast by Country, 2024-2034 (US$ Million, AGR %)
Figure 106 MEA Neuromodulation Devices Market Share Forecast by Country, 2024 & 2034 (%)
Figure 107 MEA Neuromodulation Devices Market Forecast by Product, 2024-2034 (US$ Million, AGR %)
Figure 108 MEA Neuromodulation Devices Market Share Forecast by Product, 2024 & 2034 (%)
Figure 109 MEA Neuromodulation Devices Market Forecast by Application, 2024-2034 (US$ Million, AGR %)
Figure 110 MEA Neuromodulation Devices Market Share Forecast by Application, 2024 & 2034 (%)
Figure 111 GCC Neuromodulation Devices Market Forecast, 2024-2034 (US$ Million, AGR %)
Figure 112 South Africa Neuromodulation Devices Market Forecast, 2024-2034 (US$ Million, AGR %)
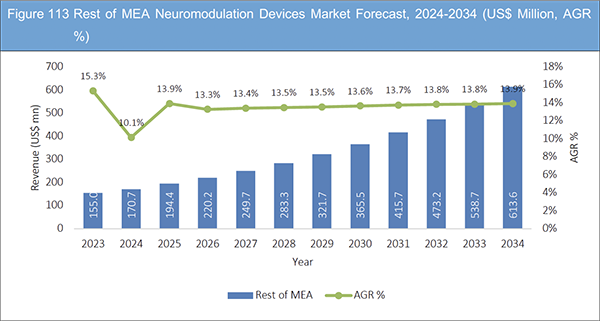
Figure 113 Rest of MEA Neuromodulation Devices Market Forecast, 2024-2034 (US$ Million, AGR %)
Figure 114 Neuromodulation Devices Market: Company Share, 2022
Figure 115 Abbott: Net Revenue, 2017-2022 (US$ million, AGR%)
Figure 116 Abbott: R&D, 2017-2022 (US$ million, AGR%)
Figure 117 Abbott: Regional Market Shares, 2022
Figure 118 Boston Scientific Corporation.: Net Revenue, 2017-2022 (US$ million, AGR%)
Figure 119 Boston Scientific Corporation, Inc.: R&D, 2017-2022 (US$ million, AGR%)
Figure 120 Boston Scientific Corporation, Inc.: Regional Market Shares, 2022
Figure 121 electroCore, Inc.: Net Revenue, 2017-2022 (US$ Million, AGR%)
Figure 122 electroCore, Inc.: R&D, 2017-2022 (US$ Million, AGR%)
Figure 123 electroCore, Inc.: Regional Market Shares, 2022
Figure 124 Helbling Holding AG: Net Revenue, 2017-2022 (US$ Million, AGR%)
Figure 125 LivaNova PLC: Net Revenue, 2017-2022 (US$ Million, AGR%)
Figure 126 LivaNova PLC: R&D, 2017-2022 (US$ Million, AGR%)
Figure 127 LivaNova PLC: Regional Market Shares, 2022
Figure 128 Medtronic: Net Revenue, 2017-2022 (US$ Million, AGR%)
Figure 129 Medtronic: R&D, 2017-2022 (US$ Million, AGR%)
Figure 130 Medtronic: Regional Market Shares, 2022
Figure 131 Neuronetics, Inc: Net Revenue, 2017-2022 (US$ Million, AGR%)
Figure 132 Neuronetics, Inc: R&D, 2017-2022 (US$ Million, AGR%)
Figure 133 Neuronetics, Inc: Regional Market Shares, 2022
ページTOPに戻る
Summary
Report Details
The Neuromodulation devices market Report 2024-2034: This report will prove invaluable to leading firms striving for new revenue pockets if they wish to better understand the industry and its underlying dynamics. It will be useful for companies that would like to expand into different industries or to expand their existing operations in a new region.
Surging Demand for Deep Brain Stimulation (DBS) in Neuromodulation
The demand for deep brain stimulation (DBS) in neuromodulation has experienced a notable surge, driven by factors such as expanded applications, technological advancements, positive clinical outcomes, progress in neurological research, and increased awareness among patients and healthcare providers. This surge reflects the growing acceptance of DBS as an effective therapeutic intervention for various neurological disorders. Ongoing developments in the field of neuromodulation continue to contribute to the increased demand for DBS, showcasing its potential to address diverse medical conditions and improve patient outcomes.
Complications Associated with Usage of Neuromodulation Devices
The use of neuromodulation devices, while offering therapeutic benefits, is not without potential complications. Complications associated with these devices can include infection at the implantation site, hardware malfunctions, lead migration or breakage, and adverse reactions to electrical stimulation. Additionally, patients may experience side effects such as tingling, pain, or muscle contractions. Proper patient selection, precise surgical placement, and ongoing monitoring are crucial to minimizing risks. Despite the efficacy of neuromodulation, the potential for complications underscores the importance of careful patient evaluation, thorough preoperative planning, and vigilant postoperative management to ensure the safe and effective use of these devices in managing various neurological conditions.
What Questions Should You Ask before Buying a Market Research Report?
-
How is the Neuromodulation devices market evolving?
-
What is driving and restraining the neuromodulation devices market?
-
How will each neuromodulation devices submarket segment grow over the forecast period and how much revenue will these submarkets account for in 2034?
-
How will the market shares for each Neuromodulation devices submarket develop from 2024 to 2034?
-
What will be the main driver for the overall market from 2024 to 2034?
-
Will leading neuromodulation devices markets broadly follow the macroeconomic dynamics, or will individual national markets outperform others?
-
How will the market shares of the national markets change by 2034 and which geographical region will lead the market in 2034?
-
Who are the leading players and what are their prospects over the forecast period?
-
What are the neuromodulation devices projects for these leading companies?
-
How will the industry evolve during the period between 2024 and 2034? What are the implications of neuromodulation devices projects taking place now and over the next 10 years?
-
Is there a greater need for product commercialisation to further scale the neuromodulation devices market?
-
Where is the neuromodulation devices market heading and how can you ensure you are at the forefront of the market?
-
What are the best investment options for new product and service lines?
-
What are the key prospects for moving companies into a new growth path and C-suite?
You need to discover how this will impact the Neuromodulation devices market today, and over the next 10 years:
-
Our 251-page report provides 96 tables and 133 charts/graphs exclusively to you.
-
The report highlights key lucrative areas in the industry so you can target them – NOW.
-
It contains in-depth analysis of global, regional and national sales and growth.
-
It highlights for you the key successful trends, changes and revenue projections made by your competitors.
This report tells you TODAY how the Neuromodulation devices market will develop in the next 10 years, and in line with the variations in COVID-19 economic recession and bounce. This market is more critical now than at any point over the last 10 years.
Forecasts to 2034 and other analyses reveal commercial prospects
-
In addition to revenue forecasting to 2034, our new study provides you with recent results, growth rates, and market shares.
-
You will find original analyses, with business outlooks and developments.
-
Discover qualitative analyses (including market dynamics, drivers, opportunities, restraints and challenges), cost structure, impact of rising Neuromodulation devices prices and recent developments.
This report includes data analysis and invaluable insight into how COVID-19 will affect the industry and your company. Four COVID-19 recovery patterns and their impact, namely, “V”, “L”, “W” and “U” are discussed in this report.
Segments Covered in the Report
By Product
-
Deep Brain Stimulator
-
Gastric Electric Stimulator
-
Spinal Cord Stimulator
-
Sacral Nerve Stimulator
-
Vagus Nerve Stimulator
-
Transcutaneous Electrical Nerve Stimulator
-
Others
By Application
-
Pain Management
-
Epilepsy
-
Essential Tremor
-
Urinary and Fecal Incontinence
-
Depression
-
Dystonia
-
Gastroparesis
-
Parkinson’s Disease
-
Others
In addition to the revenue predictions for the overall world market and segments, you will also find revenue forecasts for five regional and 21 leading national markets
North America
Europe
-
Germany
-
UK
-
France
-
Spain
-
Italy
-
Russia
-
Rest of Europe
Asia Pacific
-
China
-
Japan
-
India
-
Australia
-
South Korea
-
Rest of Asia Pacific
Latin America
-
Brazil
-
Mexico
-
Rest of Latin America
MEA
-
GCC
-
South Africa
-
Rest of MEA
The report also includes profiles and for some of the leading companies in the Neuromodulation devices market, 2024 to 2034, with a focus on this segment of these companies’ operations.
Leading companies profiled in the report
-
Abbott
-
Boston Scientific Corporation
-
electroCore, Inc.
-
Helbling Holding AG
-
Innovative Health Solutions
-
LivaNova PLC
-
Medtronic
-
MicroTransponder Inc.
-
Neuronetics Inc.
-
Parasym
-
Synapse Biomedical Inc.
-
tVNS Technologies GmbH
Overall world revenue for Neuromodulation devices market, 2024 to 2034 in terms of value the market will surpass US$10.0 billion in 2024, our work calculates. We predict strong revenue growth through to 2034. Our work identifies which organizations hold the greatest potential. Discover their capabilities, progress, and commercial prospects, helping you stay ahead.
How will the Neuromodulation devices market, 2024 to 2034 report help you?
In summary, our 250+ page report provides you with the following knowledge:
-
Revenue forecasts to 2034 for Neuromodulation devices market, 2024 to 2034 Market, with forecasts for product, application and route of administration, each forecast at a global and regional level – discover the industry’s prospects, finding the most lucrative places for investments and revenues.
-
Revenue forecasts to 2034 for five regional and 21 key national markets – See forecasts for the Neuromodulation devices market, 2024 to 2034 market in North America, Europe, Asia-Pacific, Latin America, and MEA. Also forecasted is the market in the US, Canada, Mexico, Brazil, Germany, France, UK, Italy, China, India, Japan, and Australia among other prominent economies.
-
Prospects for established firms and those seeking to enter the market – including company profiles for 12 of the major companies involved in the Neuromodulation devices market, 2024 to 2034.
Find quantitative and qualitative analyses with independent predictions. Receive information that only our report contains, staying informed with invaluable business intelligence.
Information found nowhere else
With our new report, you are less likely to fall behind in knowledge or miss out on opportunities. See how our work could benefit your research, analyses, and decisions. Visiongain’s study is for everybody needing commercial analyses for the Neuromodulation devices market 2024 to 2034, market-leading companies. You will find data, trends and predictions.
ページTOPに戻る
Table of Contents
Table of Contents
1 Report Overview
1.1 Objectives of the Study
1.2 Introduction to Neuromodulation Devices Market
1.3 What This Report Delivers
1.4 Why You Should Read This Report
1.5 Key Questions Answered by This Analytical Report
1.6 Who is This Report for?
1.7 Methodology
1.7.1 Market Definitions
1.7.2 Market Evaluation & Forecasting Methodology
1.7.3 Data Validation
1.7.3.1 Primary Research
1.7.3.2 Secondary Research
1.8 Frequently Asked Questions (FAQs)
1.9 Associated Visiongain Reports
1.10 About Visiongain
2 Executive Summary
3 Market Overview
3.1 Key Findings
3.2 Market Dynamics
3.2.1 Market Driving Factors
3.2.1.1 Growing Demand for Deep Brain Stimulator Neuromodulation Devices in Pharmaceutical and Biotechnology Industry
3.2.1.2 Rising Prevalence of Neurological Disorders and Nerve Injuries
3.2.1.3 Growing Preference Among Patients for Non-invasive Treatments
3.2.1.4 Expanded Therapeutic Applications of Neuromodulation Devices
3.2.1.5 Technological Advancements in Neuromodulation Devices
3.2.2 Market Restraining Factors
3.2.2.1 Complications Associated with Usage of Neuromodulation Devices
3.2.2.2 High Cost of Neuromodulation Devices
3.2.2.3 Stringent Regulatory Framework and a Thorough Approval Process
3.2.2.4 Preference for Drug Therapies over Neuromodulation Products
3.2.2.5 Product Recalls in the Neuromodulation Devices
3.2.2.6 Lack of Skilled Healthcare Practitioners
3.2.3 Market Opportunities
3.2.3.1 Rising Demand for Minimally Invasive Surgeries in Developed Countries
3.2.3.2 Increasing Number of Elderly Patients with Neurological Disorders
3.3 COVID-19 Impact Analysis
3.4 Porter’s Five Forces Analysis
3.4.1 Bargaining Power of Suppliers
3.4.2 Bargaining Power of Buyers
3.4.3 Competitive Rivalry
3.4.4 Threat from Substitutes
3.4.5 Threat of New Entrants
3.5 PEST Analysis
4 Neuromodulation Devices Market Analysis by Product
4.1 Key Findings
4.2 Product Segment: Market Attractiveness Index
4.3 Neuromodulation Devices Market Size Estimation and Forecast by Product
4.4 Deep Brain Stimulator
4.4.1 Market Size by Region, 2024-2034 (US$ Million)
4.4.2 Market Share by Region, 2024 & 2034 (%)
4.5 Gastric Electric Stimulator
4.5.1 Market Size by Region, 2024-2034 (US$ Million)
4.5.2 Market Share by Region, 2024 & 2034 (%)
4.6 Spinal Cord Stimulator
4.6.1 Market Size by Region, 2024-2034 (US$ Million)
4.6.2 Market Share by Region, 2024 & 2034 (%)
4.7 Sacral Nerve Stimulator
4.7.1 Market Size by Region, 2024-2034 (US$ Million)
4.7.2 Market Share by Region, 2024 & 2034 (%)
4.8 Vagus Nerve Stimulator
4.8.1 Market Size by Region, 2024-2034 (US$ Million)
4.8.2 Market Share by Region, 2024 & 2034 (%)
4.9 Transcutaneous Electrical Nerve Stimulator
4.9.1 Market Size by Region, 2024-2034 (US$ Million)
4.9.2 Market Share by Region, 2024 & 2034 (%)
4.10 Others
4.10.1 Market Size by Region, 2024-2034 (US$ Million)
4.10.2 Market Share by Region, 2024 & 2034 (%)
5 Neuromodulation Devices Market Analysis by Application
5.1 Key Findings
5.2 Application Segment: Market Attractiveness Index
5.3 Neuromodulation Devices Market Size Estimation and Forecast by Application
5.4 Pain Management
5.4.1 Market Size by Region, 2024-2034 (US$ Million)
5.4.2 Market Share by Region, 2024 & 2034 (%)
5.5 Epilepsy
5.5.1 Market Size by Region, 2024-2034 (US$ Million)
5.5.2 Market Share by Region, 2024 & 2034 (%)
5.6 Essential Tremor
5.6.1 Market Size by Region, 2024-2034 (US$ Million)
5.6.2 Market Share by Region, 2024 & 2034 (%)
5.7 Urinary and Fecal Incontinence
5.7.1 Market Size by Region, 2024-2034 (US$ Million)
5.7.2 Market Share by Region, 2024 & 2034 (%)
5.8 Depression
5.8.1 Market Size by Region, 2024-2034 (US$ Million)
5.8.2 Market Share by Region, 2024 & 2034 (%)
5.9 Dystonia
5.9.1 Market Size by Region, 2024-2034 (US$ Million)
5.9.2 Market Share by Region, 2024 & 2034 (%)
5.10 Gastroparesis
5.10.1 Market Size by Region, 2024-2034 (US$ Million)
5.10.2 Market Share by Region, 2024 & 2034 (%)
5.11 Parkinson’s Disease
5.11.1 Market Size by Region, 2024-2034 (US$ Million)
5.11.2 Market Share by Region, 2024 & 2034 (%)
5.12 Others
5.12.1 Market Size by Region, 2024-2034 (US$ Million)
5.12.2 Market Share by Region, 2024 & 2034 (%)
6 Neuromodulation Devices Market Analysis by Region
6.1 Key Findings
6.2 Regional Market Size Estimation and Forecast
7 North America Neuromodulation Devices Market Analysis
7.1 Key Findings
7.2 North America Neuromodulation Devices Market Attractiveness Index
7.3 North America Neuromodulation Devices Market by Country, 2024, 2029 & 2034 (US$ Million)
7.4 North America Neuromodulation Devices Market Size Estimation and Forecast by Country
7.5 North America Neuromodulation Devices Market Size Estimation and Forecast by Product
7.6 North America Neuromodulation Devices Market Size Estimation and Forecast by Application
7.7 U.S. Neuromodulation Devices Market Analysis
7.8 Canada Neuromodulation Devices Market Analysis
8 Europe Neuromodulation Devices Market Analysis
8.1 Key Findings
8.2 Europe Neuromodulation Devices Market Attractiveness Index
8.3 Europe Neuromodulation Devices Market by Country, 2024, 2029 & 2034 (US$ Million)
8.4 Europe Neuromodulation Devices Market Size Estimation and Forecast by Country
8.5 Europe Neuromodulation Devices Market Size Estimation and Forecast by Product
8.6 Europe Neuromodulation Devices Market Size Estimation and Forecast by Application
8.7 Germany Neuromodulation Devices Market Analysis
8.8 France Neuromodulation Devices Market Analysis
8.9 UK Neuromodulation Devices Market Analysis
8.10 Italy Neuromodulation Devices Market Analysis
8.11 Spain Neuromodulation Devices Market Analysis
8.12 Russia Neuromodulation Devices Market Analysis
8.13 Rest of Europe Neuromodulation Devices Market Analysis
9 Asia Pacific Neuromodulation Devices Market Analysis
9.1 Key Findings
9.2 Asia Pacific Neuromodulation Devices Market Attractiveness Index
9.3 Asia Pacific Neuromodulation Devices Market by Country, 2024, 2029 & 2034 (US$ Million)
9.4 Asia Pacific Neuromodulation Devices Market Size Estimation and Forecast by Country
9.5 Asia Pacific Neuromodulation Devices Market Size Estimation and Forecast by Product
9.6 Asia Pacific Neuromodulation Devices Market Size Estimation and Forecast by Application
9.7 Japan Neuromodulation Devices Market Analysis
9.8 China Neuromodulation Devices Market Analysis
9.9 India Neuromodulation Devices Market Analysis
9.10 Australia Neuromodulation Devices Market Analysis
9.11 South Korea Neuromodulation Devices Market Analysis
9.12 Rest of Asia Pacific Neuromodulation Devices Market Analysis
10 Latin America Neuromodulation Devices Market Analysis
10.1 Key Findings
10.2 Latin America Neuromodulation Devices Market Attractiveness Index
10.3 Latin America Neuromodulation Devices Market by Country, 2024, 2029 & 2034 (US$ Million)
10.4 Latin America Neuromodulation Devices Market Size Estimation and Forecast by Country
10.5 Latin America Neuromodulation Devices Market Size Estimation and Forecast by Product
10.6 Latin America Neuromodulation Devices Market Size Estimation and Forecast by Application
10.7 Brazil Neuromodulation Devices Market Analysis
10.8 Mexico Neuromodulation Devices Market Analysis
10.9 Rest of Latin America Neuromodulation Devices Market Analysis
11 MEA Neuromodulation Devices Market Analysis
11.1 Key Findings
11.2 MEA Neuromodulation Devices Market Attractiveness Index
11.3 MEA Neuromodulation Devices Market by Country, 2024, 2029 & 2034 (US$ Million)
11.4 MEA Neuromodulation Devices Market Size Estimation and Forecast by Country
11.5 MEA Neuromodulation Devices Market Size Estimation and Forecast by Product
11.6 MEA Neuromodulation Devices Market Size Estimation and Forecast by Application
11.7 GCC Neuromodulation Devices Market Analysis
11.8 South Africa Neuromodulation Devices Market Analysis
11.9 Rest of MEA Neuromodulation Devices Market Analysis
12 Company Profiles
12.1 Competitive Landscape, 2022
12.2 Strategic Outlook
12.3 Abbott
12.3.1 Company Snapshot
12.3.2 Company Overview
12.3.3 Financial Analysis
12.3.3.1 Net Revenue, 2017-2022
12.3.3.2 R&D, 2017-2022
12.3.3.3 Regional Market Shares, 2022
12.3.4 Product Benchmarking
12.3.5 Strategic Outlook
12.4 Boston Scientific Corporation
12.4.1 Company Snapshot
12.4.2 Company Overview
12.4.3 Financial Analysis
12.4.3.1 Net Revenue, 2017-2022
12.4.3.2 R&D, 2017-2022
12.4.3.3 Regional Market Shares, 2022
12.4.4 Product Benchmarking
12.4.5 Strategic Outlook
12.5 electroCore, Inc.
12.5.1 Company Snapshot
12.5.2 Company Overview
12.5.3 Financial Analysis
12.5.3.1 Net Revenue, 2017-2022
12.5.3.2 R&D, 2017-2022
12.5.3.3 Regional Market Shares, 2022
12.5.4 Product Benchmarking
12.5.5 Strategic Outlook
12.6 Helbling Holding AG
12.6.1 Company Snapshot
12.6.2 Company Overview
12.6.3 Financial Analysis
12.6.3.1 Net Revenue, 2017-2022
12.6.4 Product Benchmarking
12.6.5 Strategic Outlook
12.7 Innovative Health Solutions
12.7.1 Company Snapshot
12.7.2 Company Overview
12.7.3 Product Benchmarking
12.8 LivaNova PLC
12.8.1 Company Snapshot
12.8.2 Company Overview
12.8.3 Financial Analysis
12.8.3.1 Net Revenue, 2017-2022
12.8.3.2 R&D, 2017-2022
12.8.3.3 Regional Market Shares, 2022
12.8.4 Product Benchmarking
12.8.5 Strategic Outlook
12.9 Medtronic
12.9.1 Company Snapshot
12.9.2 Company Overview
12.9.3 Financial Analysis
12.9.3.1 Net Revenue, 2017-2022
12.9.3.2 R&D, 2017-2022
12.9.3.3 Regional Market Shares, 2022
12.9.4 Product Benchmarking
12.9.5 Strategic Outlook
12.10 MicroTransponder Inc.
12.10.1 Company Snapshot
12.10.2 Company Overview
12.10.3 Product Benchmarking
12.10.4 Strategic Outlook
12.11 Neuronetics Inc.
12.11.1 Company Snapshot
12.11.2 Company Overview
12.11.3 Financial Analysis
12.11.3.1 Net Revenue, 2017-2022
12.11.3.2 R&D, 2017-2022
12.11.3.3 Regional Market Shares, 2022
12.11.4 Product Benchmarking
12.11.5 Strategic Outlook
12.12 Parasym
12.12.1 Company Snapshot
12.12.2 Company Overview
12.12.3 Product Benchmarking
12.12.4 Strategic Outlook
12.13 Synapse Biomedical Inc
12.13.1 Company Snapshot
12.13.2 Company Overview
12.13.3 Product Benchmarking
12.13.4 Strategic Outlook
12.14 tVNS Technologies GmbH
12.14.1 Company Snapshot
12.14.2 Company Overview
12.14.3 Product Benchmarking
12.14.4 Strategic Outlook
13 Conclusion and Recommendations
13.1 Concluding Remarks from Visiongain
13.2 Recommendations for Market Players
ページTOPに戻る
List of Tables/Graphs
List of Tables
Table 1 Neuromodulation Devices Market Snapshot, 2024 & 2034 (US$ Million, CAGR %)
Table 2 Neuromodulation Devices Market Forecast by Region, 2024-2034 (US$ Million, AGR%, CAGR%): “V” Shaped Recovery
Table 3 Neuromodulation Devices Market Forecast by Region, 2024-2034 (US$ Million, AGR%, CAGR%): “U” Shaped Recovery
Table 4 Neuromodulation Devices Market Forecast by Region, 2024-2034 (US$ Million, AGR%, CAGR%): “W” Shaped Recovery
Table 5 Neuromodulation Devices Market Forecast by Region, 2024-2034 (US$ Million, AGR%, CAGR%): “L” Shaped Recovery
Table 6 Neuromodulation Devices Market Forecast by Product, 2024-2034 (US$ Million, AGR%, CAGR %)
Table 7 Deep Brain Stimulator Market Forecast by Region, 2024-2034 (US$ Million, AGR%, CAGR %)
Table 8 Gastric Electric Stimulator Market Forecast by Region, 2024-2034 (US$ Million, AGR%, CAGR %)
Table 9 Spinal Cord Stimulator Market Forecast by Region, 2024-2034 (US$ Million, AGR%, CAGR%)
Table 10 Sacral Nerve Stimulator Market Forecast by Region, 2024-2034 (US$ Million, AGR%, CAGR%)
Table 11 Vagus Nerve Stimulator Market Forecast by Region, 2024-2034 (US$ Million, AGR%, CAGR%)
Table 12 Transcutaneous Electrical Nerve Stimulator Market Forecast by Region, 2024-2034 (US$ Million, AGR%, CAGR%)
Table 13 Others Market Forecast by Region, 2024-2034 (US$ Million, AGR%, CAGR%)
Table 14 Neuromodulation Devices Market Application, 2024-2034 (US$ Million, AGR%, CAGR%)
Table 15 Pain Management Market Forecast by Region, 2024-2034 (US$ Million, AGR%, CAGR%)
Table 16 Epilepsy Market Forecast by Region, 2024-2034 (US$ Million, AGR%, CAGR%)
Table 17 Essential Tremor Market Forecast by Region, 2024-2034 (US$ Million, AGR%, CAGR%)
Table 18 Urinary and Fecal Incontinence Market Forecast by Region, 2024-2034 (US$ Million, AGR%, CAGR%)
Table 19 Depression Market Forecast by Region, 2024-2034 (US$ Million, AGR%, CAGR%)
Table 20 Dystonia Market Forecast by Region, 2024-2034 (US$ Million, AGR%, CAGR%)
Table 21 Gastroparesis Market Forecast by Region, 2024-2034 (US$ Million, AGR%, CAGR%)
Table 22 Parkinson’s Disease Market Forecast by Region, 2024-2034 (US$ Million, AGR%, CAGR%)
Table 23 Others Market Forecast by Region, 2024-2034 (US$ Million, AGR%, CAGR%)
Table 24 Neuromodulation Devices Market Forecast by Region, 2024-2034 (US$ Million, AGR%, CAGR%)
Table 25 North America Neuromodulation Devices Market Forecast by Country, 2024-2034 (US$ Million, AGR%, CAGR %)
Table 26 North America Neuromodulation Devices Market Forecast by Product, 2024-2034 (US$ Million, AGR%, CAGR %)
Table 27 North America Neuromodulation Devices Market Application, 2024-2034 (US$ Million, AGR%, CAGR%)
Table 28 U.S. Neuromodulation Devices Market Forecast, 2024-2034 (US$ Million, AGR%, CAGR%)
Table 29 Canada Neuromodulation Devices Market Forecast, 2024-2034 (US$ Million, AGR%, CAGR %)
Table 30 Europe Neuromodulation Devices Market Forecast by Country, 2024-2034 (US$ Million, AGR%, CAGR%)
Table 31 Europe Neuromodulation Devices Market Forecast by Product, 2024-2034 (US$ Million, AGR%, CAGR %)
Table 32 Europe Neuromodulation Devices Market Application, 2024-2034 (US$ Million, AGR%, CAGR%)
Table 33 Germany Neuromodulation Devices Market Forecast, 2024-2034 (US$ Million, AGR%, CAGR %)
Table 34 France Neuromodulation Devices Market Forecast, 2024-2034 (US$ Million, AGR%, CAGR %)
Table 35 UK Neuromodulation Devices Market Forecast, 2024-2034 (US$ Million, AGR%, CAGR%)
Table 36 Italy Neuromodulation Devices Market Forecast, 2024-2034 (US$ Million, AGR%, CAGR %)
Table 37 Spain Neuromodulation Devices Market Forecast, 2024-2034 (US$ Million, AGR%, CAGR%)
Table 38 Russia Neuromodulation Devices Market Forecast, 2024-2034 (US$ Million, AGR%, CAGR%)
Table 39 Rest of Europe Neuromodulation Devices Market Forecast, 2024-2034 (US$ Million, AGR%, CAGR%)
Table 40 Asia Pacific Neuromodulation Devices Market Forecast by Country, 2024-2034 (US$ Million, AGR%, CAGR%)
Table 41 Asia Pacific Neuromodulation Devices Market Forecast by Product, 2024-2034 (US$ Million, AGR%, CAGR %)
Table 42 Asia Pacific Neuromodulation Devices Market Application, 2024-2034 (US$ Million, AGR%, CAGR%)
Table 43 Japan Neuromodulation Devices Market Forecast, 2024-2034 (US$ Million, AGR%, CAGR%)
Table 44 China Neuromodulation Devices Market Forecast, 2024-2034 (US$ Million, AGR%, CAGR%)
Table 45 India Neuromodulation Devices Market Forecast, 2024-2034 (US$ Million, AGR%, CAGR %)
Table 46 Australia Neuromodulation Devices Market Forecast, 2024-2034 (US$ Million, AGR%, CAGR %)
Table 47 South Korea Neuromodulation Devices Market Forecast, 2024-2034 (US$ Million, AGR%, CAGR%)
Table 48 Rest of Asia Pacific Neuromodulation Devices Market Forecast, 2024-2034 (US$ Million, AGR%, CAGR %)
Table 49 Latin America Neuromodulation Devices Market Forecast by Country, 2024-2034 (US$ Million, AGR%, CAGR%)
Table 50 Latin America Neuromodulation Devices Market Forecast by Product, 2024-2034 (US$ Million, AGR%, CAGR %)
Table 51 Latin America Neuromodulation Devices Market Application, 2024-2034 (US$ Million, AGR%, CAGR%)
Table 52 Brazil Neuromodulation Devices Market Forecast, 2024-2034 (US$ Million, AGR%, CAGR %)
Table 53 Mexico Neuromodulation Devices Market Forecast, 2024-2034 (US$ Million, AGR%, CAGR%)
Table 54 Rest of Latin America Neuromodulation Devices Market Forecast, 2024-2034 (US$ Million, AGR%, CAGR%)
Table 55 MEA Neuromodulation Devices Market Forecast by Country, 2024-2034 (US$ Million, AGR%, CAGR%)
Table 56 MEA Neuromodulation Devices Market Forecast by Product, 2024-2034 (US$ Million, AGR%, CAGR %)
Table 57 MEA Neuromodulation Devices Market Application, 2024-2034 (US$ Million, AGR%, CAGR%)
Table 58 GCC Neuromodulation Devices Market Forecast, 2024-2034 (US$ Million, AGR%, CAGR%)
Table 59 South Africa Neuromodulation Devices Market Forecast, 2024-2034 (US$ Million, AGR%, CAGR%)
Table 60 Rest of MEA Neuromodulation Devices Market Forecast, 2024-2034 (US$ Million, AGR%, CAGR %)
Table 61 Strategic Outlook
Table 62 Abbott: Key Details, (CEO, HQ, Revenue, Founded, No. of Employees, Company Type, Website, Business Segment)
Table 63 Abbott: Product Benchmarking
Table 64 Abbott.: Strategic Outlook
Table 65 Boston Scientific Corporation: Key Details, (CEO, HQ, Revenue, Founded, No. of Employees, Company Type, Website, Business Segment)
Table 66 Boston Scientific Corporation, Inc.: Product Benchmarking
Table 67 Boston Scientific Corporation, Inc.: Strategic Outlook
Table 68 electroCore, Inc.: Key Details, (CEO, HQ, Revenue, Founded, No. of Employees, Company Type, Website, Business Segment)
Table 69 electroCore, Inc.: Product Benchmarking
Table 70 electroCore, Inc.: Strategic Outlook
Table 71 Helbling Holding AG: Key Details, (CEO, HQ, Revenue, Founded, No. of Employees, Company Type, Website, Business Segment)
Table 72 Helbling Holding AG: Product Benchmarking
Table 73 Helbling Holding AG: Strategic Outlook
Table 74 Innovative Health Solutions: Key Details, (CEO, HQ, Revenue, Founded, No. of Employees, Company Type, Website, Business Segment)
Table 75 Innovative Health Solutions: Product Benchmarking
Table 76 LivaNova PLC: Key Details, (CEO, HQ, Revenue, Founded, No. of Employees, Company Type, Website, Business Segment)
Table 77 LivaNova PLC: Product Benchmarking
Table 78 LivaNova PLC: Strategic Outlook
Table 79 Medtronic: Key Details, (CEO, HQ, Revenue, Founded, No. of Employees, Company Type, Website, Business Segment)
Table 80 Medtronic: Product Benchmarking
Table 81 Medtronic: Strategic Outlook
Table 82 MicroTransponder Inc.: Key Details, (CEO, HQ, Revenue, Founded, No. of Employees, Company Type, Website, Business Segment)
Table 83 MicroTransponder Inc.: Product Benchmarking
Table 84 MicroTransponder Inc..: Strategic Outlook
Table 85 Neuronetics Inc.: Key Details, (CEO, HQ, Revenue, Founded, No. of Employees, Company Type, Website, Business Segment)
Table 86 Neuronetics Inc.: Product Benchmarking
Table 87 Neuronetics Inc.: Strategic Outlook
Table 88 Parasym: Key Details, (CEO, HQ, Revenue, Founded, No. of Employees, Company Type, Website, Business Segment)
Table 89 Parasym: Product Benchmarking
Table 90 Parasym: Strategic Outlook
Table 91 Synapse Biomedical Inc.: Key Details, (CEO, HQ, Revenue, Founded, No. of Employees, Company Type, Website, Business Segment)
Table 92 Synapse Biomedical Inc.: Product Benchmarking
Table 93 Synapse Biomedical Inc.: Strategic Outlook
Table 94 tVNS Technologies GmbH.: Key Details, (CEO, HQ, Revenue, Founded, No. of Employees, Company Type, Website, Business Segment)
Table 95 tVNS Technologies GmbH.: Product Benchmarking
Table 96 tVNS Technologies GmbH.: Strategic Outlook
List of Figures
Figure 1 Neuromodulation Devices Market Segmentation
Figure 2 Neuromodulation Devices Market by Product: Market Attractiveness Index
Figure 3 Neuromodulation Devices Market by Application: Market Attractiveness Index
Figure 4 Neuromodulation Devices Market Attractiveness Index by Region
Figure 5 Neuromodulation Devices Market: Market Dynamics
Figure 6 Neuromodulation Devices Market by Region, 2024-2034 (US$ Million, AGR %): “V” Shaped Recovery
Figure 7 Neuromodulation Devices Market by Region, 2024-2034 (US$ Million, AGR %): “U” Shaped Recovery
Figure 8 Neuromodulation Devices Market by Region, 2024-2034 (US$ Million, AGR %): “W” Shaped Recovery
Figure 9 Neuromodulation Devices Market by Region, 2024-2034 (US$ Million, AGR %): “L” Shaped Recovery
Figure 10 Neuromodulation Devices Market: Porter’s Five Forces Analysis
Figure 11 Neuromodulation Devices Market: PEST Analysis
Figure 12 Neuromodulation Devices Market by Product: Market Attractiveness Index
Figure 13 Neuromodulation Devices Market Forecast by Product, 2024-2034 (US$ Million, AGR %)
Figure 14 Neuromodulation Devices Market Share Forecast by Product, 2024, 2029, 2034 (%)
Figure 15 Deep Brain Stimulator Market Forecast by Region, 2024-2034 (US$ Million, AGR %)
Figure 16 Deep Brain Stimulator Market Share Forecast by Region, 2024 & 2034 (%)
Figure 17 Gastric Electric Stimulator Market Forecast by Region, 2024-2034 (US$ Million, AGR %)
Figure 18 Gastric Electric Stimulator Market Share Forecast by Region, 2024 & 2034 (%)
Figure 19 Spinal Cord Stimulator Market Forecast by Region, 2024-2034 (US$ Million, AGR %)
Figure 20 Spinal Cord Stimulator Market Share Forecast by Region, 2024 & 2034 (%)
Figure 21 Sacral Nerve Stimulator Market Forecast by Region, 2024-2034 (US$ Million, AGR %)
Figure 22 Sacral Nerve Stimulator Market Share Forecast by Region, 2024 & 2034 (%)
Figure 23 Vagus Nerve Stimulator Market Forecast by Region, 2024-2034 (US$ Million, AGR %)
Figure 24 Vagus Nerve Stimulator Market Share Forecast by Region, 2024 & 2034 (%)
Figure 25 Transcutaneous Electrical Nerve Stimulator Market Forecast by Region, 2024-2034 (US$ Million, AGR %)
Figure 26 Transcutaneous Electrical Nerve Stimulator Market Share Forecast by Region, 2024 & 2034 (%)
Figure 27 Others Market Forecast by Region, 2024-2034 (US$ Million, AGR %)
Figure 28 Others Market Share Forecast by Region, 2024 & 2034 (%)
Figure 29 Neuromodulation Devices Market by Application: Market Attractiveness Index
Figure 30 Neuromodulation Devices Market Forecast by Application, 2024-2034 (US$ Million, AGR %)
Figure 31 Neuromodulation Devices Market Share Forecast by Application, 2024, 2029, 2034 (%)
Figure 32 Pain Management Segment Market Forecast by Region, 2024-2034 (US$ Million, AGR %)
Figure 33 Pain Management Segment Market Share Forecast by Region, 2024 & 2034 (%)
Figure 34 Epilepsy Market Forecast by Region, 2024-2034 (US$ Million, AGR %)
Figure 35 Epilepsy Market Share Forecast by Region, 2024 & 2034 (%)
Figure 36 Essential Tremor Market Forecast by Region, 2024-2034 (US$ Million, AGR %)
Figure 37 Essential Tremor Market Share Forecast by Region, 2024 & 2034 (%)
Figure 38 Urinary and Fecal Incontinence Market Forecast by Region, 2024-2034 (US$ Million, AGR %)
Figure 39 Urinary and Fecal Incontinence Market Share Forecast by Region, 2024 & 2034 (%)
Figure 40 Depression Market Forecast by Region, 2024-2034 (US$ Million, AGR %)
Figure 41 Depression Market Share Forecast by Region, 2024 & 2034 (%)
Figure 42 Dystonia Market Forecast by Region, 2024-2034 (US$ Million, AGR %)
Figure 43 Dystonia Market Share Forecast by Region, 2024 & 2034 (%)
Figure 44 Gastroparesis Market Forecast by Region, 2024-2034 (US$ Million, AGR %)
Figure 45 Gastroparesis Market Share Forecast by Region, 2024 & 2034 (%)
Figure 46 Parkinson’s Disease Market Forecast by Region, 2024-2034 (US$ Million, AGR %)
Figure 47 Parkinson’s Disease Market Share Forecast by Region, 2024 & 2034 (%)
Figure 48 Others Market Forecast by Region, 2024-2034 (US$ Million, AGR %)
Figure 49 Others Market Share Forecast by Region, 2024 & 2034 (%)
Figure 50 Neuromodulation Devices Market Forecast by Region 2024 and 2034 (Revenue, CAGR %)
Figure 51 Neuromodulation Devices Market Share Forecast by Region 2024, 2029, 2034 (%)
Figure 52 Neuromodulation Devices Market by Region, 2024-2034 (US$ Million, AGR %)
Figure 53 North America Neuromodulation Devices Market Attractiveness Index
Figure 54 North America Neuromodulation Devices Market by Region, 2024, 2029 & 2034 (US$ Million)
Figure 55 North America Neuromodulation Devices Market Forecast by Country, 2024-2034 (US$ Million, AGR %)
Figure 56 North America Neuromodulation Devices Market Share Forecast by Country, 2024 & 2034 (%)
Figure 57 North America Neuromodulation Devices Market Forecast by Product, 2024-2034 (US$ Million, AGR %)
Figure 58 North America Neuromodulation Devices Market Share Forecast by Product, 2024 & 2034 (%)
Figure 59 North America Neuromodulation Devices Market Forecast by Application, 2024-2034 (US$ Million, AGR %)
Figure 60 North America Neuromodulation Devices Market Share Forecast by Application, 2024 & 2034 (%)
Figure 61 U.S. Neuromodulation Devices Market Forecast, 2024-2034 (US$ Million, AGR %)
Figure 62 Canada Neuromodulation Devices Market Forecast, 2024-2034 (US$ Million, AGR %)
Figure 63 Europe Neuromodulation Devices Market Attractiveness Index
Figure 64 Europe Neuromodulation Devices Market by Region, 2024, 2029 & 2034 (US$ Million)
Figure 65 Europe Neuromodulation Devices Market Forecast by Country, 2024-2034 (US$ Million, AGR %)
Figure 66 Europe Neuromodulation Devices Market Share Forecast by Country, 2024 & 2034 (%)
Figure 67 Europe Neuromodulation Devices Market Forecast by Product, 2024-2034 (US$ Million, AGR %)
Figure 68 Europe Neuromodulation Devices Market Share Forecast by Product, 2024 & 2034 (%)
Figure 69 Europe Neuromodulation Devices Market Forecast by Application, 2024-2034 (US$ Million, AGR %)
Figure 70 Europe Neuromodulation Devices Market Share Forecast by Application, 2024 & 2034 (%)
Figure 71 Germany Neuromodulation Devices Market Forecast, 2024-2034 (US$ Million, AGR %)
Figure 72 France Neuromodulation Devices Market Forecast, 2024-2034 (US$ Million, AGR %)
Figure 73 UK Neuromodulation Devices Market Forecast, 2024-2034 (US$ Million, AGR %)
Figure 74 Italy Neuromodulation Devices Market Forecast, 2024-2034 (US$ Million, AGR %)
Figure 75 Spain Neuromodulation Devices Market Forecast, 2024-2034 (US$ Million, AGR %)
Figure 76 Russia Neuromodulation Devices Market Forecast, 2024-2034 (US$ Million, AGR %)
Figure 77 Rest of Europe Neuromodulation Devices Market Forecast, 2024-2034 (US$ Million, AGR %)
Figure 78 Asia Pacific Neuromodulation Devices Market Attractiveness Index
Figure 79 Asia Pacific Neuromodulation Devices Market by Region, 2024, 2029 & 2034 (US$ Million)
Figure 80 Asia Pacific Neuromodulation Devices Market Forecast by Country, 2024-2034 (US$ Million, AGR %)
Figure 81 Asia Pacific Neuromodulation Devices Market Share Forecast by Country, 2024 & 2034 (%)
Figure 82 Asia Pacific Neuromodulation Devices Market Forecast by Product, 2024-2034 (US$ Million, AGR %)
Figure 83 Asia Pacific Neuromodulation Devices Market Share Forecast by Product, 2024 & 2034 (%)
Figure 84 Asia Pacific Neuromodulation Devices Market Forecast by Application, 2024-2034 (US$ Million, AGR %)
Figure 85 Asia Pacific Neuromodulation Devices Market Share Forecast by Application, 2024 & 2034 (%)
Figure 86 Japan Neuromodulation Devices Market Forecast, 2024-2034 (US$ Million, AGR %)
Figure 87 China Neuromodulation Devices Market Forecast, 2024-2034 (US$ Million, AGR %)
Figure 88 India Neuromodulation Devices Market Forecast, 2024-2034 (US$ Million, AGR %)
Figure 89 Australia Neuromodulation Devices Market Forecast, 2024-2034 (US$ Million, AGR %)
Figure 90 South Korea Neuromodulation Devices Market Forecast, 2024-2034 (US$ Million, AGR %)
Figure 91 Rest of Asia Pacific Neuromodulation Devices Market Forecast, 2024-2034 (US$ Million, AGR %)
Figure 92 Latin America Neuromodulation Devices Market Attractiveness Index
Figure 93 Latin America Neuromodulation Devices Market by Region, 2024, 2029 & 2034 (US$ Million)
Figure 94 Latin America Neuromodulation Devices Market Forecast by Country, 2024-2034 (US$ Million, AGR %)
Figure 95 Latin America Neuromodulation Devices Market Share Forecast by Country, 2024 & 2034 (%)
Figure 96 Latin America Neuromodulation Devices Market Forecast by Product, 2024-2034 (US$ Million, AGR %)
Figure 97 Latin America Neuromodulation Devices Market Share Forecast by Product, 2024 & 2034 (%)
Figure 98 Latin America Neuromodulation Devices Market Forecast by Application, 2024-2034 (US$ Million, AGR %)
Figure 99 Latin America Neuromodulation Devices Market Share Forecast by Application, 2024 & 2034 (%)
Figure 100 Brazil Neuromodulation Devices Market Forecast, 2024-2034 (US$ Million, AGR %)
Figure 101 Mexico Neuromodulation Devices Market Forecast, 2024-2034 (US$ Million, AGR %)
Figure 102 Rest of Latin America Neuromodulation Devices Market Forecast, 2024-2034 (US$ Million, AGR %)
Figure 103 MEA Neuromodulation Devices Market Attractiveness Index
Figure 104 MEA Neuromodulation Devices Market by Region, 2024, 2029 & 2034 (US$ Million)
Figure 105 MEA Neuromodulation Devices Market Forecast by Country, 2024-2034 (US$ Million, AGR %)
Figure 106 MEA Neuromodulation Devices Market Share Forecast by Country, 2024 & 2034 (%)
Figure 107 MEA Neuromodulation Devices Market Forecast by Product, 2024-2034 (US$ Million, AGR %)
Figure 108 MEA Neuromodulation Devices Market Share Forecast by Product, 2024 & 2034 (%)
Figure 109 MEA Neuromodulation Devices Market Forecast by Application, 2024-2034 (US$ Million, AGR %)
Figure 110 MEA Neuromodulation Devices Market Share Forecast by Application, 2024 & 2034 (%)
Figure 111 GCC Neuromodulation Devices Market Forecast, 2024-2034 (US$ Million, AGR %)
Figure 112 South Africa Neuromodulation Devices Market Forecast, 2024-2034 (US$ Million, AGR %)
Figure 113 Rest of MEA Neuromodulation Devices Market Forecast, 2024-2034 (US$ Million, AGR %)
Figure 114 Neuromodulation Devices Market: Company Share, 2022
Figure 115 Abbott: Net Revenue, 2017-2022 (US$ million, AGR%)
Figure 116 Abbott: R&D, 2017-2022 (US$ million, AGR%)
Figure 117 Abbott: Regional Market Shares, 2022
Figure 118 Boston Scientific Corporation.: Net Revenue, 2017-2022 (US$ million, AGR%)
Figure 119 Boston Scientific Corporation, Inc.: R&D, 2017-2022 (US$ million, AGR%)
Figure 120 Boston Scientific Corporation, Inc.: Regional Market Shares, 2022
Figure 121 electroCore, Inc.: Net Revenue, 2017-2022 (US$ Million, AGR%)
Figure 122 electroCore, Inc.: R&D, 2017-2022 (US$ Million, AGR%)
Figure 123 electroCore, Inc.: Regional Market Shares, 2022
Figure 124 Helbling Holding AG: Net Revenue, 2017-2022 (US$ Million, AGR%)
Figure 125 LivaNova PLC: Net Revenue, 2017-2022 (US$ Million, AGR%)
Figure 126 LivaNova PLC: R&D, 2017-2022 (US$ Million, AGR%)
Figure 127 LivaNova PLC: Regional Market Shares, 2022
Figure 128 Medtronic: Net Revenue, 2017-2022 (US$ Million, AGR%)
Figure 129 Medtronic: R&D, 2017-2022 (US$ Million, AGR%)
Figure 130 Medtronic: Regional Market Shares, 2022
Figure 131 Neuronetics, Inc: Net Revenue, 2017-2022 (US$ Million, AGR%)
Figure 132 Neuronetics, Inc: R&D, 2017-2022 (US$ Million, AGR%)
Figure 133 Neuronetics, Inc: Regional Market Shares, 2022
ページTOPに戻る
本レポートと同じKEY WORD()の最新刊レポート
- 本レポートと同じKEY WORDの最新刊レポートはありません。
よくあるご質問
Visiongain社はどのような調査会社ですか?
英国の調査会社ヴィジョンゲイン社(Visiongain)は、通信とエネルギーのほか、自動車や化学・医薬品、金属など、広範な市場を対象に調査を行っています。自動車市場については、市場全般に関する調査のほ... もっと見る
調査レポートの納品までの日数はどの程度ですか?
在庫のあるものは速納となりますが、平均的には 3-4日と見て下さい。
但し、一部の調査レポートでは、発注を受けた段階で内容更新をして納品をする場合もあります。
発注をする前のお問合せをお願いします。
注文の手続きはどのようになっていますか?
1)お客様からの御問い合わせをいただきます。
2)見積書やサンプルの提示をいたします。
3)お客様指定、もしくは弊社の発注書をメール添付にて発送してください。
4)データリソース社からレポート発行元の調査会社へ納品手配します。
5) 調査会社からお客様へ納品されます。最近は、pdfにてのメール納品が大半です。
お支払方法の方法はどのようになっていますか?
納品と同時にデータリソース社よりお客様へ請求書(必要に応じて納品書も)を発送いたします。
お客様よりデータリソース社へ(通常は円払い)の御振り込みをお願いします。
請求書は、納品日の日付で発行しますので、翌月最終営業日までの当社指定口座への振込みをお願いします。振込み手数料は御社負担にてお願いします。
お客様の御支払い条件が60日以上の場合は御相談ください。
尚、初めてのお取引先や個人の場合、前払いをお願いすることもあります。ご了承のほど、お願いします。
データリソース社はどのような会社ですか?
当社は、世界各国の主要調査会社・レポート出版社と提携し、世界各国の市場調査レポートや技術動向レポートなどを日本国内の企業・公官庁及び教育研究機関に提供しております。
世界各国の「市場・技術・法規制などの」実情を調査・収集される時には、データリソース社にご相談ください。
お客様の御要望にあったデータや情報を抽出する為のレポート紹介や調査のアドバイスも致します。
|
|


