次世代エネルギー貯蔵技術(EST)市場レポート:2024-2034
Next Generation Energy Storage Technologies (EST) Market Report 2024-2034
レポート詳細
次世代エネルギー貯蔵技術(EST)市場レポート 2024-2034年 :本レポートは、業界とその基礎となる原動力をよりよく理解したいと望むなら、新たな収益ポケットを目指す大手企業にとって... もっと見る
※上記価格は部署ライセンス(Departmental licence)価格です。
その他の価格についてはデータリソースまでお問合せください。
日本語のページは自動翻訳を利用し作成しています。
実際のレポートは英文のみでご納品いたします。

|

|
サマリー
レポート詳細
次世代エネルギー貯蔵技術(EST)市場レポート 2024-2034年:本レポートは、業界とその基礎となる原動力をよりよく理解したいと望むなら、新たな収益ポケットを目指す大手企業にとって貴重なものとなるでしょう。異業種への進出や新規地域での既存事業の拡大を目指す企業にも有用です。
次世代エネルギー貯蔵技術(EST)市場は、世界のエネルギー情勢における変革的シフトの最前線にある
次世代エネルギー貯蔵技術(EST)市場は、持続可能で効率的なエネルギー貯蔵ソリューションに対する需要の高まりに後押しされ、世界のエネルギー情勢における変革的シフトの最前線にある。この市場には、断続的な再生可能エネルギー源がもたらす課題に対処し、さまざまなセクターでエネルギー利用を最適化することを目的とした、先進バッテリー、水素貯蔵、新しい機械式貯蔵システムなど、多様な革新的技術が含まれている。
同市場は、いくつかの主要な推進要因によって支えられている。まず、太陽光や風力などの再生可能エネルギー源の電力網への統合が進んでいるため、エネルギー供給の変動を管理する高度なエネルギー貯蔵ソリューションが必要とされている。さらに、環境の持続可能性に対する意識の高まりと、二酸化炭素排出量を削減する緊急の必要性が、よりクリーンで効率的なエネルギー貯蔵技術の採用を支持する投資と政策を後押ししている。輸送の電化、特に電気自動車(EV)の急速な普及は、高性能エネルギー貯蔵ソリューションの需要をさらに加速させている。
電池エネルギー貯蔵システムに関連するリスクが市場成長を妨げる
エネルギー貯蔵市場の成長は様々な阻害要因によって妨げられているが、その顕著なものがバッテリーエネルギー貯蔵システム(BESS)に関連するリスクである。これらのシステムの複雑な性質は、市場拡大を妨げる可能性のある課題を投げかけている。主な懸念事項のひとつはバッテリー故障の可能性で、環境要因、最適でない構造、電気的乱用、物理的損傷、温度問題など、さまざまな理由で発生する可能性がある。システムが故障した場合の影響は、バッテリーの爆発から発火、有毒ガスの発生まで多岐にわたるため、強固な予防策とセキュリティ・プロトコルの必要性が極めて重要であることが浮き彫りになっている。
市場調査レポートを購入する前にすべき質問とは?
-
次世代エネルギー貯蔵技術(EST)市場はどのように進化しているのか?
-
次世代エネルギー貯蔵技術(EST)市場の推進要因と抑制要因は何か?
-
次世代エネルギー貯蔵技術(EST)の各サブマーケットセグメントは予測期間中にどのように成長し、これらのサブマーケットが2034年にどれくらいの収益を占めるのか?
-
2024年から2034年にかけて、各次世代エネルギー貯蔵技術(EST)サブマーケットの市場シェアはどのように推移するのか?
-
2024年から2034年までの市場全体の主な牽引役は何か?
-
主要な次世代エネルギー貯蔵技術(EST)市場はマクロ経済の動きに大枠で追随するのか、それとも個々の国市場が他を凌駕するのか。
-
2034年までに各国市場のシェアはどのように変化し、2034年にはどの地域が市場をリードするのか?
-
主要プレーヤーは誰で、予測期間中の見通しは?
-
これら大手企業の次世代エネルギー貯蔵技術(EST)プロジェクトとは?
-
2024年から2034年の間に、業界はどのように進化するのか?現在および今後10年間に行われる次世代エネルギー貯蔵技術(EST)プロジェクトが意味するものは何か?
-
次世代エネルギー貯蔵技術(EST)市場をさらに拡大するために、製品の商業化の必要性は高まっているか?
-
次世代エネルギー貯蔵技術(EST)市場はどこに向かい、どのようにすれば市場の最前線に立てるのか?
-
新製品やサービスラインへの最適な投資方法とは?
-
企業を新たな成長軌道に乗せ、C-suiteに移行させるための重要な展望とは?
次世代エネルギー貯蔵技術(EST)市場に現在、そして今後10年間、どのような影響を与えるかを知る必要がある:
-
421ページにわたる本レポートは、130の表と210の図表で構成されています。
-
本レポートでは、業界の主要な有利分野をハイライトしているため、今すぐターゲットを絞ることができます。
-
世界、地域、国の売上と成長に関する詳細な分析が含まれています。
-
競合他社が成功した主なトレンド、変化、収益予測をハイライトしています。
本レポートは、次世代エネルギー貯蔵技術(EST)市場が今後10年間にどのように発展するか、またCOVID-19の景気後退と好転の変動に合わせて、今に伝えます。この市場は、過去10年間のどの時点よりも今が重要である。
2034年までの予測およびその他の分析により商業的展望が明らかに
-
2034年までの収益予測に加え、最新の業績、成長率、市場シェアを提供します。
-
ビジネスの展望と展開に関する独自の分析をご覧いただけます。
-
定性的分析(市場力学、促進要因、機会、阻害要因、課題を含む)、コスト構造、次世代エネルギー貯蔵技術(EST)価格上昇の影響、最近の動向をご覧いただけます。
本レポートには、COVID-19が業界と貴社にどのような影響を与えるかについてのデータ分析と貴重な洞察が含まれています。COVID-19の4つの回収パターンとその影響、すなわち「V」、「L」、「W」、「U」について本レポートでは論じている。
レポート対象セグメント
水素別市場セグメント
機械別市場セグメント
-
揚水発電
-
圧縮空気エネルギー貯蔵(CAES)
-
フライホイール式エネルギー貯蔵
電池タイプ別市場セグメント
-
リチウムイオン電池
-
ナトリウム硫黄電池
-
フロー電池
-
先進鉛蓄電池
用途別市場セグメント
-
電気自動車(EV)
-
住宅用エネルギー貯蔵
-
商業・産業用(C&I)
-
ユーティリティ・スケール蓄電
-
その他の用途
技術タイプ別市場セグメント
-
バッテリーエネルギー貯蔵
-
機械式エネルギー貯蔵
-
熱エネルギー貯蔵
-
水素エネルギー貯蔵
-
先進キャパシタ
-
その他の技術タイプ
世界市場全体とセグメント別の収益予測に加え、4つの地域と20の主要国市場の収益予測も掲載しています:
北米
欧州
-
ドイツ
-
スペイン
-
イギリス
-
フランス
-
イタリア
-
その他の欧州
アジア太平洋
-
中国
-
日本
-
インド
-
オーストラリア
-
韓国
-
その他のアジア太平洋地域
ラテンアメリカ
中東・アフリカ
本レポートでは、次世代エネルギー貯蔵技術(EST)市場(2024年~2034年)の主要企業のプロファイルも掲載しており、これらの企業の事業のこのセグメントに焦点を当てている。
主要企業のプロファイル
-
AES Energy Storage, LLC
-
Alevo Group S.A.
-
BYD Co. Ltd
-
Fluence Energy
-
General Electric Company
-
Greensmith Energy Management Systems
-
Hitachi Chemical Co., Ltd.
-
Leclanché S.A.
-
LG Chem Ltd.
-
Maxwell Technologies Inc
-
NEC Corporation
-
Panasonic Holdings Corporation
-
Saft Groupe SAS
-
Samsung SDI Co. Ltd.
-
Siemens AG
2024年から2034年までの次世代エネルギー貯蔵技術(EST)市場における世界全体の売上高は、金額ベースで2024年に222億米ドルを突破する。2034年まで収益は力強く成長すると予測する。当研究所では、最も大きな可能性を秘めた組織を特定しています。彼らの能力、進歩、商業的展望を発見し、あなたが一歩先を行くのを支援します。
次世代エネルギー貯蔵技術(EST)市場、2024〜2034年レポートはどのようにお役に立つでしょうか?
要約すると、420ページを超える当レポートは以下の知識を提供します:
-
次世代エネルギー貯蔵技術(EST)市場、2024年から2034年までの収益予測 水素、機械、電池タイプ、用途、技術タイプ別に、世界レベルと地域レベルで予測 - 業界の将来性を発見し、投資と収益に最も有利な場所を見つけます。
-
4つの地域と20の主要国市場の2034年までの収益予測 - 北米、欧州、アジア太平洋、中南米、中東・アフリカの次世代エネルギー貯蔵技術(EST)市場の2024年から2034年までの予測をご覧ください。また、米国、カナダ、ブラジル、ドイツ、フランス、英国、イタリア、中国、インド、日本、オーストラリアなどの著名経済圏の市場も予測しています。
-
2024年から2034年までの次世代エネルギー貯蔵技術(EST)市場に関与する主要企業15社の企業プロファイルを含む。
独自の予測による定量的・定性的分析をご覧いただけます。当レポートにしか掲載されていない情報を入手し、貴重なビジネスインテリジェンスで常に情報を得ることができます。
他では得られない情報
私たちの新しいレポートがあれば、知識に遅れをとったり、チャンスを逃したりする可能性が低くなります。弊社のレポートが貴社の調査、分析、意思決定にどのように役立つかをご覧ください。Visiongainのこの調査レポートは、次世代エネルギー貯蔵技術(EST)市場(2024年~2034年)、市場をリードする企業の商業分析を必要とするすべての方々を対象としています。データ、トレンド、予測をご覧いただけます。
ページTOPに戻る
目次
目次
1 レポートの概要
1.1 研究の目的
1.2 次世代エネルギー貯蔵技術(EST)市場の紹介
1.3 本レポートの内容
1.4 本レポートを読むべき理由
1.5 本分析レポートが回答する主な質問
1.6 本レポートは誰のためのものか?
1.7 方法論
1.7.1 市場の定義
1.7.2 市場評価・予測手法
1.7.3 データの検証
1.7.3.1 一次調査
1.7.3.2 セカンダリーリサーチ
1.8 よくある質問(FAQ)
1.9 Visiongainの関連レポート
1.10 Visiongainについて
2 エグゼクティブサマリー
3 市場の概要
3.1 主要な調査結果
3.2 市場ダイナミクス
3.2.1 市場促進要因
3.2.1.1 再生可能エネルギー源のシェア拡大と相まって高まるエネルギー需要
3.2.1.2 人口増加と工業化に伴う世界的なエネルギー需要の増加
3.2.1.3 エネルギー貯蔵技術の進歩につながる継続的な研究開発
3.2.2 市場抑制要因
3.2.2.1 電池エネルギー貯蔵システムに関連するリスクが市場成長を妨げる
3.2.2.2 蓄電技術導入の高コストが市場成長を妨げる
3.2.2.3 長時間エネルギー貯蔵の多様なニーズへの対応が依然として課題
3.2.3 市場機会
3.2.3.1 急速な都市化傾向と都市部におけるマイクログリッド・ネットワークの拡大が、地域密着型エネルギー貯蔵ソリューションの機会を生み出す
3.2.3.2 先進的エネルギー貯蔵ソリューションの開発と普及を促進する政府による支援政策、インセンティブ、補助金
3.2.3.3 持続可能なエネルギー資源への投資拡大が市場の好機となる
3.3 ポーターのファイブフォース分析
3.3.1 サプライヤーの交渉力(低~中)
3.3.2 買い手の交渉力(高)
3.3.3 競争ライバル(高)
3.3.4 代替品による脅威(低)
3.3.5 新規参入の脅威(中)
3.4 COVID-19の影響分析
3.4.1 "V字回復"
3.4.2 "U字型回復"
3.4.3 "W字型回復"
3.4.4 "L字型回復"
3.5 PEST分析
4 次世代エネルギー貯蔵技術(EST)市場分析:水素別
4.1 主要な調査結果
4.2 水素セグメント 市場魅力度指数
4.3 次世代エネルギー貯蔵技術(EST)の水素別市場規模推定と予測
4.4 水素燃料電池
4.4.1 2024~2034年の地域別市場規模(US$ Billion)
4.4.2 地域別市場シェア、2024年・2034年(%)
4.5 水素圧縮・貯蔵
4.5.1 2024~2034年の地域別市場規模(US$ Billion)
4.5.2 地域別市場シェア、2024年・2034年(%)
5 次世代エネルギー貯蔵技術(EST)の市場分析:機械別
5.1 主要調査結果
5.2 機械セグメント 市場魅力度指数
5.3 次世代エネルギー貯蔵技術(EST)の機械別市場規模推定と予測
5.4 揚水発電
5.4.1 2024~2034年の地域別市場規模(US$ Billion)
5.4.2 地域別市場シェア、2024年・2034年(%)
5.5 圧縮空気エネルギー貯蔵(CAES)
5.5.1 2024〜2034年の地域別市場規模(US$ Billion)
5.5.2 地域別市場シェア、2024年・2034年(%)
5.6 フライホイール蓄電
5.6.1 2024~2034年の地域別市場規模(US$ Billion)
5.6.2 地域別市場シェア、2024年・2034年(%)
6 次世代エネルギー貯蔵技術(EST)市場分析:電池別
6.1 主要な調査結果
6.2 電池セグメント 市場魅力度指数
6.3 次世代エネルギー貯蔵技術(EST)の電池別市場規模推定と予測
6.4 リチウムイオン電池
6.4.1 2024~2034年の地域別市場規模(US$ Billion)
6.4.2 地域別市場シェア、2024年・2034年(%)
6.5 ナトリウム硫黄電池
6.5.1 2024~2034年の地域別市場規模(US$ Billion)
6.5.2 地域別市場シェア、2024年・2034年(%)
6.6 フロー電池
6.6.1 2024~2034年の地域別市場規模(US$ Billion)
6.6.2 地域別市場シェア、2024年・2034年(%)
6.7 先進鉛蓄電池
6.7.1 2024~2034年の地域別市場規模(US$ Billion)
6.7.2 地域別市場シェア、2024年・2034年(%)
7 次世代エネルギー貯蔵技術(EST)市場分析:用途別
7.1 主要な調査結果
7.2 アプリケーションセグメント 市場魅力度指数
7.3 次世代エネルギー貯蔵技術(EST)の用途別市場規模推定と予測
7.4 電気自動車(EV)
7.4.1 2024〜2034年の地域別市場規模(US$ Billion)
7.4.2 地域別市場シェア、2024年・2034年(%)
7.5 住宅用エネルギー貯蔵
7.5.1 2024〜2034年の地域別市場規模(US$ Billion)
7.5.2 地域別市場シェア、2024年・2034年(%)
7.6 商業・産業(C&I)
7.6.1 2024〜2034年の地域別市場規模(US$ Billion)
7.6.2 地域別市場シェア、2024年・2034年(%)
7.7 ユーティリティ・スケール・ストレージ
7.7.1 2024~2034年の地域別市場規模(US$ Billion)
7.7.2 地域別市場シェア、2024年・2034年(%)
7.8 その他の用途
7.8.1 2024〜2034年の地域別市場規模(US$ Billion)
7.8.2 地域別市場シェア、2024年・2034年(%)
8 次世代エネルギー貯蔵技術(EST)市場分析:技術タイプ別
8.1 主要な調査結果
8.2 技術タイプ別セグメント 市場魅力度指数
8.3 次世代エネルギー貯蔵技術(EST)の技術タイプ別市場規模推定と予測
8.4 電池エネルギー貯蔵
8.4.1 2024〜2034年の地域別市場規模(US$ Million)
8.4.2 地域別市場シェア、2024年・2034年(%)
8.5 機械エネルギー貯蔵
8.5.1 2024~2034年の地域別市場規模(US$ Million)
8.5.2 地域別市場シェア、2024年・2034年(%)
8.6 熱エネルギー貯蔵
8.6.1 2024~2034年の地域別市場規模(US$ Million)
8.6.2 地域別市場シェア、2024年・2034年(%)
8.7 水素エネルギー貯蔵
8.7.1 2024~2034年の地域別市場規模(US$ Million)
8.7.2 地域別市場シェア、2024年・2034年(%)
8.8 先進キャパシタ
8.8.1 2024~2034年の地域別市場規模(US$ Million)
8.8.2 地域別市場シェア、2024年・2034年(%)
8.9 その他の技術タイプ
8.9.1 2024~2034年の地域別市場規模(US$ Million)
8.9.2 地域別市場シェア、2024年・2034年(%)
9 次世代エネルギー貯蔵技術(EST)市場分析:地域別
9.1 主要な調査結果
9.2 地域別市場規模の推定と予測
10 北米の次世代エネルギー貯蔵技術(EST)市場分析
10.1 主要な調査結果
10.2 北米の次世代エネルギー貯蔵技術(EST)市場魅力度指数
10.3 北米の次世代エネルギー貯蔵技術(EST)国別市場、2024年、2029年、2034年(US$ Billion)
10.4 北米の次世代エネルギー貯蔵技術(EST)市場規模推定と予測
10.5 北米の次世代エネルギー貯蔵技術(EST)市場規模推定と予測:国別
10.6 北米の次世代エネルギー貯蔵技術(EST)市場規模推定と予測:水素別
10.7 北米の次世代エネルギー貯蔵技術(EST)市場規模推定と予測:機械別
10.8 北米の次世代エネルギー貯蔵技術(EST)市場規模推定と予測:電池別
10.9 北米の次世代エネルギー貯蔵技術(EST)市場規模推定と予測:用途別
10.10 北米の次世代エネルギー貯蔵技術(EST)市場規模推定と予測:技術タイプ別
10.11 アメリカの次世代エネルギー貯蔵技術(EST)市場分析
10.12 カナダの次世代エネルギー貯蔵技術(EST)市場分析
11 欧州の次世代エネルギー貯蔵技術(EST)市場分析
11.1 主要な調査結果
11.2 欧州の次世代エネルギー貯蔵技術(EST)市場魅力度指数
11.3 欧州の次世代エネルギー貯蔵技術(EST)国別市場、2024年、2029年、2034年 (US$ Billion)
11.4 欧州の次世代エネルギー貯蔵技術(EST)市場規模推定と予測
11.5 欧州の次世代エネルギー貯蔵技術(EST)市場規模推定と予測:国別
11.6 欧州の次世代エネルギー貯蔵技術(EST)市場規模推定と予測:水素別
11.7 欧州の次世代エネルギー貯蔵技術(EST)市場規模推定と予測:機械別
11.8 欧州の次世代エネルギー貯蔵技術(EST)市場規模推定と予測:電池タイプ別
11.9 欧州の次世代エネルギー貯蔵技術(EST)市場規模推定と予測:用途別
11.10 欧州の次世代エネルギー貯蔵技術(EST)市場規模推定と予測:技術タイプ別
11.11 ドイツの次世代エネルギー貯蔵技術(EST)市場分析
11.12 イギリスの次世代エネルギー貯蔵技術(EST)市場分析
11.13 フランスの次世代エネルギー貯蔵技術(EST)市場分析
11.14 イタリアの次世代エネルギー貯蔵技術(EST)市場分析
11.15 スペインの次世代エネルギー貯蔵技術(EST)市場分析
11.16 その他の欧州の次世代エネルギー貯蔵技術(EST)市場分析
12 アジア太平洋地域の次世代エネルギー貯蔵技術(EST)市場分析
12.1 主要な調査結果
12.2 アジア太平洋地域の次世代エネルギー貯蔵技術(EST)市場魅力度指数
12.3 アジア太平洋地域の次世代エネルギー貯蔵技術(EST)国別市場、2024年、2029年、2034年(US$ Billion
12.4 アジア太平洋地域の次世代エネルギー貯蔵技術(EST)市場規模推定と予測
12.5 アジア太平洋地域の次世代エネルギー貯蔵技術(EST)市場規模推定と予測:国別
12.6 アジア太平洋地域の次世代エネルギー貯蔵技術(EST)市場規模推定と予測:水素別
12.7 アジア太平洋地域の次世代エネルギー貯蔵技術(EST)市場規模推定と予測:機械別
12.8 アジア太平洋地域の次世代エネルギー貯蔵技術(EST)市場規模推定と予測:電池タイプ別
12.9 アジア太平洋地域の次世代エネルギー貯蔵技術(EST)市場規模推定と予測:用途別
12.10 アジア太平洋地域の次世代エネルギー貯蔵技術(EST)市場規模推定と予測:技術タイプ別
12.11 中国の次世代エネルギー貯蔵技術(EST)市場分析
12.12 インドの次世代エネルギー貯蔵技術(EST)市場分析
12.13 日本の次世代エネルギー貯蔵技術(EST)市場分析
12.14 韓国の次世代エネルギー貯蔵技術(EST)市場分析
12.15 オーストラリアの次世代エネルギー貯蔵技術(EST)市場分析
12.16 その他のアジア太平洋地域の次世代エネルギー貯蔵技術(EST)市場分析
13 中東・アフリカの次世代エネルギー貯蔵技術(EST)市場分析
13.1 主要な調査結果
13.2 中東・アフリカの次世代エネルギー貯蔵技術(EST)市場魅力度指数
13.3 中東・アフリカの次世代エネルギー貯蔵技術(EST)国別市場、2024年、2029年、2034年(US$ Billion)
13.4 中東・アフリカの次世代エネルギー貯蔵技術(EST)市場規模推定と予測
13.5 中東・アフリカの次世代エネルギー貯蔵技術(EST)市場規模推定と予測:国別
13.6 中東・アフリカの次世代エネルギー貯蔵技術(EST)市場規模推定と予測:水素別
13.7 中東・アフリカの次世代エネルギー貯蔵技術(EST)市場規模推定と予測:機械別
13.8 中東・アフリカの次世代エネルギー貯蔵技術(EST)市場規模推定と予測:電池別
13.9 中東・アフリカの次世代エネルギー貯蔵技術(EST)市場規模推定と予測:用途別
13.10 中東・アフリカの次世代エネルギー貯蔵技術(EST)市場規模推定と予測:技術タイプ別
13.11 GCCの次世代エネルギー貯蔵技術(EST)市場分析
13.12 南アフリカの次世代エネルギー貯蔵技術(EST)市場分析
13.13 その他の中東・アフリカ地域の次世代エネルギー貯蔵技術(EST)市場分析
14 ラテンアメリカの次世代エネルギー貯蔵技術(EST)市場分析
14.1 主要な調査結果
14.2 ラテンアメリカの次世代エネルギー貯蔵技術(EST)市場魅力度指数
14.3 ラテンアメリカの次世代エネルギー貯蔵技術(EST)国別市場、2024年、2029年、2034年(US$ Billion)
14.4 ラテンアメリカの次世代エネルギー貯蔵技術(EST)市場規模推定と予測
14.5 ラテンアメリカの次世代エネルギー貯蔵技術(EST)市場規模推定と予測:国別
14.6 ラテンアメリカの次世代エネルギー貯蔵技術(EST)市場規模推定と予測:水素別
14.7 ラテンアメリカの次世代エネルギー貯蔵技術(EST)市場規模推定と予測:機械別
14.8 ラテンアメリカの次世代エネルギー貯蔵技術(EST)市場規模推定と予測:電池タイプ別
14.9 ラテンアメリカの次世代エネルギー貯蔵技術(EST)市場規模推定と予測:用途別
14.10 ラテンアメリカの次世代エネルギー貯蔵技術(EST)市場規模推定と予測:技術タイプ別
14.11 ブラジルの次世代エネルギー貯蔵技術(EST)市場分析
14.12 メキシコの次世代エネルギー貯蔵技術(EST)市場分析
14.13 その他のラテンアメリカの次世代エネルギー貯蔵技術(EST)市場分析
15 企業プロフィール
15.1 競争環境、2022年
15.2 戦略的展望
15.3 Siemens AG
15.3.1 会社概要
15.3.2 会社概要
15.3.3 財務分析
15.3.3.1 純収入、2018-2022年
15.3.3.2 研究開発、2018-2022年
15.3.3.3 地域別収益シェア、2023年(%)
15.3.3.4 事業セグメント別売上高シェア、2022年(%)
15.3.4 製品ベンチマーク
15.3.5 戦略的展望
15.4 General Electric Company
15.4.1 会社概要
15.4.2 会社概要
15.4.3 財務分析
15.4.3.1 純収入、2018年~2022年
15.4.3.2 研究開発、2018-2022年
15.4.3.3 地域別収益シェア、2022年(%)
15.4.3.4 事業セグメント別収益シェア、2022年(%)
15.4.4 製品ベンチマーク
15.4.5 戦略的展望
15.5 Panasonic Holdings Corporation
15.5.1 会社概要
15.5.2 会社概要
15.5.3 財務分析
15.5.3.1 純収入、2019-2023年
15.5.3.2 研究開発、2018-2022年
15.5.3.3 地域別収益シェア、2023年(%)
15.5.3.4 事業セグメント別売上高シェア、2023年(%)
15.5.4 製品ベンチマーク
15.5.5 戦略的展望
15.6 LG Chem Ltd.
15.6.1 会社概要
15.6.2 会社概要
15.6.3 財務分析
15.6.3.1 純収入、2018-2022年
15.6.3.2 研究開発、2018-2022年
15.6.3.3 地域別収益シェア、2022年(%)
15.6.3.4 事業セグメント別収益シェア、2022年(%)
15.6.4 製品ベンチマーク
15.6.5 戦略的展望
15.7 BYD Co. Ltd.
15.7.1 会社概要
15.7.2 会社概要
15.7.3 財務分析
15.7.3.1 純収入、2017-2021年
15.7.3.2 研究開発、2017-2021年
15.7.3.3 地域別収入シェア、2021年(%)
15.7.4 製品ベンチマーク
15.7.5 戦略的展望
15.8 Samsung SDI Co. Ltd.
15.8.1 会社概要
15.8.2 会社概要
15.8.3 財務分析
15.8.3.1 純収入、2018-2022年
15.8.3.2 研究開発、2018-2022年
15.8.3.3 地域別収入シェア、2022年(%)
15.8.3.4 事業セグメント別収益シェア、2022年(%)
15.8.4 製品ベンチマーク
15.8.5 戦略的展望
15.9 Saft Groupe SAS
15.9.1 会社概要
15.9.2 会社概要
15.9.3 財務分析
15.9.3.1 純収入(2018年~2022年
15.9.3.2 研究開発、2018-2022年
15.9.3.3 地域別収益シェア、2022年(%)
15.9.3.4 事業セグメント別収益シェア、2022年(%)
15.9.4 製品ベンチマーク
15.9.5 戦略的展望
15.10 Hitachi Chemical Co., Ltd.
15.10.1 会社概要
15.10.2 会社概要
15.10.3 財務分析
15.10.3.1 純収入、2019-2023年
15.10.3.2 地域別売上高シェア、2022年(%)
15.10.3.3 事業セグメント別売上シェア、2022年(%)
15.10.4 製品ベンチマーク
15.10.5 戦略的展望
15.11 Maxwell Technologies Inc
15.11.1 会社概要
15.11.2 会社概要
15.11.3 財務分析
15.11.3.1 純収入、2019-2023年
15.11.3.2 研究開発、2019-2023年
15.11.3.3 地域別売上高シェア、2022年(%)
15.11.3.4 事業セグメント別売上シェア、2022年(%)
15.11.4 製品ベンチマーク
15.11.5 戦略的展望
15.12 Fluence Energy
15.12.1 会社概要
15.12.2 会社概要
15.12.3 財務分析
15.12.3.1 純収入、2019-2023年
15.12.3.2 研究開発、2019-2023年
15.12.4 製品ベンチマーク
15.12.5 戦略的展望
15.13 AES Energy Storage, LLC
15.13.1 会社概要
15.13.2 会社概要
15.13.3 財務分析
15.13.3.1 純収入、2019年~2023年
15.13.4 製品ベンチマーク
15.13.5 戦略的展望
15.14 NEC Corporation
15.14.1 会社概要
15.14.2 会社概要
15.14.3 財務分析
15.14.3.1 純収入、2019-2023年
15.14.3.2 研究開発, 2019-2023
15.14.3.3 事業セグメント収益シェア、2022年(%)
15.14.4 製品ベンチマーク
15.14.5 戦略的展望
15.15 Alevo Group S.A.
15.15.1 会社概要
15.15.2 会社概要
15.15.3 製品ベンチマーク
15.15.4 戦略的展望
15.16 Leclanché S.A.
15.16.1 会社概要
15.16.2 会社概要
15.16.3 製品ベンチマーク
15.16.4 戦略的展望
15.17 Greensmith Energy Management Systems
15.17.1 会社概要
15.17.2 会社概要
15.17.3 製品ベンチマーク
15.17.4 戦略的展望
16 結論と提言
16.1 Visiongainの結びの言葉
16.2 市場プレイヤーへの提言
ページTOPに戻る
図表リスト
表の一覧
Table 1 Next Generation Energy Storage Technologies (EST) Market Snapshot, 2024 & 2034 (US$ Billion, CAGR %)
Table 2 Global Next Generation Energy Storage Technologies (EST) Market by Region, 2024-2034 (US$ Bn, AGR (%), CAGR (%)) (V-Shaped Recovery Scenario)
Table 3 Global Next Generation Energy Storage Technologies (EST) Market by Region, 2024-2034 (US$ Bn, AGR (%), CAGR (%)) (U-Shaped Recovery Scenario)
Table 4 Global Next Generation Energy Storage Technologies (EST) Market by Region, 2024-2034 (US$ Bn, AGR (%), CAGR (%)) (W-Shaped Recovery Scenario)
Table 5 Global Next Generation Energy Storage Technologies (EST) Market by Region, 2024-2034 (US$ Bn, AGR (%), CAGR (%)) (L-Shaped Recovery Scenario)
Table 6 Global Next Generation Energy Storage Technologies (EST) Market by Hydrogen, 2024-2034 (US$ Bn, AGR (%), CAGR (%))
Table 7 Hydrogen Fuel Cells Market by Region, 2024-2034 (US$ Bn, AGR (%), CAGR (%))
Table 8 Hydrogen Compression and Storage Market by Region, 2024-2034 (US$ Bn, AGR (%), CAGR (%))
Table 9 Global Next Generation Energy Storage Technologies (EST) Market by Mechanical, 2024-2034 (US$ Bn, AGR (%), CAGR (%))
Table 10 Pumped Hydro Storage Market by Region, 2024-2034 (US$ Bn, AGR (%), CAGR (%))
Table 11 Compressed Air Energy Storage (CAES) Market by Region, 2024-2034 (US$ Bn, AGR (%), CAGR (%))
Table 12 Flywheel Energy Storage Market by Region, 2024-2034 (US$ Bn, AGR (%), CAGR (%))
Table 13 Global Next Generation Energy Storage Technologies (EST) Market by Battery Type, 2024-2034 (US$ Bn, AGR (%), CAGR (%))
Table 14 Lithium-ion Batteries Market by Region, 2024-2034 (US$ Bn, AGR (%), CAGR (%))
Table 15 Sodium-Sulphur Batteries Market by Region, 2024-2034 (US$ Bn, AGR (%), CAGR (%))
Table 16 Flow Batteries Market by Region, 2024-2034 (US$ Bn, AGR (%), CAGR (%))
Table 17 Advanced Lead-Acid Batteries Market by Region, 2024-2034 (US$ Bn, AGR (%), CAGR (%))
Table 18 Global Next Generation Energy Storage Technologies (EST) Market by Application, 2024-2034 (US$ Bn, AGR (%), CAGR (%))
Table 19 Electric Vehicles (EVs) Market by Region, 2024-2034 (US$ Bn, AGR (%), CAGR (%))
Table 20 Residential Energy Storage Market by Region, 2024-2034 (US$ Bn, AGR (%), CAGR (%))
Table 21 Commercial and Industrial (C&I) Market by Region, 2024-2034 (US$ Bn, AGR (%), CAGR (%))
Table 22 Utility-Scale Storage Market by Region, 2024-2034 (US$ Bn, AGR (%), CAGR (%))
Table 23 Other Applications Market by Region, 2024-2034 (US$ Bn, AGR (%), CAGR (%))
Table 24 Global Next Generation Energy Storage Technologies (EST) Market by Technology Type, 2024-2034 (US$ Bn, AGR (%), CAGR (%))
Table 25 Battery Energy Storage Market by Region, 2024-2034 (US$ Bn, AGR (%), CAGR (%))
Table 26 Mechanical Energy Storage Market by Region, 2024-2034 (US$ Bn, AGR (%), CAGR (%))
Table 27 Thermal Energy Storage Market by Region, 2024-2034 (US$ Bn, AGR (%), CAGR (%))
Table 28 Hydrogen Energy Storage Market by Region, 2024-2034 (US$ Bn, AGR (%), CAGR (%))
Table 29 Advanced Capacitors Market by Region, 2024-2034 (US$ Bn, AGR (%), CAGR (%))
Table 30 Other Technology Type Market by Region, 2024-2034 (US$ Bn, AGR (%), CAGR (%))
Table 31 Global Next Generation Energy Storage Technologies (EST) Market by Region, 2024-2034 (US$ Bn, AGR (%), CAGR (%))
Table 32 North America Next Generation Energy Storage Technologies (EST) Market by Value, 2024-2034 (US$ Bn, AGR (%), CAGR (%))
Table 33 North America Next Generation Energy Storage Technologies (EST) Market by Country, 2024-2034 (US$ Bn, AGR (%), CAGR (%))
Table 34 North America Next Generation Energy Storage Technologies (EST) Market by Hydrogen, 2024-2034 (US$ Bn, AGR (%), CAGR (%))
Table 35 North America Next Generation Energy Storage Technologies (EST) Market by Mechanical, 2024-2034 (US$ Bn, AGR (%), CAGR (%))
Table 36 North America Next Generation Energy Storage Technologies (EST) Market by Battery Type, 2024-2034 (US$ Bn, AGR (%), CAGR (%))
Table 37 North America Next Generation Energy Storage Technologies (EST) Market by Application, 2024-2034 (US$ Bn, AGR (%), CAGR (%))
Table 38 North America Next Generation Energy Storage Technologies (EST) Market by Technology Type, 2024-2034 (US$ Bn, AGR (%), CAGR (%))
Table 39 US Next Generation Energy Storage Technologies (EST) Market by Value, 2024-2034 (US$ Bn, AGR (%), CAGR (%))
Table 40 Canada Next Generation Energy Storage Technologies (EST) Market by Value, 2024-2034 (US$ Bn, AGR (%), CAGR (%))
Table 41 Europe Next Generation Energy Storage Technologies (EST) Market by Value, 2024-2034 (US$ Bn, AGR (%), CAGR (%))
Table 42 Europe Next Generation Energy Storage Technologies (EST) Market by Country, 2024-2034 (US$ Bn, AGR (%), CAGR (%))
Table 43 Europe Next Generation Energy Storage Technologies (EST) Market by Hydrogen, 2024-2034 (US$ Bn, AGR (%), CAGR (%))
Table 44 Europe Next Generation Energy Storage Technologies (EST) Market by Mechanical, 2024-2034 (US$ Bn, AGR (%), CAGR (%))
Table 45 Europe Next Generation Energy Storage Technologies (EST) Market by Battery Type, 2024-2034 (US$ Bn, AGR (%), CAGR (%))
Table 46 Europe Next Generation Energy Storage Technologies (EST) Market by Application, 2024-2034 (US$ Bn, AGR (%), CAGR (%))
Table 47 Europe Next Generation Energy Storage Technologies (EST) Market by Technology Type, 2024-2034 (US$ Bn, AGR (%), CAGR (%))
Table 48 Germany Next Generation Energy Storage Technologies (EST) Market by Value, 2024-2034 (US$ Bn, AGR (%), CAGR (%))
Table 49 UK Next Generation Energy Storage Technologies (EST) Market by Value, 2024-2034 (US$ Bn, AGR (%), CAGR (%))
Table 50 France Next Generation Energy Storage Technologies (EST) Market by Value, 2024-2034 (US$ Bn, AGR (%), CAGR (%))
Table 51 Italy Next Generation Energy Storage Technologies (EST) Market by Value, 2024-2034 (US$ Bn, AGR (%), CAGR (%))
Table 52 Spain Next Generation Energy Storage Technologies (EST) Market by Value, 2024-2034 (US$ Bn, AGR (%), CAGR (%))
Table 53 Rest of Europe Next Generation Energy Storage Technologies (EST) Market by Value, 2024-2034 (US$ Bn, AGR (%), CAGR (%))
Table 54 Asia-Pacific Next Generation Energy Storage Technologies (EST) Market by Value, 2024-2034 (US$ Bn, AGR (%), CAGR (%))
Table 55 Asia-Pacific Next Generation Energy Storage Technologies (EST) Market by Country, 2024-2034 (US$ Bn, AGR (%), CAGR (%))
Table 56 Asia-Pacific Next Generation Energy Storage Technologies (EST) Market by Hydrogen, 2024-2034 (US$ Bn, AGR (%), CAGR (%))
Table 57 Asia-Pacific Next Generation Energy Storage Technologies (EST) Market by Mechanical, 2024-2034 (US$ Bn, AGR (%), CAGR (%))
Table 58 Asia-Pacific Next Generation Energy Storage Technologies (EST) Market by Battery Type, 2024-2034 (US$ Bn, AGR (%), CAGR (%))
Table 59 Asia-Pacific Next Generation Energy Storage Technologies (EST) Market by Application, 2024-2034 (US$ Bn, AGR (%), CAGR (%))
Table 60 Asia-Pacific Next Generation Energy Storage Technologies (EST) Market by Technology Type, 2024-2034 (US$ Bn, AGR (%), CAGR (%))
Table 61 China Next Generation Energy Storage Technologies (EST) Market by Value, 2024-2034 (US$ Bn, AGR (%), CAGR (%))
Table 62 India Next Generation Energy Storage Technologies (EST) Market by Value, 2024-2034 (US$ Bn, AGR (%), CAGR (%))
Table 63 Japan Next Generation Energy Storage Technologies (EST) Market by Value, 2024-2034 (US$ Bn, AGR (%), CAGR (%))
Table 64 South Korea Next Generation Energy Storage Technologies (EST) Market by Value, 2024-2034 (US$ Bn, AGR (%), CAGR (%))
Table 65 Australia Next Generation Energy Storage Technologies (EST) Market by Value, 2024-2034 (US$ Bn, AGR (%), CAGR (%))
Table 66 Rest of Asia-Pacific Next Generation Energy Storage Technologies (EST) Market by Value, 2024-2034 (US$ Bn, AGR (%), CAGR (%))
Table 67 Middle East & Africa Next Generation Energy Storage Technologies (EST) Market by Value, 2024-2034 (US$ Bn, AGR (%), CAGR (%))
Table 68 Middle East & Africa Next Generation Energy Storage Technologies (EST) Market by Country, 2024-2034 (US$ Bn, AGR (%), CAGR (%))
Table 69 Middle East & Africa Next Generation Energy Storage Technologies (EST) Market by Hydrogen, 2024-2034 (US$ Bn, AGR (%), CAGR (%))
Table 70 Middle East & Africa Next Generation Energy Storage Technologies (EST) Market by Mechanical, 2024-2034 (US$ Bn, AGR (%), CAGR (%))
Table 71 Middle East & Africa Next Generation Energy Storage Technologies (EST) Market by Battery Type, 2024-2034 (US$ Bn, AGR (%), CAGR (%))
Table 72 Middle East & Africa Next Generation Energy Storage Technologies (EST) Market by Application, 2024-2034 (US$ Bn, AGR (%), CAGR (%))
Table 73 Middle East & Africa Next Generation Energy Storage Technologies (EST) Market by Technology Type, 2024-2034 (US$ Bn, AGR (%), CAGR (%))
Table 74 GCC Next Generation Energy Storage Technologies (EST) Market by Value, 2024-2034 (US$ Bn, AGR (%), CAGR (%))
Table 75 South Africa Next Generation Energy Storage Technologies (EST) Market by Value, 2024-2034 (US$ Bn, AGR (%), CAGR (%))
Table 76 Rest of Middle East & Africa Next Generation Energy Storage Technologies (EST) Market by Value, 2024-2034 (US$ Bn, AGR (%), CAGR (%))
Table 77 Latin America Next Generation Energy Storage Technologies (EST) Market by Value, 2024-2034 (US$ Bn, AGR (%), CAGR (%))
Table 78 Latin America Next Generation Energy Storage Technologies (EST) Market by Country, 2024-2034 (US$ Bn, AGR (%), CAGR (%))
Table 79 Latin America Next Generation Energy Storage Technologies (EST) Market by Hydrogen, 2024-2034 (US$ Bn, AGR (%), CAGR (%))
Table 80 Latin America Next Generation Energy Storage Technologies (EST) Market by Mechanical, 2024-2034 (US$ Bn, AGR (%), CAGR (%))
Table 81 Latin America Next Generation Energy Storage Technologies (EST) Market by Battery Type, 2024-2034 (US$ Bn, AGR (%), CAGR (%))
Table 82 Latin America Next Generation Energy Storage Technologies (EST) Market by Application, 2024-2034 (US$ Bn, AGR (%), CAGR (%))
Table 83 Latin America Next Generation Energy Storage Technologies (EST) Market by Technology Type, 2024-2034 (US$ Bn, AGR (%), CAGR (%))
Table 84 Brazil Next Generation Energy Storage Technologies (EST) Market by Value, 2024-2034 (US$ Bn, AGR (%), CAGR (%))
Table 85 Mexico Next Generation Energy Storage Technologies (EST) Market by Value, 2024-2034 (US$ Bn, AGR (%), CAGR (%))
Table 86 Rest of Latin America Next Generation Energy Storage Technologies (EST) Market by Value, 2024-2034 (US$ Bn, AGR (%), CAGR (%))
Table 87 Strategic Outlook – Recent Development
Table 88 Siemens AG: Key Details, (CEO, HQ, Revenue, Founded, No. of Employees, Company Type, Website, Business Segment)
Table 89 Siemens AG: Product Benchmarking
Table 90 Siemens AG: Strategic Outlook
Table 91 General Electric Company: Key Details, (CEO, HQ, Revenue, Founded, No. of Employees, Company Type, Website, Business Segment)
Table 92 General Electric Company: Product Benchmarking
Table 93 General Electric Company: Strategic Outlook
Table 94 Panasonic Holdings Corporation: Key Details, (CEO, HQ, Revenue, Founded, No. of Employees, Company Type, Website, Business Segment)
Table 95 Panasonic Holdings Corporation: Product Benchmarking
Table 96 Panasonic Holdings Corporation: Strategic Outlook
Table 97 LG Chem Ltd.: Key Details, (CEO, HQ, Revenue, Founded, No. of Employees, Company Type, Website, Business Segment)
Table 98 LG Chem Ltd.: Product Benchmarking
Table 99 LG Chem Ltd.: Strategic Outlook
Table 100 BYD Co. Ltd: Key Details, (CEO, HQ, Revenue, Founded, No. of Employees, Company Type, Website, Business Segment)
Table 101 BYD Co. Ltd: Product Benchmarking
Table 102 BYD Co. Ltd: Strategic Outlook
Table 103 Samsung SDI Co. Ltd.: Key Details, (CEO, HQ, Revenue, Founded, No. of Employees, Company Type, Website, Business Segment)
Table 104 Samsung SDI Co. Ltd.: Product Benchmarking
Table 105 Samsung SDI Co. Ltd.: Strategic Outlook
Table 106 Saft Groupe SAS: Key Details, (CEO, HQ, Revenue, Founded, No. of Employees, Company Type, Website, Business Segment)
Table 107 Saft Groupe SAS: Product Benchmarking
Table 108 Saft Groupe SAS: Strategic Outlook
Table 109 Hitachi Chemical Co., Ltd.: Key Details, (CEO, HQ, Revenue, Founded, No. of Employees, Company Type, Website, Business Segment)
Table 110 Hitachi Chemical Co., Ltd.: Product Benchmarking
Table 111 Hitachi Chemical Co., Ltd.: Strategic Outlook
Table 112 Maxwell Technologies Inc: Key Details, (CEO, HQ, Revenue, Founded, No. of Employees, Company Type, Website, Business Segment)
Table 113 Maxwell Technologies Inc: Product Benchmarking
Table 114 Fluence Energy: Key Details, (CEO, HQ, Revenue, Founded, No. of Employees, Company Type, Website, Business Segment)
Table 115 Fluence Energy: Product Benchmarking
Table 116 Fluence Energy: Strategic Outlook
Table 117 AES Energy Storage, LLC: Key Details, (CEO, HQ, Revenue, Founded, No. of Employees, Company Type, Website, Business Segment)
Table 118 AES Energy Storage, LLC: Product Benchmarking
Table 119 AES Energy Storage, LLC: Strategic Outlook
Table 120 NEC Corporation: Key Details, (CEO, HQ, Revenue, Founded, No. of Employees, Company Type, Website, Business Segment)
Table 121 NEC Corporation: Product Benchmarking
Table 122 NEC Corporation: Strategic Outlook
Table 123 Alevo Group S.A.: Key Details, (CEO, HQ, Revenue, Founded, No. of Employees, Company Type, Website, Business Segment)
Table 124 Alevo Group S.A.: Product Benchmarking
Table 125 Alevo Group S.A.: Strategic Outlook
Table 126 Leclanché S.A.: Key Details, (CEO, HQ, Revenue, Founded, No. of Employees, Company Type, Website, Business Segment)
Table 127 Leclanché S.A.: Product Benchmarking
Table 128 Leclanché S.A.: Strategic Outlook
Table 129 Greensmith Energy Management Systems: Key Details, (CEO, HQ, Revenue, Founded, No. of Employees, Company Type, Website, Business Segment)
Table 130 Greensmith Energy Management Systems: Product Benchmarking
図の一覧
Figure 1 Next Generation Energy Storage Technologies (EST) Market Segmentation
Figure 2 Next Generation Energy Storage Technologies (EST) Market by Hydrogen: Market Attractiveness Index
Figure 3 Next Generation Energy Storage Technologies (EST) Market by Mechanical: Market Attractiveness Index
Figure 4 Next Generation Energy Storage Technologies (EST) Market by Battery: Market Attractiveness Index
Figure 5 Next Generation Energy Storage Technologies (EST) Market by Application: Market Attractiveness Index
Figure 6 Next Generation Energy Storage Technologies (EST) Market by Technology Type: Market Attractiveness Index
Figure 7 Next Generation Energy Storage Technologies (EST) Market Attractiveness Index by Region
Figure 8 Next Generation Energy Storage Technologies (EST) Market: Market Dynamics
Figure 9 Renewable Energy Production, 2020-2023,
Figure 10 Next Generation Energy Storage Technologies (EST) Market: Porter’s Five Forces Analysis
Figure 11 Global Next Generation Energy Storage Technologies (EST) Market Share Forecast by COVID, 2024-2034 (%)
Figure 12 Global Next Generation Energy Storage Technologies (EST) Market by Region, 2024-2034 (US$ Bn, AGR (%)) (V-Shaped Recovery Scenario)
Figure 13 Global Next Generation Energy Storage Technologies (EST) Market by Region, 2024-2034 (US$ Bn, AGR (%)) (U-Shaped Recovery Scenario)
Figure 14 Global Next Generation Energy Storage Technologies (EST) Market by Region, 2024-2034 (US$ Bn, AGR (%)) (W-Shaped Recovery Scenario)
Figure 15 Global Next Generation Energy Storage Technologies (EST) Market by Region, 2024-2034 (US$ Bn, AGR (%)) (L-Shaped Recovery Scenario)
Figure 16 Next Generation Energy Storage Technologies (EST) Market: PEST Analysis
Figure 17 Next Generation Energy Storage Technologies (EST) Market by Hydrogen: Market Attractiveness Index
Figure 18 Global Next Generation Energy Storage Technologies (EST) Market by Hydrogen, 2024-2034 (US$ Bn, AGR (%))
Figure 19 Next Generation Energy Storage Technologies (EST) Market Share Forecast by Hydrogen, 2024, 2029, 2034 (%)
Figure 20 Hydrogen Fuel Cells Market by Region, 2024-2034 (US$ Bn, AGR (%))
Figure 21 Hydrogen Fuel Cells Market Share Forecast by Region, 2024 & 2034 (%)
Figure 22 Hydrogen Compression and Storage Market by Region, 2024-2034 (US$ Bn, AGR (%))
Figure 23 Hydrogen Compression and Storage Market Share Forecast by Region, 2024 & 2034 (%)
Figure 24 Next Generation Energy Storage Technologies (EST) Market by Mechanical: Market Attractiveness Index
Figure 25 Global Next Generation Energy Storage Technologies (EST) Market by Mechanical, 2024-2034 (US$ Bn, AGR (%))
Figure 26 Next Generation Energy Storage Technologies (EST) Market Share Forecast by Mechanical, 2024, 2029, 2034 (%)
Figure 27 Pumped Hydro Storage Market by Region, 2024-2034 (US$ Bn, AGR (%))
Figure 28 Pumped Hydro Storage Market Share Forecast by Region, 2024 & 2034 (%)
Figure 29 Compressed Air Energy Storage (CAES) Market by Region, 2024-2034 (US$ Bn, AGR (%))
Figure 30 Compressed Air Energy Storage (CAES) Market Share Forecast by Region, 2024 & 2034 (%)
Figure 31 Flywheel Energy Storage Market by Region, 2024-2034 (US$ Bn, AGR (%))
Figure 32 Flywheel Energy Storage Market Share Forecast by Region, 2024 & 2034 (%)
Figure 33 Next Generation Energy Storage Technologies (EST) Market by Battery: Market Attractiveness Index
Figure 34 Global Next Generation Energy Storage Technologies (EST) Market by Battery Type, 2024-2034 (US$ Bn, AGR (%))
Figure 35 Next Generation Energy Storage Technologies (EST) Market Share Forecast by Battery, 2024, 2029, 2034 (%)
Figure 36 Lithium-ion Batteries Market by Region, 2024-2034 (US$ Bn, AGR (%))
Figure 37 Lithium-ion Batteries Market Share Forecast by Region, 2024 & 2034 (%)
Figure 38 Sodium-Sulfur Batteries Market by Region, 2024-2034 (US$ Bn, AGR (%))
Figure 39 Sodium-Sulfur Batteries Market Share Forecast by Region, 2024 & 2034 (%)
Figure 40 Flow Batteries Market by Region, 2024-2034 (US$ Bn, AGR (%))
Figure 41 Flow Batteries Market Share Forecast by Region, 2024 & 2034 (%)
Figure 42 Advanced Lead-Acid Batteries Market by Region, 2024-2034 (US$ Bn, AGR (%))
Figure 43 Advanced Lead-Acid Batteries Market Share Forecast by Region, 2024 & 2034 (%)
Figure 44 Next Generation Energy Storage Technologies (EST) Market by Application: Market Attractiveness Index
Figure 45 Global Next Generation Energy Storage Technologies (EST) Market by Application, 2024-2034 (US$ Bn, AGR (%))
Figure 46 Next Generation Energy Storage Technologies (EST) Market Share Forecast by Application, 2024, 2029, 2034 (%)
Figure 47 Electric Vehicles (EVs) Market by Region, 2024-2034 (US$ Bn, AGR (%))
Figure 48 Electric Vehicles (EVs) Market Share Forecast by Region, 2024 & 2034 (%)
Figure 49 Residential Energy Storage Market by Region, 2024-2034 (US$ Bn, AGR (%))
Figure 50 Residential Energy Storage Market Share Forecast by Region, 2024 & 2034 (%)
Figure 51 Commercial and Industrial (C&I) Market by Region, 2024-2034 (US$ Bn, AGR (%))
Figure 52 Commercial and Industrial (C&I) Market Share Forecast by Region, 2024 & 2034 (%)
Figure 53 Utility-Scale Storage Market by Region, 2024-2034 (US$ Bn, AGR (%))
Figure 54 Utility-Scale Storage Market Share Forecast by Region, 2024 & 2034 (%)
Figure 55 Other Applications Market by Region, 2024-2034 (US$ Bn, AGR (%))
Figure 56 Other Applications Market Share Forecast by Region, 2024 & 2034 (%)
Figure 57 Next Generation Energy Storage Technologies (EST) Market by Technology Type: Market Attractiveness Index
Figure 58 Global Next Generation Energy Storage Technologies (EST) Market by Technology Type, 2024-2034 (US$ Bn, AGR (%))
Figure 59 Next Generation Energy Storage Technologies (EST) Market Share Forecast by Technology Type, 2024, 2029, 2034 (%)
Figure 60 Battery Energy Storage Market by Region, 2024-2034 (US$ Bn, AGR (%))
Figure 61 Battery Energy Storage Market Share Forecast by Region, 2024 & 2034 (%)
Figure 62 Mechanical Energy Storage Market by Region, 2024-2034 (US$ Bn, AGR (%))
Figure 63 Mechanical Energy Storage Market Share Forecast by Region, 2024 & 2034 (%)
Figure 64 Thermal Energy Storage Market by Region, 2024-2034 (US$ Bn, AGR (%))
Figure 65 Thermal Energy Storage Market Share Forecast by Region, 2024 & 2034 (%)
Figure 66 Hydrogen Energy Storage Market by Region, 2024-2034 (US$ Bn, AGR (%))
Figure 67 Hydrogen Energy Storage Market Share Forecast by Region, 2024 & 2034 (%)
Figure 68 Advanced Capacitors Market by Region, 2024-2034 (US$ Bn, AGR (%))
Figure 69 Advanced Capacitors Market Share Forecast by Region, 2024 & 2034 (%)
Figure 70 Other Technology Type Market by Region, 2024-2034 (US$ Bn, AGR (%))
Figure 71 Other Technology Type Market Share Forecast by Region, 2024 & 2034 (%)
Figure 72 Next Generation Energy Storage Technologies (EST) Market Forecast by Region 2024 and 2034 (Revenue, CAGR%)
Figure 73 Next Generation Energy Storage Technologies (EST) Market Share Forecast by Region 2024, 2029, 2034 (%)
Figure 74 Global Next Generation Energy Storage Technologies (EST) Market by Region, 2024-2034 (US$ Bn, AGR (%))
Figure 75 North America Next Generation Energy Storage Technologies (EST) Market Attractiveness Index
Figure 76 North America Next Generation Energy Storage Technologies (EST) Market by Region, 2024, 2029 & 2034 (US$ Billion)
Figure 77 North America Next Generation Energy Storage Technologies (EST) Market by Value, 2024-2034 (US$ Bn, AGR (%))
Figure 78 North America Next Generation Energy Storage Technologies (EST) Market by Country, 2024-2034 (US$ Bn, AGR (%))
Figure 79 North America Next Generation Energy Storage Technologies (EST) Market Share Forecast by Country, 2024 & 2034 (%)
Figure 80 North America Next Generation Energy Storage Technologies (EST) Market by Hydrogen, 2024-2034 (US$ Bn, AGR (%))
Figure 81 North America Next Generation Energy Storage Technologies (EST) Market Share Forecast Hydrogen, 2024 & 2034 (%)
Figure 82 North America Next Generation Energy Storage Technologies (EST) Market by Mechanical, 2024-2034 (US$ Bn, AGR (%))
Figure 83 North America Next Generation Energy Storage Technologies (EST) Market Share Forecast by Mechanical, 2024 & 2034 (%)
Figure 84 North America Next Generation Energy Storage Technologies (EST) Market by Battery Type, 2024-2034 (US$ Bn, AGR (%))
Figure 85 North America Next Generation Energy Storage Technologies (EST) Market Share Forecast by Battery, 2024 & 2034 (%)
Figure 86 North America Next Generation Energy Storage Technologies (EST) Market by Application, 2024-2034 (US$ Bn, AGR (%))
Figure 87 North America Next Generation Energy Storage Technologies (EST) Market Share Forecast by Application, 2024 & 2034 (%)
Figure 88 North America Next Generation Energy Storage Technologies (EST) Market by Technology Type, 2024-2034 (US$ Bn, AGR (%))
Figure 89 North America Next Generation Energy Storage Technologies (EST) Market Share Forecast by Technology Type, 2024 & 2034 (%)
Figure 90 US Next Generation Energy Storage Technologies (EST) Market by Value, 2024-2034 (US$ Bn, AGR (%))
Figure 91 Canada Next Generation Energy Storage Technologies (EST) Market by Value, 2024-2034 (US$ Bn, AGR (%))
Figure 92 Europe Next Generation Energy Storage Technologies (EST) Market Attractiveness Index
Figure 93 Europe Next Generation Energy Storage Technologies (EST) Market by Region, 2024, 2029 & 2034 (US$ Billion)
Figure 94 Europe Next Generation Energy Storage Technologies (EST) Market by Value, 2024-2034 (US$ Bn, AGR (%))
Figure 95 Europe Next Generation Energy Storage Technologies (EST) Market by Country, 2024-2034 (US$ Bn, AGR (%))
Figure 96 Europe Next Generation Energy Storage Technologies (EST) Market Share Forecast by Country, 2024 & 2034 (%)
Figure 97 Europe Next Generation Energy Storage Technologies (EST) Market by Hydrogen, 2024-2034 (US$ Bn, AGR (%))
Figure 98 Europe Next Generation Energy Storage Technologies (EST) Market Share Forecast Hydrogen, 2024 & 2034 (%)
Figure 99 Europe Next Generation Energy Storage Technologies (EST) Market by Mechanical, 2024-2034 (US$ Bn, AGR (%))
Figure 100 Europe Next Generation Energy Storage Technologies (EST) Market Share Forecast by Mechanical, 2024 & 2034 (%)
Figure 101 Europe Next Generation Energy Storage Technologies (EST) Market by Battery Type, 2024-2034 (US$ Bn, AGR (%))
Figure 102 Europe Next Generation Energy Storage Technologies (EST) Market Share Forecast by Battery, 2024 & 2034 (%)
Figure 103 Europe Next Generation Energy Storage Technologies (EST) Market by Application, 2024-2034 (US$ Bn, AGR (%))
Figure 104 Europe Next Generation Energy Storage Technologies (EST) Market Share Forecast by Application, 2024 & 2034 (%)
Figure 105 Europe Next Generation Energy Storage Technologies (EST) Market by Technology Type, 2024-2034 (US$ Bn, AGR (%))
Figure 106 Europe Next Generation Energy Storage Technologies (EST) Market Share Forecast by Technology Type, 2024 & 2034 (%)
Figure 107 Germany Next Generation Energy Storage Technologies (EST) Market by Value, 2024-2034 (US$ Bn, AGR (%))
Figure 108 UK Next Generation Energy Storage Technologies (EST) Market by Value, 2024-2034 (US$ Bn, AGR (%))
Figure 109 France Next Generation Energy Storage Technologies (EST) Market by Value, 2024-2034 (US$ Bn, AGR (%))
Figure 110 Italy Next Generation Energy Storage Technologies (EST) Market by Value, 2024-2034 (US$ Bn, AGR (%))
Figure 111 Spain Next Generation Energy Storage Technologies (EST) Market by Value, 2024-2034 (US$ Bn, AGR (%))
Figure 112 Rest of Europe Next Generation Energy Storage Technologies (EST) Market by Value, 2024-2034 (US$ Bn, AGR (%))
Figure 113 Asia-Pacific Next Generation Energy Storage Technologies (EST) Market Attractiveness Index
Figure 114 Asia-Pacific Next Generation Energy Storage Technologies (EST) Market by Region, 2024, 2029 & 2034 (US$ Billion)
Figure 115 Asia-Pacific Next Generation Energy Storage Technologies (EST) Market by Value, 2024-2034 (US$ Bn, AGR (%))
Figure 116 Asia-Pacific Next Generation Energy Storage Technologies (EST) Market by Country, 2024-2034 (US$ Bn, AGR (%))
Figure 117 Asia-Pacific Next Generation Energy Storage Technologies (EST) Market Share Forecast by Country, 2024 & 2034 (%)
Figure 118 Asia-Pacific Next Generation Energy Storage Technologies (EST) Market by Hydrogen, 2024-2034 (US$ Bn, AGR (%))
Figure 119 Asia-Pacific Next Generation Energy Storage Technologies (EST) Market Share Forecast Hydrogen, 2024 & 2034 (%)
Figure 120 Asia-Pacific Next Generation Energy Storage Technologies (EST) Market by Mechanical, 2024-2034 (US$ Bn, AGR (%))
Figure 121 Asia-Pacific Next Generation Energy Storage Technologies (EST) Market Share Forecast by Mechanical, 2024 & 2034 (%)
Figure 122 Asia-Pacific Next Generation Energy Storage Technologies (EST) Market by Battery Type, 2024-2034 (US$ Bn, AGR (%))
Figure 123 Asia-Pacific Next Generation Energy Storage Technologies (EST) Market Share Forecast by Battery Type, 2024 & 2034 (%)
Figure 124 Asia-Pacific Next Generation Energy Storage Technologies (EST) Market by Application, 2024-2034 (US$ Bn, AGR (%))
Figure 125 Asia-Pacific Next Generation Energy Storage Technologies (EST) Market Share Forecast by Application, 2024 & 2034 (%)
Figure 126 Asia-Pacific Next Generation Energy Storage Technologies (EST) Market by Technology Type, 2024-2034 (US$ Bn, AGR (%))
Figure 127 Asia-Pacific Next Generation Energy Storage Technologies (EST) Market Share Forecast by Technology Type, 2024 & 2034 (%)
Figure 128 China Next Generation Energy Storage Technologies (EST) Market by Value, 2024-2034 (US$ Bn, AGR (%))
Figure 129 India Next Generation Energy Storage Technologies (EST) Market by Value, 2024-2034 (US$ Bn, AGR (%))
Figure 130 Japan Next Generation Energy Storage Technologies (EST) Market by Value, 2024-2034 (US$ Bn, AGR (%))
Figure 131 South Korea Next Generation Energy Storage Technologies (EST) Market by Value, 2024-2034 (US$ Bn, AGR (%))
Figure 132 Australia Next Generation Energy Storage Technologies (EST) Market by Value, 2024-2034 (US$ Bn, AGR (%))
Figure 133 Rest of Asia-Pacific Next Generation Energy Storage Technologies (EST) Market by Value, 2024-2034 (US$ Bn, AGR (%))
Figure 134 Middle East and Africa Next Generation Energy Storage Technologies (EST) Market Attractiveness Index
Figure 135 Middle East and Africa Next Generation Energy Storage Technologies (EST) Market by Region, 2024, 2029 & 2034 (US$ Billion)
Figure 136 Middle East & Africa Next Generation Energy Storage Technologies (EST) Market by Value, 2024-2034 (US$ Bn, AGR (%))
Figure 137 Middle East & Africa Next Generation Energy Storage Technologies (EST) Market by Country, 2024-2034 (US$ Bn, AGR (%))
Figure 138 Middle East and Africa Next Generation Energy Storage Technologies (EST) Market Share Forecast by Country, 2024 & 2034 (%)
Figure 139 Middle East & Africa Next Generation Energy Storage Technologies (EST) Market by Hydrogen, 2024-2034 (US$ Bn, AGR (%))
Figure 140 Middle East and Africa Next Generation Energy Storage Technologies (EST) Market Share Forecast Hydrogen, 2024 & 2034 (%)
Figure 141 Middle East & Africa Next Generation Energy Storage Technologies (EST) Market by Mechanical, 2024-2034 (US$ Bn, AGR (%))
Figure 142 Middle East and Africa Next Generation Energy Storage Technologies (EST) Market Share Forecast by Mechanical, 2024 & 2034 (%)
Figure 143 Middle East & Africa Next Generation Energy Storage Technologies (EST) Market by Battery Type, 2024-2034 (US$ Bn, AGR (%))
Figure 144 Middle East and Africa Next Generation Energy Storage Technologies (EST) Market Share Forecast by Battery, 2024 & 2034 (%)
Figure 145 Middle East & Africa Next Generation Energy Storage Technologies (EST) Market by Application, 2024-2034 (US$ Bn, AGR (%))
Figure 146 Middle East and Africa Next Generation Energy Storage Technologies (EST) Market Share Forecast by Application, 2024 & 2034 (%)
Figure 147 Middle East & Africa Next Generation Energy Storage Technologies (EST) Market by Technology Type, 2024-2034 (US$ Bn, AGR (%))
Figure 148 Middle East and Africa Next Generation Energy Storage Technologies (EST) Market Share Forecast by Technology Type, 2024 & 2034 (%)
Figure 149 GCC Next Generation Energy Storage Technologies (EST) Market by Value, 2024-2034 (US$ Bn, AGR (%))
Figure 150 South Africa Next Generation Energy Storage Technologies (EST) Market by Value, 2024-2034 (US$ Bn, AGR (%))
Figure 151 Rest of Middle East & Africa Next Generation Energy Storage Technologies (EST) Market by Value, 2024-2034 (US$ Bn, AGR (%))
Figure 152 Latin America Next Generation Energy Storage Technologies (EST) Market Attractiveness Index
Figure 153 Latin America Next Generation Energy Storage Technologies (EST) Market by Region, 2024, 2029 & 2034 (US$ Billion)
Figure 154 Latin America Next Generation Energy Storage Technologies (EST) Market by Value, 2024-2034 (US$ Bn, AGR (%))
Figure 155 Latin America Next Generation Energy Storage Technologies (EST) Market by Country, 2024-2034 (US$ Bn, AGR (%))
Figure 156 Latin America Next Generation Energy Storage Technologies (EST) Market Share Forecast by Country, 2024 & 2034 (%)
Figure 157 Latin America Next Generation Energy Storage Technologies (EST) Market by Hydrogen, 2024-2034 (US$ Bn, AGR (%))
Figure 158 Latin America Next Generation Energy Storage Technologies (EST) Market Share Forecast Hydrogen, 2024 & 2034 (%)
Figure 159 Latin America Next Generation Energy Storage Technologies (EST) Market by Mechanical, 2024-2034 (US$ Bn, AGR (%))
Figure 160 Latin America Next Generation Energy Storage Technologies (EST) Market Share Forecast by Mechanical, 2024 & 2034 (%)
Figure 161 Latin America Next Generation Energy Storage Technologies (EST) Market by Battery Type, 2024-2034 (US$ Bn, AGR (%))
Figure 162 Latin America Next Generation Energy Storage Technologies (EST) Market Share Forecast by Battery, 2024 & 2034 (%)
Figure 163 Latin America Next Generation Energy Storage Technologies (EST) Market by Application, 2024-2034 (US$ Bn, AGR (%))
Figure 164 Latin America Next Generation Energy Storage Technologies (EST) Market Share Forecast by Application, 2024 & 2034 (%)
Figure 165 Latin America Next Generation Energy Storage Technologies (EST) Market by Technology Type, 2024-2034 (US$ Bn, AGR (%))
Figure 166 Latin America Next Generation Energy Storage Technologies (EST) Market Share Forecast by Technology Type, 2024 & 2034 (%)
Figure 167 Brazil Next Generation Energy Storage Technologies (EST) Market by Value, 2024-2034 (US$ Bn, AGR (%))
Figure 168 Mexico Next Generation Energy Storage Technologies (EST) Market by Value, 2024-2034 (US$ Bn, AGR (%))
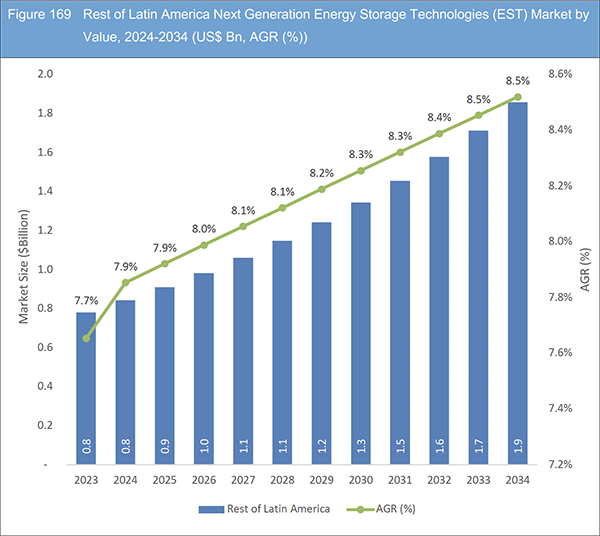
Figure 169 Rest of Latin America Next Generation Energy Storage Technologies (EST) Market by Value, 2024-2034 (US$ Bn, AGR (%))
Figure 170 Next Generation Energy Storage Technologies (EST) Market: Company Share, 2022
Figure 171 Siemens AG.: Net Revenue, 2019-2023 (US$ Million, AGR%)
Figure 172 Siemens AG.: R&D, 2019-2023 (US$ Million, AGR%)
Figure 173 Siemens AG.: Regional Revenue Share, 2023 (%)
Figure 174 Siemens AG.: Business Segment Revenue Share, 2022 (%)
Figure 175 General Electric Company.: Net Revenue, 2018-2022 (US$ Million, AGR%)
Figure 176 General Electric Company.: R&D, 2018-2022 (US$ Million, AGR%)
Figure 177 General Electric Company.: Regional Revenue Share, 2022 (%)
Figure 178 General Electric Company.: Business Segment Revenue Share, 2022 (%)
Figure 179 Panasonic Holdings Corporation.: Net Revenue, 2019-2023 (US$ Million, AGR%)
Figure 180 Panasonic Holdings Corporation.: R&D, 2019-2023 (US$ Million, AGR%)
Figure 181 Panasonic Holdings Corporation.: Regional Revenue Share, 2032 (%)
Figure 182 Panasonic Holdings Corporation.: Business Segment Revenue Share, 2023 (%)
Figure 183 LG Chem Ltd..: Net Revenue, 2018-2022 (US$ Million, AGR%)
Figure 184 LG Chem Ltd..: R&D, 2018-2022 (US$ Million, AGR%)
Figure 185 LG Chem Ltd..: Regional Revenue Share, 2022 (%)
Figure 186 LG Chem Ltd..: Business Segment Revenue Share, 2022 (%)
Figure 187 BYD Co. Ltd.: Net Revenue, 2017-2021 (US$ Million, AGR%)
Figure 188 BYD Co. Ltd.: R&D, 2017-2021 (US$ Million, AGR%)
Figure 189 BYD Co. Ltd.: Regional Revenue Share, 2021 (%)
Figure 190 Samsung SDI Co. Ltd..: Net Revenue, 2018-2022 (US$ Million, AGR%)
Figure 191 Samsung SDI Co. Ltd..: R&D, 2018-2022 (US$ Million, AGR%)
Figure 192 Samsung SDI Co. Ltd..: Regional Revenue Share, 2022 (%)
Figure 193 Samsung SDI Co. Ltd..: Business Segment Revenue Share, 2022 (%)
Figure 194 Saft Groupe SAS.: Net Revenue, 2018-2022 (US$ Million, AGR%)
Figure 195 Saft Groupe SAS.: R&D, 2018-2022 (US$ Million, AGR%)
Figure 196 Saft Groupe SAS.: Regional Revenue Share, 2022 (%)
Figure 197 Saft Groupe SAS.: Business Segment Revenue Share, 2022 (%)
Figure 198 Hitachi Chemical Co., Ltd..: Net Revenue, 2019-2023 (US$ Million, AGR%)
Figure 199 Hitachi Chemical Co., Ltd..: Regional Revenue Share, 2022 (%)
Figure 200 Hitachi Chemical Co., Ltd..: Business Segment Revenue Share, 2022 (%)
Figure 201 Maxwell Technologies Inc.: Net Revenue, 2019-2023 (US$ Million, AGR%)
Figure 202 Maxwell Technologies Inc.: R&D, 2019-2023 (US$ Million, AGR%)
Figure 203 Maxwell Technologies Inc.: Regional Revenue Share, 2022 (%)
Figure 204 Maxwell Technologies Inc.: Business Segment Revenue Share, 2022 (%)
Figure 205 Fluence Energy.: Net Revenue, 2019-2023 (US$ Million, AGR%)
Figure 206 Fluence Energy.: R&D, 2019-2023 (US$ Million, AGR%)
Figure 207 Fluence Energy.: Business Segment Revenue Share, 2022 (%)
Figure 208 AES Energy Storage, LLC.: Net Revenue, 2019-2023 (US$ Million, AGR%)
Figure 209 NEC Corporation.: Net Revenue, 2019-2023 (US$ Million, AGR%)
Figure 210 NEC Corporation.: R&D, 2019-2023 (US$ Million, AGR%)
Figure 211 NEC Corporation.: Business Segment Revenue Share, 2022 (%)
ページTOPに戻る
Summary
Report Details
The Next Generation Energy Storage Technologies (EST) Market Report 2024-2034: This report will prove invaluable to leading firms striving for new revenue pockets if they wish to better understand the industry and its underlying dynamics. It will be useful for companies that would like to expand into different industries or to expand their existing operations in a new region.
The Next Generation Energy Storage Technologies (EST) Market Is at the Forefront of a Transformative Shift in the Global Energy Landscape
The next generation energy storage technologies (EST) market is at the forefront of a transformative shift in the global energy landscape, driven by a growing demand for sustainable and efficient energy storage solutions. This market encompasses a diverse range of innovative technologies, including advanced batteries, hydrogen storage, and novel mechanical storage systems, aiming to address the challenges posed by intermittent renewable energy sources and optimize energy utilization across various sectors.
The market is propelled by several key drivers. Firstly, the increasing integration of renewable energy sources, such as solar and wind, into the power grid necessitates advanced energy storage solutions to manage fluctuations in energy supply. Additionally, a rising awareness of environmental sustainability and the urgent need to reduce carbon emissions are driving investments and policies favouring the adoption of cleaner and more efficient energy storage technologies. The electrification of transportation, particularly the rapid growth of electric vehicles (EVs), is further accelerating the demand for high-performance energy storage solutions.
Risk Associated with Battery Energy Storage System Hinder the Market Growth
The growth of the energy storage market is hindered by various restraining factors, with a prominent one being the risks associated with Battery Energy Storage Systems (BESS). The intricate nature of these systems poses challenges that could impede market expansion. One major concern is the potential for battery failure, which can occur due to a variety of reasons, including environmental factors, suboptimal construction, electrical abuse, physical damage, or temperature issues. The consequences of a failed system can range from the battery exploding to catching fire or emitting poisonous gases, highlighting the critical need for robust preventive measures and security protocols.
What Questions Should You Ask before Buying a Market Research Report?
-
How is the next generation energy storage technologies (EST) market evolving?
-
What is driving and restraining the next generation energy storage technologies (EST) market?
-
How will each next generation energy storage technologies (EST) submarket segment grow over the forecast period and how much revenue will these submarkets account for in 2034?
-
How will the market shares for each next generation energy storage technologies (EST) submarket develop from 2024 to 2034?
-
What will be the main driver for the overall market from 2024 to 2034?
-
Will leading next generation energy storage technologies (EST) markets broadly follow the macroeconomic dynamics, or will individual national markets outperform others?
-
How will the market shares of the national markets change by 2034 and which geographical region will lead the market in 2034?
-
Who are the leading players and what are their prospects over the forecast period?
-
What are the next generation energy storage technologies (EST) projects for these leading companies?
-
How will the industry evolve during the period between 2024 and 2034? What are the implications of next generation energy storage technologies (EST) projects taking place now and over the next 10 years?
-
Is there a greater need for product commercialisation to further scale the next generation energy storage technologies (EST) market?
-
Where is the next generation energy storage technologies (EST) market heading and how can you ensure you are at the forefront of the market?
-
What are the best investment options for new product and service lines?
-
What are the key prospects for moving companies into a new growth path and C-suite?
You need to discover how this will impact the next generation energy storage technologies (EST) market today, and over the next 10 years:
-
Our 421-page report provides 130 tables and 210 charts/graphs exclusively to you.
-
The report highlights key lucrative areas in the industry so you can target them – NOW.
-
It contains in-depth analysis of global, regional and national sales and growth.
-
It highlights for you the key successful trends, changes and revenue projections made by your competitors.
This report tells you TODAY how the next generation energy storage technologies (EST) market will develop in the next 10 years, and in line with the variations in COVID-19 economic recession and bounce. This market is more critical now than at any point over the last 10 years.
Forecasts to 2034 and other analyses reveal commercial prospects
-
In addition to revenue forecasting to 2034, our new study provides you with recent results, growth rates, and market shares.
-
You will find original analyses, with business outlooks and developments.
-
Discover qualitative analyses (including market dynamics, drivers, opportunities, restraints and challenges), cost structure, impact of rising next generation energy storage technologies (EST) prices and recent developments.
This report includes data analysis and invaluable insight into how COVID-19 will affect the industry and your company. Four COVID-19 recovery patterns and their impact, namely, “V”, “L”, “W” and “U” are discussed in this report.
Segments Covered in the Report
Market Segment by Hydrogen
-
Hydrogen Fuel Cells
-
Hydrogen Compression and Storage
Market Segment by Mechanical
-
Pumped Hydro Storage
-
Compressed Air Energy Storage (CAES)
-
Flywheel Energy Storage
Market Segment by Battery Type
-
Lithium-ion Batteries
-
Sodium-Sulfur Batteries
-
Flow Batteries
-
Advanced Lead-Acid Batteries
Market Segment by Application
-
Electric Vehicles (EVs)
-
Residential Energy Storage
-
Commercial and Industrial (C&I)
-
Utility-Scale Storage
-
Other Applications
Market Segment by Technology Type
-
Battery Energy Storage
-
Mechanical Energy Storage
-
Thermal Energy Storage
-
Hydrogen Energy Storage
-
Advanced Capacitors
-
Other Technology Type
In addition to the revenue predictions for the overall world market and segments, you will also find revenue forecasts for four regional and 20 leading national markets:
North America
Europe
-
Germany
-
Spain
-
United Kingdom
-
France
-
Italy
-
Rest of Europe
Asia Pacific
-
China
-
Japan
-
India
-
Australia
-
South Korea
-
Rest of Asia Pacific
Latin America
-
Brazil
-
Mexico
-
Rest of Latin America
Middle East & Africa
-
GCC
-
South Africa
-
Rest of Middle East & Africa
The report also includes profiles and for some of the leading companies in the Next Generation Energy Storage Technologies (EST) Market, 2024 to 2034, with a focus on this segment of these companies’ operations.
Leading companies profiled in the report
-
AES Energy Storage, LLC
-
Alevo Group S.A.
-
BYD Co. Ltd
-
Fluence Energy
-
General Electric Company
-
Greensmith Energy Management Systems
-
Hitachi Chemical Co., Ltd.
-
Leclanché S.A.
-
LG Chem Ltd.
-
Maxwell Technologies Inc
-
NEC Corporation
-
Panasonic Holdings Corporation
-
Saft Groupe SAS
-
Samsung SDI Co. Ltd.
-
Siemens AG
Overall world revenue for Next Generation Energy Storage Technologies (EST) Market, 2024 to 2034 in terms of value the market will surpass US$22.2 billion in 2024, our work calculates. We predict strong revenue growth through to 2034. Our work identifies which organizations hold the greatest potential. Discover their capabilities, progress, and commercial prospects, helping you stay ahead.
How will the Next Generation Energy Storage Technologies (EST) Market, 2024 to 2034 report help you?
In summary, our 420+ page report provides you with the following knowledge:
-
Revenue forecasts to 2034 for Next Generation Energy Storage Technologies (EST) Market, 2024 to 2034 Market, with forecasts for hydrogen, mechanical, battery type, application, and technology type, each forecast at a global and regional level – discover the industry’s prospects, finding the most lucrative places for investments and revenues.
-
Revenue forecasts to 2034 for four regional and 20 key national markets – See forecasts for the Next Generation Energy Storage Technologies (EST) Market, 2024 to 2034 market in North America, Europe, Asia-Pacific, Latin America and Middle East & Africa. Also forecasted is the market in the US, Canada, Brazil, Germany, France, UK, Italy, China, India, Japan, and Australia among other prominent economies.
-
Prospects for established firms and those seeking to enter the market – including company profiles for 15 of the major companies involved in the Next Generation Energy Storage Technologies (EST) Market, 2024 to 2034.
Find quantitative and qualitative analyses with independent predictions. Receive information that only our report contains, staying informed with invaluable business intelligence.
Information found nowhere else
With our new report, you are less likely to fall behind in knowledge or miss out on opportunities. See how our work could benefit your research, analyses, and decisions. Visiongain’s study is for everybody needing commercial analyses for the Next Generation Energy Storage Technologies (EST) Market, 2024 to 2034, market-leading companies. You will find data, trends and predictions.
ページTOPに戻る
Table of Contents
Table of Contents
1 Report Overview
1.1 Objectives of the Study
1.2 Introduction to Next Generation Energy Storage Technologies (EST) Market
1.3 What This Report Delivers
1.4 Why You Should Read This Report
1.5 Key Questions Answered by This Analytical Report
1.6 Who Is This Report for?
1.7 Methodology
1.7.1 Market Definitions
1.7.2 Market Evaluation & Forecasting Methodology
1.7.3 Data Validation
1.7.3.1 Primary Research
1.7.3.2 Secondary Research
1.8 Frequently Asked Questions (FAQs)
1.9 Associated Visiongain Reports
1.10 About Visiongain
2 Executive Summary
3 Market Overview
3.1 Key Findings
3.2 Market Dynamics
3.2.1 Market Driving Factors
3.2.1.1 Growing Demand for Energy Coupled with Increasing Share of Renewable Sources
3.2.1.2 The Rising Global Demand for Energy, Driven by Population Growth and Industrialization
3.2.1.3 Ongoing Research and Development lead to Advancements in Energy Storage Technologies
3.2.2 Market Restraining Factors
3.2.2.1 Risk Associated with Battery Energy Storage System Hinder the Market Growth
3.2.2.2 High Cost of Installing Energy Storage Technologies Hinder the Market Growth
3.2.2.3 Meeting the Diverse needs of Long-Duration Energy Storage Remains a Challenge
3.2.3 Market Opportunities
3.2.3.1 Rapid Urbanization Trends and the Expansion of Microgrid Networks in Urban Areas Create Opportunities for Localized Energy Storage Solutions
3.2.3.2 Supportive Policies, Incentives, and Subsidies from Governments to Promote the Development and Deployment of Advanced Energy Storage Solutions
3.2.3.3 Growing Investments towards Sustainable Energy Resources opportunity for the Market
3.3 Porter’s Five Forces Analysis
3.3.1 Bargaining Power of Suppliers (Low to Medium)
3.3.2 Bargaining Power of Buyers (High)
3.3.3 Competitive Rivalry (High)
3.3.4 Threat from Substitutes (Low)
3.3.5 Threat of New Entrants (Medium)
3.4 COVID-19 Impact Analysis
3.4.1 “V-Shaped Recovery”
3.4.2 “U-Shaped Recovery”
3.4.3 “W-Shaped Recovery”
3.4.4 “L-Shaped Recovery”
3.5 PEST Analysis
4 Next Generation Energy Storage Technologies (EST) Market Analysis by Hydrogen
4.1 Key Findings
4.2 Hydrogen Segment: Market Attractiveness Index
4.3 Next Generation Energy Storage Technologies (EST) Market Size Estimation and Forecast by Hydrogen
4.4 Hydrogen Fuel Cells
4.4.1 Market Size by Region, 2024-2034 (US$ Billion)
4.4.2 Market Share by Region, 2024 & 2034 (%)
4.5 Hydrogen Compression and Storage
4.5.1 Market Size by Region, 2024-2034 (US$ Billion)
4.5.2 Market Share by Region, 2024 & 2034 (%)
5 Next Generation Energy Storage Technologies (EST) Market Analysis by Mechanical
5.1 Key Findings
5.2 Mechanical Segment: Market Attractiveness Index
5.3 Next Generation Energy Storage Technologies (EST) Market Size Estimation and Forecast by Mechanical
5.4 Pumped Hydro Storage
5.4.1 Market Size by Region, 2024-2034 (US$ Billion)
5.4.2 Market Share by Region, 2024 & 2034 (%)
5.5 Compressed Air Energy Storage (CAES)
5.5.1 Market Size by Region, 2024-2034 (US$ Billion)
5.5.2 Market Share by Region, 2024 & 2034 (%)
5.6 Flywheel Energy Storage
5.6.1 Market Size by Region, 2024-2034 (US$ Billion)
5.6.2 Market Share by Region, 2024 & 2034 (%)
6 Next Generation Energy Storage Technologies (EST) Market Analysis by Battery
6.1 Key Findings
6.2 Battery Segment: Market Attractiveness Index
6.3 Next Generation Energy Storage Technologies (EST) Market Size Estimation and Forecast by Battery
6.4 Lithium-ion Batteries
6.4.1 Market Size by Region, 2024-2034 (US$ Billion)
6.4.2 Market Share by Region, 2024 & 2034 (%)
6.5 Sodium-Sulfur Batteries
6.5.1 Market Size by Region, 2024-2034 (US$ Billion)
6.5.2 Market Share by Region, 2024 & 2034 (%)
6.6 Flow Batteries
6.6.1 Market Size by Region, 2024-2034 (US$ Billion)
6.6.2 Market Share by Region, 2024 & 2034 (%)
6.7 Advanced Lead-Acid Batteries
6.7.1 Market Size by Region, 2024-2034 (US$ Billion)
6.7.2 Market Share by Region, 2024 & 2034 (%)
7 Next Generation Energy Storage Technologies (EST) Market Analysis by Application
7.1 Key Findings
7.2 Application Segment: Market Attractiveness Index
7.3 Next Generation Energy Storage Technologies (EST) Market Size Estimation and Forecast by Application
7.4 Electric Vehicles (EVs)
7.4.1 Market Size by Region, 2024-2034 (US$ Billion)
7.4.2 Market Share by Region, 2024 & 2034 (%)
7.5 Residential Energy Storage
7.5.1 Market Size by Region, 2024-2034 (US$ Billion)
7.5.2 Market Share by Region, 2024 & 2034 (%)
7.6 Commercial and Industrial (C&I)
7.6.1 Market Size by Region, 2024-2034 (US$ Billion)
7.6.2 Market Share by Region, 2024 & 2034 (%)
7.7 Utility-Scale Storage
7.7.1 Market Size by Region, 2024-2034 (US$ Billion)
7.7.2 Market Share by Region, 2024 & 2034 (%)
7.8 Other Applications
7.8.1 Market Size by Region, 2024-2034 (US$ Billion)
7.8.2 Market Share by Region, 2024 & 2034 (%)
8 Next Generation Energy Storage Technologies (EST) Market Analysis by Technology Type
8.1 Key Findings
8.2 Technology Type Segment: Market Attractiveness Index
8.3 Next Generation Energy Storage Technologies (EST) Market Size Estimation and Forecast by Technology Type
8.4 Battery Energy Storage
8.4.1 Market Size by Region, 2024-2034 (US$ Million)
8.4.2 Market Share by Region, 2024 & 2034 (%)
8.5 Mechanical Energy Storage
8.5.1 Market Size by Region, 2024-2034 (US$ Million)
8.5.2 Market Share by Region, 2024 & 2034 (%)
8.6 Thermal Energy Storage
8.6.1 Market Size by Region, 2024-2034 (US$ Million)
8.6.2 Market Share by Region, 2024 & 2034 (%)
8.7 Hydrogen Energy Storage
8.7.1 Market Size by Region, 2024-2034 (US$ Million)
8.7.2 Market Share by Region, 2024 & 2034 (%)
8.8 Advanced Capacitors
8.8.1 Market Size by Region, 2024-2034 (US$ Million)
8.8.2 Market Share by Region, 2024 & 2034 (%)
8.9 Other Technology Type
8.9.1 Market Size by Region, 2024-2034 (US$ Million)
8.9.2 Market Share by Region, 2024 & 2034 (%)
9 Next Generation Energy Storage Technologies (EST) Market Analysis by Region
9.1 Key Findings
9.2 Regional Market Size Estimation and Forecast
10 North America Next Generation Energy Storage Technologies (EST) Market Analysis
10.1 Key Findings
10.2 North America Next Generation Energy Storage Technologies (EST) Market Attractiveness Index
10.3 North America Next Generation Energy Storage Technologies (EST) Market by Country, 2024, 2029 & 2034 (US$ Billion)
10.4 North America Next Generation Energy Storage Technologies (EST) Market Size Estimation and Forecast
10.5 North America Next Generation Energy Storage Technologies (EST) Market Size Estimation and Forecast by Country
10.6 North America Next Generation Energy Storage Technologies (EST) Market Size Estimation and Forecast by Hydrogen
10.7 North America Next Generation Energy Storage Technologies (EST) Market Size Estimation and Forecast by Mechanical
10.8 North America Next Generation Energy Storage Technologies (EST) Market Size Estimation and Forecast by Battery
10.9 North America Next Generation Energy Storage Technologies (EST) Market Size Estimation and Forecast by Application
10.10 North America Next Generation Energy Storage Technologies (EST) Market Size Estimation and Forecast by Technology Type
10.11 U.S. Next Generation Energy Storage Technologies (EST) Market Analysis
10.12 Canada Next Generation Energy Storage Technologies (EST) Market Analysis
11 Europe Next Generation Energy Storage Technologies (EST) Market Analysis
11.1 Key Findings
11.2 Europe Next Generation Energy Storage Technologies (EST) Market Attractiveness Index
11.3 Europe Next Generation Energy Storage Technologies (EST) Market by Country, 2024, 2029 & 2034 (US$ Billion)
11.4 Europe Next Generation Energy Storage Technologies (EST) Market Size Estimation and Forecast
11.5 Europe Next Generation Energy Storage Technologies (EST) Market Size Estimation and Forecast by Country
11.6 Europe Next Generation Energy Storage Technologies (EST) Market Size Estimation and Forecast by Hydrogen
11.7 Europe Next Generation Energy Storage Technologies (EST) Market Size Estimation and Forecast by Mechanical
11.8 Europe Next Generation Energy Storage Technologies (EST) Market Size Estimation and Forecast by Battery Type
11.9 Europe Next Generation Energy Storage Technologies (EST) Market Size Estimation and Forecast by Application
11.10 Europe Next Generation Energy Storage Technologies (EST) Market Size Estimation and Forecast by Technology Type
11.11 Germany Next Generation Energy Storage Technologies (EST) Market Analysis
11.12 UK Next Generation Energy Storage Technologies (EST) Market Analysis
11.13 France Next Generation Energy Storage Technologies (EST) Market Analysis
11.14 Italy Next Generation Energy Storage Technologies (EST) Market Analysis
11.15 Spain Next Generation Energy Storage Technologies (EST) Market Analysis
11.16 Rest of Europe Next Generation Energy Storage Technologies (EST) Market Analysis
12 Asia-Pacific Next Generation Energy Storage Technologies (EST) Market Analysis
12.1 Key Findings
12.2 Asia-Pacific Next Generation Energy Storage Technologies (EST) Market Attractiveness Index
12.3 Asia-Pacific Next Generation Energy Storage Technologies (EST) Market by Country, 2024, 2029 & 2034 (US$ Billion)
12.4 Asia-Pacific Next Generation Energy Storage Technologies (EST) Market Size Estimation and Forecast
12.5 Asia-Pacific Next Generation Energy Storage Technologies (EST) Market Size Estimation and Forecast by Country
12.6 Asia-Pacific Next Generation Energy Storage Technologies (EST) Market Size Estimation and Forecast by Hydrogen
12.7 Asia-Pacific Next Generation Energy Storage Technologies (EST) Market Size Estimation and Forecast by Mechanical
12.8 Asia-Pacific Next Generation Energy Storage Technologies (EST) Market Size Estimation and Forecast by Battery Type
12.9 Asia-Pacific Next Generation Energy Storage Technologies (EST) Market Size Estimation and Forecast by Application
12.10 Asia-Pacific Next Generation Energy Storage Technologies (EST) Market Size Estimation and Forecast by Technology Type
12.11 China Next Generation Energy Storage Technologies (EST) Market Analysis
12.12 India Next Generation Energy Storage Technologies (EST) Market Analysis
12.13 Japan Next Generation Energy Storage Technologies (EST) Market Analysis
12.14 South Korea Next Generation Energy Storage Technologies (EST) Market Analysis
12.15 Australia Next Generation Energy Storage Technologies (EST) Market Analysis
12.16 Rest of Asia-Pacific Next Generation Energy Storage Technologies (EST) Market Analysis
13 Middle East and Africa Next Generation Energy Storage Technologies (EST) Market Analysis
13.1 Key Findings
13.2 Middle East and Africa Next Generation Energy Storage Technologies (EST) Market Attractiveness Index
13.3 Middle East and Africa Next Generation Energy Storage Technologies (EST) Market by Country, 2024, 2029 & 2034 (US$ Billion)
13.4 Middle East and Africa Next Generation Energy Storage Technologies (EST) Market Size Estimation and Forecast
13.5 Middle East and Africa Next Generation Energy Storage Technologies (EST) Market Size Estimation and Forecast by Country
13.6 Middle East and Africa Next Generation Energy Storage Technologies (EST) Market Size Estimation and Forecast by Hydrogen
13.7 Middle East and Africa Next Generation Energy Storage Technologies (EST) Market Size Estimation and Forecast by Mechanical
13.8 Middle East and Africa Next Generation Energy Storage Technologies (EST) Market Size Estimation and Forecast by Battery
13.9 Middle East and Africa Next Generation Energy Storage Technologies (EST) Market Size Estimation and Forecast by Application
13.10 Middle East and Africa Next Generation Energy Storage Technologies (EST) Market Size Estimation and Forecast by Technology Type
13.11 GCC Next Generation Energy Storage Technologies (EST) Market Analysis
13.12 South Africa Next Generation Energy Storage Technologies (EST) Market Analysis
13.13 Rest of Middle East & Africa Next Generation Energy Storage Technologies (EST) Market Analysis
14 Latin America Next Generation Energy Storage Technologies (EST) Market Analysis
14.1 Key Findings
14.2 Latin America Next Generation Energy Storage Technologies (EST) Market Attractiveness Index
14.3 Latin America Next Generation Energy Storage Technologies (EST) Market by Country, 2024, 2029 & 2034 (US$ Billion)
14.4 Latin America Next Generation Energy Storage Technologies (EST) Market Size Estimation and Forecast
14.5 Latin America Next Generation Energy Storage Technologies (EST) Market Size Estimation and Forecast by Country
14.6 Latin America Next Generation Energy Storage Technologies (EST) Market Size Estimation and Forecast by Hydrogen
14.7 Latin America Next Generation Energy Storage Technologies (EST) Market Size Estimation and Forecast by Mechanical
14.8 Latin America Next Generation Energy Storage Technologies (EST) Market Size Estimation and Forecast by Battery Type
14.9 Latin America Next Generation Energy Storage Technologies (EST) Market Size Estimation and Forecast by Application
14.10 Latin America Next Generation Energy Storage Technologies (EST) Market Size Estimation and Forecast by Technology Type
14.11 Brazil Next Generation Energy Storage Technologies (EST) Market Analysis
14.12 Mexico Next Generation Energy Storage Technologies (EST) Market Analysis
14.13 Rest of Latin America Next Generation Energy Storage Technologies (EST) Market Analysis
15 Company Profiles
15.1 Competitive Landscape, 2022
15.2 Strategic Outlook
15.3 Siemens AG
15.3.1 Company Snapshot
15.3.2 Company Overview
15.3.3 Financial Analysis
15.3.3.1 Net Revenue, 2018-2022
15.3.3.2 R&D, 2018-2022
15.3.3.3 Regional Revenue Share, 2023 (%)
15.3.3.4 Business Segment Revenue Share, 2022 (%)
15.3.4 Product Benchmarking
15.3.5 Strategic Outlook
15.4 General Electric Company
15.4.1 Company Snapshot
15.4.2 Company Overview
15.4.3 Financial Analysis
15.4.3.1 Net Revenue, 2018-2022
15.4.3.2 R&D, 2018-2022
15.4.3.3 Regional Revenue Share, 2022 (%)
15.4.3.4 Business Segment Revenue Share, 2022 (%)
15.4.4 Product Benchmarking
15.4.5 Strategic Outlook
15.5 Panasonic Holdings Corporation
15.5.1 Company Snapshot
15.5.2 Company Overview
15.5.3 Financial Analysis
15.5.3.1 Net Revenue, 2019-2023
15.5.3.2 R&D, 2018-2022
15.5.3.3 Regional Revenue Share, 2023 (%)
15.5.3.4 Business Segment Revenue Share, 2023 (%)
15.5.4 Product Benchmarking
15.5.5 Strategic Outlook
15.6 LG Chem Ltd.
15.6.1 Company Snapshot
15.6.2 Company Overview
15.6.3 Financial Analysis
15.6.3.1 Net Revenue, 2018-2022
15.6.3.2 R&D, 2018-2022
15.6.3.3 Regional Revenue Share, 2022 (%)
15.6.3.4 Business Segment Revenue Share, 2022 (%)
15.6.4 Product Benchmarking
15.6.5 Strategic Outlook
15.7 BYD Co. Ltd
15.7.1 Company Snapshot
15.7.2 Company Overview
15.7.3 Financial Analysis
15.7.3.1 Net Revenue, 2017-2021
15.7.3.2 R&D, 2017-2021
15.7.3.3 Regional Revenue Share, 2021 (%)
15.7.4 Product Benchmarking
15.7.5 Strategic Outlook
15.8 Samsung SDI Co. Ltd.
15.8.1 Company Snapshot
15.8.2 Company Overview
15.8.3 Financial Analysis
15.8.3.1 Net Revenue, 2018-2022
15.8.3.2 R&D, 2018-2022
15.8.3.3 Regional Revenue Share, 2022 (%)
15.8.3.4 Business Segment Revenue Share, 2022 (%)
15.8.4 Product Benchmarking
15.8.5 Strategic Outlook
15.9 Saft Groupe SAS
15.9.1 Company Snapshot
15.9.2 Company Overview
15.9.3 Financial Analysis
15.9.3.1 Net Revenue, 2018-2022
15.9.3.2 R&D, 2018-2022
15.9.3.3 Regional Revenue Share, 2022 (%)
15.9.3.4 Business Segment Revenue Share, 2022 (%)
15.9.4 Product Benchmarking
15.9.5 Strategic Outlook
15.10 Hitachi Chemical Co., Ltd.
15.10.1 Company Snapshot
15.10.2 Company Overview
15.10.3 Financial Analysis
15.10.3.1 Net Revenue, 2019-2023
15.10.3.2 Regional Revenue Share, 2022 (%)
15.10.3.3 Business Segment Revenue Share, 2022 (%)
15.10.4 Product Benchmarking
15.10.5 Strategic Outlook
15.11 Maxwell Technologies Inc
15.11.1 Company Snapshot
15.11.2 Company Overview
15.11.3 Financial Analysis
15.11.3.1 Net Revenue, 2019-2023
15.11.3.2 R&D, 2019-2023
15.11.3.3 Regional Revenue Share, 2022 (%)
15.11.3.4 Business Segment Revenue Share, 2022 (%)
15.11.4 Product Benchmarking
15.11.5 Strategic Outlook
15.12 Fluence Energy
15.12.1 Company Snapshot
15.12.2 Company Overview
15.12.3 Financial Analysis
15.12.3.1 Net Revenue, 2019-2023
15.12.3.2 R&D, 2019-2023
15.12.4 Product Benchmarking
15.12.5 Strategic Outlook
15.13 AES Energy Storage, LLC
15.13.1 Company Snapshot
15.13.2 Company Overview
15.13.3 Financial Analysis
15.13.3.1 Net Revenue, 2019-2023
15.13.4 Product Benchmarking
15.13.5 Strategic Outlook
15.14 NEC Corporation
15.14.1 Company Snapshot
15.14.2 Company Overview
15.14.3 Financial Analysis
15.14.3.1 Net Revenue ,2019-2023
15.14.3.2 R&D, 2019-2023
15.14.3.3 Business Segment Revenue Share, 2022 (%)
15.14.4 Product Benchmarking
15.14.5 Strategic Outlook
15.15 Alevo Group S.A.
15.15.1 Company Snapshot
15.15.2 Company Overview
15.15.3 Product Benchmarking
15.15.4 Strategic Outlook
15.16 Leclanché S.A.
15.16.1 Company Snapshot
15.16.2 Company Overview
15.16.3 Product Benchmarking
15.16.4 Strategic Outlook
15.17 Greensmith Energy Management Systems
15.17.1 Company Snapshot
15.17.2 Company Overview
15.17.3 Product Benchmarking
15.17.4 Strategic Outlook
16 Conclusion and Recommendations
16.1 Concluding Remarks from Visiongain
16.2 Recommendations for Market Players
ページTOPに戻る
List of Tables/Graphs
List of Tables
Table 1 Next Generation Energy Storage Technologies (EST) Market Snapshot, 2024 & 2034 (US$ Billion, CAGR %)
Table 2 Global Next Generation Energy Storage Technologies (EST) Market by Region, 2024-2034 (US$ Bn, AGR (%), CAGR (%)) (V-Shaped Recovery Scenario)
Table 3 Global Next Generation Energy Storage Technologies (EST) Market by Region, 2024-2034 (US$ Bn, AGR (%), CAGR (%)) (U-Shaped Recovery Scenario)
Table 4 Global Next Generation Energy Storage Technologies (EST) Market by Region, 2024-2034 (US$ Bn, AGR (%), CAGR (%)) (W-Shaped Recovery Scenario)
Table 5 Global Next Generation Energy Storage Technologies (EST) Market by Region, 2024-2034 (US$ Bn, AGR (%), CAGR (%)) (L-Shaped Recovery Scenario)
Table 6 Global Next Generation Energy Storage Technologies (EST) Market by Hydrogen, 2024-2034 (US$ Bn, AGR (%), CAGR (%))
Table 7 Hydrogen Fuel Cells Market by Region, 2024-2034 (US$ Bn, AGR (%), CAGR (%))
Table 8 Hydrogen Compression and Storage Market by Region, 2024-2034 (US$ Bn, AGR (%), CAGR (%))
Table 9 Global Next Generation Energy Storage Technologies (EST) Market by Mechanical, 2024-2034 (US$ Bn, AGR (%), CAGR (%))
Table 10 Pumped Hydro Storage Market by Region, 2024-2034 (US$ Bn, AGR (%), CAGR (%))
Table 11 Compressed Air Energy Storage (CAES) Market by Region, 2024-2034 (US$ Bn, AGR (%), CAGR (%))
Table 12 Flywheel Energy Storage Market by Region, 2024-2034 (US$ Bn, AGR (%), CAGR (%))
Table 13 Global Next Generation Energy Storage Technologies (EST) Market by Battery Type, 2024-2034 (US$ Bn, AGR (%), CAGR (%))
Table 14 Lithium-ion Batteries Market by Region, 2024-2034 (US$ Bn, AGR (%), CAGR (%))
Table 15 Sodium-Sulphur Batteries Market by Region, 2024-2034 (US$ Bn, AGR (%), CAGR (%))
Table 16 Flow Batteries Market by Region, 2024-2034 (US$ Bn, AGR (%), CAGR (%))
Table 17 Advanced Lead-Acid Batteries Market by Region, 2024-2034 (US$ Bn, AGR (%), CAGR (%))
Table 18 Global Next Generation Energy Storage Technologies (EST) Market by Application, 2024-2034 (US$ Bn, AGR (%), CAGR (%))
Table 19 Electric Vehicles (EVs) Market by Region, 2024-2034 (US$ Bn, AGR (%), CAGR (%))
Table 20 Residential Energy Storage Market by Region, 2024-2034 (US$ Bn, AGR (%), CAGR (%))
Table 21 Commercial and Industrial (C&I) Market by Region, 2024-2034 (US$ Bn, AGR (%), CAGR (%))
Table 22 Utility-Scale Storage Market by Region, 2024-2034 (US$ Bn, AGR (%), CAGR (%))
Table 23 Other Applications Market by Region, 2024-2034 (US$ Bn, AGR (%), CAGR (%))
Table 24 Global Next Generation Energy Storage Technologies (EST) Market by Technology Type, 2024-2034 (US$ Bn, AGR (%), CAGR (%))
Table 25 Battery Energy Storage Market by Region, 2024-2034 (US$ Bn, AGR (%), CAGR (%))
Table 26 Mechanical Energy Storage Market by Region, 2024-2034 (US$ Bn, AGR (%), CAGR (%))
Table 27 Thermal Energy Storage Market by Region, 2024-2034 (US$ Bn, AGR (%), CAGR (%))
Table 28 Hydrogen Energy Storage Market by Region, 2024-2034 (US$ Bn, AGR (%), CAGR (%))
Table 29 Advanced Capacitors Market by Region, 2024-2034 (US$ Bn, AGR (%), CAGR (%))
Table 30 Other Technology Type Market by Region, 2024-2034 (US$ Bn, AGR (%), CAGR (%))
Table 31 Global Next Generation Energy Storage Technologies (EST) Market by Region, 2024-2034 (US$ Bn, AGR (%), CAGR (%))
Table 32 North America Next Generation Energy Storage Technologies (EST) Market by Value, 2024-2034 (US$ Bn, AGR (%), CAGR (%))
Table 33 North America Next Generation Energy Storage Technologies (EST) Market by Country, 2024-2034 (US$ Bn, AGR (%), CAGR (%))
Table 34 North America Next Generation Energy Storage Technologies (EST) Market by Hydrogen, 2024-2034 (US$ Bn, AGR (%), CAGR (%))
Table 35 North America Next Generation Energy Storage Technologies (EST) Market by Mechanical, 2024-2034 (US$ Bn, AGR (%), CAGR (%))
Table 36 North America Next Generation Energy Storage Technologies (EST) Market by Battery Type, 2024-2034 (US$ Bn, AGR (%), CAGR (%))
Table 37 North America Next Generation Energy Storage Technologies (EST) Market by Application, 2024-2034 (US$ Bn, AGR (%), CAGR (%))
Table 38 North America Next Generation Energy Storage Technologies (EST) Market by Technology Type, 2024-2034 (US$ Bn, AGR (%), CAGR (%))
Table 39 US Next Generation Energy Storage Technologies (EST) Market by Value, 2024-2034 (US$ Bn, AGR (%), CAGR (%))
Table 40 Canada Next Generation Energy Storage Technologies (EST) Market by Value, 2024-2034 (US$ Bn, AGR (%), CAGR (%))
Table 41 Europe Next Generation Energy Storage Technologies (EST) Market by Value, 2024-2034 (US$ Bn, AGR (%), CAGR (%))
Table 42 Europe Next Generation Energy Storage Technologies (EST) Market by Country, 2024-2034 (US$ Bn, AGR (%), CAGR (%))
Table 43 Europe Next Generation Energy Storage Technologies (EST) Market by Hydrogen, 2024-2034 (US$ Bn, AGR (%), CAGR (%))
Table 44 Europe Next Generation Energy Storage Technologies (EST) Market by Mechanical, 2024-2034 (US$ Bn, AGR (%), CAGR (%))
Table 45 Europe Next Generation Energy Storage Technologies (EST) Market by Battery Type, 2024-2034 (US$ Bn, AGR (%), CAGR (%))
Table 46 Europe Next Generation Energy Storage Technologies (EST) Market by Application, 2024-2034 (US$ Bn, AGR (%), CAGR (%))
Table 47 Europe Next Generation Energy Storage Technologies (EST) Market by Technology Type, 2024-2034 (US$ Bn, AGR (%), CAGR (%))
Table 48 Germany Next Generation Energy Storage Technologies (EST) Market by Value, 2024-2034 (US$ Bn, AGR (%), CAGR (%))
Table 49 UK Next Generation Energy Storage Technologies (EST) Market by Value, 2024-2034 (US$ Bn, AGR (%), CAGR (%))
Table 50 France Next Generation Energy Storage Technologies (EST) Market by Value, 2024-2034 (US$ Bn, AGR (%), CAGR (%))
Table 51 Italy Next Generation Energy Storage Technologies (EST) Market by Value, 2024-2034 (US$ Bn, AGR (%), CAGR (%))
Table 52 Spain Next Generation Energy Storage Technologies (EST) Market by Value, 2024-2034 (US$ Bn, AGR (%), CAGR (%))
Table 53 Rest of Europe Next Generation Energy Storage Technologies (EST) Market by Value, 2024-2034 (US$ Bn, AGR (%), CAGR (%))
Table 54 Asia-Pacific Next Generation Energy Storage Technologies (EST) Market by Value, 2024-2034 (US$ Bn, AGR (%), CAGR (%))
Table 55 Asia-Pacific Next Generation Energy Storage Technologies (EST) Market by Country, 2024-2034 (US$ Bn, AGR (%), CAGR (%))
Table 56 Asia-Pacific Next Generation Energy Storage Technologies (EST) Market by Hydrogen, 2024-2034 (US$ Bn, AGR (%), CAGR (%))
Table 57 Asia-Pacific Next Generation Energy Storage Technologies (EST) Market by Mechanical, 2024-2034 (US$ Bn, AGR (%), CAGR (%))
Table 58 Asia-Pacific Next Generation Energy Storage Technologies (EST) Market by Battery Type, 2024-2034 (US$ Bn, AGR (%), CAGR (%))
Table 59 Asia-Pacific Next Generation Energy Storage Technologies (EST) Market by Application, 2024-2034 (US$ Bn, AGR (%), CAGR (%))
Table 60 Asia-Pacific Next Generation Energy Storage Technologies (EST) Market by Technology Type, 2024-2034 (US$ Bn, AGR (%), CAGR (%))
Table 61 China Next Generation Energy Storage Technologies (EST) Market by Value, 2024-2034 (US$ Bn, AGR (%), CAGR (%))
Table 62 India Next Generation Energy Storage Technologies (EST) Market by Value, 2024-2034 (US$ Bn, AGR (%), CAGR (%))
Table 63 Japan Next Generation Energy Storage Technologies (EST) Market by Value, 2024-2034 (US$ Bn, AGR (%), CAGR (%))
Table 64 South Korea Next Generation Energy Storage Technologies (EST) Market by Value, 2024-2034 (US$ Bn, AGR (%), CAGR (%))
Table 65 Australia Next Generation Energy Storage Technologies (EST) Market by Value, 2024-2034 (US$ Bn, AGR (%), CAGR (%))
Table 66 Rest of Asia-Pacific Next Generation Energy Storage Technologies (EST) Market by Value, 2024-2034 (US$ Bn, AGR (%), CAGR (%))
Table 67 Middle East & Africa Next Generation Energy Storage Technologies (EST) Market by Value, 2024-2034 (US$ Bn, AGR (%), CAGR (%))
Table 68 Middle East & Africa Next Generation Energy Storage Technologies (EST) Market by Country, 2024-2034 (US$ Bn, AGR (%), CAGR (%))
Table 69 Middle East & Africa Next Generation Energy Storage Technologies (EST) Market by Hydrogen, 2024-2034 (US$ Bn, AGR (%), CAGR (%))
Table 70 Middle East & Africa Next Generation Energy Storage Technologies (EST) Market by Mechanical, 2024-2034 (US$ Bn, AGR (%), CAGR (%))
Table 71 Middle East & Africa Next Generation Energy Storage Technologies (EST) Market by Battery Type, 2024-2034 (US$ Bn, AGR (%), CAGR (%))
Table 72 Middle East & Africa Next Generation Energy Storage Technologies (EST) Market by Application, 2024-2034 (US$ Bn, AGR (%), CAGR (%))
Table 73 Middle East & Africa Next Generation Energy Storage Technologies (EST) Market by Technology Type, 2024-2034 (US$ Bn, AGR (%), CAGR (%))
Table 74 GCC Next Generation Energy Storage Technologies (EST) Market by Value, 2024-2034 (US$ Bn, AGR (%), CAGR (%))
Table 75 South Africa Next Generation Energy Storage Technologies (EST) Market by Value, 2024-2034 (US$ Bn, AGR (%), CAGR (%))
Table 76 Rest of Middle East & Africa Next Generation Energy Storage Technologies (EST) Market by Value, 2024-2034 (US$ Bn, AGR (%), CAGR (%))
Table 77 Latin America Next Generation Energy Storage Technologies (EST) Market by Value, 2024-2034 (US$ Bn, AGR (%), CAGR (%))
Table 78 Latin America Next Generation Energy Storage Technologies (EST) Market by Country, 2024-2034 (US$ Bn, AGR (%), CAGR (%))
Table 79 Latin America Next Generation Energy Storage Technologies (EST) Market by Hydrogen, 2024-2034 (US$ Bn, AGR (%), CAGR (%))
Table 80 Latin America Next Generation Energy Storage Technologies (EST) Market by Mechanical, 2024-2034 (US$ Bn, AGR (%), CAGR (%))
Table 81 Latin America Next Generation Energy Storage Technologies (EST) Market by Battery Type, 2024-2034 (US$ Bn, AGR (%), CAGR (%))
Table 82 Latin America Next Generation Energy Storage Technologies (EST) Market by Application, 2024-2034 (US$ Bn, AGR (%), CAGR (%))
Table 83 Latin America Next Generation Energy Storage Technologies (EST) Market by Technology Type, 2024-2034 (US$ Bn, AGR (%), CAGR (%))
Table 84 Brazil Next Generation Energy Storage Technologies (EST) Market by Value, 2024-2034 (US$ Bn, AGR (%), CAGR (%))
Table 85 Mexico Next Generation Energy Storage Technologies (EST) Market by Value, 2024-2034 (US$ Bn, AGR (%), CAGR (%))
Table 86 Rest of Latin America Next Generation Energy Storage Technologies (EST) Market by Value, 2024-2034 (US$ Bn, AGR (%), CAGR (%))
Table 87 Strategic Outlook – Recent Development
Table 88 Siemens AG: Key Details, (CEO, HQ, Revenue, Founded, No. of Employees, Company Type, Website, Business Segment)
Table 89 Siemens AG: Product Benchmarking
Table 90 Siemens AG: Strategic Outlook
Table 91 General Electric Company: Key Details, (CEO, HQ, Revenue, Founded, No. of Employees, Company Type, Website, Business Segment)
Table 92 General Electric Company: Product Benchmarking
Table 93 General Electric Company: Strategic Outlook
Table 94 Panasonic Holdings Corporation: Key Details, (CEO, HQ, Revenue, Founded, No. of Employees, Company Type, Website, Business Segment)
Table 95 Panasonic Holdings Corporation: Product Benchmarking
Table 96 Panasonic Holdings Corporation: Strategic Outlook
Table 97 LG Chem Ltd.: Key Details, (CEO, HQ, Revenue, Founded, No. of Employees, Company Type, Website, Business Segment)
Table 98 LG Chem Ltd.: Product Benchmarking
Table 99 LG Chem Ltd.: Strategic Outlook
Table 100 BYD Co. Ltd: Key Details, (CEO, HQ, Revenue, Founded, No. of Employees, Company Type, Website, Business Segment)
Table 101 BYD Co. Ltd: Product Benchmarking
Table 102 BYD Co. Ltd: Strategic Outlook
Table 103 Samsung SDI Co. Ltd.: Key Details, (CEO, HQ, Revenue, Founded, No. of Employees, Company Type, Website, Business Segment)
Table 104 Samsung SDI Co. Ltd.: Product Benchmarking
Table 105 Samsung SDI Co. Ltd.: Strategic Outlook
Table 106 Saft Groupe SAS: Key Details, (CEO, HQ, Revenue, Founded, No. of Employees, Company Type, Website, Business Segment)
Table 107 Saft Groupe SAS: Product Benchmarking
Table 108 Saft Groupe SAS: Strategic Outlook
Table 109 Hitachi Chemical Co., Ltd.: Key Details, (CEO, HQ, Revenue, Founded, No. of Employees, Company Type, Website, Business Segment)
Table 110 Hitachi Chemical Co., Ltd.: Product Benchmarking
Table 111 Hitachi Chemical Co., Ltd.: Strategic Outlook
Table 112 Maxwell Technologies Inc: Key Details, (CEO, HQ, Revenue, Founded, No. of Employees, Company Type, Website, Business Segment)
Table 113 Maxwell Technologies Inc: Product Benchmarking
Table 114 Fluence Energy: Key Details, (CEO, HQ, Revenue, Founded, No. of Employees, Company Type, Website, Business Segment)
Table 115 Fluence Energy: Product Benchmarking
Table 116 Fluence Energy: Strategic Outlook
Table 117 AES Energy Storage, LLC: Key Details, (CEO, HQ, Revenue, Founded, No. of Employees, Company Type, Website, Business Segment)
Table 118 AES Energy Storage, LLC: Product Benchmarking
Table 119 AES Energy Storage, LLC: Strategic Outlook
Table 120 NEC Corporation: Key Details, (CEO, HQ, Revenue, Founded, No. of Employees, Company Type, Website, Business Segment)
Table 121 NEC Corporation: Product Benchmarking
Table 122 NEC Corporation: Strategic Outlook
Table 123 Alevo Group S.A.: Key Details, (CEO, HQ, Revenue, Founded, No. of Employees, Company Type, Website, Business Segment)
Table 124 Alevo Group S.A.: Product Benchmarking
Table 125 Alevo Group S.A.: Strategic Outlook
Table 126 Leclanché S.A.: Key Details, (CEO, HQ, Revenue, Founded, No. of Employees, Company Type, Website, Business Segment)
Table 127 Leclanché S.A.: Product Benchmarking
Table 128 Leclanché S.A.: Strategic Outlook
Table 129 Greensmith Energy Management Systems: Key Details, (CEO, HQ, Revenue, Founded, No. of Employees, Company Type, Website, Business Segment)
Table 130 Greensmith Energy Management Systems: Product Benchmarking
List of Figures
Figure 1 Next Generation Energy Storage Technologies (EST) Market Segmentation
Figure 2 Next Generation Energy Storage Technologies (EST) Market by Hydrogen: Market Attractiveness Index
Figure 3 Next Generation Energy Storage Technologies (EST) Market by Mechanical: Market Attractiveness Index
Figure 4 Next Generation Energy Storage Technologies (EST) Market by Battery: Market Attractiveness Index
Figure 5 Next Generation Energy Storage Technologies (EST) Market by Application: Market Attractiveness Index
Figure 6 Next Generation Energy Storage Technologies (EST) Market by Technology Type: Market Attractiveness Index
Figure 7 Next Generation Energy Storage Technologies (EST) Market Attractiveness Index by Region
Figure 8 Next Generation Energy Storage Technologies (EST) Market: Market Dynamics
Figure 9 Renewable Energy Production, 2020-2023,
Figure 10 Next Generation Energy Storage Technologies (EST) Market: Porter’s Five Forces Analysis
Figure 11 Global Next Generation Energy Storage Technologies (EST) Market Share Forecast by COVID, 2024-2034 (%)
Figure 12 Global Next Generation Energy Storage Technologies (EST) Market by Region, 2024-2034 (US$ Bn, AGR (%)) (V-Shaped Recovery Scenario)
Figure 13 Global Next Generation Energy Storage Technologies (EST) Market by Region, 2024-2034 (US$ Bn, AGR (%)) (U-Shaped Recovery Scenario)
Figure 14 Global Next Generation Energy Storage Technologies (EST) Market by Region, 2024-2034 (US$ Bn, AGR (%)) (W-Shaped Recovery Scenario)
Figure 15 Global Next Generation Energy Storage Technologies (EST) Market by Region, 2024-2034 (US$ Bn, AGR (%)) (L-Shaped Recovery Scenario)
Figure 16 Next Generation Energy Storage Technologies (EST) Market: PEST Analysis
Figure 17 Next Generation Energy Storage Technologies (EST) Market by Hydrogen: Market Attractiveness Index
Figure 18 Global Next Generation Energy Storage Technologies (EST) Market by Hydrogen, 2024-2034 (US$ Bn, AGR (%))
Figure 19 Next Generation Energy Storage Technologies (EST) Market Share Forecast by Hydrogen, 2024, 2029, 2034 (%)
Figure 20 Hydrogen Fuel Cells Market by Region, 2024-2034 (US$ Bn, AGR (%))
Figure 21 Hydrogen Fuel Cells Market Share Forecast by Region, 2024 & 2034 (%)
Figure 22 Hydrogen Compression and Storage Market by Region, 2024-2034 (US$ Bn, AGR (%))
Figure 23 Hydrogen Compression and Storage Market Share Forecast by Region, 2024 & 2034 (%)
Figure 24 Next Generation Energy Storage Technologies (EST) Market by Mechanical: Market Attractiveness Index
Figure 25 Global Next Generation Energy Storage Technologies (EST) Market by Mechanical, 2024-2034 (US$ Bn, AGR (%))
Figure 26 Next Generation Energy Storage Technologies (EST) Market Share Forecast by Mechanical, 2024, 2029, 2034 (%)
Figure 27 Pumped Hydro Storage Market by Region, 2024-2034 (US$ Bn, AGR (%))
Figure 28 Pumped Hydro Storage Market Share Forecast by Region, 2024 & 2034 (%)
Figure 29 Compressed Air Energy Storage (CAES) Market by Region, 2024-2034 (US$ Bn, AGR (%))
Figure 30 Compressed Air Energy Storage (CAES) Market Share Forecast by Region, 2024 & 2034 (%)
Figure 31 Flywheel Energy Storage Market by Region, 2024-2034 (US$ Bn, AGR (%))
Figure 32 Flywheel Energy Storage Market Share Forecast by Region, 2024 & 2034 (%)
Figure 33 Next Generation Energy Storage Technologies (EST) Market by Battery: Market Attractiveness Index
Figure 34 Global Next Generation Energy Storage Technologies (EST) Market by Battery Type, 2024-2034 (US$ Bn, AGR (%))
Figure 35 Next Generation Energy Storage Technologies (EST) Market Share Forecast by Battery, 2024, 2029, 2034 (%)
Figure 36 Lithium-ion Batteries Market by Region, 2024-2034 (US$ Bn, AGR (%))
Figure 37 Lithium-ion Batteries Market Share Forecast by Region, 2024 & 2034 (%)
Figure 38 Sodium-Sulfur Batteries Market by Region, 2024-2034 (US$ Bn, AGR (%))
Figure 39 Sodium-Sulfur Batteries Market Share Forecast by Region, 2024 & 2034 (%)
Figure 40 Flow Batteries Market by Region, 2024-2034 (US$ Bn, AGR (%))
Figure 41 Flow Batteries Market Share Forecast by Region, 2024 & 2034 (%)
Figure 42 Advanced Lead-Acid Batteries Market by Region, 2024-2034 (US$ Bn, AGR (%))
Figure 43 Advanced Lead-Acid Batteries Market Share Forecast by Region, 2024 & 2034 (%)
Figure 44 Next Generation Energy Storage Technologies (EST) Market by Application: Market Attractiveness Index
Figure 45 Global Next Generation Energy Storage Technologies (EST) Market by Application, 2024-2034 (US$ Bn, AGR (%))
Figure 46 Next Generation Energy Storage Technologies (EST) Market Share Forecast by Application, 2024, 2029, 2034 (%)
Figure 47 Electric Vehicles (EVs) Market by Region, 2024-2034 (US$ Bn, AGR (%))
Figure 48 Electric Vehicles (EVs) Market Share Forecast by Region, 2024 & 2034 (%)
Figure 49 Residential Energy Storage Market by Region, 2024-2034 (US$ Bn, AGR (%))
Figure 50 Residential Energy Storage Market Share Forecast by Region, 2024 & 2034 (%)
Figure 51 Commercial and Industrial (C&I) Market by Region, 2024-2034 (US$ Bn, AGR (%))
Figure 52 Commercial and Industrial (C&I) Market Share Forecast by Region, 2024 & 2034 (%)
Figure 53 Utility-Scale Storage Market by Region, 2024-2034 (US$ Bn, AGR (%))
Figure 54 Utility-Scale Storage Market Share Forecast by Region, 2024 & 2034 (%)
Figure 55 Other Applications Market by Region, 2024-2034 (US$ Bn, AGR (%))
Figure 56 Other Applications Market Share Forecast by Region, 2024 & 2034 (%)
Figure 57 Next Generation Energy Storage Technologies (EST) Market by Technology Type: Market Attractiveness Index
Figure 58 Global Next Generation Energy Storage Technologies (EST) Market by Technology Type, 2024-2034 (US$ Bn, AGR (%))
Figure 59 Next Generation Energy Storage Technologies (EST) Market Share Forecast by Technology Type, 2024, 2029, 2034 (%)
Figure 60 Battery Energy Storage Market by Region, 2024-2034 (US$ Bn, AGR (%))
Figure 61 Battery Energy Storage Market Share Forecast by Region, 2024 & 2034 (%)
Figure 62 Mechanical Energy Storage Market by Region, 2024-2034 (US$ Bn, AGR (%))
Figure 63 Mechanical Energy Storage Market Share Forecast by Region, 2024 & 2034 (%)
Figure 64 Thermal Energy Storage Market by Region, 2024-2034 (US$ Bn, AGR (%))
Figure 65 Thermal Energy Storage Market Share Forecast by Region, 2024 & 2034 (%)
Figure 66 Hydrogen Energy Storage Market by Region, 2024-2034 (US$ Bn, AGR (%))
Figure 67 Hydrogen Energy Storage Market Share Forecast by Region, 2024 & 2034 (%)
Figure 68 Advanced Capacitors Market by Region, 2024-2034 (US$ Bn, AGR (%))
Figure 69 Advanced Capacitors Market Share Forecast by Region, 2024 & 2034 (%)
Figure 70 Other Technology Type Market by Region, 2024-2034 (US$ Bn, AGR (%))
Figure 71 Other Technology Type Market Share Forecast by Region, 2024 & 2034 (%)
Figure 72 Next Generation Energy Storage Technologies (EST) Market Forecast by Region 2024 and 2034 (Revenue, CAGR%)
Figure 73 Next Generation Energy Storage Technologies (EST) Market Share Forecast by Region 2024, 2029, 2034 (%)
Figure 74 Global Next Generation Energy Storage Technologies (EST) Market by Region, 2024-2034 (US$ Bn, AGR (%))
Figure 75 North America Next Generation Energy Storage Technologies (EST) Market Attractiveness Index
Figure 76 North America Next Generation Energy Storage Technologies (EST) Market by Region, 2024, 2029 & 2034 (US$ Billion)
Figure 77 North America Next Generation Energy Storage Technologies (EST) Market by Value, 2024-2034 (US$ Bn, AGR (%))
Figure 78 North America Next Generation Energy Storage Technologies (EST) Market by Country, 2024-2034 (US$ Bn, AGR (%))
Figure 79 North America Next Generation Energy Storage Technologies (EST) Market Share Forecast by Country, 2024 & 2034 (%)
Figure 80 North America Next Generation Energy Storage Technologies (EST) Market by Hydrogen, 2024-2034 (US$ Bn, AGR (%))
Figure 81 North America Next Generation Energy Storage Technologies (EST) Market Share Forecast Hydrogen, 2024 & 2034 (%)
Figure 82 North America Next Generation Energy Storage Technologies (EST) Market by Mechanical, 2024-2034 (US$ Bn, AGR (%))
Figure 83 North America Next Generation Energy Storage Technologies (EST) Market Share Forecast by Mechanical, 2024 & 2034 (%)
Figure 84 North America Next Generation Energy Storage Technologies (EST) Market by Battery Type, 2024-2034 (US$ Bn, AGR (%))
Figure 85 North America Next Generation Energy Storage Technologies (EST) Market Share Forecast by Battery, 2024 & 2034 (%)
Figure 86 North America Next Generation Energy Storage Technologies (EST) Market by Application, 2024-2034 (US$ Bn, AGR (%))
Figure 87 North America Next Generation Energy Storage Technologies (EST) Market Share Forecast by Application, 2024 & 2034 (%)
Figure 88 North America Next Generation Energy Storage Technologies (EST) Market by Technology Type, 2024-2034 (US$ Bn, AGR (%))
Figure 89 North America Next Generation Energy Storage Technologies (EST) Market Share Forecast by Technology Type, 2024 & 2034 (%)
Figure 90 US Next Generation Energy Storage Technologies (EST) Market by Value, 2024-2034 (US$ Bn, AGR (%))
Figure 91 Canada Next Generation Energy Storage Technologies (EST) Market by Value, 2024-2034 (US$ Bn, AGR (%))
Figure 92 Europe Next Generation Energy Storage Technologies (EST) Market Attractiveness Index
Figure 93 Europe Next Generation Energy Storage Technologies (EST) Market by Region, 2024, 2029 & 2034 (US$ Billion)
Figure 94 Europe Next Generation Energy Storage Technologies (EST) Market by Value, 2024-2034 (US$ Bn, AGR (%))
Figure 95 Europe Next Generation Energy Storage Technologies (EST) Market by Country, 2024-2034 (US$ Bn, AGR (%))
Figure 96 Europe Next Generation Energy Storage Technologies (EST) Market Share Forecast by Country, 2024 & 2034 (%)
Figure 97 Europe Next Generation Energy Storage Technologies (EST) Market by Hydrogen, 2024-2034 (US$ Bn, AGR (%))
Figure 98 Europe Next Generation Energy Storage Technologies (EST) Market Share Forecast Hydrogen, 2024 & 2034 (%)
Figure 99 Europe Next Generation Energy Storage Technologies (EST) Market by Mechanical, 2024-2034 (US$ Bn, AGR (%))
Figure 100 Europe Next Generation Energy Storage Technologies (EST) Market Share Forecast by Mechanical, 2024 & 2034 (%)
Figure 101 Europe Next Generation Energy Storage Technologies (EST) Market by Battery Type, 2024-2034 (US$ Bn, AGR (%))
Figure 102 Europe Next Generation Energy Storage Technologies (EST) Market Share Forecast by Battery, 2024 & 2034 (%)
Figure 103 Europe Next Generation Energy Storage Technologies (EST) Market by Application, 2024-2034 (US$ Bn, AGR (%))
Figure 104 Europe Next Generation Energy Storage Technologies (EST) Market Share Forecast by Application, 2024 & 2034 (%)
Figure 105 Europe Next Generation Energy Storage Technologies (EST) Market by Technology Type, 2024-2034 (US$ Bn, AGR (%))
Figure 106 Europe Next Generation Energy Storage Technologies (EST) Market Share Forecast by Technology Type, 2024 & 2034 (%)
Figure 107 Germany Next Generation Energy Storage Technologies (EST) Market by Value, 2024-2034 (US$ Bn, AGR (%))
Figure 108 UK Next Generation Energy Storage Technologies (EST) Market by Value, 2024-2034 (US$ Bn, AGR (%))
Figure 109 France Next Generation Energy Storage Technologies (EST) Market by Value, 2024-2034 (US$ Bn, AGR (%))
Figure 110 Italy Next Generation Energy Storage Technologies (EST) Market by Value, 2024-2034 (US$ Bn, AGR (%))
Figure 111 Spain Next Generation Energy Storage Technologies (EST) Market by Value, 2024-2034 (US$ Bn, AGR (%))
Figure 112 Rest of Europe Next Generation Energy Storage Technologies (EST) Market by Value, 2024-2034 (US$ Bn, AGR (%))
Figure 113 Asia-Pacific Next Generation Energy Storage Technologies (EST) Market Attractiveness Index
Figure 114 Asia-Pacific Next Generation Energy Storage Technologies (EST) Market by Region, 2024, 2029 & 2034 (US$ Billion)
Figure 115 Asia-Pacific Next Generation Energy Storage Technologies (EST) Market by Value, 2024-2034 (US$ Bn, AGR (%))
Figure 116 Asia-Pacific Next Generation Energy Storage Technologies (EST) Market by Country, 2024-2034 (US$ Bn, AGR (%))
Figure 117 Asia-Pacific Next Generation Energy Storage Technologies (EST) Market Share Forecast by Country, 2024 & 2034 (%)
Figure 118 Asia-Pacific Next Generation Energy Storage Technologies (EST) Market by Hydrogen, 2024-2034 (US$ Bn, AGR (%))
Figure 119 Asia-Pacific Next Generation Energy Storage Technologies (EST) Market Share Forecast Hydrogen, 2024 & 2034 (%)
Figure 120 Asia-Pacific Next Generation Energy Storage Technologies (EST) Market by Mechanical, 2024-2034 (US$ Bn, AGR (%))
Figure 121 Asia-Pacific Next Generation Energy Storage Technologies (EST) Market Share Forecast by Mechanical, 2024 & 2034 (%)
Figure 122 Asia-Pacific Next Generation Energy Storage Technologies (EST) Market by Battery Type, 2024-2034 (US$ Bn, AGR (%))
Figure 123 Asia-Pacific Next Generation Energy Storage Technologies (EST) Market Share Forecast by Battery Type, 2024 & 2034 (%)
Figure 124 Asia-Pacific Next Generation Energy Storage Technologies (EST) Market by Application, 2024-2034 (US$ Bn, AGR (%))
Figure 125 Asia-Pacific Next Generation Energy Storage Technologies (EST) Market Share Forecast by Application, 2024 & 2034 (%)
Figure 126 Asia-Pacific Next Generation Energy Storage Technologies (EST) Market by Technology Type, 2024-2034 (US$ Bn, AGR (%))
Figure 127 Asia-Pacific Next Generation Energy Storage Technologies (EST) Market Share Forecast by Technology Type, 2024 & 2034 (%)
Figure 128 China Next Generation Energy Storage Technologies (EST) Market by Value, 2024-2034 (US$ Bn, AGR (%))
Figure 129 India Next Generation Energy Storage Technologies (EST) Market by Value, 2024-2034 (US$ Bn, AGR (%))
Figure 130 Japan Next Generation Energy Storage Technologies (EST) Market by Value, 2024-2034 (US$ Bn, AGR (%))
Figure 131 South Korea Next Generation Energy Storage Technologies (EST) Market by Value, 2024-2034 (US$ Bn, AGR (%))
Figure 132 Australia Next Generation Energy Storage Technologies (EST) Market by Value, 2024-2034 (US$ Bn, AGR (%))
Figure 133 Rest of Asia-Pacific Next Generation Energy Storage Technologies (EST) Market by Value, 2024-2034 (US$ Bn, AGR (%))
Figure 134 Middle East and Africa Next Generation Energy Storage Technologies (EST) Market Attractiveness Index
Figure 135 Middle East and Africa Next Generation Energy Storage Technologies (EST) Market by Region, 2024, 2029 & 2034 (US$ Billion)
Figure 136 Middle East & Africa Next Generation Energy Storage Technologies (EST) Market by Value, 2024-2034 (US$ Bn, AGR (%))
Figure 137 Middle East & Africa Next Generation Energy Storage Technologies (EST) Market by Country, 2024-2034 (US$ Bn, AGR (%))
Figure 138 Middle East and Africa Next Generation Energy Storage Technologies (EST) Market Share Forecast by Country, 2024 & 2034 (%)
Figure 139 Middle East & Africa Next Generation Energy Storage Technologies (EST) Market by Hydrogen, 2024-2034 (US$ Bn, AGR (%))
Figure 140 Middle East and Africa Next Generation Energy Storage Technologies (EST) Market Share Forecast Hydrogen, 2024 & 2034 (%)
Figure 141 Middle East & Africa Next Generation Energy Storage Technologies (EST) Market by Mechanical, 2024-2034 (US$ Bn, AGR (%))
Figure 142 Middle East and Africa Next Generation Energy Storage Technologies (EST) Market Share Forecast by Mechanical, 2024 & 2034 (%)
Figure 143 Middle East & Africa Next Generation Energy Storage Technologies (EST) Market by Battery Type, 2024-2034 (US$ Bn, AGR (%))
Figure 144 Middle East and Africa Next Generation Energy Storage Technologies (EST) Market Share Forecast by Battery, 2024 & 2034 (%)
Figure 145 Middle East & Africa Next Generation Energy Storage Technologies (EST) Market by Application, 2024-2034 (US$ Bn, AGR (%))
Figure 146 Middle East and Africa Next Generation Energy Storage Technologies (EST) Market Share Forecast by Application, 2024 & 2034 (%)
Figure 147 Middle East & Africa Next Generation Energy Storage Technologies (EST) Market by Technology Type, 2024-2034 (US$ Bn, AGR (%))
Figure 148 Middle East and Africa Next Generation Energy Storage Technologies (EST) Market Share Forecast by Technology Type, 2024 & 2034 (%)
Figure 149 GCC Next Generation Energy Storage Technologies (EST) Market by Value, 2024-2034 (US$ Bn, AGR (%))
Figure 150 South Africa Next Generation Energy Storage Technologies (EST) Market by Value, 2024-2034 (US$ Bn, AGR (%))
Figure 151 Rest of Middle East & Africa Next Generation Energy Storage Technologies (EST) Market by Value, 2024-2034 (US$ Bn, AGR (%))
Figure 152 Latin America Next Generation Energy Storage Technologies (EST) Market Attractiveness Index
Figure 153 Latin America Next Generation Energy Storage Technologies (EST) Market by Region, 2024, 2029 & 2034 (US$ Billion)
Figure 154 Latin America Next Generation Energy Storage Technologies (EST) Market by Value, 2024-2034 (US$ Bn, AGR (%))
Figure 155 Latin America Next Generation Energy Storage Technologies (EST) Market by Country, 2024-2034 (US$ Bn, AGR (%))
Figure 156 Latin America Next Generation Energy Storage Technologies (EST) Market Share Forecast by Country, 2024 & 2034 (%)
Figure 157 Latin America Next Generation Energy Storage Technologies (EST) Market by Hydrogen, 2024-2034 (US$ Bn, AGR (%))
Figure 158 Latin America Next Generation Energy Storage Technologies (EST) Market Share Forecast Hydrogen, 2024 & 2034 (%)
Figure 159 Latin America Next Generation Energy Storage Technologies (EST) Market by Mechanical, 2024-2034 (US$ Bn, AGR (%))
Figure 160 Latin America Next Generation Energy Storage Technologies (EST) Market Share Forecast by Mechanical, 2024 & 2034 (%)
Figure 161 Latin America Next Generation Energy Storage Technologies (EST) Market by Battery Type, 2024-2034 (US$ Bn, AGR (%))
Figure 162 Latin America Next Generation Energy Storage Technologies (EST) Market Share Forecast by Battery, 2024 & 2034 (%)
Figure 163 Latin America Next Generation Energy Storage Technologies (EST) Market by Application, 2024-2034 (US$ Bn, AGR (%))
Figure 164 Latin America Next Generation Energy Storage Technologies (EST) Market Share Forecast by Application, 2024 & 2034 (%)
Figure 165 Latin America Next Generation Energy Storage Technologies (EST) Market by Technology Type, 2024-2034 (US$ Bn, AGR (%))
Figure 166 Latin America Next Generation Energy Storage Technologies (EST) Market Share Forecast by Technology Type, 2024 & 2034 (%)
Figure 167 Brazil Next Generation Energy Storage Technologies (EST) Market by Value, 2024-2034 (US$ Bn, AGR (%))
Figure 168 Mexico Next Generation Energy Storage Technologies (EST) Market by Value, 2024-2034 (US$ Bn, AGR (%))
Figure 169 Rest of Latin America Next Generation Energy Storage Technologies (EST) Market by Value, 2024-2034 (US$ Bn, AGR (%))
Figure 170 Next Generation Energy Storage Technologies (EST) Market: Company Share, 2022
Figure 171 Siemens AG.: Net Revenue, 2019-2023 (US$ Million, AGR%)
Figure 172 Siemens AG.: R&D, 2019-2023 (US$ Million, AGR%)
Figure 173 Siemens AG.: Regional Revenue Share, 2023 (%)
Figure 174 Siemens AG.: Business Segment Revenue Share, 2022 (%)
Figure 175 General Electric Company.: Net Revenue, 2018-2022 (US$ Million, AGR%)
Figure 176 General Electric Company.: R&D, 2018-2022 (US$ Million, AGR%)
Figure 177 General Electric Company.: Regional Revenue Share, 2022 (%)
Figure 178 General Electric Company.: Business Segment Revenue Share, 2022 (%)
Figure 179 Panasonic Holdings Corporation.: Net Revenue, 2019-2023 (US$ Million, AGR%)
Figure 180 Panasonic Holdings Corporation.: R&D, 2019-2023 (US$ Million, AGR%)
Figure 181 Panasonic Holdings Corporation.: Regional Revenue Share, 2032 (%)
Figure 182 Panasonic Holdings Corporation.: Business Segment Revenue Share, 2023 (%)
Figure 183 LG Chem Ltd..: Net Revenue, 2018-2022 (US$ Million, AGR%)
Figure 184 LG Chem Ltd..: R&D, 2018-2022 (US$ Million, AGR%)
Figure 185 LG Chem Ltd..: Regional Revenue Share, 2022 (%)
Figure 186 LG Chem Ltd..: Business Segment Revenue Share, 2022 (%)
Figure 187 BYD Co. Ltd.: Net Revenue, 2017-2021 (US$ Million, AGR%)
Figure 188 BYD Co. Ltd.: R&D, 2017-2021 (US$ Million, AGR%)
Figure 189 BYD Co. Ltd.: Regional Revenue Share, 2021 (%)
Figure 190 Samsung SDI Co. Ltd..: Net Revenue, 2018-2022 (US$ Million, AGR%)
Figure 191 Samsung SDI Co. Ltd..: R&D, 2018-2022 (US$ Million, AGR%)
Figure 192 Samsung SDI Co. Ltd..: Regional Revenue Share, 2022 (%)
Figure 193 Samsung SDI Co. Ltd..: Business Segment Revenue Share, 2022 (%)
Figure 194 Saft Groupe SAS.: Net Revenue, 2018-2022 (US$ Million, AGR%)
Figure 195 Saft Groupe SAS.: R&D, 2018-2022 (US$ Million, AGR%)
Figure 196 Saft Groupe SAS.: Regional Revenue Share, 2022 (%)
Figure 197 Saft Groupe SAS.: Business Segment Revenue Share, 2022 (%)
Figure 198 Hitachi Chemical Co., Ltd..: Net Revenue, 2019-2023 (US$ Million, AGR%)
Figure 199 Hitachi Chemical Co., Ltd..: Regional Revenue Share, 2022 (%)
Figure 200 Hitachi Chemical Co., Ltd..: Business Segment Revenue Share, 2022 (%)
Figure 201 Maxwell Technologies Inc.: Net Revenue, 2019-2023 (US$ Million, AGR%)
Figure 202 Maxwell Technologies Inc.: R&D, 2019-2023 (US$ Million, AGR%)
Figure 203 Maxwell Technologies Inc.: Regional Revenue Share, 2022 (%)
Figure 204 Maxwell Technologies Inc.: Business Segment Revenue Share, 2022 (%)
Figure 205 Fluence Energy.: Net Revenue, 2019-2023 (US$ Million, AGR%)
Figure 206 Fluence Energy.: R&D, 2019-2023 (US$ Million, AGR%)
Figure 207 Fluence Energy.: Business Segment Revenue Share, 2022 (%)
Figure 208 AES Energy Storage, LLC.: Net Revenue, 2019-2023 (US$ Million, AGR%)
Figure 209 NEC Corporation.: Net Revenue, 2019-2023 (US$ Million, AGR%)
Figure 210 NEC Corporation.: R&D, 2019-2023 (US$ Million, AGR%)
Figure 211 NEC Corporation.: Business Segment Revenue Share, 2022 (%)
ページTOPに戻る
本レポートと同じKEY WORD(energy)の最新刊レポート
よくあるご質問
Visiongain社はどのような調査会社ですか?
英国の調査会社ヴィジョンゲイン社(Visiongain)は、通信とエネルギーのほか、自動車や化学・医薬品、金属など、広範な市場を対象に調査を行っています。自動車市場については、市場全般に関する調査のほ... もっと見る
調査レポートの納品までの日数はどの程度ですか?
在庫のあるものは速納となりますが、平均的には 3-4日と見て下さい。
但し、一部の調査レポートでは、発注を受けた段階で内容更新をして納品をする場合もあります。
発注をする前のお問合せをお願いします。
注文の手続きはどのようになっていますか?
1)お客様からの御問い合わせをいただきます。
2)見積書やサンプルの提示をいたします。
3)お客様指定、もしくは弊社の発注書をメール添付にて発送してください。
4)データリソース社からレポート発行元の調査会社へ納品手配します。
5) 調査会社からお客様へ納品されます。最近は、pdfにてのメール納品が大半です。
お支払方法の方法はどのようになっていますか?
納品と同時にデータリソース社よりお客様へ請求書(必要に応じて納品書も)を発送いたします。
お客様よりデータリソース社へ(通常は円払い)の御振り込みをお願いします。
請求書は、納品日の日付で発行しますので、翌月最終営業日までの当社指定口座への振込みをお願いします。振込み手数料は御社負担にてお願いします。
お客様の御支払い条件が60日以上の場合は御相談ください。
尚、初めてのお取引先や個人の場合、前払いをお願いすることもあります。ご了承のほど、お願いします。
データリソース社はどのような会社ですか?
当社は、世界各国の主要調査会社・レポート出版社と提携し、世界各国の市場調査レポートや技術動向レポートなどを日本国内の企業・公官庁及び教育研究機関に提供しております。
世界各国の「市場・技術・法規制などの」実情を調査・収集される時には、データリソース社にご相談ください。
お客様の御要望にあったデータや情報を抽出する為のレポート紹介や調査のアドバイスも致します。
|
|


