集光型太陽熱発電(CSP)市場レポート:2024-2034
Concentrated Solar Power (CSP) Market Report 2024-2034
レポート詳細
集光型太陽熱発電(CSP)市場レポート 2024-2034年 :この調査レポートは、業界とその基礎となるダイナミクスをより良く理解することを望むなら、新たな収益ポケットを目指す大手企業に... もっと見る
※上記価格は部署ライセンス(Departmental licence)価格です。
その他の価格についてはデータリソースまでお問合せください。
日本語のページは自動翻訳を利用し作成しています。
実際のレポートは英文のみでご納品いたします。
サマリー
レポート詳細
集光型太陽熱発電(CSP)市場レポート 2024-2034年:この調査レポートは、業界とその基礎となるダイナミクスをより良く理解することを望むなら、新たな収益ポケットを目指す大手企業にとって貴重なものとなるでしょう。異業種への進出や新規地域での既存事業の拡大を目指す企業にも有用です。
集光型太陽熱発電(CSP)市場は、持続可能で再生可能なエネルギーへの世界的なシフトが加速する中、大きく成長する見通し
集光型太陽熱発電(CSP)技術は、集光鏡や集光レンズを通して太陽光のパワーを利用し、熱を発生させ、その後電力に変換する。CSP市場を推進する主な原動力のひとつは、環境問題や二酸化炭素排出量削減の必要性から、クリーンエネルギー・ソリューションへの需要が高まっていることである。世界各国の政府は、再生可能エネルギー・ポートフォリオの一部としてCSP技術の採用を奨励するため、固定価格買取制度やインセンティブなど、有利な政策を実施している。
CSP市場には、特に現在進行中の技術の進歩に伴い、豊富なビジネスチャンスがある。革新的な材料、改良された制御システム、強化された貯蔵ソリューションの採用は、CSPシステムの効率とコスト効率に貢献している。加えて、ユーティリティ・スケールのCSPプラント、工業用暖房および海水淡水化アプリケーション、さらには住宅および商業用暖房に対する需要の高まりは、市場拡大の多様な道を提示している。CSP技術の多用途性は、大規模発電の主要プレーヤーとしてだけでなく、さまざまな産業や家庭のエネルギー・ニーズに対するソリューションとしても位置づけられている。
しかし、CSP市場に課題がないわけではない。高い初期資本コストと複雑なプロジェクト資金調達は、普及の大きなハードルとなっている。技術的リスク、太陽光の利用可能性に関する断続性の問題、他の再生可能エネルギー源との競争も課題となっている。これらの障壁を克服するためには、技術革新を推進し、CSPプロジェクトの全体的な経済性を向上させるための、継続的な研究開発、共同努力、政府による支援政策が必要である。
市場調査レポートを購入する前にすべき質問とは?
- 集光型太陽熱発電(CSP)市場はどのように進化しているのか?
- 集光型太陽熱発電(CSP)市場の推進要因と抑制要因は何か?
- 集光型太陽熱発電(CSP)サブマーケットの各セグメントは予測期間中にどのように成長し、2034年にどれくらいの収益を占めるのか?
- 2024年から2034年にかけて、集光型太陽熱発電(CSP)の各サブマーケットの市場シェアはどのように推移するのか?
- 2024年から2034年までの市場全体の主な牽引役は何か?
- 主要な集光型太陽熱発電(CSP)市場はマクロ経済の動きに概ね追随するのか、それとも個々の国市場が他を凌駕するのか?
- 2034年までに各国市場のシェアはどう変化し、2034年に市場をリードするのはどの地域か?
- 主要プレーヤーは誰で、予測期間中の見通しは?
- 主要企業の集光型太陽熱発電(CSP)プロジェクトは?
- 2024年から2034年の間に、産業はどのように発展するのか?現在および今後10年間に行われる集光型太陽熱発電(CSP)プロジェクトにはどのような意味があるのか?
- 集光型太陽熱発電(CSP)市場をさらに拡大するために、製品の商業化の必要性は高まっていますか?
- 集光型太陽熱発電(CSP)市場はどこへ向かい、どのようにすれば市場の最前線に立てるのか?
- 新製品やサービスラインへの最適な投資方法とは?
- 企業を新たな成長軌道に乗せ、C-suiteに移行させるための重要な展望とは?
このことが集光型太陽熱発電(CSP)市場に現在、そして今後10年間でどのような影響を与えるかを知る必要がある:
- 333ページにわたる本レポートは、112の表と153の図表で構成されています。
- 本レポートでは、業界における主要な有利分野を取り上げているため、今すぐターゲットを絞ることができます。
- 世界、地域、国の売上と成長に関する詳細な分析が含まれています。
- 競合他社が成功した主なトレンド、変化、収益予測をハイライトしています。
本レポートは、集光型太陽熱発電(CSP)市場が今後10年間でどのように発展するか、またCOVID-19の景気後退と好転の変動に合わせてどのように発展するかをお伝えします。この市場は、過去10年間のどの時点よりも今が重要である。
2034年までの予測やその他の分析から、商業的な展望が明らかになる
- 2034年までの収益予測に加え、最新の業績、成長率、市場シェアを提供します。
- ビジネスの展望と展開に関する独自の分析をご覧いただけます。
- 質的分析(市場ダイナミクス、促進要因、機会、阻害要因、課題を含む)、コスト構造、集光型太陽熱発電(CSP)価格上昇の影響、最近の動向をご覧いただけます。
本レポートには、COVID-19が業界と貴社にどのような影響を与えるかについてのデータ分析と貴重な洞察が含まれている。本レポートでは、COVID-19の4つの回収パターンとその影響、すなわち「V」、「L」、「W」、「U」について論じている。
レポート対象セグメント
蓄電タイプ別市場セグメント
- 熱エネルギー貯蔵
- 溶融塩貯蔵
- 蒸気アキュムレーター
用途別市場セグメント
- 実用規模のCSPプラント
- 産業用暖房および海水淡水化
- 住宅および商業用暖房
- その他の用途
コンポーネント別市場セグメント
- ソーラーコレクター
- 太陽熱貯蔵
- パワーブロック
- 熱媒体
- その他の部品
技術別市場セグメント
- パラボラトラフ
- ソーラータワー
- フレネル・リフレクター
- ディッシュスターリング
- ヘリオスタット
- その他の技術
世界市場全体とセグメント別の収益予測に加え、4つの地域と20の主要国市場の収益予測も掲載しています:
北米
- アメリカ
- カナダ
欧州
- ドイツ
- スペイン
- ギリシャ
- フランス
- イタリア
- その他の欧州
アジア太平洋
- 中国
- 日本
- インド
- オーストラリア
- 韓国
- その他のアジア太平洋地域
ラテンアメリカ
- ブラジル
- メキシコ
- その他のラテンアメリカ
中東・アフリカ
- GCC
- 南アフリカ
- その他の中東・アフリカ
集光型太陽熱発電(CSP)市場レポート 2024-2034
また、2024年から2034年までの集光型太陽熱発電(CSP)市場の主要企業のプロファイルと、これらの企業の事業のこのセグメントに焦点を当てている。
報告書に掲載されている主要企業
・ Aalborg CSP
・ ACWA Power
・ BrightSource Energy, Inc.
・ Cobra Instalaciones y Servicios
・ Enel Green Power S.p.A.
・ Flabeg Fe GmbH
・ FRENELL GmbH
・ GlassPoint Solar
・ Innova Global Limited
・ Sener
・ Shams Power Company
・ Siemens Gamesa Renewable Energy S.A.
・ Solar Inc.
・ Supcon Solar
・ TSK Flagsol Engineering GmbH
集光型太陽熱発電(CSP)市場全体の世界売上高、2024年から2034年まで、金額ベースでは2024年に72億米ドルを突破する、との試算を発表。2034年まで収益は力強く成長すると予測している。当調査では、最も大きな可能性を秘めた組織を特定しています。彼らの能力、進歩、商業的展望を発見し、一歩先を行くお手伝いをします。
集光型太陽熱発電(CSP)市場、2024-2034年レポートはどのようにお役に立ちますか?
要約すると、330ページを超えるこのレポートは、以下のような知識を提供する:
- 集光型太陽熱発電(CSP)市場の2034年までの収益予測、2024年から2034年市場 ストレージタイプ、アプリケーション、コンポーネント、テクノロジーの各予測を世界および地域レベルで掲載 - 業界の展望を発見し、投資と収益に最も有利な場所を見つけることができます。
- 4つの地域と20の主要国市場の2034年までの収益予測 - 集光型太陽熱発電(CSP)市場、北米、欧州、アジア太平洋、ラテンアメリカ、中東&アフリカの2024年から2034年までの市場予測をご覧ください。また、米国、カナダ、ブラジル、ドイツ、フランス、ギリシャ、イタリア、中国、インド、日本、オーストラリアなどの著名経済圏の市場も予測しています。
- 2024年から2034年までの集光型太陽熱発電(CSP)市場に関わる主要企業15社の企業プロファイルを含む。
独自の予測による定量的・定性的分析をご覧ください。私たちのレポートだけに含まれる情報を入手し、貴重なビジネスインテリジェンスで情報を得ることができます。
他にはない情報
私たちの新しいレポートがあれば、知識に遅れをとったり、チャンスを逃したりする可能性が低くなります。Visiongainのこの調査レポートは、集光型太陽熱発電(CSP)市場の2024年から2034年までの商業分析を必要とするすべての方々を対象としています。Visiongainの調査は、集光型太陽熱発電(CSP)市場、2024年から2034年、市場をリードする企業の商業分析を必要とするすべての人のためのものです。データ、トレンド、予測をご覧いただけます。
ページTOPに戻る
目次
1 レポート概要
1.1 研究の目的
1.2 集光型太陽熱発電(CSP)市場の紹介
1.3 本レポートの内容
1.4 本レポートを読むべき理由
1.5 本分析レポートが回答する主な質問
1.6 本レポートは誰のためのものか?
1.7 方法論
1.7.1 市場の定義
1.7.2 市場評価・予測手法
1.7.3 データの検証
1.7.3.1 一次調査
1.7.3.2 セカンダリーリサーチ
1.8 よくある質問(FAQ)
1.9 Visiongainの関連レポート
1.10 Visiongainについて
2 エグゼクティブ・サマリー
3 市場概要
3.1 主要な調査結果
3.2 市場ダイナミクス
3.2.1 市場促進要因
3.2.1.1 炭素排出に対する環境問題の高まりと大気汚染削減への取り組み
3.2.1.2 太陽エネルギーの普及と需要増加が市場成長を牽引
3.2.1.3 他の再生可能技術と比べた政府からの支援
3.2.2 市場抑制要因
3.2.2.1 他の再生可能技術と比べて高い発電コスト
3.2.2.2 CSPプラントの技術的な複雑さが市場成長を妨げる
3.2.2.3 太陽電池PVはCSPより安価であることが市場成長を妨げる
3.2.3 市場機会
3.2.3.1 ハイブリッド発電所へのCSPの統合が市場機会をもたらす
3.2.3.2 脱塩および増進回収法におけるCSPの利用
3.2.3.3 再生可能エネルギー生産を促進する技術の採用
3.3 ポーターのファイブフォース分析
3.3.1 サプライヤーの交渉力(中)
3.3.2 買い手の交渉力(中)
3.3.3 競争力(中〜高)
3.3.4 代替品による脅威(中)
3.3.5 新規参入の脅威(高)
3.4 COVID-19の影響分析
3.4.1 "V字型回復"
3.4.2 "U字型回復"
3.4.3 "W字型回復"
3.4.4 "L字型回復"
3.5 PEST分析
4 集光型太陽熱発電(CSP)市場分析:ストレージタイプ別
4.1 主要な調査結果
4.2 ストレージタイプ別セグメント 市場魅力度指数
4.3 太陽熱集光型発電(CSP)の貯蔵タイプ別市場規模の推定と予測
4.4 熱エネルギー貯蔵
4.4.1 2024〜2034年の地域別市場規模(US$ Billion)
4.4.2 地域別市場シェア、2024年・2034年(%)
4.5 溶融塩貯蔵
4.5.1 2024~2034年の地域別市場規模(US$ Billion)
4.5.2 地域別市場シェア、2024年・2034年(%)
4.6 蒸気アキュムレータ
4.6.1 2024~2034年の地域別市場規模(US$ Billion)
4.6.2 地域別市場シェア、2024年・2034年(%)
5 集光型太陽熱発電(CSP)市場分析:用途別
5.1 主な調査結果
5.2 アプリケーションセグメント 市場魅力度指数
5.3 集光型太陽熱発電(CSP)の用途別市場規模の推定と予測
5.4 実用規模のCSPプラント
5.4.1 2024〜2034年の地域別市場規模(US$ Billion)
5.4.2 地域別市場シェア、2024年・2034年(%)
5.5 産業用暖房および海水淡水化
5.5.1 2024〜2034年の地域別市場規模(US$ Billion)
5.5.2 地域別市場シェア、2024年・2034年(%)
5.6 住宅用および商業用暖房
5.6.1 2024〜2034年の地域別市場規模(US$ Billion)
5.6.2 地域別市場シェア、2024年・2034年(%)
5.7 その他の用途
5.7.1 2024〜2034年の地域別市場規模(US$ Billion)
5.7.2 地域別市場シェア、2024年・2034年(%)
6 集光型太陽熱発電(CSP)市場分析:コンポーネント別
6.1 主要な調査結果
6.2 コンポーネントセグメント 市場魅力度指数
6.3 コンポーネント別集光型太陽熱発電(CSP)市場規模の推定と予測
6.4 ソーラーコレクター
6.4.1 2024〜2034年の地域別市場規模(US$ Billion)
6.4.2 地域別市場シェア、2024年・2034年(%)
6.5 太陽熱貯蔵
6.5.1 2024〜2034年の地域別市場規模(US$ Billion)
6.5.2 地域別市場シェア、2024年・2034年(%)
6.6 パワーブロック
6.6.1 2024〜2034年の地域別市場規模(US$ Billion)
6.6.2 地域別市場シェア、2024年・2034年(%)
6.7 熱媒体
6.7.1 2024〜2034年の地域別市場規模(US$ Billion)
6.7.2 地域別市場シェア、2024年・2034年(%)
6.8 その他の部品
6.8.1 2024〜2034年の地域別市場規模(US$ Billion)
6.8.2 地域別市場シェア、2024年及び2034年(%)
7 集光型太陽熱発電(CSP)市場分析:技術タイプ別
7.1 主要な調査結果
7.2 技術タイプ別セグメント市場魅力度指数
7.3 技術タイプ別集光型太陽熱発電(CSP)市場規模の推定と予測
7.4 パラボラトラフ
7.4.1 2024~2034年の地域別市場規模(US$ Billion)
7.4.2 地域別市場シェア、2024年・2034年(%)
7.5 ソーラータワー
7.5.1 2024〜2034年の地域別市場規模(US$ Billion)
7.5.2 地域別市場シェア、2024年・2034年(%)
7.6 フレネルリフレクター
7.6.1 2024~2034年の地域別市場規模(US$ Billion)
7.6.2 地域別市場シェア、2024年・2034年(%)
7.7 ディッシュスターリング
7.7.1 2024〜2034年の地域別市場規模(US$ Billion)
7.7.2 地域別市場シェア、2024年・2034年(%)
7.8 ヘリオスタット
7.8.1 2024~2034年の地域別市場規模(US$ Billion)
7.8.2 地域別市場シェア、2024年・2034年(%)
7.9 その他の技術
7.9.1 2024〜2034年の地域別市場規模(US$ Billion)
7.9.2 地域別市場シェア、2024年・2034年(%)
8 集光型太陽熱発電(CSP)市場分析:地域別
8.1 主要な調査結果
8.2 地域別市場規模の推定と予測
9 北米の集光型太陽熱発電(CSP)市場分析
9.1 主要な調査結果
9.2 北米の集光型太陽熱発電(CSP)市場魅力度指数
9.3 北米の集光型太陽熱発電(CSP)国別市場、2024年、2029年、2034年(US$ Billion)
9.4 北米の集光型太陽熱発電(CSP)市場規模推定と予測
9.5 北米の集光型太陽熱発電(CSP)市場規模推定と予測:国別
9.6 北米の集光型太陽熱発電(CSP)市場規模推定と予測:ストレージタイプ別
9.7 北米の集光型太陽熱発電(CSP)市場規模推定と予測:用途別
9.8 北米の集光型太陽熱発電(CSP)市場規模推定と予測:コンポーネント別
9.9 北米の集光型太陽熱発電(CSP)市場規模推定と予測:技術タイプ別
9.10 米国の集光型太陽熱発電(CSP)市場分析
9.11 カナダの集光型太陽熱発電(CSP)市場分析
10 欧州の集光型太陽熱発電(CSP)市場分析
10.1 主要な調査結果
10.2 欧州の集光型太陽熱発電(CSP)市場魅力度指数
10.3 欧州の集光型太陽熱発電(CSP)国別市場、2024年、2029年、2034年(US$ Billion)
10.4 欧州の集光型太陽熱発電(CSP)市場規模推定と予測
10.5 欧州の集光型太陽熱発電(CSP)市場規模推定と予測:国別
10.6 欧州の集光型太陽熱発電(CSP)市場規模推定と予測:貯蔵タイプ別
10.7 欧州の集光型太陽熱発電(CSP)市場規模推定と予測:用途別
10.8 欧州の集光型太陽熱発電(CSP)市場規模推定と予測:コンポーネント別
10.9 欧州の集光型太陽熱発電(CSP)市場規模推定と予測:技術タイプ別
10.10 ドイツの集光型太陽熱発電(CSP)市場分析
10.11 ギリシャ集光型太陽熱発電(CSP)市場分析
10.12 フランス集光型太陽熱発電(CSP)市場分析
10.13 イタリア集光型太陽熱発電(CSP)市場分析
10.14 スペイン集光型太陽熱発電(CSP)市場分析
10.15 その他の欧州集光型太陽熱発電(CSP)市場分析
11 アジア太平洋集光型太陽熱発電(CSP)市場分析
11.1 主要な調査結果
11.2 アジア太平洋地域の集光型太陽熱発電(CSP)市場魅力度指数
11.3 アジア太平洋地域の集光型太陽熱発電(CSP)国別市場、2024年、2029年、2034年(US$ Billion)
11.4 アジア太平洋地域の集光型太陽熱発電(CSP)市場規模推定と予測
11.5 アジア太平洋地域の集光型太陽熱発電(CSP)市場規模推定と予測:国別
11.6 アジア太平洋地域の集光型太陽熱発電(CSP)市場規模推定と予測:貯蔵タイプ別
11.7 アジア太平洋地域の集光型太陽熱発電(CSP)市場規模推定と予測:用途別
11.8 アジア太平洋地域の集光型太陽熱発電(CSP)市場規模推定と予測:コンポーネント別
11.9 アジア太平洋地域の集光型太陽熱発電(CSP)市場規模推定と予測:技術タイプ別
11.10 中国の集光型太陽熱発電(CSP)市場分析
11.11 インドの集光型太陽熱発電(CSP)市場分析
11.12 日本の集光型太陽熱発電(CSP)市場分析
11.13 韓国の集光型太陽熱発電(CSP)市場分析
11.14 オーストラリアの集光型太陽熱発電(CSP)市場分析
11.15 その他のアジア太平洋地域の集光型太陽熱発電(CSP)市場分析
12 中東・アフリカ集光型太陽熱発電(CSP)市場分析
12.1 主要な調査結果
12.2 中東・アフリカの集光型太陽熱発電(CSP)市場魅力度指数
12.3 中東・アフリカの集光型太陽熱発電(CSP)国別市場、2024年、2029年、2034年(US$ Billion)
12.4 中東・アフリカの集光型太陽熱発電(CSP)市場規模推定と予測
12.5 中東・アフリカの集光型太陽熱発電(CSP)市場規模推定と予測:国別
12.6 中東・アフリカの集光型太陽熱発電(CSP)市場規模推定と予測:貯蔵タイプ別
12.7 中東・アフリカの集光型太陽熱発電(CSP)市場規模推定と予測:用途別
12.8 中東・アフリカの集光型太陽熱発電(CSP)市場規模推定と予測:コンポーネント別
12.9 中東・アフリカの集光型太陽熱発電(CSP)市場規模推定と予測:予測技術タイプ別
12.10 GCCの集光型太陽熱発電(CSP)市場分析
12.11 南アフリカの太陽熱発電(CSP)市場分析
12.12 その他の中東・アフリカ集光型太陽熱発電(CSP)市場分析
13 ラテンアメリカの集光型太陽熱発電(CSP)市場分析
13.1 主要な調査結果
13.2 ラテンアメリカ集光型太陽熱発電(CSP)市場魅力度指数
13.3 ラテンアメリカの集光型太陽熱発電(CSP)国別市場、2024年、2029年、2034年(US$ Billion)
13.4 ラテンアメリカの集光型太陽熱発電(CSP)市場規模推定と予測
13.5 ラテンアメリカの集光型太陽熱発電(CSP)市場規模推定と予測:国別
13.6 ラテンアメリカの集光型太陽熱発電(CSP)市場規模推定と予測:貯蔵タイプ別
13.7 ラテンアメリカの集光型太陽熱発電(CSP)市場規模推定と予測:用途別
13.8 ラテンアメリカの集光型太陽熱発電(CSP)市場規模推定と予測:コンポーネント別
13.9 ラテンアメリカの集光型太陽熱発電(CSP)市場規模推定と予測:技術タイプ別
13.10 ブラジル集光型太陽熱発電(CSP)市場分析
13.11 メキシコ集光型太陽熱発電(CSP)市場分析
13.12 その他のラテンアメリカの集光型太陽熱発電(CSP)市場分析
14 主要企業のプロファイル
14.1 戦略的展望
14.2 BrightSource Energy, Inc.
14.2.1 会社概要
14.2.2 会社概要
14.2.3 製品ベンチマーク
14.3 ACWA Power
14.3.1 会社概要
14.3.2 会社概要
14.3.3 製品ベンチマーク
14.3.4 戦略的展望
14.4 Sener
14.4.1 会社概要
14.4.2 会社概要
14.4.3 製品ベンチマーク
14.5 TSK Flagsol Engineering GmbH
14.5.1 会社概要
14.5.2 会社概要
14.5.3 製品ベンチマーク
14.6 Solar Inc.
14.6.1 会社概要
14.6.2 会社概要
14.6.3 製品ベンチマーク
14.7 Siemens Gamesa Renewable Energy S.A.
14.7.1 会社概要
14.7.2 会社概要
14.7.3 製品ベンチマーク
14.8 FRENELL GmbH
14.8.1 会社概要
14.8.2 会社概要
14.8.3 製品ベンチマーク
14.9 Aalborg CSP
14.9.1 会社概要
14.9.2 会社概要
14.9.3 製品ベンチマーク
14.9.4 戦略的展望
14.10 Enel Green Power S.p.A.
14.10.1 会社概要
14.10.2 会社概要
14.10.3 財務分析
14.10.3.1 純収入、2018年~2022年
14.10.3.2 地域別収入シェア、2022年(%)
14.10.3.3 事業セグメント別収益シェア、2022年(%)
14.10.4 製品ベンチマーク
14.11 Supcon Solar
14.11.1 会社概要
14.11.2 会社概要
14.11.3 製品ベンチマーク
14.12 シャムス電力
14.12.1 会社概要
14.12.2 会社概要
14.12.3 製品ベンチマーク
14.13 Cobra Instalaciones y Servicios
14.13.1 会社概要
14.13.2 会社概要
14.13.3 製品ベンチマーク
14.14 フラベッグフェ社
14.14.1 会社概要
14.14.2 会社概要
14.14.3 製品ベンチマーク
14.15 GlassPoint Solar
14.15.1 会社概要
14.15.2 会社概要
14.15.3 製品ベンチマーク
14.15.4 戦略的展望
14.16 Innova Global Limited
14.16.1 会社概要
14.16.2 会社概要
14.16.3 製品ベンチマーク
15 結論と提言
15.1 Visiongainからの結びの言葉
15.2 市場プレイヤーへの提言
ページTOPに戻る
図表リスト
表の一覧
Table 1 Concentrated Solar Power (CSP) Market Snapshot, 2024 & 2034 (US$ Billion, CAGR %)
Table 2 Global Concentrated Solar Power (CSP) Market by Region, 2024-2034 (US$ Bn, AGR (%), CAGR (%)) (V-Shaped Recovery Scenario)
Table 3 Global Concentrated Solar Power (CSP) Market Forecast, 2024-2034 (US$ Bn, AGR (%), CAGR (%)) (U-Shaped Recovery Scenario)
Table 4 Global Concentrated Solar Power (CSP) Market by Region, 2024-2034 (US$ Bn, AGR (%), CAGR (%)) (W-Shaped Recovery Scenario)
Table 5 Global Concentrated Solar Power (CSP) Market by Region, 2024-2034 (US$ Bn, AGR (%), CAGR (%)) (L-Shaped Recovery Scenario)
Table 6 Global Concentrated Solar Power (CSP) Market by Storage Type, 2024-2034 (US$ Bn, AGR (%), CAGR (%))
Table 7 Thermal Energy Storage Market by Region, 2024-2034 (US$ Bn, AGR (%), CAGR (%))
Table 8 Molten Salt Storage Market by Region, 2024-2034 (US$ Bn, AGR (%), CAGR (%))
Table 9 Steam Accumulators Market by Region, 2024-2034 (US$ Bn, AGR (%), CAGR (%))
Table 10 Global Concentrated Solar Power (CSP) Market by Application, 2024-2034 (US$ Bn, AGR (%), CAGR (%))
Table 11 Utility-scale CSP Plants Market by Region, 2024-2034 (US$ Bn, AGR (%), CAGR (%))
Table 12 Industrial Heating and Desalination Market by Region, 2024-2034 (US$ Bn, AGR (%), CAGR (%))
Table 13 Residential and Commercial Heating Market by Region, 2024-2034 (US$ Bn, AGR (%), CAGR (%))
Table 14 Other Applications Market by Region, 2024-2034 (US$ Bn, AGR (%), CAGR (%))
Table 15 Global Concentrated Solar Power (CSP) Market by Component, 2024-2034 (US$ Bn, AGR (%), CAGR (%))
Table 16 Solar Collectors Market by Region, 2024-2034 (US$ Bn, AGR (%), CAGR (%))
Table 17 Solar Thermal Storage Market by Region, 2024-2034 (US$ Bn, AGR (%), CAGR (%))
Table 18 Power Block Market by Region, 2024-2034 (US$ Bn, AGR (%), CAGR (%))
Table 19 Heat Transfer Fluid Market by Region, 2024-2034 (US$ Bn, AGR (%), CAGR (%))
Table 20 Other Components Market by Region, 2024-2034 (US$ Bn, AGR (%), CAGR (%))
Table 21 Global Concentrated Solar Power (CSP) Market by Technology, 2024-2034 (US$ Bn, AGR (%), CAGR (%))
Table 22 Parabolic Trough Market by Region, 2024-2034 (US$ Bn, AGR (%), CAGR (%))
Table 23 Solar Tower Market by Region, 2024-2034 (US$ Bn, AGR (%), CAGR (%))
Table 24 Fresnel Reflectors Market by Region, 2024-2034 (US$ Bn, AGR (%), CAGR (%))
Table 25 Dish Stirling Market by Region, 2024-2034 (US$ Bn, AGR (%), CAGR (%))
Table 26 Heliostat Market by Region, 2024-2034 (US$ Bn, AGR (%), CAGR (%))
Table 27 Other Technologies Market by Region, 2024-2034 (US$ Bn, AGR (%), CAGR (%))
Table 28 Concentrated Solar Power (CSP) Market Forecast by Region, 2024-2034 (US$ Billion, AGR%, CAGR%)
Table 29 North America Concentrated Solar Power (CSP) Market by Value, 2024-2034 (US$ Bn, AGR (%), CAGR (%))
Table 30 North America Concentrated Solar Power (CSP) Market by Country, 2024-2034 (US$ Bn, AGR (%), CAGR (%))
Table 31 North America Concentrated Solar Power (CSP) Market by Storage Type, 2024-2034 (US$ Bn, AGR (%), CAGR (%))
Table 32 North America Concentrated Solar Power (CSP) Market by Application, 2024-2034 (US$ Bn, AGR (%), CAGR (%))
Table 33 North America Concentrated Solar Power (CSP) Market by Component, 2024-2034 (US$ Bn, AGR (%), CAGR (%))
Table 34 North America Concentrated Solar Power (CSP) Market by Technology, 2024-2034 (US$ Bn, AGR (%), CAGR (%))
Table 35 US Concentrated Solar Power (CSP) Market by Value, 2024-2034 (US$ Bn, AGR (%), CAGR (%))
Table 36 Canada Concentrated Solar Power (CSP) Market by Value, 2024-2034 (US$ Bn, AGR (%), CAGR (%))
Table 37 Europe Concentrated Solar Power (CSP) Market by Value, 2024-2034 (US$ Bn, AGR (%), CAGR (%))
Table 38 Europe Concentrated Solar Power (CSP) Market by Country, 2024-2034 (US$ Bn, AGR (%), CAGR (%))
Table 39 Europe Concentrated Solar Power (CSP) Market by Storage Type, 2024-2034 (US$ Bn, AGR (%), CAGR (%))
Table 40 Europe Concentrated Solar Power (CSP) Market by Application, 2024-2034 (US$ Bn, AGR (%), CAGR (%))
Table 41 Europe Concentrated Solar Power (CSP) Market by Component, 2024-2034 (US$ Bn, AGR (%), CAGR (%))
Table 42 Europe Concentrated Solar Power (CSP) Market by Technology, 2024-2034 (US$ Bn, AGR (%), CAGR (%))
Table 43 Germany Concentrated Solar Power (CSP) Market by Value, 2024-2034 (US$ Bn, AGR (%), CAGR (%))
Table 44 Greece Concentrated Solar Power (CSP) Market by Value, 2024-2034 (US$ Bn, AGR (%), CAGR (%))
Table 45 France Concentrated Solar Power (CSP) Market by Value, 2024-2034 (US$ Bn, AGR (%), CAGR (%))
Table 46 Italy Concentrated Solar Power (CSP) Market by Value, 2024-2034 (US$ Bn, AGR (%), CAGR (%))
Table 47 Spain Concentrated Solar Power (CSP) Market by Value, 2024-2034 (US$ Bn, AGR (%), CAGR (%))
Table 48 Rest of Europe Concentrated Solar Power (CSP) Market by Value, 2024-2034 (US$ Bn, AGR (%), CAGR (%))
Table 49 Asia-Pacific Concentrated Solar Power (CSP) Market by Value, 2024-2034 (US$ Bn, AGR (%), CAGR (%))
Table 50 Asia-Pacific Concentrated Solar Power (CSP) Market by Country, 2024-2034 (US$ Bn, AGR (%), CAGR (%))
Table 51 Asia-Pacific Concentrated Solar Power (CSP) Market by Storage Type, 2024-2034 (US$ Bn, AGR (%), CAGR (%))
Table 52 Asia-Pacific Concentrated Solar Power (CSP) Market by Application, 2024-2034 (US$ Bn, AGR (%), CAGR (%))
Table 53 Asia-Pacific Concentrated Solar Power (CSP) Market by Component, 2024-2034 (US$ Bn, AGR (%), CAGR (%))
Table 54 Asia-Pacific Concentrated Solar Power (CSP) Market by Technology, 2024-2034 (US$ Bn, AGR (%), CAGR (%))
Table 55 China Concentrated Solar Power (CSP) Market by Value, 2024-2034 (US$ Bn, AGR (%), CAGR (%))
Table 56 India Concentrated Solar Power (CSP) Market by Value, 2024-2034 (US$ Bn, AGR (%), CAGR (%))
Table 57 Japan Concentrated Solar Power (CSP) Market by Value, 2024-2034 (US$ Bn, AGR (%), CAGR (%))
Table 58 South Korea Concentrated Solar Power (CSP) Market by Value, 2024-2034 (US$ Bn, AGR (%), CAGR (%))
Table 59 Australia Concentrated Solar Power (CSP) Market by Value, 2024-2034 (US$ Bn, AGR (%), CAGR (%))
Table 60 Rest of Asia-Pacific Concentrated Solar Power (CSP) Market by Value, 2024-2034 (US$ Bn, AGR (%), CAGR (%))
Table 61 Middle East & Africa Concentrated Solar Power (CSP) Market by Value, 2024-2034 (US$ Bn, AGR (%), CAGR (%))
Table 62 Middle East & Africa Concentrated Solar Power (CSP) Market by Country, 2024-2034 (US$ Bn, AGR (%), CAGR (%))
Table 63 Middle East & Africa Concentrated Solar Power (CSP) Market by Storage Type, 2024-2034 (US$ Bn, AGR (%), CAGR (%))
Table 64 Middle East & Africa Concentrated Solar Power (CSP) Market by Application, 2024-2034 (US$ Bn, AGR (%), CAGR (%))
Table 65 Middle East & Africa Concentrated Solar Power (CSP) Market by Component, 2024-2034 (US$ Bn, AGR (%), CAGR (%))
Table 66 Middle East & Africa Concentrated Solar Power (CSP) Market by Technology, 2024-2034 (US$ Bn, AGR (%), CAGR (%))
Table 67 GCC Concentrated Solar Power (CSP) Market by Value, 2024-2034 (US$ Bn, AGR (%), CAGR (%))
Table 68 South Africa Concentrated Solar Power (CSP) Market by Value, 2024-2034 (US$ Bn, AGR (%), CAGR (%))
Table 69 Rest of Middle East & Africa Concentrated Solar Power (CSP) Market by Value, 2024-2034 (US$ Bn, AGR (%), CAGR (%))
Table 70 Latin America Concentrated Solar Power (CSP) Market by Value, 2024-2034 (US$ Bn, AGR (%), CAGR (%))
Table 71 Latin America Concentrated Solar Power (CSP) Market by Country, 2024-2034 (US$ Bn, AGR (%), CAGR (%))
Table 72 Latin America Concentrated Solar Power (CSP) Market by Storage Type, 2024-2034 (US$ Bn, AGR (%), CAGR (%))
Table 73 Latin America Concentrated Solar Power (CSP) Market by Application, 2024-2034 (US$ Bn, AGR (%), CAGR (%))
Table 74 Latin America Concentrated Solar Power (CSP) Market by Component, 2024-2034 (US$ Bn, AGR (%), CAGR (%))
Table 75 Latin America Concentrated Solar Power (CSP) Market by Technology, 2024-2034 (US$ Bn, AGR (%), CAGR (%))
Table 76 Brazil Concentrated Solar Power (CSP) Market by Value, 2024-2034 (US$ Bn, AGR (%), CAGR (%))
Table 77 Mexico Concentrated Solar Power (CSP) Market by Value, 2024-2034 (US$ Bn, AGR (%), CAGR (%))
Table 78 Rest of Latin America Concentrated Solar Power (CSP) Market by Value, 2024-2034 (US$ Bn, AGR (%), CAGR (%))
Table 79 Strategic Outlook - Contract
Table 80 BrightSource Energy, Inc.: Key Details, (CEO, HQ, Revenue, Founded, No. of Employees, Company Type, Website, Business Segment)
Table 81 BrightSource Energy, Inc.: Product Benchmarking
Table 82 ACWA Power: Key Details, (CEO, HQ, Revenue, Founded, No. of Employees, Company Type, Website, Business Segment)
Table 83 ACWA Power: Product Benchmarking
Table 84 ACWA Power: Strategic Outlook
Table 85 Sener: Key Details, (CEO, HQ, Revenue, Founded, No. of Employees, Company Type, Website, Business Segment)
Table 86 Sener: Product Benchmarking
Table 87 TSK Flagsol Engineering GmbH: Key Details, (CEO, HQ, Revenue, Founded, No. of Employees, Company Type, Website, Business Segment)
Table 88 TSK Flagsol Engineering GmbH: Product Benchmarking
Table 89 Solar Inc.: Key Details, (CEO, HQ, Revenue, Founded, No. of Employees, Company Type, Website, Business Segment)
Table 90 Solar Inc.: Product Benchmarking
Table 91 Siemens Gamesa Renewable Energy S.A.: Key Details, (CEO, HQ, Revenue, Founded, No. of Employees, Company Type, Website, Business Segment)
Table 92 Siemens Gamesa Renewable Energy S.A.: Product Benchmarking
Table 93 FRENELL GmbH: Key Details, (CEO, HQ, Revenue, Founded, No. of Employees, Company Type, Website, Business Segment)
Table 94 FRENELL GmbH: Product Benchmarking
Table 95 Aalborg CSP: Key Details, (CEO, HQ, Revenue, Founded, No. of Employees, Company Type, Website, Business Segment)
Table 96 Aalborg CSP: Product Benchmarking
Table 97 Aalborg CSP: Strategic Outlook
Table 98 Enel Green Power S.p.A.: Key Details, (CEO, HQ, Revenue, Founded, No. of Employees, Company Type, Website, Business Segment)
Table 99 Enel Green Power S.p.A.: Product Benchmarking
Table 100 Supcon Solar: Key Details, (CEO, HQ, Revenue, Founded, No. of Employees, Company Type, Website, Business Segment)
Table 101 Supcon Solar: Product Benchmarking
Table 102 Shams Power Company: Key Details, (CEO, HQ, Revenue, Founded, No. of Employees, Company Type, Website, Business Segment)
Table 103 Shams Power Company: Product Benchmarking
Table 104 Cobra Instalaciones y Servicios: Key Details, (CEO, HQ, Revenue, Founded, No. of Employees, Company Type, Website, Business Segment)
Table 105 Cobra Instalaciones y Servicios: Product Benchmarking
Table 106 Flabeg Fe GmbH: Key Details, (CEO, HQ, Revenue, Founded, No. of Employees, Company Type, Website, Business Segment)
Table 107 Flabeg Fe GmbH: Product Benchmarking
Table 108 GlassPoint Solar: Key Details, (CEO, HQ, Revenue, Founded, No. of Employees, Company Type, Website, Business Segment)
Table 109 GlassPoint Solar: Product Benchmarking
Table 110 GlassPoint Solar: Strategic Outlook
Table 111 Innova Global Limited: Key Details, (CEO, HQ, Revenue, Founded, No. of Employees, Company Type, Website, Business Segment)
図の一覧
Figure 1 Concentrated Solar Power (CSP) Market Segmentation
Figure 2 Concentrated Solar Power (CSP) Market by Storage Type: Market Attractiveness Index
Figure 3 Concentrated Solar Power (CSP) Market by Application: Market Attractiveness Index
Figure 4 Concentrated Solar Power (CSP) Market by Components: Market Attractiveness Index
Figure 5 Concentrated Solar Power (CSP) Market by Technology Type: Market Attractiveness Index
Figure 6 Concentrated Solar Power (CSP) Market Attractiveness Index by Region
Figure 7 Concentrated Solar Power (CSP) Market: Market Dynamics
Figure 8 Concentrated Solar Power (CSP) Market: Porter’s Five Forces Analysis
Figure 9 Global Concentrated Solar Power (CSP) Market Share Forecast by COVID, 2024-2034 (%)
Figure 10 Global Concentrated Solar Power (CSP) Market by Region, 2024-2034 (US$ Bn, AGR (%)) (V-Shaped Recovery Scenario)
Figure 11 Global Concentrated Solar Power (CSP) Market Forecast, 2024-2034 (US$ Bn, AGR (%)) (U-Shaped Recovery Scenario)
Figure 12 Global Concentrated Solar Power (CSP) Market by Region, 2024-2034 (US$ Bn, AGR (%)) (W-Shaped Recovery Scenario)
Figure 13 Global Concentrated Solar Power (CSP) Market by Region, 2024-2034 (US$ Bn, AGR (%)) (L-Shaped Recovery Scenario)
Figure 14 Concentrated Solar Power (CSP) Market: PEST Analysis
Figure 15 Concentrated Solar Power (CSP) Market by Storage Type: Market Attractiveness Index
Figure 16 Global Concentrated Solar Power (CSP) Market by Storage Type, 2024-2034 (US$ Bn, AGR (%))
Figure 17 Concentrated Solar Power (CSP) Market Share Forecast by Storage Type, 2024, 2029, 2034 (%)
Figure 18 Thermal Energy Storage Market by Region, 2024-2034 (US$ Bn, AGR (%))
Figure 19 Thermal Energy Storage Market Share Forecast by Region, 2024 & 2034 (%)
Figure 20 Molten Salt Storage Market by Region, 2024-2034 (US$ Bn, AGR (%))
Figure 21 Molten Salt Storage Market Share Forecast by Region, 2024 & 2034 (%)
Figure 22 Steam Accumulators Market by Region, 2024-2034 (US$ Bn, AGR (%))
Figure 23 Steam Accumulators Market Share Forecast by Region, 2024 & 2034 (%)
Figure 24 Concentrated Solar Power (CSP) Market by Application: Market Attractiveness Index
Figure 25 Global Concentrated Solar Power (CSP) Market by Application, 2024-2034 (US$ Bn, AGR (%))
Figure 26 Concentrated Solar Power (CSP) Market Share Forecast by Application, 2024, 2029, 2034 (%)
Figure 27 Utility-scale CSP Plants Market by Region, 2024-2034 (US$ Bn, AGR (%))
Figure 28 Utility-scale CSP Plants Market Share Forecast by Region, 2024 & 2034 (%)
Figure 29 Industrial Heating and Desalination Market by Region, 2024-2034 (US$ Bn, AGR (%))
Figure 30 Industrial Heating and Desalination Market Share Forecast by Region, 2024 & 2034 (%)
Figure 31 Residential and Commercial Heating Market by Region, 2024-2034 (US$ Bn, AGR (%))
Figure 32 Residential and Commercial Heating Market Share Forecast by Region, 2024 & 2034 (%)
Figure 33 Other Applications Market by Region, 2024-2034 (US$ Bn, AGR (%))
Figure 34 Other Applications Market Share Forecast by Region, 2024 & 2034 (%)
Figure 35 Concentrated Solar Power (CSP) Market by Components: Market Attractiveness Index
Figure 36 Global Concentrated Solar Power (CSP) Market by Component, 2024-2034 (US$ Bn, AGR (%))
Figure 37 Concentrated Solar Power (CSP) Market Share Forecast by Components, 2024, 2029, 2034 (%)
Figure 38 Solar Collectors Market by Region, 2024-2034 (US$ Bn, AGR (%))
Figure 39 Solar Collectors Market Share Forecast by Region, 2024 & 2034 (%)
Figure 40 Solar Thermal Storage Market by Region, 2024-2034 (US$ Bn, AGR (%))
Figure 41 Solar Thermal Storage Market Share Forecast by Region, 2024 & 2034 (%)
Figure 42 Power Block Market by Region, 2024-2034 (US$ Bn, AGR (%))
Figure 43 Power Block Market Share Forecast by Region, 2024 & 2034 (%)
Figure 44 Heat Transfer Fluid Market by Region, 2024-2034 (US$ Bn, AGR (%))
Figure 45 Heat Transfer Fluid Market Share Forecast by Region, 2024 & 2034 (%)
Figure 46 Other Components Market by Region, 2024-2034 (US$ Bn, AGR (%))
Figure 47 Other Components Market Share Forecast by Region, 2024 & 2034 (%)
Figure 48 Concentrated Solar Power (CSP) Market by Technology Type: Market Attractiveness Index
Figure 49 Global Concentrated Solar Power (CSP) Market by Technology, 2024-2034 (US$ Bn, AGR (%))
Figure 50 Concentrated Solar Power (CSP) Market Share Forecast by Technology Type, 2024, 2029, 2034 (%)
Figure 51 Parabolic Trough Market by Region, 2024-2034 (US$ Bn, AGR (%))
Figure 52 Parabolic Trough Market Share Forecast by Region, 2024 & 2034 (%)
Figure 53 Solar Tower Market by Region, 2024-2034 (US$ Bn, AGR (%))
Figure 54 Solar Tower Market Share Forecast by Region, 2024 & 2034 (%)
Figure 55 Fresnel Reflectors Market by Region, 2024-2034 (US$ Bn, AGR (%))
Figure 56 Fresnel Reflectors Market Share Forecast by Region, 2024 & 2034 (%)
Figure 57 Dish Stirling Market by Region, 2024-2034 (US$ Bn, AGR (%))
Figure 58 Dish Stirling Market Share Forecast by Region, 2024 & 2034 (%)
Figure 59 Heliostat Market by Region, 2024-2034 (US$ Bn, AGR (%))
Figure 60 Heliostat Market Share Forecast by Region, 2024 & 2034 (%)
Figure 61 Other Technologies Market by Region, 2024-2034 (US$ Bn, AGR (%))
Figure 62 Other Technology Market Share Forecast by Region, 2024 & 2034 (%)
Figure 63 Concentrated Solar Power (CSP) Market Forecast by Region 2024 and 2034 (Revenue, CAGR%)
Figure 64 Concentrated Solar Power (CSP) Market Share Forecast by Region 2024, 2029, 2034 (%)
Figure 65 Concentrated Solar Power (CSP) Market by Region, 2024-2034 (US$ Billion, AGR %)
Figure 66 North America Concentrated Solar Power (CSP) Market Attractiveness Index
Figure 67 North America Concentrated Solar Power (CSP) Market by Region, 2024, 2029 & 2034 (US$ Billion)
Figure 68 North America Concentrated Solar Power (CSP) Market by Value, 2024-2034 (US$ Bn, AGR (%))
Figure 69 North America Concentrated Solar Power (CSP) Market by Country, 2024-2034 (US$ Bn, AGR (%))
Figure 70 North America Concentrated Solar Power (CSP) Market Share Forecast by Country, 2024 & 2034 (%)
Figure 71 North America Concentrated Solar Power (CSP) Market by Storage Type, 2024-2034 (US$ Bn, AGR (%))
Figure 72 North America Concentrated Solar Power (CSP) Market Share Forecast Storage Type, 2024 & 2034 (%)
Figure 73 North America Concentrated Solar Power (CSP) Market by Application, 2024-2034 (US$ Bn, AGR (%))
Figure 74 North America Concentrated Solar Power (CSP) Market Share Forecast by Application, 2024 & 2034 (%)
Figure 75 North America Concentrated Solar Power (CSP) Market by Component, 2024-2034 (US$ Bn, AGR (%))
Figure 76 North America Concentrated Solar Power (CSP) Market Share Forecast by Components, 2024 & 2034 (%)
Figure 77 North America Concentrated Solar Power (CSP) Market by Technology, 2024-2034 (US$ Bn, AGR (%))
Figure 78 North America Concentrated Solar Power (CSP) Market Share Forecast by Technology Type, 2024 & 2034 (%)
Figure 79 US Concentrated Solar Power (CSP) Market by Value, 2024-2034 (US$ Bn, AGR (%))
Figure 80 Canada Concentrated Solar Power (CSP) Market by Value, 2024-2034 (US$ Bn, AGR (%))
Figure 81 Europe Concentrated Solar Power (CSP) Market Attractiveness Index
Figure 82 Europe Concentrated Solar Power (CSP) Market by Region, 2024, 2029 & 2034 (US$ Billion)
Figure 83 Europe Concentrated Solar Power (CSP) Market by Value, 2024-2034 (US$ Bn, AGR (%))
Figure 84 Europe Concentrated Solar Power (CSP) Market by Country, 2024-2034 (US$ Bn, AGR (%))
Figure 85 Europe Concentrated Solar Power (CSP) Market Share Forecast by Country, 2024 & 2034 (%)
Figure 86 Europe Concentrated Solar Power (CSP) Market by Storage Type, 2024-2034 (US$ Bn, AGR (%))
Figure 87 Europe Concentrated Solar Power (CSP) Market Share Forecast Storage Type, 2024 & 2034 (%)
Figure 88 Europe Concentrated Solar Power (CSP) Market by Application, 2024-2034 (US$ Bn, AGR (%))
Figure 89 Europe Concentrated Solar Power (CSP) Market Share Forecast by Application, 2024 & 2034 (%)
Figure 90 Europe Concentrated Solar Power (CSP) Market by Component, 2024-2034 (US$ Bn, AGR (%))
Figure 91 Europe Concentrated Solar Power (CSP) Market Share Forecast by Components, 2024 & 2034 (%)
Figure 92 Europe Concentrated Solar Power (CSP) Market by Technology, 2024-2034 (US$ Bn, AGR (%))
Figure 93 Europe Concentrated Solar Power (CSP) Market Share Forecast by Technology Type, 2024 & 2034 (%)
Figure 94 Germany Concentrated Solar Power (CSP) Market by Value, 2024-2034 (US$ Bn, AGR (%))
Figure 95 Greece Concentrated Solar Power (CSP) Market by Value, 2024-2034 (US$ Bn, AGR (%))
Figure 96 France Concentrated Solar Power (CSP) Market by Value, 2024-2034 (US$ Bn, AGR (%))
Figure 97 Italy Concentrated Solar Power (CSP) Market by Value, 2024-2034 (US$ Bn, AGR (%))
Figure 98 Spain Concentrated Solar Power (CSP) Market by Value, 2024-2034 (US$ Bn, AGR (%))
Figure 99 Rest of Europe Concentrated Solar Power (CSP) Market by Value, 2024-2034 (US$ Bn, AGR (%))
Figure 100 Asia-Pacific Concentrated Solar Power (CSP) Market Attractiveness Index
Figure 101 Asia-Pacific Concentrated Solar Power (CSP) Market by Region, 2024, 2029 & 2034 (US$ Billion)
Figure 102 Asia-Pacific Concentrated Solar Power (CSP) Market by Value, 2024-2034 (US$ Bn, AGR (%))
Figure 103 Asia-Pacific Concentrated Solar Power (CSP) Market by Country, 2024-2034 (US$ Bn, AGR (%))
Figure 104 Asia-Pacific Concentrated Solar Power (CSP) Market Share Forecast by Country, 2024 & 2034 (%)
Figure 105 Asia-Pacific Concentrated Solar Power (CSP) Market by Storage Type, 2024-2034 (US$ Bn, AGR (%))
Figure 106 Asia-Pacific Concentrated Solar Power (CSP) Market Share Forecast Storage Type, 2024 & 2034 (%)
Figure 107 Asia-Pacific Concentrated Solar Power (CSP) Market by Application, 2024-2034 (US$ Bn, AGR (%))
Figure 108 Asia-Pacific Concentrated Solar Power (CSP) Market Share Forecast by Application, 2024 & 2034 (%)
Figure 109 Asia-Pacific Concentrated Solar Power (CSP) Market by Component, 2024-2034 (US$ Bn, AGR (%))
Figure 110 Asia-Pacific Concentrated Solar Power (CSP) Market Share Forecast by Components, 2024 & 2034 (%)
Figure 111 Asia-Pacific Concentrated Solar Power (CSP) Market by Technology, 2024-2034 (US$ Bn, AGR (%))
Figure 112 Asia-Pacific Concentrated Solar Power (CSP) Market Share Forecast by Technology Type, 2024 & 2034 (%)
Figure 113 China Concentrated Solar Power (CSP) Market by Value, 2024-2034 (US$ Bn, AGR (%))
Figure 114 India Concentrated Solar Power (CSP) Market by Value, 2024-2034 (US$ Bn, AGR (%))
Figure 115 Japan Concentrated Solar Power (CSP) Market by Value, 2024-2034 (US$ Bn, AGR (%))
Figure 116 South Korea Concentrated Solar Power (CSP) Market by Value, 2024-2034 (US$ Bn, AGR (%))
Figure 117 Australia Concentrated Solar Power (CSP) Market by Value, 2024-2034 (US$ Bn, AGR (%))
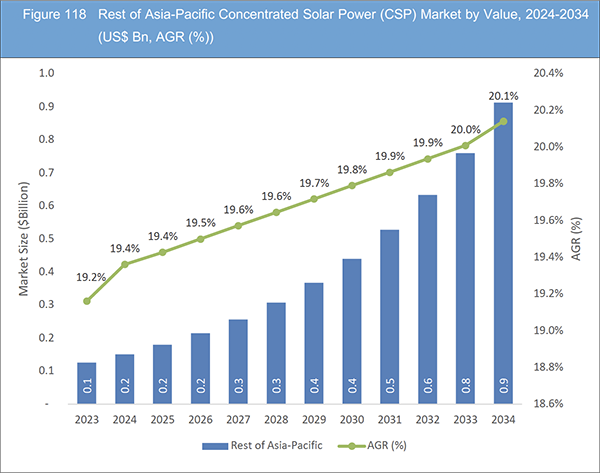
Figure 118 Rest of Asia-Pacific Concentrated Solar Power (CSP) Market by Value, 2024-2034 (US$ Bn, AGR (%))
Figure 119 Middle East and Africa Concentrated Solar Power (CSP) Market Attractiveness Index
Figure 120 Middle East and Africa Concentrated Solar Power (CSP) Market by Region, 2024, 2029 & 2034 (US$ Billion)
Figure 121 Middle East & Africa Concentrated Solar Power (CSP) Market by Value, 2024-2034 (US$ Bn, AGR (%))
Figure 122 Middle East & Africa Concentrated Solar Power (CSP) Market by Country, 2024-2034 (US$ Bn, AGR (%))
Figure 123 Middle East and Africa Concentrated Solar Power (CSP) Market Share Forecast by Country, 2024 & 2034 (%)
Figure 124 Middle East & Africa Concentrated Solar Power (CSP) Market by Storage Type, 2024-2034 (US$ Bn, AGR (%))
Figure 125 Middle East and Africa Concentrated Solar Power (CSP) Market Share Forecast Storage Type, 2024 & 2034 (%)
Figure 126 Middle East & Africa Concentrated Solar Power (CSP) Market by Application, 2024-2034 (US$ Bn, AGR (%))
Figure 127 Middle East and Africa Concentrated Solar Power (CSP) Market Share Forecast by Application, 2024 & 2034 (%)
Figure 128 Middle East & Africa Concentrated Solar Power (CSP) Market by Component, 2024-2034 (US$ Bn, AGR (%))
Figure 129 Middle East and Africa Concentrated Solar Power (CSP) Market Share Forecast by Components, 2024 & 2034 (%)
Figure 130 Middle East & Africa Concentrated Solar Power (CSP) Market by Technology, 2024-2034 (US$ Bn, AGR (%))
Figure 131 Middle East and Africa Concentrated Solar Power (CSP) Market Share Forecast by Technology Type, 2024 & 2034 (%)
Figure 132 GCC Concentrated Solar Power (CSP) Market by Value, 2024-2034 (US$ Bn, AGR (%))
Figure 133 South Africa Concentrated Solar Power (CSP) Market by Value, 2024-2034 (US$ Bn, AGR (%))
Figure 134 Rest of Middle East & Africa Concentrated Solar Power (CSP) Market by Value, 2024-2034 (US$ Bn, AGR (%))
Figure 135 Latin America Concentrated Solar Power (CSP) Market Attractiveness Index
Figure 136 Latin America Concentrated Solar Power (CSP) Market by Region, 2024, 2029 & 2034 (US$ Billion)
Figure 137 Latin America Concentrated Solar Power (CSP) Market by Value, 2024-2034 (US$ Bn, AGR (%))
Figure 138 Latin America Concentrated Solar Power (CSP) Market by Country, 2024-2034 (US$ Bn, AGR (%))
Figure 139 Latin America Concentrated Solar Power (CSP) Market Share Forecast by Country, 2024 & 2034 (%)
Figure 140 Latin America Concentrated Solar Power (CSP) Market by Storage Type, 2024-2034 (US$ Bn, AGR (%))
Figure 141 Latin America Concentrated Solar Power (CSP) Market Share Forecast Storage Type, 2024 & 2034 (%)
Figure 142 Latin America Concentrated Solar Power (CSP) Market by Application, 2024-2034 (US$ Bn, AGR (%))
Figure 143 Latin America Concentrated Solar Power (CSP) Market Share Forecast by Application, 2024 & 2034 (%)
Figure 144 Latin America Concentrated Solar Power (CSP) Market by Component, 2024-2034 (US$ Bn, AGR (%))
Figure 145 Latin America Concentrated Solar Power (CSP) Market Share Forecast by Components, 2024 & 2034 (%)
Figure 146 Latin America Concentrated Solar Power (CSP) Market by Technology, 2024-2034 (US$ Bn, AGR (%))
Figure 147 Latin America Concentrated Solar Power (CSP) Market Share Forecast by Technology Type, 2024 & 2034 (%)
Figure 148 Brazil Concentrated Solar Power (CSP) Market by Value, 2024-2034 (US$ Bn, AGR (%))
Figure 149 Mexico Concentrated Solar Power (CSP) Market by Value, 2024-2034 (US$ Bn, AGR (%))
Figure 150 Rest of Latin America Concentrated Solar Power (CSP) Market by Value, 2024-2034 (US$ Bn, AGR (%))
Figure 151 Enel Green Power S.p.A..: Net Revenue, 2018-2022 (US$ Million, AGR%)
Figure 152 Enel Green Power S.p.A..: Regional Revenue Share, 2022 (%)
Figure 153 Enel Green Power S.p.A..: Business Segment Revenue Share, 2022 (%)
ページTOPに戻る
Summary
Report Details
The Concentrated Solar Power (CSP) Market Report 2024-2034: This report will prove invaluable to leading firms striving for new revenue pockets if they wish to better understand the industry and its underlying dynamics. It will be useful for companies that would like to expand into different industries or to expand their existing operations in a new region.
The Concentrated Solar Power (CSP) Market Is Poised for Significant Growth as the Global Shift Toward Sustainable and Renewable Energy Intensifies
The CSP technology harnesses the power of sunlight through concentrated mirrors or lenses to generate heat, subsequently converted into electricity. One of the key drivers propelling the CSP market forward is the increasing demand for clean energy solutions, driven by environmental concerns and the need to reduce carbon emissions. Governments around the world are implementing favourable policies, including feed-in tariffs and incentives, to encourage the adoption of CSP technology as part of their renewable energy portfolios.
Opportunities within the CSP market are abundant, particularly with the ongoing advancements in technology. The adoption of innovative materials, improved control systems, and enhanced storage solutions contributes to the efficiency and cost-effectiveness of CSP systems. Additionally, the rising demand for utility-scale CSP plants, industrial heating and desalination applications, and even residential and commercial heating presents diverse avenues for market expansion. The versatility of CSP technology positions it not only as a major player in large-scale electricity generation but also as a solution for various industrial and domestic energy needs.
However, the CSP market is not without its challenges. High initial capital costs and complex project financing remain significant hurdles for widespread adoption. Technological risks, intermittency issues related to sunlight availability, and competition from other renewable energy sources also pose challenges. Overcoming these barriers requires continued research and development, collaborative efforts, and supportive government policies to drive innovation and improve the overall economic viability of CSP projects.
What Questions Should You Ask before Buying a Market Research Report?
• How is the concentrated solar power (CSP) market evolving?
• What is driving and restraining the concentrated solar power (CSP) market?
• How will each concentrated solar power (CSP) submarket segment grow over the forecast period and how much revenue will these submarkets account for in 2034?
• How will the market shares for each concentrated solar power (CSP) submarket develop from 2024 to 2034?
• What will be the main driver for the overall market from 2024 to 2034?
• Will leading concentrated solar power (CSP) markets broadly follow the macroeconomic dynamics, or will individual national markets outperform others?
• How will the market shares of the national markets change by 2034 and which geographical region will lead the market in 2034?
• Who are the leading players and what are their prospects over the forecast period?
• What are the concentrated solar power (CSP) projects for these leading companies?
• How will the industry evolve during the period between 2024 and 2034? What are the implications of concentrated solar power (CSP) projects taking place now and over the next 10 years?
• Is there a greater need for product commercialisation to further scale the concentrated solar power (CSP) market?
• Where is the concentrated solar power (CSP) market heading and how can you ensure you are at the forefront of the market?
• What are the best investment options for new product and service lines?
• What are the key prospects for moving companies into a new growth path and C-suite?
You need to discover how this will impact the concentrated solar power (CSP) market today, and over the next 10 years:
• Our 333-page report provides 112 tables and 153 charts/graphs exclusively to you.
• The report highlights key lucrative areas in the industry so you can target them – NOW.
• It contains in-depth analysis of global, regional and national sales and growth.
• It highlights for you the key successful trends, changes and revenue projections made by your competitors.
This report tells you TODAY how the concentrated solar power (CSP) market will develop in the next 10 years, and in line with the variations in COVID-19 economic recession and bounce. This market is more critical now than at any point over the last 10 years.
Forecasts to 2034 and other analyses reveal commercial prospects
• In addition to revenue forecasting to 2034, our new study provides you with recent results, growth rates, and market shares.
• You will find original analyses, with business outlooks and developments.
• Discover qualitative analyses (including market dynamics, drivers, opportunities, restraints and challenges), cost structure, impact of rising concentrated solar power (CSP) prices and recent developments.
This report includes data analysis and invaluable insight into how COVID-19 will affect the industry and your company. Four COVID-19 recovery patterns and their impact, namely, “V”, “L”, “W” and “U” are discussed in this report.
Segments Covered in the Report
Market Segment by Storage Type
• Thermal Energy Storage
• Molten Salt Storage
• Steam Accumulators
Market Segment by Application
• Utility-scale CSP Plants
• Industrial Heating and Desalination
• Residential and Commercial Heating
• Other Applications
Market Segment by Component
• Solar Collectors
• Solar Thermal Storage
• Power Block
• Heat Transfer Fluid
• Other Components
Market Segment by Technology
• Parabolic Trough
• Solar Tower
• Fresnel Reflectors
• Dish Stirling
• Heliostat
• Other Technologies
In addition to the revenue predictions for the overall world market and segments, you will also find revenue forecasts for four regional and 20 leading national markets:
North America
• U.S.
• Canada
Europe
• Germany
• Spain
• Greece
• France
• Italy
• Rest of Europe
Asia Pacific
• China
• Japan
• India
• Australia
• South Korea
• Rest of Asia Pacific
Latin America
• Brazil
• Mexico
• Rest of Latin America
Middle East & Africa
• GCC
• South Africa
• Rest of Middle East & Africa
The report also includes profiles and for some of the leading companies in the Concentrated Solar Power (CSP) Market, 2024 to 2034, with a focus on this segment of these companies’ operations.
Leading companies profiled in the report
• Aalborg CSP
• ACWA Power
• BrightSource Energy, Inc.
• Cobra Instalaciones y Servicios
• Enel Green Power S.p.A.
• Flabeg Fe GmbH
• FRENELL GmbH
• GlassPoint Solar
• Innova Global Limited
• Sener
• Shams Power Company
• Siemens Gamesa Renewable Energy S.A.
• Solar Inc.
• Supcon Solar
• TSK Flagsol Engineering GmbH
Overall world revenue for Concentrated Solar Power (CSP) Market, 2024 to 2034 in terms of value the market will surpass US$7.2 billion in 2024, our work calculates. We predict strong revenue growth through to 2034. Our work identifies which organizations hold the greatest potential. Discover their capabilities, progress, and commercial prospects, helping you stay ahead.
How will the Concentrated Solar Power (CSP) Market, 2024 to 2034 report help you?
In summary, our 330+ page report provides you with the following knowledge:
• Revenue forecasts to 2034 for Concentrated Solar Power (CSP) Market, 2024 to 2034 Market, with forecasts for storage type, application, component, and technology, each forecast at a global and regional level – discover the industry’s prospects, finding the most lucrative places for investments and revenues.
• Revenue forecasts to 2034 for four regional and 20 key national markets – See forecasts for the Concentrated Solar Power (CSP) Market, 2024 to 2034 market in North America, Europe, Asia-Pacific, Latin America and Middle East & Africa. Also forecasted is the market in the US, Canada, Brazil, Germany, France, Greece, Italy, China, India, Japan, and Australia among other prominent economies.
• Prospects for established firms and those seeking to enter the market – including company profiles for 15 of the major companies involved in the Concentrated Solar Power (CSP) Market, 2024 to 2034.
Find quantitative and qualitative analyses with independent predictions. Receive information that only our report contains, staying informed with invaluable business intelligence.
Information found nowhere else
With our new report, you are less likely to fall behind in knowledge or miss out on opportunities. See how our work could benefit your research, analyses, and decisions. Visiongain’s study is for everybody needing commercial analyses for the Concentrated Solar Power (CSP) Market, 2024 to 2034, market-leading companies. You will find data, trends and predictions.
ページTOPに戻る
Table of Contents
1 Report Overview
1.1 Objectives of the Study
1.2 Introduction to Concentrated Solar Power (CSP) Market
1.3 What This Report Delivers
1.4 Why You Should Read This Report
1.5 Key Questions Answered by This Analytical Report
1.6 Who Is This Report for?
1.7 Methodology
1.7.1 Market Definitions
1.7.2 Market Evaluation & Forecasting Methodology
1.7.3 Data Validation
1.7.3.1 Primary Research
1.7.3.2 Secondary Research
1.8 Frequently Asked Questions (FAQs)
1.9 Associated Visiongain Reports
1.10 About Visiongain
2 Executive Summary
3 Market Overview
3.1 Key Findings
3.2 Market Dynamics
3.2.1 Market Driving Factors
3.2.1.1 Growing Environmental Concern Over Carbon Emission and Efforts to Reduce Air Pollution
3.2.1.2 Increasing Popularity and Rising Demand for Solar Energy Driving the Market Growth
3.2.1.3 Support from Government Compared with Other Renewable Technologies
3.2.2 Market Restraining Factors
3.2.2.1 Higher Cost of Generation Compared with Others Renewable Technologies.
3.2.2.2 Technical Complexities of CSP Plants Hinder the Market Growth
3.2.2.3 Solar PV is Cheaper Than CSP Hinder the Market Growth
3.2.3 Market Opportunities
3.2.3.1 Integration of CSP in Hybrid Power Plants Opportunities for the Market
3.2.3.2 Use of CSP in Desalination and Enhanced Oil Recovery Processes
3.2.3.3 Adoption of Technologies to Boost Renewable Energy Production
3.3 Porter’s Five Forces Analysis
3.3.1 Bargaining Power of Suppliers (Medium)
3.3.2 Bargaining Power of Buyers (Medium)
3.3.3 Competitive Rivalry (Medium to High)
3.3.4 Threat from Substitutes (Medium)
3.3.5 Threat of New Entrants (High)
3.4 COVID-19 Impact Analysis
3.4.1 “V-Shaped Recovery”
3.4.2 “U-Shaped Recovery”
3.4.3 “W-Shaped Recovery”
3.4.4 “L-Shaped Recovery”
3.5 PEST Analysis
4 Concentrated Solar Power (CSP) Market Analysis by Storage Type
4.1 Key Findings
4.2 Storage Type Segment: Market Attractiveness Index
4.3 Concentrated Solar Power (CSP) Market Size Estimation and Forecast by Storage Type
4.4 Thermal Energy Storage
4.4.1 Market Size by Region, 2024-2034 (US$ Billion)
4.4.2 Market Share by Region, 2024 & 2034 (%)
4.5 Molten Salt Storage
4.5.1 Market Size by Region, 2024-2034 (US$ Billion)
4.5.2 Market Share by Region, 2024 & 2034 (%)
4.6 Steam Accumulators
4.6.1 Market Size by Region, 2024-2034 (US$ Billion)
4.6.2 Market Share by Region, 2024 & 2034 (%)
5 Concentrated Solar Power (CSP) Market Analysis by Application
5.1 Key Findings
5.2 Application Segment: Market Attractiveness Index
5.3 Concentrated Solar Power (CSP) Market Size Estimation and Forecast by Application
5.4 Utility-scale CSP Plants
5.4.1 Market Size by Region, 2024-2034 (US$ Billion)
5.4.2 Market Share by Region, 2024 & 2034 (%)
5.5 Industrial Heating and Desalination
5.5.1 Market Size by Region, 2024-2034 (US$ Billion)
5.5.2 Market Share by Region, 2024 & 2034 (%)
5.6 Residential and Commercial Heating
5.6.1 Market Size by Region, 2024-2034 (US$ Billion)
5.6.2 Market Share by Region, 2024 & 2034 (%)
5.7 Other Applications
5.7.1 Market Size by Region, 2024-2034 (US$ Billion)
5.7.2 Market Share by Region, 2024 & 2034 (%)
6 Concentrated Solar Power (CSP) Market Analysis by Components
6.1 Key Findings
6.2 Components Segment: Market Attractiveness Index
6.3 Concentrated Solar Power (CSP) Market Size Estimation and Forecast by Components
6.4 Solar Collectors
6.4.1 Market Size by Region, 2024-2034 (US$ Billion)
6.4.2 Market Share by Region, 2024 & 2034 (%)
6.5 Solar Thermal Storage
6.5.1 Market Size by Region, 2024-2034 (US$ Billion)
6.5.2 Market Share by Region, 2024 & 2034 (%)
6.6 Power Block
6.6.1 Market Size by Region, 2024-2034 (US$ Billion)
6.6.2 Market Share by Region, 2024 & 2034 (%)
6.7 Heat Transfer Fluid
6.7.1 Market Size by Region, 2024-2034 (US$ Billion)
6.7.2 Market Share by Region, 2024 & 2034 (%)
6.8 Other Components
6.8.1 Market Size by Region, 2024-2034 (US$ Billion)
6.8.2 Market Share by Region, 2024 & 2034 (%)
7 Concentrated Solar Power (CSP) Market Analysis by Technology Type
7.1 Key Findings
7.2 Technology Type Segment: Market Attractiveness Index
7.3 Concentrated Solar Power (CSP) Market Size Estimation and Forecast by Technology Type
7.4 Parabolic Trough
7.4.1 Market Size by Region, 2024-2034 (US$ Billion)
7.4.2 Market Share by Region, 2024 & 2034 (%)
7.5 Solar Tower
7.5.1 Market Size by Region, 2024-2034 (US$ Billion)
7.5.2 Market Share by Region, 2024 & 2034 (%)
7.6 Fresnel Reflectors
7.6.1 Market Size by Region, 2024-2034 (US$ Billion)
7.6.2 Market Share by Region, 2024 & 2034 (%)
7.7 Dish Stirling
7.7.1 Market Size by Region, 2024-2034 (US$ Billion)
7.7.2 Market Share by Region, 2024 & 2034 (%)
7.8 Heliostat
7.8.1 Market Size by Region, 2024-2034 (US$ Billion)
7.8.2 Market Share by Region, 2024 & 2034 (%)
7.9 Other Technology
7.9.1 Market Size by Region, 2024-2034 (US$ Billion)
7.9.2 Market Share by Region, 2024 & 2034 (%)
8 Concentrated Solar Power (CSP) Market Analysis by Region
8.1 Key Findings
8.2 Regional Market Size Estimation and Forecast
9 North America Concentrated Solar Power (CSP) Market Analysis
9.1 Key Findings
9.2 North America Concentrated Solar Power (CSP) Market Attractiveness Index
9.3 North America Concentrated Solar Power (CSP) Market by Country, 2024, 2029 & 2034 (US$ Billion)
9.4 North America Concentrated Solar Power (CSP) Market Size Estimation and Forecast
9.5 North America Concentrated Solar Power (CSP) Market Size Estimation and Forecast by Country
9.6 North America Concentrated Solar Power (CSP) Market Size Estimation and Forecast by Storage Type
9.7 North America Concentrated Solar Power (CSP) Market Size Estimation and Forecast by Application
9.8 North America Concentrated Solar Power (CSP) Market Size Estimation and Forecast by Components
9.9 North America Concentrated Solar Power (CSP) Market Size Estimation and Forecast by Technology Type
9.10 U.S. Concentrated Solar Power (CSP) Market Analysis
9.11 Canada Concentrated Solar Power (CSP) Market Analysis
10 Europe Concentrated Solar Power (CSP) Market Analysis
10.1 Key Findings
10.2 Europe Concentrated Solar Power (CSP) Market Attractiveness Index
10.3 Europe Concentrated Solar Power (CSP) Market by Country, 2024, 2029 & 2034 (US$ Billion)
10.4 Europe Concentrated Solar Power (CSP) Market Size Estimation and Forecast
10.5 Europe Concentrated Solar Power (CSP) Market Size Estimation and Forecast by Country
10.6 Europe Concentrated Solar Power (CSP) Market Size Estimation and Forecast by Storage Type
10.7 Europe Concentrated Solar Power (CSP) Market Size Estimation and Forecast by Application
10.8 Europe Concentrated Solar Power (CSP) Market Size Estimation and Forecast by Components
10.9 Europe Concentrated Solar Power (CSP) Market Size Estimation and Forecast by Technology Type
10.10 Germany Concentrated Solar Power (CSP) Market Analysis
10.11 Greece Concentrated Solar Power (CSP) Market Analysis
10.12 France Concentrated Solar Power (CSP) Market Analysis
10.13 Italy Concentrated Solar Power (CSP) Market Analysis
10.14 Spain Concentrated Solar Power (CSP) Market Analysis
10.15 Rest of Europe Concentrated Solar Power (CSP) Market Analysis
11 Asia-Pacific Concentrated Solar Power (CSP) Market Analysis
11.1 Key Findings
11.2 Asia-Pacific Concentrated Solar Power (CSP) Market Attractiveness Index
11.3 Asia-Pacific Concentrated Solar Power (CSP) Market by Country, 2024, 2029 & 2034 (US$ Billion)
11.4 Asia-Pacific Concentrated Solar Power (CSP) Market Size Estimation and Forecast
11.5 Asia-Pacific Concentrated Solar Power (CSP) Market Size Estimation and Forecast by Country
11.6 Asia-Pacific Concentrated Solar Power (CSP) Market Size Estimation and Forecast by Storage Type
11.7 Asia-Pacific Concentrated Solar Power (CSP) Market Size Estimation and Forecast by Application
11.8 Asia-Pacific Concentrated Solar Power (CSP) Market Size Estimation and Forecast by Components
11.9 Asia-Pacific Concentrated Solar Power (CSP) Market Size Estimation and Forecast by Technology Type
11.10 China Concentrated Solar Power (CSP) Market Analysis
11.11 India Concentrated Solar Power (CSP) Market Analysis
11.12 Japan Concentrated Solar Power (CSP) Market Analysis
11.13 South Korea Concentrated Solar Power (CSP) Market Analysis
11.14 Australia Concentrated Solar Power (CSP) Market Analysis
11.15 Rest of Asia-Pacific Concentrated Solar Power (CSP) Market Analysis
12 Middle East and Africa Concentrated Solar Power (CSP) Market Analysis
12.1 Key Findings
12.2 Middle East and Africa Concentrated Solar Power (CSP) Market Attractiveness Index
12.3 Middle East and Africa Concentrated Solar Power (CSP) Market by Country, 2024, 2029 & 2034 (US$ Billion)
12.4 Middle East and Africa Concentrated Solar Power (CSP) Market Size Estimation and Forecast
12.5 Middle East and Africa Concentrated Solar Power (CSP) Market Size Estimation and Forecast by Country
12.6 Middle East and Africa Concentrated Solar Power (CSP) Market Size Estimation and Forecast by Storage Type
12.7 Middle East and Africa Concentrated Solar Power (CSP) Market Size Estimation and Forecast by Application
12.8 Middle East and Africa Concentrated Solar Power (CSP) Market Size Estimation and Forecast by Components
12.9 Middle East and Africa Concentrated Solar Power (CSP) Market Size Estimation and Forecast by Technology Type
12.10 GCC Concentrated Solar Power (CSP) Market Analysis
12.11 South Africa Concentrated Solar Power (CSP) Market Analysis
12.12 Rest of Middle East & Africa Concentrated Solar Power (CSP) Market Analysis
13 Latin America Concentrated Solar Power (CSP) Market Analysis
13.1 Key Findings
13.2 Latin America Concentrated Solar Power (CSP) Market Attractiveness Index
13.3 Latin America Concentrated Solar Power (CSP) Market by Country, 2024, 2029 & 2034 (US$ Billion)
13.4 Latin America Concentrated Solar Power (CSP) Market Size Estimation and Forecast
13.5 Latin America Concentrated Solar Power (CSP) Market Size Estimation and Forecast by Country
13.6 Latin America Concentrated Solar Power (CSP) Market Size Estimation and Forecast by Storage Type
13.7 Latin America Concentrated Solar Power (CSP) Market Size Estimation and Forecast by Application
13.8 Latin America Concentrated Solar Power (CSP) Market Size Estimation and Forecast by Components
13.9 Latin America Concentrated Solar Power (CSP) Market Size Estimation and Forecast by Technology Type
13.10 Brazil Concentrated Solar Power (CSP) Market Analysis
13.11 Mexico Concentrated Solar Power (CSP) Market Analysis
13.12 Rest of Latin America Concentrated Solar Power (CSP) Market Analysis
14 Company Profiles
14.1 Strategic Outlook
14.2 BrightSource Energy, Inc.
14.2.1 Company Snapshot
14.2.2 Company Overview
14.2.3 Product Benchmarking
14.3 ACWA Power
14.3.1 Company Snapshot
14.3.2 Company Overview
14.3.3 Product Benchmarking
14.3.4 Strategic Outlook
14.4 Sener
14.4.1 Company Snapshot
14.4.2 Company Overview
14.4.3 Product Benchmarking
14.5 TSK Flagsol Engineering GmbH
14.5.1 Company Snapshot
14.5.2 Company Overview
14.5.3 Product Benchmarking
14.6 Solar Inc.
14.6.1 Company Snapshot
14.6.2 Company Overview
14.6.3 Product Benchmarking
14.7 Siemens Gamesa Renewable Energy S.A.
14.7.1 Company Snapshot
14.7.2 Company Overview
14.7.3 Product Benchmarking
14.8 FRENELL GmbH
14.8.1 Company Snapshot
14.8.2 Company Overview
14.8.3 Product Benchmarking
14.9 Aalborg CSP
14.9.1 Company Snapshot
14.9.2 Company Overview
14.9.3 Product Benchmarking
14.9.4 Strategic Outlook
14.10 Enel Green Power S.p.A.
14.10.1 Company Snapshot
14.10.2 Company Overview
14.10.3 Financial Analysis
14.10.3.1 Net Revenue, 2018-2022
14.10.3.2 Regional Revenue Share, 2022 (%)
14.10.3.3 Business Segment Revenue Share, 2022 (%)
14.10.4 Product Benchmarking
14.11 Supcon Solar
14.11.1 Company Snapshot
14.11.2 Company Overview
14.11.3 Product Benchmarking
14.12 Shams Power Company
14.12.1 Company Snapshot
14.12.2 Company Overview
14.12.3 Product Benchmarking
14.13 Cobra Instalaciones y Servicios
14.13.1 Company Snapshot
14.13.2 Company Overview
14.13.3 Product Benchmarking
14.14 Flabeg Fe GmbH
14.14.1 Company Snapshot
14.14.2 Company Overview
14.14.3 Product Benchmarking
14.15 GlassPoint Solar
14.15.1 Company Snapshot
14.15.2 Company Overview
14.15.3 Product Benchmarking
14.15.4 Strategic Outlook
14.16 Innova Global Limited
14.16.1 Company Snapshot
14.16.2 Company Overview
14.16.3 Product Benchmarking
15 Conclusion and Recommendations
15.1 Concluding Remarks from Visiongain
15.2 Recommendations for Market Players
ページTOPに戻る
List of Tables/Graphs
List of Tables
Table 1 Concentrated Solar Power (CSP) Market Snapshot, 2024 & 2034 (US$ Billion, CAGR %)
Table 2 Global Concentrated Solar Power (CSP) Market by Region, 2024-2034 (US$ Bn, AGR (%), CAGR (%)) (V-Shaped Recovery Scenario)
Table 3 Global Concentrated Solar Power (CSP) Market Forecast, 2024-2034 (US$ Bn, AGR (%), CAGR (%)) (U-Shaped Recovery Scenario)
Table 4 Global Concentrated Solar Power (CSP) Market by Region, 2024-2034 (US$ Bn, AGR (%), CAGR (%)) (W-Shaped Recovery Scenario)
Table 5 Global Concentrated Solar Power (CSP) Market by Region, 2024-2034 (US$ Bn, AGR (%), CAGR (%)) (L-Shaped Recovery Scenario)
Table 6 Global Concentrated Solar Power (CSP) Market by Storage Type, 2024-2034 (US$ Bn, AGR (%), CAGR (%))
Table 7 Thermal Energy Storage Market by Region, 2024-2034 (US$ Bn, AGR (%), CAGR (%))
Table 8 Molten Salt Storage Market by Region, 2024-2034 (US$ Bn, AGR (%), CAGR (%))
Table 9 Steam Accumulators Market by Region, 2024-2034 (US$ Bn, AGR (%), CAGR (%))
Table 10 Global Concentrated Solar Power (CSP) Market by Application, 2024-2034 (US$ Bn, AGR (%), CAGR (%))
Table 11 Utility-scale CSP Plants Market by Region, 2024-2034 (US$ Bn, AGR (%), CAGR (%))
Table 12 Industrial Heating and Desalination Market by Region, 2024-2034 (US$ Bn, AGR (%), CAGR (%))
Table 13 Residential and Commercial Heating Market by Region, 2024-2034 (US$ Bn, AGR (%), CAGR (%))
Table 14 Other Applications Market by Region, 2024-2034 (US$ Bn, AGR (%), CAGR (%))
Table 15 Global Concentrated Solar Power (CSP) Market by Component, 2024-2034 (US$ Bn, AGR (%), CAGR (%))
Table 16 Solar Collectors Market by Region, 2024-2034 (US$ Bn, AGR (%), CAGR (%))
Table 17 Solar Thermal Storage Market by Region, 2024-2034 (US$ Bn, AGR (%), CAGR (%))
Table 18 Power Block Market by Region, 2024-2034 (US$ Bn, AGR (%), CAGR (%))
Table 19 Heat Transfer Fluid Market by Region, 2024-2034 (US$ Bn, AGR (%), CAGR (%))
Table 20 Other Components Market by Region, 2024-2034 (US$ Bn, AGR (%), CAGR (%))
Table 21 Global Concentrated Solar Power (CSP) Market by Technology, 2024-2034 (US$ Bn, AGR (%), CAGR (%))
Table 22 Parabolic Trough Market by Region, 2024-2034 (US$ Bn, AGR (%), CAGR (%))
Table 23 Solar Tower Market by Region, 2024-2034 (US$ Bn, AGR (%), CAGR (%))
Table 24 Fresnel Reflectors Market by Region, 2024-2034 (US$ Bn, AGR (%), CAGR (%))
Table 25 Dish Stirling Market by Region, 2024-2034 (US$ Bn, AGR (%), CAGR (%))
Table 26 Heliostat Market by Region, 2024-2034 (US$ Bn, AGR (%), CAGR (%))
Table 27 Other Technologies Market by Region, 2024-2034 (US$ Bn, AGR (%), CAGR (%))
Table 28 Concentrated Solar Power (CSP) Market Forecast by Region, 2024-2034 (US$ Billion, AGR%, CAGR%)
Table 29 North America Concentrated Solar Power (CSP) Market by Value, 2024-2034 (US$ Bn, AGR (%), CAGR (%))
Table 30 North America Concentrated Solar Power (CSP) Market by Country, 2024-2034 (US$ Bn, AGR (%), CAGR (%))
Table 31 North America Concentrated Solar Power (CSP) Market by Storage Type, 2024-2034 (US$ Bn, AGR (%), CAGR (%))
Table 32 North America Concentrated Solar Power (CSP) Market by Application, 2024-2034 (US$ Bn, AGR (%), CAGR (%))
Table 33 North America Concentrated Solar Power (CSP) Market by Component, 2024-2034 (US$ Bn, AGR (%), CAGR (%))
Table 34 North America Concentrated Solar Power (CSP) Market by Technology, 2024-2034 (US$ Bn, AGR (%), CAGR (%))
Table 35 US Concentrated Solar Power (CSP) Market by Value, 2024-2034 (US$ Bn, AGR (%), CAGR (%))
Table 36 Canada Concentrated Solar Power (CSP) Market by Value, 2024-2034 (US$ Bn, AGR (%), CAGR (%))
Table 37 Europe Concentrated Solar Power (CSP) Market by Value, 2024-2034 (US$ Bn, AGR (%), CAGR (%))
Table 38 Europe Concentrated Solar Power (CSP) Market by Country, 2024-2034 (US$ Bn, AGR (%), CAGR (%))
Table 39 Europe Concentrated Solar Power (CSP) Market by Storage Type, 2024-2034 (US$ Bn, AGR (%), CAGR (%))
Table 40 Europe Concentrated Solar Power (CSP) Market by Application, 2024-2034 (US$ Bn, AGR (%), CAGR (%))
Table 41 Europe Concentrated Solar Power (CSP) Market by Component, 2024-2034 (US$ Bn, AGR (%), CAGR (%))
Table 42 Europe Concentrated Solar Power (CSP) Market by Technology, 2024-2034 (US$ Bn, AGR (%), CAGR (%))
Table 43 Germany Concentrated Solar Power (CSP) Market by Value, 2024-2034 (US$ Bn, AGR (%), CAGR (%))
Table 44 Greece Concentrated Solar Power (CSP) Market by Value, 2024-2034 (US$ Bn, AGR (%), CAGR (%))
Table 45 France Concentrated Solar Power (CSP) Market by Value, 2024-2034 (US$ Bn, AGR (%), CAGR (%))
Table 46 Italy Concentrated Solar Power (CSP) Market by Value, 2024-2034 (US$ Bn, AGR (%), CAGR (%))
Table 47 Spain Concentrated Solar Power (CSP) Market by Value, 2024-2034 (US$ Bn, AGR (%), CAGR (%))
Table 48 Rest of Europe Concentrated Solar Power (CSP) Market by Value, 2024-2034 (US$ Bn, AGR (%), CAGR (%))
Table 49 Asia-Pacific Concentrated Solar Power (CSP) Market by Value, 2024-2034 (US$ Bn, AGR (%), CAGR (%))
Table 50 Asia-Pacific Concentrated Solar Power (CSP) Market by Country, 2024-2034 (US$ Bn, AGR (%), CAGR (%))
Table 51 Asia-Pacific Concentrated Solar Power (CSP) Market by Storage Type, 2024-2034 (US$ Bn, AGR (%), CAGR (%))
Table 52 Asia-Pacific Concentrated Solar Power (CSP) Market by Application, 2024-2034 (US$ Bn, AGR (%), CAGR (%))
Table 53 Asia-Pacific Concentrated Solar Power (CSP) Market by Component, 2024-2034 (US$ Bn, AGR (%), CAGR (%))
Table 54 Asia-Pacific Concentrated Solar Power (CSP) Market by Technology, 2024-2034 (US$ Bn, AGR (%), CAGR (%))
Table 55 China Concentrated Solar Power (CSP) Market by Value, 2024-2034 (US$ Bn, AGR (%), CAGR (%))
Table 56 India Concentrated Solar Power (CSP) Market by Value, 2024-2034 (US$ Bn, AGR (%), CAGR (%))
Table 57 Japan Concentrated Solar Power (CSP) Market by Value, 2024-2034 (US$ Bn, AGR (%), CAGR (%))
Table 58 South Korea Concentrated Solar Power (CSP) Market by Value, 2024-2034 (US$ Bn, AGR (%), CAGR (%))
Table 59 Australia Concentrated Solar Power (CSP) Market by Value, 2024-2034 (US$ Bn, AGR (%), CAGR (%))
Table 60 Rest of Asia-Pacific Concentrated Solar Power (CSP) Market by Value, 2024-2034 (US$ Bn, AGR (%), CAGR (%))
Table 61 Middle East & Africa Concentrated Solar Power (CSP) Market by Value, 2024-2034 (US$ Bn, AGR (%), CAGR (%))
Table 62 Middle East & Africa Concentrated Solar Power (CSP) Market by Country, 2024-2034 (US$ Bn, AGR (%), CAGR (%))
Table 63 Middle East & Africa Concentrated Solar Power (CSP) Market by Storage Type, 2024-2034 (US$ Bn, AGR (%), CAGR (%))
Table 64 Middle East & Africa Concentrated Solar Power (CSP) Market by Application, 2024-2034 (US$ Bn, AGR (%), CAGR (%))
Table 65 Middle East & Africa Concentrated Solar Power (CSP) Market by Component, 2024-2034 (US$ Bn, AGR (%), CAGR (%))
Table 66 Middle East & Africa Concentrated Solar Power (CSP) Market by Technology, 2024-2034 (US$ Bn, AGR (%), CAGR (%))
Table 67 GCC Concentrated Solar Power (CSP) Market by Value, 2024-2034 (US$ Bn, AGR (%), CAGR (%))
Table 68 South Africa Concentrated Solar Power (CSP) Market by Value, 2024-2034 (US$ Bn, AGR (%), CAGR (%))
Table 69 Rest of Middle East & Africa Concentrated Solar Power (CSP) Market by Value, 2024-2034 (US$ Bn, AGR (%), CAGR (%))
Table 70 Latin America Concentrated Solar Power (CSP) Market by Value, 2024-2034 (US$ Bn, AGR (%), CAGR (%))
Table 71 Latin America Concentrated Solar Power (CSP) Market by Country, 2024-2034 (US$ Bn, AGR (%), CAGR (%))
Table 72 Latin America Concentrated Solar Power (CSP) Market by Storage Type, 2024-2034 (US$ Bn, AGR (%), CAGR (%))
Table 73 Latin America Concentrated Solar Power (CSP) Market by Application, 2024-2034 (US$ Bn, AGR (%), CAGR (%))
Table 74 Latin America Concentrated Solar Power (CSP) Market by Component, 2024-2034 (US$ Bn, AGR (%), CAGR (%))
Table 75 Latin America Concentrated Solar Power (CSP) Market by Technology, 2024-2034 (US$ Bn, AGR (%), CAGR (%))
Table 76 Brazil Concentrated Solar Power (CSP) Market by Value, 2024-2034 (US$ Bn, AGR (%), CAGR (%))
Table 77 Mexico Concentrated Solar Power (CSP) Market by Value, 2024-2034 (US$ Bn, AGR (%), CAGR (%))
Table 78 Rest of Latin America Concentrated Solar Power (CSP) Market by Value, 2024-2034 (US$ Bn, AGR (%), CAGR (%))
Table 79 Strategic Outlook - Contract
Table 80 BrightSource Energy, Inc.: Key Details, (CEO, HQ, Revenue, Founded, No. of Employees, Company Type, Website, Business Segment)
Table 81 BrightSource Energy, Inc.: Product Benchmarking
Table 82 ACWA Power: Key Details, (CEO, HQ, Revenue, Founded, No. of Employees, Company Type, Website, Business Segment)
Table 83 ACWA Power: Product Benchmarking
Table 84 ACWA Power: Strategic Outlook
Table 85 Sener: Key Details, (CEO, HQ, Revenue, Founded, No. of Employees, Company Type, Website, Business Segment)
Table 86 Sener: Product Benchmarking
Table 87 TSK Flagsol Engineering GmbH: Key Details, (CEO, HQ, Revenue, Founded, No. of Employees, Company Type, Website, Business Segment)
Table 88 TSK Flagsol Engineering GmbH: Product Benchmarking
Table 89 Solar Inc.: Key Details, (CEO, HQ, Revenue, Founded, No. of Employees, Company Type, Website, Business Segment)
Table 90 Solar Inc.: Product Benchmarking
Table 91 Siemens Gamesa Renewable Energy S.A.: Key Details, (CEO, HQ, Revenue, Founded, No. of Employees, Company Type, Website, Business Segment)
Table 92 Siemens Gamesa Renewable Energy S.A.: Product Benchmarking
Table 93 FRENELL GmbH: Key Details, (CEO, HQ, Revenue, Founded, No. of Employees, Company Type, Website, Business Segment)
Table 94 FRENELL GmbH: Product Benchmarking
Table 95 Aalborg CSP: Key Details, (CEO, HQ, Revenue, Founded, No. of Employees, Company Type, Website, Business Segment)
Table 96 Aalborg CSP: Product Benchmarking
Table 97 Aalborg CSP: Strategic Outlook
Table 98 Enel Green Power S.p.A.: Key Details, (CEO, HQ, Revenue, Founded, No. of Employees, Company Type, Website, Business Segment)
Table 99 Enel Green Power S.p.A.: Product Benchmarking
Table 100 Supcon Solar: Key Details, (CEO, HQ, Revenue, Founded, No. of Employees, Company Type, Website, Business Segment)
Table 101 Supcon Solar: Product Benchmarking
Table 102 Shams Power Company: Key Details, (CEO, HQ, Revenue, Founded, No. of Employees, Company Type, Website, Business Segment)
Table 103 Shams Power Company: Product Benchmarking
Table 104 Cobra Instalaciones y Servicios: Key Details, (CEO, HQ, Revenue, Founded, No. of Employees, Company Type, Website, Business Segment)
Table 105 Cobra Instalaciones y Servicios: Product Benchmarking
Table 106 Flabeg Fe GmbH: Key Details, (CEO, HQ, Revenue, Founded, No. of Employees, Company Type, Website, Business Segment)
Table 107 Flabeg Fe GmbH: Product Benchmarking
Table 108 GlassPoint Solar: Key Details, (CEO, HQ, Revenue, Founded, No. of Employees, Company Type, Website, Business Segment)
Table 109 GlassPoint Solar: Product Benchmarking
Table 110 GlassPoint Solar: Strategic Outlook
Table 111 Innova Global Limited: Key Details, (CEO, HQ, Revenue, Founded, No. of Employees, Company Type, Website, Business Segment)
Table 112 Innova Global Limited: Product Benchmarking
List of Figures
Figure 1 Concentrated Solar Power (CSP) Market Segmentation
Figure 2 Concentrated Solar Power (CSP) Market by Storage Type: Market Attractiveness Index
Figure 3 Concentrated Solar Power (CSP) Market by Application: Market Attractiveness Index
Figure 4 Concentrated Solar Power (CSP) Market by Components: Market Attractiveness Index
Figure 5 Concentrated Solar Power (CSP) Market by Technology Type: Market Attractiveness Index
Figure 6 Concentrated Solar Power (CSP) Market Attractiveness Index by Region
Figure 7 Concentrated Solar Power (CSP) Market: Market Dynamics
Figure 8 Concentrated Solar Power (CSP) Market: Porter’s Five Forces Analysis
Figure 9 Global Concentrated Solar Power (CSP) Market Share Forecast by COVID, 2024-2034 (%)
Figure 10 Global Concentrated Solar Power (CSP) Market by Region, 2024-2034 (US$ Bn, AGR (%)) (V-Shaped Recovery Scenario)
Figure 11 Global Concentrated Solar Power (CSP) Market Forecast, 2024-2034 (US$ Bn, AGR (%)) (U-Shaped Recovery Scenario)
Figure 12 Global Concentrated Solar Power (CSP) Market by Region, 2024-2034 (US$ Bn, AGR (%)) (W-Shaped Recovery Scenario)
Figure 13 Global Concentrated Solar Power (CSP) Market by Region, 2024-2034 (US$ Bn, AGR (%)) (L-Shaped Recovery Scenario)
Figure 14 Concentrated Solar Power (CSP) Market: PEST Analysis
Figure 15 Concentrated Solar Power (CSP) Market by Storage Type: Market Attractiveness Index
Figure 16 Global Concentrated Solar Power (CSP) Market by Storage Type, 2024-2034 (US$ Bn, AGR (%))
Figure 17 Concentrated Solar Power (CSP) Market Share Forecast by Storage Type, 2024, 2029, 2034 (%)
Figure 18 Thermal Energy Storage Market by Region, 2024-2034 (US$ Bn, AGR (%))
Figure 19 Thermal Energy Storage Market Share Forecast by Region, 2024 & 2034 (%)
Figure 20 Molten Salt Storage Market by Region, 2024-2034 (US$ Bn, AGR (%))
Figure 21 Molten Salt Storage Market Share Forecast by Region, 2024 & 2034 (%)
Figure 22 Steam Accumulators Market by Region, 2024-2034 (US$ Bn, AGR (%))
Figure 23 Steam Accumulators Market Share Forecast by Region, 2024 & 2034 (%)
Figure 24 Concentrated Solar Power (CSP) Market by Application: Market Attractiveness Index
Figure 25 Global Concentrated Solar Power (CSP) Market by Application, 2024-2034 (US$ Bn, AGR (%))
Figure 26 Concentrated Solar Power (CSP) Market Share Forecast by Application, 2024, 2029, 2034 (%)
Figure 27 Utility-scale CSP Plants Market by Region, 2024-2034 (US$ Bn, AGR (%))
Figure 28 Utility-scale CSP Plants Market Share Forecast by Region, 2024 & 2034 (%)
Figure 29 Industrial Heating and Desalination Market by Region, 2024-2034 (US$ Bn, AGR (%))
Figure 30 Industrial Heating and Desalination Market Share Forecast by Region, 2024 & 2034 (%)
Figure 31 Residential and Commercial Heating Market by Region, 2024-2034 (US$ Bn, AGR (%))
Figure 32 Residential and Commercial Heating Market Share Forecast by Region, 2024 & 2034 (%)
Figure 33 Other Applications Market by Region, 2024-2034 (US$ Bn, AGR (%))
Figure 34 Other Applications Market Share Forecast by Region, 2024 & 2034 (%)
Figure 35 Concentrated Solar Power (CSP) Market by Components: Market Attractiveness Index
Figure 36 Global Concentrated Solar Power (CSP) Market by Component, 2024-2034 (US$ Bn, AGR (%))
Figure 37 Concentrated Solar Power (CSP) Market Share Forecast by Components, 2024, 2029, 2034 (%)
Figure 38 Solar Collectors Market by Region, 2024-2034 (US$ Bn, AGR (%))
Figure 39 Solar Collectors Market Share Forecast by Region, 2024 & 2034 (%)
Figure 40 Solar Thermal Storage Market by Region, 2024-2034 (US$ Bn, AGR (%))
Figure 41 Solar Thermal Storage Market Share Forecast by Region, 2024 & 2034 (%)
Figure 42 Power Block Market by Region, 2024-2034 (US$ Bn, AGR (%))
Figure 43 Power Block Market Share Forecast by Region, 2024 & 2034 (%)
Figure 44 Heat Transfer Fluid Market by Region, 2024-2034 (US$ Bn, AGR (%))
Figure 45 Heat Transfer Fluid Market Share Forecast by Region, 2024 & 2034 (%)
Figure 46 Other Components Market by Region, 2024-2034 (US$ Bn, AGR (%))
Figure 47 Other Components Market Share Forecast by Region, 2024 & 2034 (%)
Figure 48 Concentrated Solar Power (CSP) Market by Technology Type: Market Attractiveness Index
Figure 49 Global Concentrated Solar Power (CSP) Market by Technology, 2024-2034 (US$ Bn, AGR (%))
Figure 50 Concentrated Solar Power (CSP) Market Share Forecast by Technology Type, 2024, 2029, 2034 (%)
Figure 51 Parabolic Trough Market by Region, 2024-2034 (US$ Bn, AGR (%))
Figure 52 Parabolic Trough Market Share Forecast by Region, 2024 & 2034 (%)
Figure 53 Solar Tower Market by Region, 2024-2034 (US$ Bn, AGR (%))
Figure 54 Solar Tower Market Share Forecast by Region, 2024 & 2034 (%)
Figure 55 Fresnel Reflectors Market by Region, 2024-2034 (US$ Bn, AGR (%))
Figure 56 Fresnel Reflectors Market Share Forecast by Region, 2024 & 2034 (%)
Figure 57 Dish Stirling Market by Region, 2024-2034 (US$ Bn, AGR (%))
Figure 58 Dish Stirling Market Share Forecast by Region, 2024 & 2034 (%)
Figure 59 Heliostat Market by Region, 2024-2034 (US$ Bn, AGR (%))
Figure 60 Heliostat Market Share Forecast by Region, 2024 & 2034 (%)
Figure 61 Other Technologies Market by Region, 2024-2034 (US$ Bn, AGR (%))
Figure 62 Other Technology Market Share Forecast by Region, 2024 & 2034 (%)
Figure 63 Concentrated Solar Power (CSP) Market Forecast by Region 2024 and 2034 (Revenue, CAGR%)
Figure 64 Concentrated Solar Power (CSP) Market Share Forecast by Region 2024, 2029, 2034 (%)
Figure 65 Concentrated Solar Power (CSP) Market by Region, 2024-2034 (US$ Billion, AGR %)
Figure 66 North America Concentrated Solar Power (CSP) Market Attractiveness Index
Figure 67 North America Concentrated Solar Power (CSP) Market by Region, 2024, 2029 & 2034 (US$ Billion)
Figure 68 North America Concentrated Solar Power (CSP) Market by Value, 2024-2034 (US$ Bn, AGR (%))
Figure 69 North America Concentrated Solar Power (CSP) Market by Country, 2024-2034 (US$ Bn, AGR (%))
Figure 70 North America Concentrated Solar Power (CSP) Market Share Forecast by Country, 2024 & 2034 (%)
Figure 71 North America Concentrated Solar Power (CSP) Market by Storage Type, 2024-2034 (US$ Bn, AGR (%))
Figure 72 North America Concentrated Solar Power (CSP) Market Share Forecast Storage Type, 2024 & 2034 (%)
Figure 73 North America Concentrated Solar Power (CSP) Market by Application, 2024-2034 (US$ Bn, AGR (%))
Figure 74 North America Concentrated Solar Power (CSP) Market Share Forecast by Application, 2024 & 2034 (%)
Figure 75 North America Concentrated Solar Power (CSP) Market by Component, 2024-2034 (US$ Bn, AGR (%))
Figure 76 North America Concentrated Solar Power (CSP) Market Share Forecast by Components, 2024 & 2034 (%)
Figure 77 North America Concentrated Solar Power (CSP) Market by Technology, 2024-2034 (US$ Bn, AGR (%))
Figure 78 North America Concentrated Solar Power (CSP) Market Share Forecast by Technology Type, 2024 & 2034 (%)
Figure 79 US Concentrated Solar Power (CSP) Market by Value, 2024-2034 (US$ Bn, AGR (%))
Figure 80 Canada Concentrated Solar Power (CSP) Market by Value, 2024-2034 (US$ Bn, AGR (%))
Figure 81 Europe Concentrated Solar Power (CSP) Market Attractiveness Index
Figure 82 Europe Concentrated Solar Power (CSP) Market by Region, 2024, 2029 & 2034 (US$ Billion)
Figure 83 Europe Concentrated Solar Power (CSP) Market by Value, 2024-2034 (US$ Bn, AGR (%))
Figure 84 Europe Concentrated Solar Power (CSP) Market by Country, 2024-2034 (US$ Bn, AGR (%))
Figure 85 Europe Concentrated Solar Power (CSP) Market Share Forecast by Country, 2024 & 2034 (%)
Figure 86 Europe Concentrated Solar Power (CSP) Market by Storage Type, 2024-2034 (US$ Bn, AGR (%))
Figure 87 Europe Concentrated Solar Power (CSP) Market Share Forecast Storage Type, 2024 & 2034 (%)
Figure 88 Europe Concentrated Solar Power (CSP) Market by Application, 2024-2034 (US$ Bn, AGR (%))
Figure 89 Europe Concentrated Solar Power (CSP) Market Share Forecast by Application, 2024 & 2034 (%)
Figure 90 Europe Concentrated Solar Power (CSP) Market by Component, 2024-2034 (US$ Bn, AGR (%))
Figure 91 Europe Concentrated Solar Power (CSP) Market Share Forecast by Components, 2024 & 2034 (%)
Figure 92 Europe Concentrated Solar Power (CSP) Market by Technology, 2024-2034 (US$ Bn, AGR (%))
Figure 93 Europe Concentrated Solar Power (CSP) Market Share Forecast by Technology Type, 2024 & 2034 (%)
Figure 94 Germany Concentrated Solar Power (CSP) Market by Value, 2024-2034 (US$ Bn, AGR (%))
Figure 95 Greece Concentrated Solar Power (CSP) Market by Value, 2024-2034 (US$ Bn, AGR (%))
Figure 96 France Concentrated Solar Power (CSP) Market by Value, 2024-2034 (US$ Bn, AGR (%))
Figure 97 Italy Concentrated Solar Power (CSP) Market by Value, 2024-2034 (US$ Bn, AGR (%))
Figure 98 Spain Concentrated Solar Power (CSP) Market by Value, 2024-2034 (US$ Bn, AGR (%))
Figure 99 Rest of Europe Concentrated Solar Power (CSP) Market by Value, 2024-2034 (US$ Bn, AGR (%))
Figure 100 Asia-Pacific Concentrated Solar Power (CSP) Market Attractiveness Index
Figure 101 Asia-Pacific Concentrated Solar Power (CSP) Market by Region, 2024, 2029 & 2034 (US$ Billion)
Figure 102 Asia-Pacific Concentrated Solar Power (CSP) Market by Value, 2024-2034 (US$ Bn, AGR (%))
Figure 103 Asia-Pacific Concentrated Solar Power (CSP) Market by Country, 2024-2034 (US$ Bn, AGR (%))
Figure 104 Asia-Pacific Concentrated Solar Power (CSP) Market Share Forecast by Country, 2024 & 2034 (%)
Figure 105 Asia-Pacific Concentrated Solar Power (CSP) Market by Storage Type, 2024-2034 (US$ Bn, AGR (%))
Figure 106 Asia-Pacific Concentrated Solar Power (CSP) Market Share Forecast Storage Type, 2024 & 2034 (%)
Figure 107 Asia-Pacific Concentrated Solar Power (CSP) Market by Application, 2024-2034 (US$ Bn, AGR (%))
Figure 108 Asia-Pacific Concentrated Solar Power (CSP) Market Share Forecast by Application, 2024 & 2034 (%)
Figure 109 Asia-Pacific Concentrated Solar Power (CSP) Market by Component, 2024-2034 (US$ Bn, AGR (%))
Figure 110 Asia-Pacific Concentrated Solar Power (CSP) Market Share Forecast by Components, 2024 & 2034 (%)
Figure 111 Asia-Pacific Concentrated Solar Power (CSP) Market by Technology, 2024-2034 (US$ Bn, AGR (%))
Figure 112 Asia-Pacific Concentrated Solar Power (CSP) Market Share Forecast by Technology Type, 2024 & 2034 (%)
Figure 113 China Concentrated Solar Power (CSP) Market by Value, 2024-2034 (US$ Bn, AGR (%))
Figure 114 India Concentrated Solar Power (CSP) Market by Value, 2024-2034 (US$ Bn, AGR (%))
Figure 115 Japan Concentrated Solar Power (CSP) Market by Value, 2024-2034 (US$ Bn, AGR (%))
Figure 116 South Korea Concentrated Solar Power (CSP) Market by Value, 2024-2034 (US$ Bn, AGR (%))
Figure 117 Australia Concentrated Solar Power (CSP) Market by Value, 2024-2034 (US$ Bn, AGR (%))
Figure 118 Rest of Asia-Pacific Concentrated Solar Power (CSP) Market by Value, 2024-2034 (US$ Bn, AGR (%))
Figure 119 Middle East and Africa Concentrated Solar Power (CSP) Market Attractiveness Index
Figure 120 Middle East and Africa Concentrated Solar Power (CSP) Market by Region, 2024, 2029 & 2034 (US$ Billion)
Figure 121 Middle East & Africa Concentrated Solar Power (CSP) Market by Value, 2024-2034 (US$ Bn, AGR (%))
Figure 122 Middle East & Africa Concentrated Solar Power (CSP) Market by Country, 2024-2034 (US$ Bn, AGR (%))
Figure 123 Middle East and Africa Concentrated Solar Power (CSP) Market Share Forecast by Country, 2024 & 2034 (%)
Figure 124 Middle East & Africa Concentrated Solar Power (CSP) Market by Storage Type, 2024-2034 (US$ Bn, AGR (%))
Figure 125 Middle East and Africa Concentrated Solar Power (CSP) Market Share Forecast Storage Type, 2024 & 2034 (%)
Figure 126 Middle East & Africa Concentrated Solar Power (CSP) Market by Application, 2024-2034 (US$ Bn, AGR (%))
Figure 127 Middle East and Africa Concentrated Solar Power (CSP) Market Share Forecast by Application, 2024 & 2034 (%)
Figure 128 Middle East & Africa Concentrated Solar Power (CSP) Market by Component, 2024-2034 (US$ Bn, AGR (%))
Figure 129 Middle East and Africa Concentrated Solar Power (CSP) Market Share Forecast by Components, 2024 & 2034 (%)
Figure 130 Middle East & Africa Concentrated Solar Power (CSP) Market by Technology, 2024-2034 (US$ Bn, AGR (%))
Figure 131 Middle East and Africa Concentrated Solar Power (CSP) Market Share Forecast by Technology Type, 2024 & 2034 (%)
Figure 132 GCC Concentrated Solar Power (CSP) Market by Value, 2024-2034 (US$ Bn, AGR (%))
Figure 133 South Africa Concentrated Solar Power (CSP) Market by Value, 2024-2034 (US$ Bn, AGR (%))
Figure 134 Rest of Middle East & Africa Concentrated Solar Power (CSP) Market by Value, 2024-2034 (US$ Bn, AGR (%))
Figure 135 Latin America Concentrated Solar Power (CSP) Market Attractiveness Index
Figure 136 Latin America Concentrated Solar Power (CSP) Market by Region, 2024, 2029 & 2034 (US$ Billion)
Figure 137 Latin America Concentrated Solar Power (CSP) Market by Value, 2024-2034 (US$ Bn, AGR (%))
Figure 138 Latin America Concentrated Solar Power (CSP) Market by Country, 2024-2034 (US$ Bn, AGR (%))
Figure 139 Latin America Concentrated Solar Power (CSP) Market Share Forecast by Country, 2024 & 2034 (%)
Figure 140 Latin America Concentrated Solar Power (CSP) Market by Storage Type, 2024-2034 (US$ Bn, AGR (%))
Figure 141 Latin America Concentrated Solar Power (CSP) Market Share Forecast Storage Type, 2024 & 2034 (%)
Figure 142 Latin America Concentrated Solar Power (CSP) Market by Application, 2024-2034 (US$ Bn, AGR (%))
Figure 143 Latin America Concentrated Solar Power (CSP) Market Share Forecast by Application, 2024 & 2034 (%)
Figure 144 Latin America Concentrated Solar Power (CSP) Market by Component, 2024-2034 (US$ Bn, AGR (%))
Figure 145 Latin America Concentrated Solar Power (CSP) Market Share Forecast by Components, 2024 & 2034 (%)
Figure 146 Latin America Concentrated Solar Power (CSP) Market by Technology, 2024-2034 (US$ Bn, AGR (%))
Figure 147 Latin America Concentrated Solar Power (CSP) Market Share Forecast by Technology Type, 2024 & 2034 (%)
Figure 148 Brazil Concentrated Solar Power (CSP) Market by Value, 2024-2034 (US$ Bn, AGR (%))
Figure 149 Mexico Concentrated Solar Power (CSP) Market by Value, 2024-2034 (US$ Bn, AGR (%))
Figure 150 Rest of Latin America Concentrated Solar Power (CSP) Market by Value, 2024-2034 (US$ Bn, AGR (%))
Figure 151 Enel Green Power S.p.A..: Net Revenue, 2018-2022 (US$ Million, AGR%)
Figure 152 Enel Green Power S.p.A..: Regional Revenue Share, 2022 (%)
Figure 153 Enel Green Power S.p.A..: Business Segment Revenue Share, 2022 (%)
ページTOPに戻る
本レポートと同分野(再生可能エネルギー)の最新刊レポート
Visiongain社のエネルギーと資源分野での最新刊レポート
本レポートと同じKEY WORD()の最新刊レポート
- 本レポートと同じKEY WORDの最新刊レポートはありません。
よくあるご質問
Visiongain社はどのような調査会社ですか?
英国の調査会社ヴィジョンゲイン社(Visiongain)は、通信とエネルギーのほか、自動車や化学・医薬品、金属など、広範な市場を対象に調査を行っています。自動車市場については、市場全般に関する調査のほ... もっと見る
調査レポートの納品までの日数はどの程度ですか?
在庫のあるものは速納となりますが、平均的には 3-4日と見て下さい。
但し、一部の調査レポートでは、発注を受けた段階で内容更新をして納品をする場合もあります。
発注をする前のお問合せをお願いします。
注文の手続きはどのようになっていますか?
1)お客様からの御問い合わせをいただきます。
2)見積書やサンプルの提示をいたします。
3)お客様指定、もしくは弊社の発注書をメール添付にて発送してください。
4)データリソース社からレポート発行元の調査会社へ納品手配します。
5) 調査会社からお客様へ納品されます。最近は、pdfにてのメール納品が大半です。
お支払方法の方法はどのようになっていますか?
納品と同時にデータリソース社よりお客様へ請求書(必要に応じて納品書も)を発送いたします。
お客様よりデータリソース社へ(通常は円払い)の御振り込みをお願いします。
請求書は、納品日の日付で発行しますので、翌月最終営業日までの当社指定口座への振込みをお願いします。振込み手数料は御社負担にてお願いします。
お客様の御支払い条件が60日以上の場合は御相談ください。
尚、初めてのお取引先や個人の場合、前払いをお願いすることもあります。ご了承のほど、お願いします。
データリソース社はどのような会社ですか?
当社は、世界各国の主要調査会社・レポート出版社と提携し、世界各国の市場調査レポートや技術動向レポートなどを日本国内の企業・公官庁及び教育研究機関に提供しております。
世界各国の「市場・技術・法規制などの」実情を調査・収集される時には、データリソース社にご相談ください。
お客様の御要望にあったデータや情報を抽出する為のレポート紹介や調査のアドバイスも致します。
|
|

